


Abstract
Underwater explosion bubbles generate intense pressure pulses and high-speed re-entrant jets during their expansion and collapse processes, posing significant threats to ships and submerged structures. In practical engineering, plate-like structures with different orientations are widely encountered; therefore, investigating the influence of boundary orientation on bubble dynamics is of great importance. In this study, underwater electrical explosion experiments were conducted using a capacitor discharge voltage of 300 V, with stand-off distances ranging from 1 mm to 30 mm. Two typical boundary configurations were established, namely a vertical plate and a horizontal plate. High-speed imaging was employed to capture the complete bubble evolution process, while coupled Eulerian–Lagrangian (CEL) simulations were performed to analyze bubble dynamics and structural response. The results indicate that, under the vertical plate condition, the maximum bubble diameter decreases monotonically with increasing stand-off distance, whereas the oscillation period exhibits a non-monotonic variation. At a stand-off distance of 5 mm, the maximum bubble diameter in the vertical plate configuration is 40.3% larger than that in the horizontal plate configuration. The reflected shock wave from the elastic boundary modifies the surrounding pressure field, thereby influencing the evolution of the bubble interface. In the presence of a vertical elastic plate, the bubble exhibits a centroid displacement during the expansion phase, and a re-entrant jet directed toward the boundary forms during collapse. In contrast, under the horizontal elastic plate condition, the bubble maintains a nearly axisymmetric evolution, and the re-entrant jet develops along the vertical direction. As the standoff distance between the plate and the charge center increases, the boundary effect gradually weakens, and the bubble morphology approaches that under free-field conditions. This study provides experimental evidence for understanding bubble–structure interaction (BSI) between underwater explosion bubbles and ship plate structures, and offers valuable insights for blast-resistant design of naval structures and the evaluation of underwater explosion loads.
1. Introduction
Underwater explosion (UNDEX) is an important issue in the blast-resistant protection of ships and underwater vehicles, the structural safety assessment of offshore engineering structures, and the study of underwater damage mechanisms. It is a complex transient process involving the coupling of compressible fluid dynamics, free-surface evolution, and structural dynamic response [1,2]. Compared with air explosions, water has a higher density and lower compressibility, which enables the explosion energy to be transmitted to the surrounding medium and adjacent structures in the form of more intense shock waves. After detonation, in addition to the initial shock wave, the detonation products form a gas bubble that undergoes periodic motions including expansion, contraction, re-expansion, and collapse [3,4]. These bubble pulsations act on the surrounding structures over a relatively long timescale, thereby producing significant secondary loading effects [5,6].
Under free-field conditions, the evolution of explosion bubbles generally maintains an approximately spherical symmetry. However, when the bubble is close to a boundary, the symmetry of the flow field is broken, resulting in centroid migration and morphological instability [7,8]. During the collapse stage, the bubble often forms a high-speed re-entrant jet and generates local pressure peaks, thereby significantly altering the loading conditions and failure modes of structures [9,10]. For typical structures such as ship side plates, bulkheads, bottom plates, and the external shells of marine equipment, the local impact generated by bubble collapse near boundaries is often an important cause of structural damage.
In addition, the behavior of underwater explosion bubbles is also affected by factors such as hydrostatic pressure, cavitation, and multi-bubble interactions. Previous studies have shown that hydrostatic pressure can change the bubble pulsation scale and affect the bubble–plate interaction process [11]. Meanwhile, cavitation generated during bubble pulsation further increases the complexity of the flow field [12]. When multiple bubbles occur during the explosion process, their interactions can also alter the bubble collapse mode and load distribution [13,14]. These factors collectively indicate that the problem of bubble–structure interaction in underwater explosions exhibits significant multi-factor coupling characteristics.
Based on the existing literature, studies on underwater explosion bubble–structure interaction can generally be summarized from five aspects: research progress based on experimental investigations, research based on theoretical and empirical models, research based on numerical simulations, research focusing on structural response and damage mechanisms, and studies on bubble behavior near rigid boundaries and plates.
Experimental research is an important approach for revealing the real evolution characteristics of underwater explosion bubbles. Zhou et al. [3] conducted underwater electrical explosion experiments to investigate bubble pulsation and energy characteristics, and analyzed the relationship between bubble oscillation behavior and energy distribution. Gao et al. [15] used the underwater exploding aluminum wire method to study shock waves and bubble pulsation behavior, demonstrating the applicability of different experimental methods in load characterization. Shan et al. [4] explored the evolution characteristics of bubble dynamics and energy distribution from the perspective of detonation product states. These studies provide experimental evidence for understanding the fundamental physical processes of explosion bubbles.
Theoretical models are important tools for explaining the mechanisms of bubble dynamics and extracting governing parameters. For underwater explosion bubble motion, existing studies have established analytical models under different boundary conditions based on the Rayleigh–Plesset-type equations, the Prosperetti–Lezzi equation, and the method of images. Among them, Zhang et al. [16] applied the Prosperetti–Lezzi equation to solve engineering problems of underwater explosion bubbles, demonstrating that simplified theoretical models have certain practical value in predicting the pulsation period and bubble radius evolution. Wang et al. [2] analyzed bubble dynamics and its engineering applications, summarizing the fundamental theories, typical boundary effects, and application prospects. These studies provide a theoretical basis for understanding the processes of bubble formation, expansion, and collapse.
However, theoretical models are often established based on ideal boundaries or simplified assumptions, and their applicability is limited for near-field explosions, strongly nonlinear collapse, jet penetration, and complex fluid–structure interaction (FSI) problems. Therefore, for bubble–plate coupling problems near complex boundaries, especially near rigid plates with different orientations, theoretical models still need to be corrected and validated by experimental and numerical results.
Numerical simulation has become an important means for studying the entire process of underwater explosions. Liu et al. [1] employed the Eulerian finite element method to achieve continuous simulation of the whole underwater explosion process and analyzed the evolution of detonation products, shock waves, and bubbles; Liu et al. [5] also used the Eulerian method to study free-field underwater explosion problems. Hsu et al. [8] conducted numerical studies on bubble pulsation and collapse, revealing the flow field evolution characteristics during the collapse stage. Wu et al. [17] developed a fully coupled fluid–structure interaction model to simulate the highly nonlinear dynamic behavior of an underwater explosion bubble near an elastic–plastic thin-walled plate, capturing the mutual interaction between bubble evolution and structural deformation. Cheng et al. [18] investigated the cumulative damage effects of repeated underwater explosions on multi-cabin structures through numerical simulation, revealing the progressive deterioration mechanism under successive blast loadings.
In addition to Eulerian methods, smoothed particle hydrodynamics (SPH) and its improved forms have also been widely used to deal with large deformation and free-surface problems. Zhang et al. [19] combined SPH with the boundary element method (BEM) to study underwater explosions of cylindrical charges, and Tian and Xu [20] proposed an improved SPH method to simulate explosions in shallow water near the free surface. Zhang et al. [21] investigated the impact characteristics of underwater explosion bubble jets induced by plate structures through numerical simulation, revealing the interaction mechanism between bubble jet formation and structural effects, while Gannon [7] simulated explosion phenomena near free surfaces or rigid boundaries adjacent to submerged cylinders. These studies indicate that different numerical methods have their own advantages and exhibit complementarity in handling boundaries, free surfaces, complex geometries, and strong local nonlinearities.
In recent years, numerical studies under special conditions have continued to increase. Choi et al. [13] investigated the effect of phase change in dual-bubble systems on bubble dynamics; Hu et al. [14,22] examined the characteristics of bubble pulsation and shock waves in multi-charge explosions; Yu et al. [23] studied cavitation effects induced by multi-point explosions near free surfaces; and Dong et al. [24] analyzed the directional enhancement phenomenon of shock and bubble loads in adjacent two-phase regions. These studies have enriched the research scenarios of underwater explosion bubble problems.
In the field of fluid–structure interaction and structural safety, researchers mainly focus on the effects of explosion bubbles on structural dynamic response and damage. For ship and compartment structures, Chen et al. [25] investigated the effects of ballast water conditions on the dynamic response of cabin structures subjected to underwater explosions through fluid–structure interaction analysis; Gao et al. [26] investigated the damage characteristics of compartments under near-field explosions; and Wang et al. [27] investigated the effect of water-filled cabins on the explosion resistance of ship side structures, revealing the protective mechanism of internal water on structural response under blast loading.
For plate and sandwich structures, Pang et al. [28] studied the damage characteristics of steel sandwich plates under the combined action of shock waves and bubble pulsation; Jain et al. [29] investigated the response of curved sandwich composite plates under near-field underwater explosions; and Yang et al. [30] explored the damage mechanisms of double cylindrical shells under underwater explosion loads. In addition, Wanchoo et al. [31] developed an energy quantification framework to evaluate the transfer and dissipation of underwater explosive loading in PVC foam-cladded composite plates, revealing the role of layered structures in energy absorption, and Liu et al. [32] analyzed the strong coupling between oscillating bubbles and elastic steel plates under contact explosions. These studies indicate that structural form, material properties, and boundary stiffness significantly affect the transmission path of explosion loads and failure modes.
For other structural objects, Huang [33] studied the damage effect of explosion bubbles on concrete gravity dams, Chen et al. [34] analyzed the damage behavior of reinforced concrete plates under the combined action of shock waves and bubble pulses, and Li et al. [6] discussed bubble dynamics and structural damage caused by underwater explosions from a broader perspective. Overall, existing studies have focused more on structural damage, but often treat bubble loads as prescribed inputs, with insufficient attention paid to the influence of boundary orientation on load variation.
Studies directly related to this work mainly focus on bubble loads near rigid walls, cavitation near plates, and bubble dynamics in confined spaces between plates. Hung and Hwangfu [35] conducted experimental studies on micro-charge explosion bubbles near different boundaries, revealing the significant influence of rigid boundaries and other boundary conditions on bubble morphology and collapse modes. Wang et al. [10] experimentally investigated the collapse load characteristics of bubbles near rigid walls and pointed out that bubble collapse near walls produces significant local high-pressure responses. Chen et al. [36] analyzed the variation law of wall pressure induced by small-charge explosion bubbles, providing a basis for quantitative prediction of wall loads. Huang et al. [37] studied the cavitation phenomenon and load characteristics of fixed square plates under near-field underwater explosions; Chen et al. [38] analyzed the response of fixed steel plates under underwater explosions through combined experimental and numerical methods. Su et al. [39] investigated the bubble dynamics between parallel double plates under different plate spacings, and Wang et al. [40] further examined bubble pulsation and jet phenomena between double plates with circular holes, indicating that confined spaces and complex boundaries significantly affect bubble evolution. Lai et al. [9] analyzed near-field explosion bubble load characteristics; Huang et al. [37] and Wen et al. [12] conducted experimental and numerical studies on cavitation phenomena and cavitation evolution during pulsation processes, respectively. Han et al. [11] further investigated the influence of hydrostatic pressure on bubble–plate interaction, indicating that the bubble–plate problem is significantly controlled by environmental pressure.
Taken together, previous studies have provided a solid foundation for understanding underwater explosion bubble dynamics and bubble–structure interaction. Experimental investigations have revealed the fundamental pulsation behavior, energy evolution, and shock–bubble coupling characteristics, while theoretical and empirical models have offered useful descriptions of bubble motion under simplified conditions. Numerical approaches, including Eulerian methods, SPH, and fully coupled fluid–structure interaction models, have further enabled detailed analysis of nonlinear bubble evolution, jet formation, and structural response. In addition, studies on various structural forms, such as ship hulls, sandwich panels, and compartment structures, have demonstrated that bubble pulsation and collapse can induce sustained secondary loading and localized structural effects. Investigations on bubbles near rigid walls and plates have also shown that boundary presence plays an important role in modifying bubble morphology and collapse behavior.
However, from the perspective of practical engineering applications in naval and offshore structures, several aspects still merit further investigation. Existing studies on plate boundaries have mainly focused on rigid configurations, while research involving elastic plates remains relatively limited. Moreover, although boundary effects have been widely examined, most studies consider a single boundary orientation, and comparative analyses between vertical and horizontal plate configurations within a unified framework are still relatively limited. The influence of boundary orientation on bubble morphology evolution, collapse path, jet direction, and the associated structural loading characteristics is still not yet fully understood from an integrated perspective.
Based on the above research background, this study conducts experimental and numerical investigations on the interaction between underwater explosion bubbles and elastic plate structures with different spatial orientations. The experiments adopt the underwater electrical explosion method to generate explosion bubbles in water, and high-speed imaging is used to record the entire process from bubble generation to collapse. The numerical simulation adopts the coupled Eulerian–Lagrangian (CEL) method for fluid–structure interaction and establishes an underwater explosion model on the ABAQUS platform. Considering typical plate structures in ship structures, two representative boundary conditions, namely a vertical plate and a horizontal plate, are selected. By varying the distance between the explosion center and the plate, the evolution characteristics of bubbles under different distance conditions and their effects on the plate structures are systematically investigated. Through the measurement and analysis of key dynamic parameters such as bubble morphology evolution, maximum expansion diameter, and pulsation period, the influence mechanism of elastic boundaries with different spatial orientations on bubble expansion morphology, collapse path, and jet development direction is revealed. Furthermore, the stress distribution and deformation response of the plate under bubble loading are analyzed. To clarify the physical origin of the boundary-orientation effect more explicitly, the present study further examines the evolution of the pressure field, the fluid velocity field, and the plate-center pressure history obtained from the CEL model. These field quantities provide a direct link between reflected-wave-induced pressure redistribution, bubble-interface deformation, and the resulting localization pattern of plate loading. In this way, the differences between vertical and horizontal plate configurations can be interpreted not only from bubble morphology, but also from the underlying load-transfer process in the surrounding fluid. The results can provide experimental evidence for understanding the interaction mechanism between underwater explosion bubbles and ship plate structures, and offer references for the blast-resistant design of ship structures and the analysis of underwater explosion loads. Details of the experimental setup and conditions are presented in the experimental section.
2. Experimental Setup and Procedure
2.1. Experimental Apparatus
The present experiment employs a 1 mm thick iron plate to simulate the ship bottom plate. The density, Young’s modulus, and Poisson’s ratio of the iron plate are 7850 kg/m3, 210 GPa, and 0.3. To investigate the interaction phenomena between underwater explosion bubbles and the iron plate at different standoff distances, an underwater explosion experimental platform was designed and constructed, as shown in Figure 1. The experimental platform mainly consists of an explosion generation system, an image acquisition system, and a data processing and display system. The schematic diagram of the experimental setup is shown in Figure 2.
Figure 1.
Experimental setup.
Figure 2.
Schematic diagram of the experimental principle.
In the experimental setup, the iron plate is fixed along one side, which differs from the boundary conditions of actual ship structures, where support is typically provided by surrounding stiffeners and structural components. Therefore, the experimental results should be interpreted as a simplified representation of the local plate response under reduced constraint conditions.
The explosion generation system mainly consists of an AC–DC regulated power supply, a capacitor, a display screen, a PLC control integrated unit, a vacuum AC contactor charging device, a vacuum AC contactor discharging device, and a circuit breaker. In this system, the AC–DC regulated power supply is used to charge the capacitor, and the display screen can monitor the capacitor voltage in real time. The PLC control integrated unit is employed to control the switching time of the charging and discharging devices of the vacuum AC contactor. When the discharge switch is turned on, the electrical energy stored in the capacitor is transmitted to the intersection of the copper wires, where an explosion occurs and interacts with the plate.
The image acquisition system is used to visually capture the variation process during the interaction between the bubble and the iron plate. In this experiment, a FASTCAM SA-Z high-speed camera (Photron) is used, with a resolution of 128 × 232 pixels and a maximum frame rate of 80,000 fps. The high-speed camera is placed directly in front of the water tank to record the entire process of the bubble from its generation to complete collapse.
2.2. Experimental Procedure
The experimental procedure for the underwater explosion bubble tests is divided into three steps:
- (1)
- Pre-experimental preparation: Fill the water tank to the prescribed water level, fix the plate at the required position, and arrange two copper wires so that they intersect at a designated location near the plate.
- (2)
- Turn on the AC–DC regulated power supply to charge the capacitor to 300 V, and stop charging when the display screen reaches the specified voltage.
- (3)
- Start the high-speed camera and switch on the discharge circuit. An explosion occurs at the intersection of the copper wires, generating a bubble.
2.3. Test Conditions
In practical ship structures, a large number of components are composed of plate structures with different spatial orientations, among which vertical plates and horizontal plates are the two most common basic forms. The study selects two typical boundary conditions, namely a vertical plate and a horizontal plate, for experimental investigation. By varying the distance between the explosion location and the plate, the interaction characteristics between the bubble and the plate under different distance conditions are analyzed.
To facilitate comparison among cases with different bubble scales, the initial standoff distance is further expressed in nondimensional form. For case i, the nondimensional distance is defined as [41]
where Hi is the initial distance between the charge center and the plate, and Dmax,i is the maximum bubble diameter measured in the corresponding case. This parameter characterizes the relative proximity of the elastic boundary with respect to the characteristic bubble scale, and provides a unified basis for comparing bubble evolution and plate response under different boundary orientations and standoff conditions.
In this experiment, the relative position between the explosion bubble and the plate is adjusted by changing the distance between the intersection point of the copper wires (the explosion location) and the target plate, thereby enabling the investigation of the interaction characteristics between the bubble and the plate under different standoff conditions. The corresponding dimensional distances and their nondimensional values are listed in Table 1.
Table 1.
Test conditions and nondimensional standoff distance.
It should be noted that the stand-off distances for the vertical and horizontal plate configurations are not identical. The vertical cases used 2, 5, 7, 10, and 28 mm, while the horizontal cases used 1, 3, 5, 9, and 30 mm. Therefore, the comparison is intended to highlight qualitative differences in bubble dynamics due to boundary orientation, rather than provide a direct quantitative equivalence under identical conditions.
Due to the transient and destructive nature of underwater electrical explosion experiments, each test condition in the present study was conducted only once. Nevertheless, several measures were taken to ensure the reliability of the results. First, all experiments were carried out under strictly controlled conditions, including identical charging voltage (300 V), electrode configuration, and environmental settings, so as to minimize variability between individual tests. Second, high-speed imaging at a frame rate of 80,000 fps was employed to capture the bubble evolution process, ensuring sufficient temporal and spatial resolution. Third, the experimental results were validated against coupled Eulerian–Lagrangian (CEL) numerical simulations. As shown in Section 4, the simulated maximum bubble radius and oscillation period both agree well with the experimental observations, with a relative error of overall less than 5%. Although repeat tests were not performed for each configuration, the observed variation trends are consistent with physical expectations and previous findings reported in the literature, indicating that the present experimental results are representative.
3. Numerical Model
3.1. Computational Domain
The coupled Eulerian–Lagrangian (CEL) method is employed to numerically simulate the interaction of a single bubble near an elastic boundary, as shown in Figure 3a,b. A full-scale underwater explosion model is established based on the 2022 version of ABAQUS 2022, including three components: air, water, and explosive. The Eulerian domain is defined with dimensions of 0.3 m × 0.3 m × 0.3 m, and a discrete field initialization approach is adopted. The model incorporates both the gravitational field and geostatic stress conditions.
Figure 3.
Schematic diagram of the numerical simulation. (The thick dark blue lines represent the structural plate, and the small black dots denote the detonation center.)
For the boundary conditions, non-reflecting outflow boundaries are applied to the four lateral faces and the top surface to prevent material outflow and reduce the influence of shock wave reflections. The bottom surface is defined as a zero normal velocity boundary. The plate has dimensions of 150 mm × 150 mm × 1 mm, and the upper edge of the plate is subjected to fixed boundary conditions, consistent with those applied in the experiment.
To achieve an optimal balance between computational efficiency and accuracy, the mesh size in the numerical model was determined based on a mesh convergence study. Mesh sizes of 2.0 mm, 1.5 mm, 1.0 mm, and 0.75 mm were employed for comparison. The corresponding bubble radius evolution curves extracted from the simulations are presented in Figure 4a. The results indicate good convergence behavior, as the curves obtained with mesh sizes of 1.0 mm and 0.75 mm are nearly identical. Although a finer mesh can yield slightly higher accuracy, it significantly increases computational cost. Therefore, a local mesh refinement technique was applied in the bubble expansion region, and a mesh size of 1.0 mm was adopted for the simulations. As shown in Figure 4, the final model consists of a total of 5,832,000 elements. The element type used is the linear Eulerian hexahedral element (EC3D8R).
Figure 4.
(a) Mesh convergence analysis curve. (b) Locally refined mesh computational model.
3.2. Material Models
3.2.1. Equation of State for TNT
TNT underwater explosions generate a large amount of high-energy gases, thereby inducing shock waves and bubble pulsations. Therefore, the Jones–Wilkins–Lee (JWL) equation of state is adopted in this study to describe the relationship between the pressure, specific volume, and internal energy of TNT detonation products. The expression is given as follows:
In the equation, , , , , and are material constants of the explosive; is the relative specific volume; and is the pressure of the detonation products. The specific parameters for TNT are listed in Table 2.
Table 2.
TNT explosive parameters.
3.2.2. Equation of State for Water
To accurately describe the compressibility characteristics and high-pressure physical behavior of water under strong shock loading, the Mie–Grüneisen equation of state is adopted in this study. Based on the Hugoniot curve under normal temperature and pressure conditions, this equation expresses the pressure P as a function of volumetric strain and specific internal energy :
The meanings of the key physical parameters are as follows: is the initial mass density of water; is the nominal volumetric compressive strain of water; is the speed of sound in water; serves as the intercept coefficient in the linear shock velocity–particle velocity relationship; and is the Grüneisen coefficient of the material, representing the contribution of lattice vibration to pressure. The parameters of the water medium are detailed in Table 3.
Table 3.
Water medium parameters.
It should be noted that cavitation is not explicitly incorporated in the present numerical model. The water medium is modeled as a compressible continuum using the Mie–Grüneisen equation of state, and the simulation is intended to reproduce the dominant dynamic behavior of the primary explosion bubble, without accounting for secondary cavitation phenomena.
3.2.3. Equation of State for Air
Air is described using the ideal gas equation of state, which can be expressed as:
In the equation, the specific heat capacity of air is denoted as ; the atmospheric pressure is taken as 101,300 Pa; denotes the gas pressure; is the mass density, taken as ; is the gas constant, taken as 287; is the current temperature; and is the absolute zero temperature.
4. Model Validation
To verify the accuracy of the numerical model, an underwater explosion model is established based on the finite element software ABAQUS 2022, including three components, air, water, and explosives, to simulate the bubble pulsation behavior, as shown in Figure 5. The Eulerian domain is defined with dimensions of 0.3 m × 0.3 m × 0.3 m. The spherical charge is located at a distance of 0.06 m from the free surface and 0.005 m from the vertical elastic plate, corresponding to a nondimensional standoff distance γ = 0.187 for the validation case.
Figure 5.
Comparison of bubble morphology between experimental and numerical results at different times.
To establish the equivalence between the spark-generated explosion experiment and the numerical simulation, the equivalent TNT charge was back-calculated based on the experimentally measured maximum bubble radius and the burial depth of the explosion source. According to the experimental results, the maximum bubble radius was , and the explosion depth was . Substituting these values into the empirical relation for the maximum bubble radius [41]:
the equivalent TNT charge was obtained as . Assuming a spherical charge and taking the TNT density as , the initial equivalent radius of TNT in the numerical model was further determined to be approximately 0.91 mm based on the mass–volume relationship. On this basis, numerical simulations were conducted and compared with the experimental results. The simulated maximum bubble radius was 28 ± 1 mm, which shows an absolute error of 1–2 mm and a relative error of 3.57% compared with the experimental value of 27 mm. In addition, the experimentally measured bubble oscillation period was 5.15 ms, while the numerical result was 5.25 ms, corresponding to an absolute error of 0.10 ms and a relative error of 1.94%. These results indicate that the equivalent TNT charge obtained by back-calculation from the maximum bubble radius can effectively characterize the primary dynamic features of the spark-generated bubble. The numerical model shows good agreement with the experimental results in terms of bubble scale evolution and oscillation period prediction, demonstrating the rationality and reliability of the adopted equivalence method and numerical modeling strategy.
5. Bubble Dynamics Under Different Boundary Conditions
5.1. Bubble Interaction with a Vertical Elastic Plate
5.1.1. Evolution of Bubble Motion
As shown in Figure 6, the interaction states of the bubble at different times under the vertical elastic plate boundary condition, along with the corresponding time instants, are presented. It can be observed that under different nondimensional standoff conditions (γ = 0.0704, 0.187, 0.2656, 0.4268, 1.321), the processes of bubble expansion, contraction, and collapse all exhibit varying degrees of asymmetry. Combined with the spline curves shown in Figure 7, the continuous evolution of the bubble interface morphology over time can be more clearly visualized. Overall, the presence of the vertical elastic plate alters the pressure field distribution around the bubble, causing the bubble to gradually deviate from an approximately axisymmetric evolution from the initial stage of formation, and leading to the formation of a re-entrant jet and eventual collapse during the collapse stage.
Figure 6.
Bubble dynamics near the vertical elastic plate.
Figure 7.
Bubble–plate interaction process at different standoff distances from the vertical plate. (The direction of the arrows indicates the expansion or contraction trend of the bubbles.)
At a small standoff distance (γ = 0.0704, Figure 6a and Figure 7a), the bubble expansion is strongly influenced by the nearby plate. The interface on the plate side is suppressed, while the opposite side expands more freely, resulting in an elongated shape and a centroid migration away from the plate. This asymmetry is mainly caused by the non-uniform pressure field induced by shock reflection at the elastic boundary. During collapse, the asymmetry becomes more pronounced, leading to the formation of a re-entrant jet directed toward the plate and a collapse concentrated near the boundary. This behavior is driven by the higher pressure on the plate side, which induces a non-uniform collapse velocity and promotes directional fluid convergence. As the standoff distance increases to γ = 0.187 and 0.2656 (Figure 6b,c), the expansion stage remains similar, while the asymmetry develops later and becomes weaker. The re-entrant jet still forms but is delayed and less intense. At larger distances (γ = 0.4268 and 1.321, Figure 6d,e), the bubble evolution approaches an axisymmetric pattern. The jet structure is significantly weakened, and the collapse is no longer concentrated near the plate. This indicates that the influence of the elastic boundary gradually diminishes with increasing distance.
To further characterize the fluid motion responsible for the asymmetric bubble evolution near the vertical elastic plate, the pressure field near the boundary is further examined in Figure 8. The results show that the vertical plate reconstructs the surrounding pressure field in a distinctly non-uniform manner. As the bubble pulsation develops, the pressure field around the bubble becomes increasingly uneven, and a more localized pressure-variation region gradually forms near the plate-side interaction zone and the projection area of the bubble axis. This indicates that the load transferred from the fluid to the plate is not spatially uniform, but becomes progressively concentrated as collapse develops.
Figure 8.
Evolution of the pressure field near the vertical elastic plate at representative instants.
The velocity field is shown in Figure 9. At the early stage, the velocity field is distributed over a relatively broad region. As the bubble expands and interacts with the vertical boundary, the flow gradually becomes asymmetric, with the region between the bubble and the plate showing a more concentrated motion compared with the opposite side. As the bubble enters the contraction stage, although the flow field velocity generally decreases, this asymmetry remains very significant. The flow is increasingly directed toward the plate-side interface, indicating that the surrounding liquid motion is preferentially focused in this region. This change in the flow structure is accompanied by a corresponding redistribution of the pressure field. As the flow becomes more localized, the pressure variation near the plate-side interaction zone also becomes more concentrated. Although absolute pressure values are not directly comparable, the spatial evolution indicates that the pressure field is increasingly focused within a limited region. In the later stage, the inward-directed flow leads to the formation of a jet toward the plate. As a result, the load transmitted to the plate is no longer uniformly distributed, but becomes concentrated near the projection of the bubble axis and the jet-affected region. This explains the formation of localized high-stress regions on the vertical plate. Therefore, the non-uniform stress distribution on the vertical plate can be interpreted as the result of the coupled evolution of the velocity and pressure fields during asymmetric bubble collapse. The directional flow and the associated pressure redistribution lead to a localized loading pattern on the plate surface.
Figure 9.
Evolution of the velocity field near the vertical elastic plate at representative instants.
Figure 10 schematically illustrates the measurement method of the bubble length and bubble width for a single bubble. In this study, the maximum diameter is defined as the larger value between the bubble width and bubble length.
Figure 10.
Schematic diagram of bubble length and width.
Based on the measurements, the variation in the maximum bubble diameter and pulsation period with the distance between the explosion point and the vertical elastic plate is shown in Figure 11.
Figure 11.
Variation in maximum diameter and pulsation period (vertical plate).
As shown in Figure 11, both the maximum bubble diameter and the pulsation period vary systematically with the standoff distance under the vertical plate condition. As γ increases from 0.0704 to 1.321, the maximum diameter decreases monotonically, while the pulsation period first increases and then decreases, reaching its maximum at γ = 0.2656.
At the closest distance (γ = 0.0704), the bubble attains its largest size (56.88 mm), indicating a strong enhancement effect of the nearby boundary. As the distance increases, the maximum diameter is reduced by up to about 25%, demonstrating a clear attenuation of boundary influence. In contrast, the pulsation period shows a moderate increase at intermediate distances (up to about 10%) before decreasing again at larger γ. This behavior can be attributed to the interaction between the reflected shock wave and the bubble dynamics. In the near field, the in-phase reflected wave overlaps strongly with the expansion stage, promoting bubble growth and slightly prolonging the oscillation. As the distance increases, the reflected wave becomes delayed and weakened, reducing its coupling with the bubble evolution. Consequently, the bubble behavior gradually approaches free-field conditions, leading to reduced expansion and oscillation effects.
Overall, the influence of the vertical elastic plate is strongest in the near field and decreases progressively with increasing distance, consistent with the transition from asymmetric, jet-dominated collapse to a more symmetric bubble evolution.
5.1.2. Stress Distribution and Deformation Response Characteristics of the Plate Structure
To further clarify the coupling between bubble dynamics and structural response, Figure 12 presents the corresponding bubble morphologies and plate stress distributions at representative standoff distances (γ = 0.0704, 0.4268, and 1.321). The results are consistent with the previously observed features of asymmetric expansion and near-wall collapse.
Figure 12.
Interaction process between the bubble and the elastic plate under three typical conditions (vertical plate).
The von Mises stress on the vertical plate exhibits a clear transient evolution closely linked to bubble dynamics. At the early stage, the stress is rapidly established by the incident shock wave and is mainly concentrated near the plate center, reflecting a localized loading condition. As the bubble expands, the loaded region spreads and the stress level slightly decreases. During the subsequent collapse stage, especially with the development of asymmetric contraction and re-entrant jetting, the stress field becomes increasingly localized again, forming a concentrated high-stress region near the projection of the bubble axis.
A comparison among different standoff distances shows that the distance is a key factor controlling both stress magnitude and localization. At small γ, the stress level is higher and more concentrated due to shorter propagation distance and stronger near-wall pressure non-uniformity. As γ increases, the stress gradually decreases and becomes more uniformly distributed, approaching far-field behavior. In particular, under the smallest distance, the enhanced asymmetry and stronger jet during collapse lead to more pronounced stress concentration, whereas at large distances the boundary effect is weakened and the stress field becomes relatively uniform.
Combined with the analyses of bubble morphology (Figure 6), interface evolution (Figure 7), and global bubble parameters (Figure 11), it can be concluded that the stress distribution in Figure 12 originates from the boundary-induced reconstruction of the local pressure field. The elastic plate amplifies pressure non-uniformity in the near field, thereby enhancing bubble asymmetry and promoting localized loading. This effect weakens progressively with increasing distance, demonstrating a clear distance-dependent interaction between the bubble and the structure.
Based on the deflection distribution curves at seven typical time instants (0.4 ms, 0.8 ms, 1.2 ms, 1.6 ms, 2.0 ms, 4.0 ms, and 6.4 ms) shown in Figure 13, as well as the time-history curves of the deflection at the plate center (Figure 14), the response characteristics of the vertical plate under five distance conditions (γ = 0.0704, 0.187, 0.2656, 0.4268, and 1.321) can be summarized as follows. To avoid confusion, the curves correspond to: black squares for γ = 0.0704, red circles for γ = 0.187, blue upward triangles for γ = 0.2656, green downward triangles for γ = 0.4268, and purple diamonds for γ = 1.321.
Figure 13.
Deflection curves of the plate at different times (vertical plate).
Figure 14.
Deflection curve at the plate center (vertical plate).
Figure 13 shows that the plate deflection exhibits a clear stage-dependent and oscillatory evolution under different standoff distances. In the early stage (about 0.4–0.8 ms), the deflection is positive for all cases and forms a single peak near the plate center. The intermediate-distance cases (γ = 0.2656 and 0.4268) exhibit relatively larger initial deflections, while the far-field case (γ = 1.321) shows the smallest response. As time progresses to the expansion stage (around 1.2–2.0 ms), the central peak gradually flattens and the deflection decreases, indicating a redistribution of the plate deformation. During the bubble collapse stage (around 4.0 ms), the deflection reverses to negative for all conditions, forming a symmetric concave profile with the minimum at the center. At this stage, the far-field condition (γ = 1.321) exhibits the largest negative deflection, whereas the near-field case (γ = 0.0704) remains relatively smaller. In the late stage (about 6.4 ms), the deflection becomes positive again and forms a second central peak, which is generally larger than the initial one. The γ = 1.321 case shows the highest rebound, followed by γ = 0.4268, while the near-field conditions (γ = 0.0704–0.2656) remain relatively smaller.
Overall, all cases follow a typical oscillatory process of “initial positive deflection → reduction → negative deflection during collapse → enhanced positive rebound.” However, the standoff distance significantly affects both magnitude and timing: near-field conditions produce stronger and more immediate responses, whereas far-field conditions exhibit a clear time-lag effect, with weaker early deformation but more pronounced response during the collapse and rebound stages.
The central deflection histories in Figure 14 further confirm the oscillatory behavior observed in Figure 13. All cases exhibit a similar multi-stage evolution: a rapid rise to a first positive peak (about 1.6–1.8 mm within 0–0.8 ms), followed by a short plateau, a transition to negative deflection, and a rebound to a second, generally higher, positive peak. In the early stage, the γ = 0.4268 case rises fastest and shows a slightly higher first peak, while the γ = 1.321 case responds more slowly. All conditions enter the negative phase around 3.0–3.8 ms; the γ = 0.4268 case reaches the minimum earlier and with a larger magnitude, whereas γ = 1.321 shows a delayed and weaker negative response. In the later stage (about 5.5–6.8 ms), all cases form a second positive peak, typically higher than the first. The γ = 1.321 and γ = 0.187–0.2656 conditions exhibit relatively larger rebound amplitudes (about 2.6–2.8 mm), while γ = 0.4268 peaks earlier and decays more rapidly. Overall, although the evolution pattern is consistent, the standoff distance significantly affects the phase and amplitude: γ = 0.4268 shows a clear phase advance, while γ = 1.321 exhibits a delayed but stronger response in the middle and late stages.
Figure 15 shows the pressure–time history at the center of the vertical plate. The response exhibits a multi-stage loading process, consisting of an initial sharp peak induced by the shock wave followed by several secondary peaks during bubble pulsation. This indicates that the plate loading is not a single impulsive event but involves repeated pressure re-intensification associated with bubble contraction and collapse, leading to temporally intermittent structural response. Negative values are also observed in the pressure history, indicating that the plate center is in a tensile state and that the pressure is below the hydrostatic reference level. This behavior is associated with transient unloading during bubble expansion, driven by rarefaction wave propagation and local fluid-pressure redistribution. As the bubble subsequently contracts, the surrounding liquid accelerates back toward the plate, resulting in a rapid pressure increase and the formation of positive peaks. The repeated alternation between negative and positive pressures reflects the oscillatory nature of the bubble–fluid system. Due to fluid inertia and pressure–wave interactions, the re-converging flow can overshoot the equilibrium state, leading to successive cycles of compression and expansion. These processes, together with bubble subsequent pulsations, produce multiple loading–unloading cycles, which manifest as the observed alternating pressure fluctuations.
Figure 15.
The pressure–time historical curve at the center of the vertical plate.
5.2. Bubble Interaction with a Horizontal Elastic Plate
5.2.1. Evolution of Bubble Motion
Figure 16 and Figure 17 present the experimental observations and corresponding interface evolution of a bubble interacting with a horizontal elastic plate. Although slight plate motion is observed, the bubble evolution remains predominantly vertical and nearly axisymmetric. During the expansion stage, the bubble expands approximately radially, while the interface near the plate is clearly constrained. Around 2 ms, the lower interface continues to expand outward, whereas the upper interface becomes flattened. This feature is observed for all standoff distances, with the constraint effect gradually weakening as the distance increases. The mechanism is that shock reflection at the plate forms a high-pressure region above the bubble, reducing the local expansion rate on the plate side and leading to a vertically non-uniform interface evolution. However, the timing of maximum expansion remains similar across cases. During the collapse stage, the influence of the plate becomes more pronounced. The interface near the plate contracts earlier, and the overall motion shows a clear tendency of fluid convergence toward the plate along the vertical direction, while the lower part collapses relatively later. With increasing distance, the degree of interface deformation decreases, but the collapse direction remains predominantly vertical. These observations indicate that the pressure gradient induced by the horizontal plate governs the collapse path, resulting in a stable directional contraction of the bubble toward the plate.
Figure 16.
Bubble motion near a horizontal plate.
Figure 17.
Interaction process between bubble and horizontal plate at different distances. (The direction of the arrows indicates the expansion or contraction trend of the bubbles.)
To further interpret the flow organization under the horizontal plate condition, the corresponding velocity and pressure fields are shown in Figure 18 and Figure 19. Compared with the vertical plate case, the velocity field beneath the horizontal plate remains largely organized about the vertical centerline and does not exhibit a persistent lateral bias. As the pulsation proceeds, the high-gradient velocity region gradually becomes concentrated beneath the plate and around the bubble axis, indicating that the surrounding liquid momentum is focused primarily in the direction normal to the plate. The pressure contours in Figure 19 show a corresponding evolution feature. Under the horizontal plate condition, the pressure field remains predominantly center-controlled and approximately axisymmetric with respect to the bubble centerline. During expansion, the reflected pressure field above the bubble continuously modifies the force balance on the interface near the plate, leading to a restrained upper contour while the lower part of the bubble retains a relatively greater freedom to develop. As the bubble enters collapse, the pressure redistribution remains mainly concentrated beneath the plate rather than shifting laterally, which explains why the collapse path and the ensuing jet remain predominantly vertical.
Figure 18.
Evolution of the velocity field near the horizontal elastic plate at representative instants.
Figure 19.
Evolution of the pressure field near the horizontal elastic plate at representative instants.
As shown in Figure 20, under the horizontal plate condition, both the maximum bubble diameter and pulsation period exhibit a non-monotonic dependence on the standoff distance. The maximum diameter reaches its peak (46.41 mm) at γ = 0.1292, while other cases remain within a relatively narrow range (approximately 36–43 mm). A similar trend is observed for the pulsation period, which attains its maximum (5.41 ms) at the same distance, whereas most other conditions are concentrated in the range of 4.2–4.6 ms. This indicates that the horizontal plate does not continuously enhance or suppress bubble evolution, but instead produces a distance-dependent coupling effect, with the strongest interaction occurring at an intermediate distance.
Figure 20.
Variation in maximum diameter and pulsation period (horizontal plate).
The non-monotonic variation in both the maximum bubble diameter and the pulsation period under the horizontal plate condition indicates that the boundary effect is not a simple monotonic confinement, but rather the result of a competition between near-wall suppression and constructive pressure-field coupling. When the explosion center is extremely close to the plate, the reflected pressure field is established too early and too strongly, acting on the bubble during the initial expansion stage. This leads to a pronounced suppression of the upper interface development, limiting the overall volumetric growth of the bubble. As a result, the bubble reaches a smaller maximum size and undergoes a shorter oscillation timescale, yielding a reduced pulsation period. As the standoff distance increases to an intermediate range (e.g., γ = 0.1292), the excessive early-stage suppression is alleviated, while the reflected pressure disturbance remains sufficiently strong and becomes better aligned with the later stage of bubble expansion. Under this condition, the reflected pressure field interacts constructively with the expanding bubble, enhancing effective energy retention and delaying the onset of collapse. Consequently, the bubble achieves a more favorable global expansion morphology, a larger maximum diameter, and a prolonged oscillation process, resulting in the peak values of both maximum diameter and pulsation period. When the distance increases further, the reflected pressure field gradually attenuates and becomes temporally delayed relative to the bubble dynamics. Its coupling with the expansion–collapse cycle weakens significantly, and the bubble behavior progressively approaches that under free-field conditions. Accordingly, both the maximum diameter and the pulsation period decrease. Therefore, the observed non-monotonic variations are governed by the degree of temporal coupling between the reflected pressure field and the intrinsic bubble oscillation process, rather than by the standoff distance alone.
Further comparison between the horizontal and vertical plate boundary conditions shows that the spatial orientation of the boundary has a significant influence on bubble dynamics. Under the vertical plate condition, the maximum bubble diameter decreases monotonically with distance, from 56.88 mm at γ = 0.0325 to 42.39 mm at γ = 1.321, with an overall reduction of approximately 25.5%. In contrast, under the horizontal plate condition, the maximum diameter ranges from 36.16 mm to 46.41 mm and exhibits a non-monotonic variation, indicating that, under the present experimental conditions, the vertical plate tends to exert a more pronounced influence on the bubble expansion behavior. In terms of the pulsation period, the two boundary conditions also show different patterns. Under the vertical plate condition, the pulsation period varies from 4.6 ms to 5.3375 ms, showing a trend of first increasing and then decreasing. Under the horizontal plate condition, the pulsation period ranges from 4.2125 ms to 5.4125 ms, with most cases concentrated in the range of 4.2–4.6 ms, and only the γ = 0.1292 condition showing a significant increase (5.4125 ms), indicating a stronger coupling effect between the boundary and bubble pulsation at this distance.
The main reason for these differences lies in the different effects of the two boundary orientations on the pressure gradient distribution around the bubble. Under the vertical plate condition, the reflected pressure mainly establishes a non-uniform pressure field in the horizontal direction, causing significant centroid displacement during expansion and forming a jet directed toward the wall during collapse, thereby exerting a stronger modulation effect on the bubble expansion scale. In contrast, under the horizontal plate condition, the reflected pressure mainly establishes a pressure gradient in the vertical direction, causing the interface near the plate to be constrained during expansion, but having a relatively weak effect on the overall volumetric growth of the bubble. Therefore, under the horizontal plate condition, the bubble dynamics are mainly reflected in the evolution of interface morphology and the directional adjustment of the collapse path.
5.2.2. Stress Distribution and Deformation Response Characteristics of the Plate Structure
To further reveal the coupling relationship between bubble pulsation and structural loading under horizontal elastic boundary conditions, Figure 21 presents the von Mises stress contours of the horizontal plate and the corresponding bubble morphologies at three typical conditions (with standoff distances of γ = 0.1292, γ = 0.4978, and γ = 1.5894), obtained from ABAQUS simulations, to supplement the analysis of bubble dynamics from the perspective of structural response. From the bubble morphology, it can be observed that the horizontal plate exerts a significant constraint on the upper interface of the bubble. During the expansion stage, the bubble exhibits a development pattern characterized by restricted expansion at the top and outward expansion at the bottom; during the collapse stage, it is more likely to form fluid convergence and jet structures along the vertical direction, which is consistent with experimental observations.
Figure 21.
Interaction process between the bubble and the elastic plate under three typical conditions (horizontal plate).
Unlike the vertical plate condition, where the stress distribution shows strong lateral non-uniformity, Figure 21a–c indicate that the von Mises stress on the horizontal plate exhibits an approximately axisymmetric distribution centered around the plate center. However, the maximum stress does not always occur at the center at all times. For a given condition, the temporal evolution of the plate stress is mainly reflected in the continuous adjustment of the stress distribution near the central region, rather than significant spatial migration.
The temporal evolution of stress shows a clear stage-dependent behavior. At about 0.4 ms, the stress is rapidly established at the plate center due to shock loading. At 0.8 ms, a ring-like distribution appears, with slightly lower stress at the center, indicating a transient outward spread of the load. As the bubble continues to expand (1.2–2.0 ms), the stress field gradually re-concentrates toward the center, forming an axisymmetric distribution with radial attenuation. During the subsequent contraction stage (2.0–4.0 ms), the stress pattern transitions from outward spreading to inward convergence, with the high-stress region moving back toward the center. In the later stage (4.0–6.4 ms), the stress becomes further concentrated at the center, indicating that the continued fluid convergence enhances the normal load acting on the plate.
Comparisons among different conditions at the same time indicate that the distance between the explosion center and the horizontal plate is a key factor determining both the stress level and its degree of concentration. During the 0.4–1.6 ms stage, all three conditions show significant stress responses near the plate center, with the γ = 0.1292 condition exhibiting the highest peak stress and the most concentrated contours, followed by the γ = 0.4978 condition, while the γ = 1.5894 condition shows a more uniform stress distribution and a significantly smaller high-stress region. This is because under near-field conditions, the shock wave travels a shorter distance with less attenuation, allowing the plate to experience stronger transient normal loads earlier. As time progresses beyond 2.0 ms, this trend remains, but differences among conditions increasingly reflect the modulation of stress distribution by bubble collapse. Under the γ = 0.1292 condition, due to the strongest boundary constraint, fluid convergence along the vertical direction during collapse is more pronounced, leading to a persistent high-stress concentration at the plate center. Under the γ = 0.4978 condition, although central stress response still exists, the degree of concentration is reduced. Under the 1.5894 condition, boundary effects are further weakened, and the stress distribution becomes more uniform, approaching the axisymmetric loading characteristics dominated by far-field shock waves. Overall, at the same time instant, the plate stress decreases with increasing distance, i.e., the γ = 0.1292 condition is the largest, followed by γ = 0.4978, and γ = 1.5894 is the smallest.
Overall, Figure 21 demonstrates that the structural response of the horizontal plate under underwater explosion bubble loading exhibits a pronounced “center-controlled” characteristic. Since the elastic boundary is located above the bubble, the reflected pressure wave and confined fluid motion jointly enhance the normal load in the central region of the plate, causing the stress field to remain centered around the projection area throughout the evolution process. As the distance between the explosion center and the plate increases, this central constraint effect gradually weakens, and both the stress level and concentration decrease. Therefore, the stress response mechanism of the horizontal plate is mainly characterized by axisymmetric loading under vertical constraint, which is significantly different from the asymmetric pressure redistribution and biased collapse mechanism induced by vertical plates.
Based on the deflection distribution curves at seven typical time instants (0.4 ms, 0.8 ms, 1.2 ms, 1.6 ms, 2.0 ms, 4.0 ms, and 6.4 ms) shown in Figure 22, as well as the time-history curve of the central deflection, the response characteristics of the plate under five distance conditions (γ = 0.0484, γ = 0.1292, γ = 0.2622, γ = 0.4978, and γ = 1.5894) can be summarized as follows. The curve symbols correspond to: black squares for γ = 0.0484, red circles for γ = 0.1292, blue upward triangles for γ = 0.2622, green downward triangles for γ = 0.4978, and purple diamonds for γ = 1.5894.
Figure 22.
Deflection curves of the plate at different times (horizontal plate).
From the comparison at the same time, the deflection distribution exhibits clear stage-dependent characteristics. In the early stage (0.4–0.8 ms), all curves show an approximately symmetric positive deflection with a single peak near the plate center. The differences among the γ = 0.0484–γ = 0.2622 conditions are small, the γ = 0.4978 condition is slightly lower, and the γ = 1.5894 condition is the smallest. At 1.2 ms, the central region gradually transitions from a sharp peak to a plateau, and the γ = 1.5894 condition gradually exhibits a dominant positive deflection. At 1.6 ms, the γ = 0.0484–γ = 0.4978 conditions have already transitioned to negative deflection, while the γ = 1.5894 condition remains close to zero, indicating a clear response delay. During the 2.0–4.0 ms stage, all conditions enter the negative deflection state and form a trough near the center, with the γ = 0.4978 condition exhibiting the largest negative deflection. At 6.4 ms, the plate returns to a positive deflection with a single central peak, and the γ = 1.5894 condition shows the highest central deflection. Overall, all conditions exhibit clear distance effects at the same time, but these effects vary with the response stage: near-field conditions dominate in the early stage, while long-distance conditions become more prominent in the middle and late stages.
From the temporal evolution under the same condition, all cases exhibit a staged process of “positive deflection establishment—gradual reduction—transition to negative deflection—recovery from negative deflection—reappearance of positive deflection peak.” For the near-field conditions (γ = 0.0484–γ = 0.4978), a high positive deflection peak is formed at 0.4 ms, followed by gradual reduction during 0.8–1.2 ms, transition to negative deflection at approximately 1.6 ms, and reaching a negative peak near 2.0 ms. Subsequently, the deflection recovers and forms a second positive peak at 6.4 ms. Among them, the γ = 0.4978 condition shows slightly higher positive deflection and a relatively larger negative amplitude. In contrast, the γ = 1.5894 condition shows a distinct temporal pattern: its early response is weaker, but it increases rapidly around 1.2 ms and reaches the highest positive deflection; it remains near zero while other conditions have already become negative, indicating a clear time delay; it then exhibits a large negative deflection at 4.0 ms and reaches the maximum positive deflection again at 6.4 ms.
From the time-history curve of the central deflection shown in Figure 23, it can be further observed that near-field conditions (γ = 0.0484–γ = 0.4978) have similar first positive peaks, while the γ = 1.5894 condition has a higher peak that appears slightly later. Subsequently, all curves rapidly enter the negative region and form a trough, with the γ = 1.5894 condition reaching the minimum later than the others. The curves then rise again to form a second positive peak, with the γ = 1.5894 condition showing the largest amplitude and earlier occurrence, while the near-field conditions exhibit similar amplitudes. Overall, the central deflection exhibits a clear oscillatory characteristic, and significant differences exist among different distance conditions in terms of peak magnitude, occurrence time, and decay rate. Among them, the γ = 1.5894 condition shows the largest amplitude with a slight phase lag, while the γ = 0.0484–γ = 0.4978 conditions exhibit relatively consistent response patterns.
Figure 23.
Deflection curve at the plate center (horizontal plate).
By comparing the results in Figure 13 and Figure 22, it can be observed that the plate deflection responses under different spatial orientations of elastic plates exhibit both similarities and significant differences. Under both boundary conditions, the deflection shows a typical staged oscillatory behavior over time, namely rapid establishment of positive deflection in the early stage, followed by gradual reduction and transition to negative deflection, and finally recovery to a second positive peak. However, differences exist in spatial distribution and distance effects. Under the vertical plate condition, the plate response is more influenced by the asymmetric evolution of the bubble, and differences among distance conditions are mainly reflected in the magnitude and temporal variation in the central deflection, with long-distance conditions showing more pronounced enhancement in the middle and late stages. In contrast, under the horizontal plate condition, the deflection maintains a more stable axisymmetric distribution, and the distance effect exhibits more obvious stage-dependent transitions. These differences indicate that the spatial orientation of the boundary significantly modulates the pressure gradient direction around the bubble and the collapse path, thereby influencing the load distribution on the plate and the structural dynamic response process.
Figure 24 presents the pressure–time history at the center of the horizontal plate. The response is characterized by a compact multi-peak structure, where the initial shock-induced peak is followed by several closely spaced secondary peaks during bubble pulsation. This indicates that the loading process is temporally clustered, and the structural response at the plate center is governed by the cumulative effect of successive pressure re-intensification rather than isolated loading events. Negative values are also present in the pressure history, indicating transient tensile states of the plate center relative to the hydrostatic pressure. The underlying mechanism is consistent with that described for the vertical plate case. However, the temporal evolution under the horizontal configuration exhibits a distinctly different pattern. The unloading and reloading processes occur in a more synchronized manner, leading to a tighter clustering of pressure peaks. In contrast, the vertical plate case is affected by asymmetric bubble collapse, which introduces additional temporal dispersion in the pressure response. As a result, although the fundamental mechanism is similar, the horizontal plate shows a more regular and temporally concentrated oscillatory behavior.
Figure 24.
Pressure–time history at the center point of the horizontal elastic plate obtained from the CEL simulation.
6. Conclusions
In this study, underwater electrical explosion experiments combined with high-speed imaging and supplemented by the coupled Eulerian–Lagrangian (CEL) numerical method were conducted to investigate the evolution characteristics of underwater explosion bubbles near elastic plates with different spatial orientations, as well as the corresponding structural response of the plates. The main conclusions are as follows:
- (1)
- The spatial orientation of the elastic boundary strongly governs bubble evolution and the resulting loading pattern. Under the vertical plate condition, the bubble exhibits pronounced asymmetric deformation, leading to localized and non-uniform loading. In contrast, under the horizontal plate condition, the bubble evolution remains approximately axisymmetric, with the interface near the plate being constrained and the collapse developing predominantly along the plate-normal direction. Consequently, the structural loading becomes more centrally concentrated and spatially symmetric.
- (2)
- The standoff distance plays a key role in controlling the coupling between the bubble and the boundary. With increasing distance, the reflected pressure wave becomes progressively delayed and attenuated, reducing its interaction with bubble dynamics and leading to a transition toward free-field behavior. Under the vertical plate condition, the maximum bubble diameter decreases monotonically with distance, while the oscillation period exhibits a non-monotonic trend. In contrast, under the horizontal plate condition, both the diameter and period vary non-monotonically within a narrower range, indicating a weaker but more temporally dependent coupling governed by the synchronization between reflected pressure and bubble evolution.
- (3)
- A strong fluid–structure interaction coupling exists between bubble dynamics and plate response, with distinct loading characteristics governed by boundary orientation. Under the vertical plate condition, asymmetric bubble collapse and jet impingement lead to highly localized and non-uniform stress distributions, accompanied by temporally dispersed pressure peaks that exhibit intermittent intensification during the bubble pulsation process. In contrast, under the horizontal plate condition, the structural response is dominated by an approximately axisymmetric loading pattern centered on the plate, where multiple pressure peaks occur in a more temporally concentrated manner, reflecting a clustered loading process associated with bubble contraction and collapse. In both configurations, increasing the standoff distance reduces the overall load intensity and spatial concentration, highlighting the attenuation effect of distance on bubble–structure interaction.
A limitation of the present study is that cavitation effects are not explicitly considered in either the experiments or the numerical model, and their influence on local pressure distribution and structural response requires further investigation. In naval and offshore structures, such as ship hulls, bulkheads, and underwater platforms, similar bubble–structure interaction processes occur during near-field underwater explosions. The present experimental results can therefore be extrapolated to engineering conditions by combining the observed dimensionless trends with numerical simulations under higher energy levels and realistic structural configurations. However, differences in energy scale, structural stiffness, and hydrostatic pressure may affect the quantitative response. Future work will focus on incorporating cavitation effects, extending the analysis to higher energy and pressure conditions, and considering more realistic structural configurations to improve the engineering relevance of the model.
Author Contributions
Methodology, L.L.; writing—original draft preparation, K.C.; funding acquisition, X.H.; numerical simulation, C.X., L.X. All authors have read and agreed to the published version of the manuscript.
Funding
National Natural Science Foundation of China (52401383).
Data Availability Statement
The original contributions presented in this study are included in the article. Further inquiries can be directed to the corresponding author.
Conflicts of Interest
Changan Xu is an employee of China Merchants Marine and Offshore Research Institute Co., Ltd. The paper reflects the views of the scientists and not the company. The authors declare that there is no conflicts of interest regarding the publication of this paper.
References
- Liu, W.T.; Ming, F.R.; Zhang, A.M.; Miao, X.; Liu, Y. Continuous simulation of the whole process of underwater explosion based on Eulerian finite element approach. Appl. Ocean Res. 2018, 80, 125–135. [Google Scholar] [CrossRef] [Scilit]
- Wang, S.P.; Zhang, A.M.; Liu, Y.L.; Zhang, S.; Cui, P. Bubble dynamics and its applications. J. Hydrodyn. 2018, 30, 975–991. [Google Scholar] [CrossRef] [Scilit]
- Zhou, S.T.; Mo, T.F.; Ren, X.D.; Xu, Q.; Sun, Q.-Z.; Zhang, S.-Q.; Huang, X.-B.; Zhang, Z.-H.; Liu, W.-Y. Experimental study on pulsation and energy characteristics of bubbles produced by underwater electrical explosion. ACTA Phys. Sin. 2024, 73, 245204. [Google Scholar] [CrossRef] [Scilit]
- Shan, F.; He, Y.; Jiao, J.J.; Wang, H.-C. Experimental and theoretical analysis of detonation products state on bubble dynamics and energy distribution in underwater explosion. J. Appl. Phys. 2021, 130, 174701. [Google Scholar] [CrossRef] [Scilit]
- Liu, Y.L.; Zhang, A.M.; Tian, Z.L.; Wang, S. Investigation of free-field underwater explosion with Eulerian finite element method. Ocean Eng. 2018, 166, 182–190. [Google Scholar] [CrossRef] [Scilit]
- Li, H.L.; Zhang, J.Y.; Wang, L.K.; Li, B.; Zhang, Z.; Zhang, G.; Zong, Z. Bubble dynamics and structural damage caused by underwater explosion. Int. J. Mech. Sci. 2025, 297, 110387. [Google Scholar] [CrossRef] [Scilit]
- Gannon, L. Simulation of underwater explosions in close-proximity to a submerged cylinder and a free-surface or rigid boundary. J. Fluids Struct. 2019, 87, 189–205. [Google Scholar] [CrossRef] [Scilit]
- Hsu, C.Y.; Liang, C.C.; Nguyen, A.T.; Teng, T.-L. A numerical study on the underwater explosion bubble pulsation and the collapse process. Ocean Eng. 2014, 81, 29–38. [Google Scholar] [CrossRef] [Scilit]
- Lai, Z.C.; Deng, S.; Qin, J.; Chi, H.; Meng, X.; Yang, X.; Huang, R. Investigation on bubble load characteristics of near-field underwater explosion. Ocean Eng. 2023, 284, 115215. [Google Scholar] [CrossRef] [Scilit]
- Wang, Q.; Feng, L.H.; Liu, N.N.; Li, M.; Zhao, P.-D.; Zhang, L.; Wang, S.-P. Experimental study of load characteristics caused by underwater explosion bubble collapsing in the neighborhood of a rigid wall. Ocean Eng. 2023, 287, 115903. [Google Scholar] [CrossRef] [Scilit]
- Han, L.X.; Zhou, L.T.; Mukhtar, M.; Zhang, A.-M.; Han, R.; Li, S. Influence of hydrostatic pressure on underwater explosion bubble-plate interaction. Appl. Ocean Res. 2025, 155, 104434. [Google Scholar] [CrossRef] [Scilit]
- Wen, Y.B.; Qin, J.; Lai, Z.C.; Meng, X.; Yang, X.; Chi, H.; Chen, Y.; Huang, R. Experimental and numerical simulation investigation of cavitation phenomenon during bubble pulsation process. Int. J. Impact Eng. 2024, 186, 104891. [Google Scholar] [CrossRef] [Scilit]
- Choi, K.; Kim, H.; Kim, C. Effects of phase change in double underwater explosion bubbles. Ocean Eng. 2024, 308, 118254. [Google Scholar] [CrossRef] [Scilit]
- Hu, H.W.; Li, D.K.; Zheng, J.; Zhang, Z. Experimental and numerical study on bubble pulsation characteristics of underwater explosions with multiple charges. Phys. Fluids 2024, 36, 102112. [Google Scholar] [CrossRef] [Scilit]
- Gao, Y.; Yang, T.H.; Wang, C.; Sun, Y. Experimental study on shock wave and bubble pulsation behavior generated by underwater aluminum wire electrical explosion. Appl. Ocean Res. 2025, 154, 104407. [Google Scholar] [CrossRef] [Scilit]
- Zhang, J.X.; Wang, S.S.; Jia, X.Y.; Gao, Y.; Ma, F. An engineering application of Prosperetti and Lezzi equation to solve underwater explosion bubbles. Phys. Fluids 2021, 33, 017118. [Google Scholar] [CrossRef] [Scilit]
- Wu, W.B.; Liu, M.B.; Zhang, A.M.; Liu, Y.-L. Fully coupled model for simulating highly nonlinear dynamic behaviors of a bubble near an elastic-plastic thin-walled plate. Phys. Rev. Fluids 2021, 6, 013605. [Google Scholar] [CrossRef] [Scilit]
- Cheng, L.L.; Huang, F.L.; Wu, H.J.; Dong, H.; Tian, S. Cumulative damage effects of repeated underwater explosions on multi-cabin structures. Thin-Walled Struct. 2024, 204, 112231. [Google Scholar] [CrossRef] [Scilit]
- Zhang, A.M.; Yang, W.S.; Huang, C.; Ming, F.-R. Numerical simulation of column charge underwater explosion based on SPH and BEM combination. Comput. Fluids 2013, 71, 169–178. [Google Scholar] [CrossRef] [Scilit]
- Tian, L.Y.; Xu, X.Y. An improved SPH method for simulating near-surface underwater explosions in shallow water. Eur. J. Mech. B-Fluids 2026, 116, 204420. [Google Scholar] [CrossRef] [Scilit]
- Zhang, Y.F.; Liu, L.T.; Wang, J.X.; Tang, K.; Ma, T. Study on the impact characteristics of underwater explosion bubble jets induced by plate structure. Ocean Eng. 2022, 266, 112641. [Google Scholar] [CrossRef] [Scilit]
- Hu, H.W.; Song, P.; Guo, S.F.; Feng, H.-Y.; Li, D.-K. Shock wave and bubble characteristics of underwater array explosion of charges. Def. Technol. 2022, 18, 1445–1453. [Google Scholar] [CrossRef] [Scilit]
- Yu, J.; Li, H.T.; Sheng, Z.X.; Hao, Y.; Liu, J.-H. Numerical research on the cavitation effect induced by underwater multi-point explosion near free surface. AIP Adv. 2023, 13, 015021. [Google Scholar] [CrossRef] [Scilit]
- Dong, Y.F.; Han, W.; Li, R.N.; Nan, H.; Shen, X.; Yang, S.; Bai, L. Directional enhancement of underwater impact and bubble loads in neighbor two-phase fluid domains. Appl. Ocean Res. 2024, 153, 104269. [Google Scholar] [CrossRef] [Scilit]
- Chen, Y.W.; Wang, C.; Sun, Y.X.; Wang, T. Effects of the ballast water state on the dynamic response of cabin structure subjected to underwater explosion. Thin-Walled Struct. 2026, 219, 114266. [Google Scholar] [CrossRef] [Scilit]
- Gao, H.P.; Tian, H.D.; Gao, X.T. Damage characteristics of cabin in navigational state subjected to near-field underwater explosion. Ocean Eng. 2023, 277, 114256. [Google Scholar] [CrossRef] [Scilit]
- Wang, Q.; Gao, Z.L.; Li, C.B.; Chen, W.; Li, X. Effect of water-filled cabins on explosion resistance for ship side structure. Ships Offshore Struct. 2025, 1–20. [Google Scholar] [CrossRef] [Scilit]
- Pang, C.C.; Wang, J.X.; Shi, S.Z.; Liu, K. Damage characteristics of steel sandwich panels subjected to combined shock wave and bubble pulsation. Ships Offshore Struct. 2025, 1–19. [Google Scholar] [CrossRef] [Scilit]
- Jain, S.; Pandey, A.; Matos, H.; Shukla, A. Curved sandwich composite panels subjected to a near-field underwater explosion. Compos. Struct. 2025, 370, 119357. [Google Scholar] [CrossRef] [Scilit]
- Yang, S.X.; Zhang, S.H.; Wang, L.K.; Chen, L.; Li, B.; Zhang, Z.; Li, T. Damage mechanism of double-layer cylindrical shell subjected to underwater explosion. Phys. Fluids 2025, 37, 037139. [Google Scholar] [CrossRef] [Scilit]
- Wanchoo, P.; Pandey, A.; Leger, M.; LeBlanc, J.; Shukla, A. Energy quantification framework for underwater explosive loading into PVC foam cladded composite plates. J. Mech. Phys. Solids 2024, 187, 105646. [Google Scholar] [CrossRef] [Scilit]
- Liu, X.B.; Li, S.M.; Li, S. Strong interaction between an oscillating bubble and elastic steel plates in underwater contact explosions. Phys. Fluids 2025, 37, 083372. [Google Scholar] [CrossRef] [Scilit]
- Huang, X.P. Damage effect of underwater explosion bubble on concrete gravity dam. Eng. Fail. Anal. 2024, 163, 108516. [Google Scholar] [CrossRef] [Scilit]
- Chen, Z.J.; Li, J.; Zong, Z.H.; Li, J.; Li, M.; Wu, C. Damage analysis of RC panels subjected to shock wave and bubble pulse in underwater explosion. Eng. Struct. 2025, 335, 120331. [Google Scholar] [CrossRef] [Scilit]
- Hung, C.F.; Hwangfu, J.J. Experimental study of the behaviour of mini-charge underwater explosion bubbles near different boundaries. J. Fluid Mech. 2010, 651, 55–80. [Google Scholar] [CrossRef] [Scilit]
- Chen, Y.Y.; Yao, X.L.; Cui, X.W.; Li, S.; Liu, L. Study on the quantitative law of wall pressure caused by mini-charge underwater explosion bubble. Ocean. Eng. 2020, 213, 107552. [Google Scholar]
- Huang, R.Y.; Chen, Y.F.; Qin, J.; Meng, X.; Wen, Y.; Yang, X.; Lai, Z. Investigation on cavitation phenomena and load characteristics of fixed square plates subjected to near-field underwater explosion. Ocean Eng. 2024, 295, 116905. [Google Scholar] [CrossRef] [Scilit]
- Chen, S.; Qin, J.; Deng, S.; Meng, X.; Huang, R.; Yang, X. Experimental and Numerical Studies on Fixed Steel Sheets Subjected to Underwater Explosion. Materials 2022, 15, 6419. [Google Scholar] [CrossRef] [Scilit]
- Su, B.; Yao, X.L.; Cui, X.W. Experimental research of underwater explosion bubble dynamics between two parallel plates with various distances. Appl. Ocean Res. 2022, 122, 103081. [Google Scholar] [CrossRef] [Scilit]
- Wang, C.; Chen, Y.W.; Sun, Y.X.; Yang, T. Experimental research of bubble pulsation and jet under a double plate with circular hole. Ocean Eng. 2024, 306, 118127. [Google Scholar] [CrossRef] [Scilit]
- Cole, R.H. Underwater Explosions; Princeton University Press: Princeton, NJ, USA, 1948. [Google Scholar]
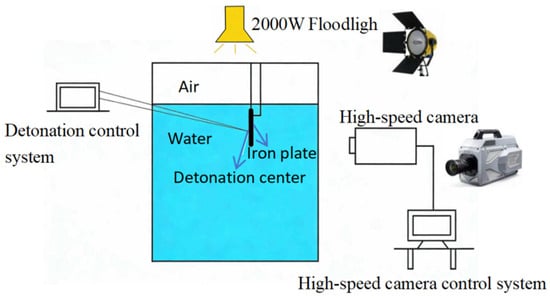
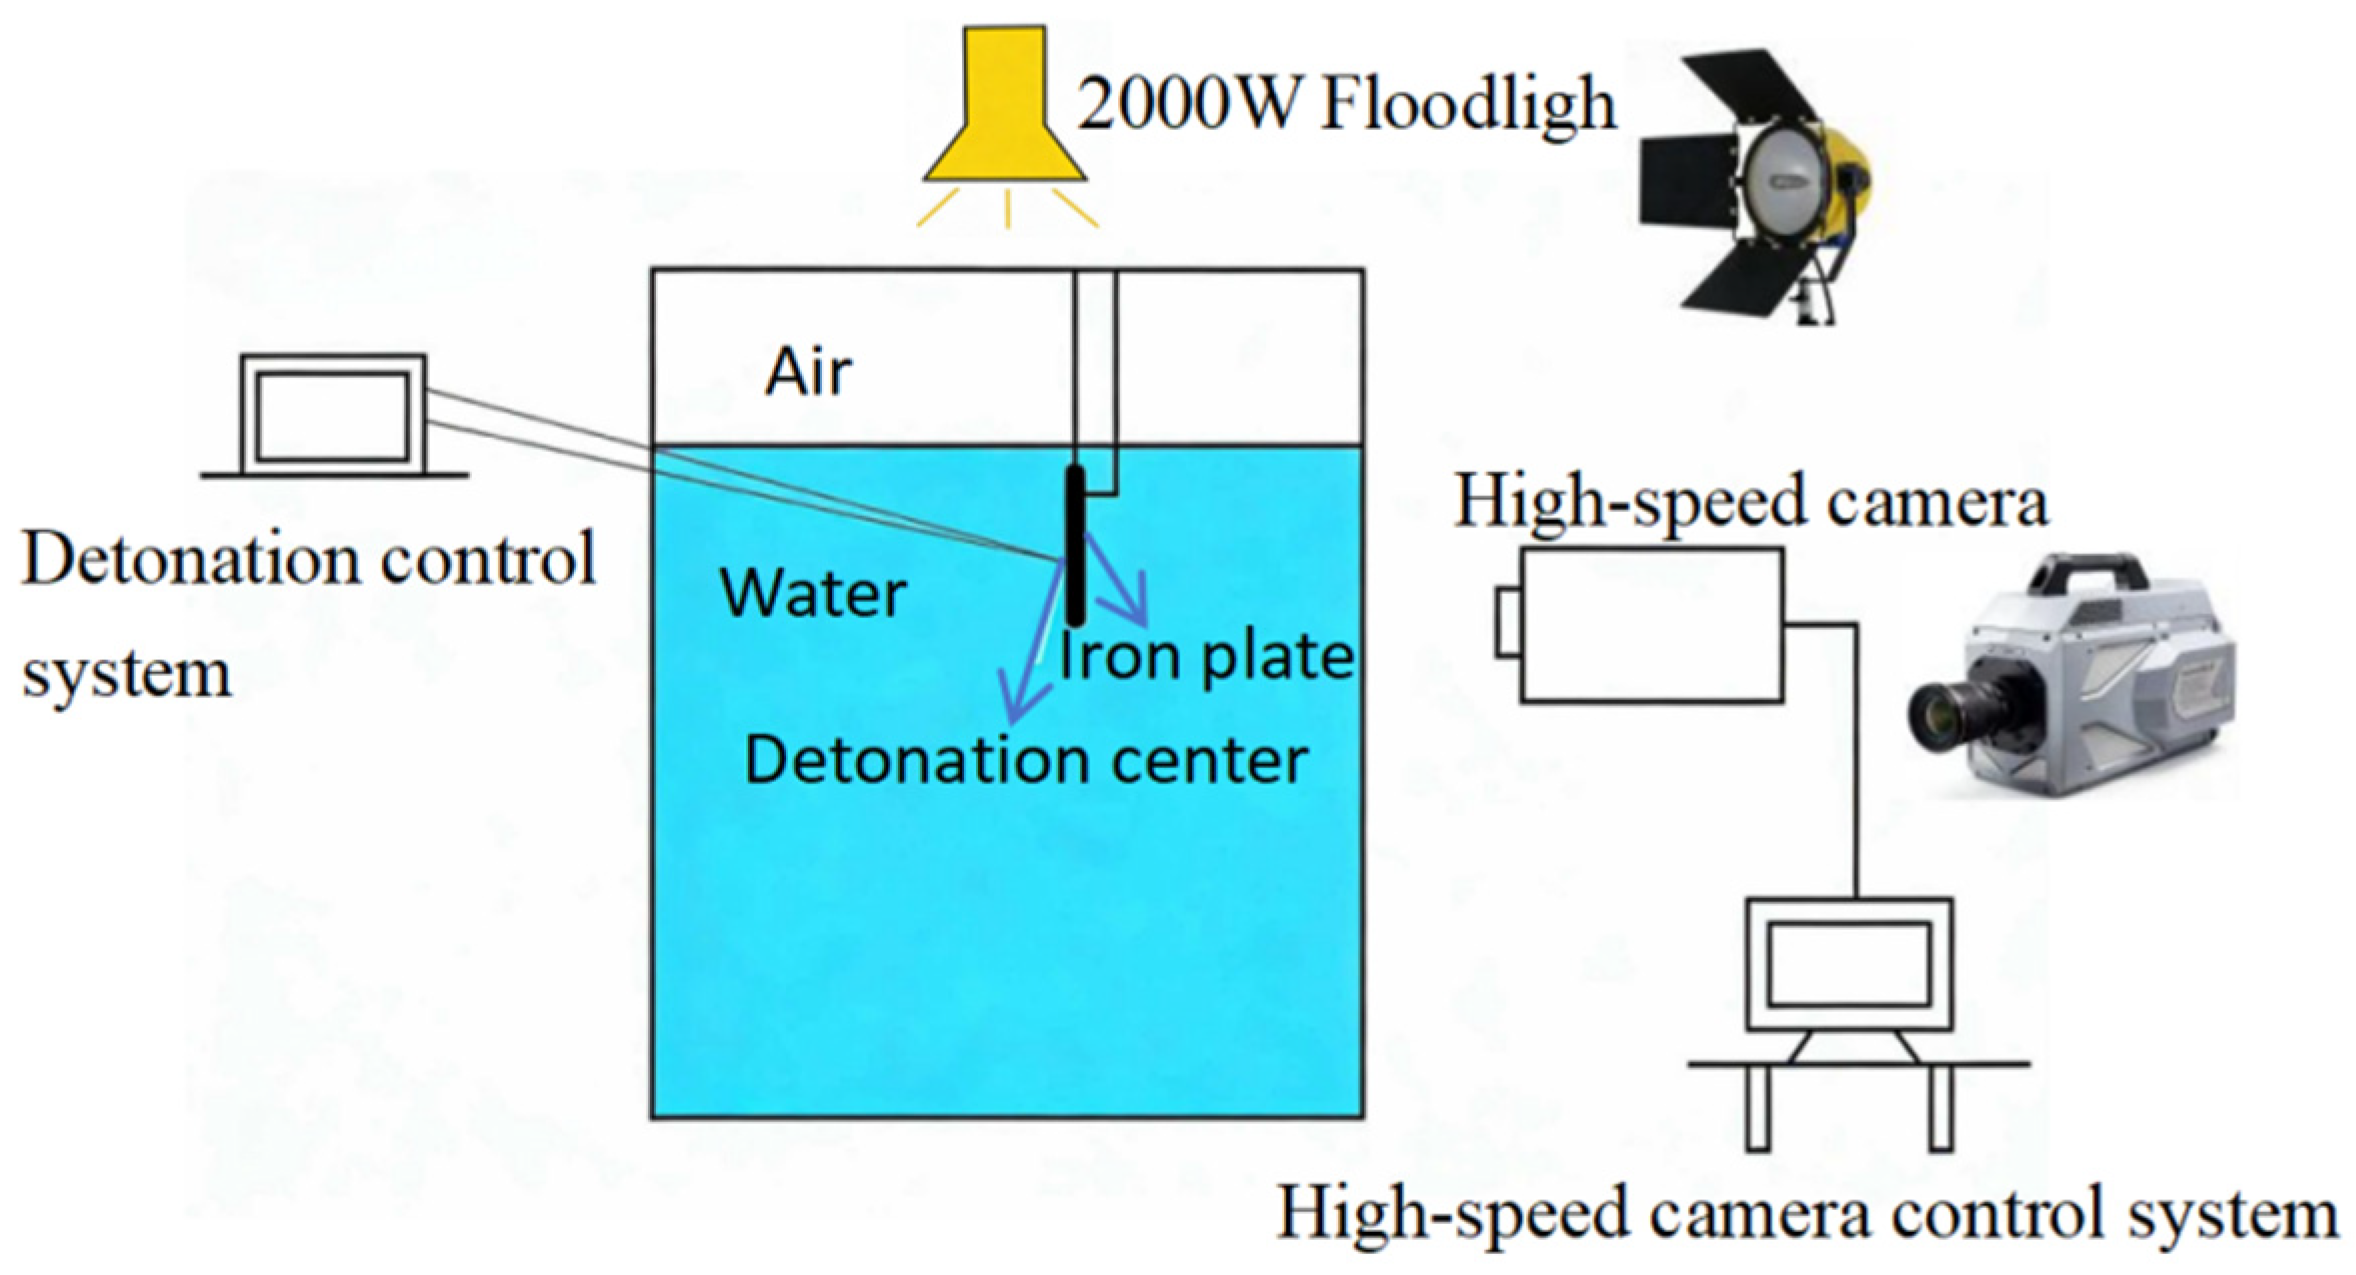
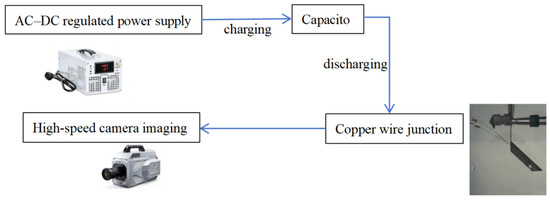
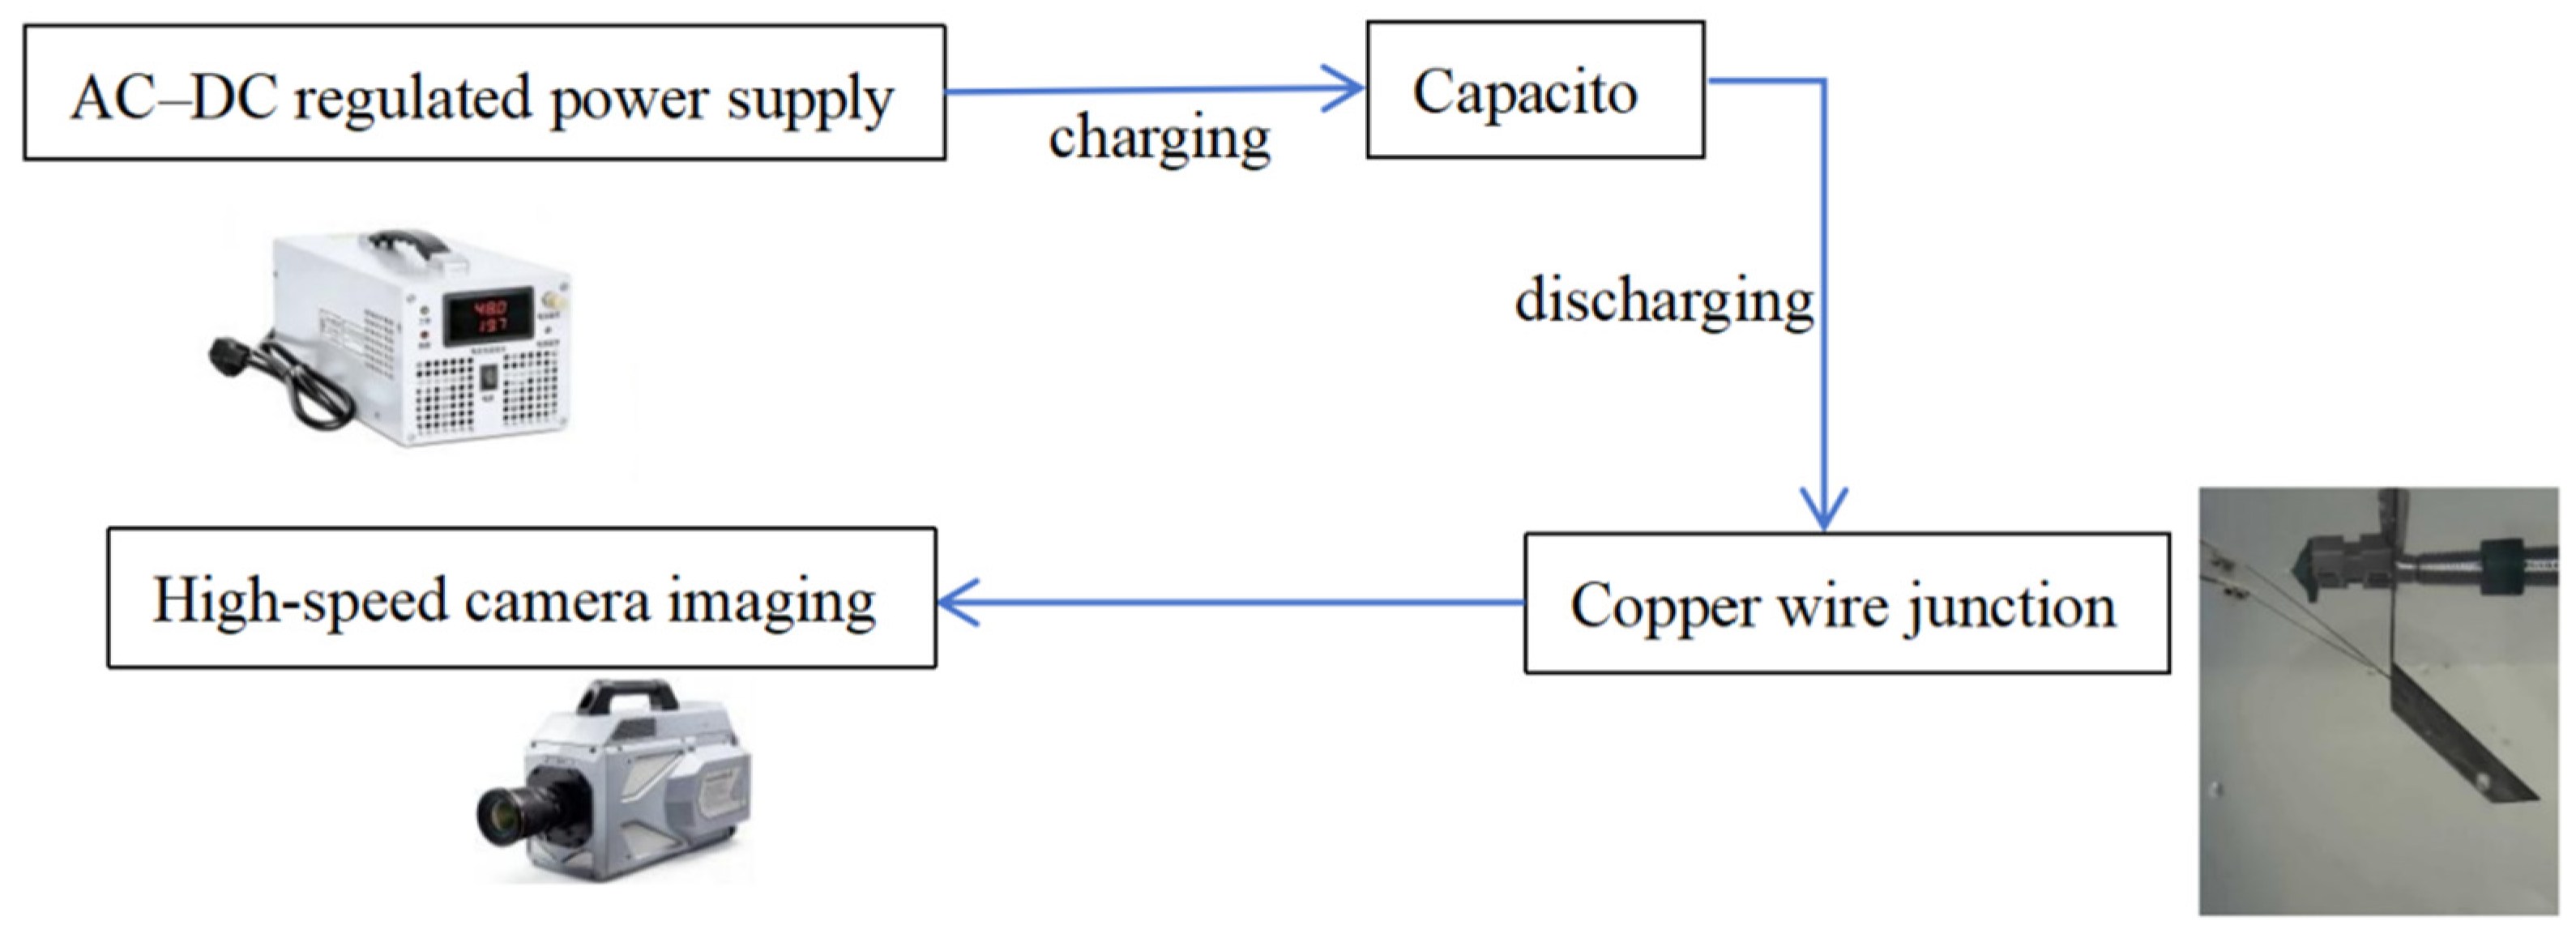
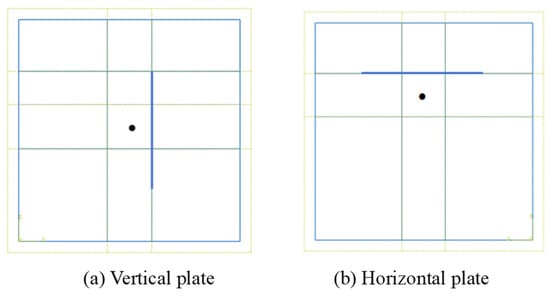
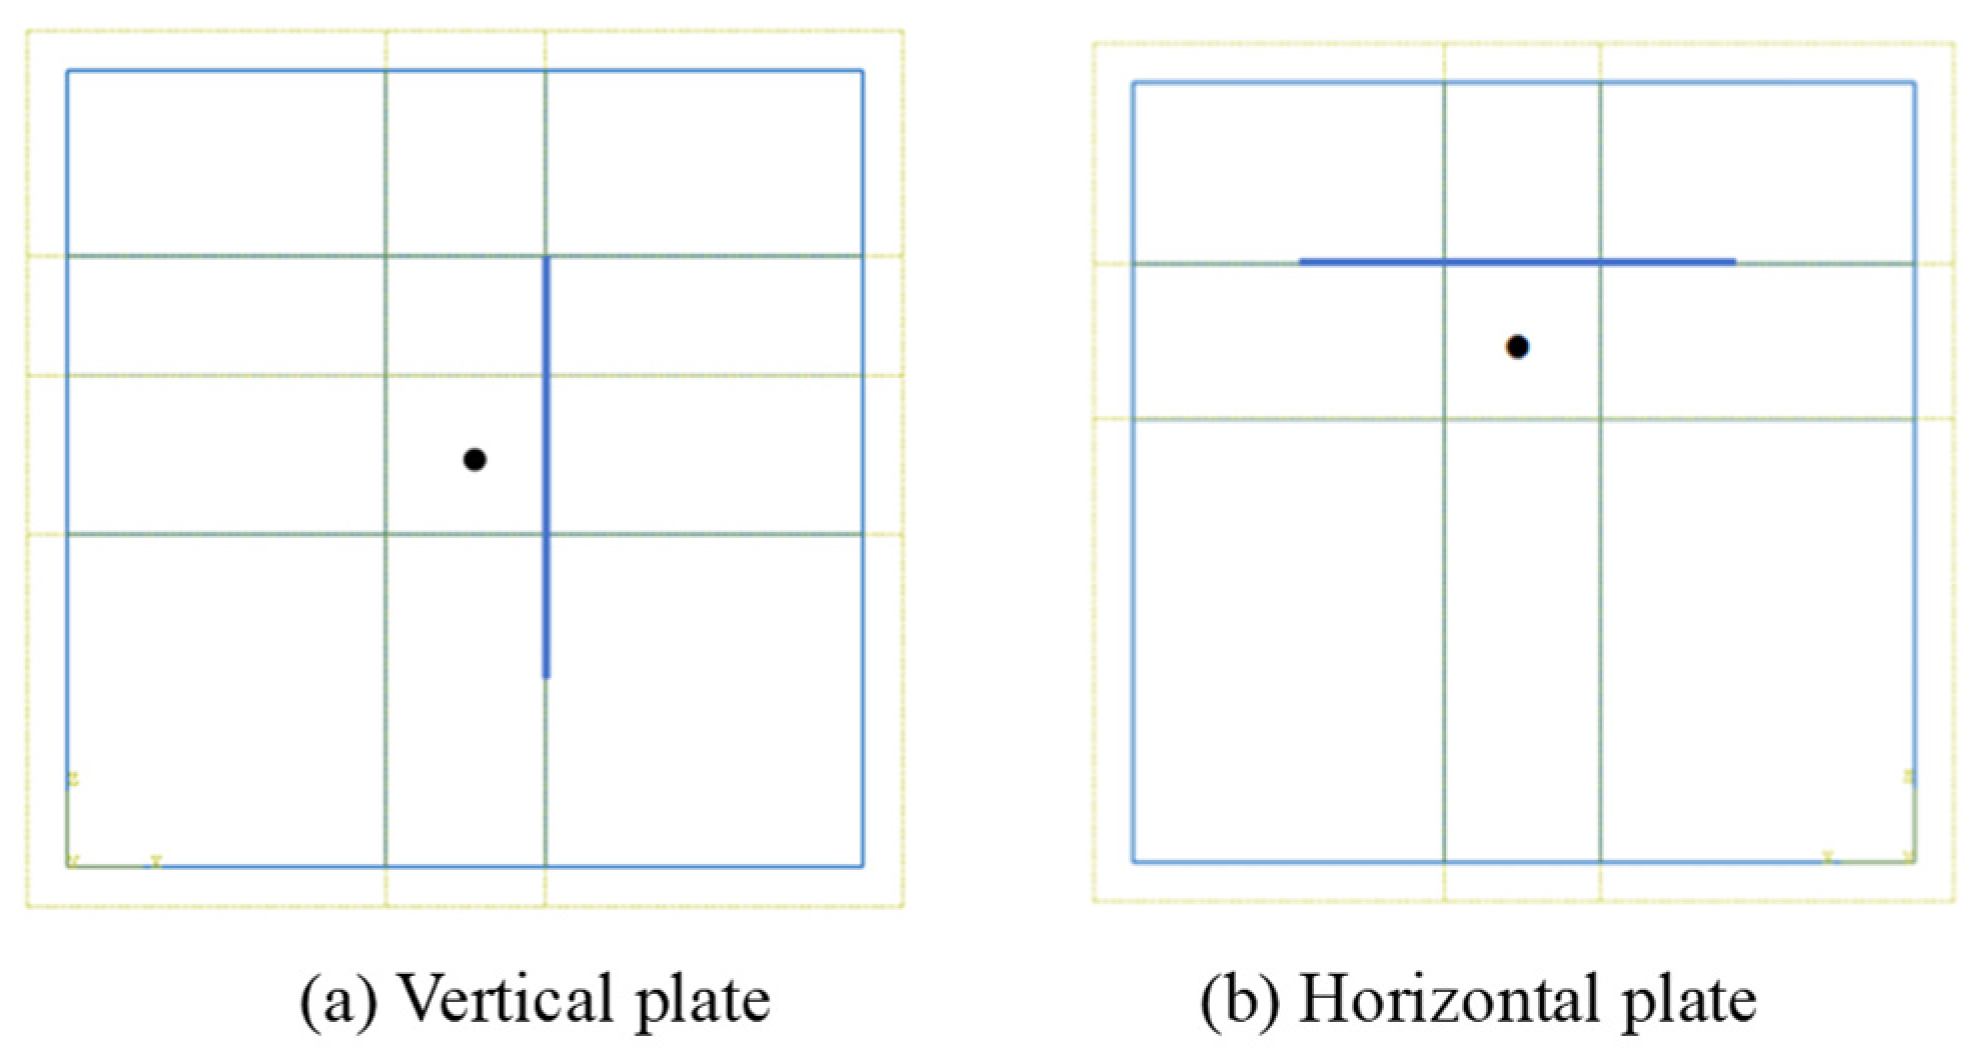
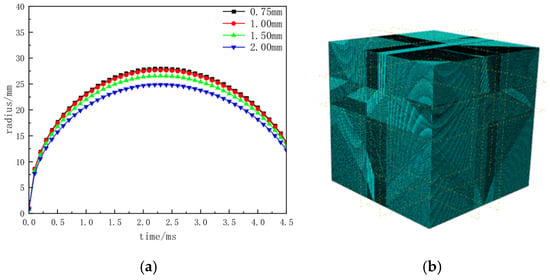
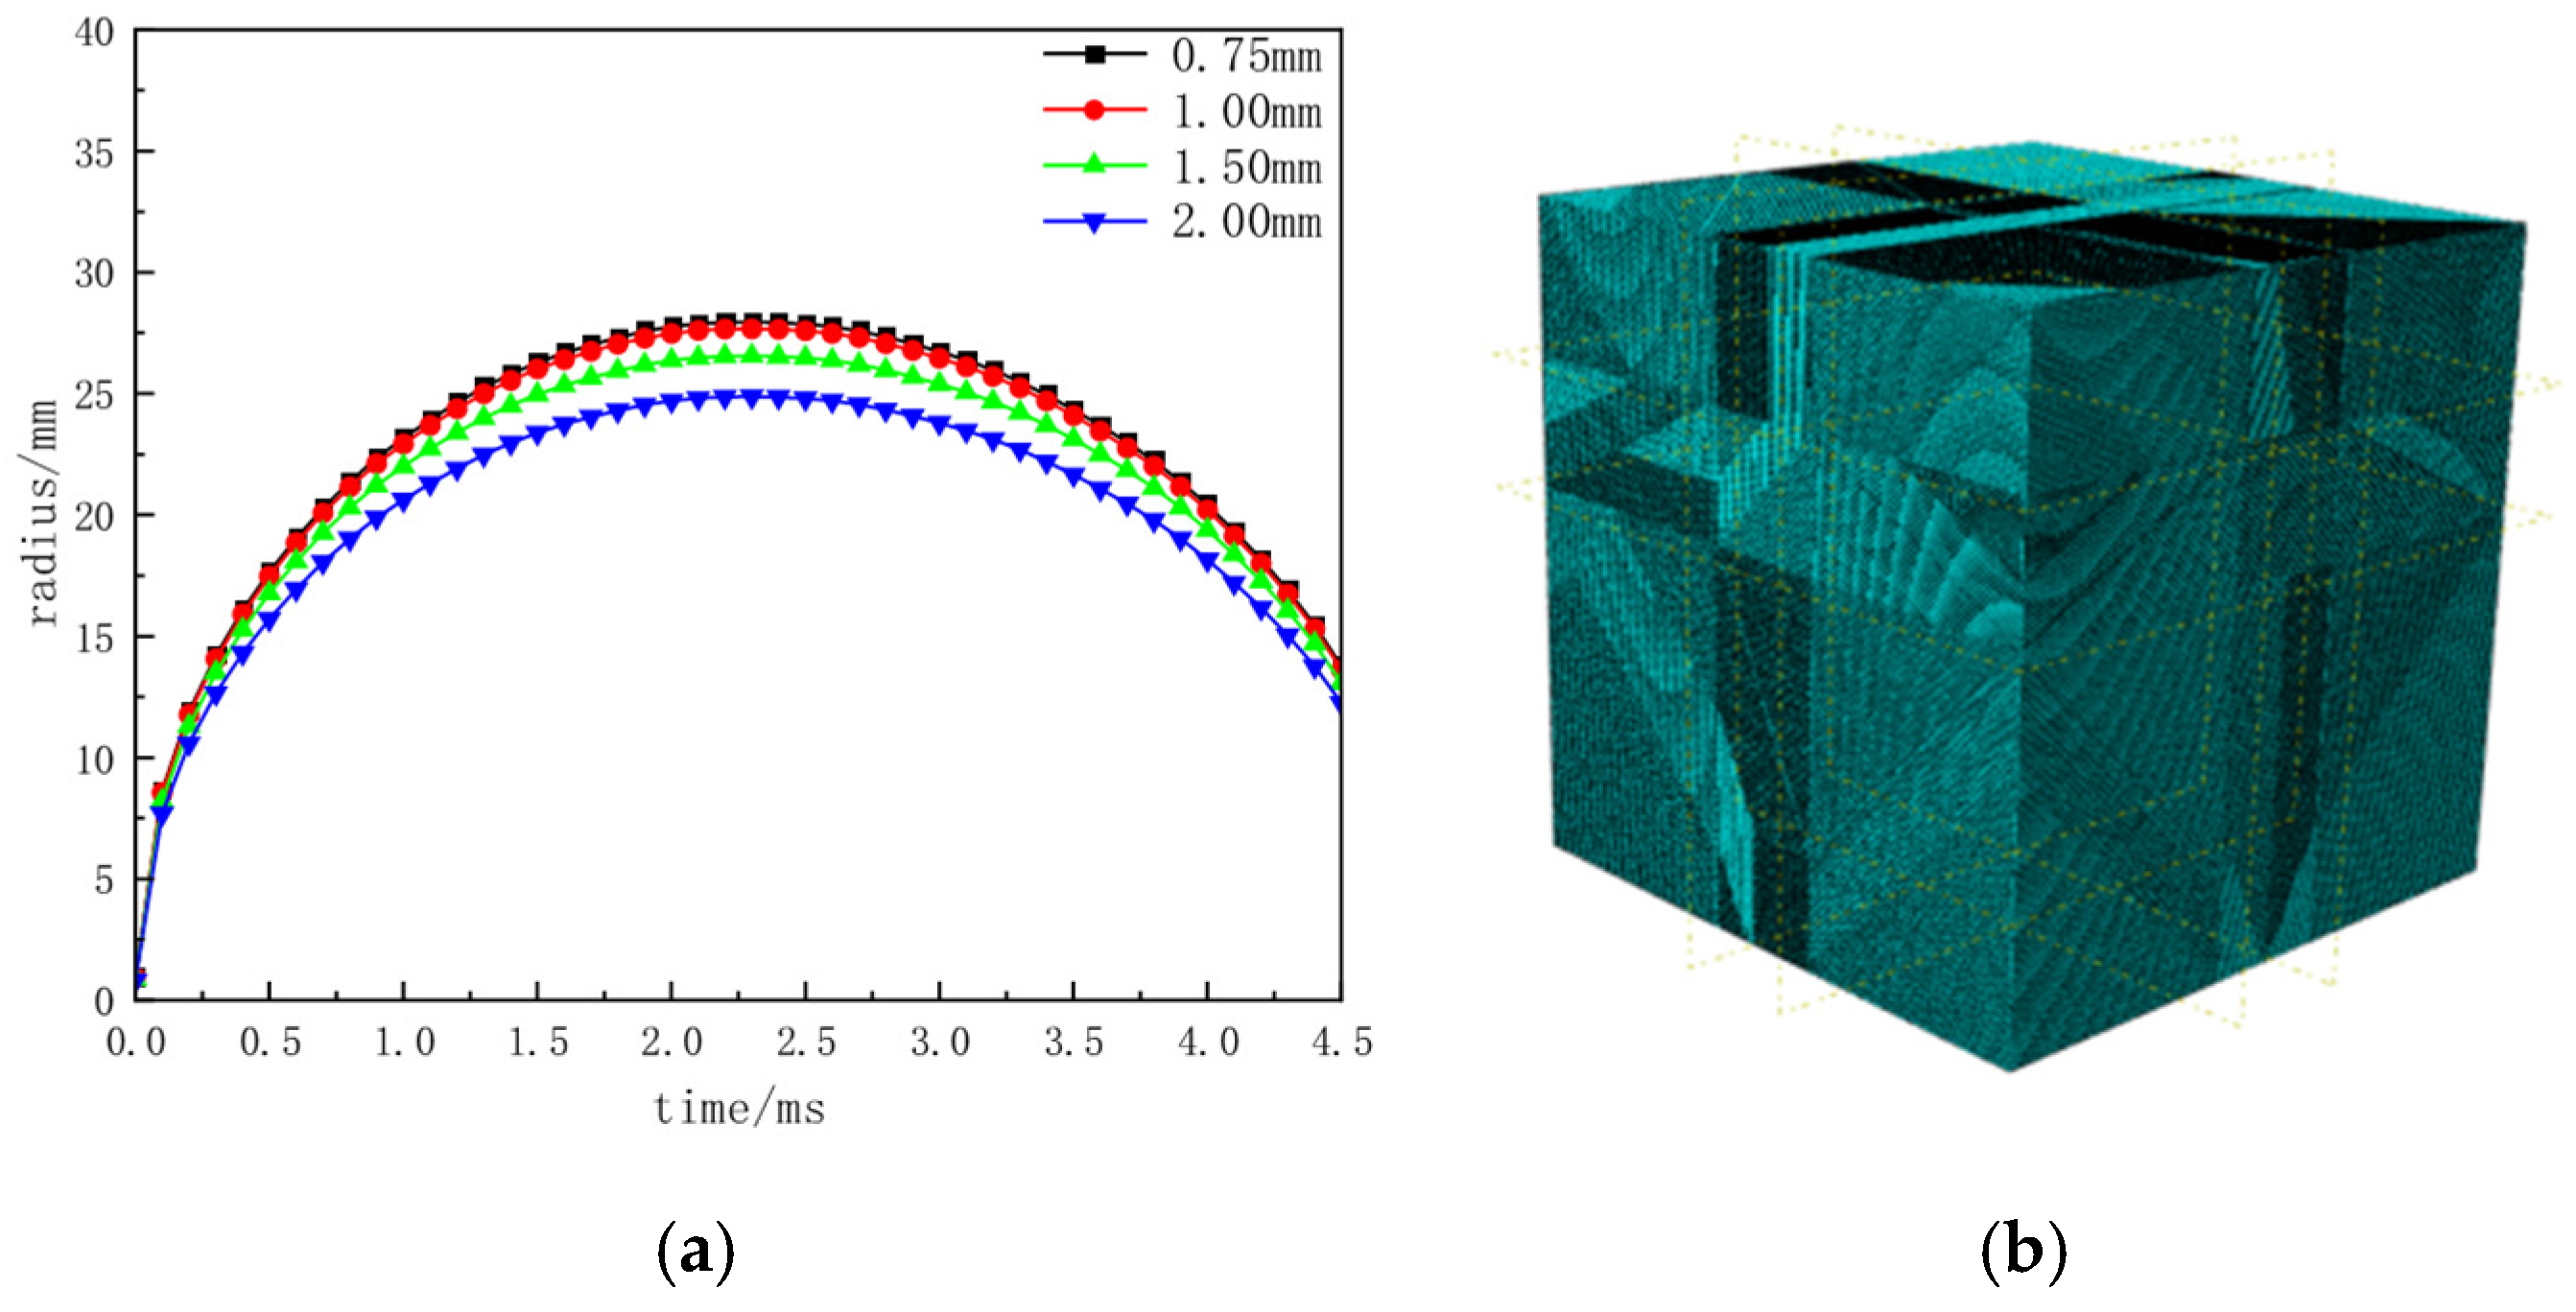
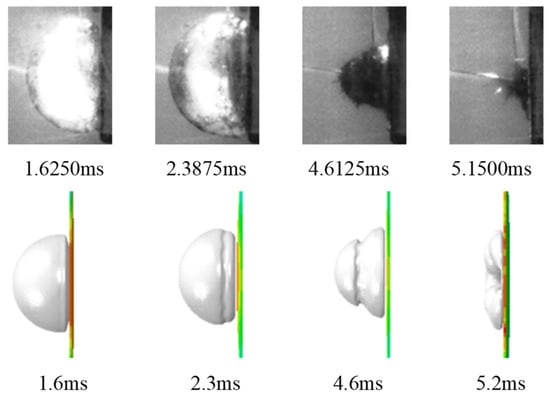
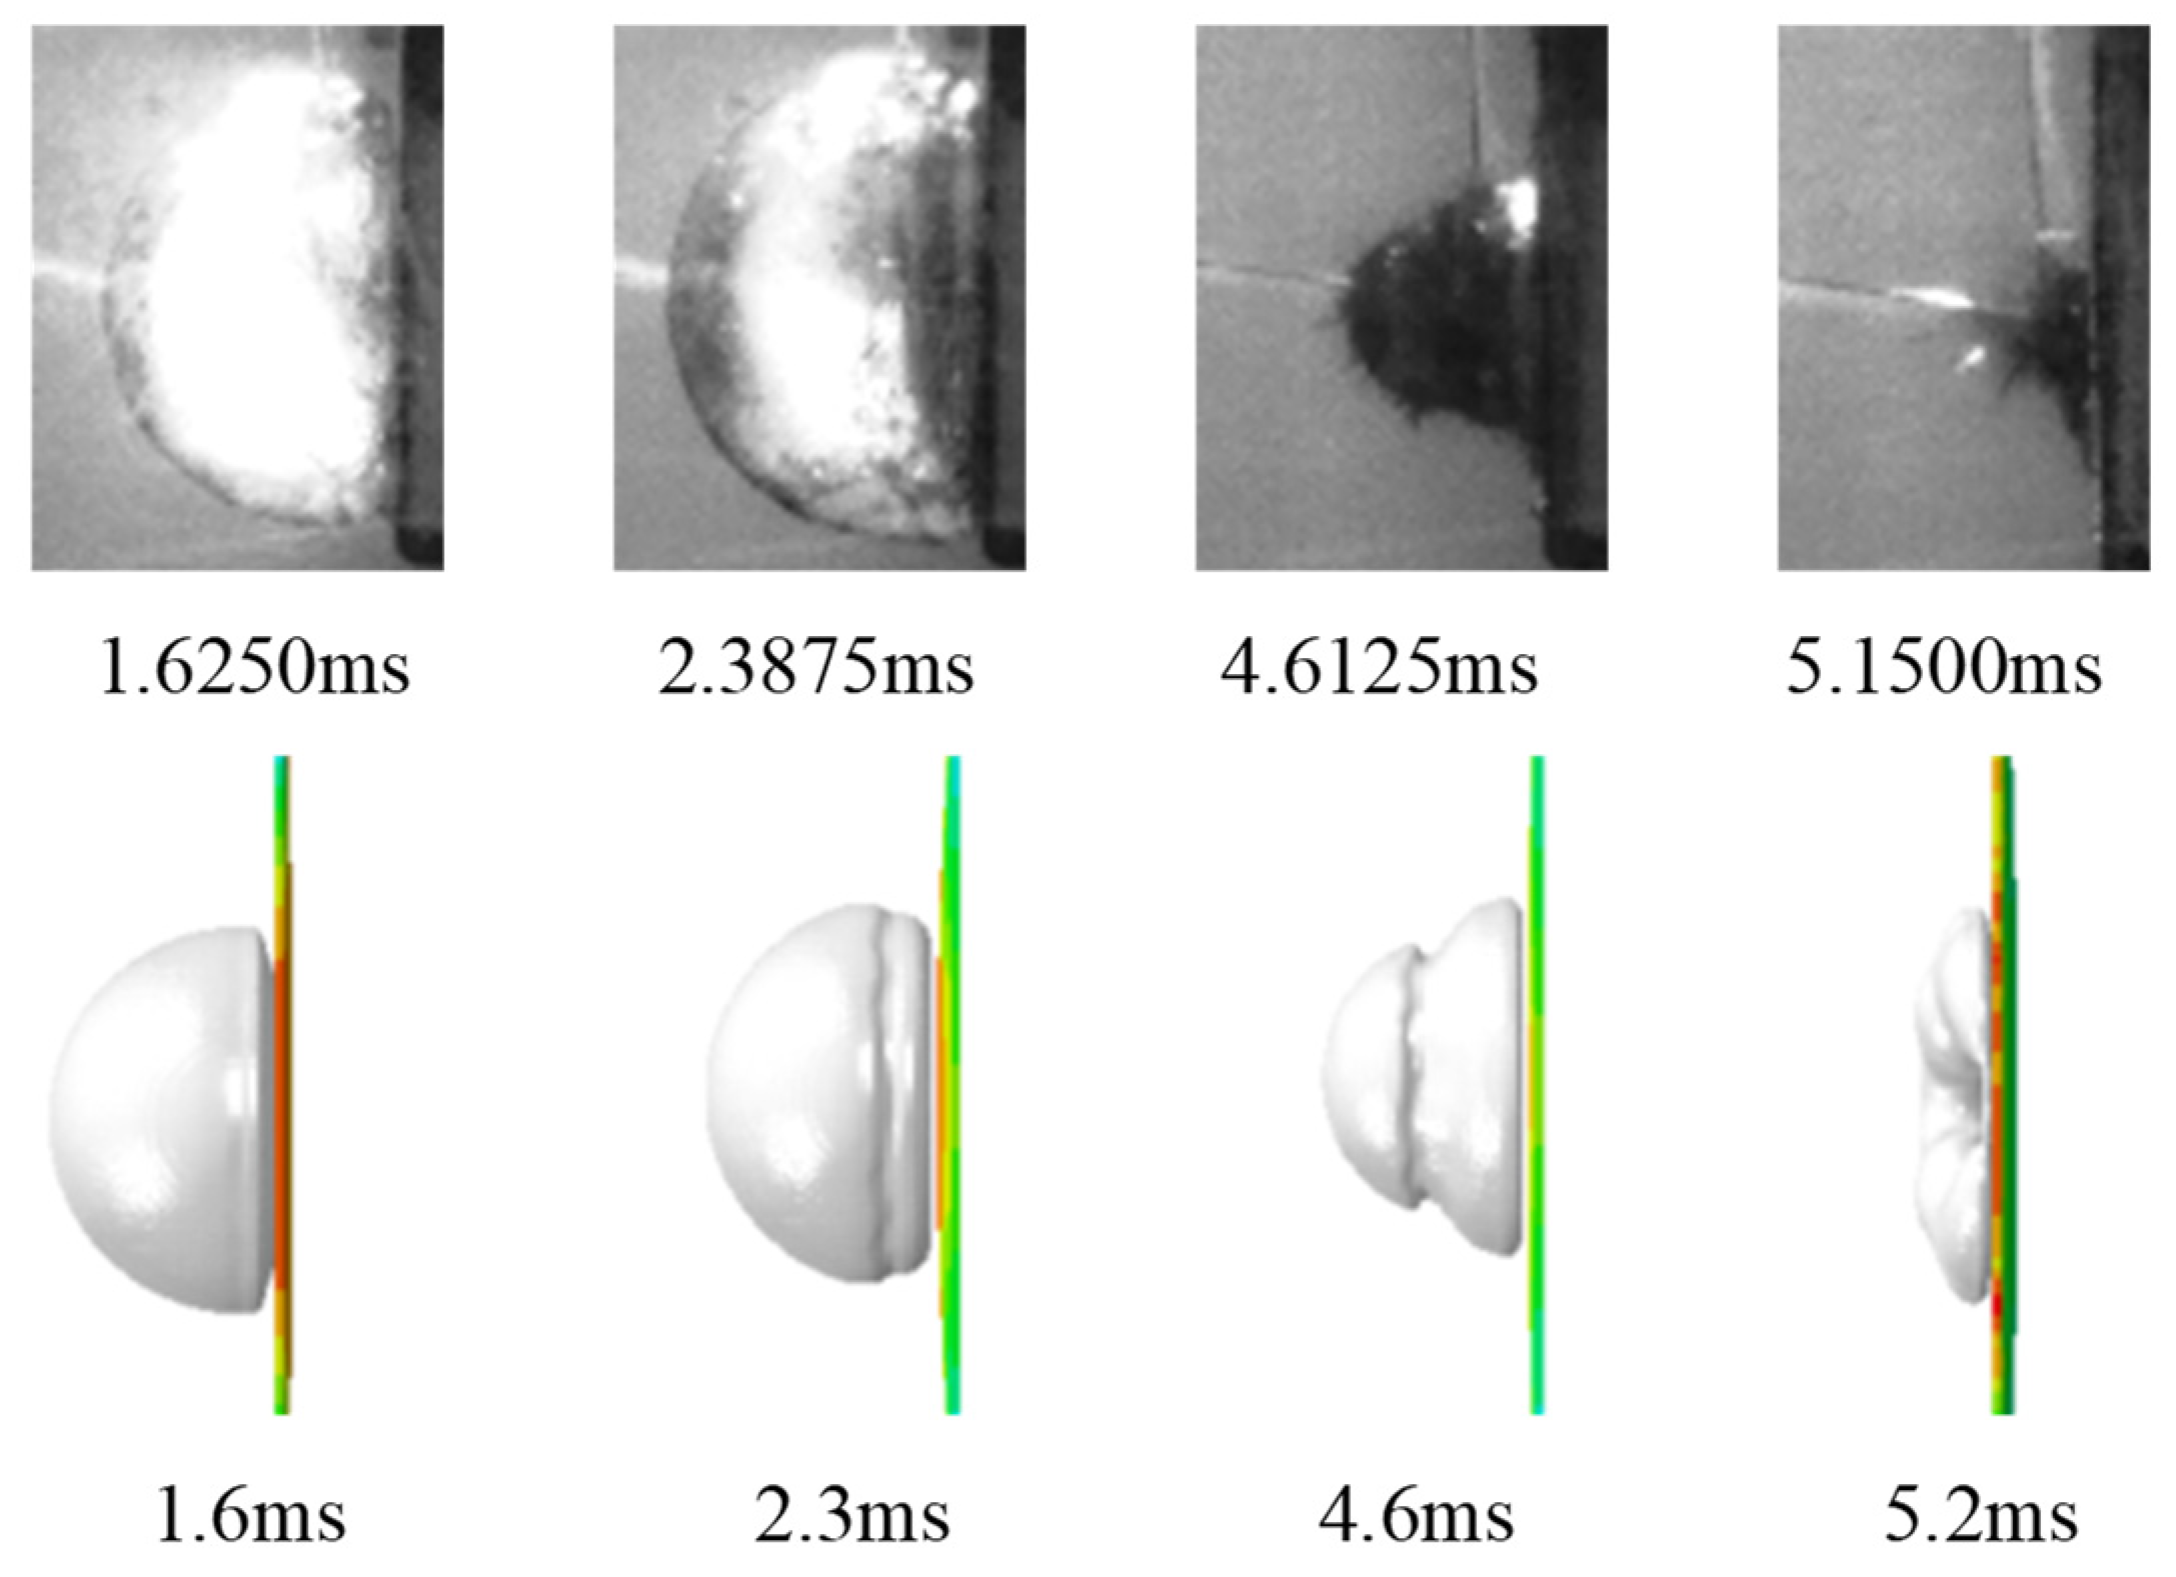
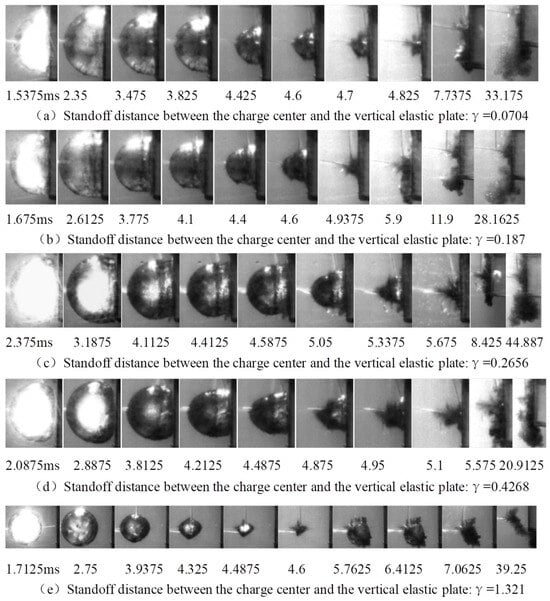
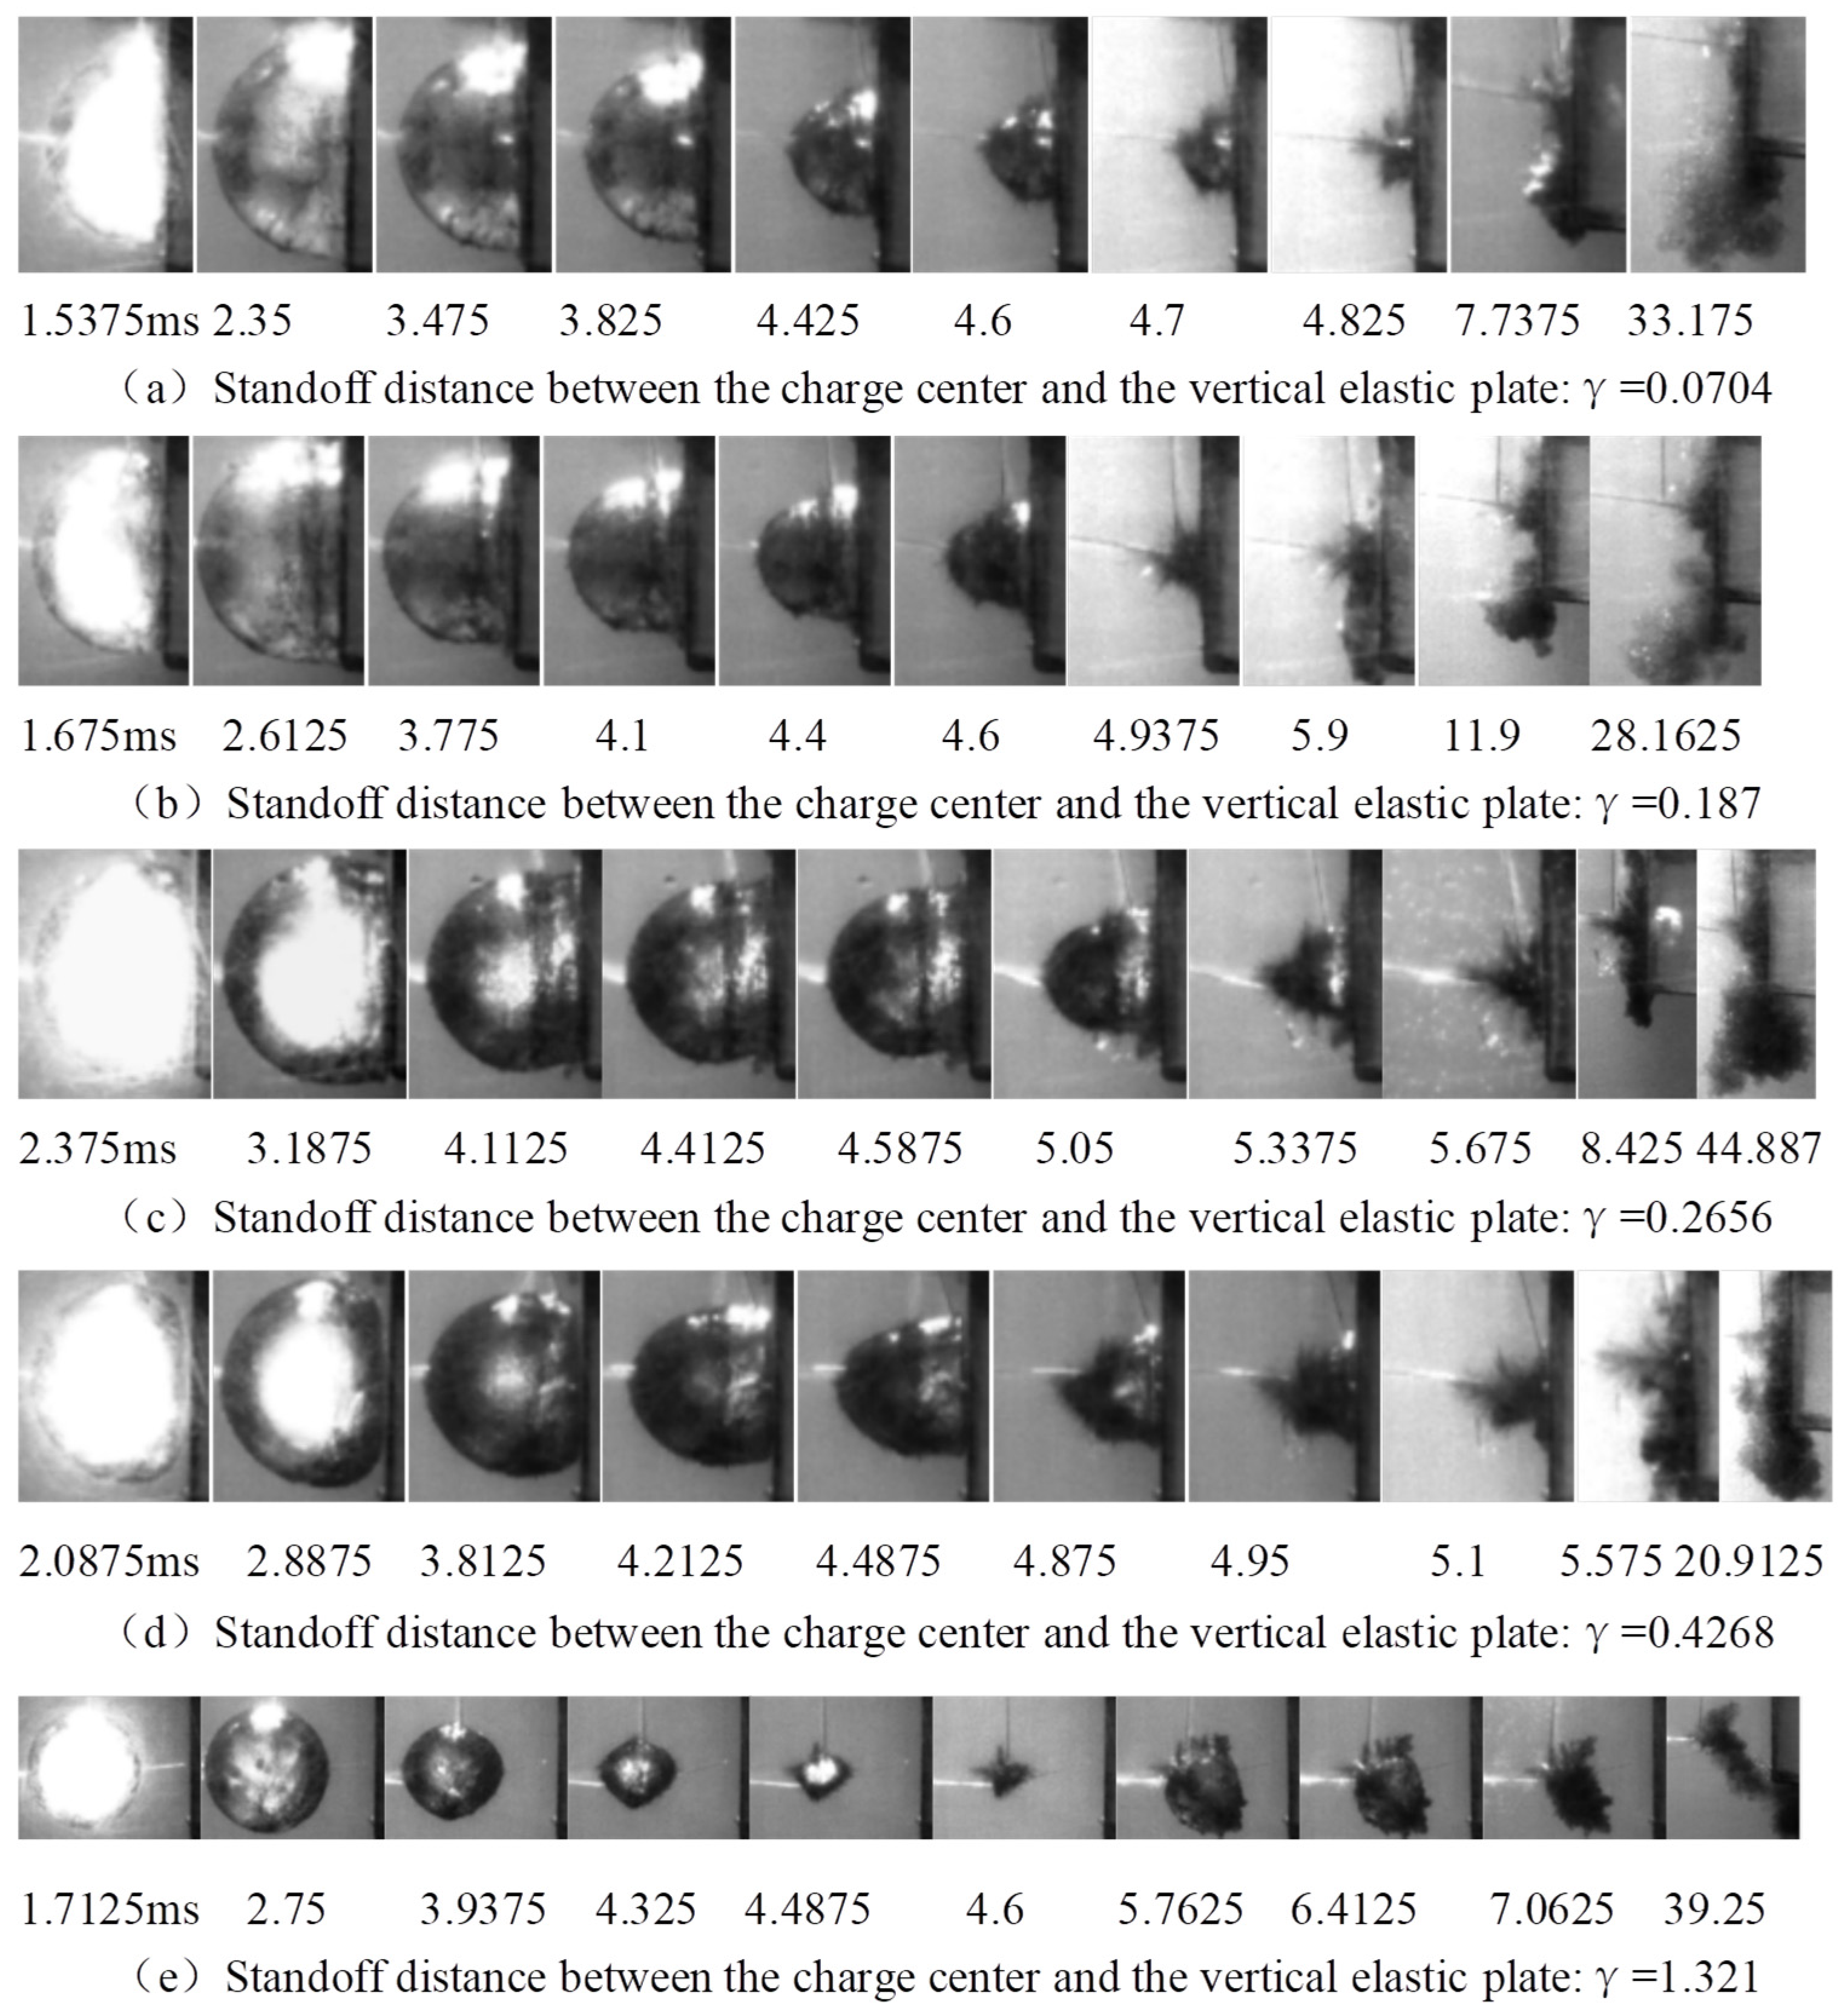
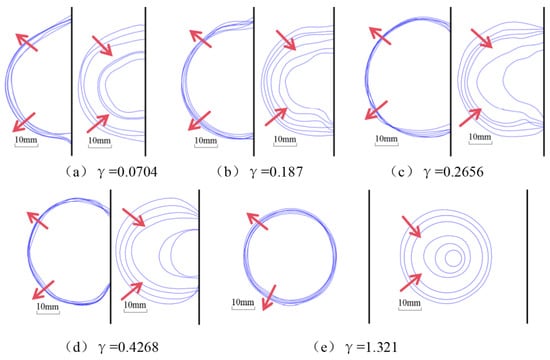
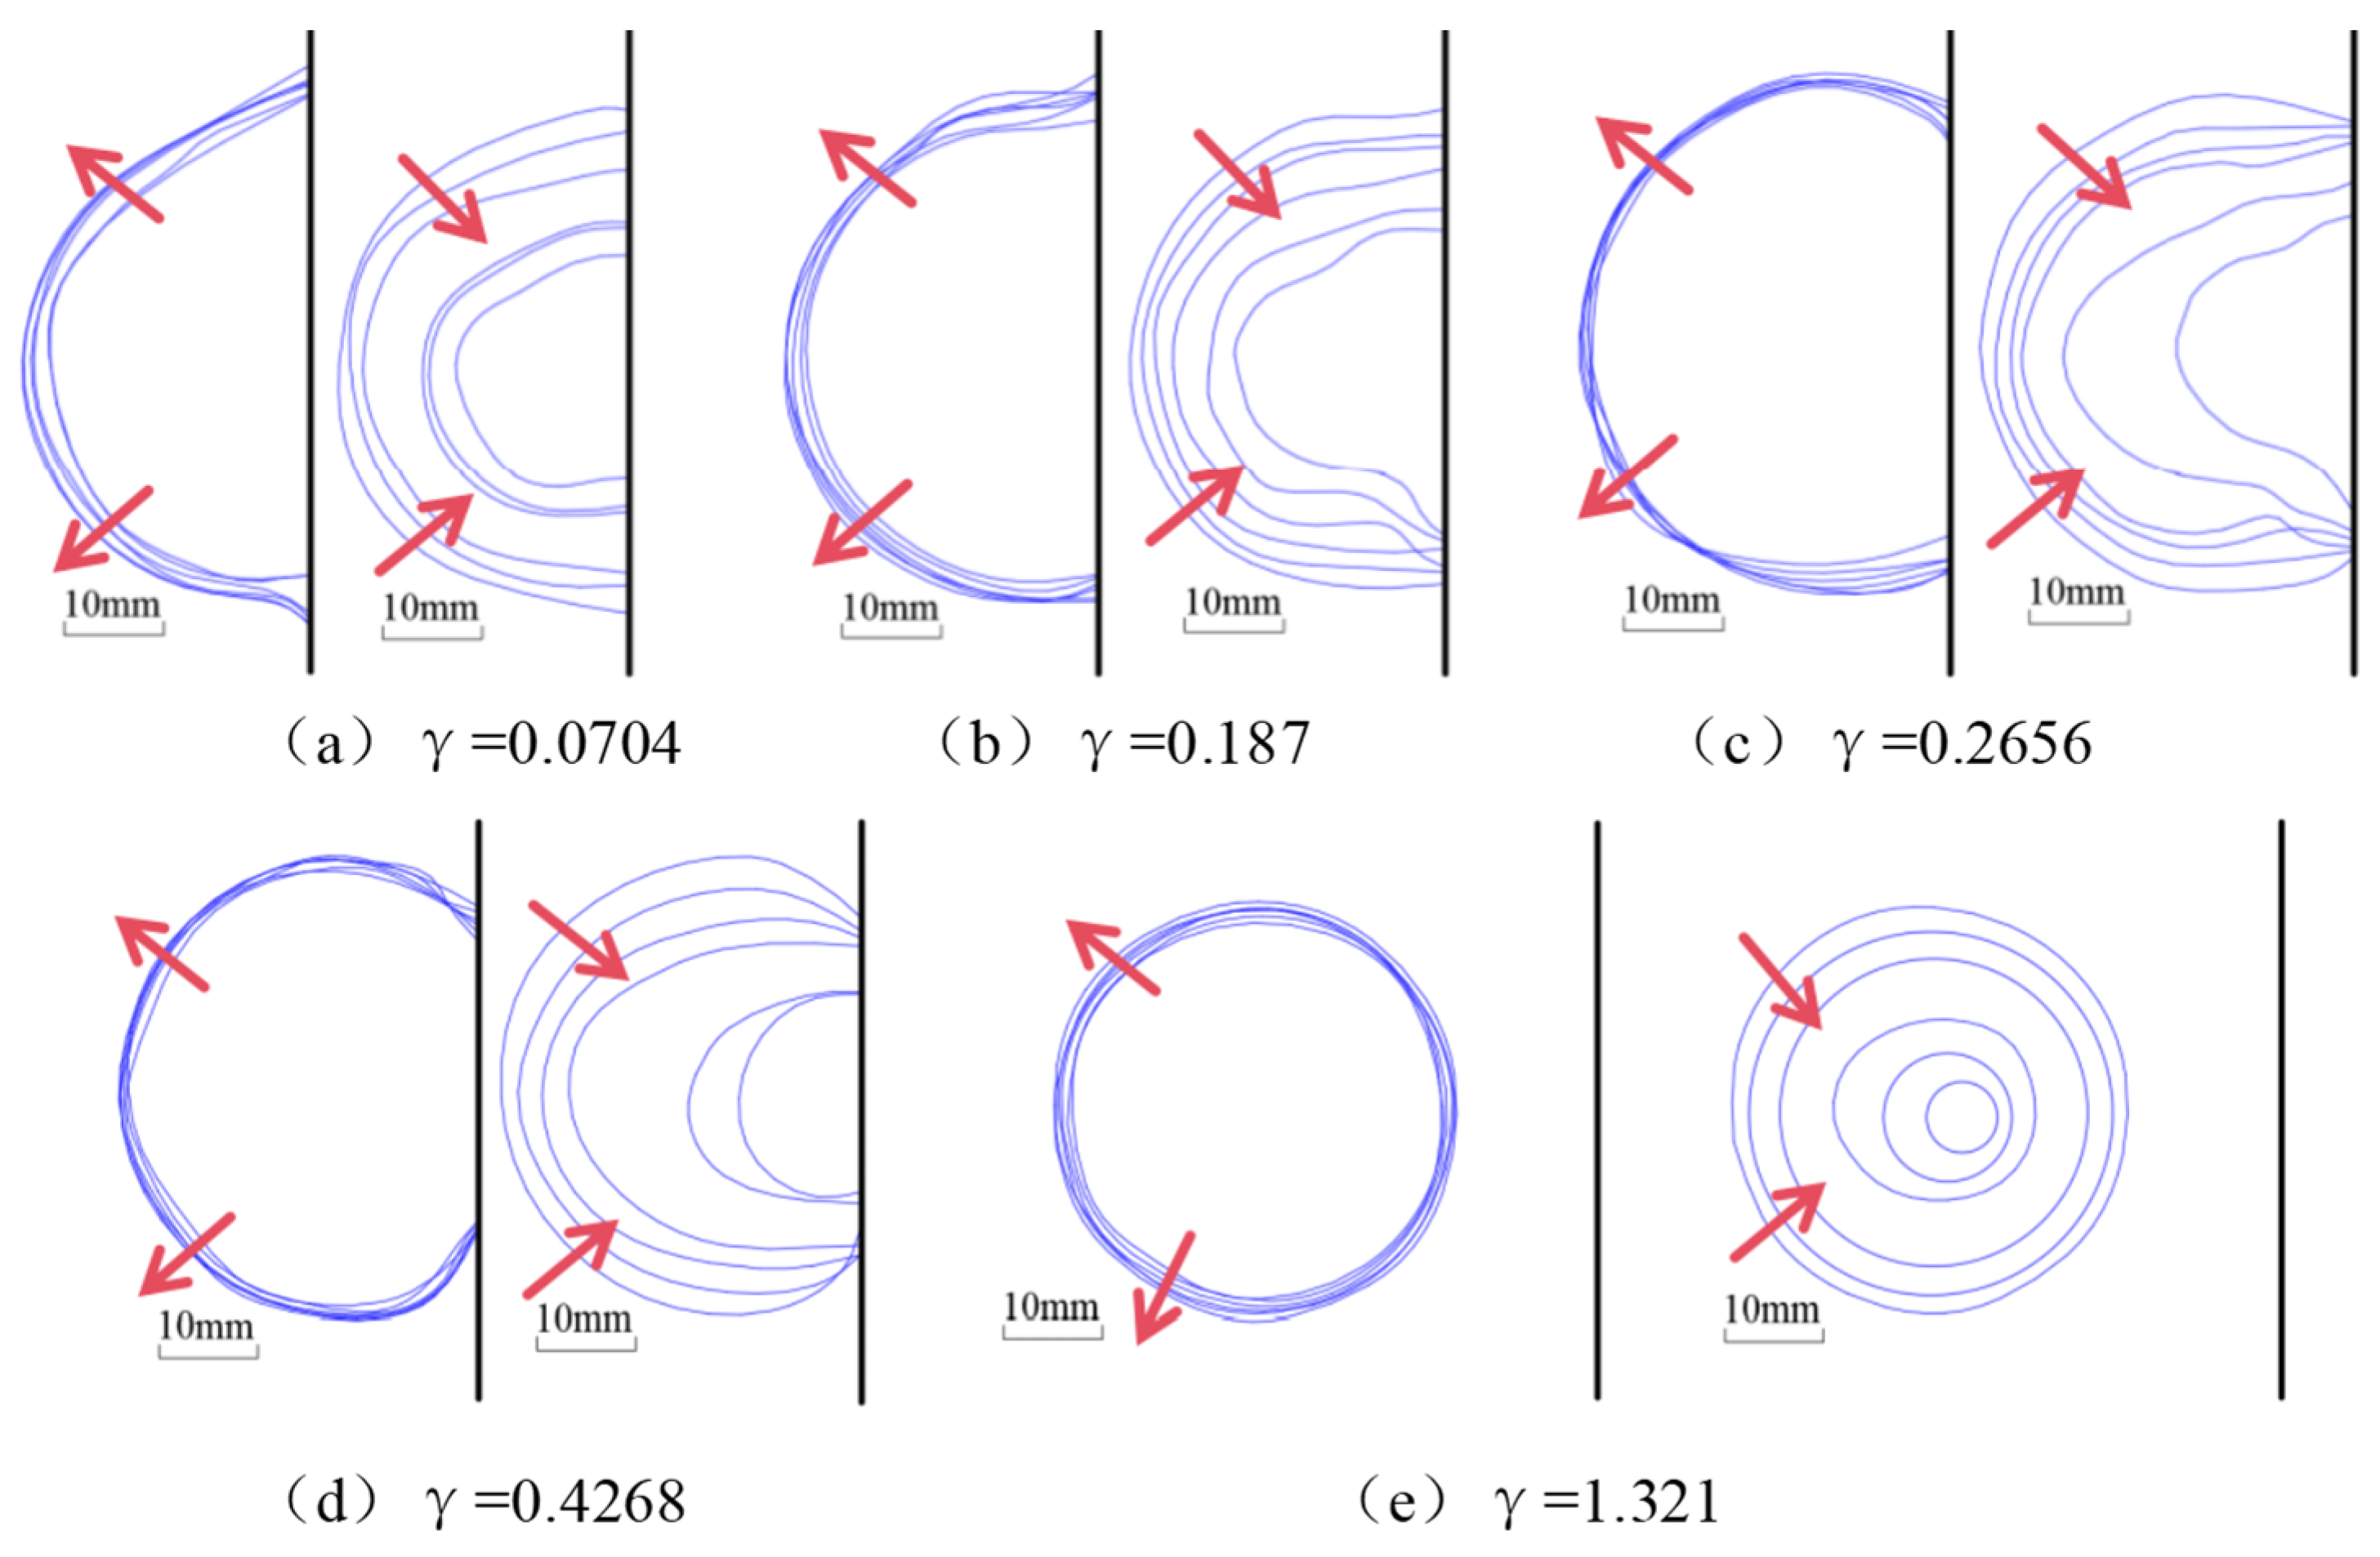
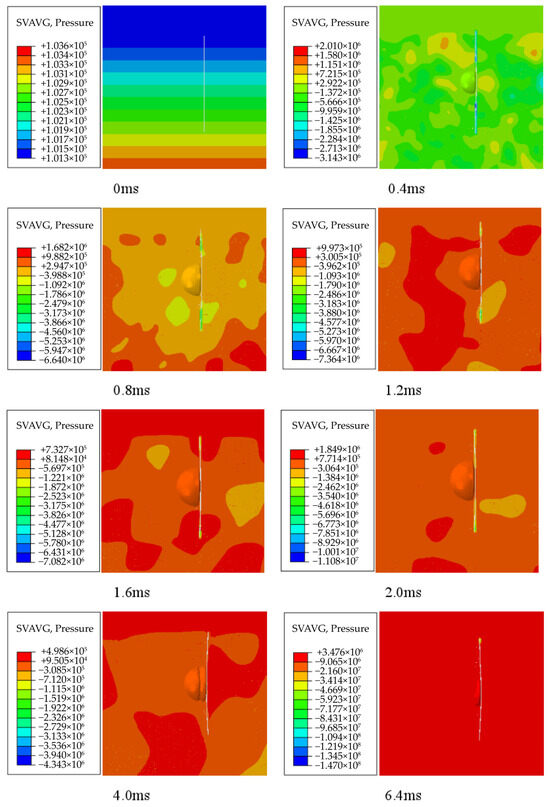
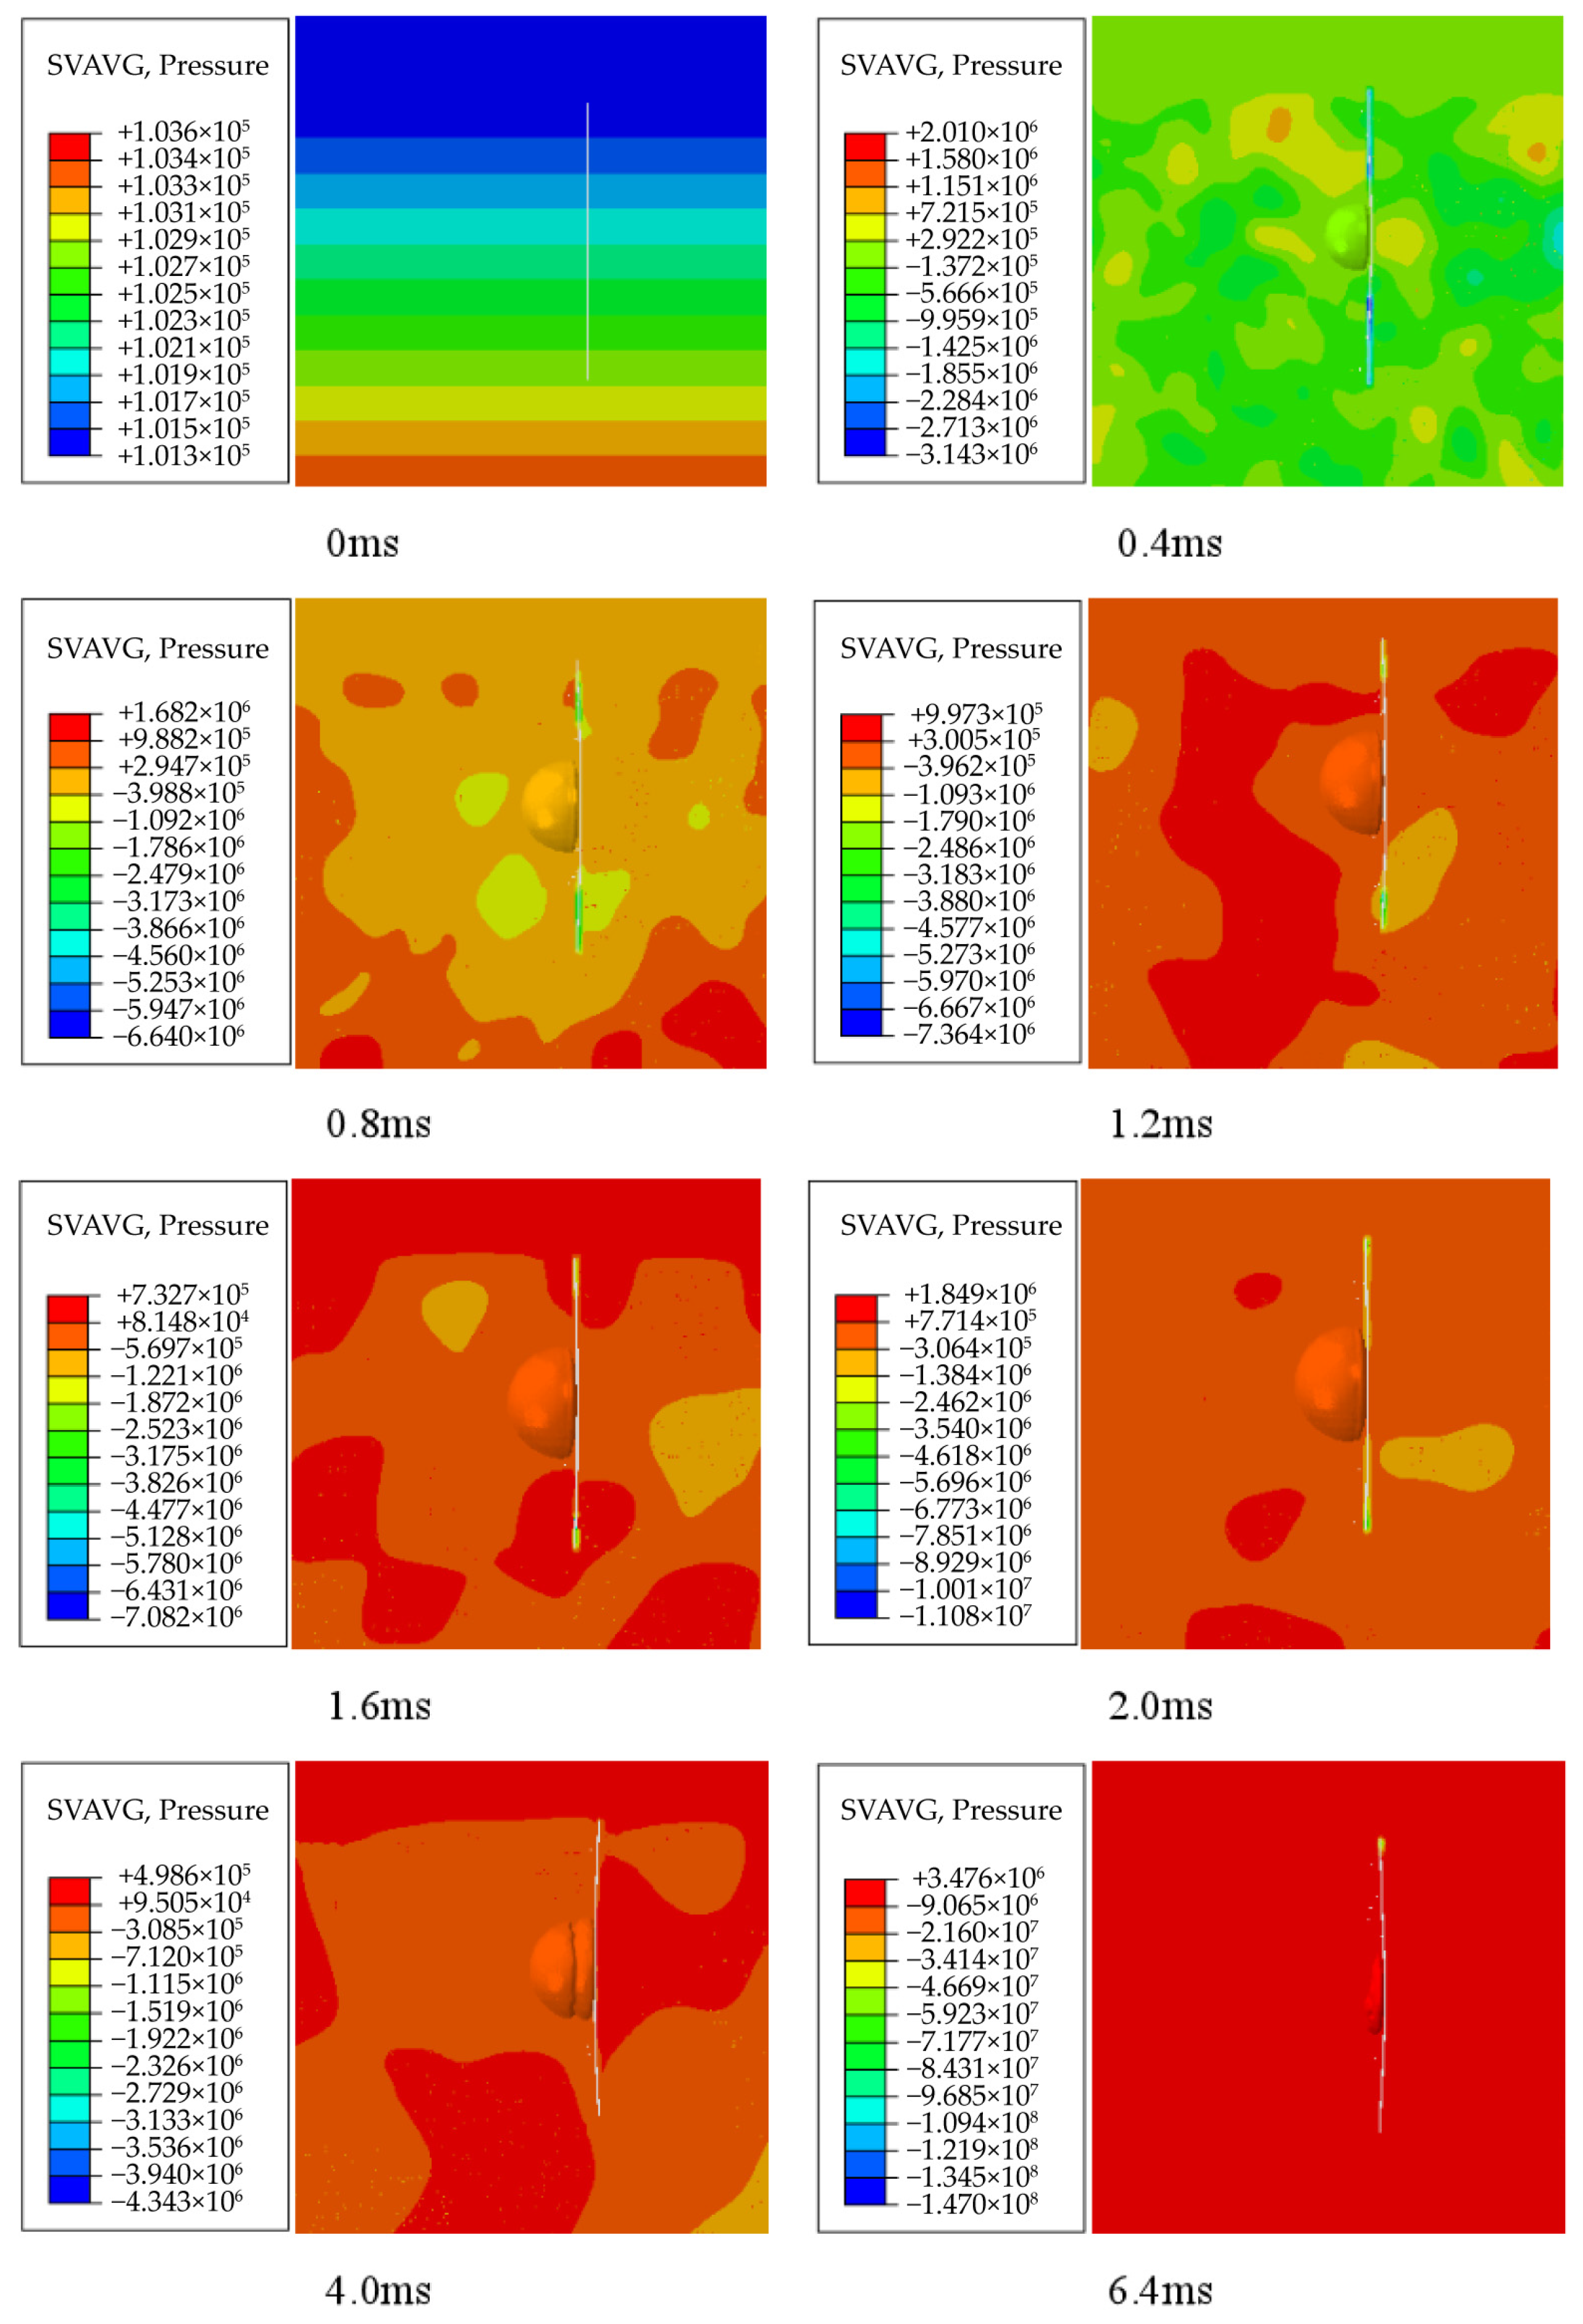
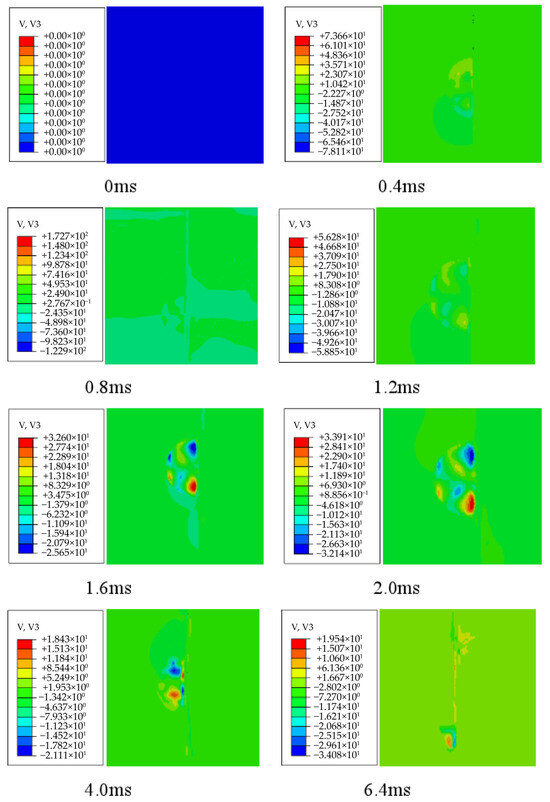
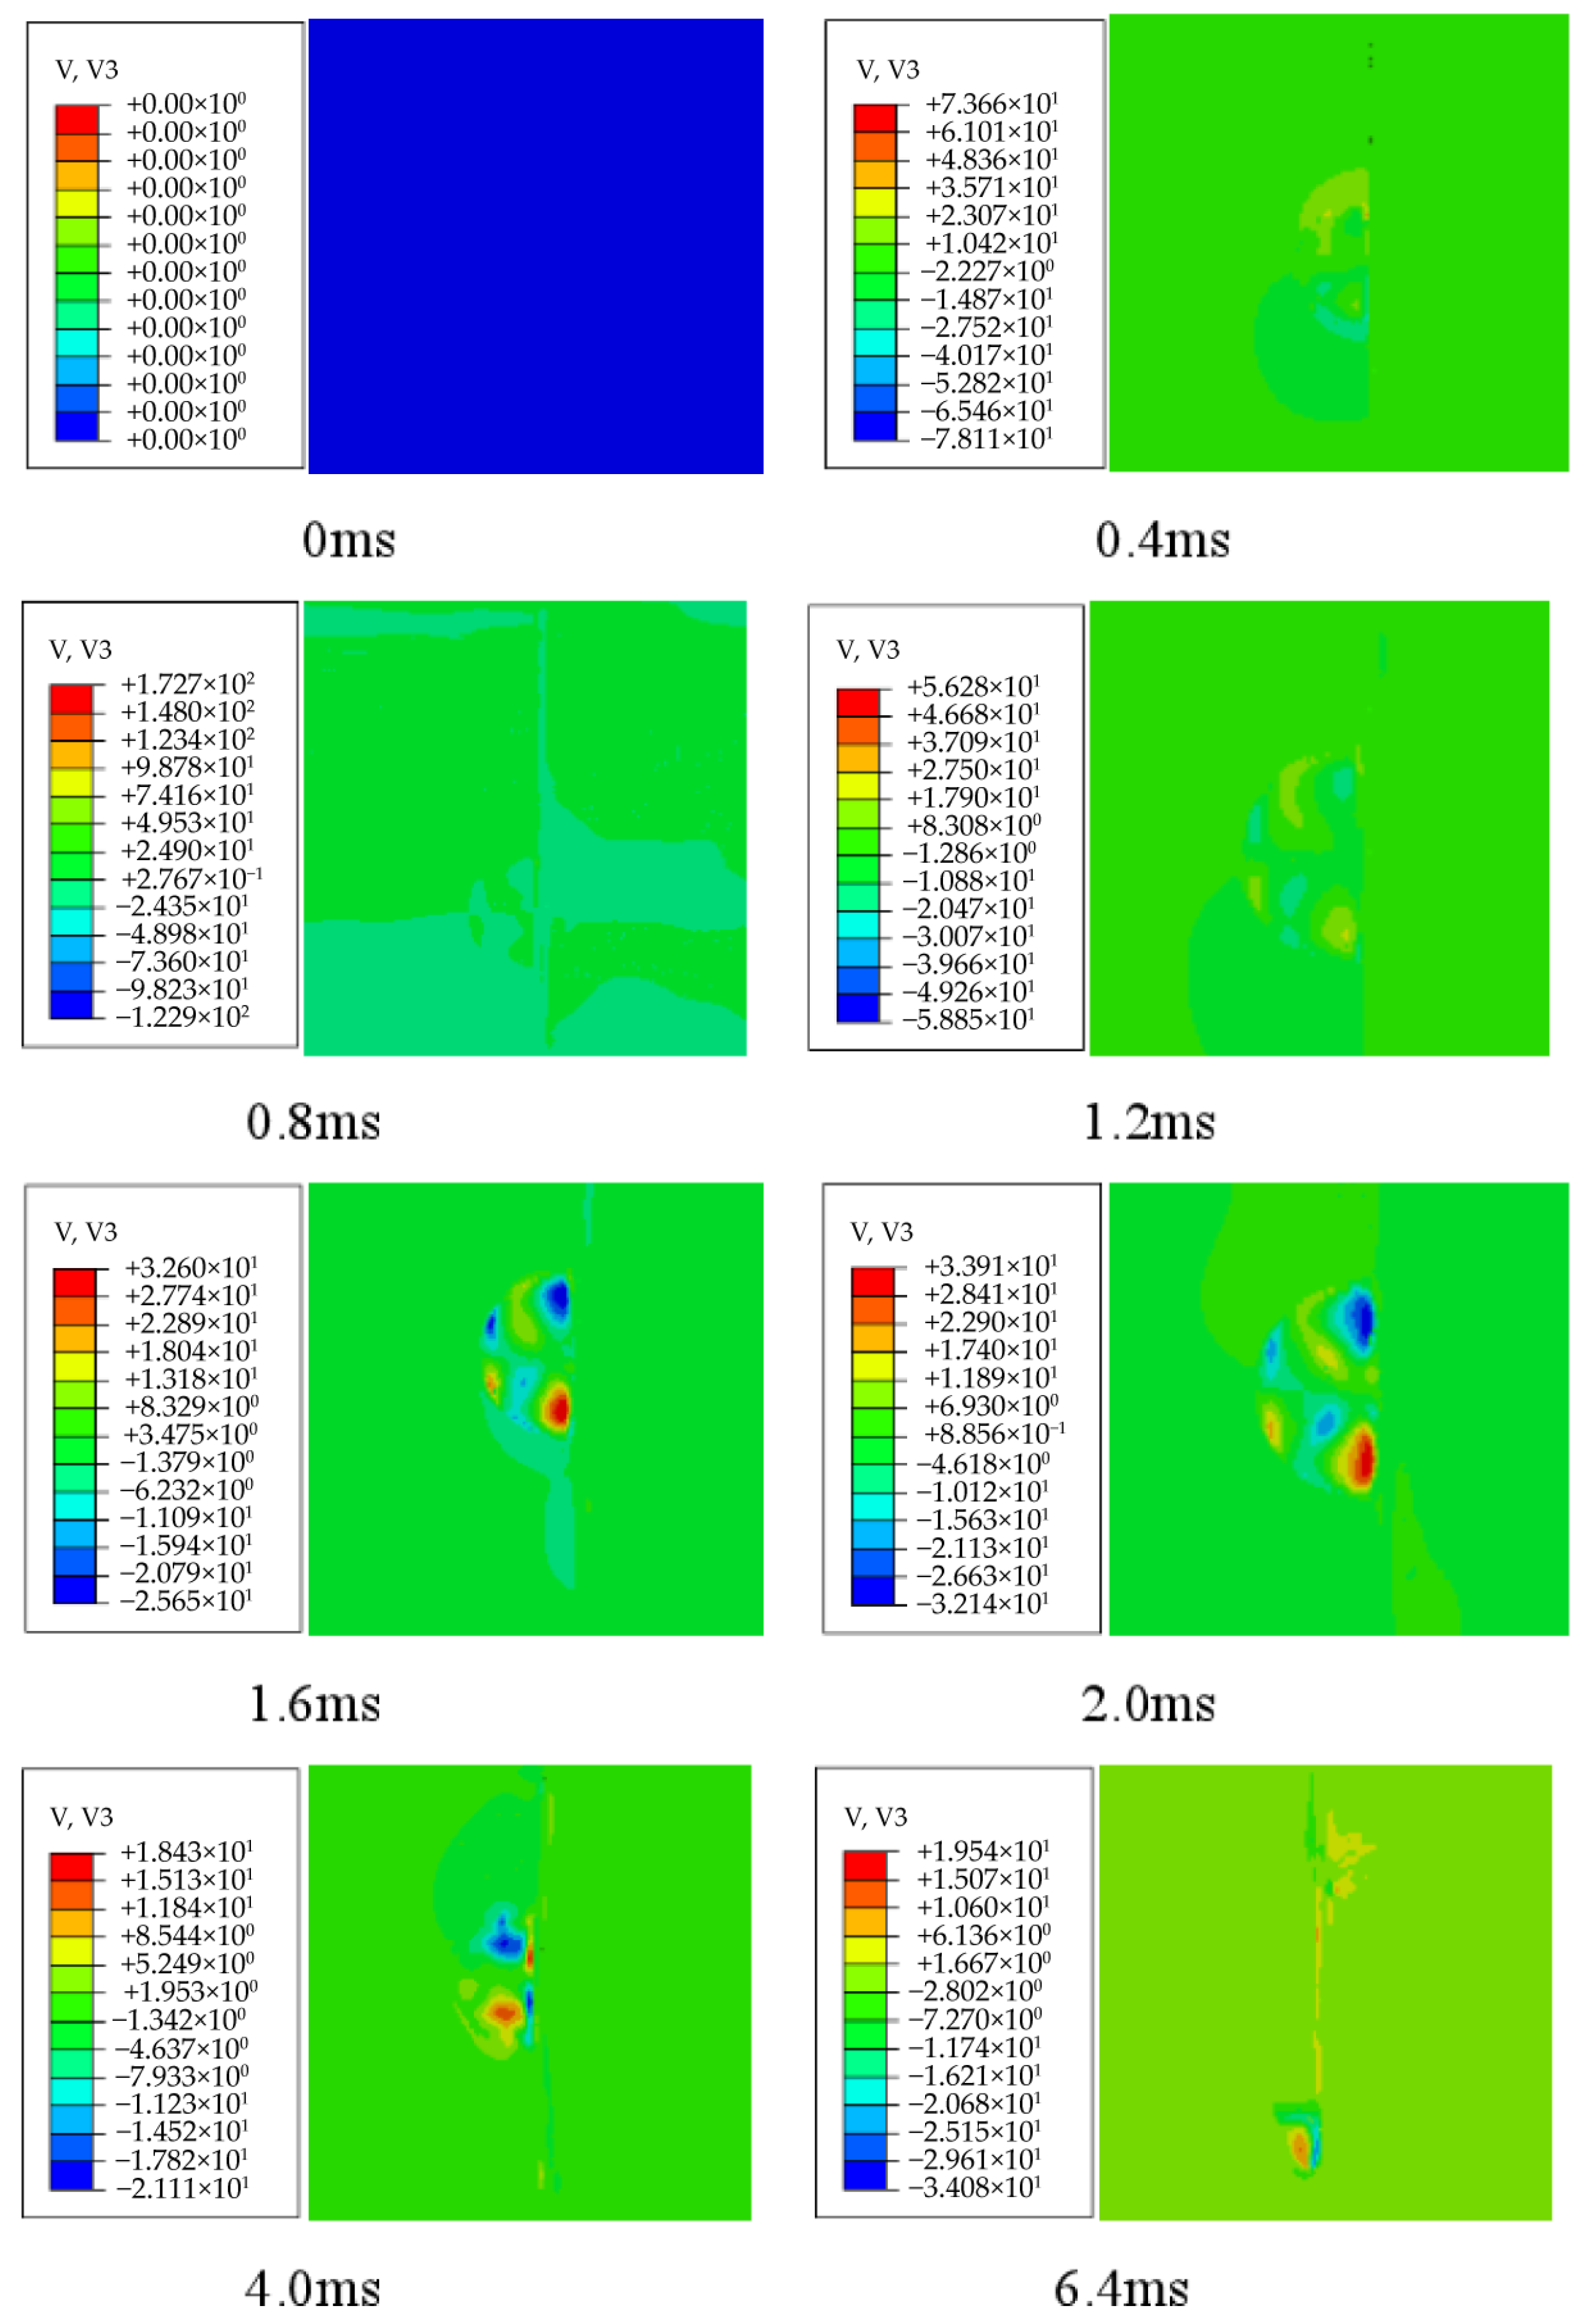
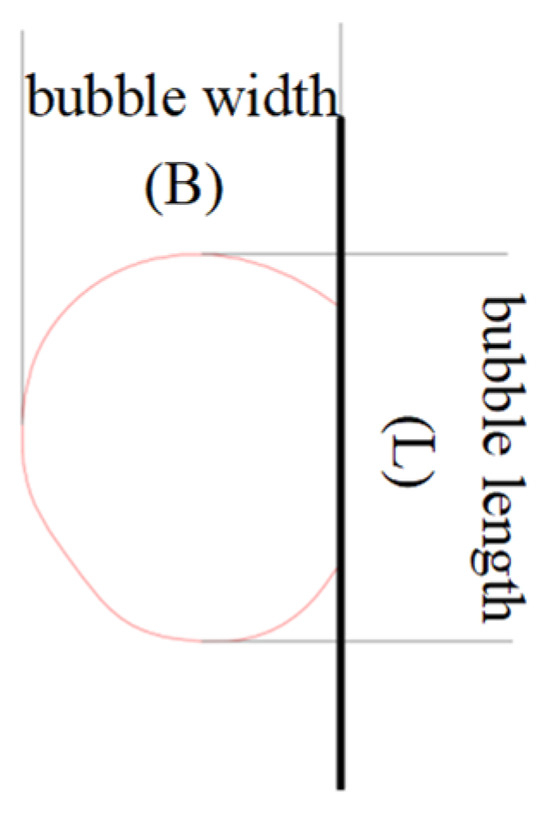
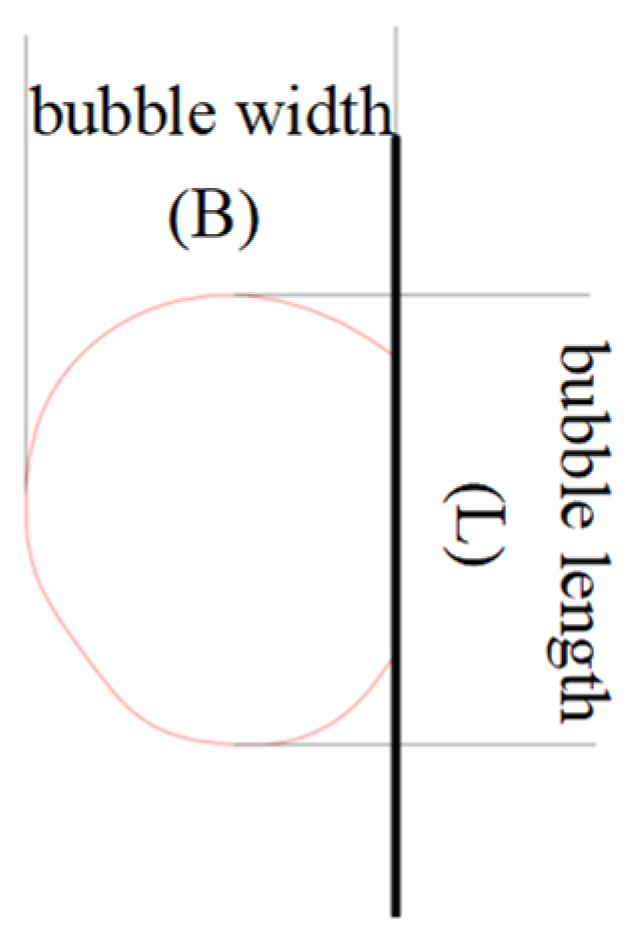
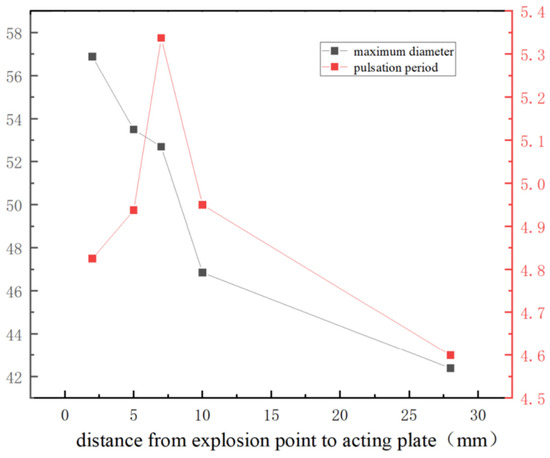
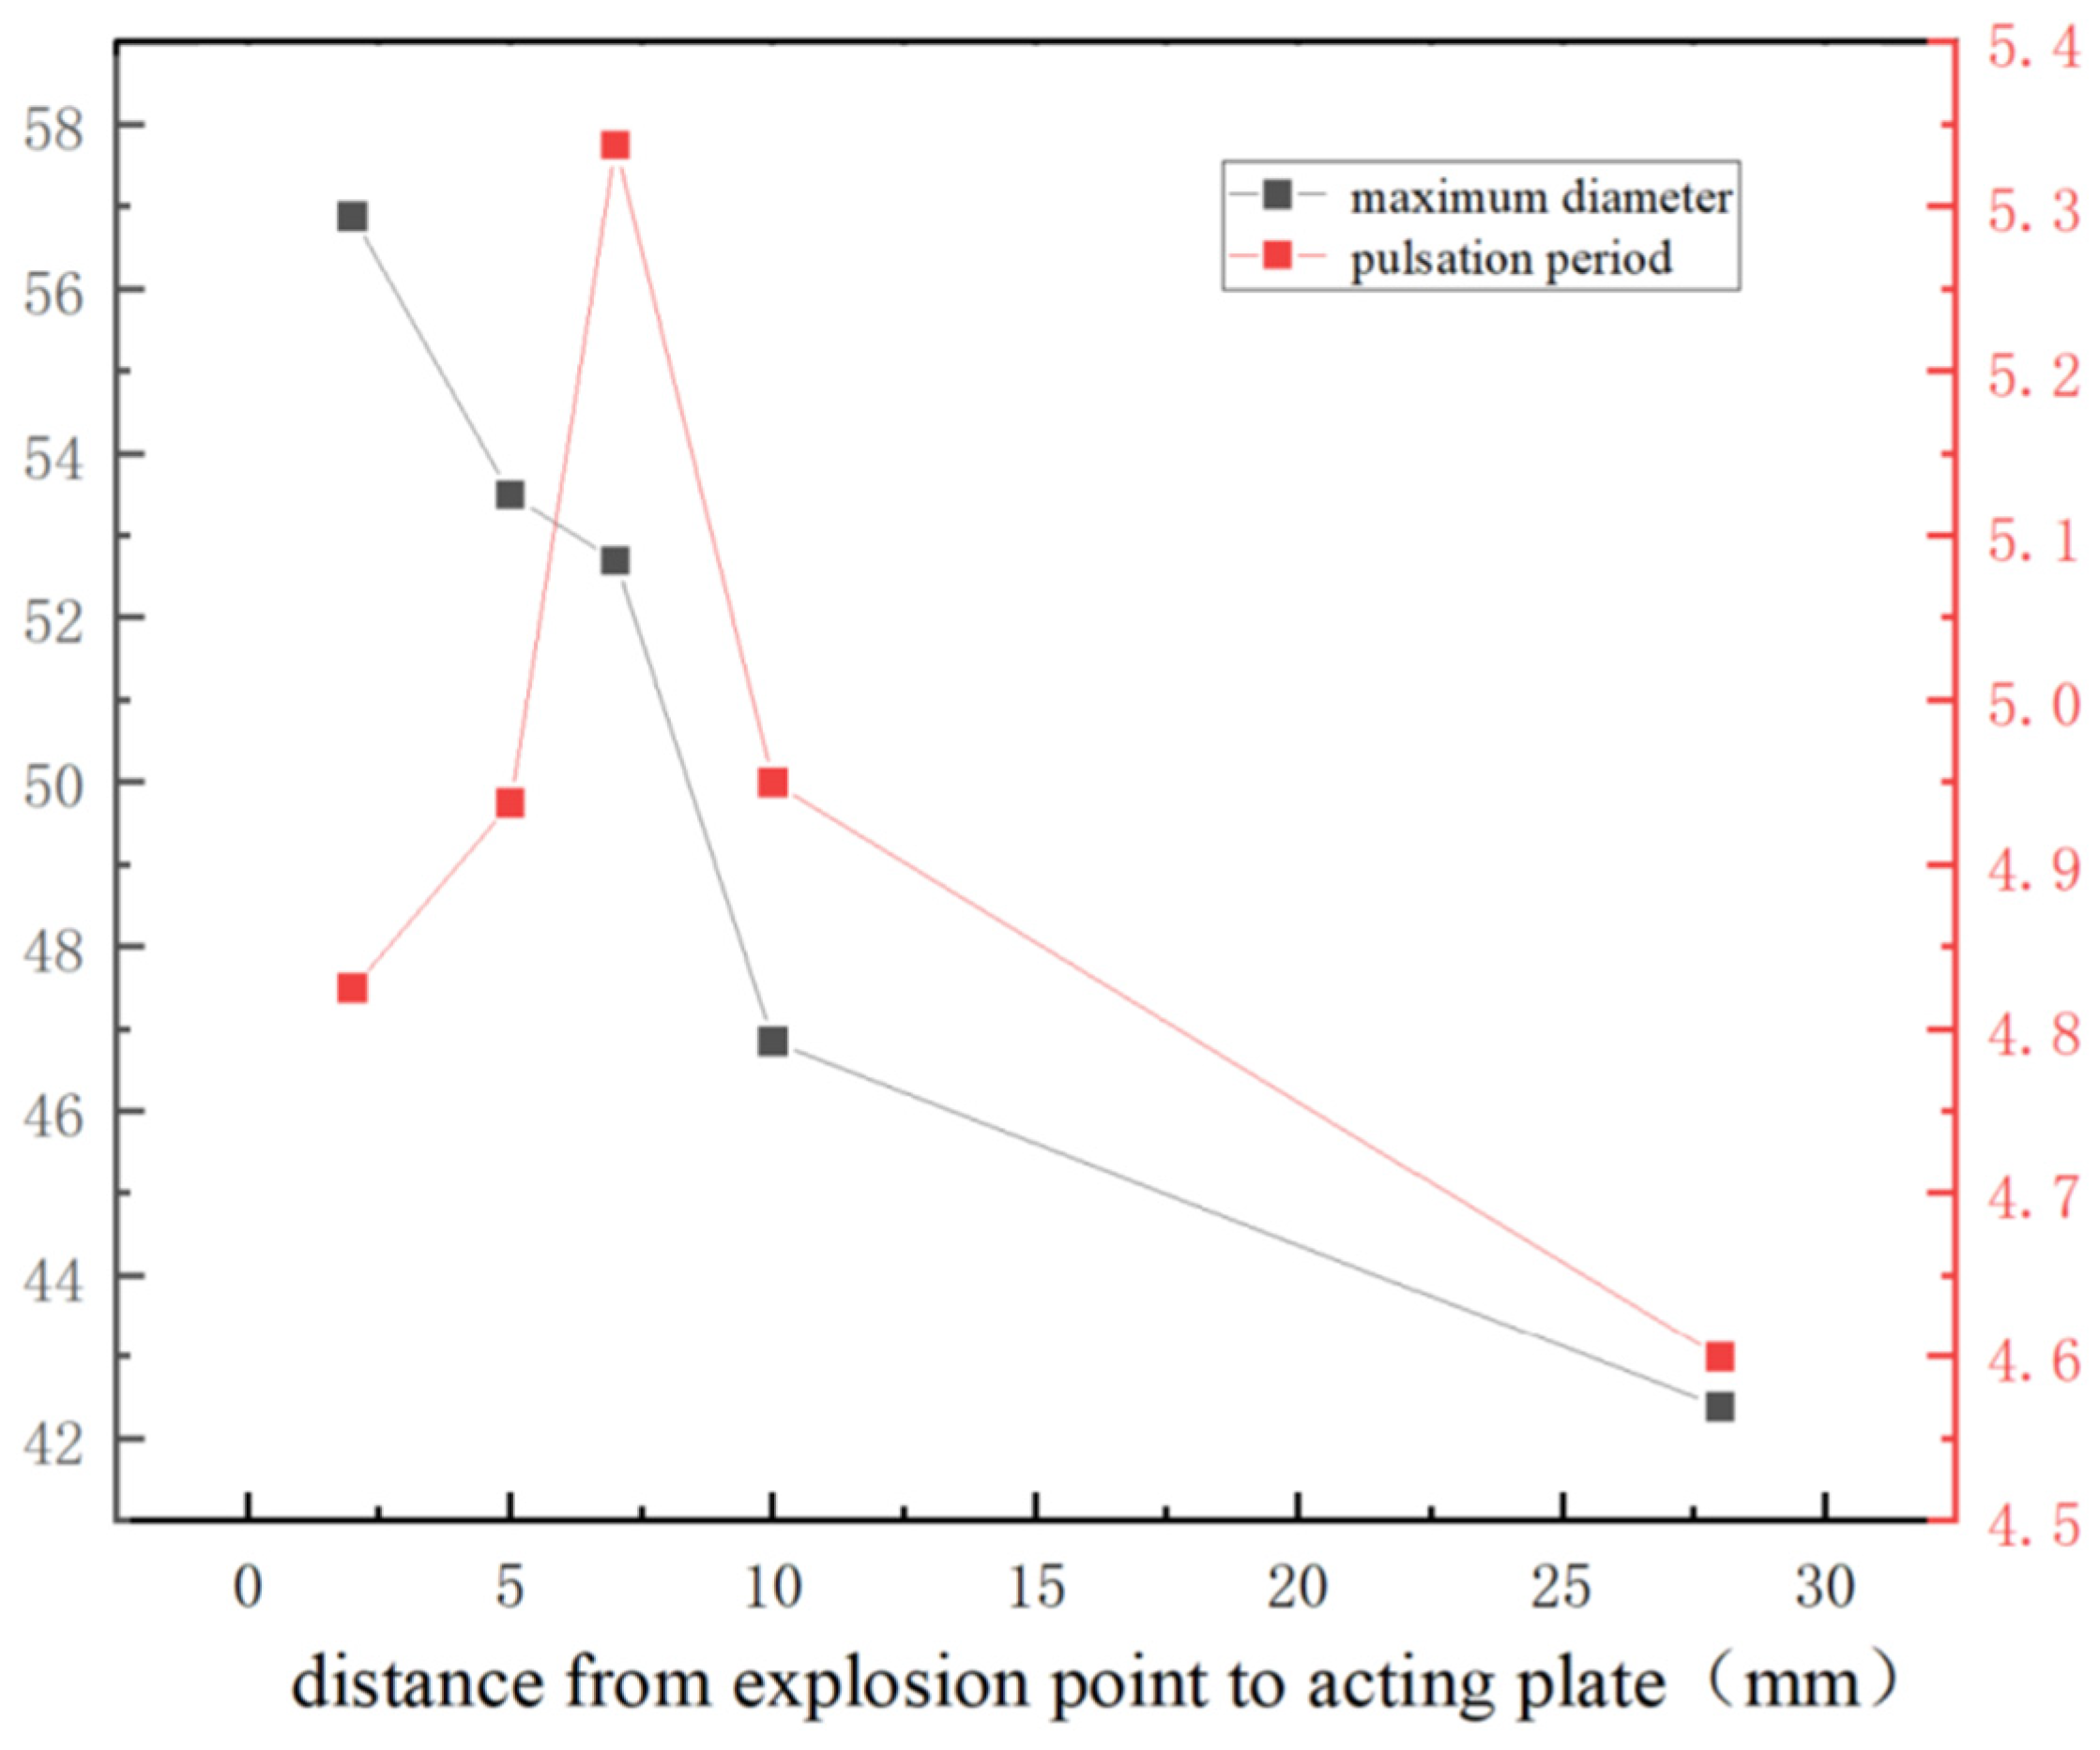
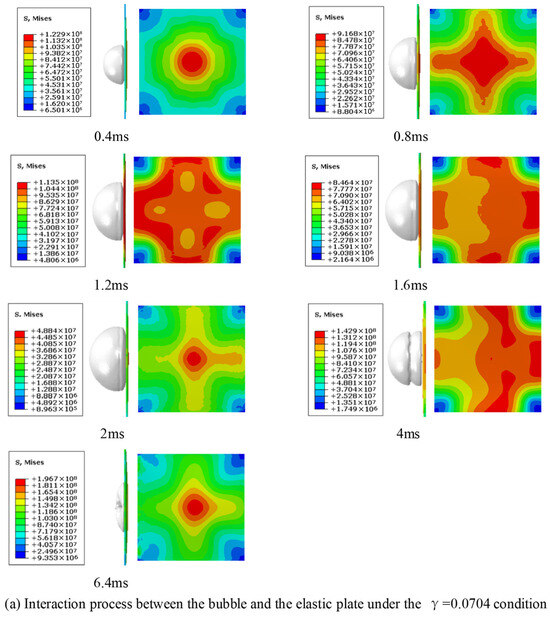
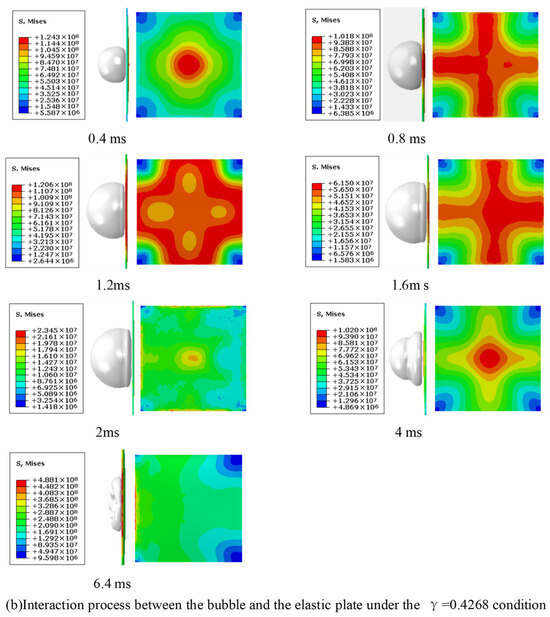
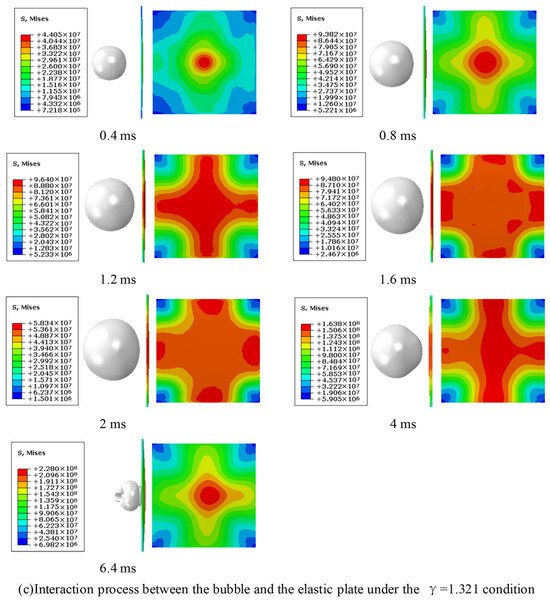
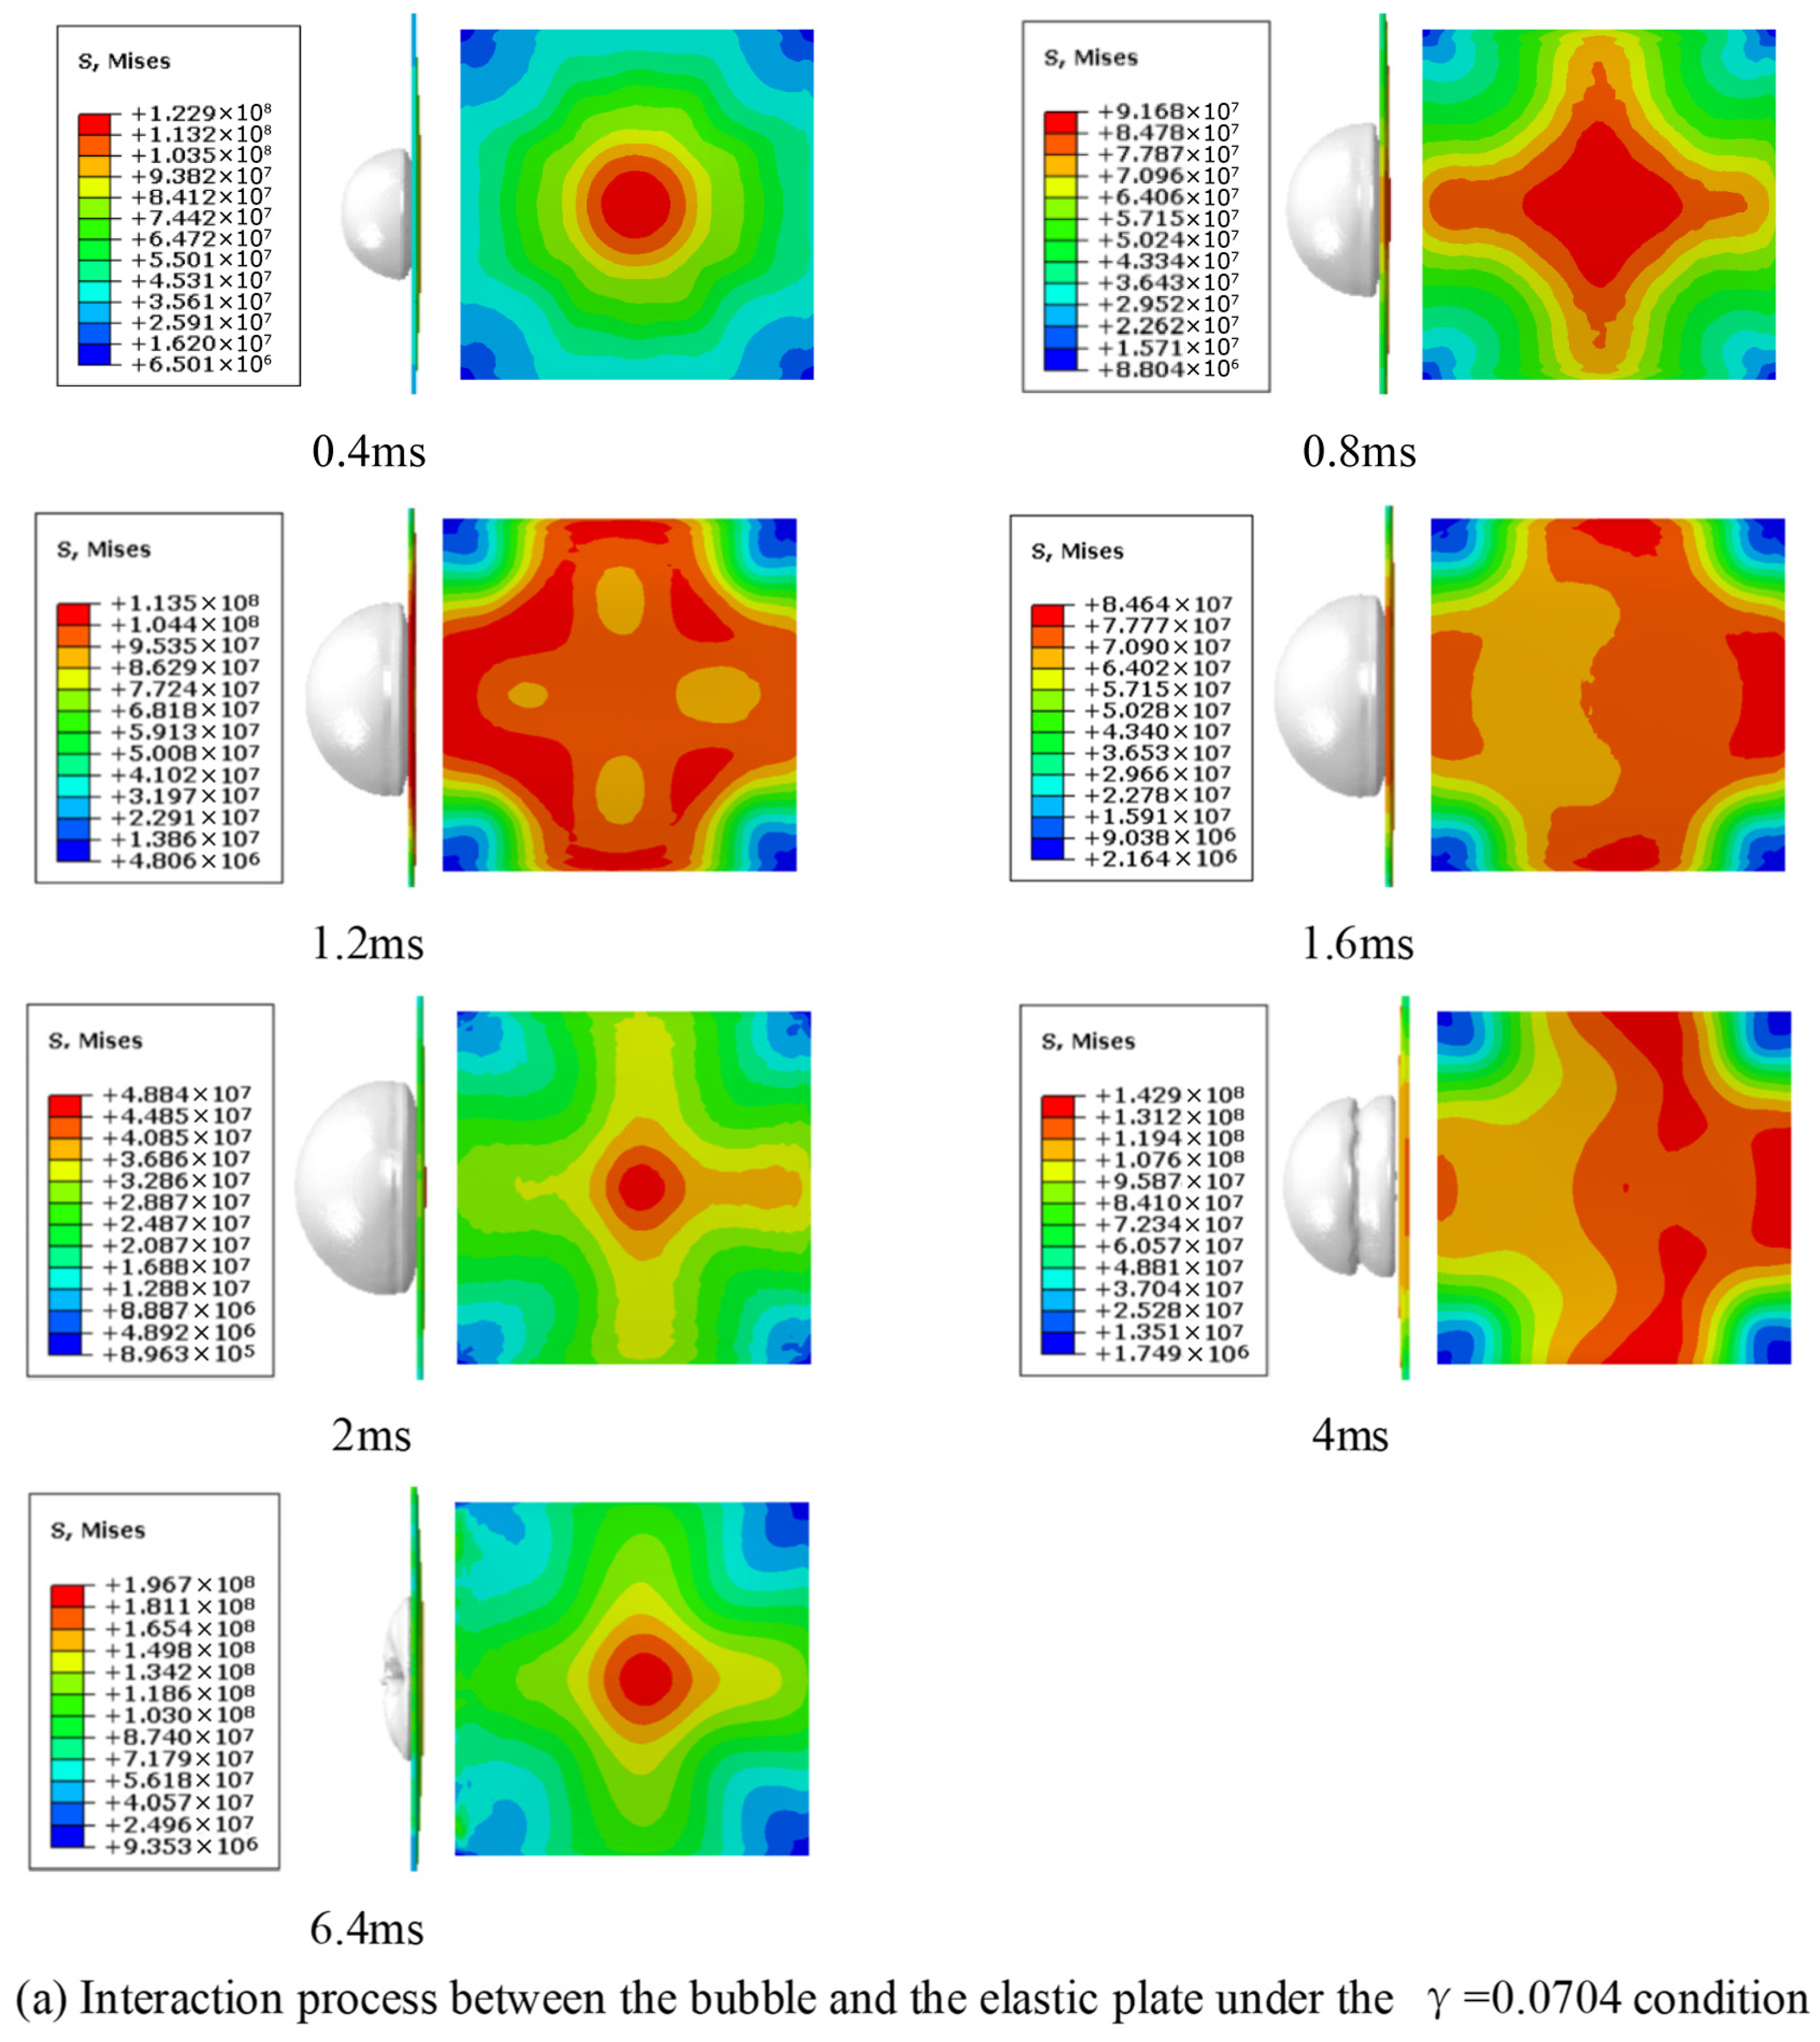
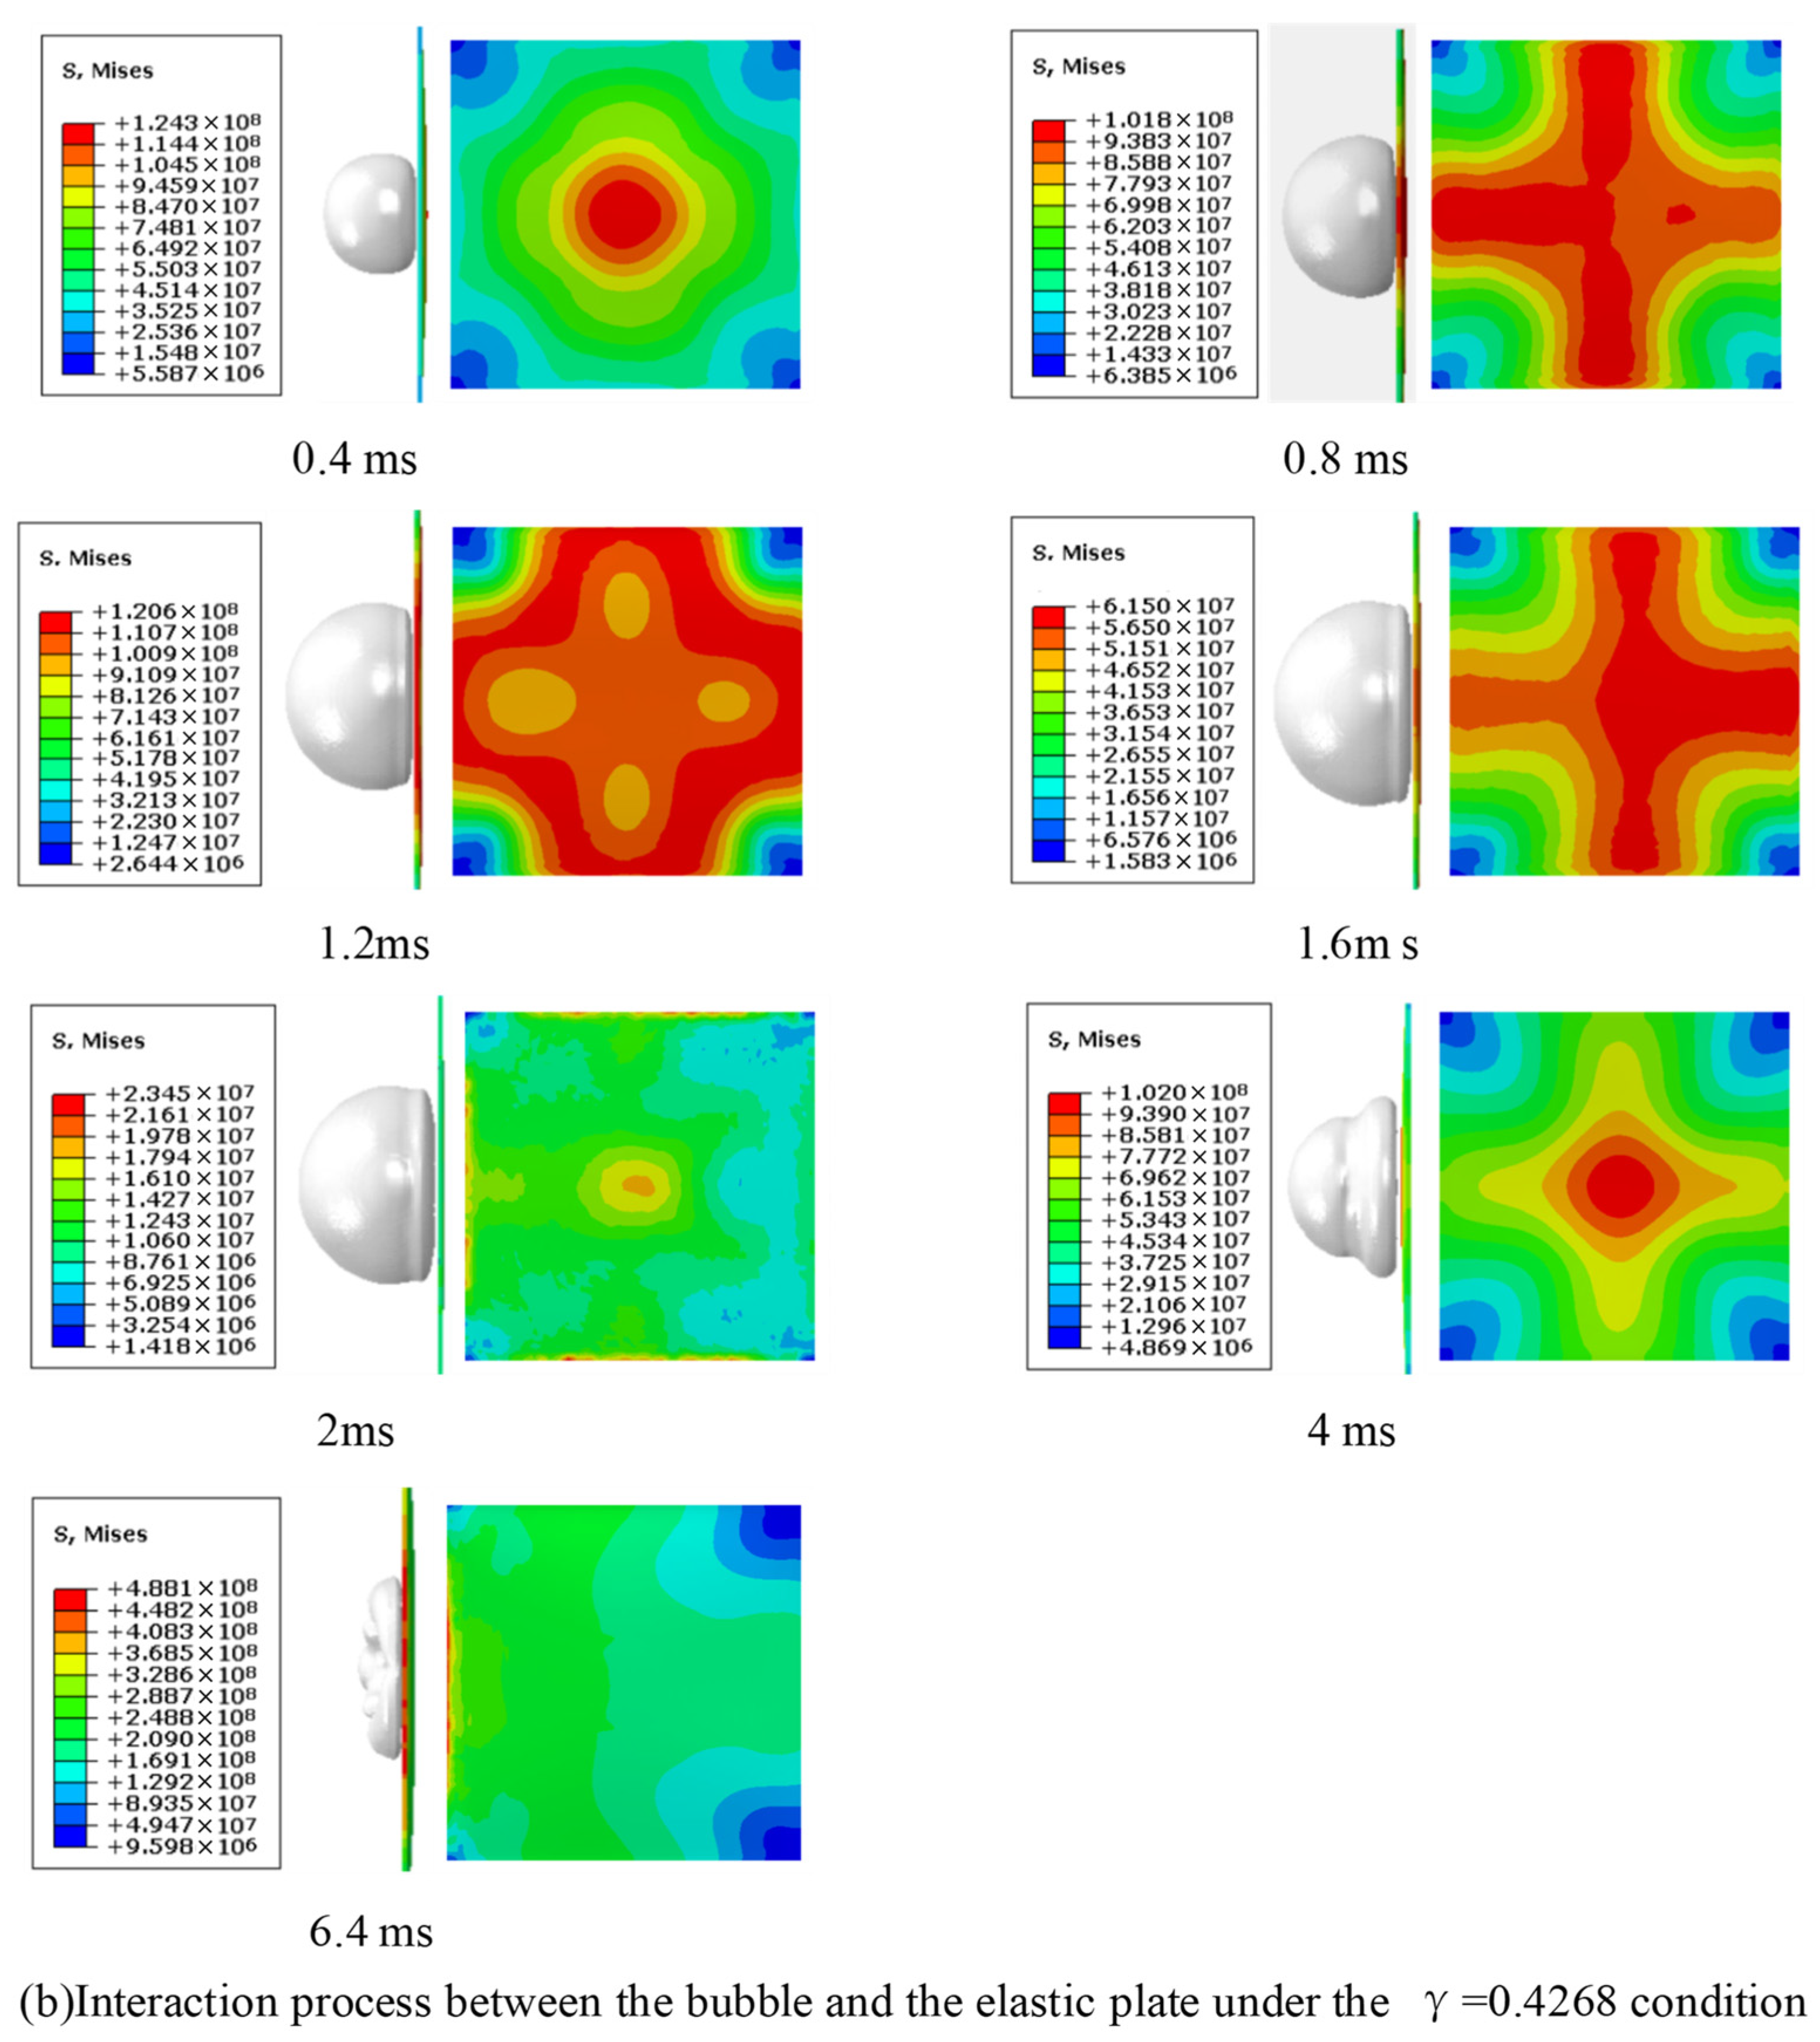
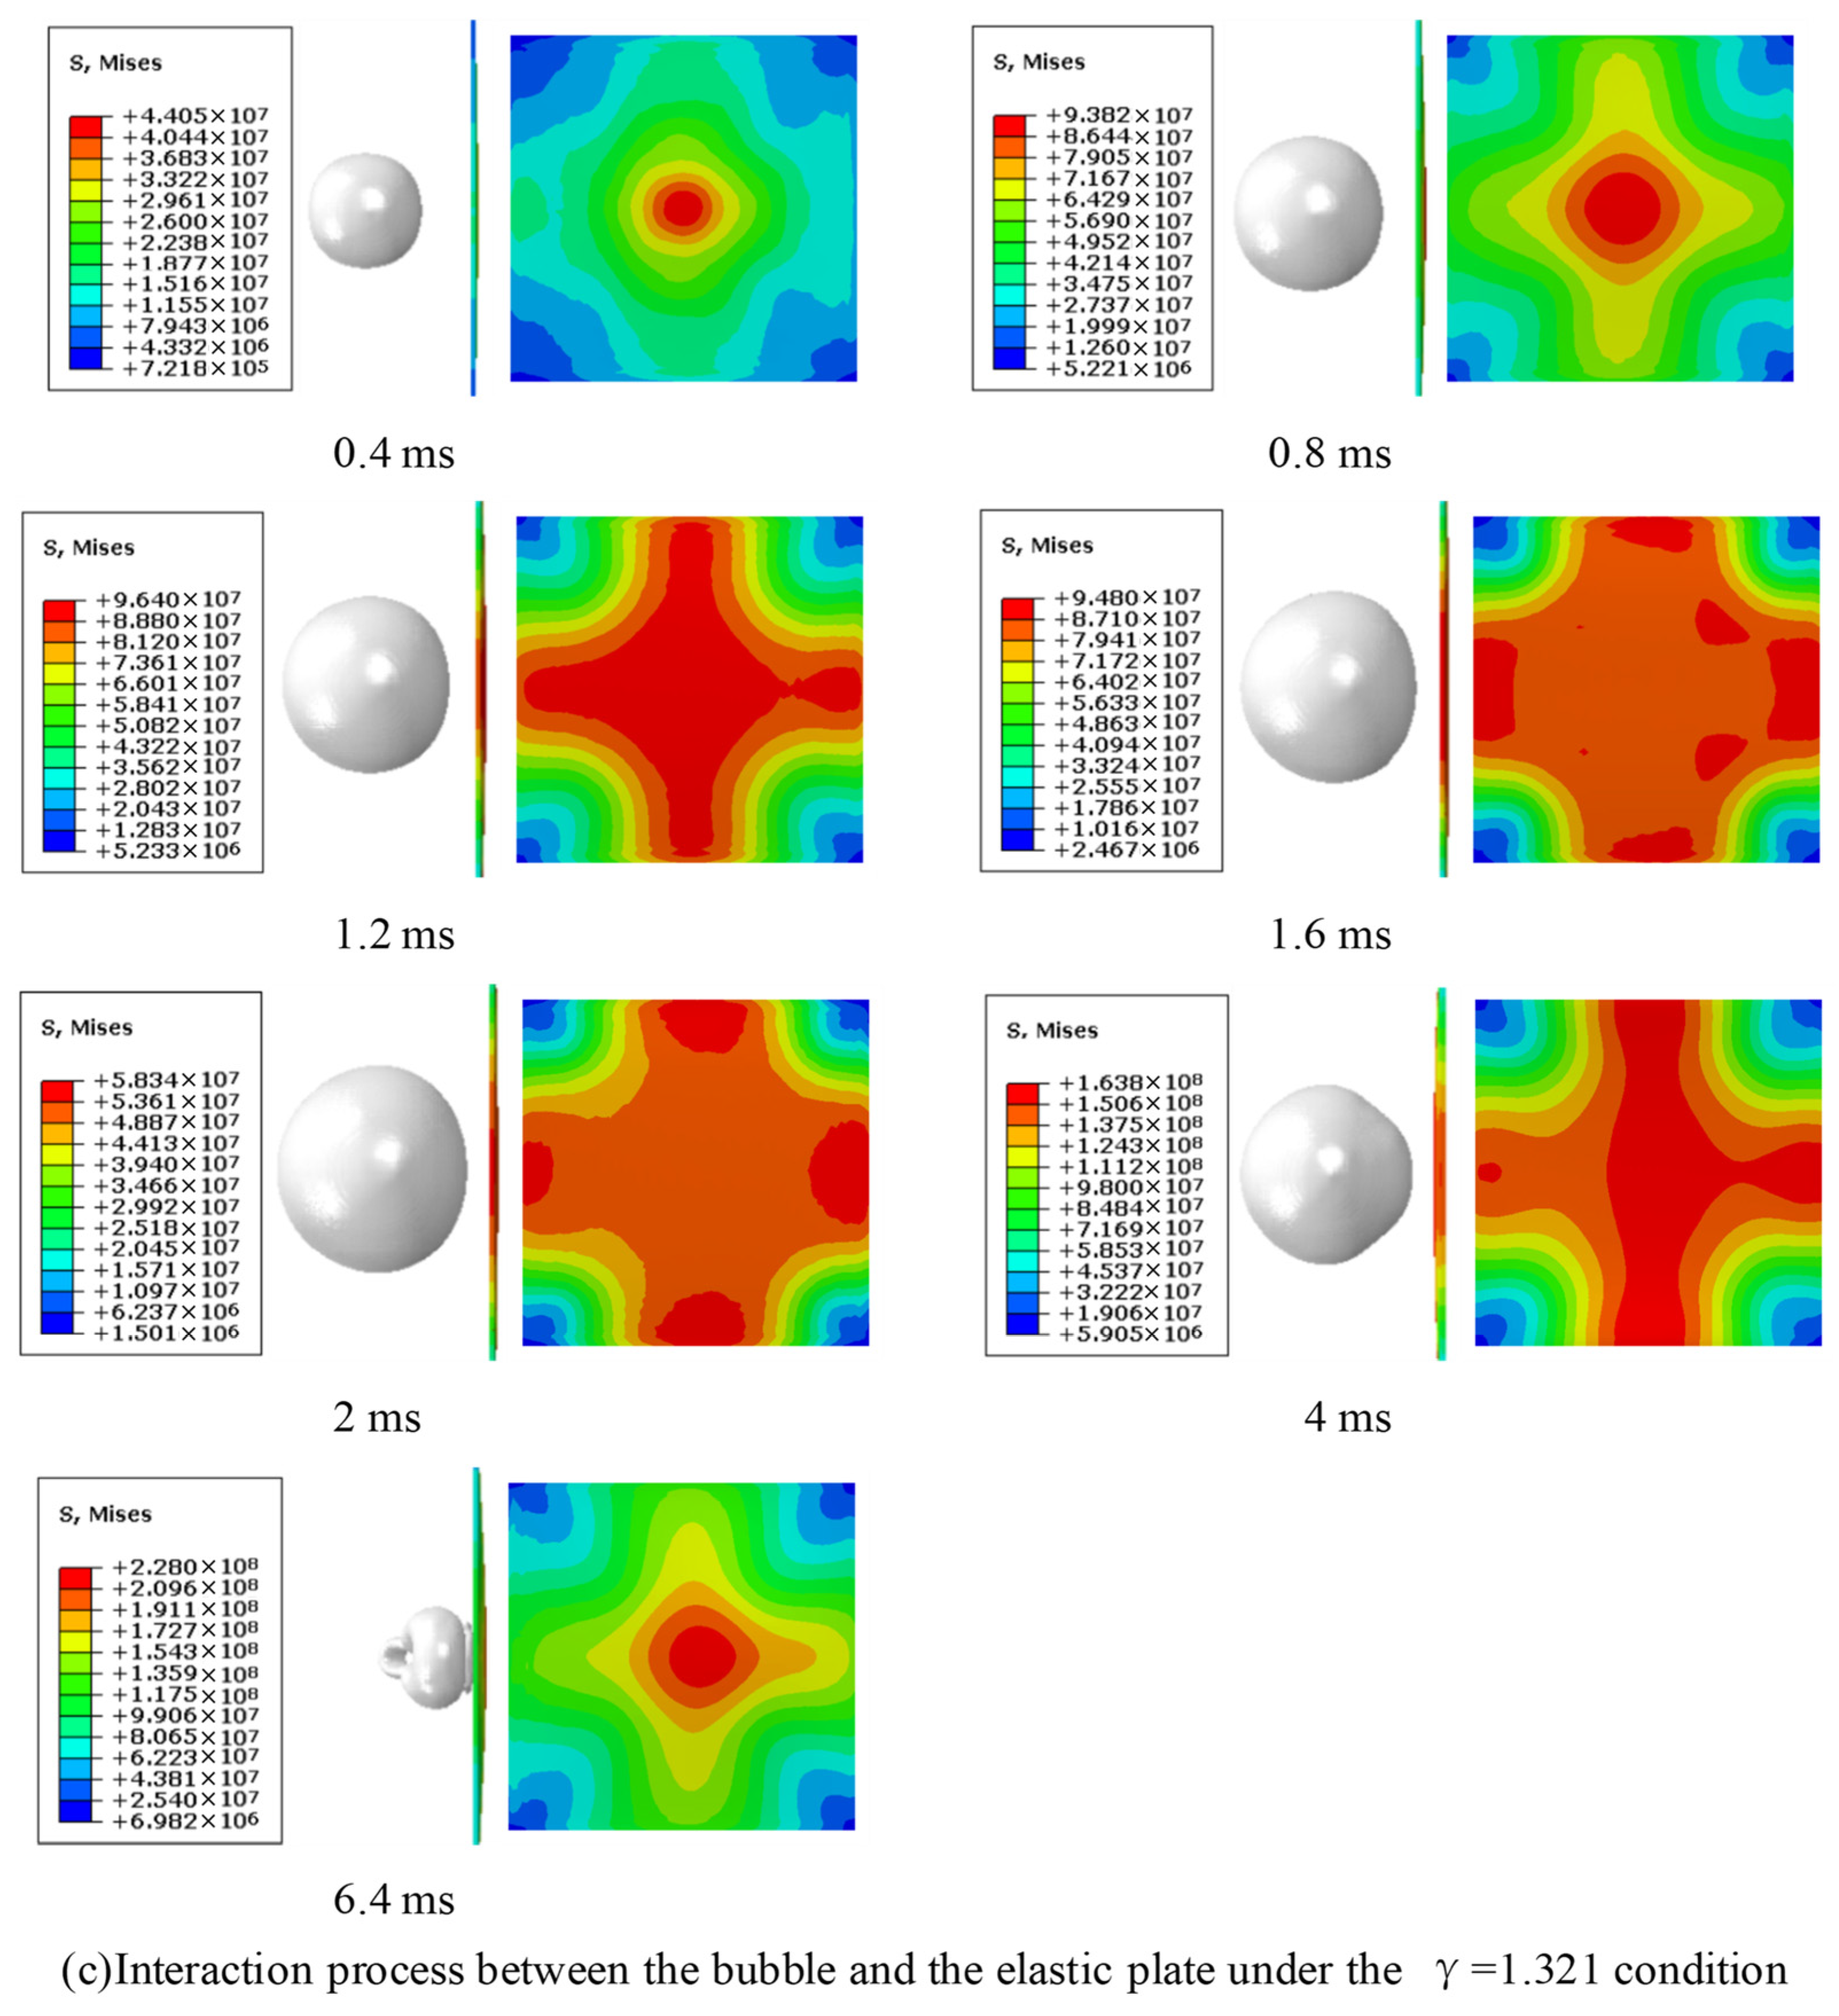
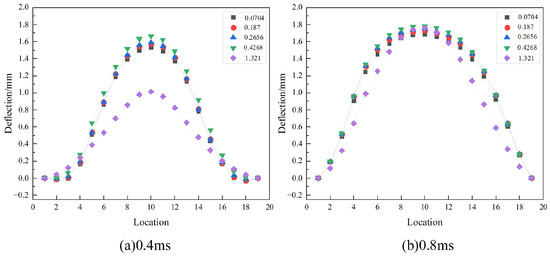
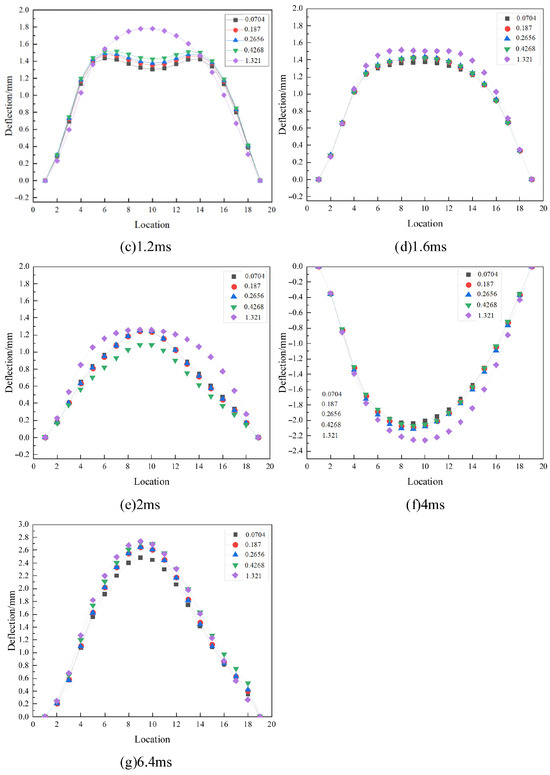
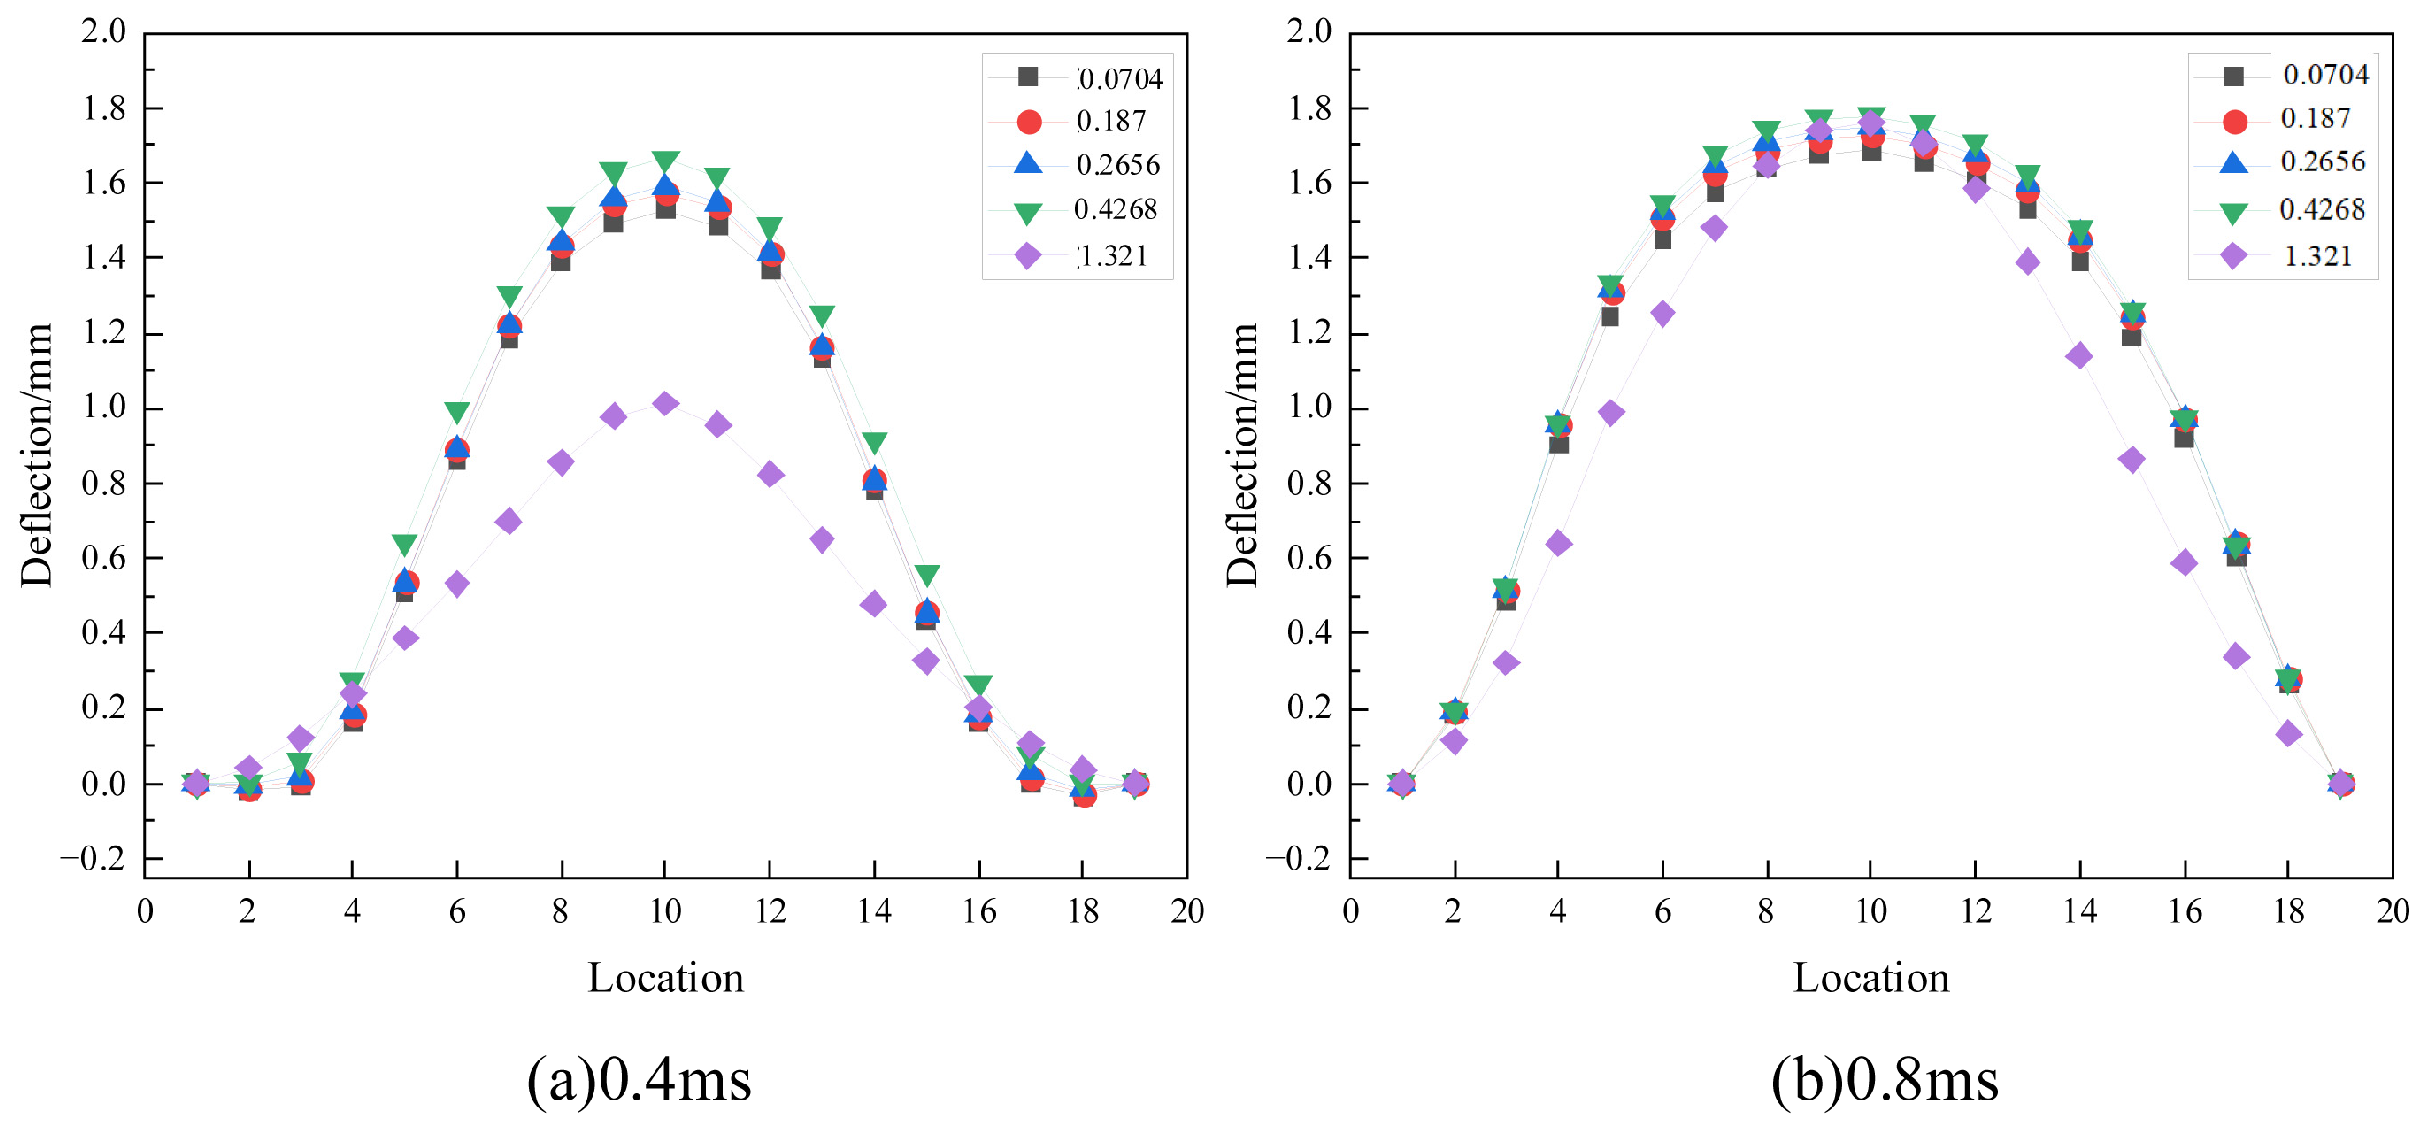
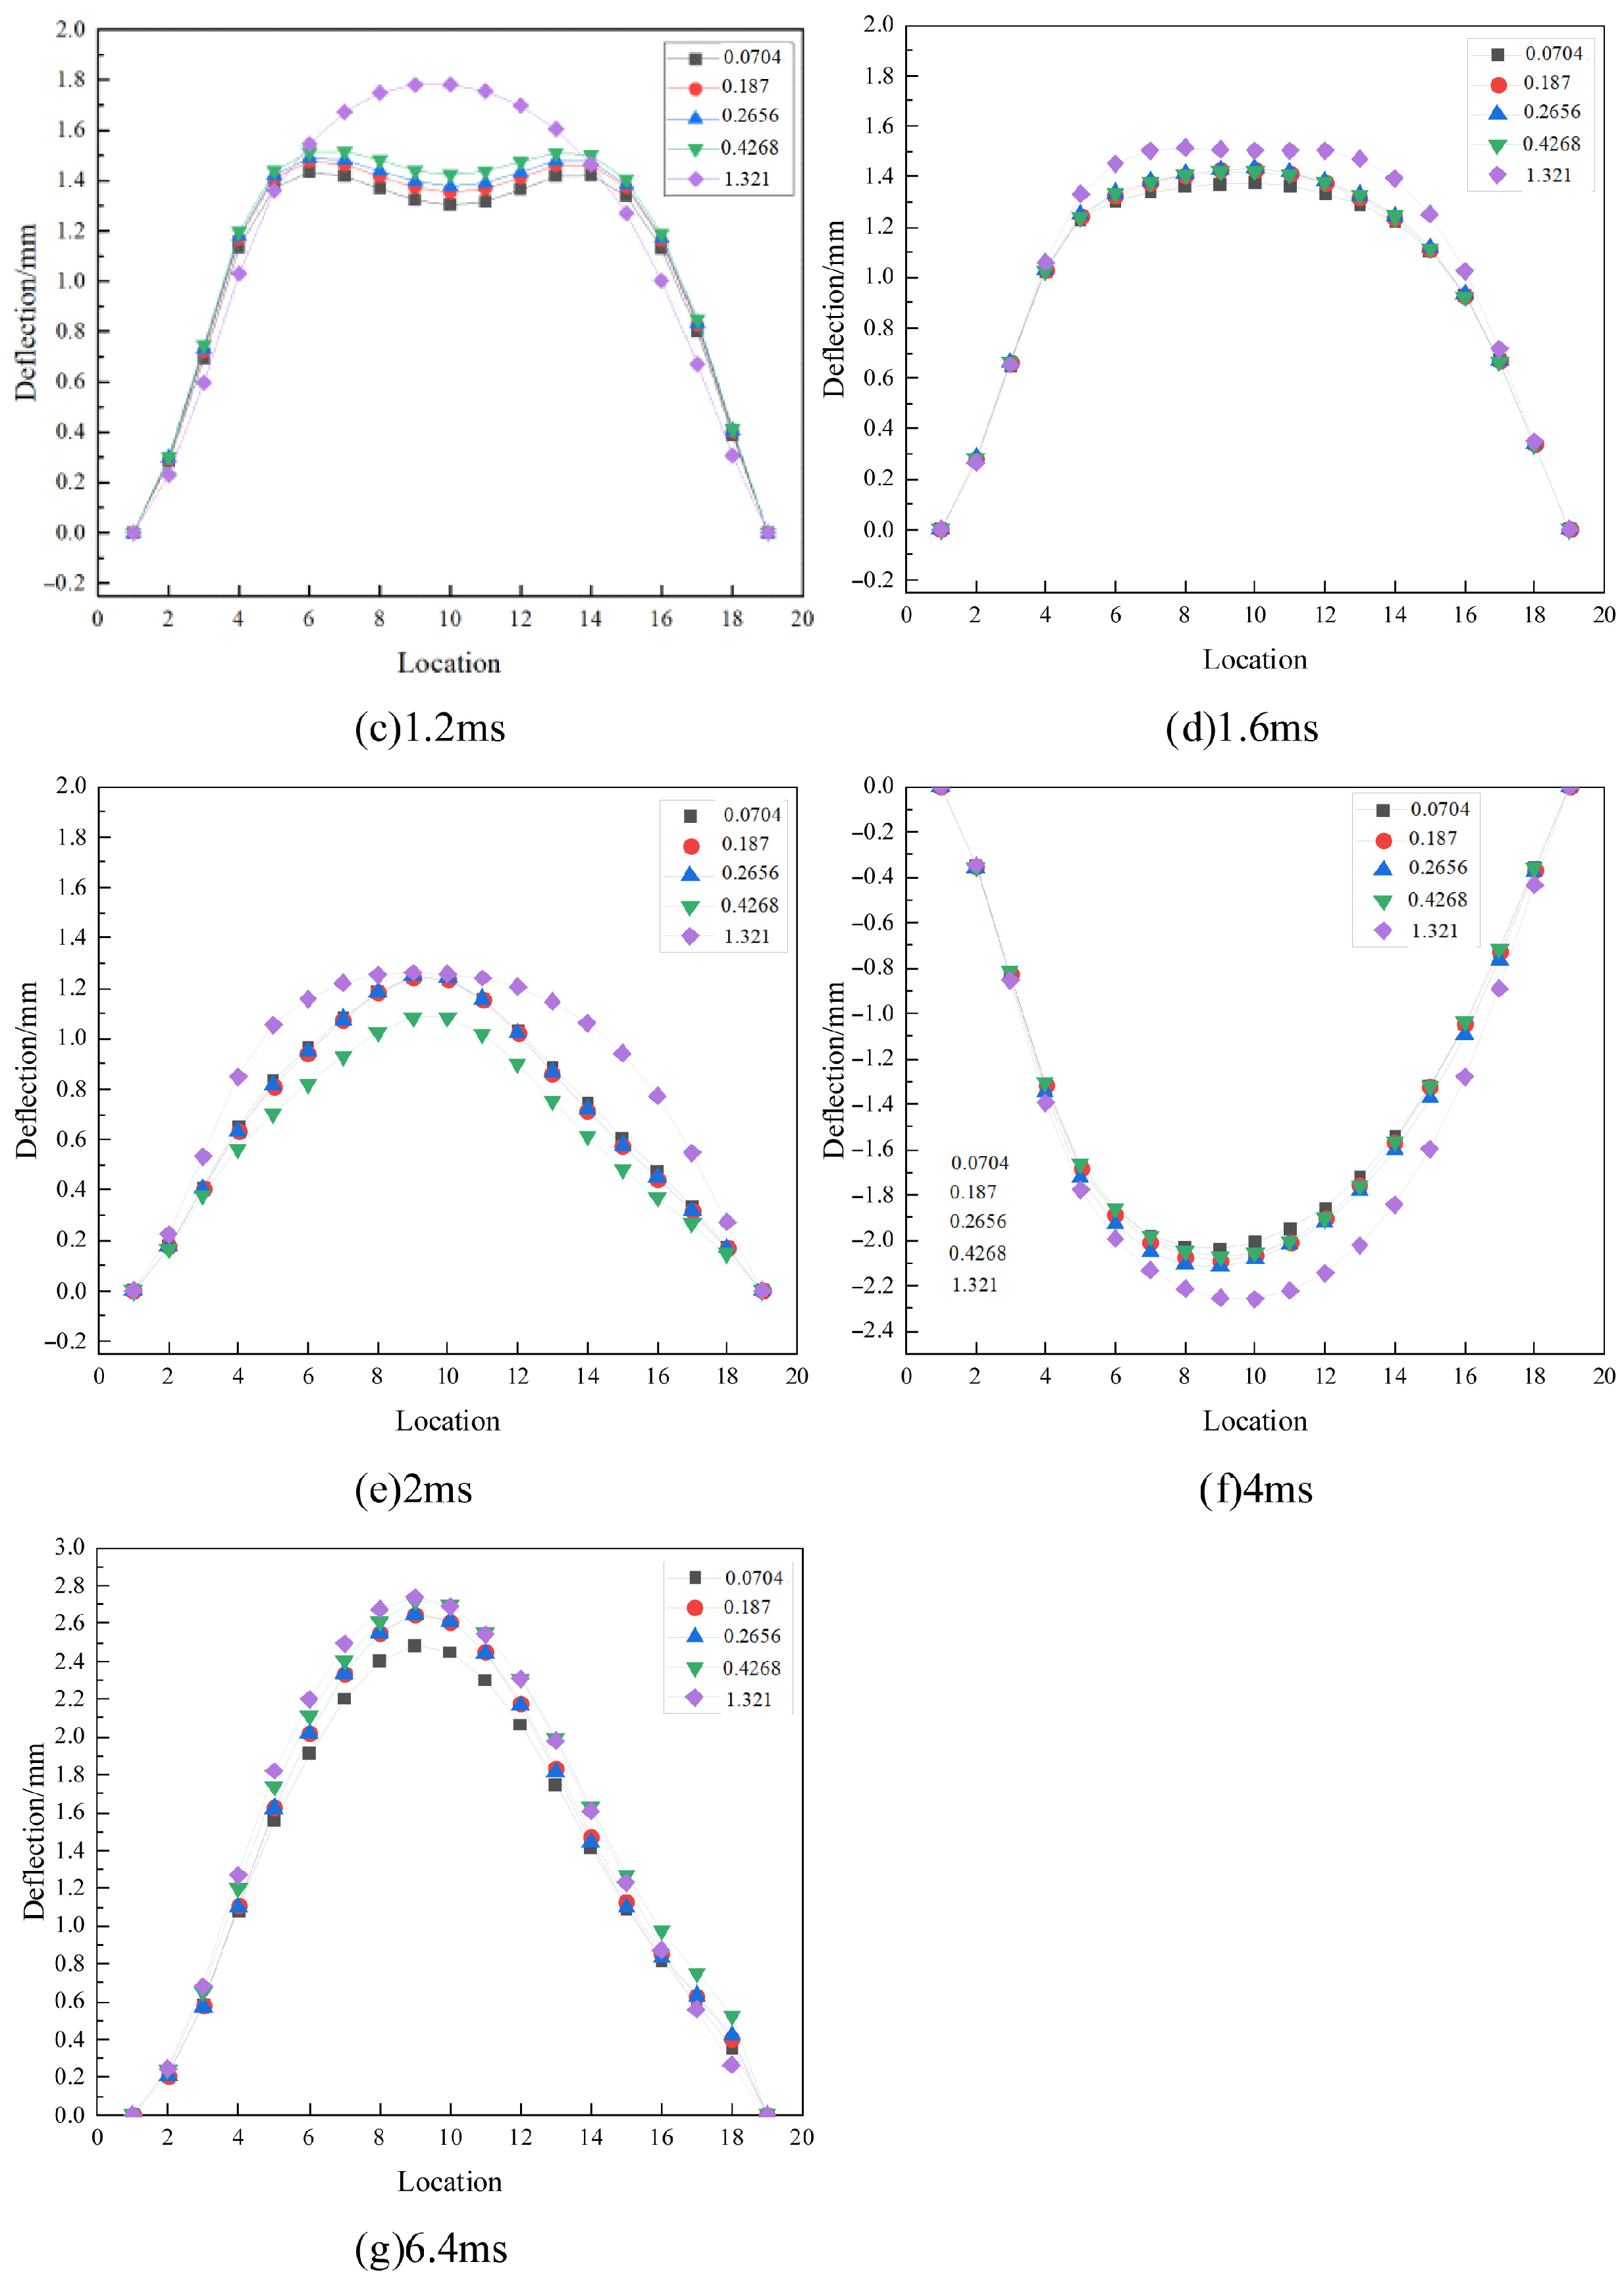
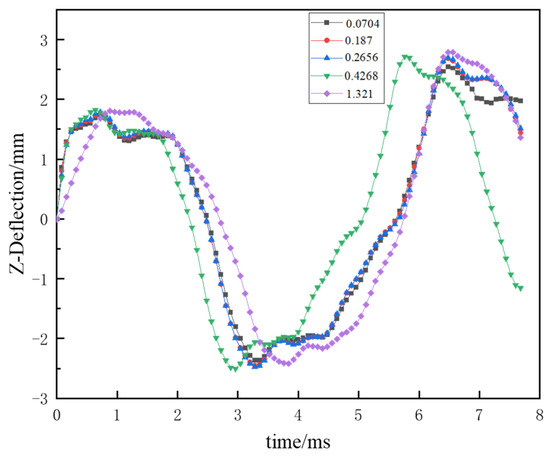
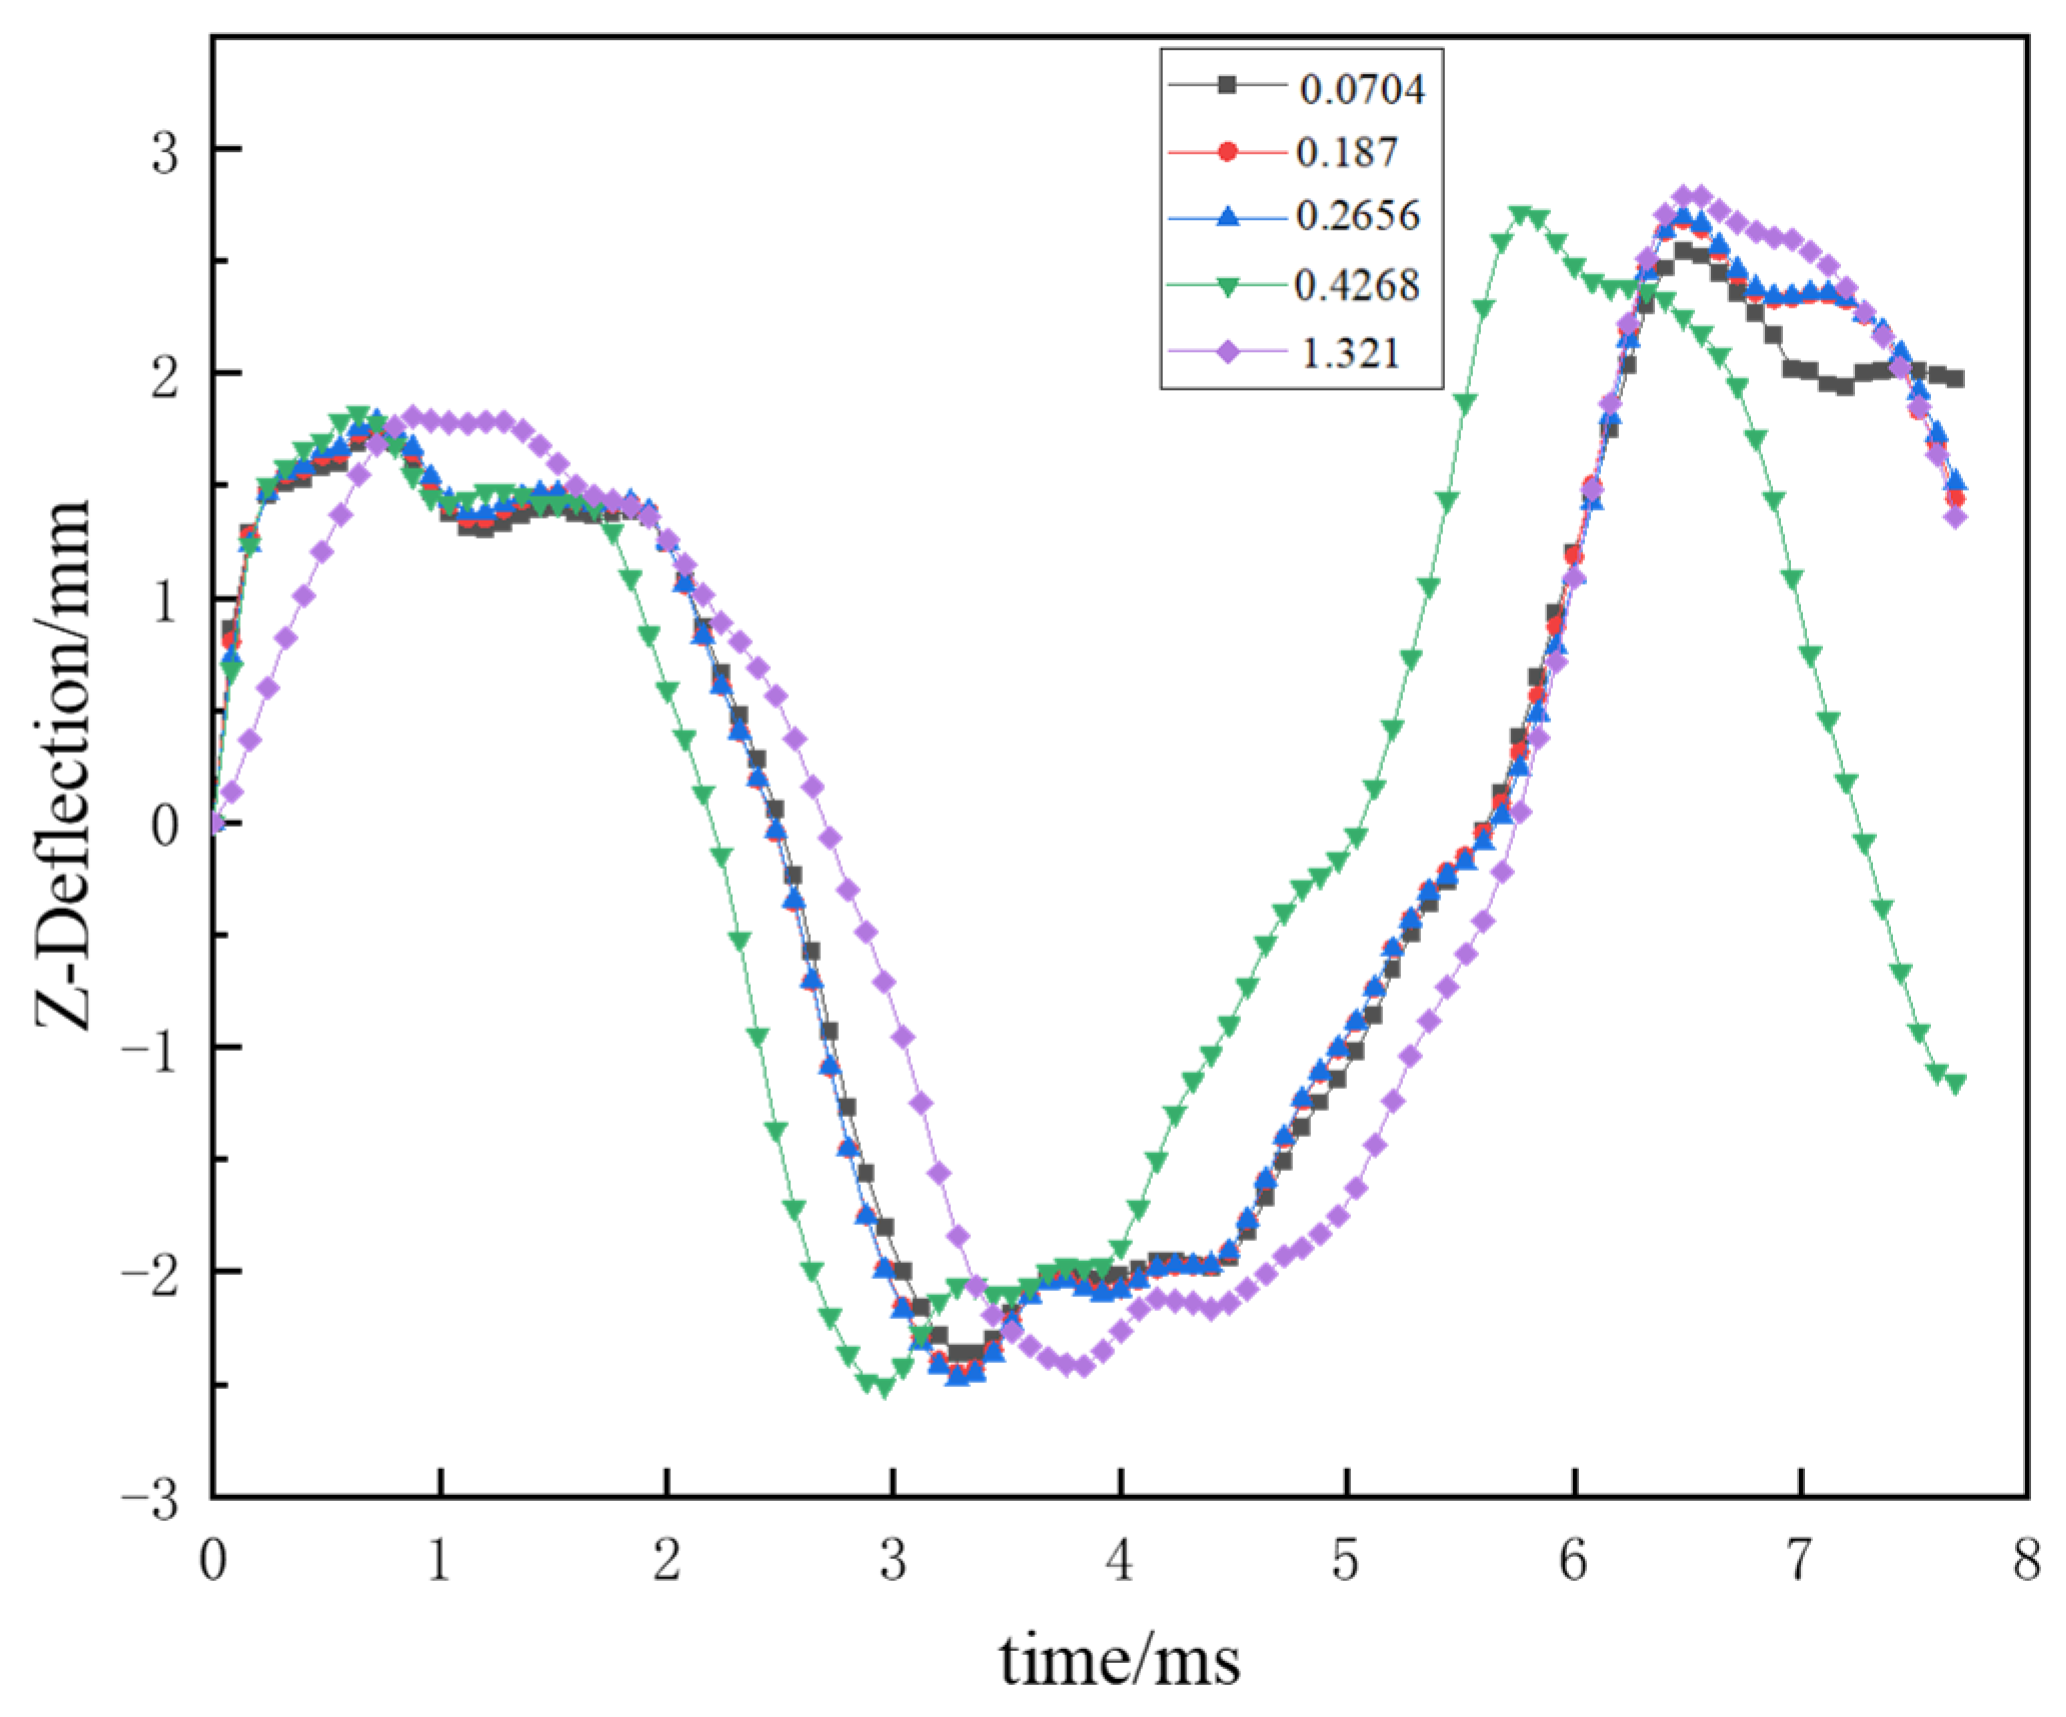
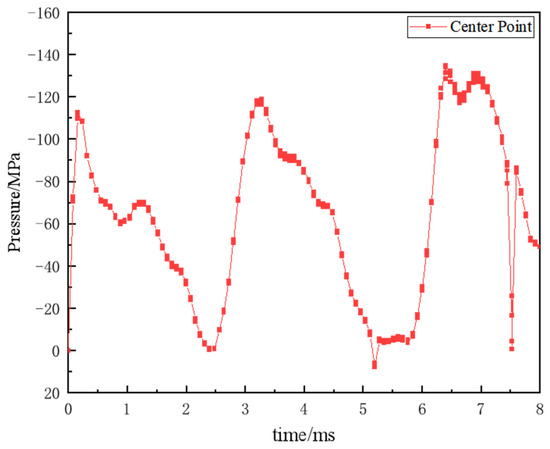
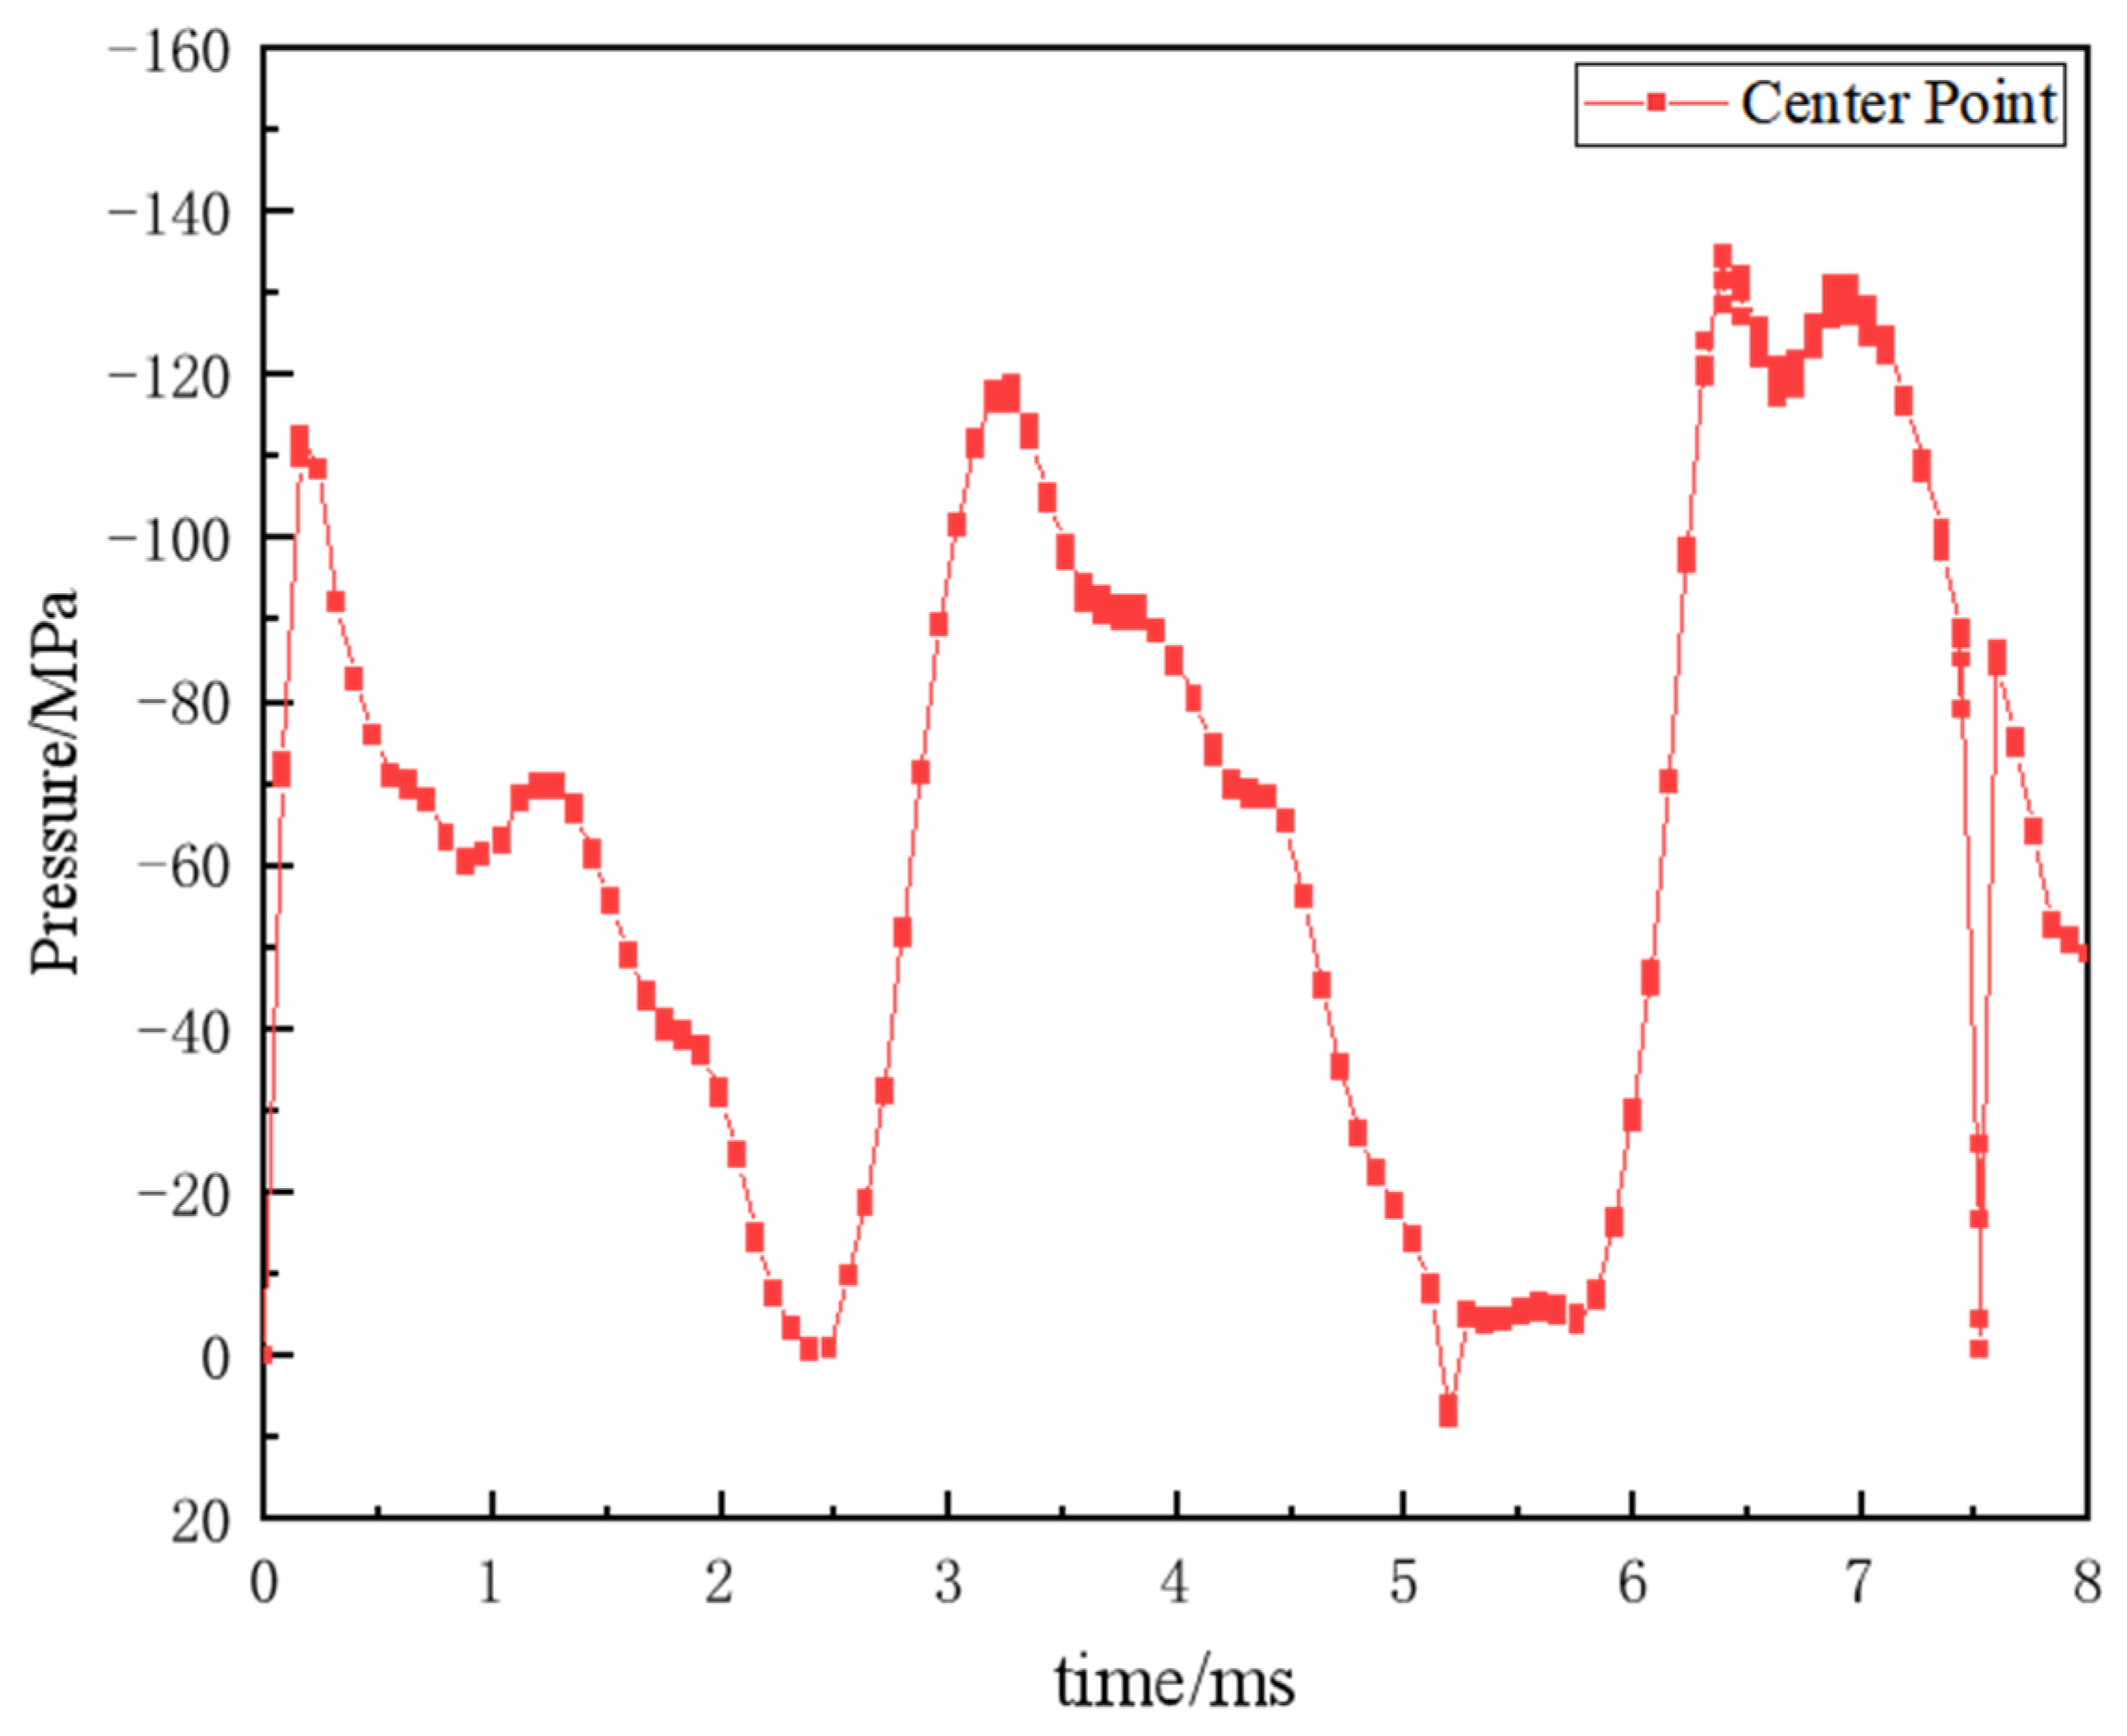
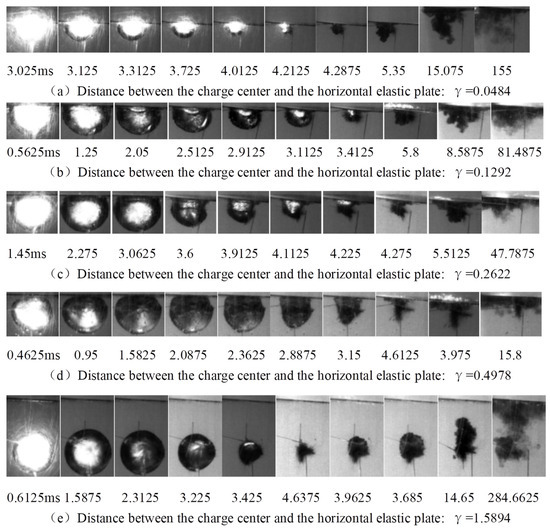
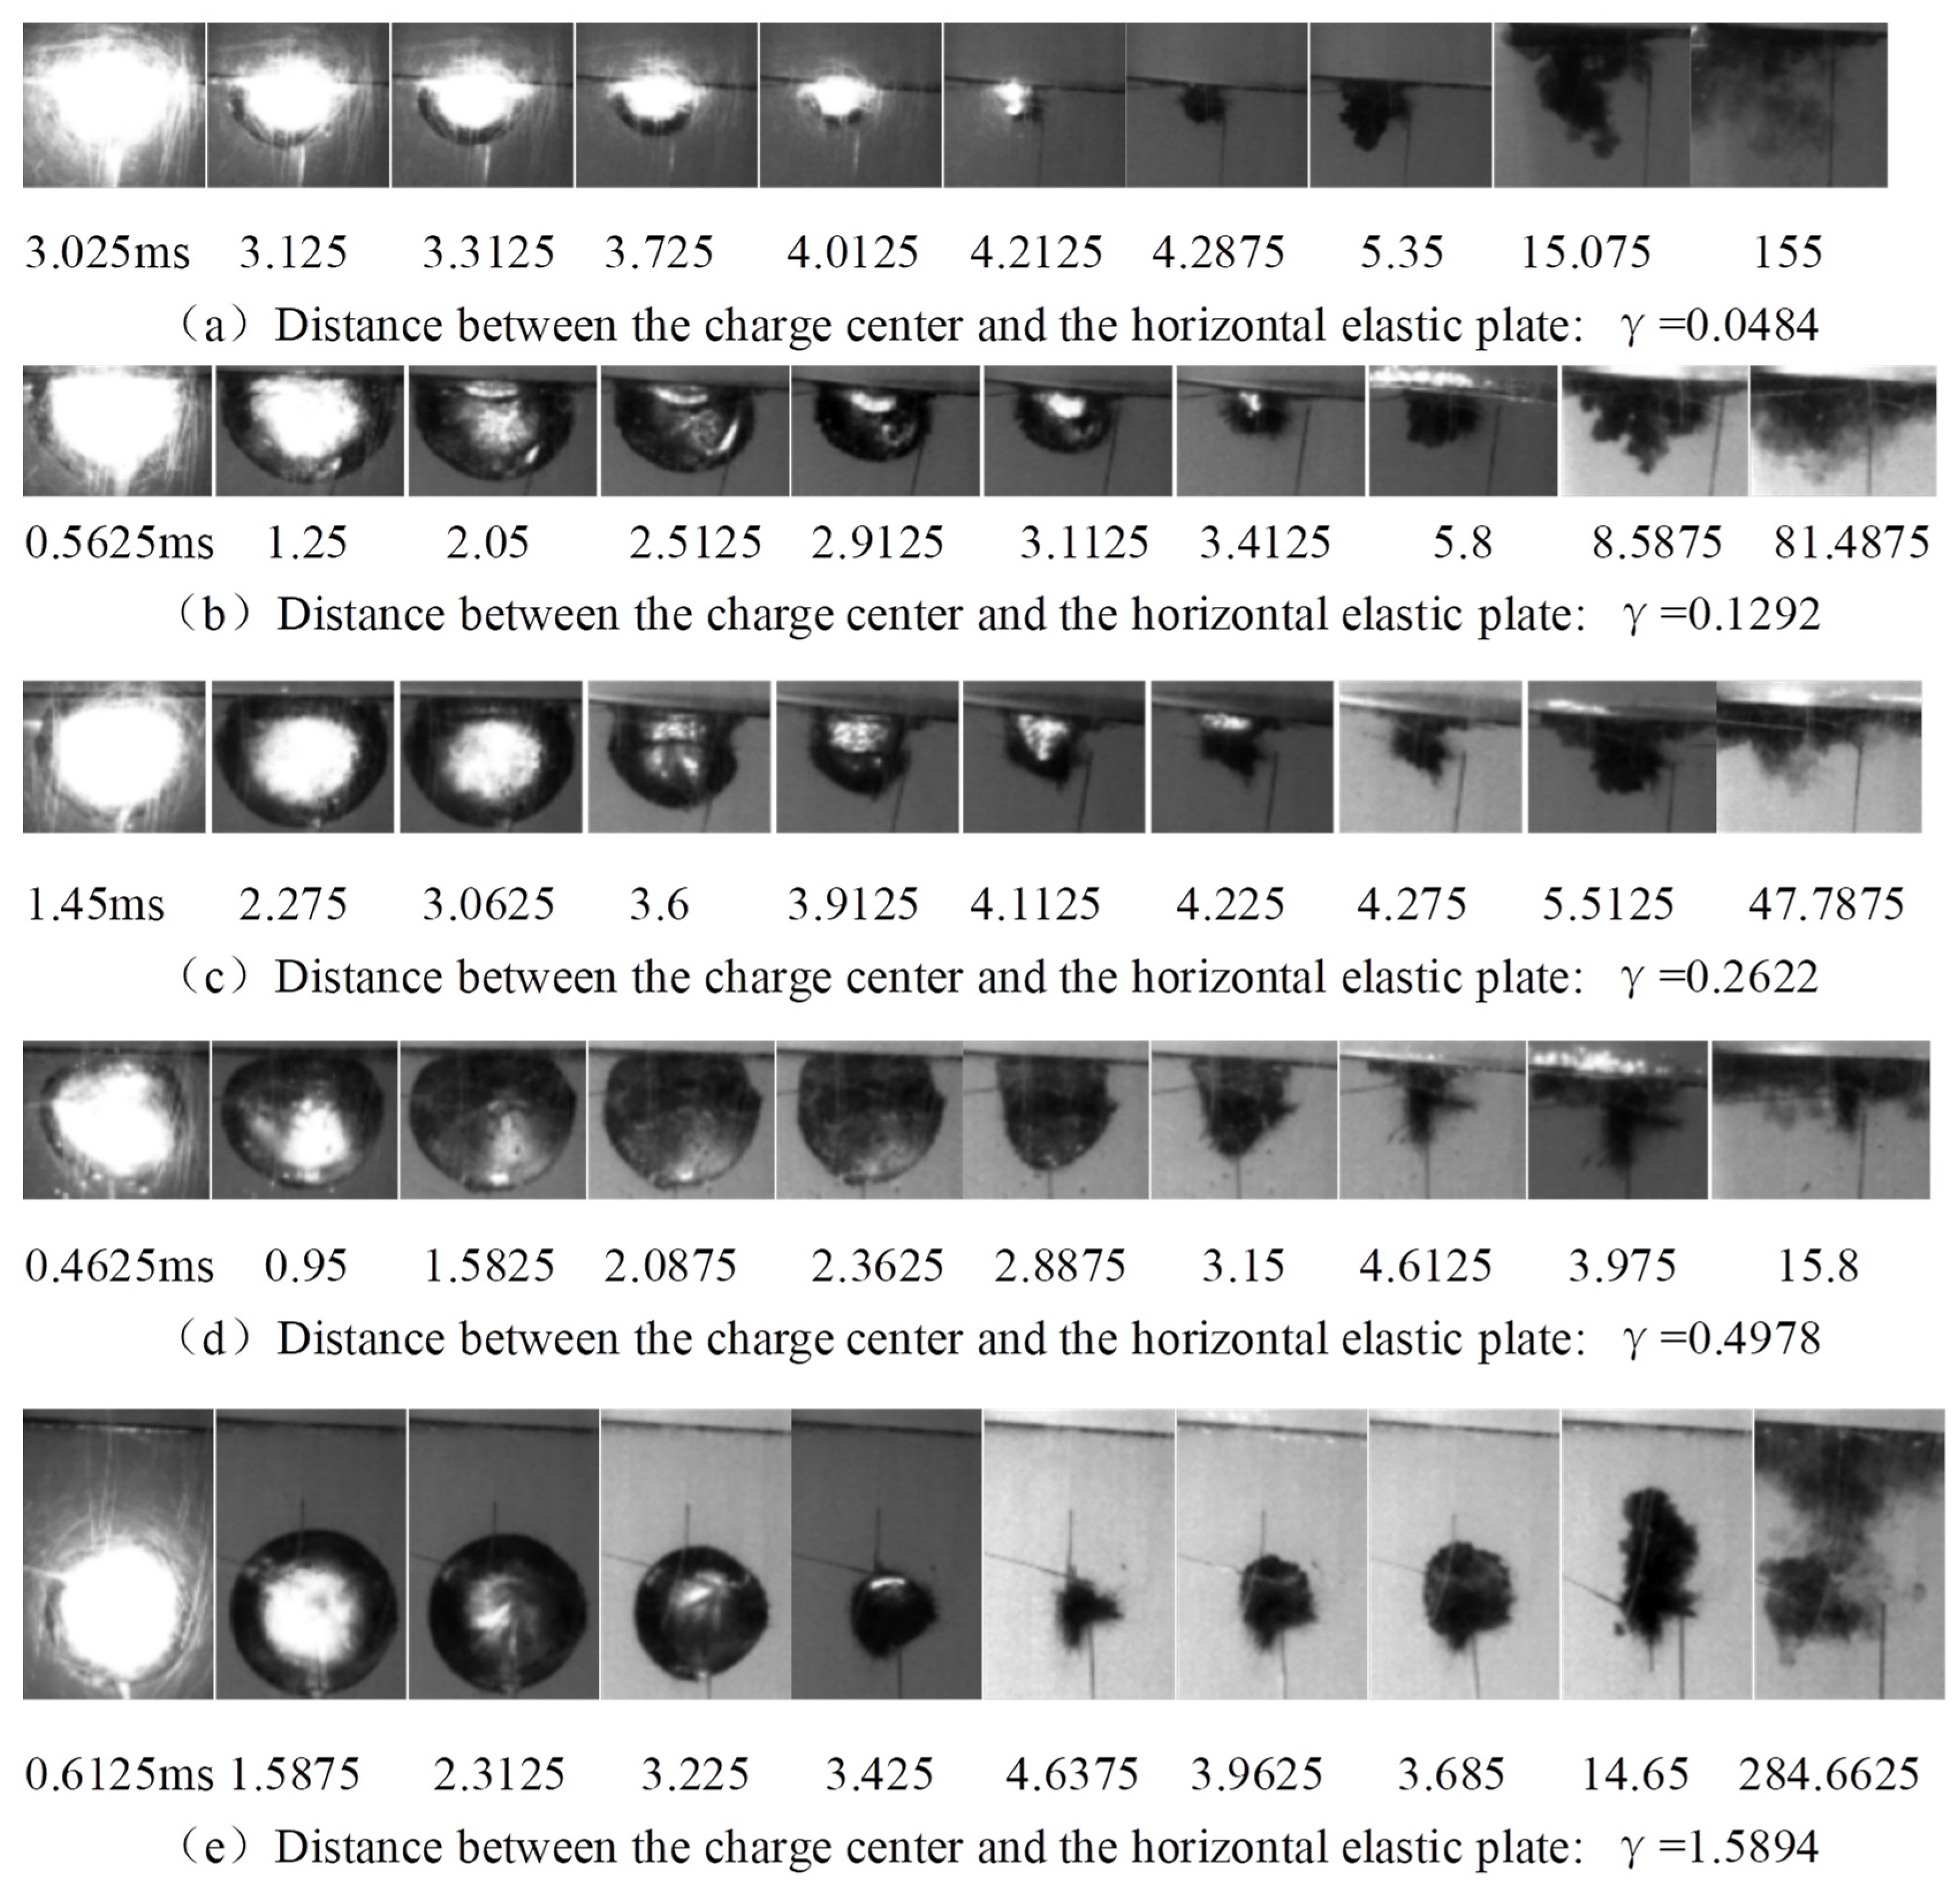
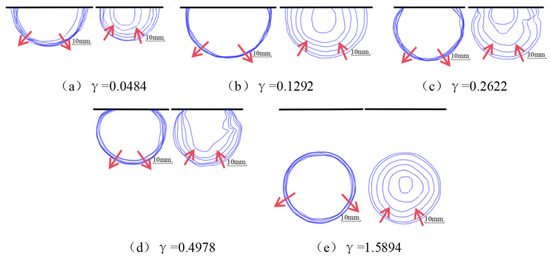
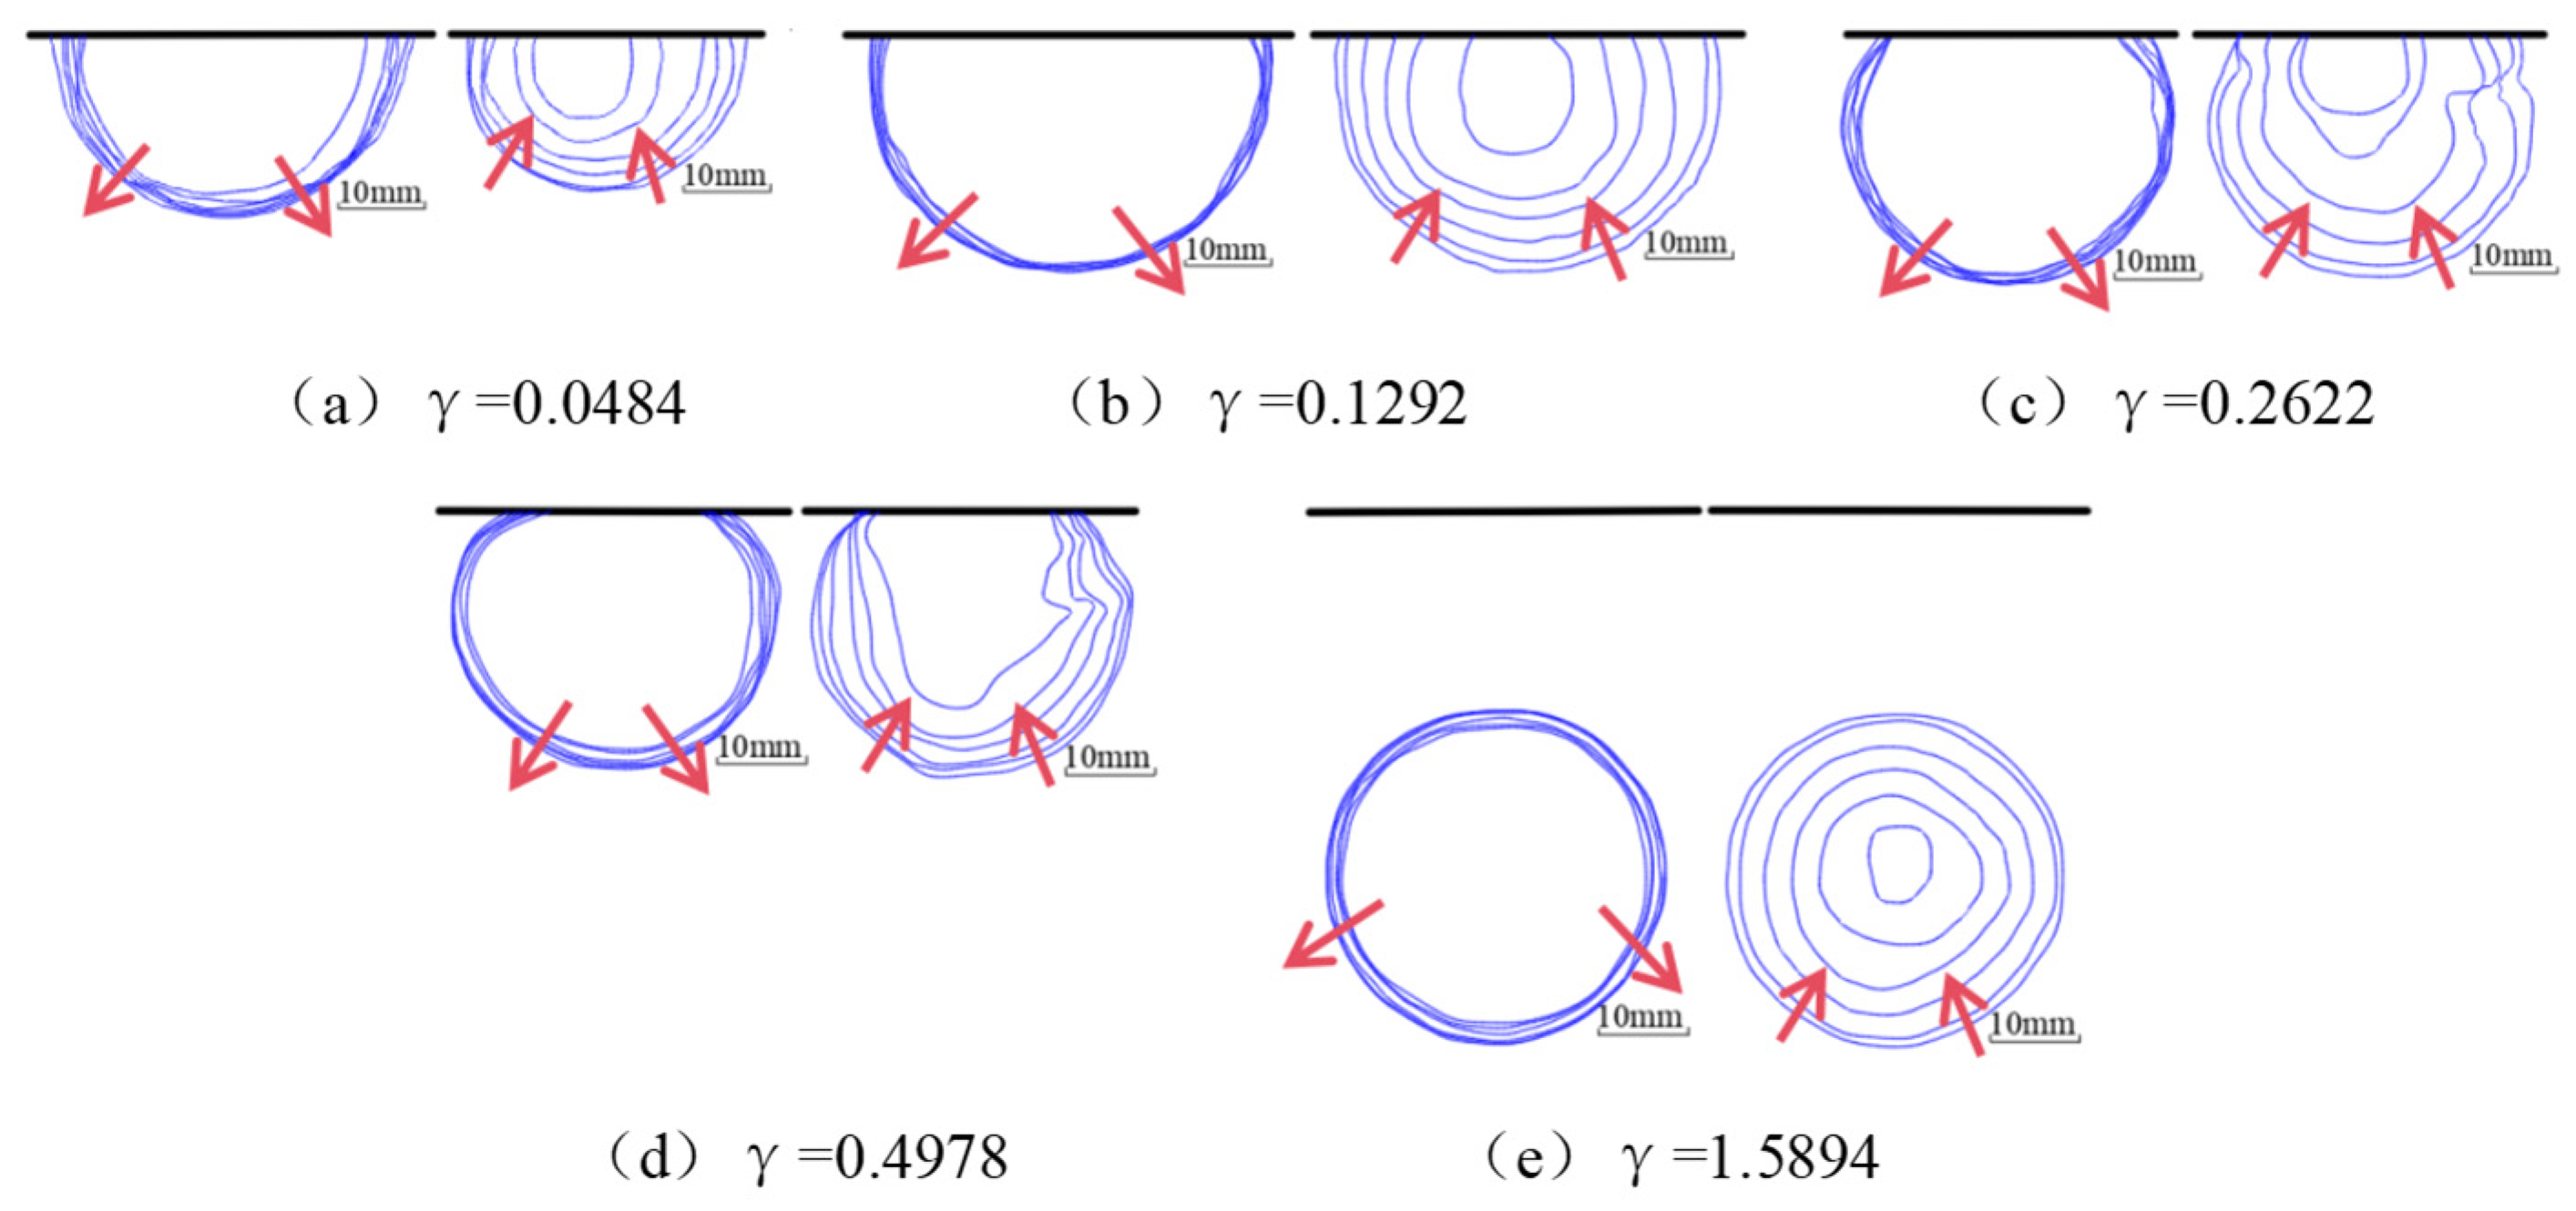
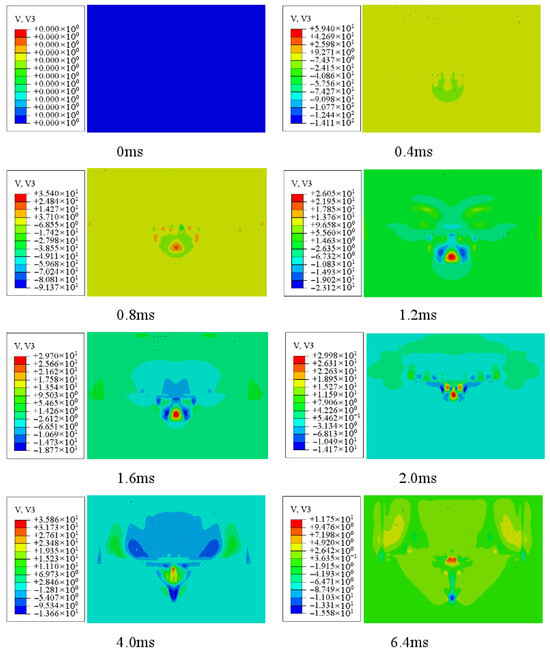
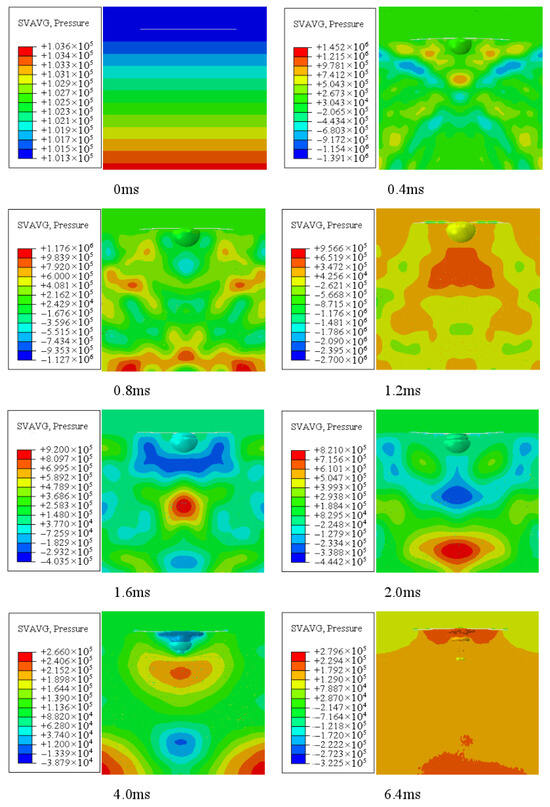
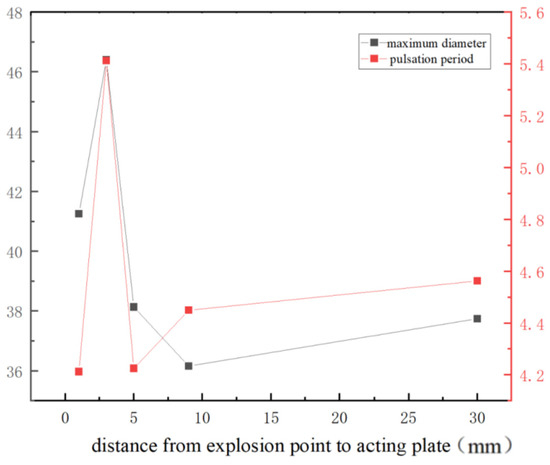
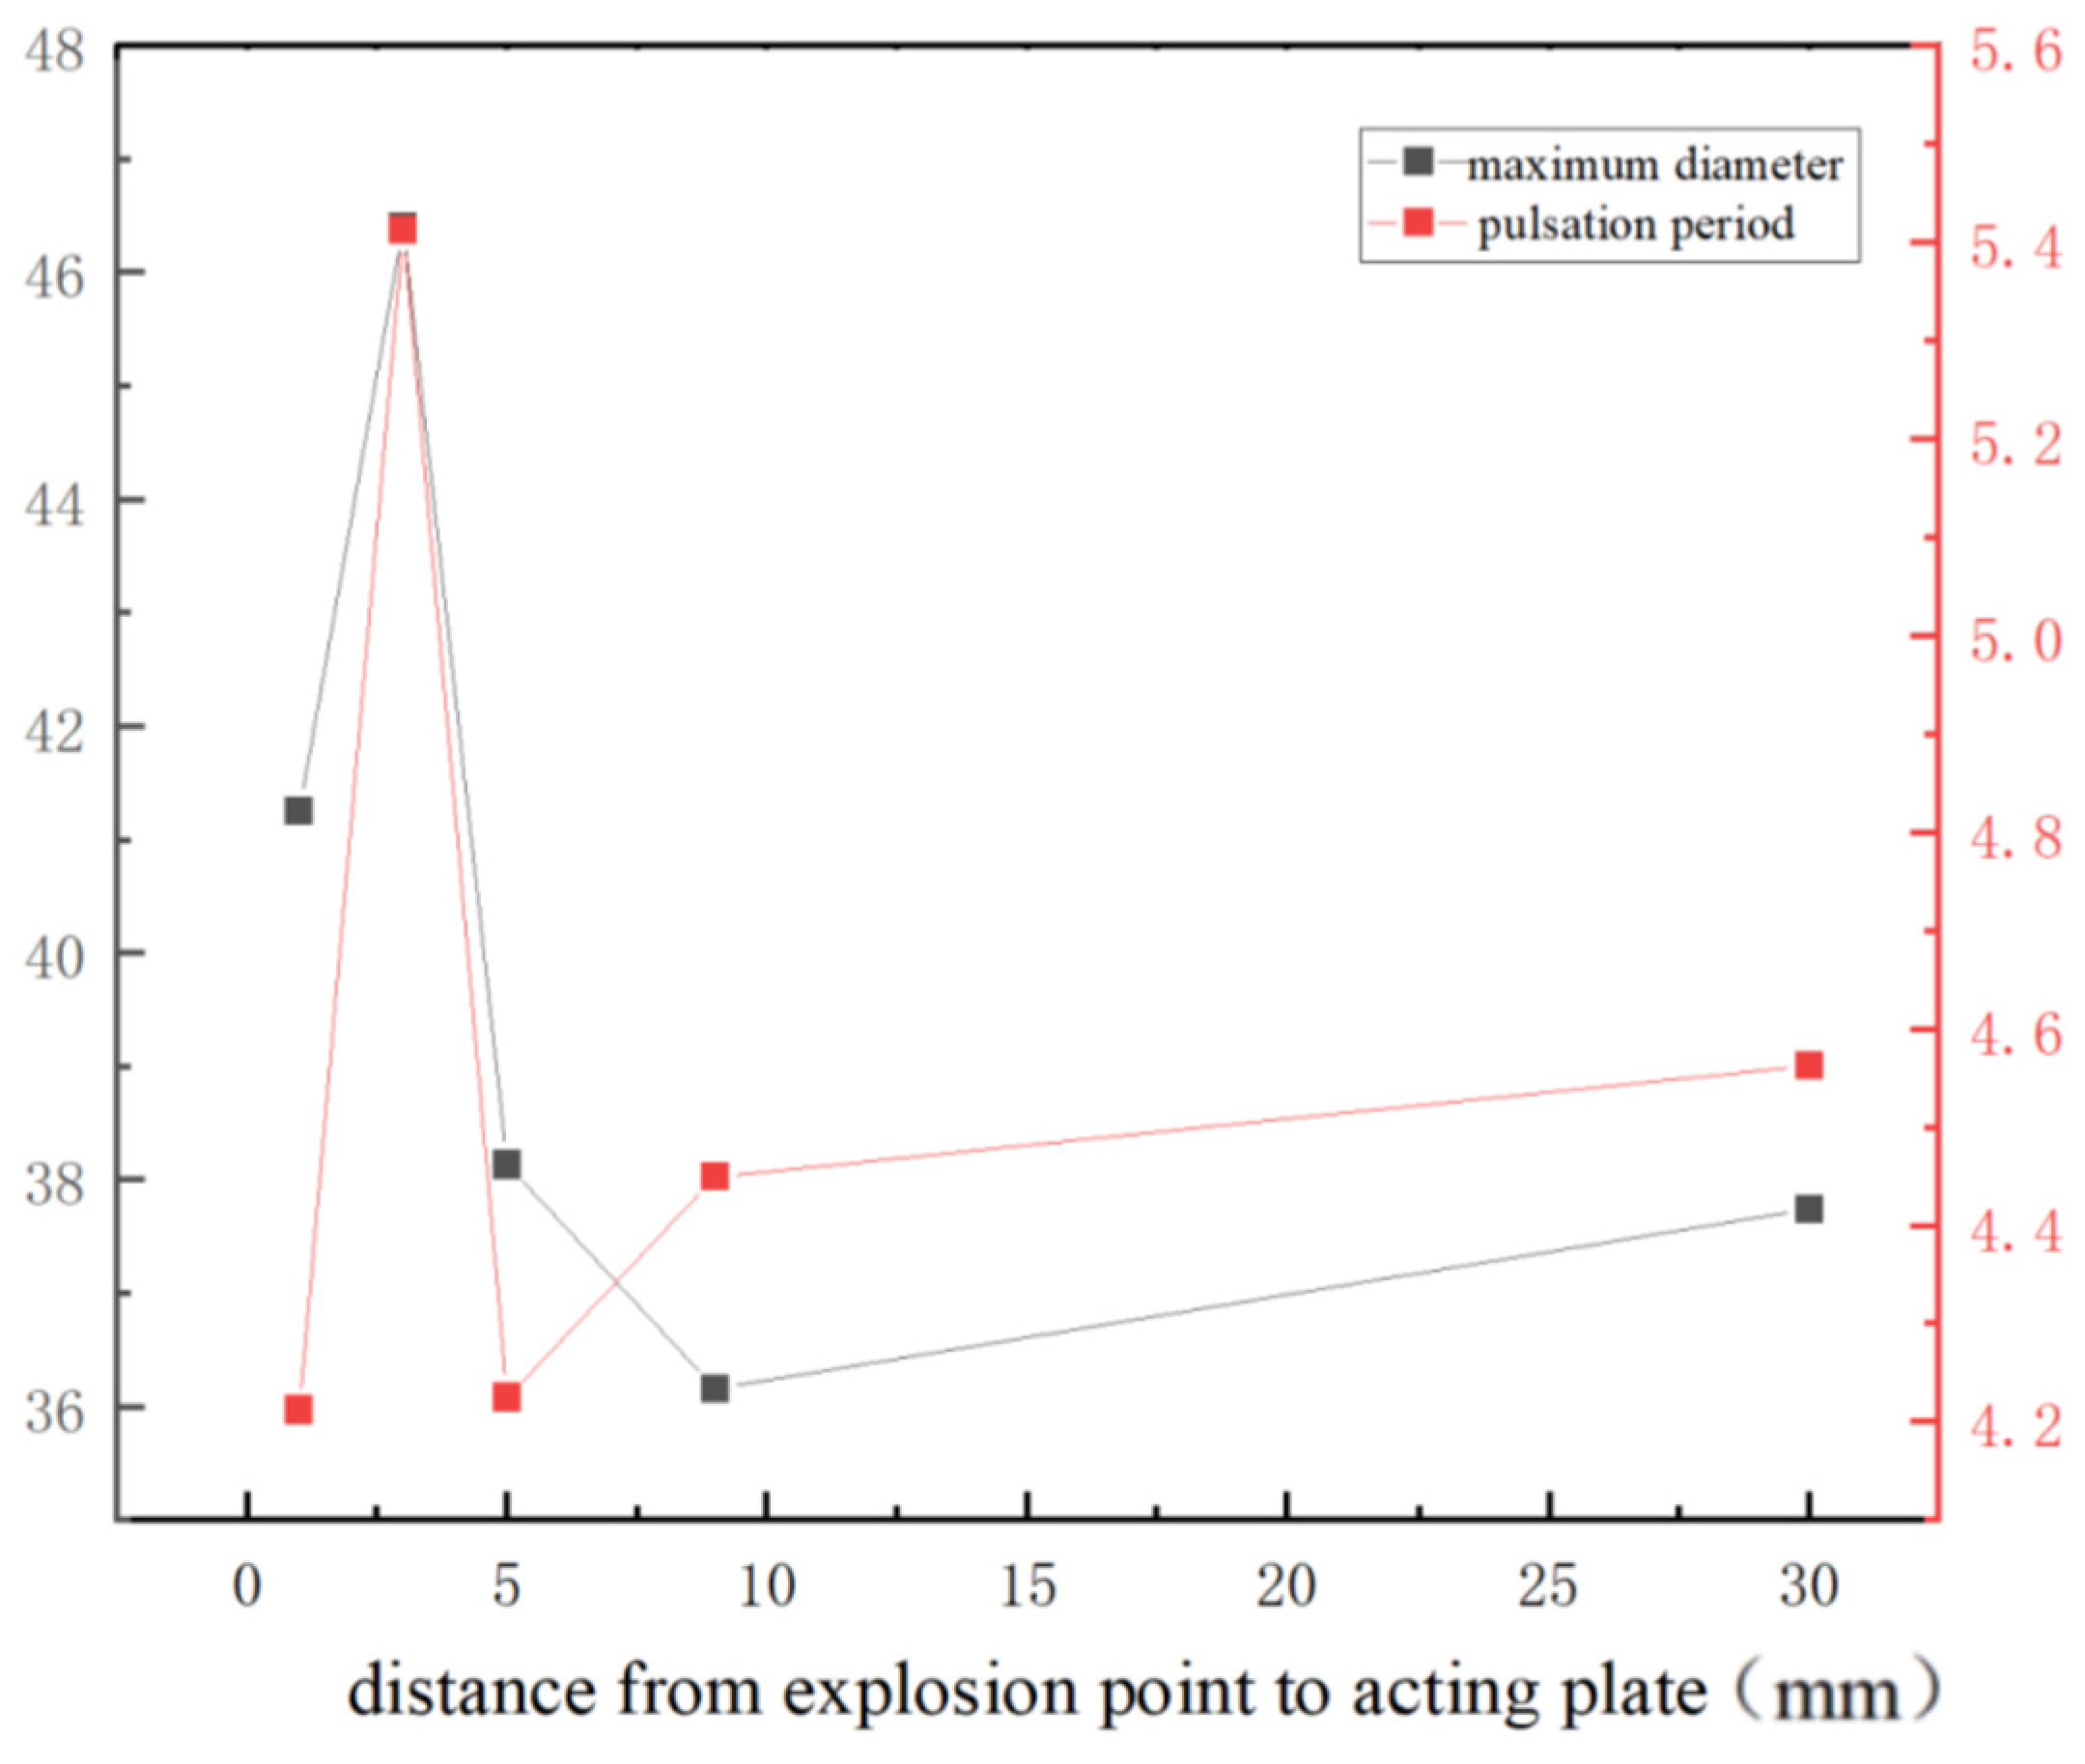
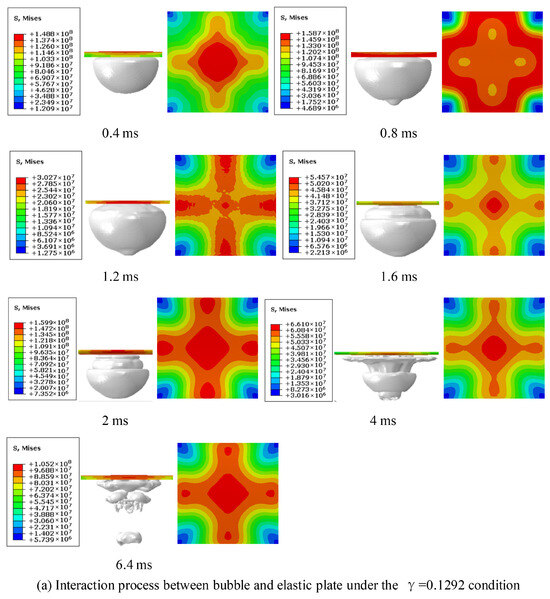
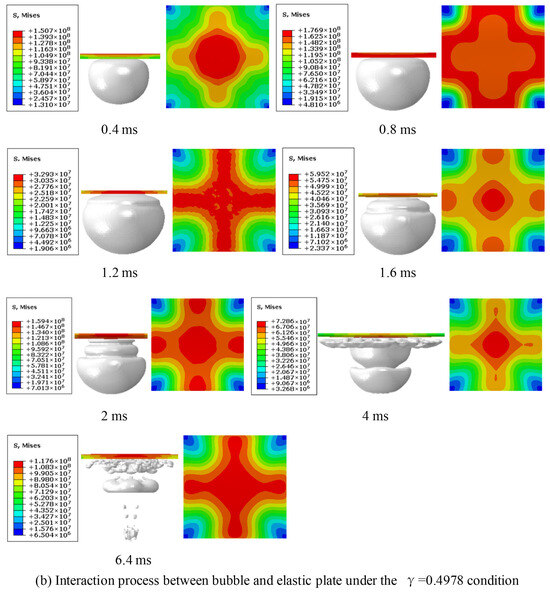
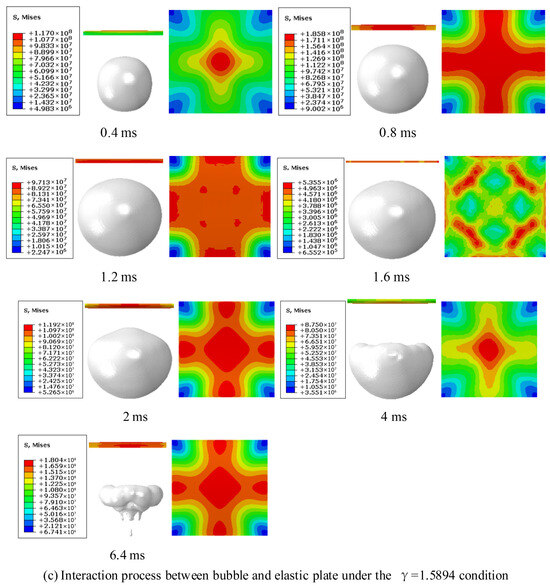
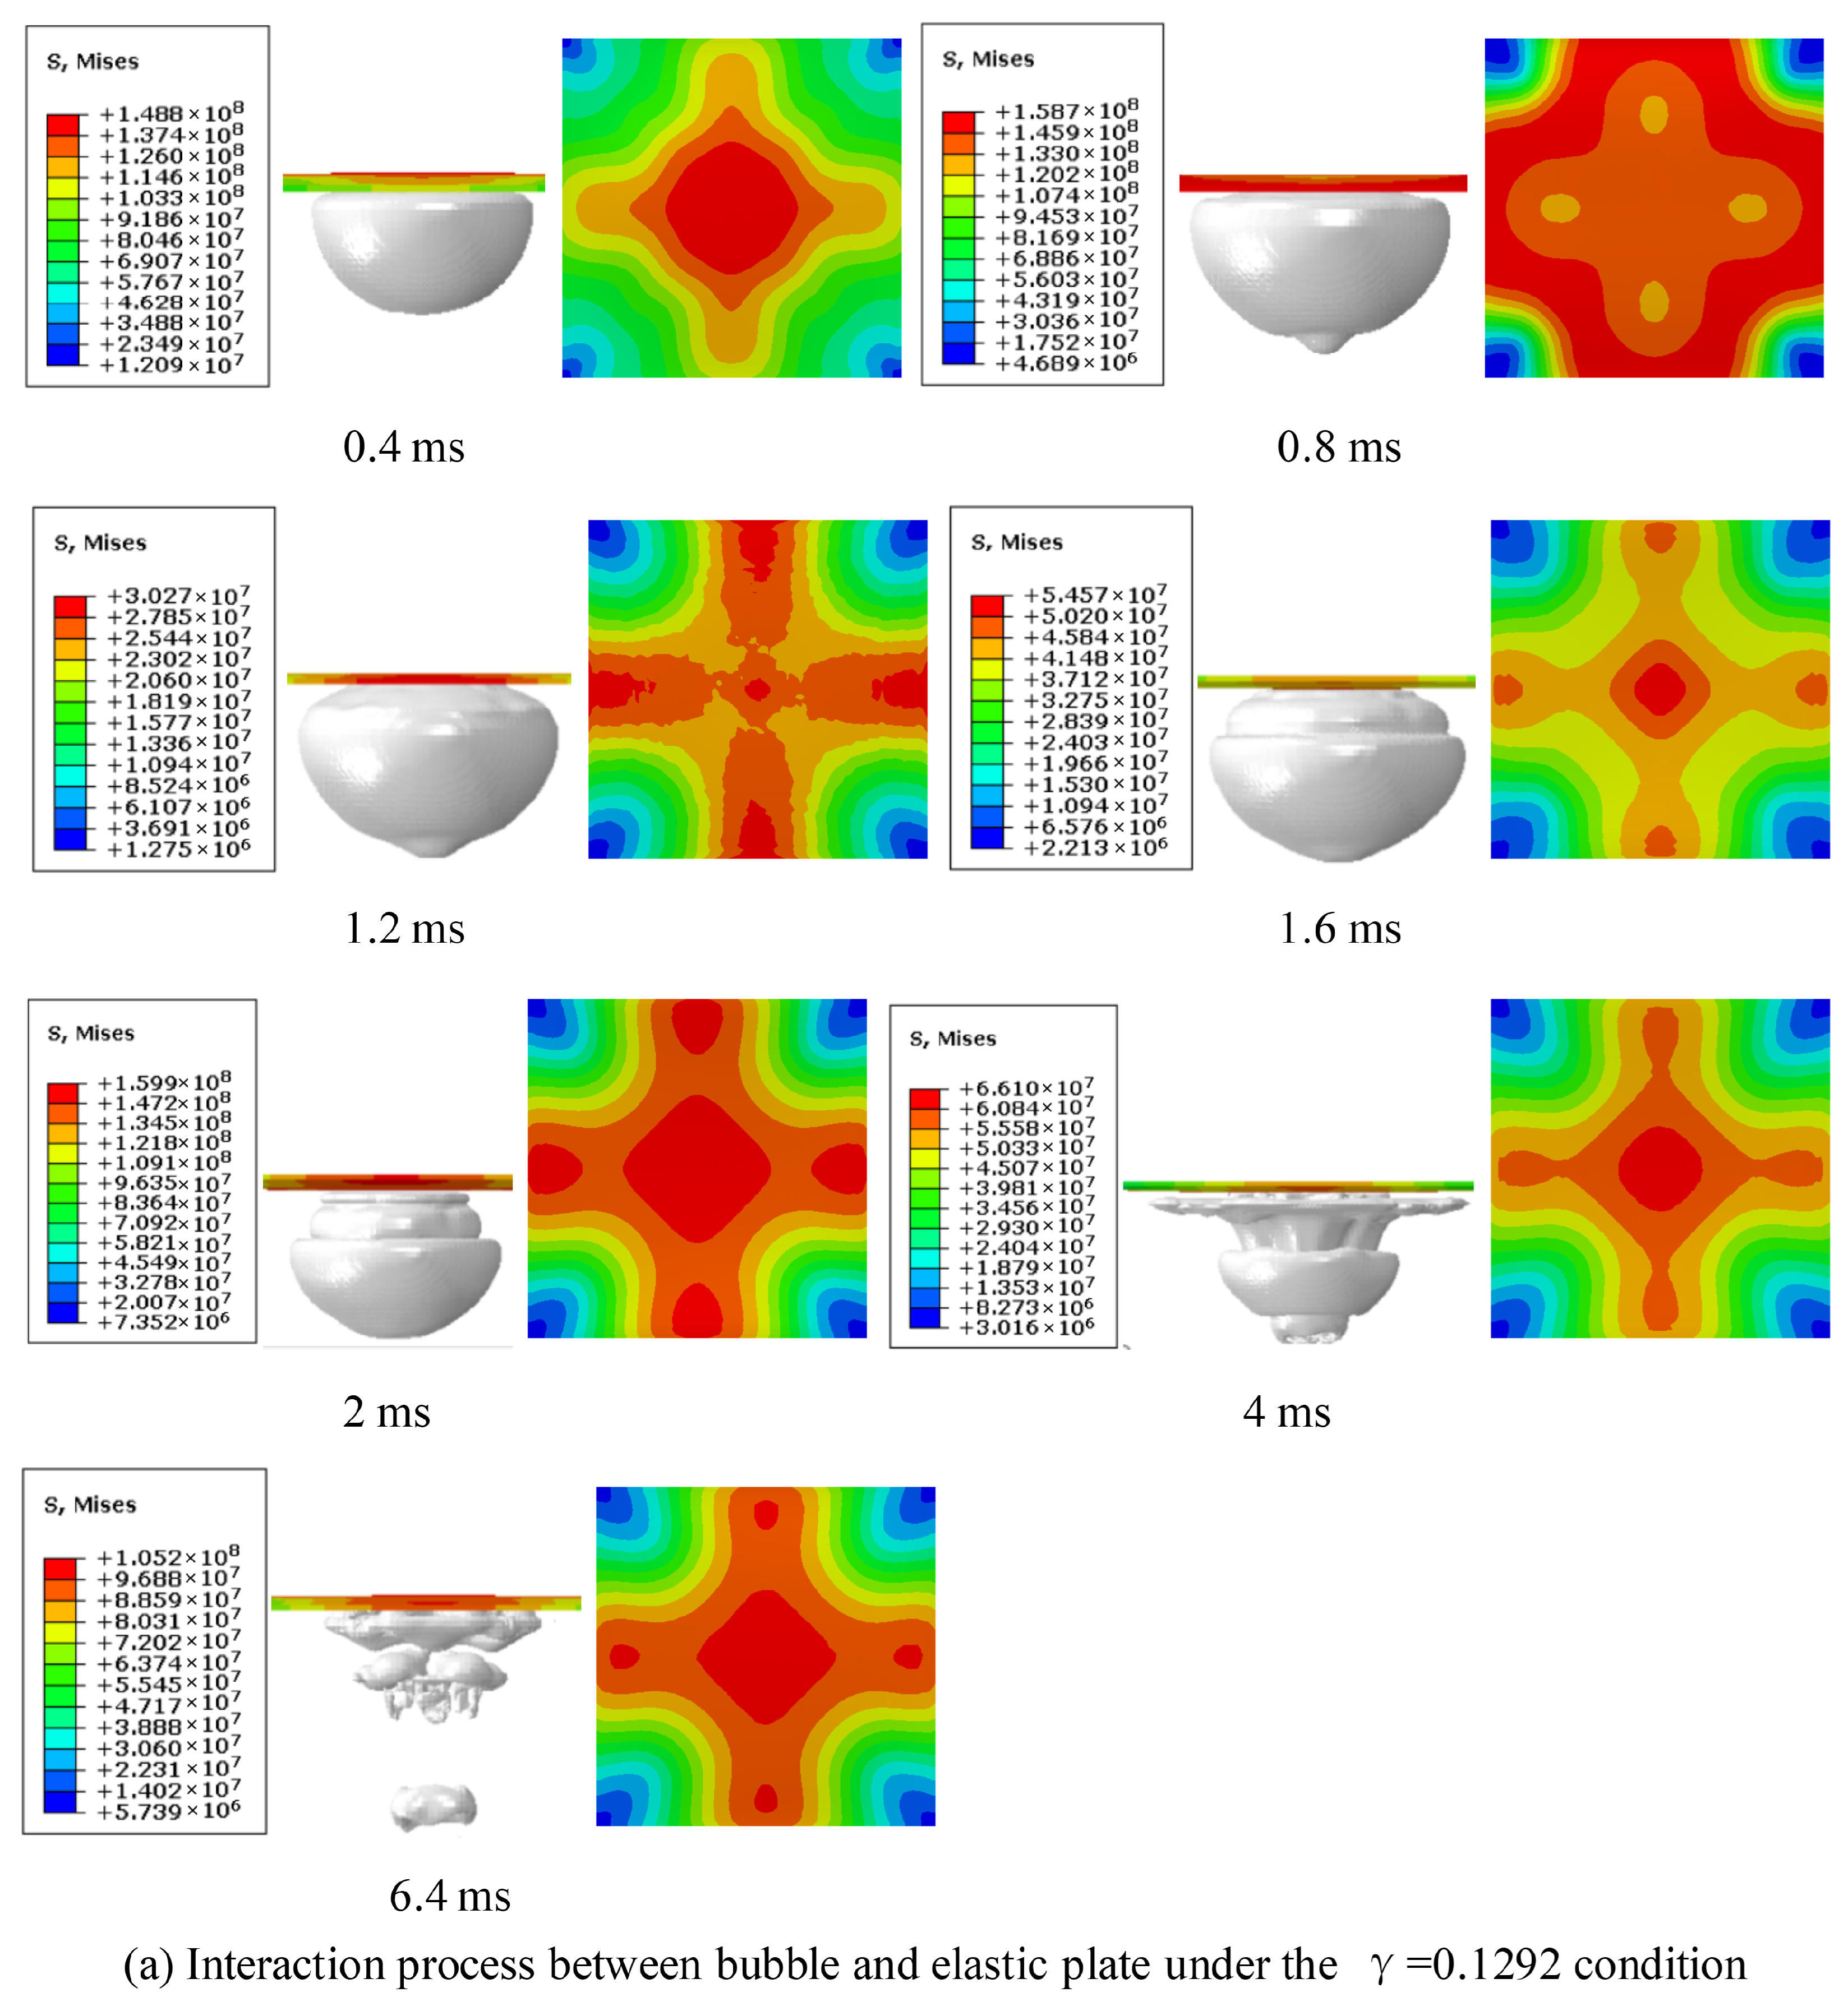
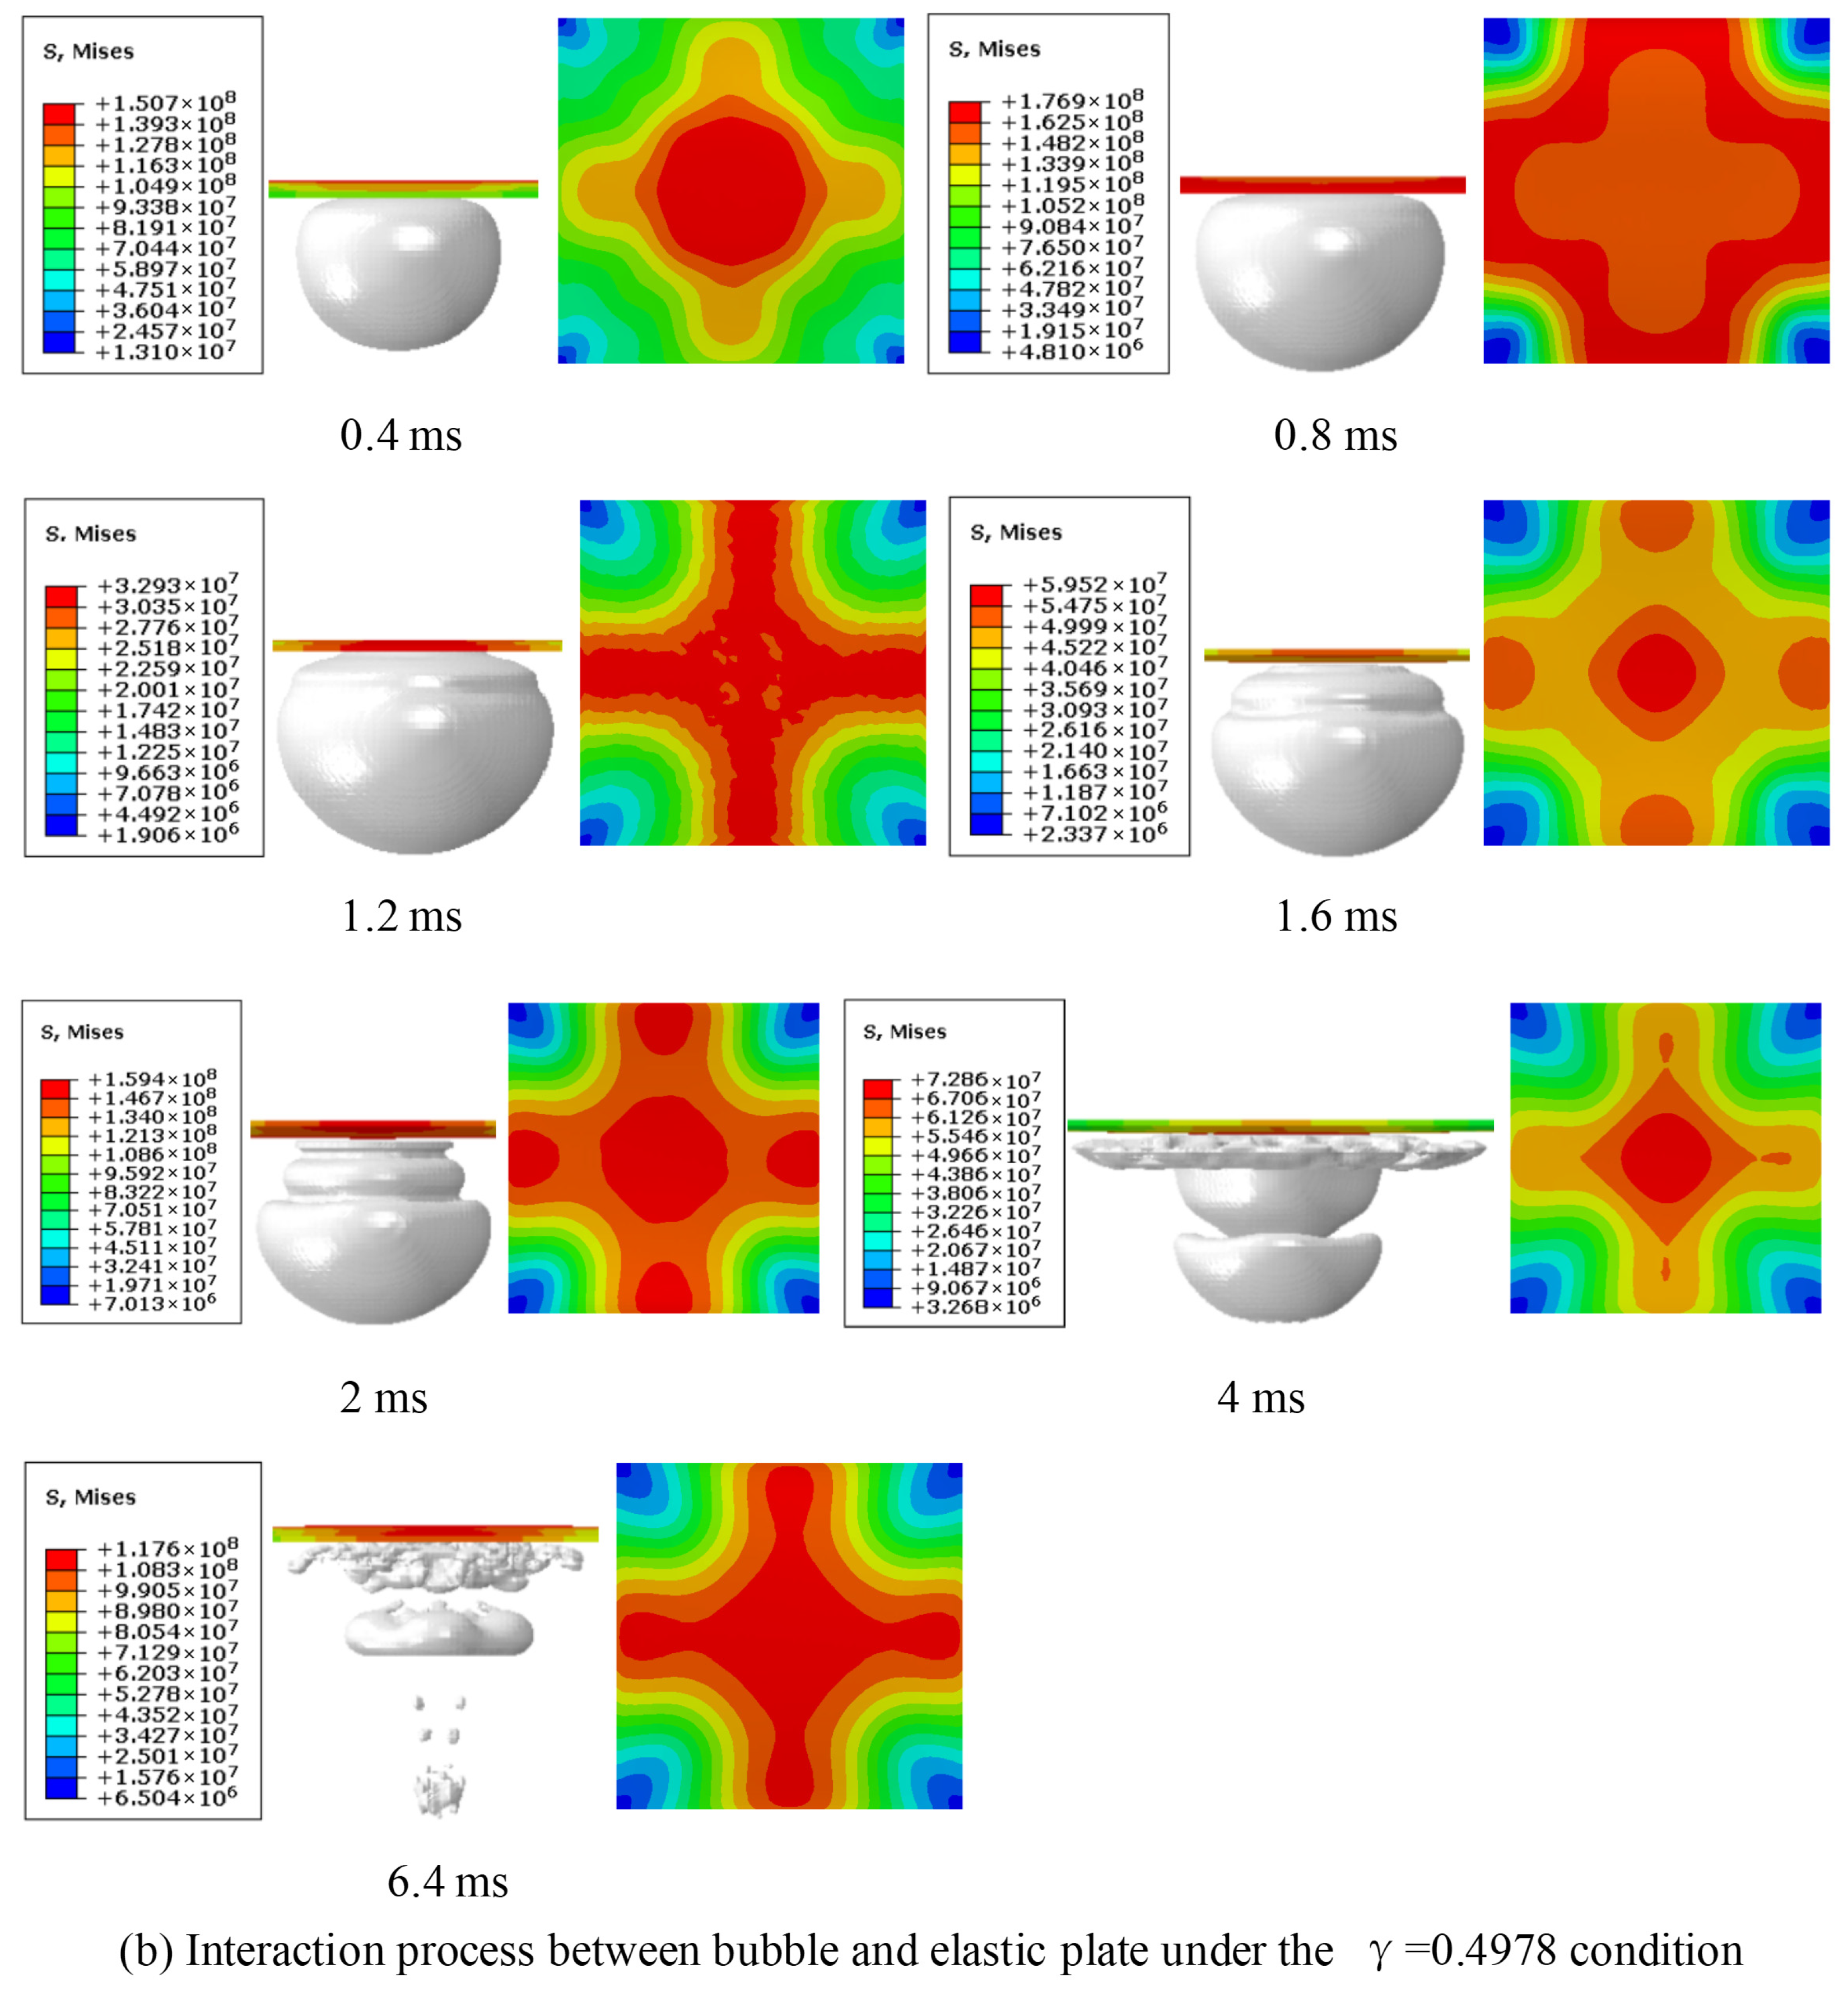
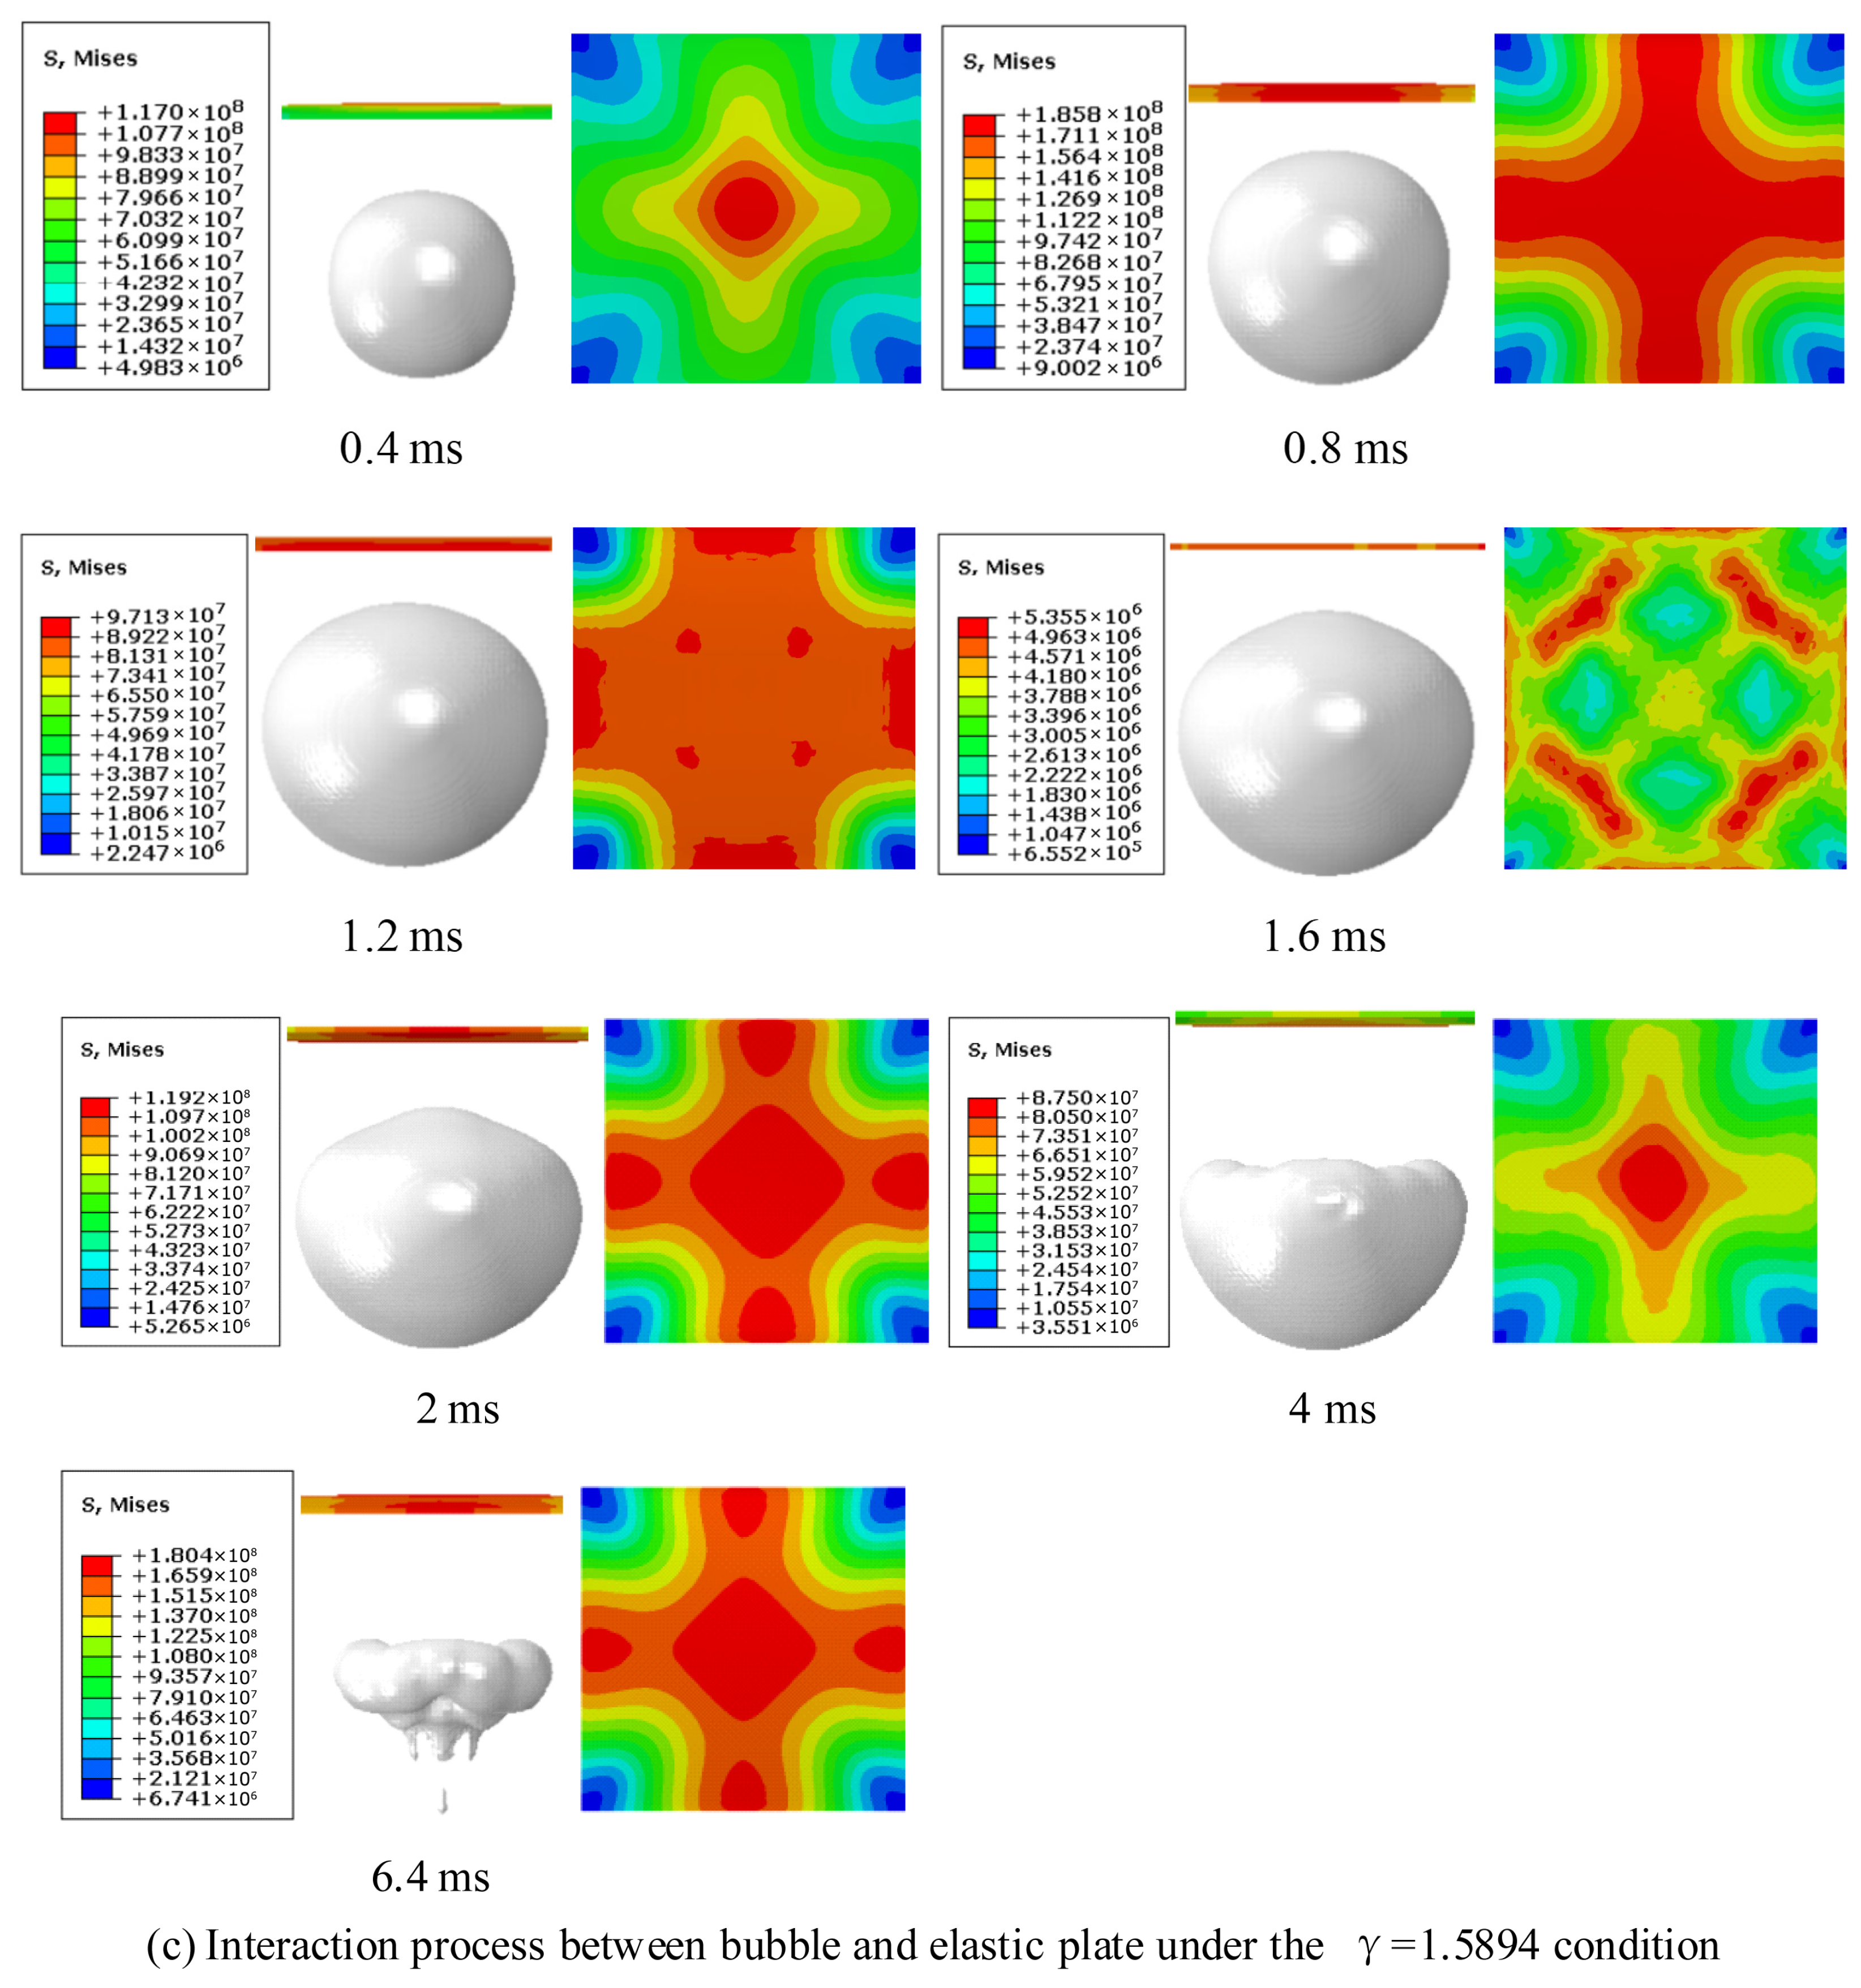
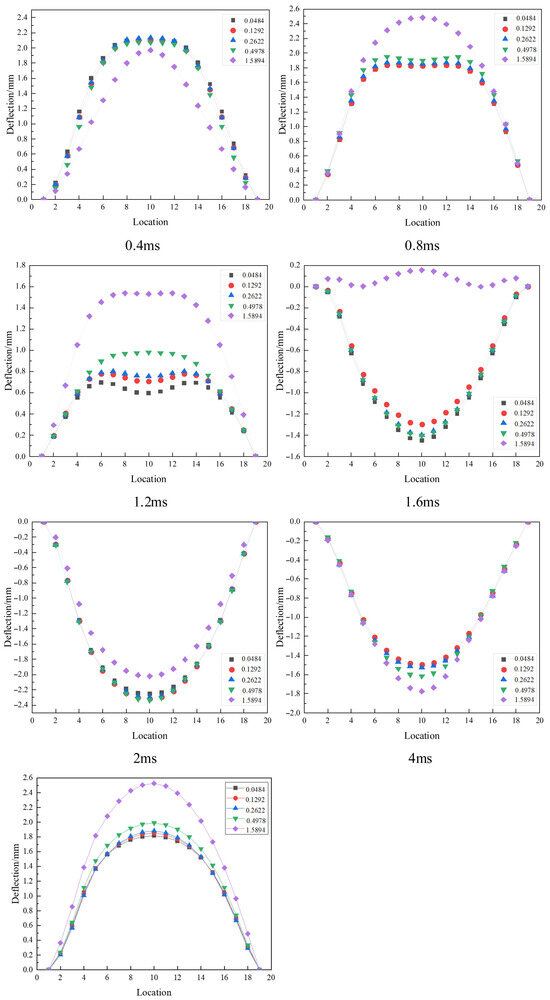
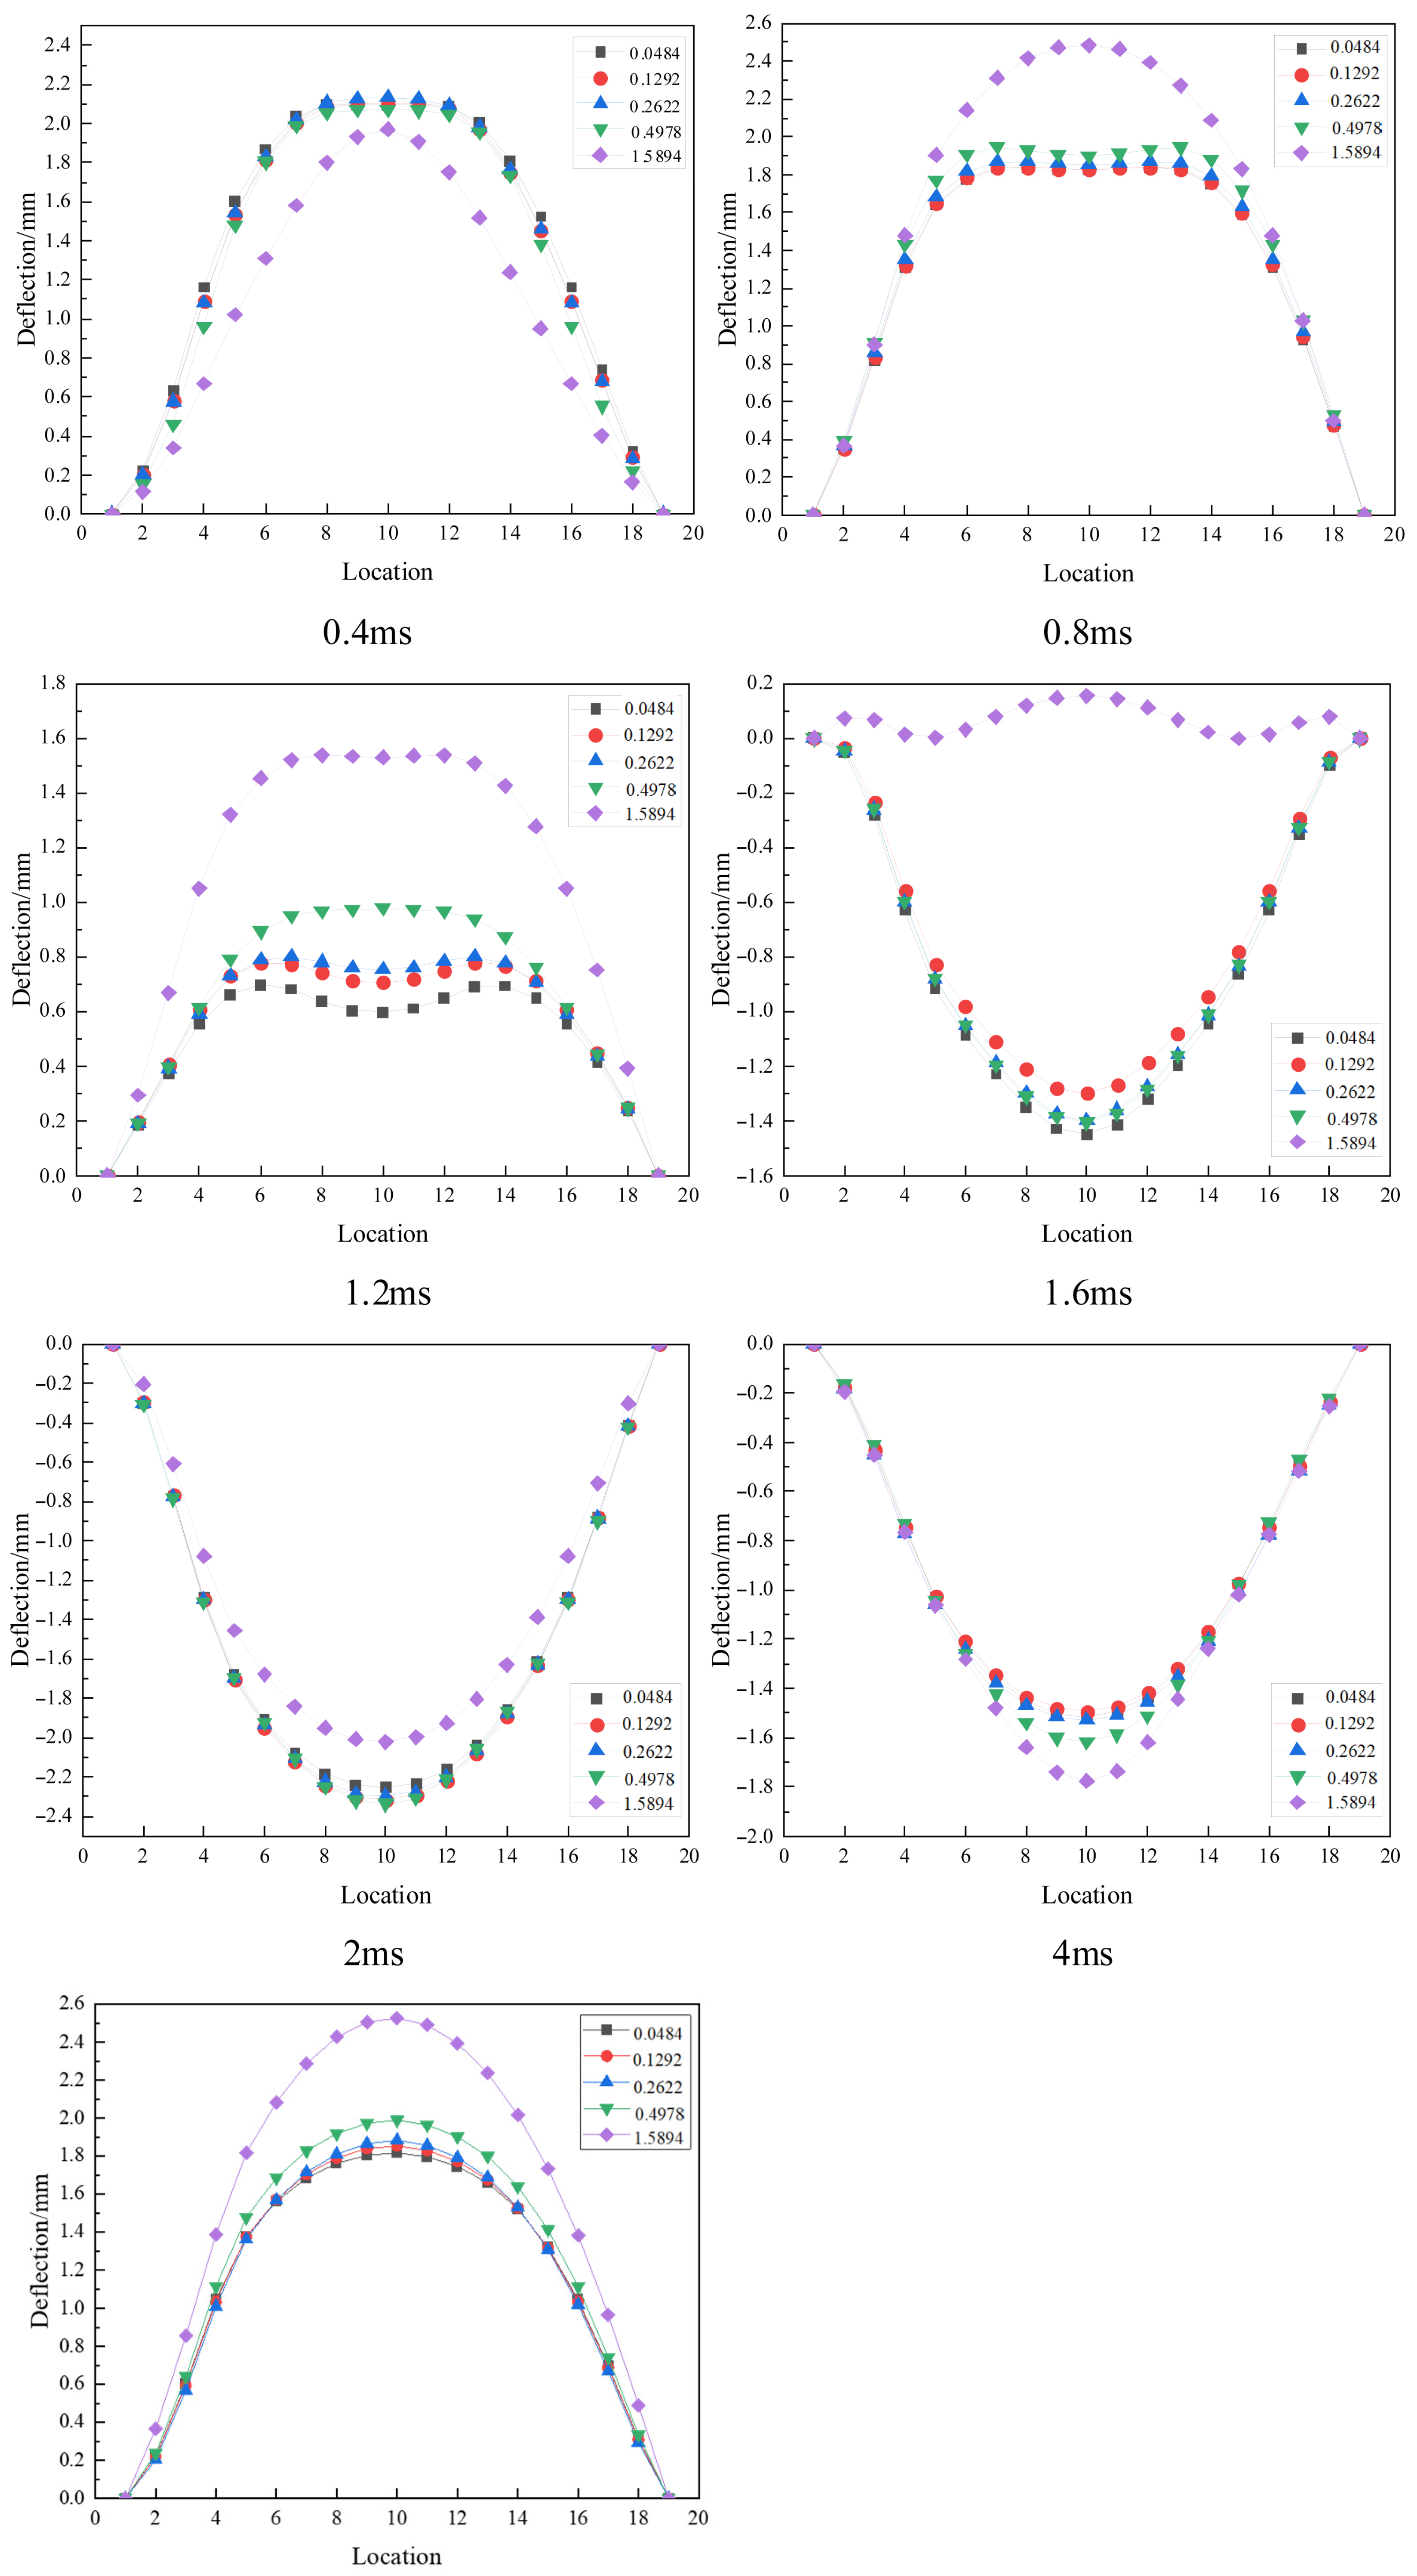
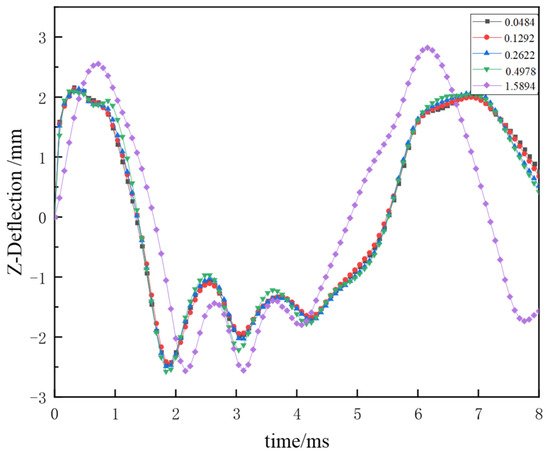
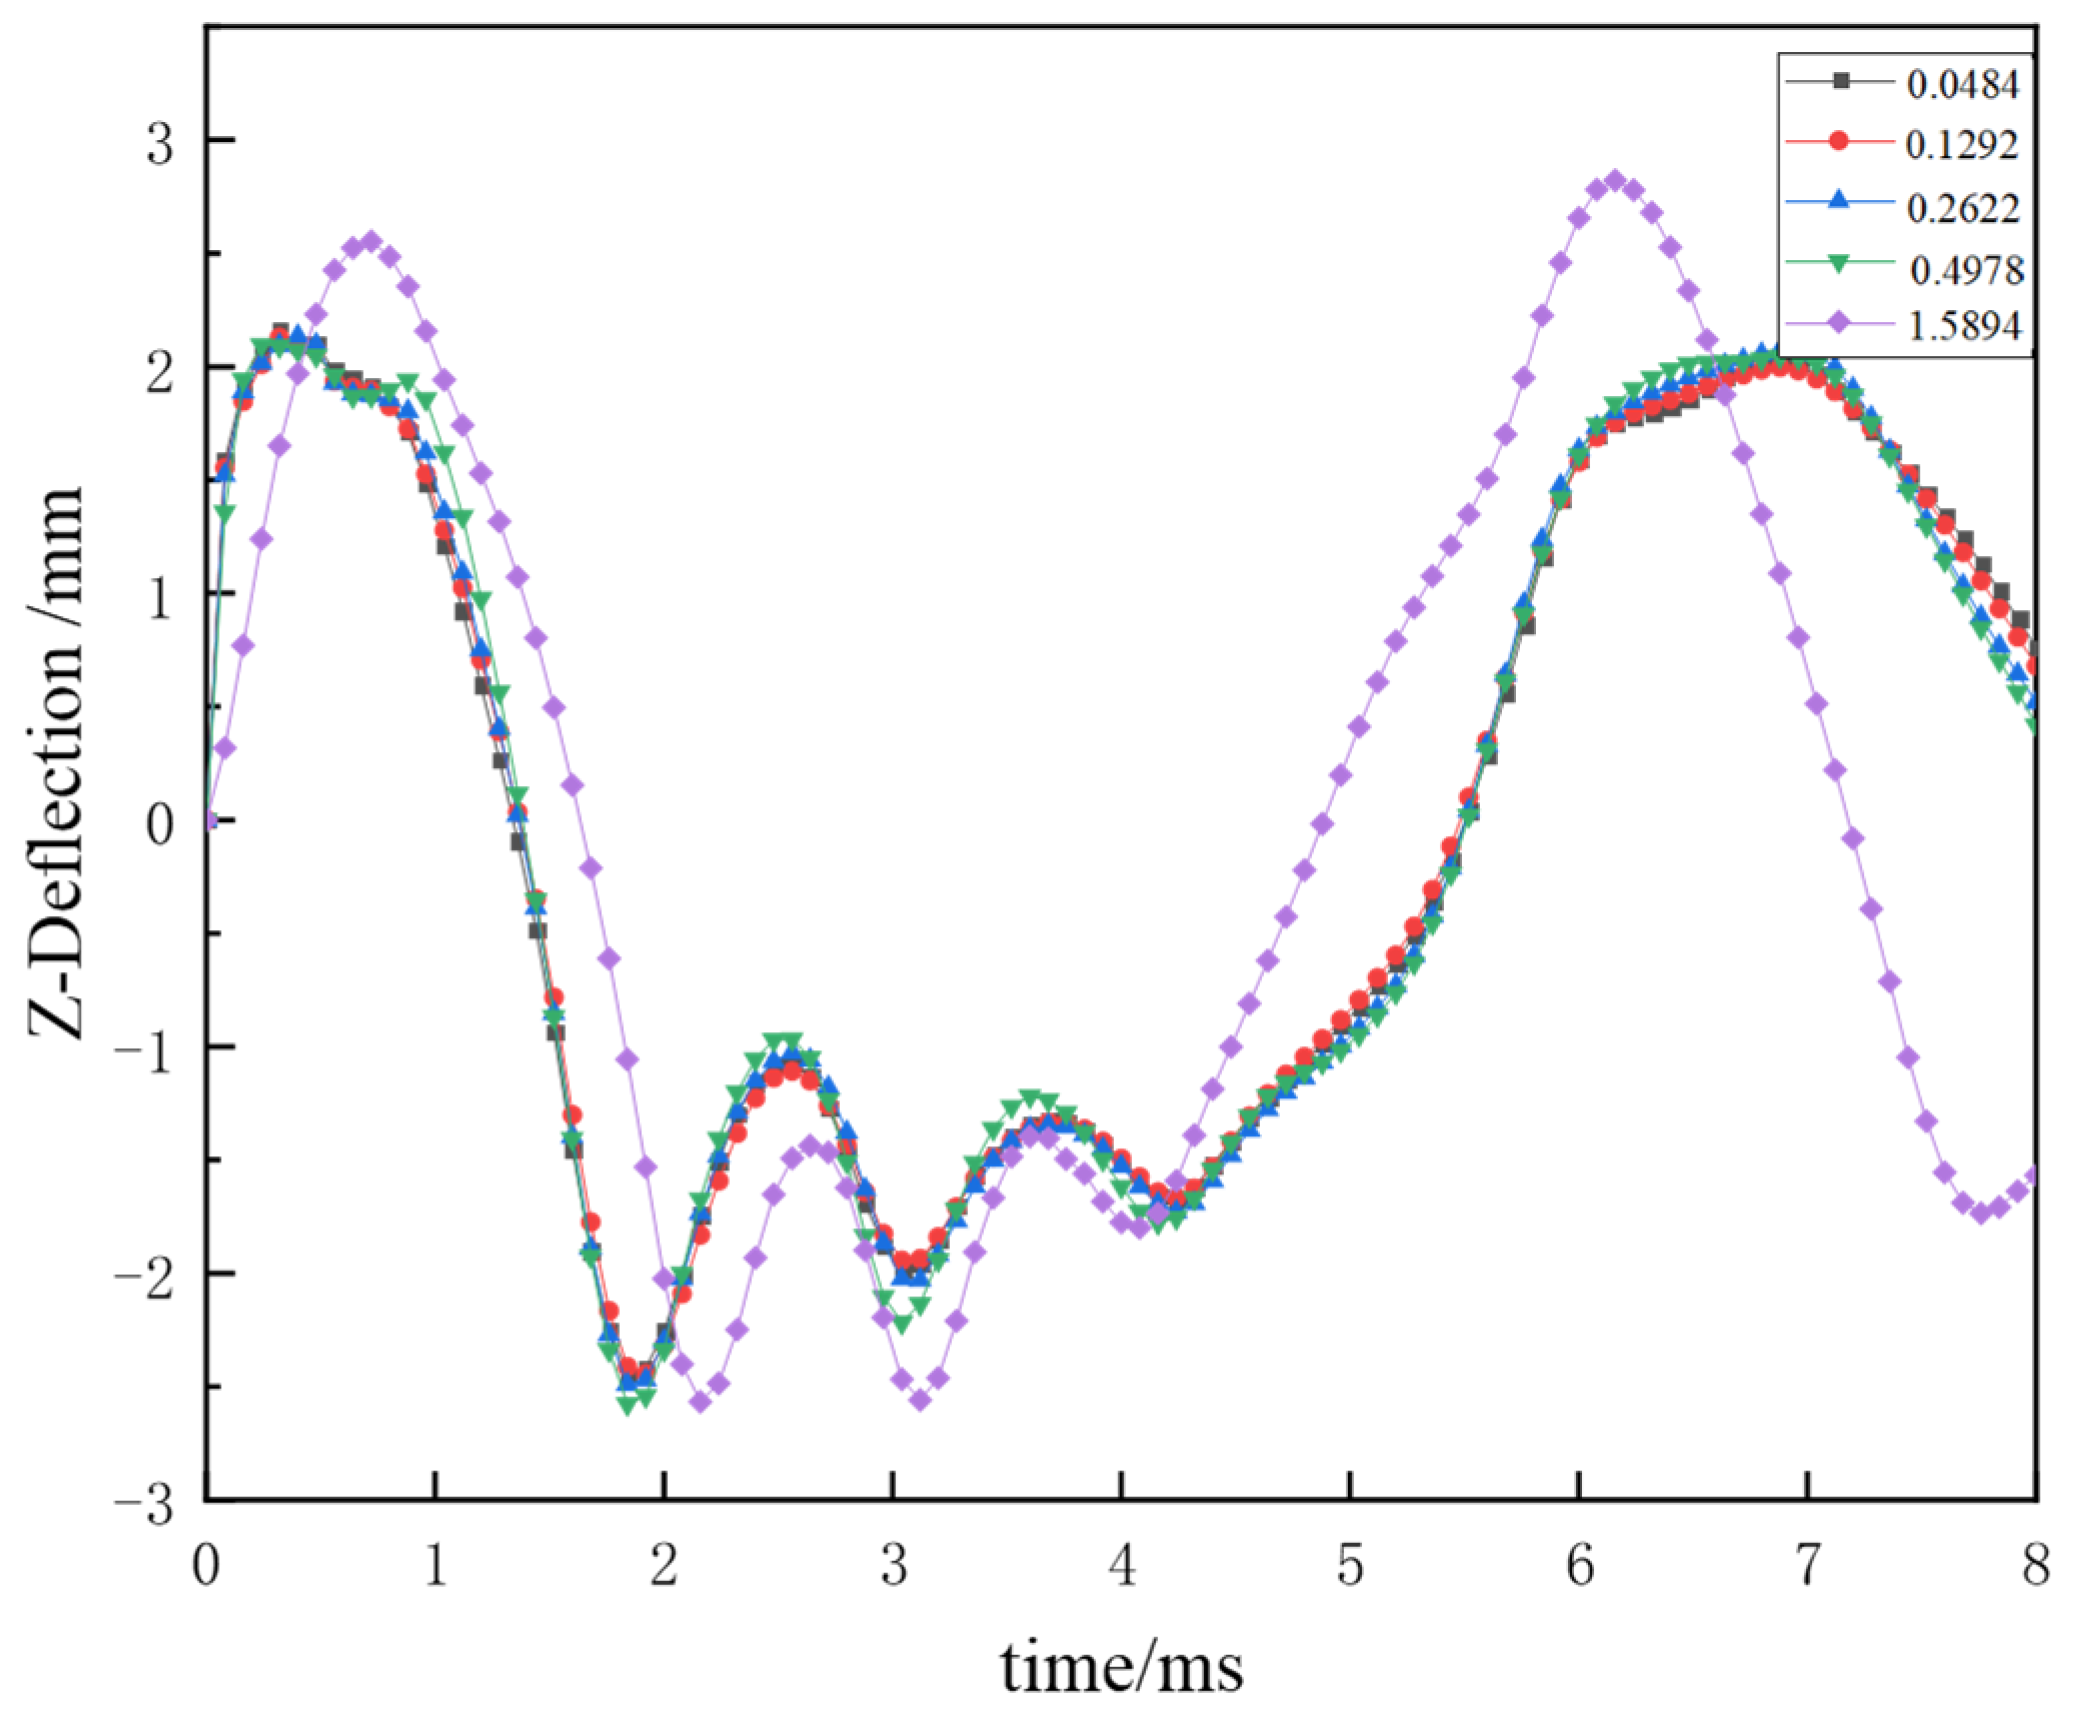
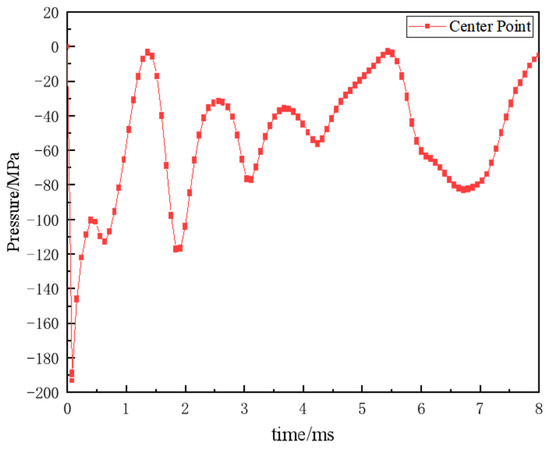
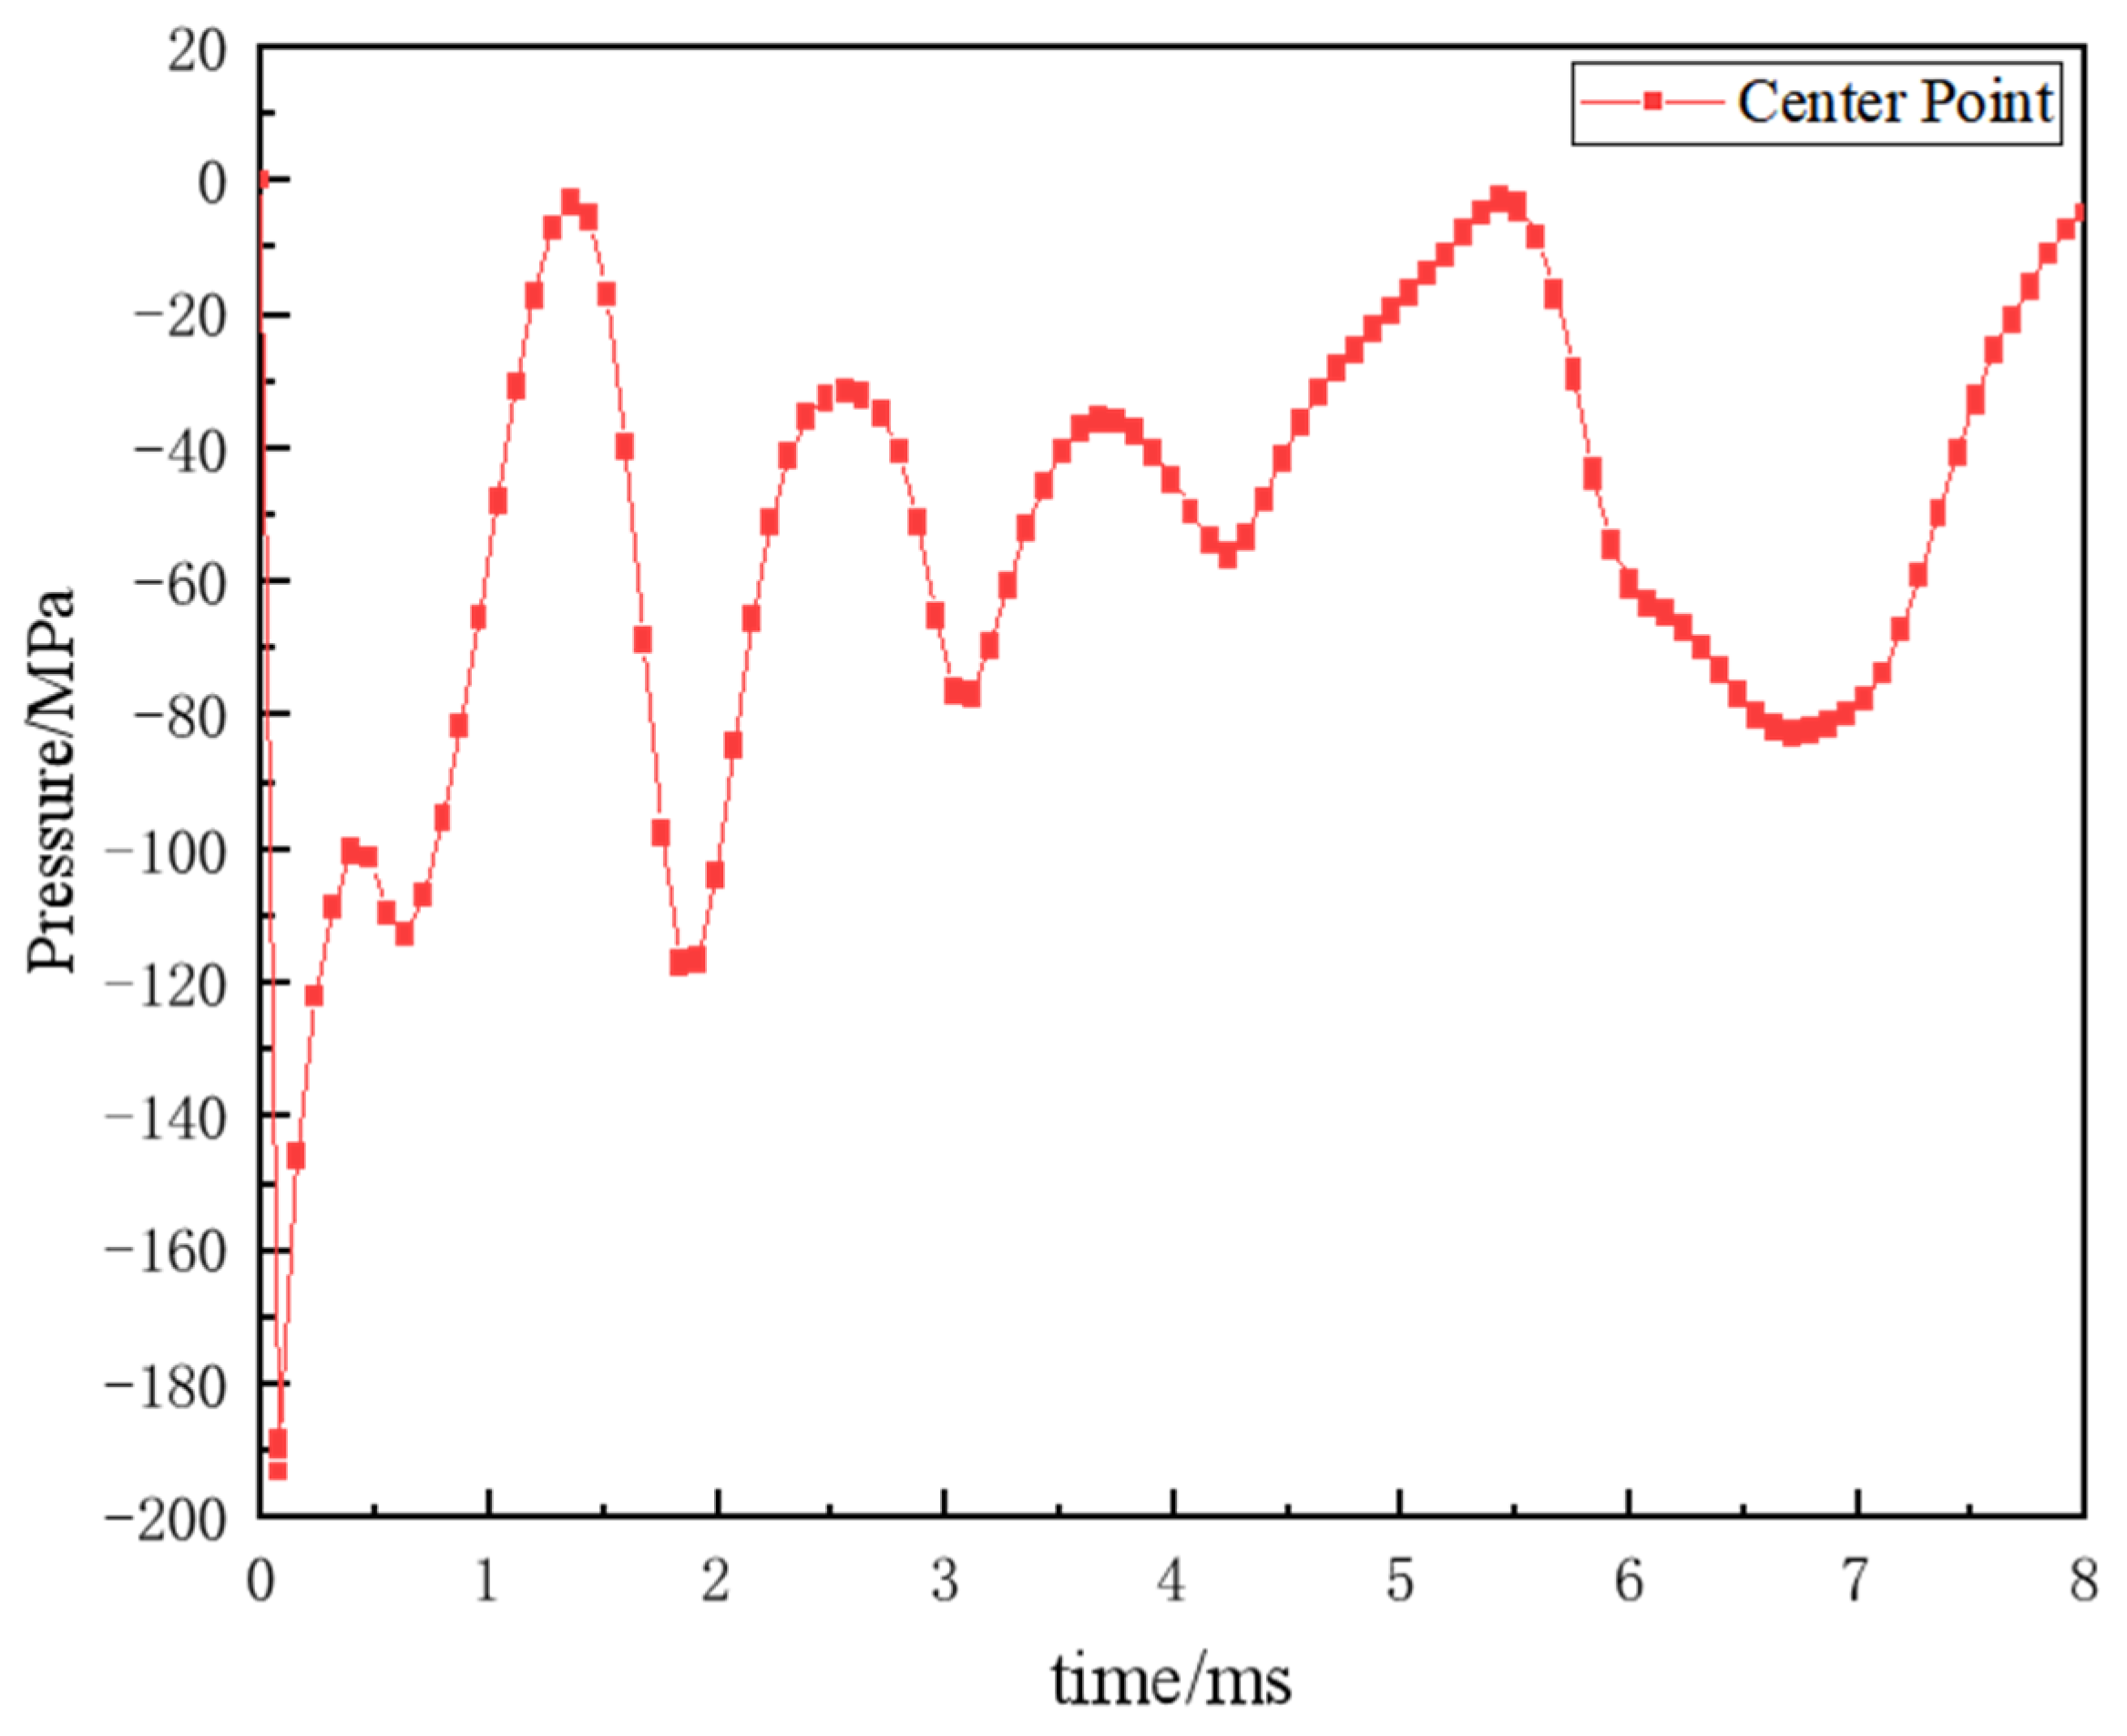



Disclaimer/Publisher’s Note: The statements, opinions and data contained in all publications are solely those of the individual author(s) and contributor(s) and not of MDPI and/or the editor(s). MDPI and/or the editor(s) disclaim responsibility for any injury to people or property resulting from any ideas, methods, instructions or products referred to in the content. |
© 2026 by the authors. Licensee MDPI, Basel, Switzerland. This article is an open access article distributed under the terms and conditions of the Creative Commons Attribution (CC BY) license.