


Abstract
Identifying coal fire risk areas is essential for safe production in coal mines. Land Surface Temperature (LST) retrieval and high-temperature anomaly extraction are core techniques for coal fire risk detection. To address the insufficient evaluation of the accuracy of relevant algorithms for arid open-pit mines, this study takes the Xingsheng Open-Pit Coal Mine in Yiwu County, Xinjiang as the research object. Based on Landsat imagery and UAV thermal infrared data, we systematically compared five mainstream LST retrieval algorithms and six high-temperature anomaly extraction algorithms and determined the optimal combination for long-term monitoring. The results indicate that all five algorithms can effectively depict LST spatial distribution under normal temperature conditions. The Jiménez-Muñoz split-window algorithm performs best for small-scale coal fire identification, with a mean absolute error of 3.25 °C and a relative error of 5.53%, and its fitting slope of 0.82 proves superior stability. For high-temperature anomaly extraction methods, the gradient threshold method achieves a 100% overlap rate with actual anomalies and no omission, which is ideal for large-scale surveys; the cluster analysis method balances detection accuracy and economic benefits for pit-scale investigations. Using 52 valid Landsat images from 2013 to 2025, long-term monitoring reveals that high-temperature anomalies are most active in summer, with an average patch area of 5.65 × 10⁵ m2, and weaken sharply in winter. According to the observed spatiotemporal evolution patterns, the dynamic changes in thermal anomalies are inferred to be mainly associated with human mining activities, with coal seam conditions as the secondary influencing factor. This study provides reliable technical references for coal mine safety management and coal fire disaster prevention.
1. Introduction
Coal fires require air and internal or external ignition sources as preconditions and are triggered by the spontaneous combustibility of coal or by human activities [1]. Coal fires are spontaneous combustion and smoldering phenomena that commonly occur in surface-exposed coal seams, underground coal seams, coal gangue piles, and coal storage piles [2,3]. As a widely distributed natural hazard [4,5], coal fires cause serious economic and ecological problems, including resource losses, air pollution, and geological disasters [6,7]. China, which accounts for nearly half of global coal production, has long suffered from coal fire disasters [8]. In particular, some mining areas in Xinjiang, China have become among the most severely affected coal fire regions in the world because of their thick coal seams [9,10], shallow burial depths, and arid climate, representing an urgent need for effective control and remediation. Retrieving Land Surface Temperature (LST) over large areas and delineating temperature anomalies are necessary prerequisites for coal fire control. However, existing studies lack sufficient accuracy and reliability in assessing LST retrieval algorithms and temperature anomaly delineation algorithms for arid regions, creating prominent obstacles to coal fire investigation and treatment.
The traditional methods of coal fire detection include field investigation, drilling, and geophysical and geochemical exploration [8,11]. These approaches are easy to implement and can deliver accurate and direct data, so they are still widely used [12,13]. Nevertheless, these methods require on-site instrument deployment, and their application across large or topographically complex regions incurs high labor and material costs, alongside low operational efficiency. In addition, sparse sampling layouts and limited measurement coverage prevent these techniques from fully capturing the real distribution of coal fires [14,15]. In contrast, remote sensing features non-contact operation and large-area detection capacity. Among various remote sensing techniques, thermal infrared remote sensing stands out as the most intuitive approach for coal fire identification. It converts the radiance signals captured by satellite thermal infrared sensors into actual LST and further delineates coal fire zones by detecting thermal anomalies [16,17]. Currently, the mainstream LST retrieval algorithms consist of Qin Zhihao’s mono-window algorithm [18], the generalized single-channel algorithm [19], the Jiménez-Muñoz split-window algorithm [20], the Offer Rozenstein split-window algorithm [21], and the temperature and emissivity separation algorithm [22]. In recent years, researchers have applied these algorithms to a wide range of coal fire investigation studies [23,24,25,26].
After obtaining LST results, high-temperature anomalies must be identified to delineate target areas for on-site coal fire investigation. Traditional methods delineate high-temperature anomalies through manual visual interpretation, which is inefficient and strongly affected by human factors, making them unsuitable for large-scale coal fire investigations [27]. Algorithms built on numerical statistical analysis derive extraction thresholds from the numerical characteristics of high-temperature anomaly areas, supporting accurate, efficient, semi-automatic or fully automatic extraction of high-temperature anomalies [28]. Current mainstream algorithms include the empirical threshold method [29], the non-fixed threshold method [30], the natural breaks classification method [31], the cluster analysis method [32], the moving window method [28], and the gradient threshold method [33].
LST acquisition and high-temperature anomaly extraction are necessary steps in field investigation and control of coal fires. In practical application, however, the selection of LST retrieval algorithms and high-temperature anomaly extraction algorithms still lacks sufficient scientific support, and evaluation of the accuracy of different algorithms remains incomplete. For temperature retrieval algorithms, most existing studies rely on sparse ground truth values to validate massive raster datasets [15], which reduces the reliability of their evaluation results. For high-temperature anomaly extraction algorithms, current research mainly focuses on improving traditional algorithms, developing new methods, and applying algorithms to new types of remote sensing data [30]. Few studies conduct comparative evaluations of accuracy and applicability differences across various algorithms, which limits the practical application of LST anomaly extraction algorithms in routine mine production.
Given this research gap, this study takes the Xingsheng Open-Pit Mine in the Naomaohu mining area, Yiwu County, Xinjiang, China, as the study area, uses Landsat 8/9 OLI/TIRS imagery as the data source, and adopts near-surface UAV thermal infrared observations as the benchmark. On this basis, we conducted grid-by-grid statistical comparisons of LST retrieval accuracy for Qin Zhihao’s mono-window algorithm, the generalized single-channel algorithm, the Jiménez-Muñoz split-window algorithm, the Offer Rozenstein split-window algorithm, and the temperature and emissivity separation algorithm. We then used human-computer interactive interpretation to delineate temperature anomalies from the optimal LST retrieval results and the UAV thermal infrared monitoring results. Using these interpreted anomalies as references, we comprehensively compared six LST anomaly extraction algorithms, including the non-fixed threshold method, the natural breaks classification method, the cluster analysis method, the moving window method, and the gradient threshold method, in terms of indicators such as extracted anomaly area and anomaly count. Finally, we constructed an optimal technical framework integrating LST retrieval with high-temperature anomaly extraction to realize long-term time-series monitoring of LST anomalies within the study area. This study provides a scientific basis for LST retrieval and anomaly extraction in open-pit mining areas, supports coal fire control in open-pit mines, and boosts the safety and operational efficiency of open-pit mining areas.
2. Data and Methods
2.1. Overview of the Study Area
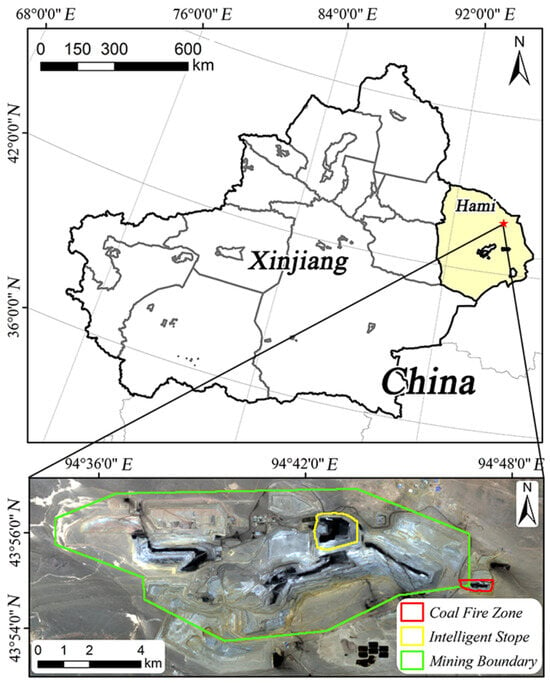
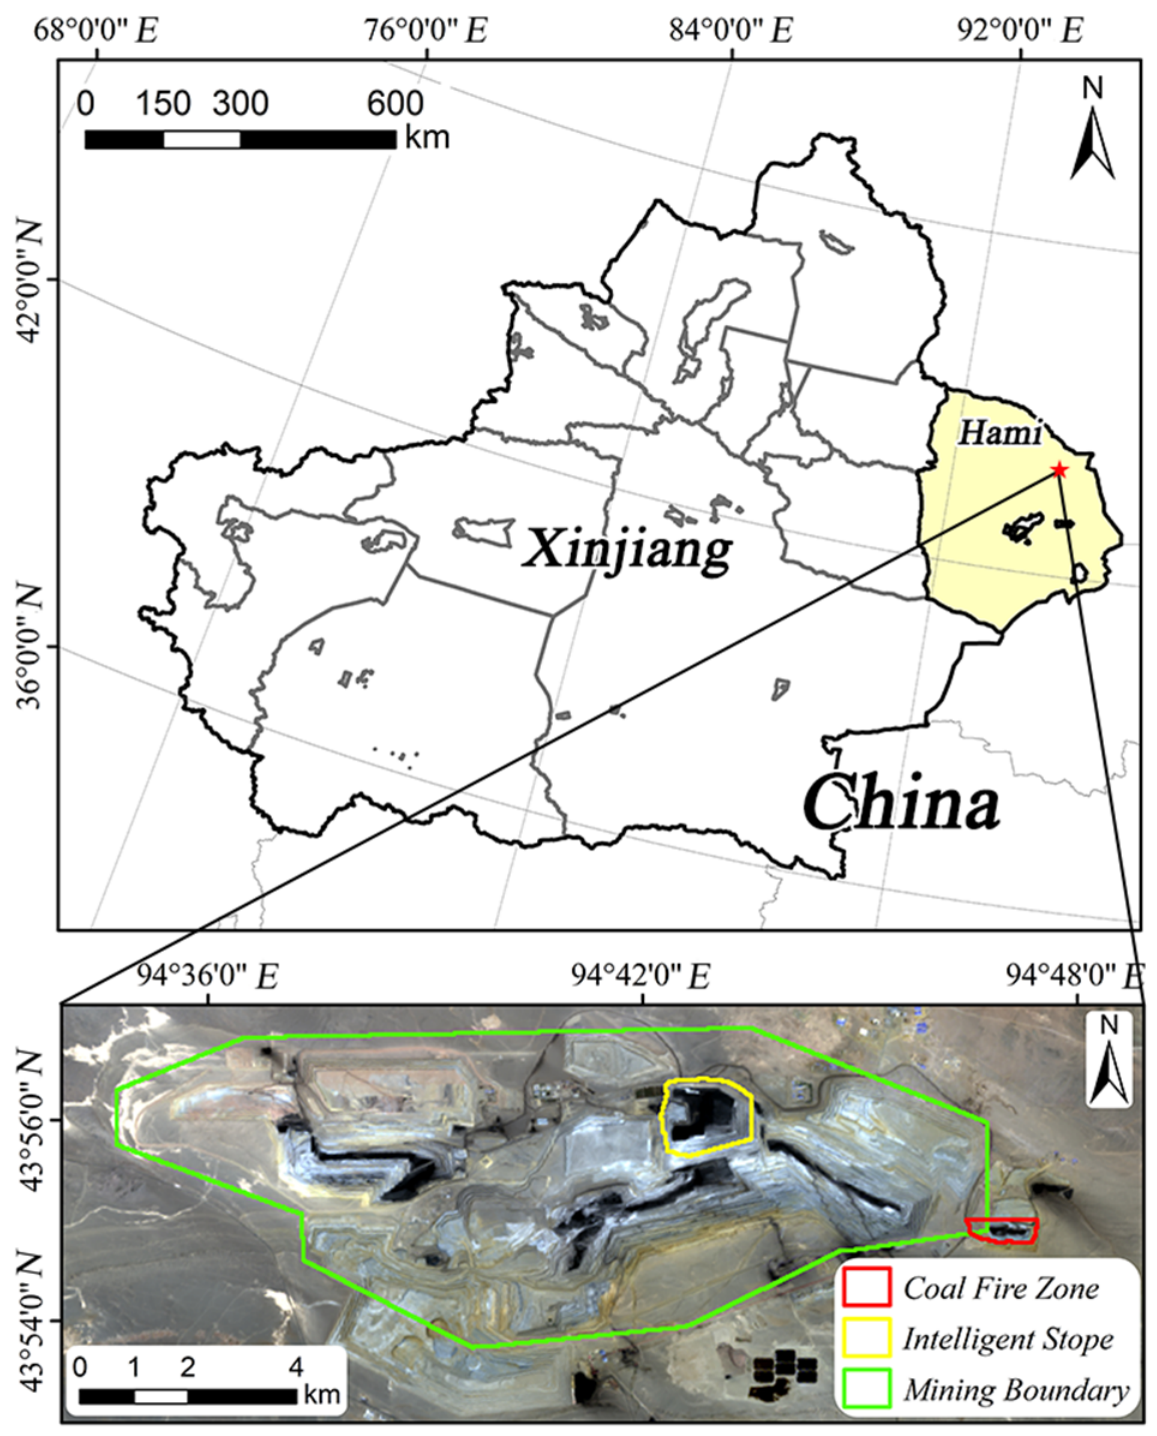
The Jiangna Mining Area of Xingsheng Open-pit Coal Mine in the Naomaohu Mining Area, Yiwu County, Xinjiang Uygur Autonomous Region, is located 30 km northwest of Naomaohu Town, Yiwu County (Figure 1). It covers an area of 32.53 km2 with flat terrain and negligible topographic undulation. Situated in the hinterland of Central Asia, the coal mine is located in a typical temperate continental climate. The annual average temperature is 9.9 °C, and the annual, seasonal, and diurnal temperature variations are extremely dramatic, with a frost-free period of roughly 180 days. The surrounding area of the mining area receives minimal precipitation, with an annual average precipitation of 11.3 mm; the evaporation capacity is 4615.4 mm, far exceeding local rainfall levels. Driven by the arid climate, the regional ecological environment is extremely harsh, with no continuous vegetation cover across the zone [34].
Figure 1.
Location overview of the study area. The red star indicates the study site of this research.
In this study, the intelligent stope within the Jiangna Mining Area and the coal fire disaster area surrounding the Jiangna Mining Area were chosen as the research areas to conduct the application, comparison, and evaluation of temperature retrieval algorithms and high-temperature anomaly extraction algorithms. The intelligent stope is the zone with the most concentrated mining activities, where intelligent driving technology has been adopted in recent years. Localized open fire was detected within this stope on 24 June 2025. The surrounding coal fire disaster area is a legacy coal fire zone subject to key remediation. Coal fires have persisted in this zone since 2021. During the field investigation conducted on 14 June 2025, no open fire was identified, yet abnormal high-temperature areas and dense smoke signatures were detected.
2.2. Introduction of Data Used in the Study
This paper investigates LST inversion and high-temperature anomaly extraction algorithms and adopts two Landsat 8/9 OLI/TIRS images as the data sources. Both images were acquired when the satellite overpassed the study area at local time 10:24. Specifically, Landsat 9 OLI/TIRS data acquired on 15 June 2025 were used to invert the LST of coal fire disaster zones surrounding the mining area, while Landsat 8 OLI/TIRS data obtained on 23 June 2025 were applied to retrieve the LST of the intelligent mining stope.
Raw remote sensing data require a set of preprocessing workflows prior to formal LST inversion, mainly including radiometric calibration, atmospheric correction, and topographic correction. These procedures eliminate errors derived from sensor noise, atmospheric interference, and terrain distortion to retrieve genuine land surface information. The Landsat 8/9 Collection 2 Level 1 TP-grade data used in this study are high-precision preprocessed products fully corrected for terrain using high-accuracy ground control points and digital elevation models (DEMs), including precise geometric correction, radiometric terrain correction, and shadow compensation. For these pre-corrected TP-grade datasets, only radiometric calibration and atmospheric correction are needed for subsequent processing.
Radiometric calibration transforms raw digital pixel values recorded by satellite sensors into physically meaningful spectral radiance, as expressed in Equation (1):
where denotes band spectral radiance (); is the original quantized digital pixel value; stands for the band multiplicative radiometric calibration coefficient; and represents the band additive radiometric calibration coefficient.
Atmospheric correction is applied to eliminate atmospheric interference in remote sensing signals. For the multispectral bands of Landsat 8/9, we adopted the Fast Line-of-sight Atmospheric Analysis of Spectral Hypercubes (FLAASH) model embedded within ENVI software (version 6.1) for atmospheric correction. This physically based radiative transfer model accurately simulates atmospheric effects on band radiance through flexible field parameter configuration.
For Landsat 8/9 thermal infrared bands, atmospheric correction removes signal attenuation induced by atmospheric absorption and atmospheric self-emission to recover genuine surface thermal radiance. We employed the MODTRAN5 radiative transfer model to simulate atmospheric parameters throughout this research. Hourly layered atmospheric profiles (including air temperature, water vapor content, ozone concentration, air pressure, etc.) covering the study area during satellite overpasses were extracted from ERA5 reanalysis datasets to characterize local atmospheric conditions. The atmospheric parameters obtained in this step represent discrete values at individual wavenumbers, while satellite sensors record integrated radiance across all wavenumbers within each band. Thus, the satellite-specific Spectral Response Function (SRF) is applied to integrate discrete atmospheric radiance values for alignment with satellite-measured spectral radiance, as defined in Equation (2):
where is the band-integrated spectral radiance matching satellite observations (); represents discrete spectral radiance at wavelength (); is the spectral response function; and and refer to the minimum and maximum wavelengths of the corresponding satellite band, respectively.
Thermal infrared band atmospheric correction uses the radiative transfer equation to separate atmospheric contributions and retrieve true surface radiance from the total radiance captured by satellite sensors, as shown in Equation (3):
where is the true surface spectral radiance after atmospheric correction (); is the total spectral radiance captured by the satellite sensor (); and represent upwelling and downwelling atmospheric radiance, respectively (); denotes atmospheric transmittance; and is land surface emissivity.
An Autel EVO II DUAL 640T V3 thermal infrared unmanned aerial vehicle (UAV) (Autel Robotics, Shenzhen, China) was used to collect ground truth LST measurements. The UAV’s onboard thermal infrared camera covers a spectral range of 8–14 μm. When running under calibrated ambient temperature and gain modes (−20 °C to 60 °C), the camera delivers temperature readings spanning −20 °C to 150 °C with a relative measurement error of ±3%. All UAV surveys conducted in this study were carried out at a fixed altitude of 200 m, with zigzag flight trajectories automatically generated by the device’s proprietary control software. Field measurements for the coal fire disaster zone were taken from 06:00 to 08:00 on 15 June 2025, while in situ LST data covering the intelligent stope were collected between 09:30 and 10:30 on 23 June 2025.
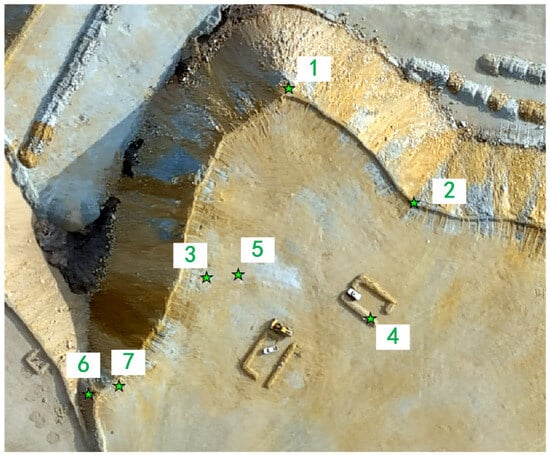
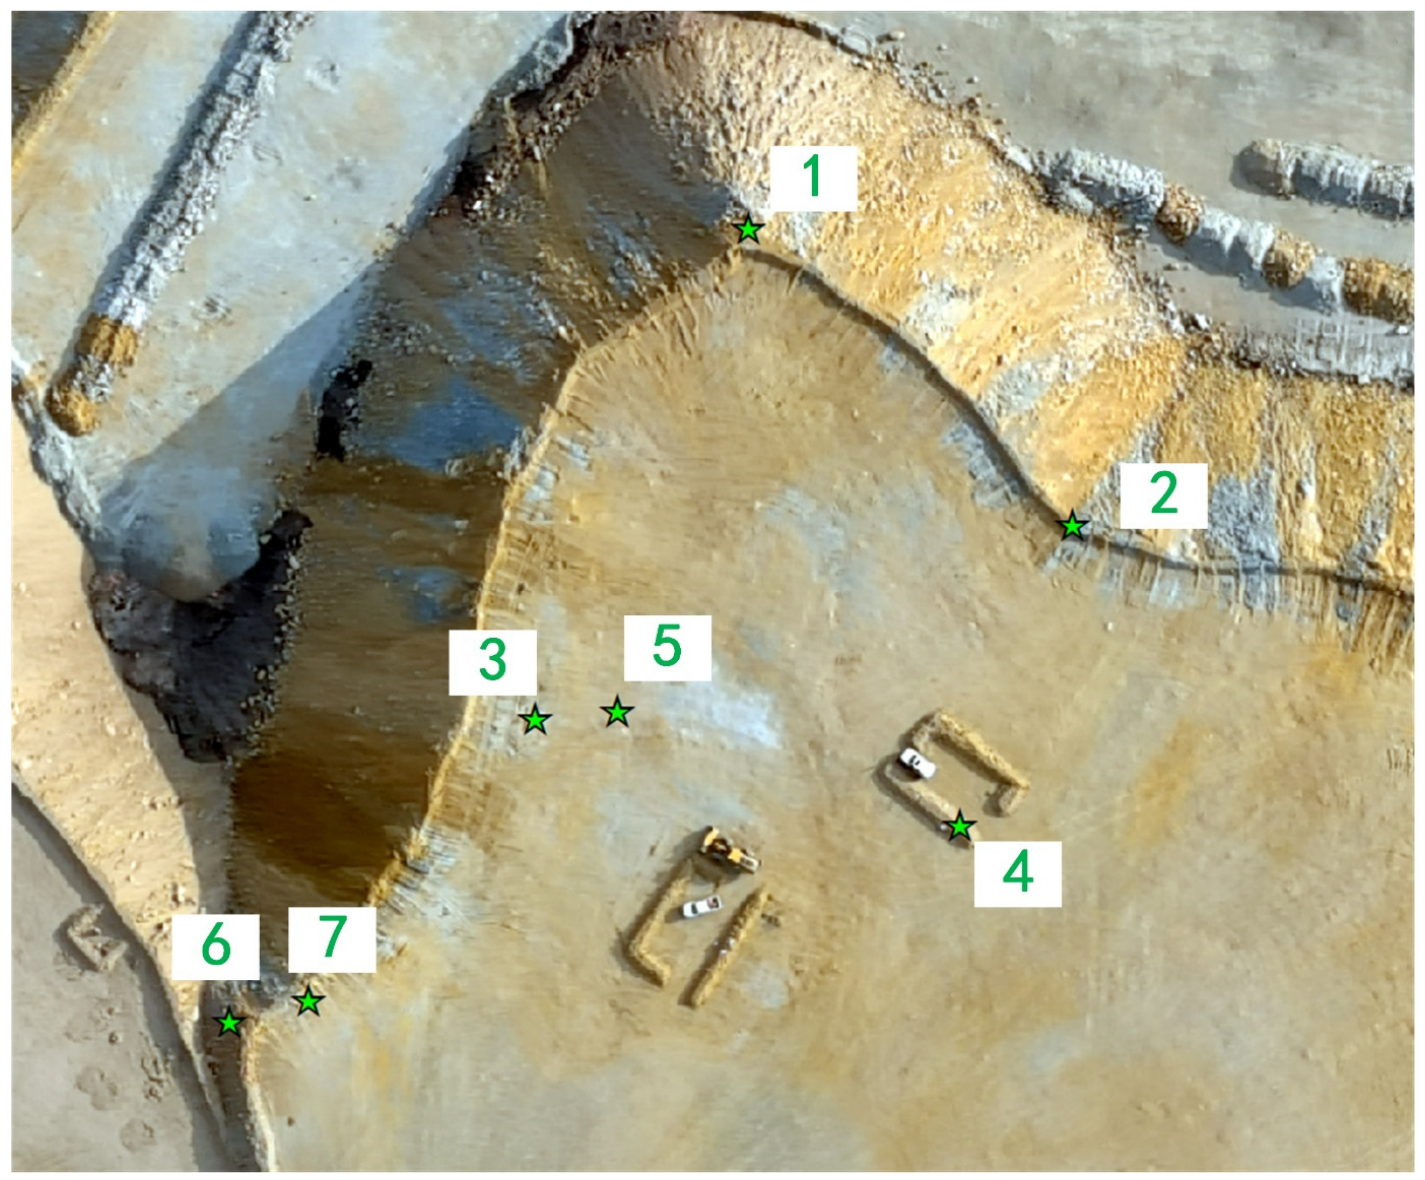
Before LST data collection, we manually verified the UAV temperature measurement accuracy across typical coal fire subareas with obvious temperature gradients within the study area; these zones were defined as validation plots. Seven validation sampling points were laid out across these zones, as shown in Figure 2. The selected sampling points covered sunlit surfaces under direct solar irradiation conditions and shaded surfaces with weak solar radiation, fully capturing low-, medium-, and high-temperature ground conditions across the study area. Midway through each UAV flight over the experimental area, synchronous temperature readings were collected with a handheld thermal infrared thermometer to conduct cross-comparison against UAV-derived thermal data. Detailed validation results are summarized in Table 1. Statistical analysis reveals that the mean absolute error and relative error of temperature measurements at the seven validation points reach only 0.69 °C and 2.31%, respectively. These statistical results fully verify that using UAV thermal measurement data as the ground truth reference dataset for this study is both reliable and feasible.
Figure 2.
Location map of temperature verification points. The green stars denote the verification points, and the numbers adjacent to each star are the corresponding point numbers.
Table 1.
Temperature verification data.
UAV thermal infrared imagery has an original spatial resolution of 0.5 m, leading to a severe scale mismatch with the 30 m resolution of Landsat 8/9 satellite data; direct pixel-wise comparison inevitably generates obvious mixed-pixel errors that degrade the reliability of accuracy assessment. To eliminate accuracy biases induced by mismatched spatial resolutions, this study adopted a reprojection and aggregation workflow taking Landsat grids as the unified spatial reference to achieve scale alignment and precise spatial matching of UAV-derived LST data. Using the coordinate system, grid geometry, and spatial resolution of concurrent satellite imagery as transformation benchmarks, we reprojected the 0.5 m UAV LST dataset to the Landsat grid framework and computed average UAV temperature values inside valid grids through area-weighted averaging. This workflow generated standardized 30 m UAV ground truth LST rasters that were fully consistent with Landsat data in grid layout and spatial coverage. All pixel-wise error calculations and quantitative accuracy assessments for satellite-retrieved LST products were conducted exclusively on the spatially aligned, standardized UAV dataset.
After screening the optimal algorithm through cross-comparison of multiple inversion methods, we built a full satellite-based LST inversion and anomaly extraction workflow. Quarterly Landsat 8/9 remote sensing images spanning 2013–2025 were used to implement long time-series monitoring of high-temperature anomalies throughout the study mining area. Images acquired every April, July, October, and January of the following year (or alternative imagery collected during adjacent periods) were used to represent spring, summer, autumn, and winter, respectively. After discarding unqualified scenes suffering from heavy cloud cover, data corruption, or a large share of invalid pixels, we retained 52 valid image scenes that fully cover the full mining lifecycle of the study site. The complete time-series LST raster datasets derived from these Landsat images are provided in Supplementary Data S1.
2.3. LST Retrieval Algorithms
The physical basis for retrieving LST indirectly from satellite remote sensing lies in continuous thermal infrared radiation emitted by ground objects under thermodynamic equilibrium. Their radiative characteristics strictly comply with Planck’s law, and a fixed quantitative relationship exists between radiant intensity and the absolute temperature of ground objects. The thermal infrared radiation signals captured by satellite sensors are comprehensive responses to surface self-emitted radiation after atmospheric transmission, which is interfered with by atmospheric absorption, scattering, and self-emission. Overall, the core principle of LST retrieval is to establish a mapping relationship between the thermal radiation signals received by sensors and the true surface temperature by quantifying key parameters such as atmospheric effects and land surface emissivity based on the radiative transfer equation.
Planck’s law is a fundamental physical principle quantifying the link between a black body’s spectral radiant exitance and its wavelength and equilibrium temperature, and it also serves as the core theoretical foundation for LST retrieval in thermal infrared remote sensing. As an ideal radiative source, a black body fully absorbs all incident electromagnetic waves and emits outward thermal energy at a fixed absolute temperature, with its radiative properties only dependent on its absolute temperature. The distribution function of radiant energy versus wavelength for an ideal black body is expressed as Equation (4):
where represents the spectral radiant exitance of a black body at the wavelength (μm) and absolute temperature (K); is Planck’s constant, with a value of 6.626 × 10⁻³⁴ J·s; denotes the speed of light in vacuum, equal to 3.0 × 10⁸ m·s−1; is the Boltzmann constant, taking a value of 1.38 × 10⁻²³ J·K−1; and refers to the natural constant of 2.718.
Derived from Planck’s law, the radiative transfer equation quantifies attenuation and amplification of electromagnetic energy induced by absorption and emission of CO2, water vapor, ozone, and other atmospheric constituents during atmospheric wave propagation. It is a critical theoretical basis for eliminating atmospheric interference in LST retrieval. Radiation signals captured by thermal infrared sensors come from three main sources: atmospheric upwelling radiance, surface radiance attenuated by the atmosphere, and atmospheric downwelling radiance reflected off land surfaces and weakened during atmospheric transmission. The radiative transfer equation quantifies the contribution of each component, allowing atmospheric interference to be isolated from sensor-recorded radiance for true LST retrieval. The simplified form of the radiative transfer equation for thermal infrared remote sensing is given in Equation (5) [35]:
where is the total spectral radiance received by the sensor (); is atmospheric upwelling radiance (), i.e., the radiation emitted by the atmosphere and transmitted to the sensor; stands for atmospheric transmittance, which characterizes the ability of the atmosphere to transmit surface radiation; denotes land surface emissivity, representing how closely the thermal radiation of actual ground objects approximates that of an ideal black body; is the spectral radiant exitance of a black body corresponding to the surface temperature (), calculated via Planck’s law; and is atmospheric downwelling radiance (), referring to the radiation emitted by the atmosphere and transmitted to the land surface.
The radiative transfer equation clarifies the essence of LST retrieval: the surface temperature Ts can be solved by substituting known or estimated atmospheric parameters (, , ) and surface parameters () into the equation. Core discrepancies across different LST retrieval algorithms stem from differing approaches to atmospheric/surface parameter calculation and equation simplification strategies, generating distinct workflows adapted to diverse data inputs and research conditions.
Land Surface Emissivity (LSE) serves as a critical input parameter for LST retrieval. It measures how effectively ground surfaces emit thermal radiation compared with a black body at identical temperatures and is jointly controlled by land cover, surface moisture, vegetation fraction, and other environmental variables. In this study, the Normalized Difference Vegetation Index (NDVI) threshold method is adopted to calculate LSE. The NDVI is the most prevalent vegetation metric in remote sensing, as it reliably captures vegetation growth vigor and surface coverage levels. It is calculated based on the strong absorption of red band (RED) radiation and strong reflection of near-infrared band (NIR) radiation by vegetation. For Landsat 8/9 OLI imagery, the red spectral band corresponds to Band 4, and the near-infrared band corresponds to Band 5. The formulas for NDVI and Fractional Vegetation Cover (FVC) are shown in Equation (6):
where NDVI ranges from −1 to 1; and are the surface reflectance of the red band and near-infrared band, respectively; FVC represents fractional vegetation cover with a range of 0 to 1; and and are the NDVI values of pixels completely covered by bare soil and dense vegetation, respectively.
The NDVI threshold method leverages NDVI’s sensitivity to FVC. It categorizes surface types with distinct LSE by defining FVC-based threshold ranges and assigns matched emissivity values to each land cover category. The basic formula is presented in Equation (7):
where is the LSE of the target pixel; and and are the emissivity of pixels fully covered by bare soil and pure vegetation, respectively. For TIRS Band 10, and are generally set to 0.9668 and 0.9863; for TIRS Band 11, the two parameters take values of 0.9747 and 0.9896, respectively [36].
Qin Zhihao’s mono-window algorithm calculates LST from thermal infrared band data, atmospheric water vapor, and LSE inputs. This model streamlines atmospheric correction to allow direct LST computation once LSE and atmospheric parameters are acquired. The relevant formulas are shown in Equations (8) and (9) [18]:
where is the mean atmospheric effective temperature (K); is the at-sensor brightness temperature (K); a and b are empirical coefficients with values of −67.355351 and 0.458606, respectively; and C and D are intermediate variables calculated from the LSE (ε) and atmospheric transmittance (τ).
The generalized single-channel algorithm employs generalized parameters to lower dependence on high-precision atmospheric profile datasets, and its calculation formulas are presented in Equations (10)–(12) [19].
where is land surface emissivity; is spectral radiance (); and are intermediate variables calculated from at-sensor brightness temperature (, K), effective wavelength (, μm), and the second Planck radiation constant (, m·K); and , , and are atmospheric function coefficients related to atmospheric upwelling radiance () and downwelling radiance (), which are computed from atmospheric transmittance (), , and .
The Jiménez-Muñoz split-window algorithm fully accounts for atmospheric water vapor and LSE and corrects atmospheric interference using brightness temperature differences between its two thermal infrared TIRS channels. The computational formula is shown in Equation (13) [20]:
where to are empirical coefficients, assigned as −0.268, 1.378, 0.183, 54.3, −2.238, −129.2, and 16.4 in sequence; and represent the at-sensor brightness temperature (K) of TIRS Bands 10 and Band 11, respectively; is the atmospheric water vapor content (); is the mean value of the LSE for Band 10 and Band 11; and is the LSE difference between Band 10 and Band 11.
The Offer Rozenstein split-window algorithm removes atmospheric interference using brightness temperature values from the two thermal infrared bands. Its coefficient setup and parameterization scheme are optimized using extensive simulation datasets covering diverse surface and atmospheric scenarios. The relevant formulas are given in Equations (14)–(17) [21]:
where and are the at-sensor brightness temperature (K) of TIRS Band 10 and Band 11, respectively; and , , and are intermediate variables calculated from the LSE () and the atmospheric transmittance () of Band 10 and Band 11, respectively.
The Temperature and Emissivity Separation (TES) algorithm was initially designed for ASTER imagery; it separates LST and surface emissivity from raw thermal infrared radiance data. Its main workflow includes iterative optimization of brightness emissivity, LST retrieval, and convergence judgment. This work utilizes a modified TES variant optimized for Landsat imagery. The improved method establishes an empirical relationship between the Minimum–Maximum Difference (MMD) of LSE for Landsat TIRS Band 10 and Band 11 and the minimum emissivity () and further estimates LSE using . Iterative estimation is based on the modified Wien approximation, with the iteration stopping criterion defined as εmin < 0.1 K. The empirical formula adopted in this study is shown in Equation (18) [22]:
2.4. LST Anomaly Extraction Algorithms
This study selected six LST anomaly extraction algorithms—the empirical threshold method, the non-fixed threshold method, the natural breaks classification method, the cluster analysis method, the moving window method, and the gradient threshold method—to extract anomalies from the optimal LST retrieval results. All algorithms were coded and executed using Python 3.12. LST data for the study area generated by the optimal retrieval algorithm, alongside UAV thermal infrared monitoring outputs, served as model inputs. After algorithmic processing, each method outputs vector boundary layers and raster distribution maps marking surface high-temperature anomaly areas. All vectorized high-temperature patch results generated by six extraction algorithms are archived in Supplementary Data S2. In this study, manually delineated LST anomalies acted as ground reference data, and these manual delineation outcomes were applied to assess the accuracy of distinct LST anomaly extraction algorithms.
The empirical threshold method relies on the normal distribution traits of LST values and uses mean temperature and standard deviation to define segmentation thresholds. In practical engineering applications, is commonly defined as the baseline threshold for identifying coal-fire-related high-temperature anomalies, with all pixels above this threshold marked as suspected fire zones; serves as a stricter threshold to distinguish intense high-temperature anomalies. This method supports fast preliminary mapping of small-scale high-temperature hotspots, and its threshold calculation formulas are shown in Equation (19) [29]:
where denotes the average LST (°C); represents the standard deviation of surface temperature (°C); is the total number of pixels in the thermal image; and refers to the temperature value of an arbitrary pixel (°C). The study area lies within an arid zone characterized by uniformly high background temperatures and drastic landscape temperature fluctuations. To reduce misclassification induced by naturally warm bare ground surfaces, the threshold was increased to three standard deviations to tighten identification criteria and boost delineation precision.
The robust-statistics-based non-fixed threshold method removes interference from extreme high-temperature outliers that skew global threshold segmentation and does not require temperature datasets to obey a normal distribution. This approach efficiently decreases false detection of non-fire warm pixels, including sandy terrain and man-made structures, rendering it suitable for multi-temporal, large-scale coal-fire thermal anomaly extraction, as formulated in Equation (20) [30]:
where is the critical temperature for thermal anomaly detection (°C); stands for the median LST (°C); and denotes the interquartile range, with and representing the 25th and 75th temperature percentiles, respectively. The original interquartile range coefficient of 1.5 could not suppress interference from non-fire extremely hot pixels; hence, the coefficient was adjusted to 2.5 to widen the threshold interval and improve the algorithm’s anti-interference performance.
The natural breaks classification method statistically detects natural breakpoints in temperature datasets and optimizes segmentation by minimizing intra-class variance while maximizing inter-class temperature gaps. The algorithm sorts all temperature values and iteratively calculates intra-class variance under multiple classification schemes to select the optimal segmentation breakpoints, which separate high-temperature anomaly zones from cool background areas. Land-use datasets were further overlaid to mask interfering surfaces such as sandy terrain and built-up zones for refined anomaly delineation; intra-class variance calculation is shown in Equation (21) [31]:
where is the intra-class variance of the category covering pixels from i to j; is the temperature value of the K-th pixel (°C); and represents the average temperature of pixels within the i–j category (°C). Since high-temperature patches within the study area are generally tiny, the temperature dataset was split into nine classes to achieve refined temperature gradient differentiation, with the uppermost temperature tier extracted as core high-temperature anomaly zones.
Cluster analysis constitutes an unsupervised learning workflow for thermal anomaly extraction [32]. Its core principle stems from intrinsic discrepancies between coal fire hotspots and background surfaces in terms of both temperature magnitude and spatial aggregation characteristics. This algorithm segments image pixels into clusters with consistent feature signatures and isolates high-temperature anomalies via cluster grouping without manually preset temperature cutoffs. Rather than clustering purely using single-pixel temperature values, this method incorporates multi-dimensional features such as grid unit mean and maximum temperature to eliminate misjudgments caused by isolated single-pixel thermal noise and emphasize the spatial clustering signatures of coal-fire zones. A 20-pixel grid size was selected to balance local thermal signatures and global background noise while matching the sensor’s spatial resolution; the confidence ellipse level was set to 0.8 to reliably distinguish stable background clusters from fire-associated clusters, and a 0.5 °C safety threshold was configured to capture weak fire zones with mild temperature gradients.
The moving window method is a spatial analysis workflow built upon two core traits: the spatial continuity of high-temperature anomalies and the fact that temperatures inside hotspots are markedly higher than those of surrounding background pixels [28]. A sliding window of defined dimensions traverses every pixel of the thermal raster, capturing intra-window temperature statistics to suppress scattered non-fire hot pixels and boost detectability of weak fire anomalies against mild global temperature backgrounds. Four sets of square windows with side lengths of 11, 19, 27, and 35 pixels were tested with a 1-pixel sliding step size to fully leverage multi-scale detection strengths. Scattered small fire spots are widely distributed throughout the study area, and the original 70% passing threshold would omit weak anomalies with low hotspot pixel ratios; thus, the threshold was reduced to 60% to preserve fragmented mild thermal anomalies.
The gradient threshold method is derived from a physical characteristic: sharp temperature gradient shifts occur along the boundaries of high-temperature anomaly zones [37]. This algorithm calculates temperature gradient values over the thermal raster to identify boundary pixels with sharp gradient jumps, then generates adaptive segmentation thresholds from boundary pixel thermal signatures to precisely separate high-temperature anomalies from background land surfaces. Consistent with the empirical threshold method, the uniformly high background temperatures of this arid study area demanded a higher initial segmentation threshold, adjusted from mean plus one standard deviation to mean plus two standard deviations. The gradient buffer’s lower bound was set to 0.8 times the standard deviation to accommodate weak fire zones with mild boundary gradients and avoid missing marginal anomaly pixels.
3. Results
3.1. Accuracy of LST Retrieval
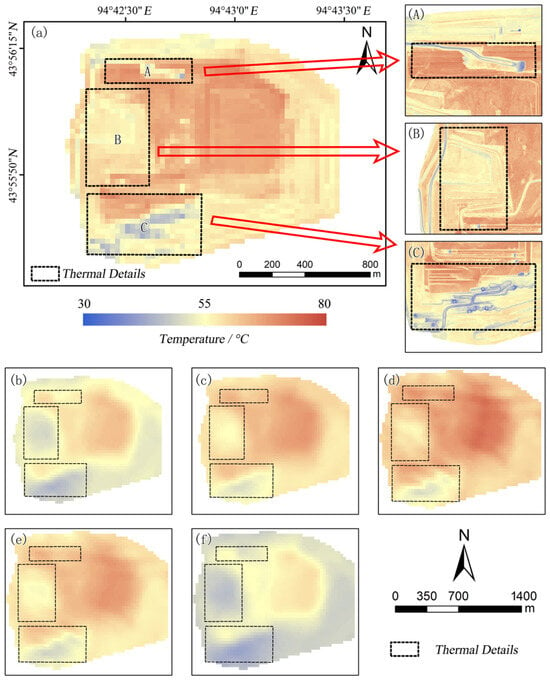
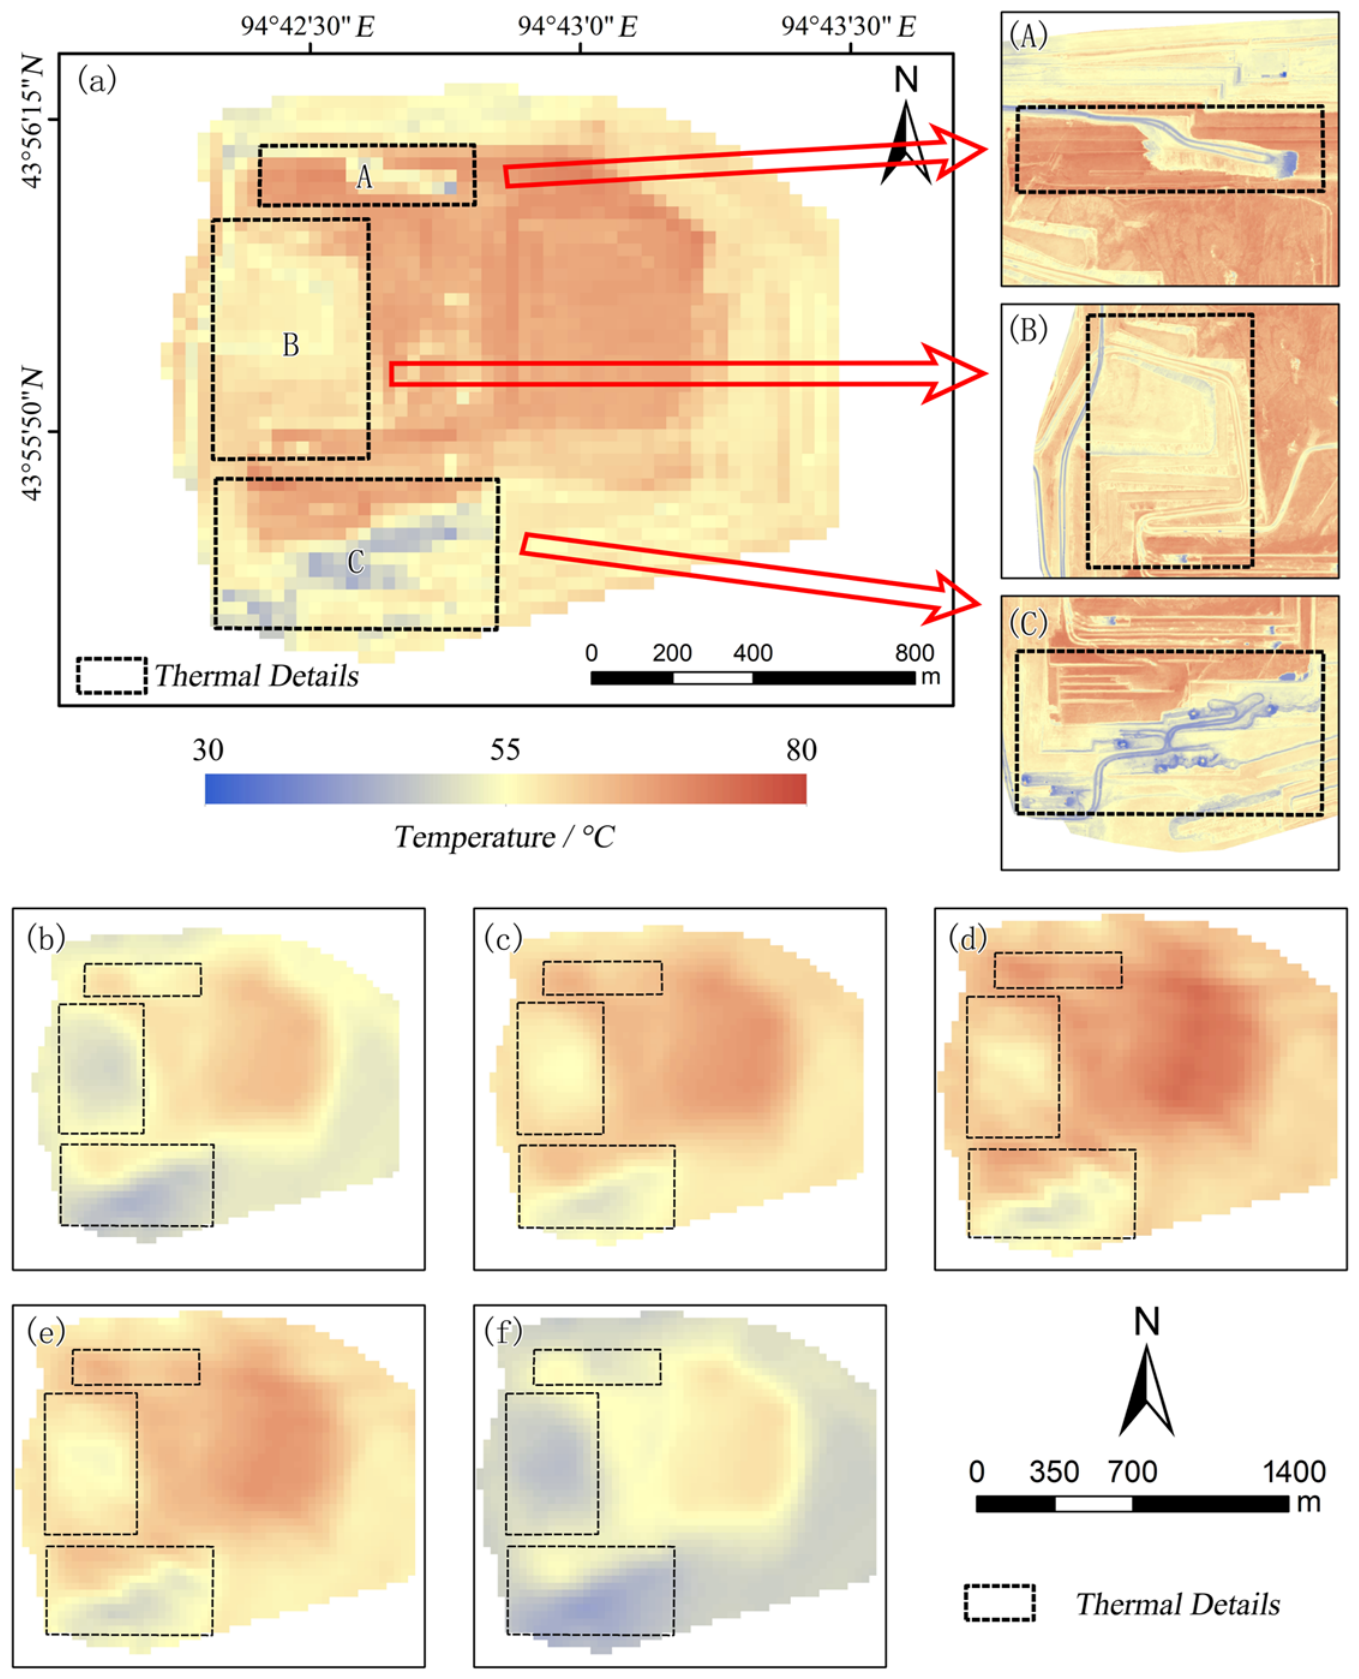
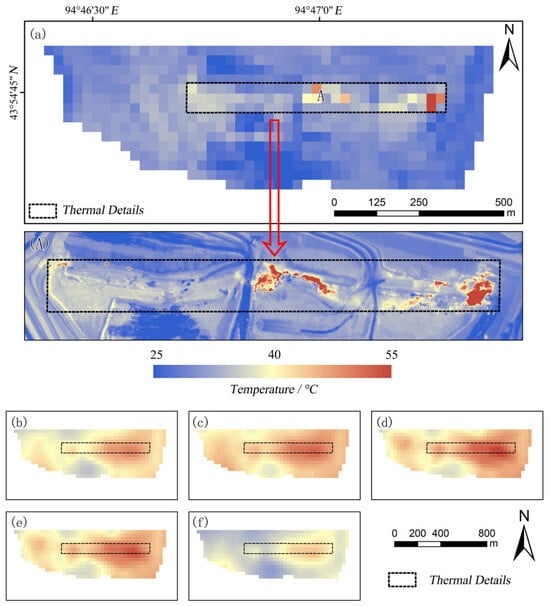
In terms of spatial patterns, LST outputs from Qin Zhihao’s mono-window algorithm and the Jiménez-Muñoz split-window algorithm show distinct thermal gradients that align more closely with UAV-derived ground truth temperatures. Three zones with rich thermal details extracted from UAV inversion outputs were chosen for comparative analysis (Figure 3). In panel A of Figure 3, high-temperature areas are distributed in the upper right and lower left, while moderate and low-temperature zones stretch from the upper left through the central area to the lower right. This spatial pattern can be accurately reproduced by outputs from Qin Zhihao’s mono-window algorithm, the Jiménez-Muñoz split-window algorithm, and the temperature-emissivity separation algorithm. In panel B of Figure 3, low-temperature and moderate- to low-temperature zones present a vertically interlaced distribution. Out of the five LST inversion algorithms, only the Jiménez-Muñoz split-window algorithm can capture this spatial feature. In panel C of Figure 3, the low-temperature zone extending from the lower left to the upper right shows a stepped pattern; the Jiménez-Muñoz split-window algorithm and Offer Rozenstein’s split-window algorithm can faithfully depict such subtle thermal details.
Figure 3.
Spatial pattern of LST retrieval in the intelligent mining pit. This figure utilizes the Landsat scene LC08_L1TP_138029_20250623_20250701. (a) Temperature distribution pattern of UAV thermal infrared imagery resampled to 30 m resolution, with (A–C) showing three detailed areas within the intelligent mining pit. (b–f) Temperature distribution patterns of the intelligent mining pit retrieved by Qin Zhihao’s mono-window algorithm, the generalized single-channel algorithm, the Jiménez-Muñoz split-window algorithm, the Offer Rozenstein split-window algorithm, and the temperature and emissivity separation algorithm, respectively.
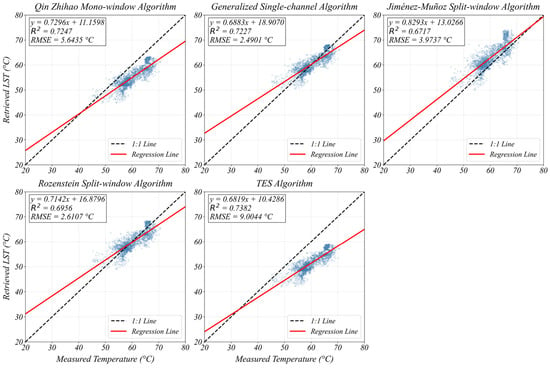
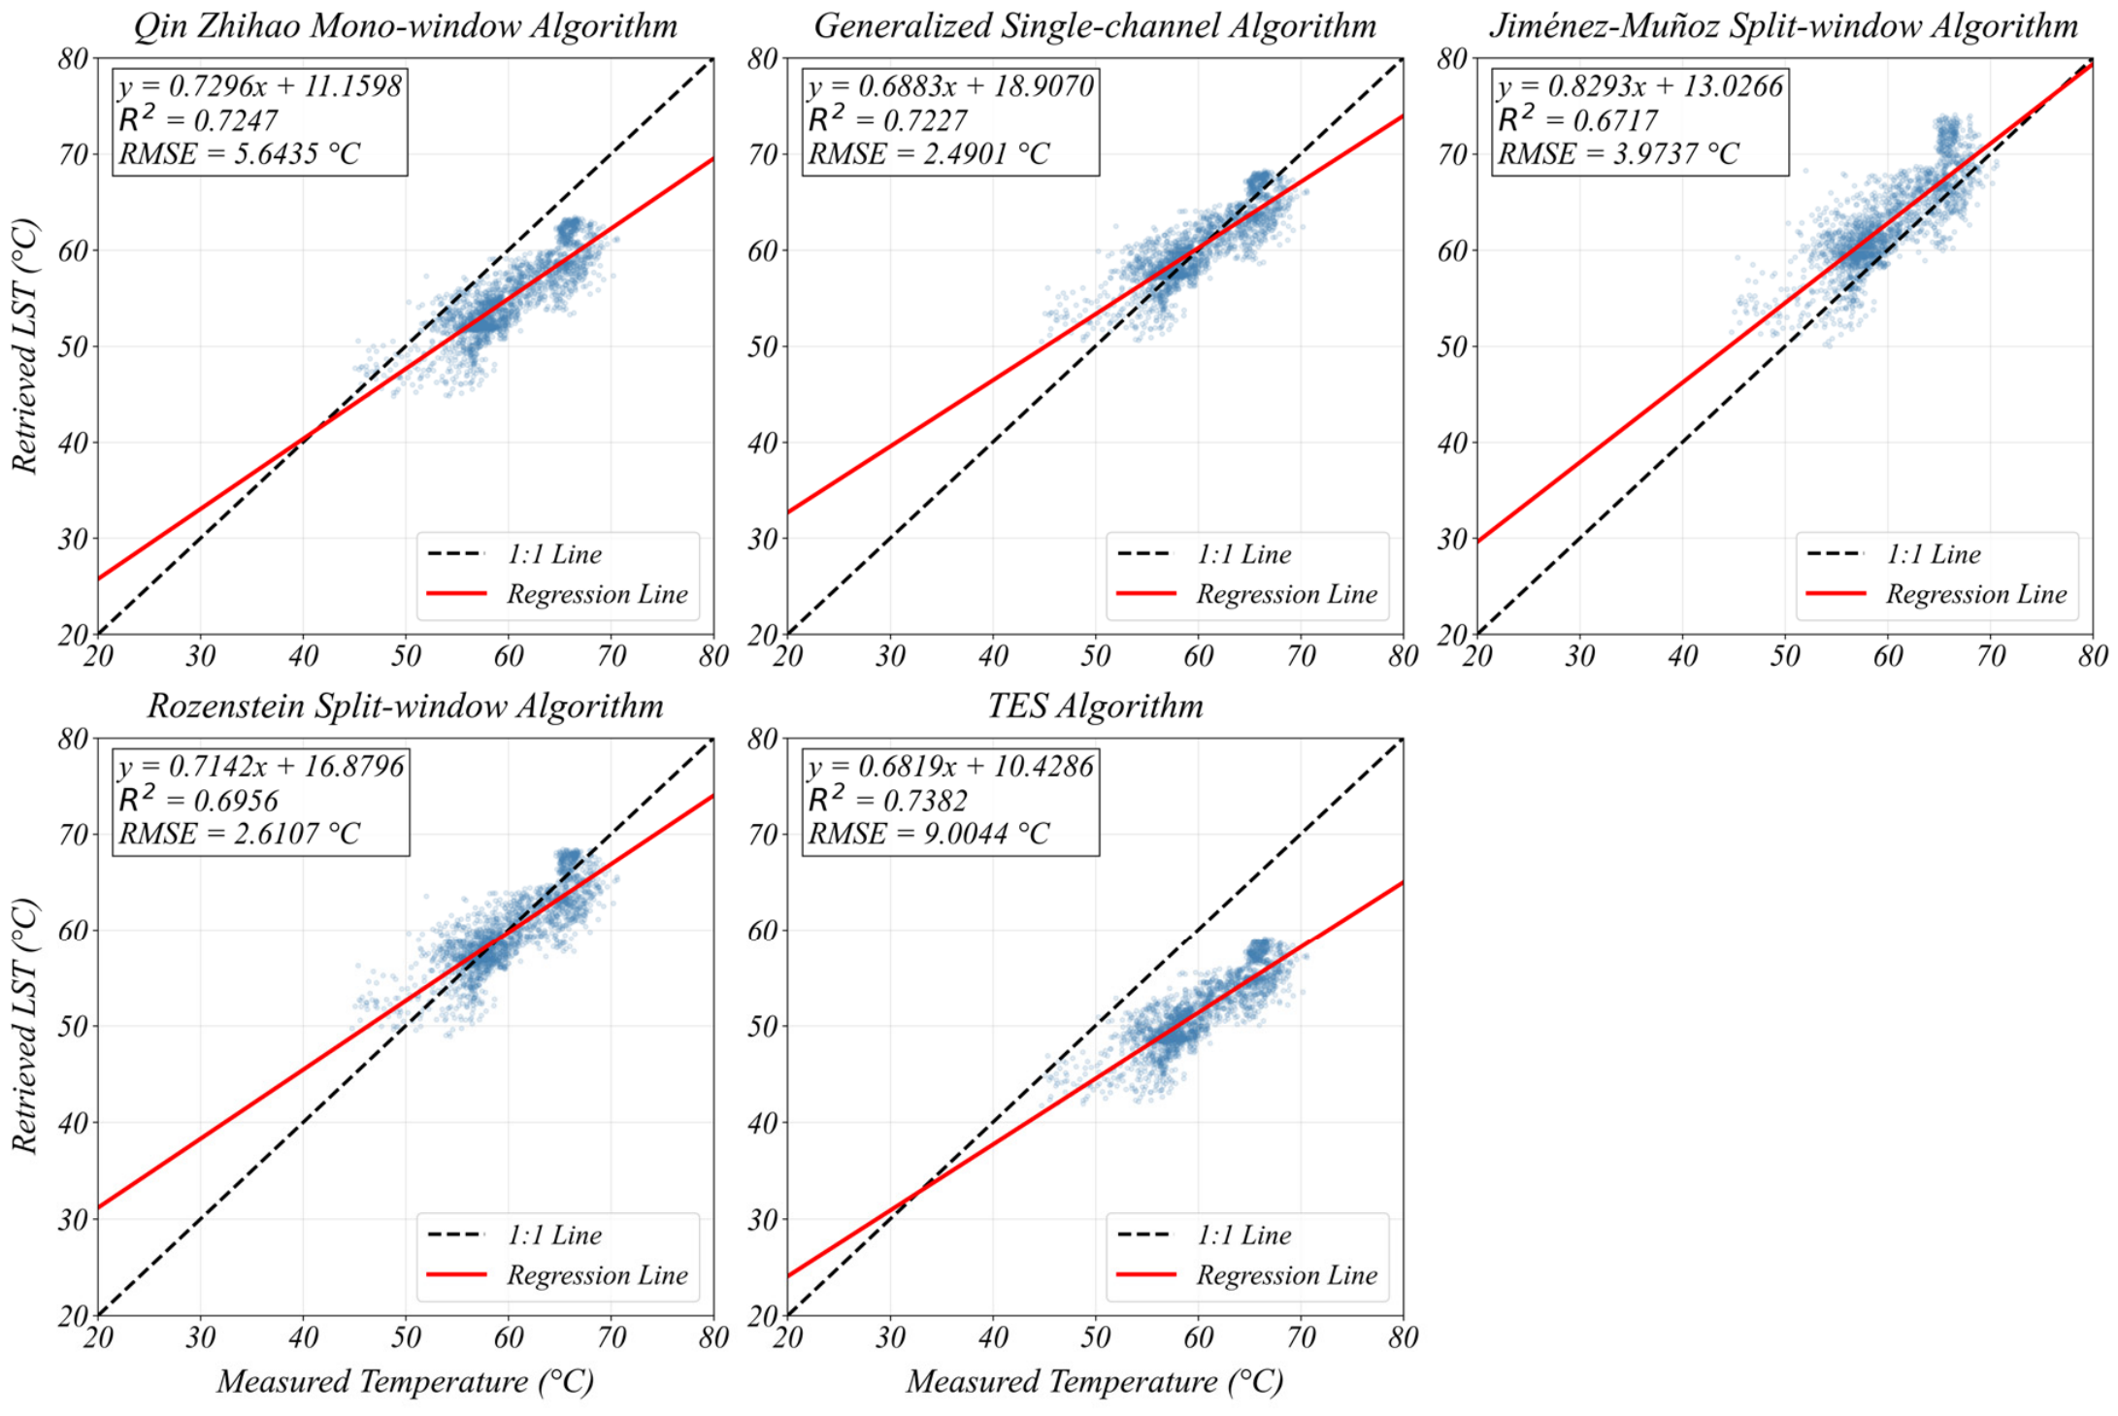
The Euclidean distance between the regression fit line and the 1:1 reference line quantifies the retrieval error magnitude of each algorithm. The fitted lines of the generalized single-channel algorithm, the Jiménez-Muñoz split-window algorithm, and the Offer Rozenstein split-window algorithm are closer to the 1:1 line, whereas those of Qin Zhihao’s mono-window algorithm and the temperature and emissivity separation algorithm are farther from the 1:1 line (Figure 4). The regression slope reveals how retrieval errors shift alongside variations in ground truth temperature. A slope value closer to 1 means algorithmic errors fluctuate less drastically with shifts in ground temperature, signifying superior model stability. Of all five inversion algorithms, the Jiménez-Muñoz split-window algorithm yields the slope nearest to 1, at 0.82; the remaining four algorithms produce slopes ranging between 0.68 and 0.73.
Figure 4.
Scatterplot fitting statistics of LST retrieval results. Blue dots represent pixel-by-pixel matched pairs between estimates from different methods and UAV measurements, and the red lines are regression lines fitted to these points.
Qin Zhihao’s mono-window algorithm and the temperature and emissivity separation algorithm produce the largest deviations, with relative errors of 8.48% and 14.33%, respectively; their raster outputs are consistently underestimated compared to ground truth data (Table 2). The generalized single-channel algorithm and Offer Rozenstein split-window algorithm deliver the lowest relative errors (3.27% and 3.37%), alongside maximum absolute errors of 10.73 °C and 11.53 °C. The Jiménez-Muñoz split-window algorithm achieves a mean absolute error of 3.25 °C and a relative error of 5.53%. Its retrieval accuracy is comparable to the generalized single-channel and Offer Rozenstein split-window algorithms and outperforms Qin Zhihao’s mono-window algorithm and the temperature and emissivity separation algorithm.
Table 2.
LST retrieval results.
UAV monitoring data collected at 06:00 on the satellite overpass day above the mining pit reveal that UAV-derived LST values are substantially lower than satellite-retrieved results, with entirely distinct spatial distributions. Over the roughly 4.5 h gap between the UAV survey and the satellite overpass, the maximum rise in surface temperature reached around 45 °C. Across all five inversion algorithms, maximum absolute errors span 31.52 °C to 46.24 °C, minimum absolute errors fall between 15.11 °C and 23.53 °C, and relative errors range from 23.43% to 34.88%. LST retrieval outputs for the coal fire disaster zone demonstrate that all five algorithms can capture LST spatial patterns with acceptable overall accuracy (Figure 5). Among these models, Qin Zhihao’s mono-window algorithm delivers finer delineation of strip-shaped thermal signatures linked to coal-fire combustion. When comparing absolute retrieved LST magnitudes, only the temperature and emissivity separation algorithm generates outputs consistent with in situ-measured LST. For the remaining four algorithms, maximum absolute errors of retrieved LST fall between 18.09 °C and 23.75 °C, with all relative errors exceeding 10% (11.13–14.11%).
Figure 5.
Spatial pattern of temperature retrieval in the coal fire area. This figure utilizes the Landsat scene LC09_L1TP_138029_20250615_20250615. (a) Temperature distribution pattern of UAV thermal infrared imagery resampled to 30 m resolution, with (A) showing the distribution of coal fire strips in the coal fire area. (b–f) Temperature distribution patterns of the coal fire area retrieved by Qin Zhihao’s mono-window algorithm, the generalized single-channel algorithm, the Jiménez-Muñoz split-window algorithm, the Offer Rozenstein split-window algorithm, and the temperature and emissivity separation algorithm, respectively.
3.2. Accuracy of Surface High-Temperature Anomaly Extraction
To objectively quantify the high-temperature extraction accuracy of each algorithm, we first built a reliable ground reference dataset. We adopted a standardized workflow to manually delineate reference thermal anomaly zones. First, we utilized mine-supplied historical coal fire records and the spatial layout of ongoing intensive mining zones to carry out field surveys and on-site interviews, locating typical fire hotspots and high-risk coal fire areas as preliminary spatial constraints for subsequent anomaly delineation. Second, we used abrupt local background temperature gradients on LST inversion outputs as the core boundary standard for pixel-by-pixel manual delineation. In this step, only continuous or semi-continuous high-temperature pixel clusters were marked as anomalies, while isolated single-pixel hotspots were eliminated. Finally, a separate researcher independently cross-checked the preliminary delineation results by overlaying contemporaneous high-resolution optical imagery. This step filtered out non-coal fire thermal signals triggered by man-made buildings, paved roads, and solar-heated bare rock, keeping only anomaly patches linked to exposed coal, gangue piles, and smoke emissions. Following the above standardized workflow, we delineated four high-temperature anomaly zones covering a total area of 0.82 km2 from satellite-derived LST. From UAV thermal infrared data, we identified 18 anomaly patches (909.61 m2 total) within the coal fire disaster zone and 8 patches (521.23 m2) inside the intelligent stope.
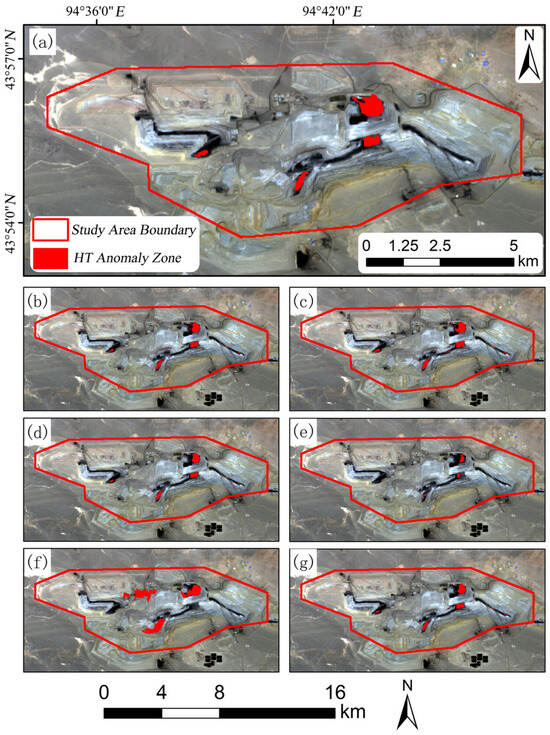
In our assessment, cluster analysis and the moving window method missed several thermal anomalies, resulting in one and two omitted patches, respectively (Figure 6). While the remaining four algorithms captured all real thermal anomalies, they generated abundant false positives by mislabeling normal background zones as hotspots. Specifically, the natural breaks classification method and gradient threshold method each yielded four false positives, whereas the empirical threshold method generated eight false positives. When measuring how completely extracted patches cover real target anomalies, the natural breaks, gradient threshold, and empirical threshold methods all attained coverage ratios above 70%, at 70.25%, 71.13%, and 76.51%, respectively.
Figure 6.
Anomaly extraction based on satellite-derived LST results. (a) High-temperature anomaly areas manually delineated based on field investigation. (b–g) High-temperature anomaly areas delineated by the empirical threshold method, the non-fixed threshold method, the natural breaks classification method, the cluster analysis method, the moving window method, and the gradient threshold method, respectively.
When extracting anomalies from UAV thermal data, the gradient threshold, non-fixed threshold, and empirical threshold methods produced zero omitted patches for both the coal fire disaster zone and the intelligent stope (Table 3). Within the coal fire disaster zone, the natural breaks classification and moving window methods omitted 6 and 14 real anomaly patches, respectively. For the intelligent stope, the moving window method missed four anomaly patches, and cluster analysis only missed one patch. Regarding false positive counts, every algorithm except cluster analysis and natural breaks classification generated far more false signals than the real number of anomaly patches. For patch overlap ratio metrics, the gradient threshold, empirical threshold, and non-fixed threshold methods fully matched 100% of manually mapped thermal anomalies, while all remaining algorithms had overlap ratios below 51.25%.
Table 3.
LST anomaly extraction based on UAV thermal infrared data.
3.3. Long-Term Time-Series Monitoring of Satellite-Derived High-Temperature Anomalies
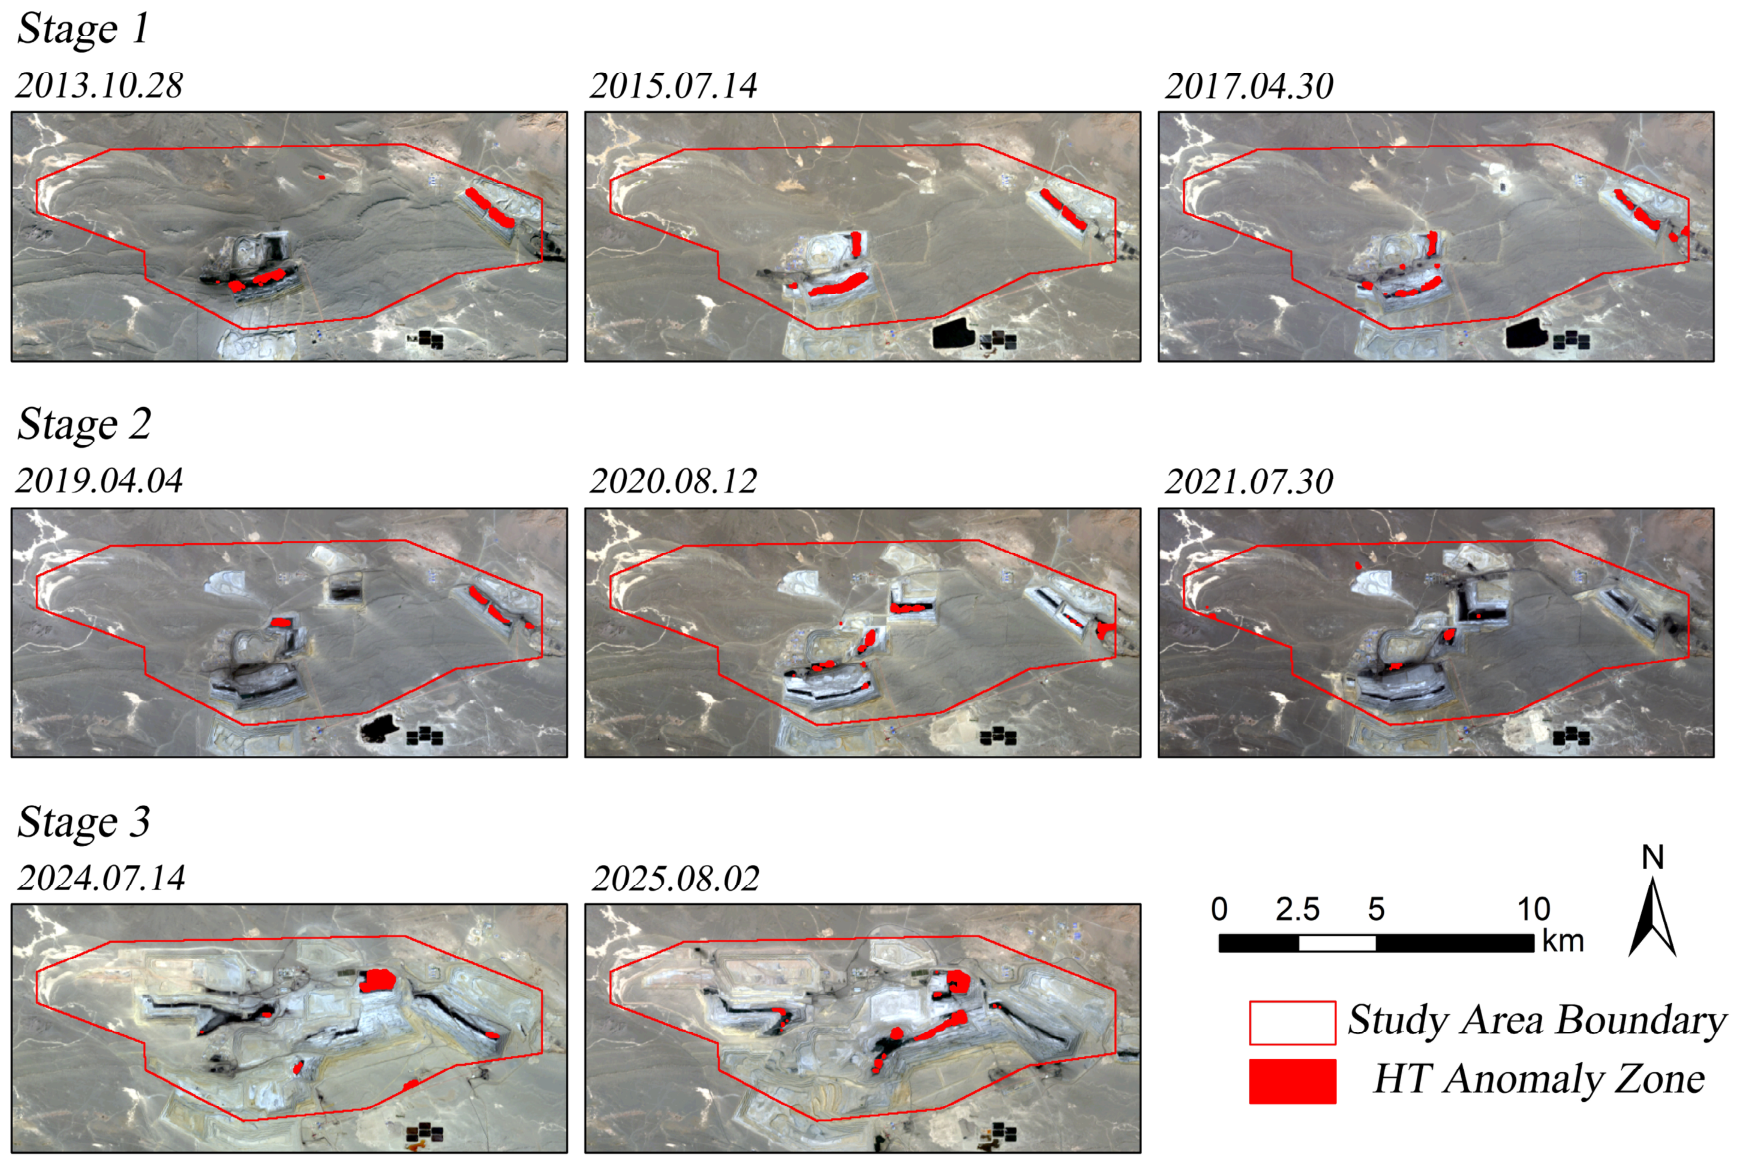
Based on the optimal outputs obtained in Section 3.1 and Section 3.2, we adopted the Jiménez-Muñoz split-window algorithm paired with the gradient threshold method as the retrieval-extraction workflow for long-term continuous monitoring. From an interannual perspective, thermal anomalies within the study area followed a three-stage evolutionary timeline aligned with three mining phases: mine construction and development (2013–2018), stable mining (2019–2022), and intelligent mining operations (2023–2025) (Figure 7): during 2013–2018, the mean total patch area was m2, the annual mean overall temperature was 28.15 °C, and the annual mean high-temperature anomaly value was 33.21 °C; during 2019–2022, the mean total patch area was m2, the annual mean overall temperature was 22.83 °C, and the annual mean high-temperature anomaly value was 30.75 °C; during 2023–2025, the mean total patch area was m2, the annual mean overall temperature was 19.21 °C, and the annual mean high-temperature anomaly value was 25.56 °C. At the seasonal scale, high-temperature anomalies were most active in summer, with a mean total patch area of m2, whereas in winter, suppressed by extremely low temperatures, the seasonal mean area decreased sharply to m2. Spring and autumn were relatively stable transitional stages, with mean patch areas of m2 and m2, respectively. Full annual and seasonal time-series temperature grids, hotspot vector patches and corresponding statistical indicators for 2013–2025 can be found in Supplementary Data S1, S2 and S3, respectively.
Figure 7.
Distribution of typical patches across the three stages from 2013 to 2025.
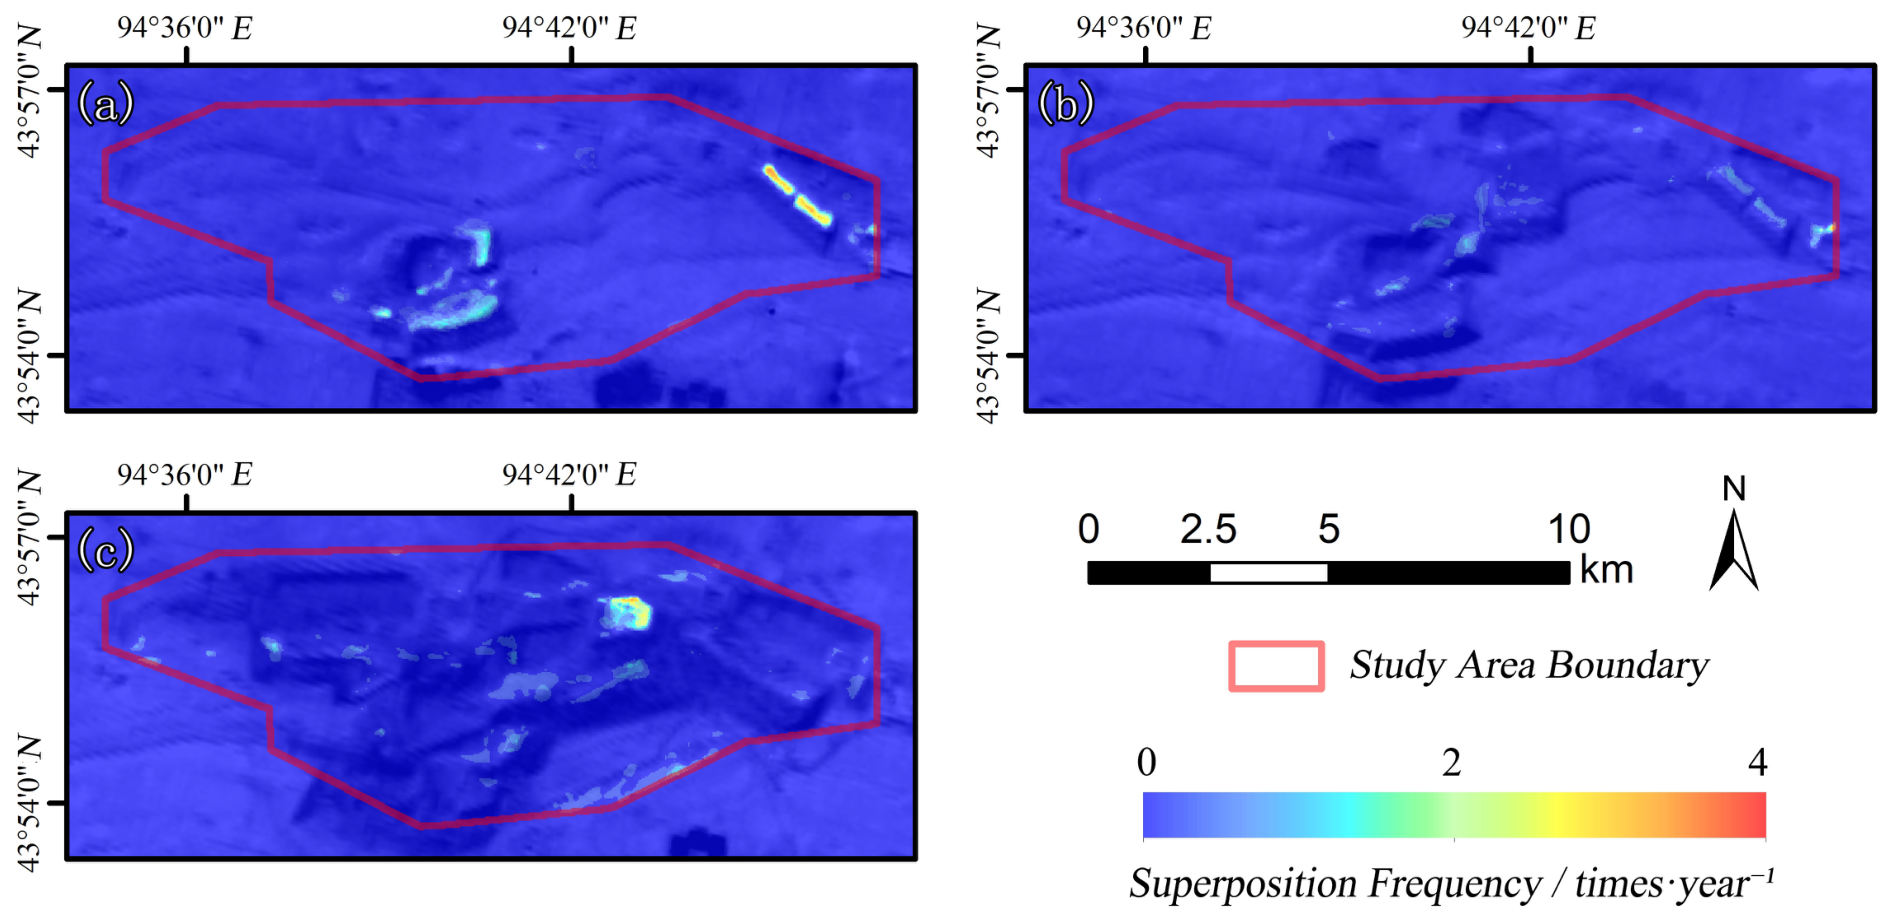
Spatially, we overlaid all extracted hotspot patches from each mining phase to visualize their varying spatial aggregation patterns (Figure 8). Thermal anomaly zones followed a three-phase spatial evolution: concentrated expansion, scattered shrinkage, and renewed clustered aggregation. For the 2013–2018 period, we overlaid 24 hotspot distribution maps. Thermal anomalies concentrated into continuous strips along coal seam strikes in the eastern and south-central mining zones. Within the eastern open pit, the annual overlay frequency surpassed three, and hotspots appeared as elongated linear strips. In the south-central pit, overlay frequencies ranged from two to three times annually, with most hotspots presenting irregular outlines. We overlaid 16 hotspot maps for the 2019–2022 phase. Throughout this period, thermal anomalies shrank into isolated scattered patches across the mine, and their annual overlay frequency seldom surpassed two. Hotspots transformed into tiny isolated patches and point signatures, marking a notable decline in spatial clustering intensity. For the 2023–2025 intelligent mining stage, 12 hotspot maps were combined for overlay analysis. Thermal anomalies re-converged toward the northeastern intelligent stope, with annual overlay frequencies above three. These hotspots formed block-shaped clusters and exhibited strong spatial coupling with the layout of the intelligent stope. Additionally, sparse tiny patch and point-shaped hotspots with annual overlay frequencies below two were scattered throughout the whole mining area.
Figure 8.
Overlay map of high-temperature areas from 2013 to 2025. (a–c) Overlay of high-temperature area patches delineated during 2013–2018, 2019–2022, and 2023–2025, respectively.
4. Discussion
4.1. Evaluation of the Accuracy of Different Algorithm Retrieval Strategies
The five LST retrieval algorithms handle atmospheric water vapor content and land surface emissivity via distinct approaches, generating deviations between retrieved outputs and ground truth measurements. Qin Zhihao’s mono-window algorithm computes LST via direct formulas, and its measurement errors stem from inaccuracies in land surface emissivity and atmospheric water vapor calculations. Thus, this algorithm delivers relatively stable results for regions with minor variations in land surface emissivity and atmospheric water vapor. By contrast, the remaining four algorithms conduct mathematical fitting of core LST inversion parameters. For instance, the generalized single-channel algorithm incorporates parameters describing atmospheric transmittance and upward and downward atmospheric radiance [19]; the Offer Rozenstein split-window algorithm models LST as a linear function of Band 10 and Band 11 at-sensor brightness temperatures [21]; and the Temperature and Emissivity Separation (TES) algorithm relies on an empirical correlation between Band 10/11 brightness temperature differences and LST [22].
Fitting and modeling operations applied to core parameters may result in the loss of subtle thermal detail information. Consequently, LST outputs from the generalized single-channel, Offer Rozenstein split-window, and TES algorithms retain fewer subtle thermal features compared with Qin Zhihao’s mono-window model and display weaker temperature gradients. While the Jiménez-Muñoz split-window algorithm also fits core parameters and adopts empirical coefficients, it accounts for not only Band 10/11 brightness temperature differences and averages, but also the nonlinear correlation between these variables and LST. Furthermore, this model integrates the correlations between LSE mean/difference values and LST into its calculation framework [20]. As it incorporates more influencing parameters and variables than the other four models, the Jiménez-Muñoz split-window algorithm delivers the most precise spatial LST patterns and finest thermal detail recovery during inversion.
From the perspective of algorithmic mechanisms, the precision of absolute retrieved LST is determined by each model’s inherent robustness. The Jiménez-Muñoz split-window formula originates from regression analysis on extensive simulation datasets, smoothing the model’s variable response fluctuations across diverse parameters. By directly estimating and mitigating atmospheric interference via brightness temperature differences, this model lowers its reliance on precise absolute atmospheric water vapor measurements [20]. In contrast, the Offer Rozenstein split-window algorithm calculates LST based on water vapor and emissivity inputs, triggering obvious error propagation originating from these two parameters [21]. The TES algorithm’s iterative calculation workflow can rapidly magnify minor biases from the initial emissivity threshold [22]. Qin Zhihao’s mono-window and generalized single-channel algorithms are limited by their inherent inversion frameworks [19,38], so their performance reliability needs further verification and optimization for this hyper-arid, ecologically fragile mining study area.
This work builds a multi-dimensional assessment framework for coal-fire mapping, which prioritizes spatial detail retention and small hotspot detection sensitivity alongside absolute LST precision. Re-evaluating all algorithms within this assessment framework shows that, despite the generalized single-channel and Offer Rozenstein split-window algorithms having low MAE values (1.93 °C and 2.00 °C), they perform poorly over representative thermal anomaly zones (Zones B and C) in Figure 3; the former homogenizes interleaved cool-warm temperature bands, and the latter shrinks thermal gradient ranges and obscures hotspot edges. Only the Jiménez-Muñoz split-window algorithm retains inter-layer temperature differences in Zone B and stepped transition features in Zone C at the same time, supplying an irreplaceable dataset for high-precision hotspot boundary delineation in follow-up steps. Furthermore, the Jiménez-Muñoz split-window algorithm produces a regression slope of 0.82—the closest value to 1 out of all five models—demonstrating the most stable error response across the full temperature spectrum. Its systematic overestimation bias provides greater safety margins for coal-fire early warning, and its MAE of 3.25 °C and relative error of 5.53% fully meet standard engineering error tolerances. Combining spatial structural fidelity, systematic stability, and practical monitoring safety, this algorithm, though not the most accurate in pure numerical metrics, attains the highest comprehensive performance score and is thus chosen as the primary operational model for long time-series monitoring in this research.
4.2. Evaluation of the Applicability of High-Temperature Anomaly Extraction Algorithms
False positives and omitted hotspots during thermal anomaly extraction arise from each algorithm’s core design and threshold segmentation logic. The empirical threshold and non-fixed threshold methods adopt global segmentation thresholds derived from mean values multiplied by fixed standard deviation multiples or interquartile ranges to map thermal hotspots [13]. In arid mining environments with elevated background temperatures and drastic thermal fluctuations, these methods struggle to separate natural warm bare ground from real coal fire hotspots, generating substantial false positive outputs (Figure 6, Table 3). Natural breaks classification, cluster analysis, and the moving window method leverage hierarchical grouping, fixed grid dimensions, and sliding window parameters, respectively, to isolate thermal anomalies. Given the small, scattered distribution of thermal hotspots across open pits, overly coarse classification generates over-expanded anomaly polygons, while over-fine segmentation fragments extraction outputs and creates missed patches [39]. The gradient threshold algorithm detects sharp temperature gradient shifts and integrates this workflow with empirical thresholding to draw preliminary hotspot boundaries, which suppress excessive false positives. At the same time, it can capture small-area high-temperature anomalies and resist background high-temperature noise [40], which enables it to achieve no omissions and a relatively low false detection rate.
The spatial overlap ratio between extracted hotspots and manually mapped patches reflects how well each algorithm constrains thermal anomaly edges. As purely statistical segmentation tools, the empirical and non-fixed threshold methods fail to accurately lock thermal anomaly edge boundaries [37,41]. By contrast, the natural breaks, cluster analysis, and moving window approaches apply overly rigid boundary restrictions, resulting in incomplete coverage of real hotspot zones in extraction outputs [28,32]. The gradient threshold method uses a gradient buffer to limit anomaly boundaries [40], so its extraction range can cover anomaly core areas relatively completely without expansion or restriction. Consequently, this method achieved nearly 100% spatial overlap with target hotspots in both test zones and exhibited minimal area deviation from real coal fire regions.
The precision of thermal anomaly extraction also relies on site-specific tuning of algorithm threshold parameters. Within this research, we have tuned the original parameters of the empirical and non-fixed threshold methods, yet these two algorithms still generate large quantities of false positives. Tweaking class counts and value ranges for natural breaks, grid dimensions for cluster analysis, and window size/step parameters for the moving window approach improved extraction performance yet partially lowered computational efficiency. The core advantage of the gradient threshold method lies in its balanced overall performance. Its gradient edge and buffer thresholds were calibrated to match the study area’s thermal traits, striking a balance among detection completeness, false positive ratio, and spatial coverage alongside stable high computational efficiency. This makes the method more consistent with the practical requirements of high-temperature anomaly extraction in the study area.
It is worth noting that each accuracy metric has distinct practical implications for on-site mine safety workflows. An omission means that an active coal fire hotspot goes undetected, which may leave burning zones unmonitored, allow combustion ranges to expand, and trigger severe hazards including gas outbursts and slope collapse; false detection, by contrast, refers to the erroneous marking of non-coal fire naturally warm areas as anomalies, which increases unnecessary field verification workloads and consumes labor and time, but typically does not result in catastrophic consequences. Accordingly, for mine engineering monitoring, minimizing the omission rate must be set as the top priority.
Combining all comparison results from Section 3.2, the gradient threshold method delivers optimal performance, with 100% spatial overlap and zero omissions, alongside a comparatively low false positive count across all tested algorithms, demonstrating its well-balanced detection capacity and anti-noise robustness. For this reason, this algorithm acts as the primary universal tool for coal fire hotspot detection across open-pit mines and fits most routine long-term monitoring tasks. Nevertheless, universal applicability does not equal exclusive suitability. When targeting specific monitoring goals, alternative algorithms possess unique comparative strengths: cluster analysis produces only one missed hotspot within the intelligent stope, yet yields the fewest false positives (five total), drastically decreasing manual recheck labor costs during detailed pit-scale surveys; and while the natural breaks and moving window approaches generate more missed patches, their low false positive output delivers practical value for regular surveys of scattered, tiny coal fire hotspots. For field implementation, we recommend using the gradient threshold method as the core detection workflow, with auxiliary cross-verification and fine-tuning from cluster analysis and other algorithms for cost-limited or targeted stope monitoring tasks.
4.3. Factors Driving High-Temperature Surface Anomalies in the Mining Area
Based on the evaluation of spatiotemporal evolution traits of thermal hotspots from 2013 to 2025, their dynamic shifts are tightly linked to multiple driving factors: anthropogenic mining operations, regional climate, and coal seam geological attributes. Human mining activities are the primary factor controlling the development of high-temperature areas. Artificially regulated mining scope, operational spatial layout, and technical upgrades jointly drive shifts in the location and areal extent of thermal hotspots across multiple dimensions [42,43]. During the mine construction and development stage (2013–2018), mining disturbance was intense, and exposed coal seams and coal gangue accumulation in the eastern and south-central mining pits formed locally concentrated high-temperature areas. In the stable mining period (2019–2022), mine facilities and outcropping coal zones stayed relatively static, mining advancement decelerated, and thermal hotspots declined notably in both temperature and coverage. During the intelligent mining stage (2023–2025), technological upgrading and adjustments to the spatial planning of the mining area caused marked changes in coal seam exposure and coal gangue accumulation, leading the area of high-temperature patches to return to a high level (Figure 7).
The study area’s climatic background and long-term regional mean temperature trends serve as critical environmental triggers for coal-fire activity. The study area features a temperate continental arid climate characterized by year-round extreme temperature events, substantial diurnal and seasonal temperature swings, and scarce rainfall. Together with the overall warming trend in Yiwu County, Hami City over the years, these conditions have promoted the interannual development of high-temperature areas [44,45]. Notably, despite the overall regional warming trend, years of mine layout adjustment and subsequent underlying surface reconstruction have gradually generated a mining cold island effect. Such surface transformation covers three major types: replacement of native Gobi terrain with leveled, soil-covered ground, regular irrigation and humidification, and shading generated by stepped pit geomorphology. Consequently [46], the temperature gap between the mine interior and surrounding wilderness has widened year after year, leading to a continuous downward trend in the average pixel temperature of mapped hotspots. Seasonal climatic cycles dominate the seasonal fluctuation of coal fire thermal hotspots. In summer, hot, arid conditions where evaporation vastly surpasses precipitation drastically speed up coal seam oxidation and heat accumulation; by contrast, frigid winter temperatures suppress coal fire activity.
Intrinsic coal lithological characteristics form the fundamental material precondition for spontaneous coal combustion. The long-flame coal in the study area has a high volatile content (>30%), a spontaneous combustion tendency grade of I–II, and a strong tendency toward oxidation and heat release. This coal variety is high-quality Xinjiang coal. Nevertheless, abundant shallow coal outcrops coupled with flat terrain turn these favorable mining traits into inherent vulnerabilities that facilitate spontaneous coal fires [34]. For on-site mine management, operators must apply timely fire-suppression treatments to outcropping coal, including loess capping, cooling water sprinkling, and gangue compaction. Mine staff should carry out tiered, zoned management based on spontaneous combustion risk grades and conduct pre-emptive thermal insulation and oxygen isolation treatments in high-risk coal zones.
It should be emphasized that the above analysis relies solely on satellite remote sensing time series and historical comparative data. The detected correlations are deduced mainly from spatiotemporal matching patterns, which serve as rational interpretive deductions instead of fully quantified causal conclusions. To fully construct a complete causal chain, supplementary datasets including mining operation logs, real-time coal outcrop records, coal fire remediation archives, and stope layout adjustment files are needed for systematic attribution quantification.
5. Conclusions
This study took the Xingsheng Open-Pit Coal Mine in the Naomaohu mining area, Yiwu County, Xinjiang, China, as the study area and used UAV-monitored LST as ground truth data to systematically compare the LST retrieval accuracy of Qin Zhihao’s mono-window algorithm, the generalized single-channel algorithm, the Jiménez-Muñoz split-window algorithm, the Offer Rozenstein split-window algorithm, and the temperature and emissivity separation algorithm. The results show that:
- (1)
- Owing to its unique retrieval strategy, the Jiménez-Muñoz split-window algorithm can provide a detailed description of the spatial distribution of LST while maintaining relatively low retrieval errors in absolute LST values. It is the most suitable algorithm for rapid and accurate identification of coal fire risk areas at small scales and can be applied for routine safety production management in mining areas.
- (2)
- Among the LST high-temperature anomaly extraction algorithms, the gradient threshold method has a strong ability to capture temperature gradient features and is the most suitable algorithm for large-area high-temperature anomaly surveys. In safety production work at the mining-pit scale, the cluster analysis method can balance low omission rates and low false detection rates, making it the most advantageous method for reducing human and material costs while ensuring the quality of safety management work.
- (3)
- The dynamic variations of surface high-temperature anomalies in the mining area exhibit significant spatiotemporal correspondence with multiple factors, including human mining activities and coal seam occurrence conditions, among which human mining activities show the most prominent spatiotemporal consistency, followed by coal seam occurrence conditions. The influence of the regional climatic environment is mainly reflected in high-temperature extremes and seasonal variations. The above inferences are based on spatiotemporal pattern analysis, and their causal relationships require further validation with operation logs and field measurement data.
Supplementary Materials
The following supporting information can be downloaded at: https://www.mdpi.com/article/10.3390/fire9080345/s1, Supplementary Data S1: 2013–2025 Land Surface Temperature; Supplementary Data S2: 2013–2025 High Temperature Anomaly Patches; Supplementary Data S3: 2013–2025 Analysis Data.
Author Contributions
P.J.: methodology, writing—original draft preparation, data curation, visualization, formal analysis, and investigation. H.H.: funding acquisition, writing—review and editing, and supervision. X.Y.: conceptualization and methodology. C.G.: investigation, writing—review and editing, project administration, and conceptualization. C.Y.: investigation, data curation, and visualization. X.C.: data curation and visualization. All authors have read and agreed to the published version of the manuscript.
Funding
This work was financially supported by the National Natural Science Foundation of China (42507487); the Natural Science Basic Research Program of Shaanxi (2025JC-YBQN-384); and the Geological Survey Project of China Geological Survey, Ministry of Natural Resources (DD202607202809).
Data Availability Statement
The raw data supporting the conclusions of this article will be made available by the authors on request.
Acknowledgments
This work was also supported by Xinjiang Jiangna Mining Co., Ltd. The authors sincerely thank the company for providing partial UAV orthophoto images and historical geological exploration reports of the study area.
Conflicts of Interest
The authors declare no conflicts of interest.
References
- Kuenzer, C.; Zhang, J.; Sun, Y.; Jia, Y.; Dech, S. Coal fires revisited: The Wuda coal field in the aftermath of extensive coal fire research and accelerating extinguishing activities. Int. J. Coal Geol. 2012, 102, 75–86. [Google Scholar] [CrossRef] [Scilit]
- Kuenzer, C.; Zhang, J.; Jing, L.; Huadong, G.; Dech, S. Thermal Infrared Remote Sensing of Surface and Underground Coal Fires. In Thermal Infrared Remote Sensing; Remote Sensing and Digital Image Processing; Springer: Dordrecht, The Netherlands, 2013; pp. 429–451. [Google Scholar]
- Anghelescu, L.; Diaconu, B.M. Advances in Detection and Monitoring of Coal Spontaneous Combustion: Techniques, Challenges, and Future Directions. Fire 2024, 7, 354. [Google Scholar] [CrossRef] [Scilit]
- Ding, K.; Chen, Y.; Suo, Z.; Cao, W. Coal Fire Zone Identification by Using an Enhanced Ensemble Learning Model and Multi-Modal Remote Sensing Data. In Proceedings of the IGARSS 2024—2024 IEEE International Geoscience and Remote Sensing Symposium, Athens, Greece, 7–12 July 2024; pp. 729–733. [Google Scholar]
- Deng, J.; Xue, Y.; Zhou, F.; Shi, B. Using Thermal Remote Sensing for Coal Fires Identification, Delineation, and Spatiotemporal Analysis. In Proceedings of the IGARSS 2024—2024 IEEE International Geoscience and Remote Sensing Symposium, Athens, Greece, 7–12 July 2024; pp. 1883–1886. [Google Scholar]
- Finkelman, R.B. Potential health impacts of burning coal beds and waste banks. Int. J. Coal Geol. 2004, 59, 19–24. [Google Scholar] [CrossRef] [Scilit]
- Yu, H.; Zhang, H.L.; Zhang, Z.Y.; Shao, Z.L.; Zhao, H.F.; Yan, S.Y. Multi-source remote sensing identification of underground coal fires based on the fusion of surface temperature and deformation. Coal Sci. Technol. 2024, 52, 139–147. [Google Scholar]
- Song, Z.; Kuenzer, C. Coal fires in China over the last decade: A comprehensive review. Int. J. Coal Geol. 2014, 133, 72–99. [Google Scholar] [CrossRef] [Scilit]
- Wu, J.J.; Jiang, W.G.; Liu, X.C.; Gu, L.; Li, J.H. Innovative technologies for exploration, monitoring and extinction of underground coal fires. J. China Coal Soc. 2009, 34, 1669–1674. [Google Scholar] [CrossRef]
- Wu, J.J.; Liu, X.C.; Jiang, W.G.; Gu, L.; Cai, Z.Y. Spatial analysis of risk for underground coal fire in Xinjiang, China. J. China Coal Soc. 2010, 35, 1147–1154. [Google Scholar] [CrossRef]
- Zheng, X.Z.; Jia, Y.X.; Guo, J.; Wen, H.; Wang, B.Y. Research status and prospect of coalfield fire monitoring technologies. Ind. Mine Autom. 2019, 45, 6–10, 61. [Google Scholar] [CrossRef]
- He, X.Y.; Wang, F.; Luo, Z.; Guan, T.; Li, C.C.; Cui, S.; Chen, X.L.; Chen, R.L. Aeromagnetic Method for Detecting Residual Coal Fire Area Based on Cross Constraint Inversion of Different Height. China Min. Mag. 2022, 31, 168–174. [Google Scholar] [CrossRef]
- Chen, Y.; Cheng, H.B.; Du, P.J.; Wei, J.; Lang, F.K.; Ding, K.W.; Suo, Z.H. A review of remote sensing detection and identification methods for underground coal fire areas. Remote Sens. Technol. Appl. 2025, 40, 816–834. [Google Scholar]
- Chen, Y.; Suo, Z.; Li, J.; Wei, J.; Cao, F.; Sun, H.; Li, H.; Gao, Y.; Li, Q.; Yue, Y.; et al. Active–Passive Remote Sensing Identification of Underground Coal Fire Zones With Joint Constraints of Temperature and Surface Deformation Time Series. IEEE J. Sel. Top. Appl. Earth Obs. Remote Sens. 2024, 17, 894–915. [Google Scholar] [CrossRef] [Scilit]
- Gao, Y.R.; Sui, G.; Zhang, X.J.; Kong, J.Y.; Zhang, H.S. Application of remote sensing method in coal fire identification in Ningwu Coalfield. Coal Sci. Technol. 2023, 51, 133–139. [Google Scholar] [CrossRef]
- Jiang, W.G.; Wu, J.J.; Gu, L.; Yang, B.; Chen, Q.; Liu, X.C. Monitoring Method of Underground Coal Fire Based on Night Thermal Infrared Remote Sensing Technology. Spectrosc. Spectr. Anal. 2011, 31, 357–361. [Google Scholar] [CrossRef]
- Ma, Z.J.; Li, Y.Y.; Wu, J.; Ouyang, Z.Q.; Wang, M.W.; Qiu, T.X.; Xu, Z.H. Coal fire identification through satellite remote sensing considering the landscapes. Coal Sci. Technol. 2023, 51, 92–103. [Google Scholar] [CrossRef]
- Qin, Z.; Karnieli, A.; Berliner, P. A mono-window algorithm for retrieving land surface temperature from Landsat TM data and its application to the Israel-Egypt border region. Int. J. Remote Sens. 2001, 22, 3719–3746. [Google Scholar] [CrossRef] [Scilit]
- Jimenez-Munoz, J.C.; Cristobal, J.; Sobrino, J.A.; Soria, G.; Ninyerola, M.; Pons, X. Revision of the Single-Channel Algorithm for Land Surface Temperature Retrieval From Landsat Thermal-Infrared Data. IEEE Trans. Geosci. Remote Sens. 2009, 47, 339–349. [Google Scholar] [CrossRef] [Scilit]
- Jimenez-Munoz, J.C.; Sobrino, J.A.; Skokovic, D.; Mattar, C.; Cristobal, J. Land Surface Temperature Retrieval Methods From Landsat-8 Thermal Infrared Sensor Data. IEEE Geosci. Remote Sens. Lett. 2014, 11, 1840–1843. [Google Scholar] [CrossRef] [Scilit]
- Rozenstein, O.; Qin, Z.; Derimian, Y.; Karnieli, A. Derivation of Land Surface Temperature for Landsat-8 TIRS Using a Split Window Algorithm. Sensors 2014, 14, 5768–5780, Erratum in Sensors 2014, 14, 11277. [Google Scholar] [CrossRef] [Scilit] [PubMed]
- Wang, S.; He, L.; Hu, W. A Temperature and Emissivity Separation Algorithm for Landsat-8 Thermal Infrared Sensor Data. Remote Sens. 2015, 7, 9904–9927. [Google Scholar] [CrossRef] [Scilit]
- Liu, J.; Zhao, F.; Wang, Y.; Wang, Y.; Du, S.; Dang, L.; Mallorqui, J.J. Advancing coal fire detection model for large-scale areas based on RS indices and machine learning. Int. J. Appl. Earth Obs. Geoinf. 2025, 140, 104587. [Google Scholar] [CrossRef] [Scilit]
- Singh, N.; Chatterjee, R.S.; Kumar, D.; Panigrahi, D.C.; Mujawdiya, R. Retrieval of precise land surface temperature from ASTER night-time thermal infrared data by split window algorithm for improved coal fire detection in Jharia Coalfield, India. Geocarto Int. 2022, 37, 926–943. [Google Scholar] [CrossRef] [Scilit]
- Nádudvari, Á.; Abramowicz, A.; Fabiańska, M.; Misz-Kennan, M.; Ciesielczuk, J. Classification of fires in coal waste dumps based on Landsat, Aster thermal bands and thermal camera in Polish and Ukrainian mining regions. Int. J. Coal Sci. Technol. 2021, 8, 441–456. [Google Scholar] [CrossRef] [Scilit]
- Mujawdiya, R.; Chatterjee, R.S.; Kumar, D. MODIS land surface temperature time series decomposition for detecting and characterizing temporal intensity variations of coal fire induced thermal anomalies in Jharia coalfield, India. Geocarto Int. 2022, 37, 2160–2174. [Google Scholar] [CrossRef] [Scilit]
- Han, L.; Gao, Q.; Wang, Q.H.; Gao, Z.L.; Wang, Q. Study on burned area extraction based on Sentinel-2 data. J. Nat. Disasters 2023, 32, 123–130. [Google Scholar] [CrossRef]
- Kuenzer, C.; Zhang, J.; Li, J.; Voigt, S.; Mehl, H.; Wagner, W. Detecting unknown coal fires: Synergy of automated coal fire risk area delineation and improved thermal anomaly extraction. Int. J. Remote Sens. 2007, 28, 4561–4585. [Google Scholar] [CrossRef] [Scilit]
- Xu, Y.; Fan, H.D.; Dang, L.B. Detection Method of Fire Area in Xinjiang Wide Area Coalfield Based on TIRS and TCP-InSAR. Metal. Mine 2019, 48, 164–171. [Google Scholar] [CrossRef]
- Vu, T.D.; Nguyen, T.T. Spatio-temporal changes of underground coal fires during 2008–2016 in Khanh Hoa coal field (North-east of Viet Nam) using Landsat time-series data. J. Mt. Sci. 2018, 15, 2703–2720. [Google Scholar] [CrossRef] [Scilit]
- Jiang, W.G.; Wu, J.J.; Gu, L.; Liu, X.C.; Li, X.X. Change monitoring in Wuda coalfield fire area based on remote sensing. J. China Coal Soc. 2010, 35, 964–968. [Google Scholar] [CrossRef]
- Biswal, S.S.; Gorai, A.K. Detection and Delineation of Subsurface Coal Mine Fire from Spaceborne Thermal Infrared Data in Jharia Coalfield, Dhanbad, India. Int. Arch. Photogramm. Remote Sens. Spat. Inf. Sci. 2019, 42, 65–69. [Google Scholar] [CrossRef] [Scilit][Green Version]
- Du, X.M. Thermal Infrared Remote Sensing Based Coal Spontaneous Combustion Detection Method and Change Detection for Coal Fire Areas—A Case Study of the Wuda Coal Field. Ph.D. Thesis, China University of Mining and Technology (Beijing), Beijing, China, 2015. [Google Scholar]
- Shandong First Institute of Geology and Mineral Exploration. Supplementary Exploration Report of Xingsheng Open-Pit Mine; Naomaohu Mining Area, Yiwu County, Xinjiang; Xinjiang Jiangna Mining Co., Ltd.: Hami, China, 2023. [Google Scholar]
- Becker, F.; Li, Z.L. Surface temperature and emissivity at various scales: Definition, measurement and related problems. Remote Sens. Rev. 1995, 12, 225–253. [Google Scholar] [CrossRef] [Scilit]
- Wang, L.; Lu, Y.; Yao, Y. Comparison of Three Algorithms for the Retrieval of Land Surface Temperature from Landsat 8 Images. Sensors 2019, 19, 5049. [Google Scholar] [CrossRef] [Scilit] [PubMed]
- Du, X.; Cao, D.; Mishra, D.; Bernardes, S.; Jordan, T.; Madden, M. Self-Adaptive Gradient-Based Thresholding Method for Coal Fire Detection Using ASTER Thermal Infrared Data, Part I: Methodology and Decadal Change Detection. Remote Sens. 2015, 7, 6576–6610. [Google Scholar] [CrossRef] [Scilit]
- Qin, Z.; Dall’Olmo, G.; Karnieli, A.; Berliner, P. Derivation of split window algorithm and its sensitivity analysis for retrieving land surface temperature from NOAA-advanced very high resolution radiometer data. J. Geophys. Res. Atmos. 2001, 106, 23603–23614. [Google Scholar] [CrossRef] [Scilit]
- Li, J.W.; Xue, S.; Hou, Y.W.; Li, X.W.; Guo, J.L. A high-precision boundary identification method and its application to coal mine fire zone boundary interpretation. J. China Coal Soc. 2024, 49, 2757–2765. [Google Scholar] [CrossRef]
- Li, F.; Wang, Q.L.; Zhao, Y.L.; Qian, A. Coal fires detection study using adaptive-edge threshold algorithm. China Min. Mag. 2019, 28, 152–157. [Google Scholar] [CrossRef]
- Celik, M.; Dadasercelik, F.; Dokuz, A.S. Anomaly detection in temperature data using DBSCAN algorithm. In Proceedings of the 2011 IEEE 19th Signal Processing and Communications Applications Conference, Istanbul, Turkey, 15–18 June 2011; pp. 91–95. [Google Scholar]
- Xie, M.M.; Bai, Z.K.; Fu, M.C.; Zhou, W.; Yuan, T. Effects of land disturbance on surface temperature in large opencast coal mine. J. China Coal Soc. 2011, 36, 643–647. [Google Scholar] [CrossRef]
- Guo, J.Y.; Qi, Y.; Wang, H.W.; Zhang, J.L.; Yang, R.; Cao, Y.P. Variation of land surface temperature and its influencing factors in Muli Coalfield, Qinghai Province. J. Glaciol. Geocryol. 2023, 45, 980–992. [Google Scholar] [CrossRef]
- Yang, Y.L.; Yang, X.; Liu, Y.; Xiao, J.M.; Qian, W.X. Effects of Environmental Change on Climate Data of Naomaohu Station. Desert Oasis Meteorol. 2022, 16, 84–89. [Google Scholar] [CrossRef]
- Yang, Y.; Chang, W.; Zhang, X.D. Historical changes and future scenario projections of extreme temperature cold (warm) index in Xinjiang. Arid. Land Geogr. 2025, 48, 1747–1759. [Google Scholar] [CrossRef]
- Deng, X.R.; Bie, Q.; Huang, C.L.; Shi, Y.; Li, X.Z. Cold island effect of typical oasis landscape pattern in arid region. J. Desert Res. 2025, 45, 12–25. [Google Scholar]

Disclaimer/Publisher’s Note: The statements, opinions and data contained in all publications are solely those of the individual author(s) and contributor(s) and not of MDPI and/or the editor(s). MDPI and/or the editor(s) disclaim responsibility for any injury to people or property resulting from any ideas, methods, instructions or products referred to in the content. |
© 2026 by the authors. Licensee MDPI, Basel, Switzerland. This article is an open access article distributed under the terms and conditions of the Creative Commons Attribution (CC BY) license.