Article

Hidden Heat Before Flames: Multispectral Deep Learning for Early Warning of Concealed Fire Hazards in Insulated Structures

1
Shenyang Fire Science and Technology Research Institute of Ministry of Emergency Management, Shenyang 110034, China
2
National Engineering Research Center of Fire and Emergency Rescue, Shenyang 110034, China
3
Key Laboratory of Fire Prevention Technology of Liaoning Provincial, Shenyang 110034, China
4
Key Laboratory of Urban Fire Monitoring and Early Warning, Ministry of Emergency Management, Shenyang 110034, China
5
State Key Laboratory of Fire Science, University of Science and Technology of China, Hefei 230000, China
*
Author to whom correspondence should be addressed.
Fire 2026, 9(8), 334; https://doi.org/10.3390/fire9080334
Submission received: 8 June 2026 / Revised: 22 July 2026 / Accepted: 30 July 2026 / Published: 4 August 2026
(This article belongs to the Special Issue Fire Detection and Fire Signal Processing)

Abstract

Concealed fires within the insulation layers of buildings, such as cold storage facilities and cinemas, present a serious fire hazard because heat generated by electrical faults can accumulate behind protective panels before ignition and then spread rapidly once combustion begins. Conventional fire detection methods have limited capability to identify these hidden thermal abnormalities at the pre-ignition stage. To address this problem, this paper proposes a deep learning method, called the Multi-Scale Cross-Modal Fusion Network (MSCMFNet), that uses multispectral images to identify abnormal heat sources beneath insulation layers before visible combustion occurs. A standardized experimental platform was developed to accurately simulate subsurface heat sources within the pre-ignition temperature range of insulation materials. Instead of relying on fixed temperature thresholds, the proposed method learns the characteristic spectral patterns produced by hidden heating. It extracts information from different spectral bands, combines these complementary features, and verifies the persistence of detected heat sources over time to reduce false alarms caused by non-fire disturbances. Experimental results demonstrate that the proposed method can effectively detect concealed thermal anomalies before ignition, providing reliable early warning and offering a promising approach to improving fire safety in buildings that make extensive use of insulation materials.

1. Introduction

Special-purpose buildings such as cold storages, indoor ski resorts, and large cinemas have multiplied rapidly across the globe in recent years, driven by advances in modern construction technology. These facilities impose strict indoor temperature control and demand high energy efficiency from their envelopes, which has led to the widespread adoption of organic polymer insulation materials—chiefly expanded polystyrene (EPS) and polyurethane (PU) foam. Although such materials offer excellent thermal insulation, most are combustible or flammable. Once ignited, they release dense toxic smoke, significantly hindering firefighting and occupant evacuation. From a regulatory standpoint, many countries and regions have issued explicit requirements that the combustion performance of insulation in these occupancies must meet specified flame-retardant grades, as set out in ISO 11014:2021 [1] and equivalent national standards, such as China’s GB/T 28009-2025 [2]. Nevertheless, data from real fire incidents show that even insulation materials that comply with flame-retardant standards remain vulnerable to ignition when high-temperature heat sources arise from internal electrical circuit faults. In practice, such fires are typically preceded by a prolonged stage of concealed abnormal heat accumulation beneath the insulation layer, during which no visible flame or smoke is produced. Detecting these early abnormal heat sources—so that intervention can occur before ignition—has become a critical pain point in global building fire safety.
In building sites with internal insulation structures, when electrical faults occur in the wiring within the insulation layer, the generated heat first accumulates locally and then gradually migrates to the outer surface through conduction and structural heat-transfer pathways. Because the heat source is enclosed, it produces neither open flame nor visible smoke in the early stage, while surface reactions are usually weak before visible fire phenomena appear. Moreover, strong environmental thermal noise is often present, making early identification particularly challenging. Traditional point-type heat and smoke detectors cannot penetrate the protective layers or function effectively before smoke is produced, and therefore are largely ineffective for detecting the early abnormal heating stage of fires beneath or inside insulation layers. In recent years, researchers have explored several sensing approaches for such concealed heat sources. Embedded thermocouples or temperature-sensing cables [3,4] can measure internal temperatures directly, but they must be installed within the insulation layer, which compromises the integrity of the insulation and brings significant installation, maintenance, and future operation difficulties. Distributed fiber-optic temperature measurement [5] enables temperature monitoring along a path, yet its spatial resolution is limited, and the fiber must be closely attached to the structure being monitored, which makes it difficult to cover large-area insulation walls in existing buildings. Integrating conductive networks and flame-retardant components into insulation materials has produced smart flame-retardant materials [6] that can self-alarm at an early stage of a fire while preserving the material’s flame-retardant properties. Yet both of these methods come with practical limitations. For smart materials, self-alarming requires the existing insulation layer to be removed and replaced, pushing retrofitting costs to prohibitive levels and limiting the approach mainly to new construction. Gas-odor recognition, on the other hand, is easily disrupted by ambient air currents and other volatile substances, and its accuracy drops off markedly in large or well-ventilated spaces.
Compared with the above techniques, infrared thermography holds greater potential because it is non-contact, is suitable for large-area monitoring, requires no structural modifications, and is less affected by air movement than gas sensing. Infrared detection identifies thermal anomalies by capturing changes in the thermal radiation energy emitted from the target surface, but its accuracy is substantially affected by atmospheric attenuation and variations in surface emissivity. Most existing infrared methods rely on a single LWIR band and make alarm decisions based on temperature thresholds or abnormal temperature-rise rates. However, weak subsurface thermal anomalies at the pre-ignition stage can easily be masked by background and surface-temperature fluctuations. The signal-to-noise ratio of single-band radiation signals is therefore limited, making it difficult to distinguish early abnormal heat sources beneath the insulation layer from normal environmental variations.
More importantly, existing thermal-imaging fire detection algorithms are generally built on fire characteristics observed in open flames or extremely high-temperature scenarios. Electrical short-circuit fires within insulation, however, are low-temperature, slow heat-conduction processes without open flames and often without obvious smoke. The intensity and spectral morphology of their radiation signals differ markedly from those of conventional open-flame fires. Multispectral technology can acquire thermal radiation characteristics in different spectral bands, but current multispectral fusion algorithms are mainly oriented toward recognizing high-temperature fire sources and do not adequately consider how insulation-layer structures attenuate different wavebands during the early abnormal-heating stage. In these special settings, the infrared extinction coefficients and spectral transmittances of insulation materials fluctuate noticeably with changes in ambient temperature. When processing such attenuated multispectral data, existing algorithms fail to accurately extract the weak thermal-anomaly signals that precede visible combustion, leading to severely insufficient detection accuracy. This limitation creates a clear research need for multispectral collaborative detection.
Multispectral detection works by measuring radiation in different bands, which can generate richer information than using a single infrared band. As stated in Planck’s law and Wien’s displacement law, the dominant wavelength of thermal radiation varies with the target temperature. In the case of early concealed heating within the insulation layer, long-wave infrared (LWIR, 7.5–14.0 μm) is highly suitable for capturing low-temperature surface radiation and drawing an overall temperature distribution map. As the thermal radiation intensity of the heat source beneath the insulation material increases, mid-wave infrared (MWIR, 3.7–4.8 μm) becomes increasingly useful, adding details of local heating and spatial thermal gradients. Although short-wave infrared (SWIR, 0.9–2.0 μm) has a slower response to low-temperature thermal emission, it can still provide supplementary information related to surface reflectivity and local radiation changes. Therefore, the fusion of SWIR, MWIR, and LWIR images provides a feasible method for detecting abnormal heat sources hidden beneath the surface of insulation materials before visible combustion occurs.
Some studies have already applied multispectral or dual-band infrared to fire-related problems. For indoor fire rescue where smoke occlusion hampers personnel detection, fusing near-infrared (NIR) and thermal infrared (TIR) images, combined with global–local feature alignment and frequency-domain attention, has been shown to achieve high-precision person localization in smoky environments [7]. In forest fire monitoring, synthesizing night-vision and pseudo-thermal infrared representations from RGB images has allowed for the construction of a hardware-free multimodal classification framework that performs well on the FLAME and FireStage datasets [8]. For special spaces such as large aircraft hangars, lightweight models based on single thermal infrared images have been designed to detect open flames efficiently while meeting the real-time requirements of edge deployment [9]. Most existing work, however, targets open flames or high-temperature thermal anomalies—cases where radiation contrast is strong and target shapes are distinct. The algorithms developed for those scenarios are ill-suited to the weak, low-temperature abnormal heating that occurs inside insulation layers at the pre-ignition stage. In terms of multimodal fusion, the common practice is to combine thermal infrared with visible or near-infrared images; however, the joint use of SWIR, MWIR, and LWIR for early warning of subsurface thermal hazards remains largely unexamined.
Deep learning has demonstrated powerful feature extraction and cross-modal association capabilities, and a large body of representative work has emerged in recent years in fields such as remote sensing and object detection. Multispectral fusion strategies can be grouped by where the combination occurs in the processing pipeline: data-level, feature-level, and decision-level fusion. Wavelet decomposition combined with deep learning has also been applied to fuse noisy images [10]. Data-level fusion, however, demands strict pixel-level alignment and incurs substantial computational cost, making it difficult to implement on resource-constrained embedded detection terminals. Decision-level fusion processes each band independently to obtain preliminary results before combining them at the decision stage. The UAV-based multispectral landmine detection method proposed in [11] adopts a detection-driven joint fusion architecture that improves fusion quality and detection performance, but this approach cannot fully exploit the complementarity of intermediate-layer features and has limited ability to capture weak signals. Current mainstream research therefore concentrates on feature-level fusion, which uses separate branches to extract per-band features and then fuses them interactively, striking a balance among computational efficiency, fusion accuracy, and the retention of key information.
For backbone networks, residual architectures—exemplified by ResNet [12]—remain the dominant choice in multispectral fusion tasks. Skip connections effectively alleviate gradient degradation in deep networks, thereby offering a stable foundation for multi-band feature extraction. Other classic convolutional networks, including VGGNet [13], EfficientNet [14], and ConvNeXt [15], are also widely adopted across multispectral detection tasks of varying complexity. The lightweight MobileNet series [16] is particularly suited for resource-constrained edge deployment. The Vision Transformer [17], by contrast, has shown considerable promise for target recognition in complex backgrounds, owing to its global modeling capability.
Improvements to fusion units have largely centered on attention mechanisms and multi-scale structures. Channel attention modules—such as Squeeze-and-Excitation (SE) [18] and Efficient Channel Attention (ECA) [19]—recalibrate channel-wise feature responses to emphasize informative channels while suppressing irrelevant ones. ECA delivers performance comparable to SE at a significantly lower computational cost, a feature that makes it especially attractive for edge deployment. The Convolutional Block Attention Module (CBAM) [20] extends this idea by integrating both channel and spatial attention branches, adaptively weighting features along both dimensions to reduce redundancy. Transformer-based self-attention [21] and cross-attention mechanisms have further demonstrated strong capabilities in capturing long-range spatial dependencies and cross-modal feature interactions, thus providing a robust tool for global modeling of multispectral data. Multi-scale feature extraction can simultaneously capture the local texture of small hotspots and the global distribution of large-area heat conduction.
Despite the impressive results these algorithms have achieved in their respective domains, their original designs are not tailored to the characteristics of concealed abnormal heat sources within insulation layers at the pre-ignition stage. When applied directly to this scenario, several shortcomings become apparent. In particular, the receptive field of shallow features may be ill-suited to capturing small and weak abnormal-heating regions, and general fusion strategies often fail to distinguish true subsurface heat accumulation from environmental thermal disturbances. These limitations mean that existing multispectral fusion algorithms cannot readily meet the early-warning requirements for concealed insulation-layer fires. A dedicated network architecture that combines multi-scale feature extraction, cross-modal attention fusion, and temporal verification is therefore needed.
To address the above bottlenecks, this work investigates an early detection method for abnormal heat sources beneath insulation layers, aimed at providing a pre-ignition warning for concealed insulation-layer fires, which relies on multispectral imaging and deep learning. Rather than depending on a single infrared temperature threshold, we formulate early warning as a multispectral feature-pattern recognition problem linked to abnormal heat accumulation prior to visible combustion. We constructed a standardized subsurface thermal-fault simulation device to replicate the heat-transfer process caused by internal electrical faults inside insulation. Multispectral image data covering the SWIR, MWIR, and LWIR bands were collected under different materials, interface temperatures, and interference conditions. A multi-scale cross-modal fusion network was then designed to integrate complementary information from the three bands through hierarchical feature extraction and cross-attention fusion. The proposed method is intended to detect weak early thermal-anomaly cues under strong background interference and to provide timely warning before visible combustion occurs.

2. Materials and Methods

Accurate detection of hidden fire in insulating materials needs to capture the weak multispectral signals generated in the early stage of hidden heat storage. In order to obtain reliable data from these signals, a standardized and repeatable early fire abnormal heat source simulation device is very important for experimental research. The existing constant-temperature heating table has been used in this kind of research, but it has significant limitations. Specifically, the temperature monitoring system of the traditional constant-temperature heating table only measures the central temperature below the surface of the heating table, does not provide information on the uniformity of the heating surface, and does not monitor the actual temperature at the interface between the heat transfer surface and the insulating material. These limitations lead to a large deviation between the experimental data and the actual heating scene, which reduces the accuracy of the collected spectral data and the performance of the subsequent algorithm model.
To solve these shortcomings, this study developed an improved abnormal heat source simulation device beneath thermal insulation materials, which provided a reliable and repeatable experimental platform for spectral data acquisition in abnormal heat source detection research for subsurface concealed-fire early warning under thermal insulation materials, and laid the foundation for multispectral analysis. On this basis, a multi-scale cross-modal fusion network named MSCMFNet was further designed to identify weak hidden thermal anomaly clues under complex background conditions. The overall research process includes the construction and validation of the subsurface thermal fault simulation device, multispectral dataset acquisition, network architecture design, loss function design, and model training and evaluation settings.

2.1. Insulation Material Subsurface Thermal Fault Simulation Device

2.1.1. High-Purity Graphite Heat Conduction Interface

Due to the anisotropy of thermal conductivity and significant edge heat dissipation, the temperature distribution of traditional metal heating panels is uneven. These temperature gradients make it difficult to achieve uniform heating in subsurface abnormal heat source simulation for concealed fire research. In order to overcome this problem, the device uses high-purity graphite plate as the heat conduction interface. Graphite has extremely high thermal conductivity and isotropic thermal conductivity, which ensures the rapid and uniform diffusion of heat on the heating surface.
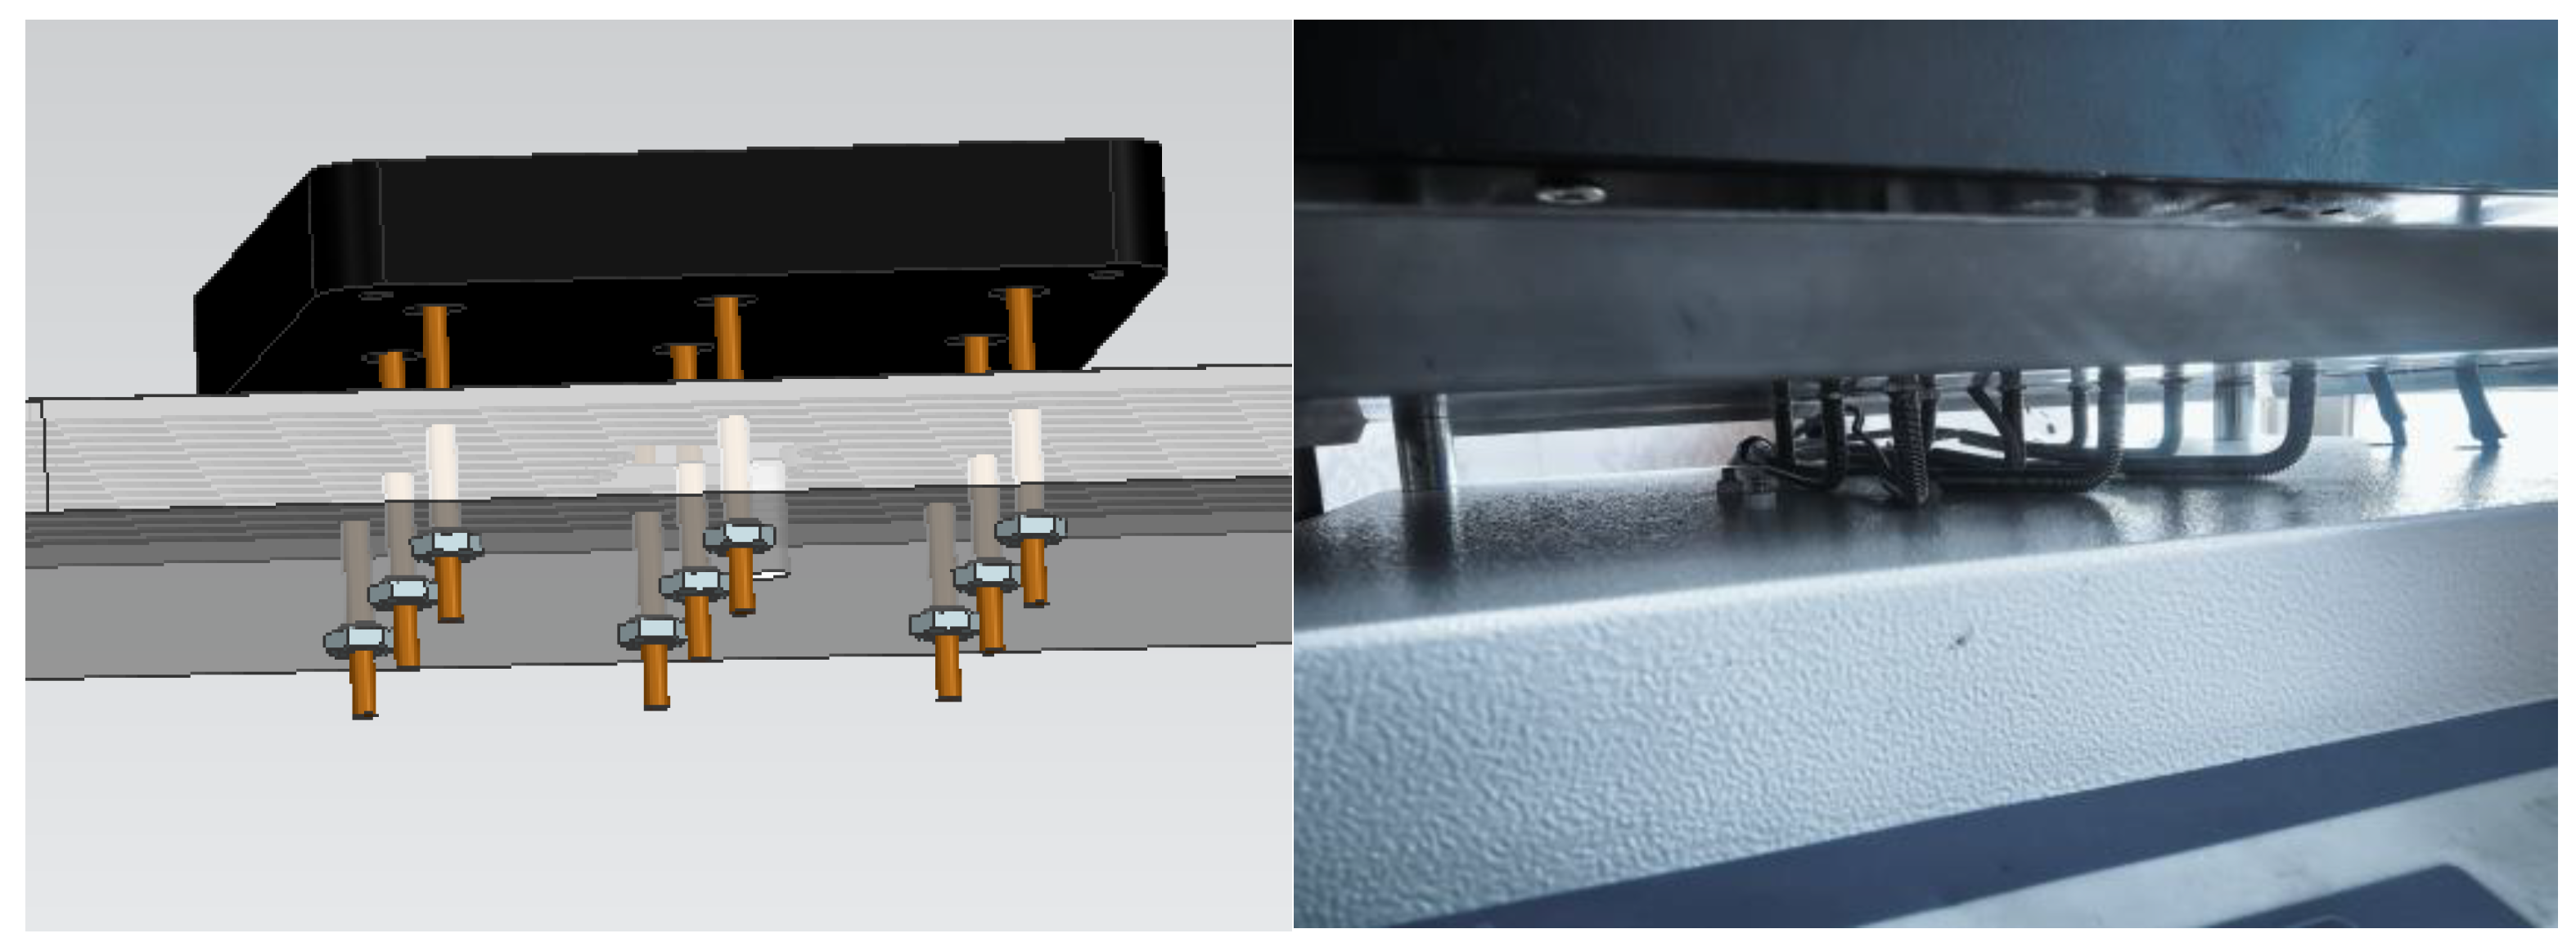
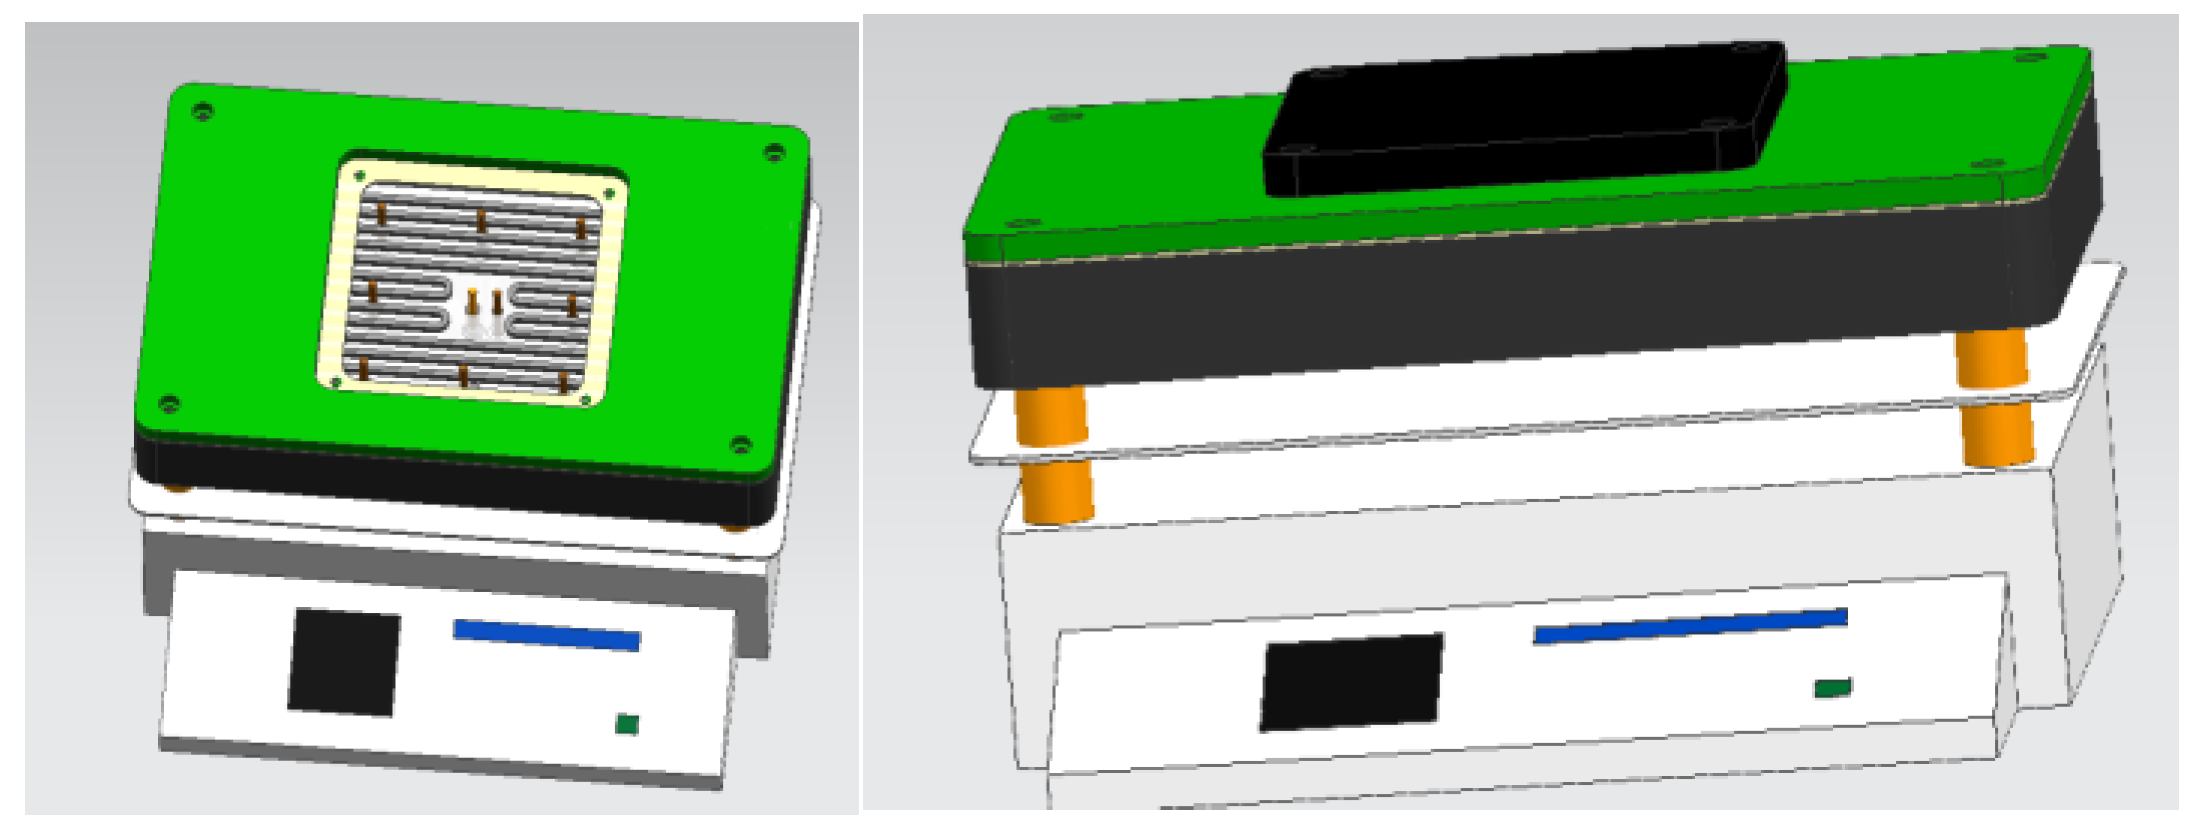
The graphite plate, with an effective heating area of 0.08 m2 and an optimized thickness of 5 mm, was fabricated using water cutting technology to achieve high precision. The flatness error of the plate’s surface was controlled to within 0.1 mm, ensuring tight contact with both the heating substrate and insulation material specimens. Both the upper and lower surfaces were polished to minimize interface thermal resistance, further enhancing heat-transfer efficiency. These improvements significantly reduce thermal anomalies caused by poor surface contact, ensuring that heat is uniformly distributed to the insulation material samples. A structural diagram of the heating table is shown in Figure 1.

2.1.2. Nine-Point Penetrating Temperature Acquisition System

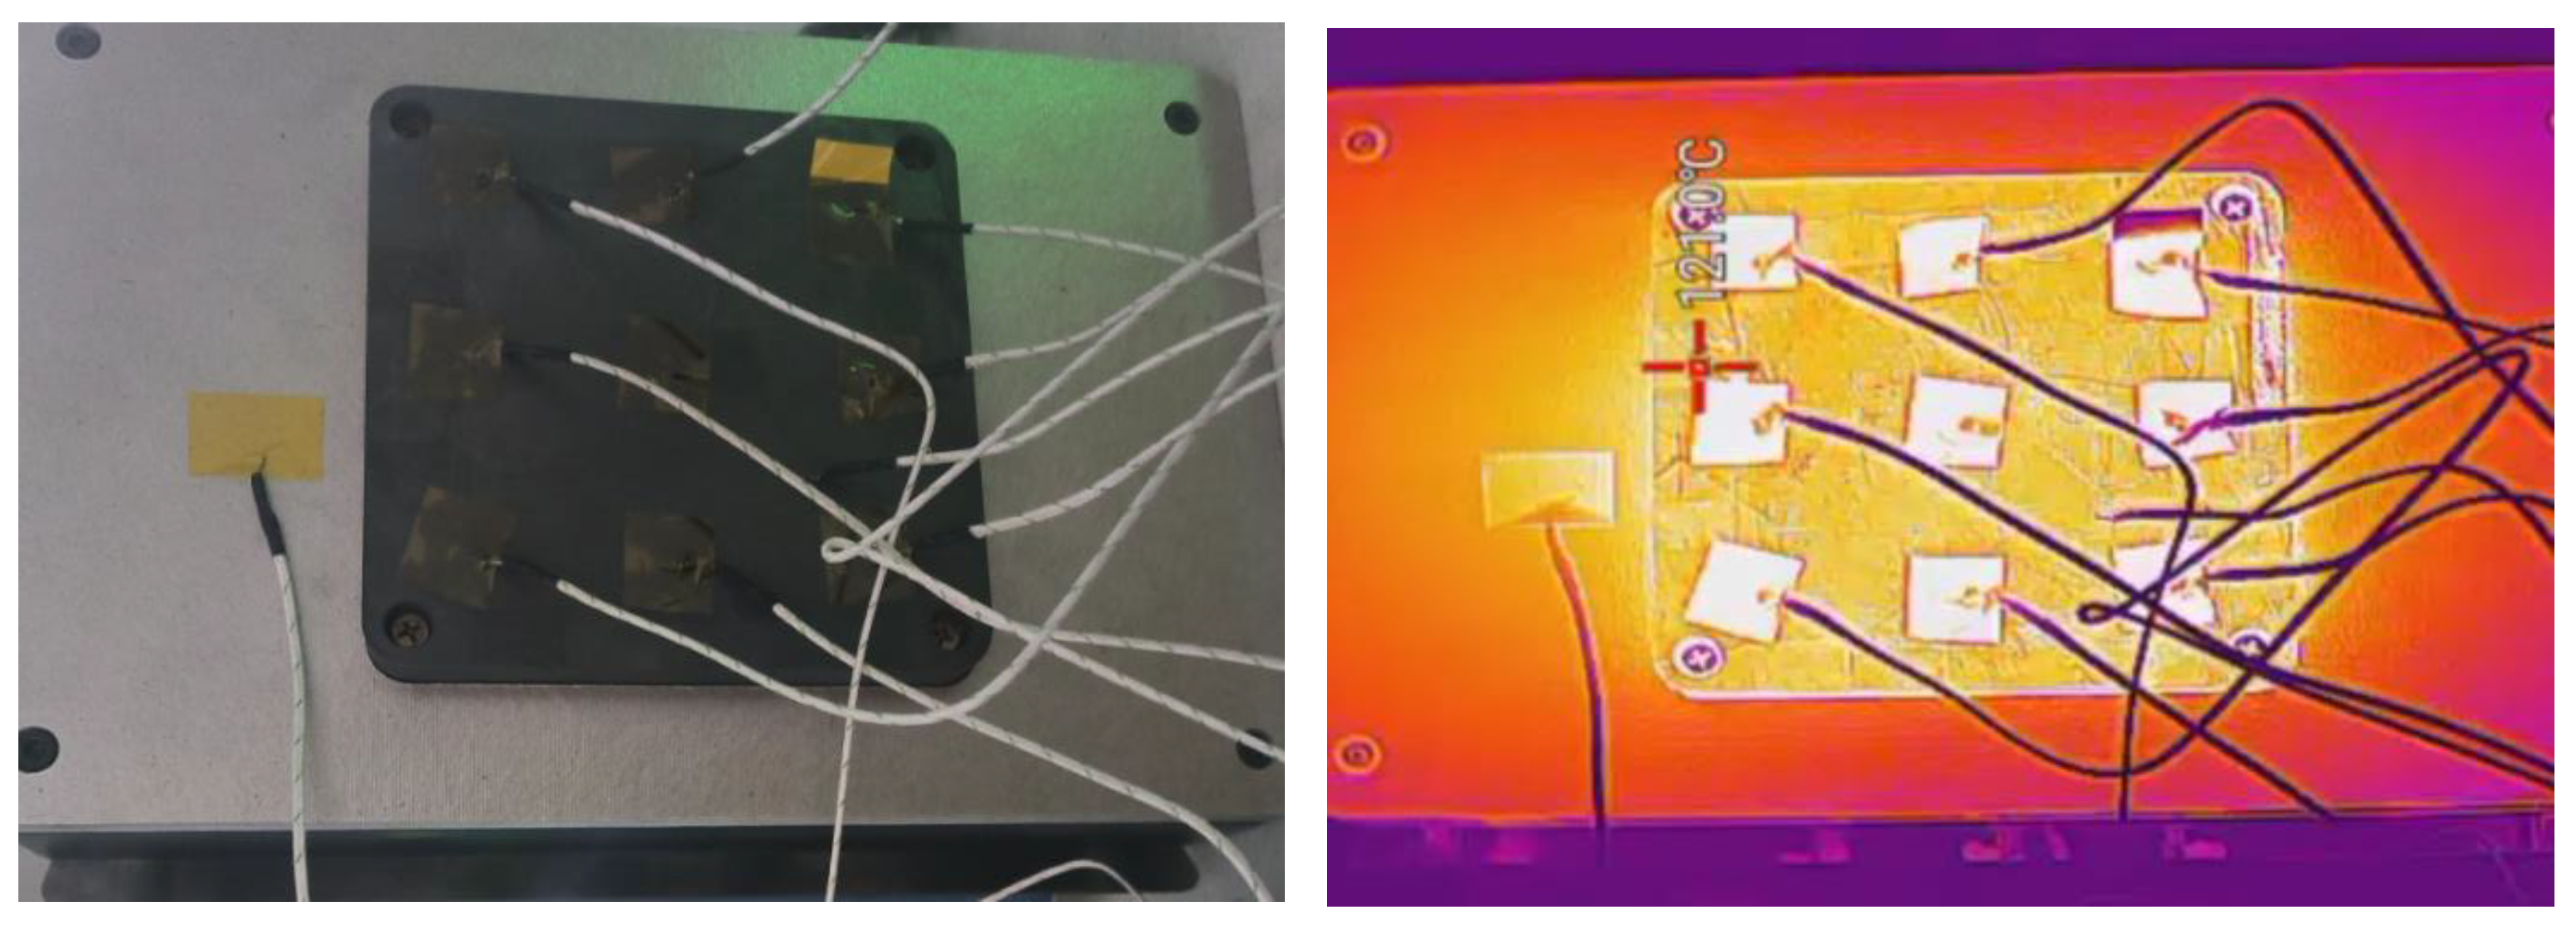
A key limitation of traditional heating tables is that thermocouples are usually placed below the heating surface, so it is impossible to accurately measure the temperature between the heating surface and the insulating material. Therefore, we designed a set of 3 × 3 matrix mode 9-point penetration temperature acquisition systems. Nine K-type thermocouples are evenly distributed in the whole heating area of the graphite plate, covering the center, edge midpoint and corner.
Thermocouples are installed vertically through the machining hole at the bottom of the heating table. Their tips are ground flush with the top surface of the graphite plate to ensure direct contact with the insulating material. This design eliminates additional thermal resistance and prevents physical gaps between the heated surface and the material being tested. The system synchronously collects the signals of 9 thermocouples and calculates the average temperature of 9 points in real time to represent the temperature of the whole heating surface.
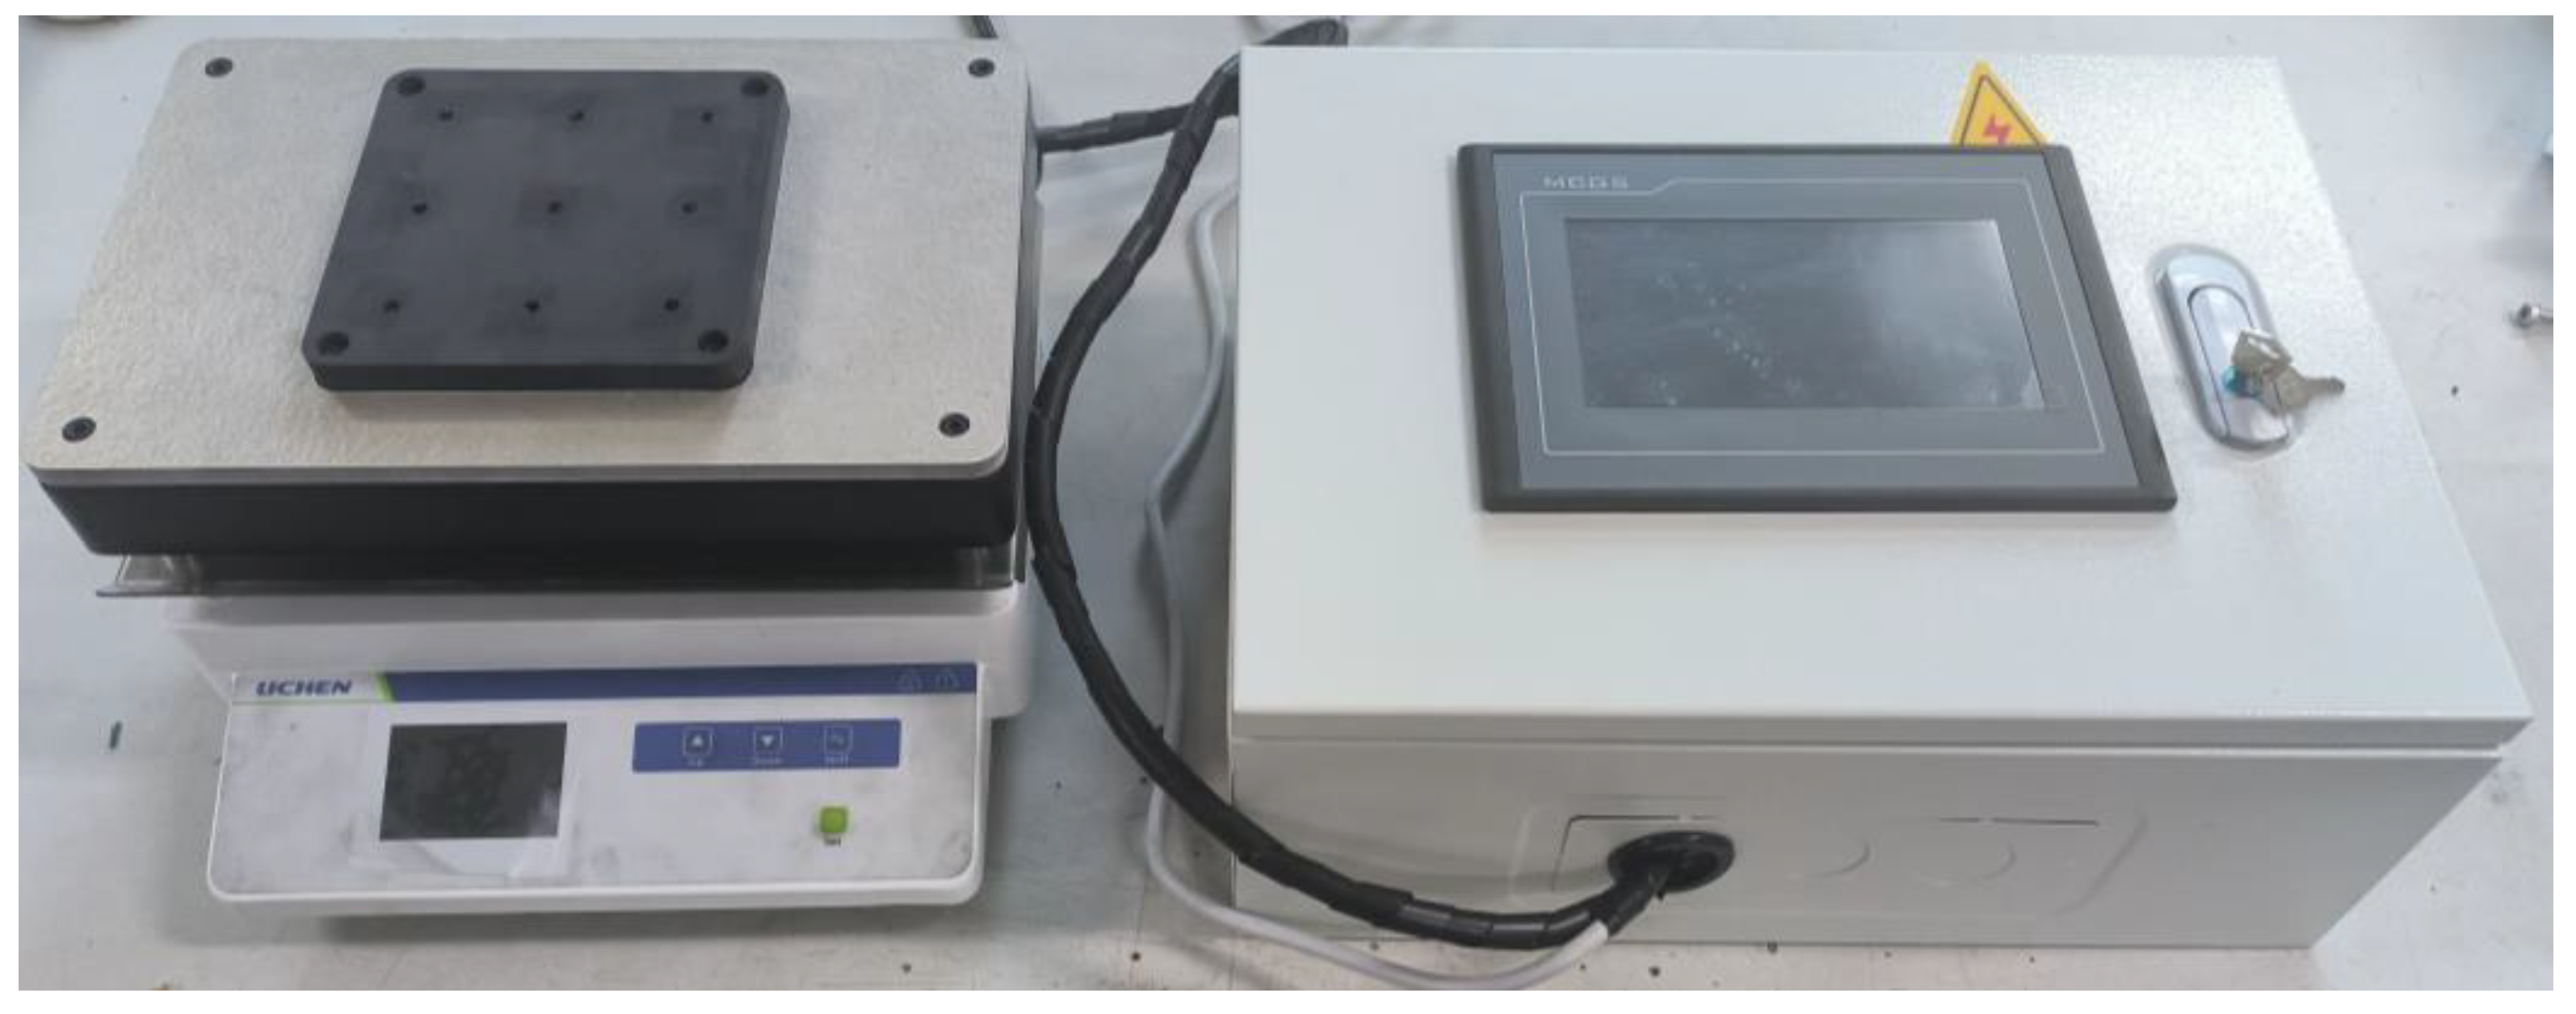
The top two images in Figure 2 show the schematic diagram of the temperature acquisition system design and the actual images of its implementation. The following figure shows the overall composition of the Insulation Material Subsurface Thermal Fault Simulation Device. The left side is the designed heating table, and the right side is the centralized temperature collection and display device.

2.1.3. Performance Validation of the Heating Device

In order to verify the temperature uniformity of the proposed device, a series of performance tests were carried out within the set temperature range of 100 °C, 200 °C and 300 °C. During each test, the thermocouple data at 9 points were recorded continuously within 30 min after the temperature field fully diffused, achieved uniform distribution and entered a quasi-steady state. Patch thermocouples were installed at 9 holes on the graphite plate at the same time to cross-verify the measurement results, collect thermal imaging data, and evaluate the temperature distribution.
The results show that within the whole temperature range, the maximum deviation between the measured value of 9 points and the set temperature is within ± 3 °C, which meets the accuracy requirements of simulating the early-stage abnormal heat source beneath thermal insulation materials for subsurface concealed-fire early warning. In addition, the data for surface-mounted thermocouples are closely consistent with the measured values of thermocouples. The thermal images confirmed these findings, showing a uniform orange color without obvious hot or cold spots on the whole heated surface. These results confirm that the graphite-based device has higher temperature uniformity than the traditional heating table. The summary of the heating uniformity test is shown in Figure 3.

2.1.4. Instantaneous Heating Strategy for Simulating Electrical Faults

In order to simulate the sudden temperature rise caused by electrical short-circuit arcs in the insulation layer, the device adopts a strategy of preheating before contact, rather than gradually heating up. During this process, the graphite platform is first heated to the target temperature while being isolated from the insulating material. Once the 9 o’clock thermocouple system confirms that the entire surface temperature has reached the set temperature and is uniformly stable, use the fixing device on the bracket to quickly and tightly contact the heating table surface with the insulation material sample. This operation is completed in less than 2 s, simulating the instantaneous high temperature caused by the occurrence of a short circuit fault.

2.2. Multi-Scale Cross-Modal Fusion Network

2.2.1. Algorithm Design

In order to solve the problems of weak surface response to early abnormal heat sources of subsurface concealed fires and strong background thermal noise below the surface of insulation materials, this study proposes a multi-scale cross modal fusion network named MSCMFNet. The core idea of our method is to utilize the complementary characteristics of SWIR, MWIR, and LWIR images. Through frequency band-specific feature extraction, hierarchical feature fusion, adaptive cross modal weighting, and time validation, this network aims to identify weak hidden thermal anomaly clues under complex background conditions and express the warning as a multispectral pattern-recognition problem for concealed abnormal heating within insulation layers, rather than as a simple surface-temperature thresholding problem. At the same time, a multi-frame time verification mechanism was further introduced to filter transient environmental interference and improve alarm stability.
The algorithm design rests on three considerations. For band-specific feature extraction, independent branches are built to handle distinct imaging characteristics: the SWIR branch captures fine-scale surface texture, reflectance, and local radiometric variations; the MWIR branch emphasizes localized heating patterns and spatial thermal gradients; and the LWIR branch characterizes the overall low-temperature surface thermal field while suppressing interference from stable background heat sources. Regarding progressive cross-modal fusion, a two-stage strategy is adopted. Features from SWIR and MWIR are first fused to enhance local abnormal cues; the resulting representation is then integrated with LWIR features to incorporate global thermal distribution information. Cross-attention dynamically adjusts the contribution of each band. For spatio-temporal joint decision-making, the final alarm relies not solely on spatial features from a single frame, but also on temporal evolution across consecutive frames. This design improves robustness in complex monitoring environments.

2.2.2. Overall Architecture of MSCMFNet

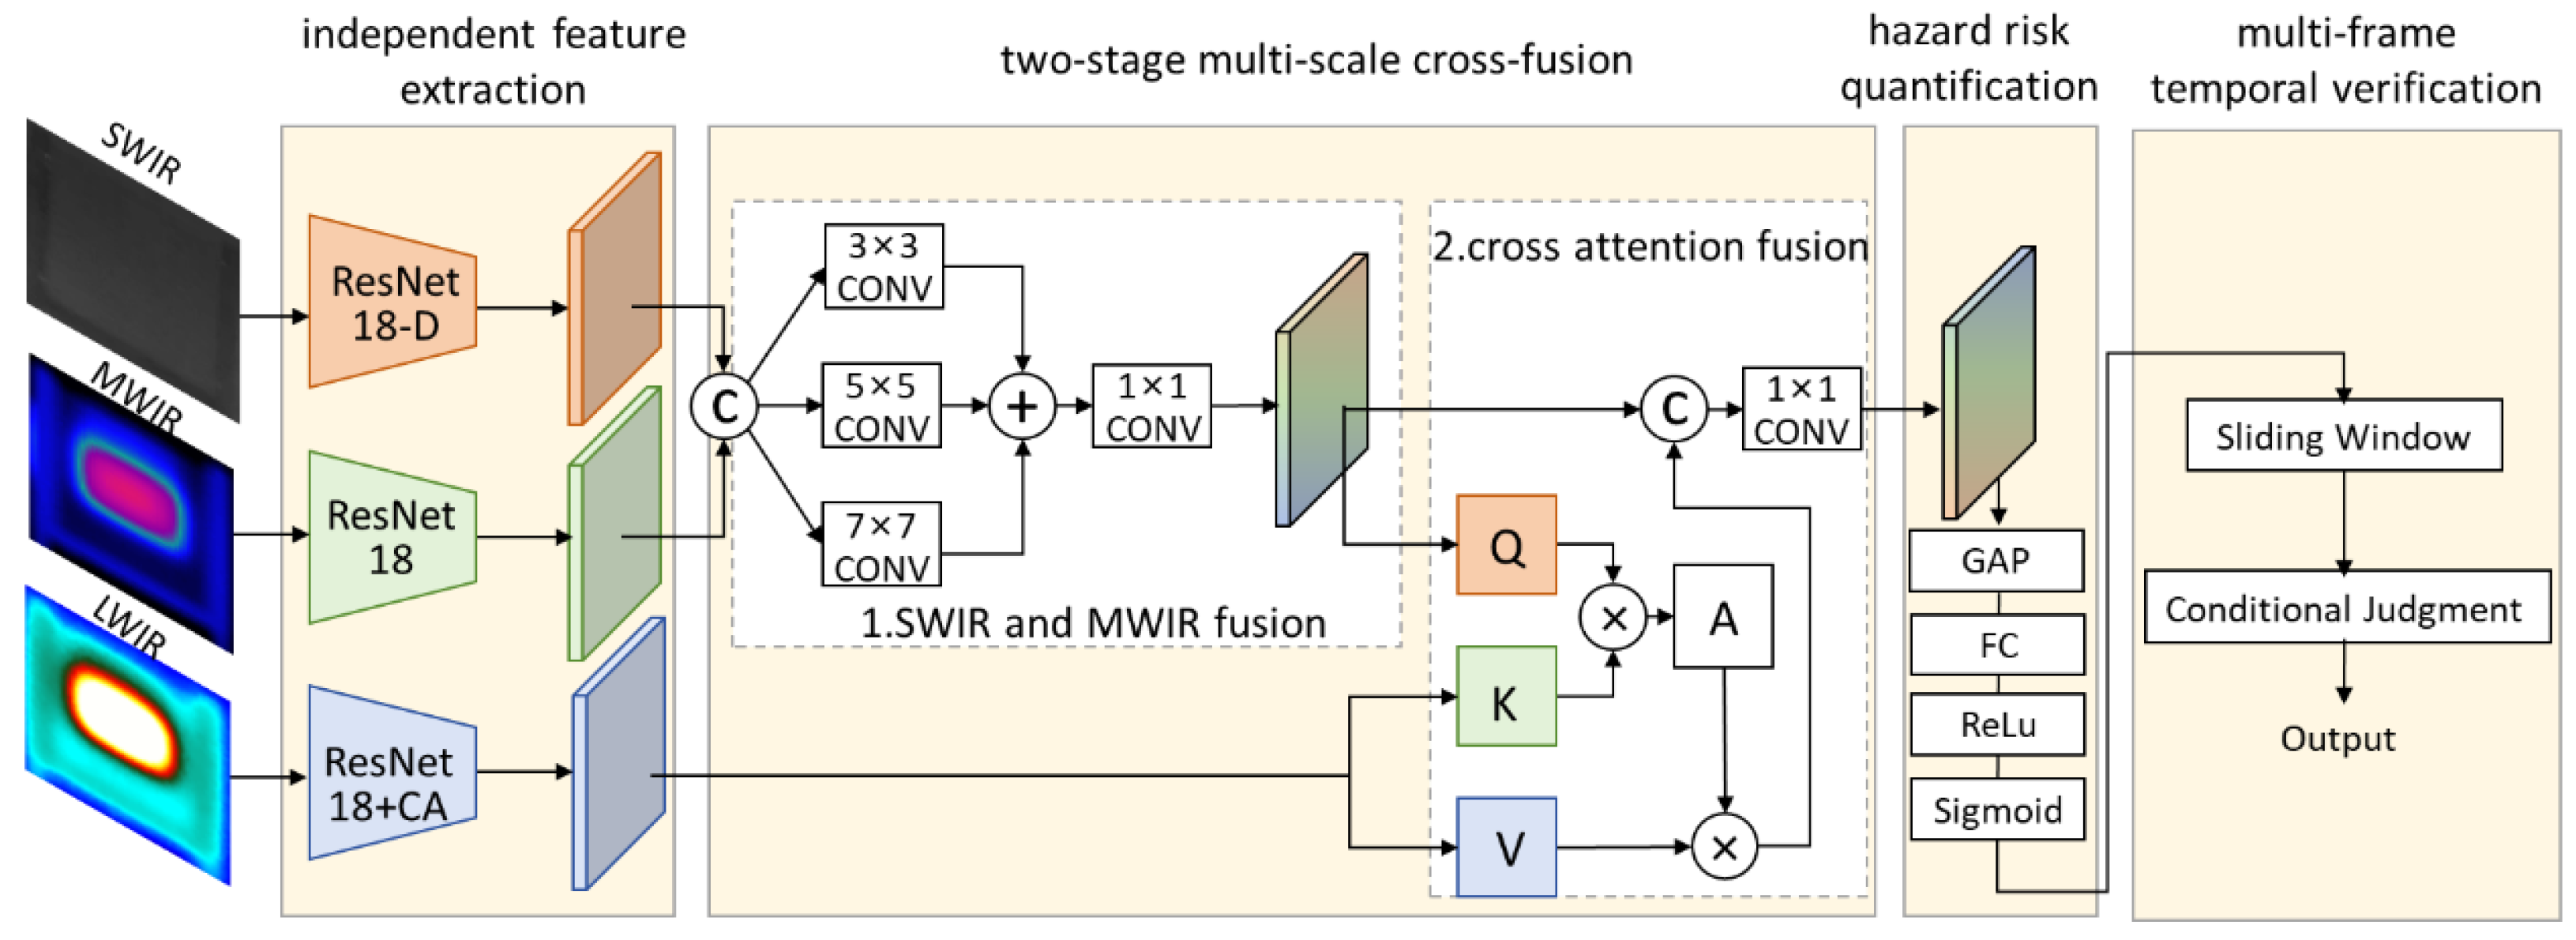
The overall architecture of MSCMFNet consists of four sequentially connected modules: a multi-band independent feature extraction module, a two-stage multi-scale cross-fusion module, a hidden danger risk quantification module, and a multi-frame temporal verification module. The data processing flow is as follows. First, the synchronously acquired three-band images are denoted as the short-wave image I s , the mid-wave image I m , and the long-wave image I l , respectively. Each image is input into the corresponding feature extraction branch, and each branch computes a set of multi-scale primary features. These features are then sent to the first stage of the fusion module, which integrates the SWIR and MWIR feature maps into a short-mid wave fusion feature F s m . Subsequently, this intermediate feature map is fused with the long-wave feature F l in the second stage of the fusion module to generate the final multispectral fusion feature F f u s e d . The hidden danger risk quantification module then analyzes F f u s e d and outputs the current single-frame abnormal heat source hazard probability. Finally, the multi-frame temporal verification module performs spatio-temporal correlation analysis on the probability results of consecutive N frames and outputs the final fire risk level of the system. The overall network structure is shown in Figure 4.

2.2.3. Multi-Band Independent Feature Extraction Module

Considering the computational resource constraints of edge-deployment hardware, all three band feature extraction branches adopt the lightweight ResNet18 as the backbone network. Let the function F b a c k b o n e · ; θ denote the ResNet18 architecture with parameters θ .
In order to capture the details of small abnormal heating areas, we removed the last downsampling layer of the backbone network in the SWIR branch B s , which can maintain higher spatial resolution in the output feature map. In the MWIR branch B m , we maintained the complete ResNet18 structure to effectively extract spatial temperature gradient features, which is crucial for distinguishing abnormal heat sources from normal temperature fluctuations. In the LWIR branch B l , we integrate channel attention mechanism into the basic backbone network, enabling it to automatically learn and suppress features from constant background heat sources such as pipelines and lighting fixtures while highlighting areas of abnormal temperature changes.
Then, we adjust the feature maps output by the three branches to a uniform size through an adaptive average pooling layer, providing standardized representations for subsequent fusion operations:
F s =   A d a p t i v e A v g P o o l B s I s
F m = A d a p t i v e A v g P o o l B m I m
F l = A d a p t i v e A v g P o o l B l I l
where F s , F m , F l R H × W × C , and in this implementation, H = 28, W = 28, C = 256.

2.2.4. Two-Stage Multi-Scale Cross-Fusion Module

The two-stage multi-scale cross-fusion module is the core of the algorithm, aiming to integrate the spectral complementary information of the three bands. The first stage completes the intermediate fusion of SWIR and MWIR features. First, F s and F m are concatenated along the channel dimension to obtain F c a t = [ F s ; F m ]. Subsequently, this joint feature map undergoes multi-scale feature extraction through three parallel convolution branches with different kernel sizes, and the generated features are fused through element-wise addition. This operation can simultaneously capture local details and global spatial context:
F 1   =   C o n v 3 × 3 F c a t
F 2 = C o n v 5 × 5 F c a t
F 3 = C o n v 7 × 7 F c a t
F s m = F 1 F 2 F 3
where denotes element-wise addition, and each convolution operation is followed by batch normalization and a ReLU activation function. Finally, the number of channels of F s m is compressed back to C through a 1 × 1 convolution. Then, by integrating the intermediate representation F s m and the long-wave feature F l through a cross-attention fusion unit, which can adaptively adjust the contribution of the two modalities according to the dependencies between features. Learnable linear projections are used to generate queries from the fused features and keys and values from the long-wave features:
Q   =   F s m   W q
K = F l   W k
V = F l   W v
where W q , W k , W v   R C × d are the weight matrices of 1 × 1 convolutions, and d is the dimension of the embedding space. Subsequently, the attention affinity matrix A is calculated through scaled dot-product operation, which quantifies the correlation between each spatial position of F s m and F l :
A   = s o f t m a x Q K T d
Attention map A is used to weight and aggregate the long-wave features to obtain F a t t =   A V . This operation selects the most relevant information from F l to the content of F s m . The final multispectral fusion feature map is generated by connecting the original intermediate features with the attention filtered output, and then using a projection layer:
F f u s e d = P r o j F s m ; F a t t
where P r o j · is a 1 × 1 convolution used to restore the number of channels to C. The mechanism we designed enables the network to dynamically adjust the weights of LWIR branches. Specifically, when background noise dominates, the model suppresses the F a t t component. When there is a real but weak thermal signal, the relevant SWIR/MWIR mode will automatically enhance the useful information of LWIR.

2.2.5. Hazard Risk Quantification and Temporal Verification

The hazard risk quantification module maps the final fusion feature map F f u s e d to a scalar probability p, representing the possibility of abnormal heat source hazard associated with concealed insulation-layer fires in the current frame. This is specifically implemented sequentially through global average pooling and a fully connected network. The global average pooling operation compresses the spatial dimension of F f u s e d by calculating the mean of each feature map to obtain a one-dimensional feature vector v:
v   =   1 H × W 1 H F f u s e d i ,   j
This vector is then transformed through two fully connected layers, with ReLU activation in between, and finally normalized to the (0, 1) interval through the sigmoid function.
p = s i g m o i d   W 2 R e L U W 1 v + b 1 + b 2
where W 1   R C × C / 2 , b 1   R C / 2 and W 2   R C / 2 × 1 , b 2   R C / 2 are the learnable parameters of the classifier. For engineering application convenience, the continuous probability p is mapped to discrete alarm levels: Safe ( p   <   0.3 ), Warning ( 0.3   p   <   0.7 ), and Alarm ( 0.7   p ).
In order to avoid false alarms caused by interference such as device operating temperature, the algorithm adopts a sliding window time verification mechanism. Let p t be the frame-level abnormal heat source risk probability for subsurface concealed-fire assessment at time t , and the system maintains a queue containing the probabilities of the most recent N frames { p t N + 1 , , p t } , where N = 10 in this experiment. Only when both conditions are met simultaneously within the sliding window will a clear alarm state be triggered. The first condition is that the probability of exceeding the majority of frames in the window exceeds the warning threshold, that is
i = 0 N 1 I ( p t i > 0.3 ) > τ N
where I ( · ) is the indicator function, and τ N = 7. The second condition requires that the probability sequence exhibits a continuous upward trend to ensure that the thermal signal not only persists but also intensifies, which is determined by the positive slope of the linear regression of the probability values within the window. This joint spatial and temporal constraint makes the final decision of the system robust to transient noise.

2.2.6. Loss Function Design

The loss function of MSCMFNet is used to solve the extreme class imbalance problem in early abnormal heat source detection for concealed insulation-layer fires, and embeds physical priors related to heat-conduction processes. The total loss L t o t a l consists of a weighted sum of three components: focal loss L f o c a l , smooth L1 loss L s m o o t h , and physical constraint loss L p h y s . Focal loss is the main driving force for the classification task, aiming to alleviate the problem of simple negative samples dominating the training process. For a sequence containing T frames with ground truth labels y t   { 0,1 } , the focal loss is defined as follows:
L f o c a l =   1 T t = 0 T y t α 1 p t γ l o g p t +   1 y t 1 α p t γ l o g 1 p t
where p t is the predicted probability. A weighting factor α is introduced to trade off with the importance of positives and negatives. Meanwhile, the focusing parameter γ reduces the contribution of samples that are already easy to classify—this shifts the model’s attention toward those hard-to-distinguish early abnormal-heating cases.
For the output sequence of predicted probabilities, we impose a smooth L1 loss. Its role is to encourage temporal coherence and dampen abrupt frame-to-frame fluctuations. That is, it penalizes sudden changes between consecutive outputs. Formally,
L s m o o t h = 1 T 1 t = 2 T s m o o t h L 1 p t p t 1
where the s m o o t h L 1 function is defined as follows:
s m o o t h L 1 x = 0.5   x 2 ,   x <   1 x   0.5 , x 1
The physical constraint loss injects a key inductive bias in the learning process: the real heat source controlled by thermal conduction has a stable and continuous temperature change characteristic and should not exhibit instantaneous jumps. When the probability change between adjacent frames exceeds the physically reasonable threshold δ, this loss term will penalize the prediction, thereby guiding the model away from false correlations caused by sensor noise.
L p h y s = 1 T 1 t = 2 T [ m a x 0 , p t p t 1 δ ]
In this experiment, the threshold δ is set to 0.15. The final training objective is a linear combination of these three loss terms, with weight coefficients λ f , λ s , and λ p determined through grid search on the validation set:
L t o t a l = λ f L f o c a l + λ s L s m o o t h + λ p L p h y s
Among them, λ f is set to 0.4, and λ s and λ p are set to 0.3. This composite loss function not only optimizes the accuracy of the network for frame-by-frame classification but also endows the model with certain temporal reasoning capabilities and physical consistency, thereby achieving more reliable and robust early detection performance.

2.3. Dataset Construction and Experimental Settings

To comprehensively verify the effectiveness of the proposed MSCMFNet algorithm in the early detection of concealed abnormal heat sources beneath insulation layers for subsurface concealed-fire early warning, this section systematically elaborates on three aspects: dataset construction, ablation experiments, and comparative experiment design. The objectives of the experiments are to validate the performance advantages of the multispectral fusion strategy over single-band detection, quantify the contribution of each module, and evaluate the robustness of the algorithm under complex environmental interference.

2.3.1. Multispectral Imaging System

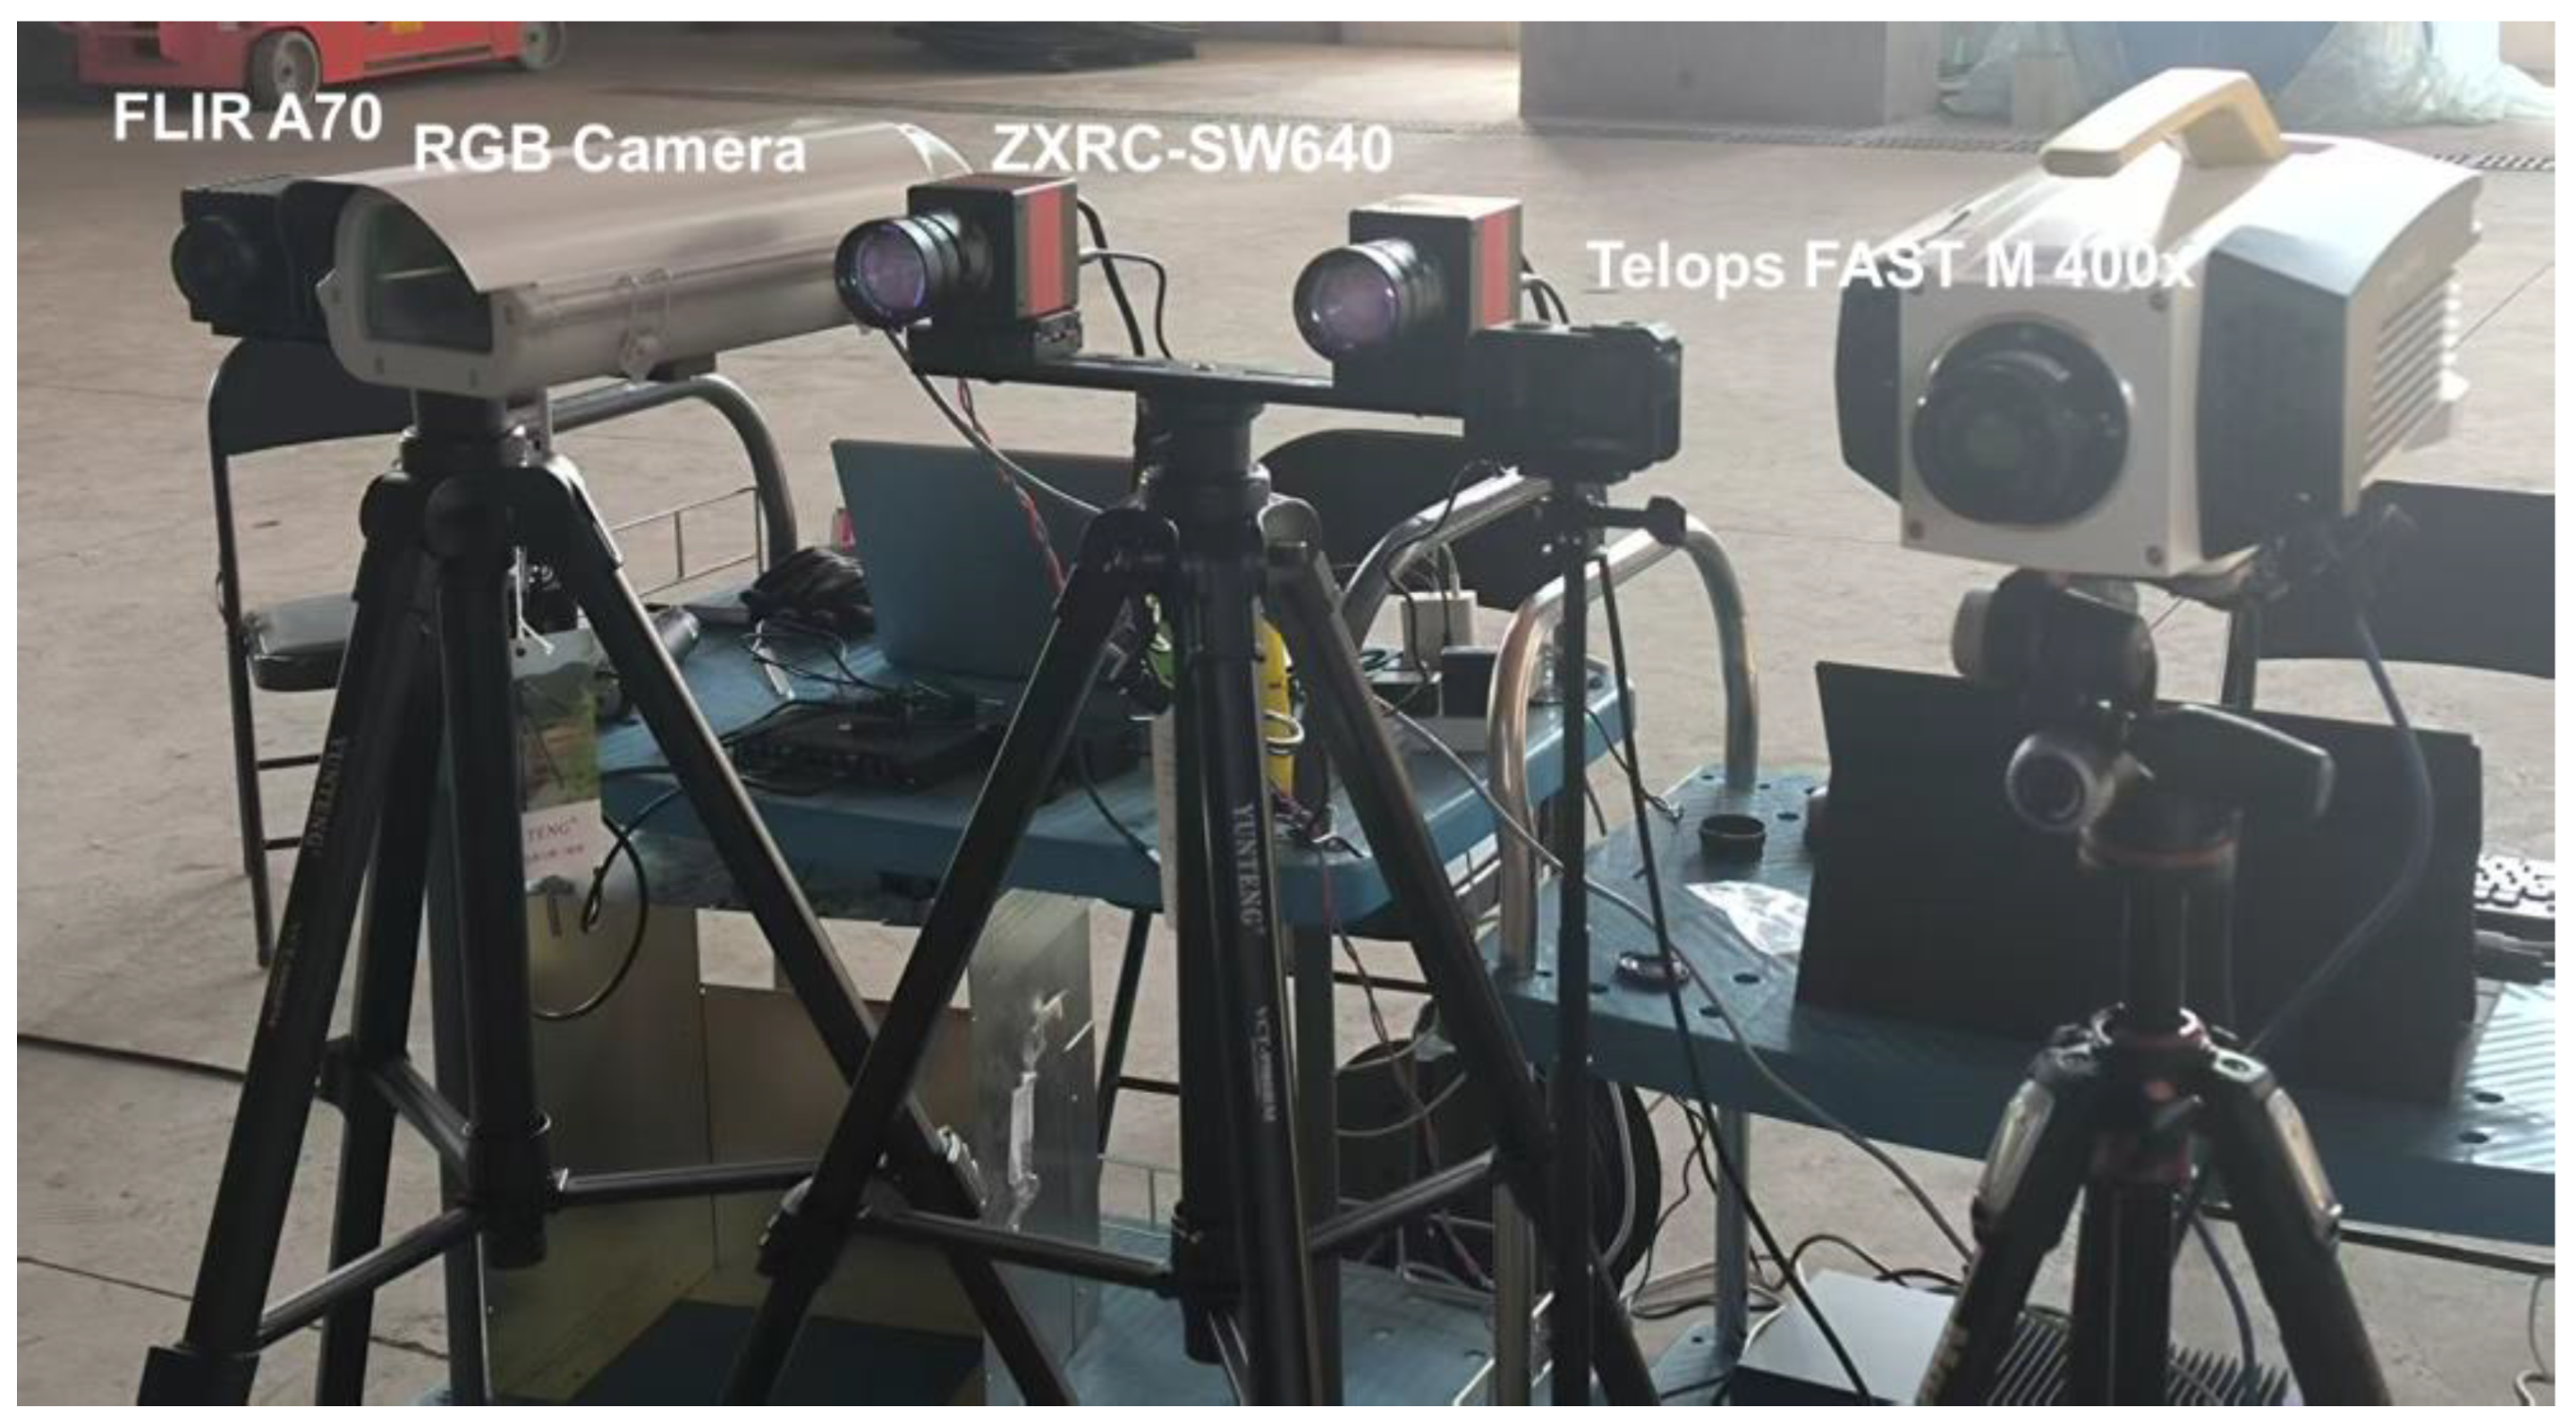
In the experiment, a customized three-band multispectral imaging acquisition system was used to collect the thermal radiation spectra generated by an abnormal heat source simulation device beneath insulation materials for concealed-fire early warning designed in this chapter, and the data were manually annotated to form a dataset. The three-band synchronous multispectral imaging system achieves time synchronization of the three detectors through an external unified TTL trigger signal, ensuring temporal consistency of images from different bands. Specifically, the short-wave infrared (SWIR) band adopts the ZXRC-SW640-F15-25 colloidal quantum dot camera from Zhongxin Thermal Imaging (Beijing, China), with a response band of 0.9–2.0 μm, a detector array size of 640 × 512, a pixel pitch of 15 μm, and a frame rate of 20 fps. It is equipped with a precision thermoelectric cooler (TEC) temperature control system to eliminate the influence of ambient temperature fluctuations on detector response. The mid-wave infrared (MWIR) band uses the Telops FAST M 400x (Québec City, Canada) high-speed infrared camera, with a response band of 3.7–4.8 μm, an original resolution of 320 × 256, and a pixel pitch of 30 μm. In the experiments, it was uniformly set to 20 fps for synchronous acquisition with other cameras. The long-wave infrared (LWIR) band employs the FLIR A70 (Stockholm, Sweden) thermal imaging camera, with a response band of 7.5–14.0 μm, an original resolution of 640 × 480, a pixel pitch of 12 μm, a temperature measurement accuracy of ±2 °C, and a frame rate of 30 fps. All data were collected at a detection distance of 15–20 m, which covers the typical application scenarios of insulation-layer fire detection in real buildings. The equipment used in the dataset collection process is shown in Figure 5.

2.3.2. Insulation Materials and Sample Definition

To ensure the material diversity of the dataset, the two most commonly used organic foam materials in building insulation were selected: Class B1 polyurethane foam (PU) and Class B1 expanded polystyrene foam (EPS). The thermal decomposition temperature of PU is about 200–340 °C, and the thermal decomposition temperature of EPS is about 260 °C. In order to provide early warning before the material enters the obvious decomposition stage, we define the temperature between the heating table and the insulation material reaching or exceeding 100 °C as a positive sample, and the detector should issue an alarm under this condition.
Standard specimens with dimensions of 500 mm × 500 mm × 50 mm were prepared to simulate concealed heat accumulation in different insulation materials. A stepwise heating scheme was adopted to more accurately simulate the heat accumulation process of real electrical short circuits: the heating table was first raised to a specified temperature point, and after the temperature stabilized, the heating table was closely attached to the bottom of the insulation material specimen and held for 3 min to achieve thermal equilibrium inside the specimen. Then, three-band multispectral image acquisition was synchronously triggered, and the average interface temperature measured by the 9-point penetrating thermocouples was recorded in real time as the data label.

2.3.3. Temporal Evolution of Multi-Band Thermal Response

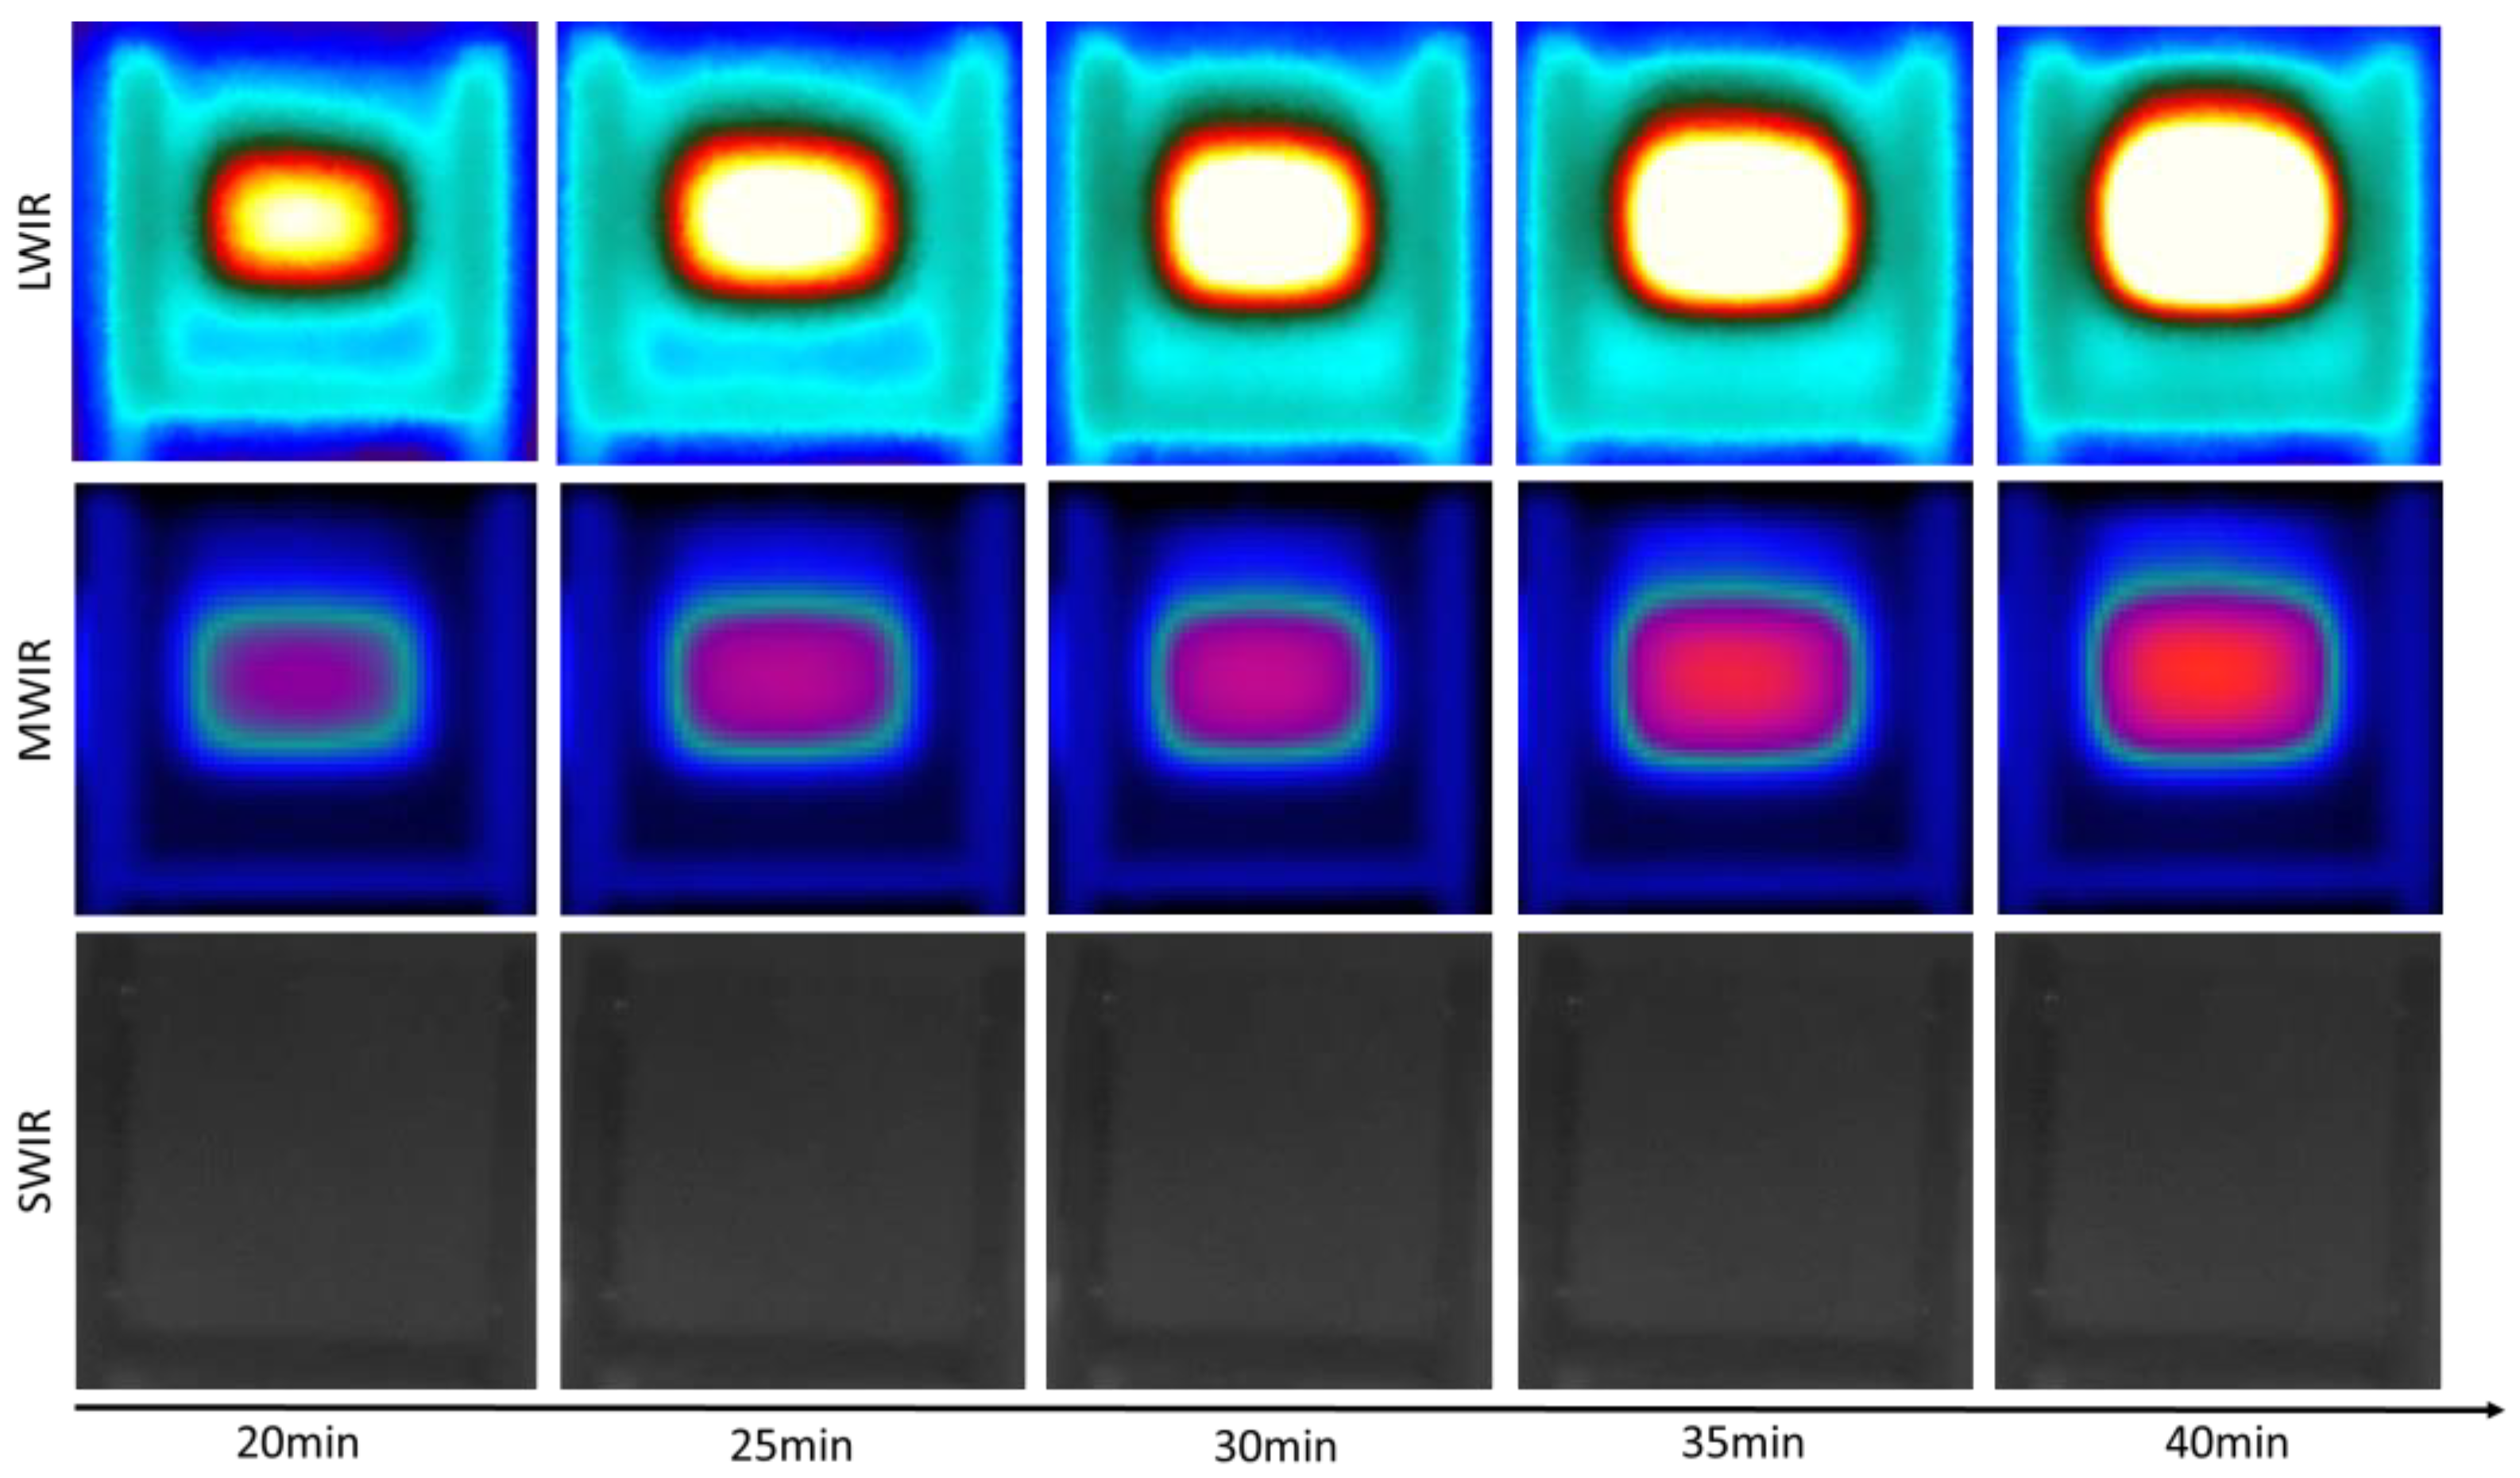
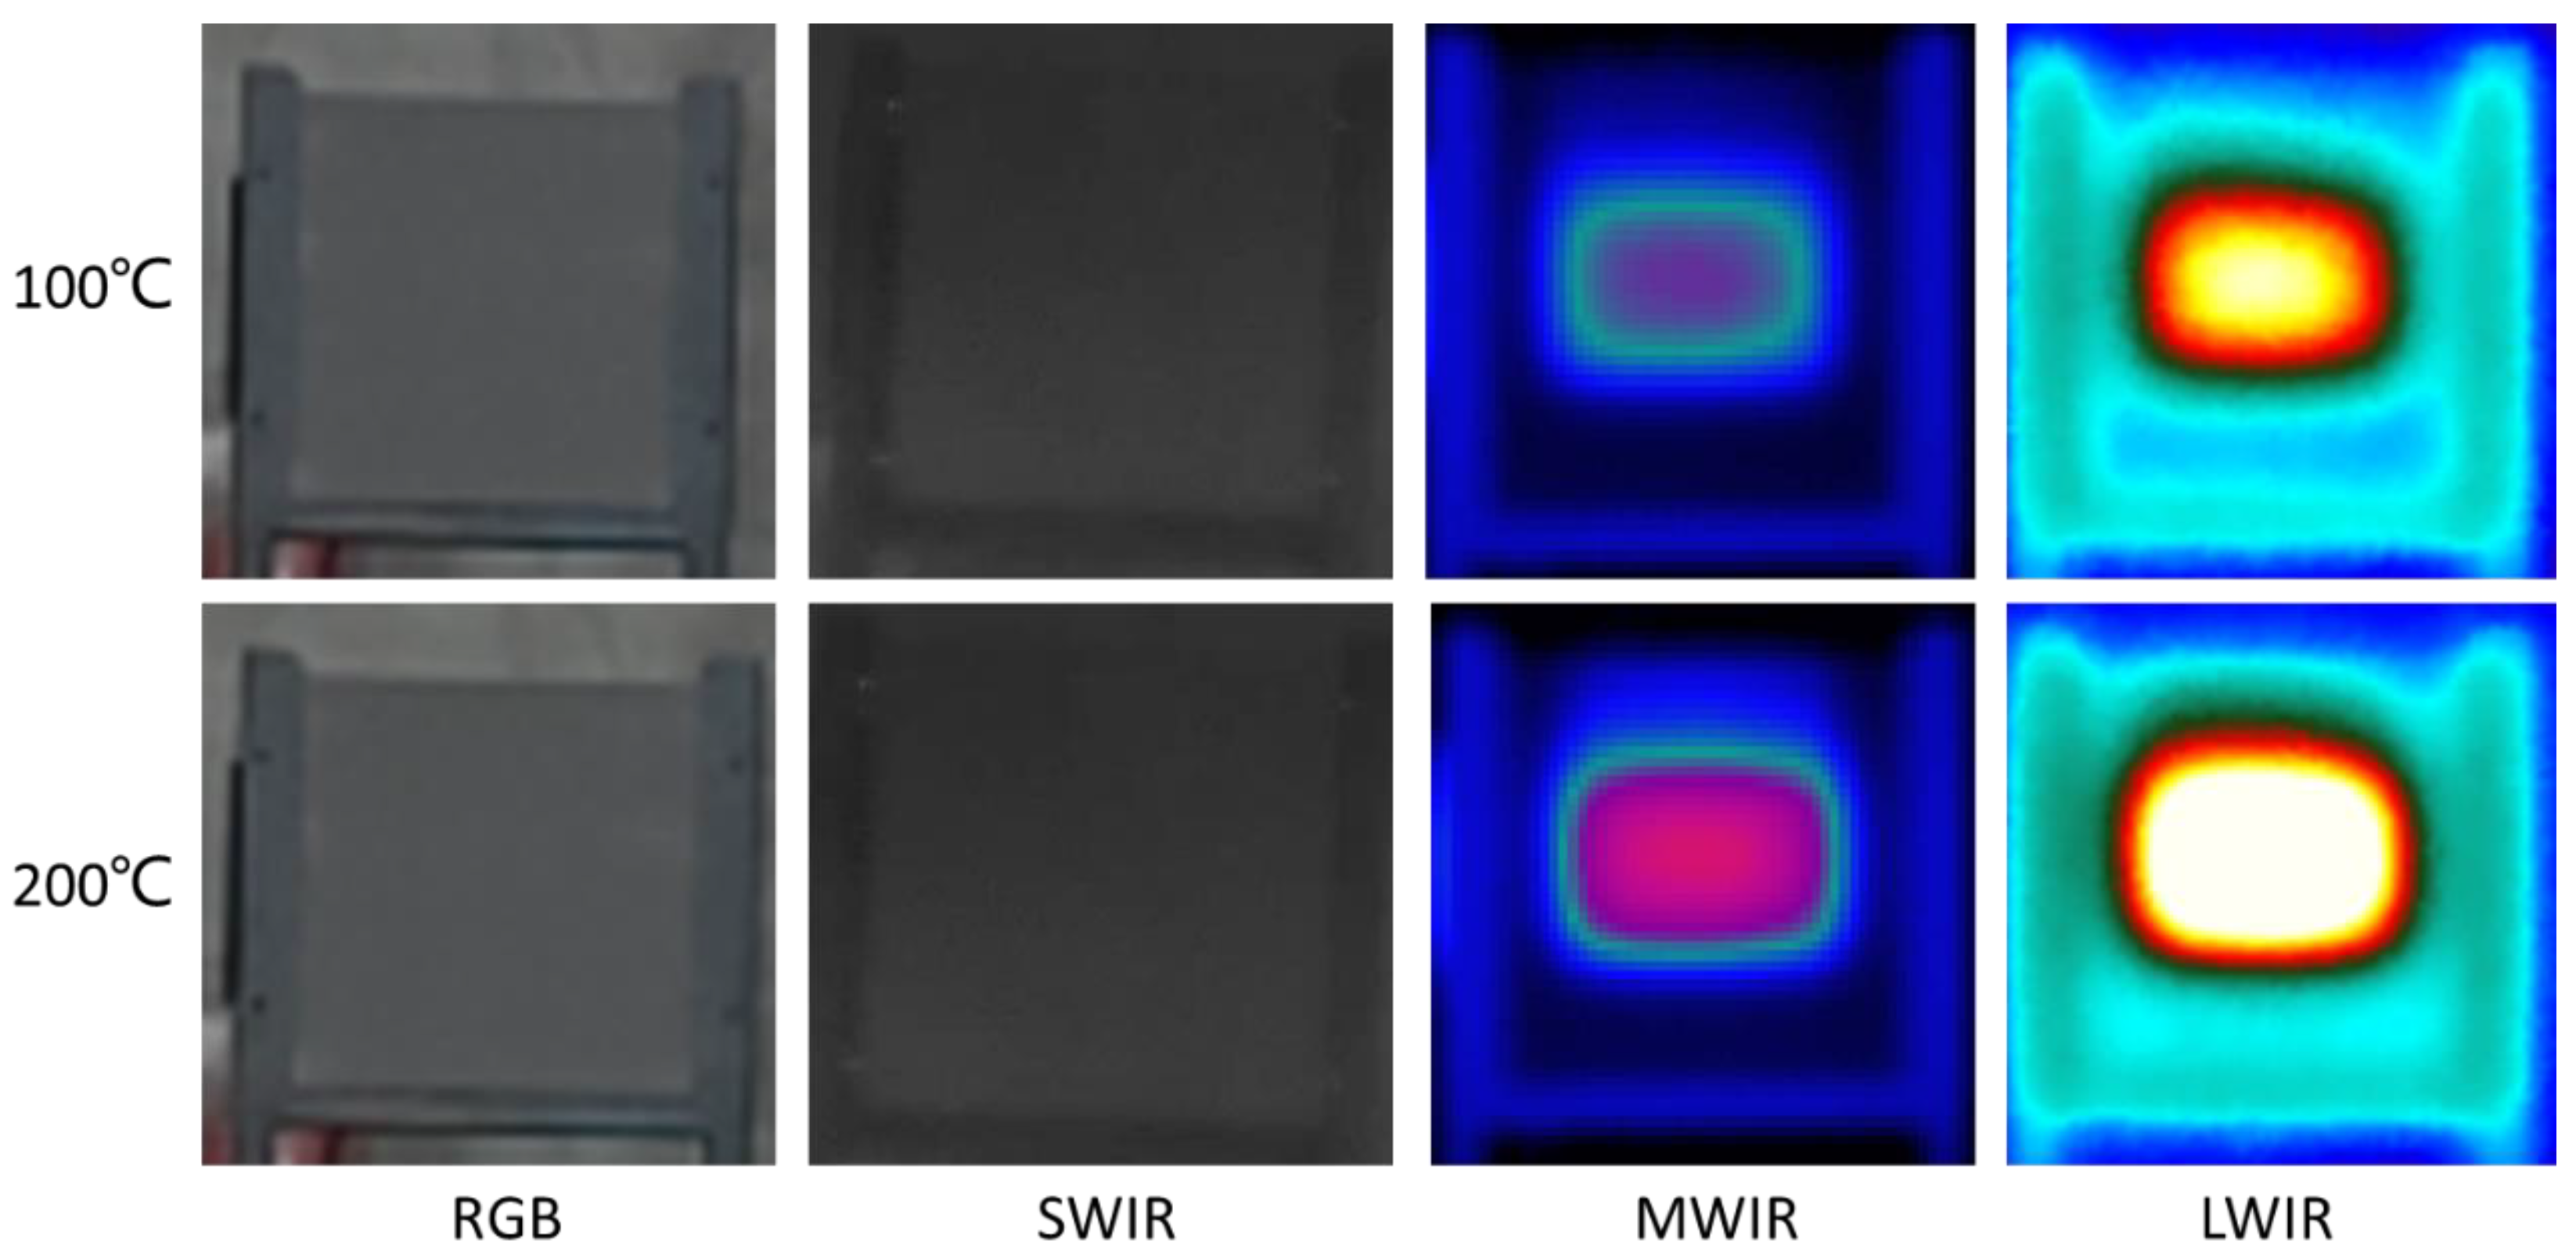
To fully present the non-steady heat conduction process beneath the insulation layer and address the deficiency in the time-evolution description of measurement results, continuous time-series multispectral observations were supplemented during dataset construction. Synchronous SWIR, MWIR, and LWIR thermal images of the specimen surface were acquired throughout the 20–40 min heating period after the heat source was attached to the insulation sample, as illustrated in Figure 6.
The LWIR band maintains high sensitivity throughout the observation period and can clearly delineate the surface temperature distribution corresponding to the subsurface heat source. With the heating time extending from 20 min to 40 min, the high-radiation area on the surface expands continuously, and the central brightness temperature rises progressively. The outward expansion of the high-temperature region directly visualizes the in-plane heat diffusion process and temperature accumulation effect under non-steady conduction. The MWIR band presents a gradually enhanced response as the interface temperature rises: the contrast between the heat source area and the background increases noticeably over time, and the heat source boundary becomes increasingly distinct, reflecting the temperature-dependent signal-to-noise ratio characteristic of the MWIR band. For the SWIR band, the radiation signal variation associated with the heat source is relatively weak in this temperature range, and the overall image contrast is low, so it is difficult to independently resolve the detailed temperature distribution of the subsurface heat source. However, it can still act as a complementary dimension in the multi-spectral detection framework, providing auxiliary information for background radiation calibration and cross-validation of environmental disturbances.
The above temporal response characteristics demonstrate the transition trend of the temperature field from transient heating to a quasi-steady state and verify the spectral complementarity among the three bands. These physical characteristics provide the experimental basis for the band-specific feature extraction design and two-stage cross-modal fusion strategy of the MSCMFNet model, and also support the rationale for constructing a multi-spectral dataset for concealed thermal anomaly detection.

2.3.4. Interference Scenarios and Dataset Composition

To enhance the algorithm’s ability to distinguish real fire risks from environmental interference in real application scenarios, multispectral records of various typical interference sources were specially added to the dataset, including separate interference scenarios and mixed scenarios in which concealed abnormal heat sources and interference coexist. These interference sources include normal thermal radiation from the surface of heating pipes, infrared radiation from high-power lighting fixtures, transient thermal traces caused by personnel walking at close range, and local temperature fluctuations caused by periodic startup of ventilation equipment.
Finally, a total of 15,940 valid multispectral image groups were obtained, including 6620 positive samples and 9320 negative samples. Partial data from the dataset are shown in Figure 7. Each group contains three preprocessed and registered images of SWIR, MWIR, and LWIR. The entire dataset was randomly divided into training set, validation set, and test set according to a ratio of 7:2:1. The training set and validation set were used for model training and hyperparameter tuning, while the test set was completely independent of the training process and only used for final performance evaluation, ensuring the objectivity and fairness of the evaluation results.

2.3.5. Model Training Settings

All models were trained and tested under a unified hardware and software environment. The training hardware platform was a server equipped with 4 NVIDIA RTX 3090 GPUs (24 GB RAM), powered by an Intel Xeon Gold 6248R CPU with 128 GB of memory. Inference performance tests were conducted simultaneously on both the server and edge-embedded platforms: a single RTX 3090 GPU was used on the server side, and an NVIDIA Jetson Orin AGX (32 GB) development board was used on the edge side, with TensorRT 8.4 employed for model quantization and optimization.
The software environment adopted the Ubuntu 20.04 operating system, with PyTorch 1.12.1 as the deep learning framework, CUDA version 11.6, and cuDNN version 8.4.0. During training, the AdamW optimizer was selected, with an initial learning rate of 1 × 10⁻⁴, a weight decay coefficient of 1 × 10⁻⁵, a batch size of 32, and a total of 200 epochs. The learning rate was decayed using a cosine annealing strategy and updated once per epoch.

2.3.6. Evaluation Metrics

To comprehensively evaluate the detection accuracy, real-time performance, and model complexity of the algorithm, multiple evaluation metrics commonly used in the field of abnormal heat source detection for concealed-fire early warning were adopted. Accuracy is defined as the proportion of correct predictions among all predictions:
A c c u r a c y = T P + T N T P + F P + T N + F N
where TP, TN, FP, and FN represent the number of true positive, true negative, false positive, and false negative samples, respectively. The false positive rate (FPR) measures the proportion of negative samples misclassified as fire hazards:
F P R = F P T N + F P
while the false negative rate (FNR) reflects the proportion of positive samples that are missed:
F N R = F N T P + F N
To evaluate the feasibility of edge deployment, the number of parameters (Params), floating-point operations (FLOPs), and single-frame inference time of all models were also recorded. The inference time was measured on a single RTX 3090 GPU and NVIDIA Jetson AGX Orin (32 G) embedded development board, excluding the time consumed by data input and output.

3. Results

3.1. Ablation Experiments

To quantitatively verify the independent contribution of each module in MSCMFNet for abnormal heat source detection beneath insulation layers serving subsurface concealed-fire early warning, five groups of ablation experiments were designed, and their performance differences were compared and analyzed by gradually adding modules. All variants were trained and tested under the same data partition and training hyperparameters. The specific configurations are as follows:
  • Baseline 1 (B1): Single LWIR band + basic ResNet18 network. Only long-wave infrared band data were used for training and abnormal heat source detection, with the most basic ResNet18 as the feature extraction network, serving as the benchmark for performance comparison.
  • Baseline 2 (B2): Three-band simple concatenation + basic ResNet18 network. Images from the SWIR, MWIR, and LWIR bands were directly concatenated along the channel dimension and input into the ResNet18 network to verify the performance improvement brought by multi-band data itself in concealed abnormal heat-source identification.
  • Baseline 3 (B3): Three-band independent feature extraction + two-stage fusion. The multi-band independent feature extraction module and two-stage multi-scale cross-fusion module designed in this paper were adopted, but without the attention mechanism and multi-frame temporal verification.
  • Baseline 4 (B4): Three-band independent feature extraction + two-stage fusion + cross-attention mechanism. A cross-attention fusion unit was added on the basis of B3 to verify the improvement of the attention mechanism in feature fusion performance for weak subsurface thermal anomaly recognition.
  • Full Model (Ours): The complete architecture of MSCMFNet, including all modules: multi-band independent feature extraction, two-stage cross-attention fusion, and multi-frame temporal verification.
All models were trained and tested on exactly the same dataset and training parameters. By comparing the performance improvement from B1 to the full model, the gain path of each module is clearly depicted. The quantitative results are presented in Table 1 and analyzed in the following subsections. To verify the effectiveness of each module in MSCMFNet step by step, comparative tests were conducted on the five model variants under exactly the same dataset and training hyperparameters, and the results are shown in Table 1.

3.1.1. Accuracy Analysis

Regarding the accuracy metric, the complete MSCMFNet model in this paper outperforms all baseline models with an accuracy of 98.2%, demonstrating the rationality of the progressive module design for subsurface concealed-abnormal-heat-source detection. The single long-wave infrared baseline model B1 only achieves an accuracy of 81.5%, verifying the bottleneck of existing single-band detection technologies: relying solely on thermal radiation information in the 8–14 μm band cannot effectively distinguish normal temperature fluctuations on the surface of insulation layers from internal weak signals of pre-ignition thermal anomalies. The B2 model with simple three-band concatenation improves the accuracy to 86.2%, an increase of 4.7 percentage points compared to B1, directly proving that multispectral data contains richer abnormal heat source feature information related to concealed insulation-layer fires than single-band data. However, due to the use of a unified feature extraction network without considering the differences in the physical characteristics of each band, the performance improvement is limited.
After adopting the band-specific independent feature extraction branches and the two-stage multi-scale fusion strategy designed in this paper, the accuracy of the B3 model jumps to 92.1%, an increase of 5.9 percentage points compared to B2. This result fully proves the necessity of differentiated modeling: the SWIR branch retains high-resolution features to capture fine-scale local anomaly cues, the MWIR branch extracts spatial gradient features of heat conduction to distinguish abnormal heat sources from normal temperature fields, and the LWIR branch suppresses interference from constant background heat sources. The three achieve information complementarity through multi-scale convolutional fusion. The B4 model, which introduces a cross-attention fusion unit on the basis of B3, further improves the accuracy to 96.3%, an increase of 4.2 percentage points, indicating that the adaptive weight adjustment mechanism can effectively enhance useful signals and suppress background noise for weak subsurface thermal hazard identification. Finally, the complete model with the multi-frame temporal verification mechanism achieves the highest accuracy of 98.2%, verifying that the spatio-temporal joint decision strategy can further improve the reliability of the concealed abnormal-heat-source detection results.

3.1.2. False Positive Rate Analysis

Regarding the false positive rate (FPR), which is the most critical metric in engineering applications, the complete model in this paper achieves an ultra-low false positive rate of 1.2%, far lower than all baseline models. The false positive rate of the B1 model is as high as 12.7%, mainly because single long-wave infrared detection is extremely sensitive to ambient temperature fluctuations and normal heat sources such as pipes and lamps, leading to frequent false alarms. The B2 model reduces the false positive rate to 8.3% by introducing multispectral information, but it still cannot effectively distinguish real fire features from complex background interference. The B3 model further reduces the false positive rate to 4.2%, benefiting from differentiated feature extraction that can better suppress background noise. The B4 model with the cross-attention mechanism reduces the false positive rate to 2.1%, as the attention mechanism can dynamically adjust the weights of each band according to the input content, automatically enhancing fire-related features and suppressing interference features.
The most significant improvement comes from the multi-frame temporal verification mechanism, which further reduces the false positive rate from 2.1% to 1.2% without increasing the number of model parameters. This is because the temporal verification mechanism can effectively filter out short-term non-fire thermal disturbances such as personnel movement and instantaneous equipment startup/shutdown by analyzing the trend of the probability sequence over 10 consecutive frames. In practical applications, frequent false alarms can cause the system to be ignored by users, thus causing it to lose its early warning value. The ultra-low false positive rate achieved by the complete model in this paper gives it significant practical application value.

3.1.3. False Negative Rate Analysis

Regarding the false negative rate (FNR) metric, the false negative rate of the complete model in this paper is only 0.9%, meaning that it can almost completely capture early thermal anomalies in insulation layers. The false negative rate of the B1 model is 9.8%, indicating that single long-wave infrared detection has a high probability of missing weak signals in the early stage of fire. The B2 model reduces the false negative rate to 7.1% by introducing SWIR and MWIR bands, which are more sensitive to weak heat sources. The B3 model further reduces the false negative rate to 4.5% through multi-scale feature fusion, which can simultaneously capture local tiny hotspots and global heat conduction distribution. The B4 model with the cross-attention mechanism reduces the false negative rate to 2.3%, as the attention mechanism can automatically focus on easily overlooked weak-signal regions. Finally, the complete model reduces the false negative rate to 0.9%, effectively avoiding missed detections and ensuring that pre-ignition thermal hazards of insulation-layer concealed fires are detected at the earliest stage.

3.1.4. Model Complexity and Inference Time Analysis

Regarding model complexity and inference time, from B1 to the complete model, the number of parameters only increases from 11.2 M to 13.1 M, an increase of only 17%, and the floating-point operations (FLOPs) only increase from 8.9 G to 16.8 G. On the server side (single RTX 3090 GPU), the single-frame inference time of all models is less than 20 ms; on the edge side (NVIDIA Jetson Orin AGX 32 G, optimized with TensorRT 8.4 quantization), the single-frame inference time of all models is less than 26 ms, fully meeting the real-time detection requirement of 30 frames per second.
This marginal increase in computational cost is negligible compared to the significant performance gains, as our improvements primarily focus on innovative fusion strategies and decision mechanisms rather than simply scaling up network depth or width. It is particularly noteworthy that the multi-frame temporal verification mechanism hardly increases the computational load (only adding simple sliding window statistics and linear regression calculations), yet brings significant reductions in both the false positive rate and false negative rate. The lightweight design ensures that the algorithm can be efficiently deployed on resource-constrained edge detection devices, which is crucial for the large-scale application of the system.

3.2. Comparative Experiments

Long wave infrared (LWIR) thermal imaging is the most widely used non-contact fire detection technology in engineering applications. Its alarm logic based on the surface temperature threshold is simple and easy to deploy, but there are limitations in the scenario of concealed fires under insulation materials. It cannot distinguish between normal heat sources and early fire signals, and can only trigger alarms when the surface temperature reaches a preset threshold, resulting in a high false alarm rate. Therefore, in order to verify the technical advantages of our method compared to single long wave infrared for subsurface abnormal heat source early warning, we designed comparative experiments covering interference-free and multi-heat-source interference scenarios, simulating the complex environment of insulation-layer concealed fire precursor thermal anomalies coexisting with normal heat sources in actual buildings.

3.2.1. Experimental Setup

The experiment used the same experimental platform, detection equipment, and environmental conditions as described above, and all tests were conducted within a typical detection distance of 15–20 m. For traditional infrared thermal imaging, the same FLIR A70 as the multispectral system was used, and a surface temperature threshold was used to determine whether there was an abnormal heat source indicative of concealed subsurface fire risk.
The heating table temperatures were set to 80 °C, 100 °C, and 120 °C to create negative and positive alarm conditions for comparative evaluation. In this study, the 80 °C condition was defined as a negative condition, while the 100 °C and 120 °C conditions were defined as positive alarm conditions.
  • The 80 °C condition: This condition represents non-fire heat accumulation or normal thermal interference within the insulation layer. Therefore, the proposed model is expected not to trigger an alarm under this condition, which is used to examine its ability to reject non-fire thermal disturbances.
  • The 100 °C condition: This condition corresponds to the onset stage of thermal decomposition under the present experimental configuration. It is also used as the alarm-triggering reference for the proposed method, representing an early abnormal-heat-source state that requires pre-ignition warning for concealed insulation-layer fires.
  • The 120 °C condition: This situation represents a stage of significantly increased fire risk. It is used to evaluate whether the proposed method can respond quickly under high-risk, concealed subsurface fire precursor conditions.
The experimental procedure remained consistent with previous settings. After the heating table reached and stabilized at the target temperature, a 50 mm thick Class B1 PU insulation board was closely attached to the heating surface and heated continuously for 30 min to allow heat accumulation inside the insulation layer. The 5 mm thick wooden partition between the insulation board and the detector was then rapidly removed, and a timing system was activated to record the alarm response time (defined as the time from partition removal to the first system alarm). If no alarm occurred within 30 min, it was recorded as “no alarm”. To evaluate the impact of environmental heat sources on alarm stability, both interference-free and interference scenarios were tested. The interference-free scenario had no additional heat sources; the interference scenario activated high-power lighting fixtures to simulate common background thermal reflections and local thermal radiation interference in practical engineering. Each condition was repeated 10 times to ensure statistical stability, with results averaged as final outcomes.

3.2.2. Performance Comparison at Heating Table Temperature of 80 °C

At 80 °C, the internal thermal state is defined as a negative condition in this study (Table 2). Therefore, the expected result is that the detection system should not trigger an alarm. This condition is mainly used to examine whether the method can suppress alarms caused by normal heat accumulation and environmental thermal interference.
The results show that the low-threshold setting of conventional infrared thermography is prone to false alarms. When the alarm threshold is set to 40 °C, the system triggers an alarm after 466 s even in the interference-free scenario. Since the 80 °C condition is defined as a negative sample in this study, this alarm is counted as a false alarm, and the false alarm rate is therefore 100%. This result indicates that a low surface-temperature threshold may respond not only to hazardous internal thermal states, but also to slow surface warming caused by non-alarm heat accumulation.
The same problem becomes more obvious in the interference scenario. Under the influence of background thermal radiation from the lighting fixtures, the 40 °C threshold triggers an alarm in only 43 s, also resulting in a 100% false alarm rate. This suggests that low-threshold infrared thermography cannot reliably distinguish between internal risk-related heating and external thermal interference.
When the threshold is increased to 60 °C or above, no alarm is triggered in either scenario. Although this avoids false alarms under the 80 °C negative condition, it also reflects a basic limitation of the threshold-based strategy: the result depends entirely on whether the outer surface temperature exceeds the preset value. The method does not actively evaluate the internal thermal state of the insulation layer.
In contrast, the proposed method does not generate alarms in both interference-free and interference situations, maintaining a 0% false alarm rate. This is because the model does not make decisions based solely on the apparent surface temperature. On the contrary, it uses multispectral features and temporal consistency to determine whether the observed pattern corresponds to a positive internal thermal state. Therefore, under 80 °C conditions, normal heat accumulation and external thermal interference can be effectively filtered out.

3.2.3. Performance Comparison at Heating Table Temperature of 100 °C

The 100 °C condition is defined as the lower boundary of the positive alarm category in the comparative experiments (Table 3). Under this condition, a reliable detection method should generate an alarm as early as possible while remaining insensitive to environmental interference.
The experimental results indicate that traditional infrared thermography suffers from significant response delay and insufficient anti-interference capability under this condition. The 40 °C and 60 °C low thresholds can trigger alarms in the interference-free scenario, but the response times are extremely long: the 40 °C threshold requires 223 s (approximately 3.7 min), and the 60 °C threshold requires as long as 945 s (approximately 15.75 min), completely losing the significance of early warning. In the interference scenario, low thresholds are severely disturbed by environmental heat sources, with a 100% false alarm rate for the 40 °C threshold and a 10% false alarm rate for the 60 °C threshold, making them unable to work stably in complex environments. The 80 °C and 100 °C high thresholds completely fail to trigger alarms regardless of interference due to heat conduction loss in the insulation layer: the internal 100 °C heat is significantly attenuated when transferred to the surface, and the surface temperature never reaches the alarm threshold, resulting in severe missed detection and complete inability to identify early signals.
The proposed model demonstrates remarkable performance advantages under this condition: it triggers an alarm in only 83 s in the interference-free scenario, which is approximately 62.8% faster than the traditional 40 °C threshold and 76% faster than the 60 °C threshold. In the interference scenario, the response time is only 88 s with a 0% false alarm rate, almost unaffected by environmental heat sources. This result validates the effectiveness of multispectral feature fusion: through synergistic analysis of the SWIR, MWIR, and LWIR bands, the model captures the specific spectral signals in the short-wave and mid-wave infrared during heat conduction, rather than relying solely on surface temperature. Therefore, it can identify internal heat conduction states in advance before the insulation board surface temperature reaches traditional high thresholds. Meanwhile, the multi-frame temporal verification mechanism eliminates the influence of instantaneous thermal radiation from environmental interference by analyzing the probability-change trend of consecutive frames, ensuring the accuracy and stability of alarms.

3.2.4. Performance Comparison at Heating Table Temperature of 120 °C

At 120 °C, the internal thermal condition is more severe than that at 100 °C (Table 4). Under this condition, the detection system is expected to trigger an alarm rapidly and maintain stability even in the presence of environmental heat sources. The experimental results further highlight the technical bottleneck of traditional infrared thermography: even when the internal heating table temperature reaches 120 °C, the surface temperature still cannot exceed 80 °C due to heat conduction loss in the insulation layer, leading to complete failure of the 80 °C and 100 °C high thresholds. They cannot trigger alarms regardless of interference, posing a great safety hazard. The 40 °C and 60 °C low thresholds can trigger alarms, but the response times are still excessively long: the 40 °C threshold requires 168 s (approximately 2.8 min), and the 60 °C threshold requires as long as 635 s (approximately 10.58 min). Moreover, in the interference scenario, the 40 °C threshold still has a 100% false alarm rate and the 60 °C threshold has a 10% false alarm rate, failing to meet the reliability requirements of engineering applications.
The performance advantages of the proposed model are more prominent under this condition: it triggers an alarm in only 38 s in the interference-free scenario, much faster than traditional thermography. In the interference scenario, the response time is only 48 s with a 0% false alarm rate. This result fully proves the effectiveness of the proposed sliding window temporal verification mechanism: through probability sequence analysis of 10 consecutive frames, this mechanism ensures rapid response to continuously enhanced thermal radiation signals while effectively filtering instantaneous interference, achieving a balance between fast alarms and zero false alarms.

4. Discussion

4.1. Comprehensive Performance Discussion

Comparative experiments have revealed significant limitations of traditional LWIR thermal imaging. Due to its alarm decision being solely dependent on the temperature of the insulation material surface, it faces a trade-off between sensitivity and reliability. A low threshold can shorten response time, but it is easily triggered by non-alarm heat accumulation or environmental thermal interference. This is evident at 80 °C, where a threshold of 40 °C produces false positives in both interference-free and interference scenarios. A high threshold can reduce false alarms, but may not detect hidden internal heating as the insulation layer strongly attenuates the temperature transmitted to the surface.
Our method does not rely on a single band surface temperature threshold, but instead uses multispectral feature recognition as a decision basis. In comparative experiments, our method can avoid false alarms of 80% and achieve rapid responses to fire risks at 100 °C and 120 °C. This indicates that the model is more effective than traditional LWIR thermal imaging in distinguishing non-alarm thermal accumulation from generally high-risk internal thermal states.
The main difference between these two methods lies in the criteria for judgment. For the LWIR threshold method, an alarm will be triggered as long as the outer surface reaches the preset temperature. In contrast, our designed method combines spectral information from multiple bands with time validation. This enables it to suppress alarms at 80 °C while still responding quickly at 100 °C and 120 °C. In the interference environment, there is only a slight change in response, indicating that this method is less affected by external heat sources.
Overall, results in Section 3 indicate that our strategy of combining multispectral fusion with time validation has more significant advantages than the simple LWIR temperature threshold method. Our method reduces false alarms caused by ordinary heat sources and responds faster to internal high-risk thermal conditions.

4.2. Validation of Research Hypotheses

Our study was based on three core research hypotheses: (1) multispectral imaging can capture complementary information about concealed heat accumulation that single-band LWIR cannot detect; (2) band-specific feature extraction and hierarchical cross-modal fusion can effectively identify weak abnormal heat source signals that precede concealed fires under strong background noise; and (3) temporal verification can significantly reduce false alarms caused by transient environmental disturbances. All three hypotheses have been validated by our experimental results.
The subsurface fire simulation device we developed provides a reliable experimental foundation for testing these hypotheses. By achieving uniform heating and accurate interface temperature measurement, we were able to generate consistent and reproducible concealed fire scenarios. The MSCMFNet algorithm, with its customized feature extraction branches and two-stage cross-attention fusion strategy, successfully integrates the complementary strengths of the SWIR, MWIR, and LWIR bands. The multi-frame temporal verification mechanism further enhances the system’s robustness by filtering out non-fire disturbances.
The ablation study confirms that each component of our method contributes independently to the overall performance. Simple three-band concatenation only provides limited performance improvement, while band-specific feature extraction and cross-attention fusion lead to significant gains. The temporal verification module, despite adding negligible computational cost, achieves the largest reduction in false positive rate.

4.3. Implications of the Findings

The results indicate that the combination of multispectral imaging, cross modal feature fusion, and time validation proposed by us can improve the sensitivity and reliability of abnormal heat source detection beneath thermal insulation materials for subsurface concealed-fire early warning. This indicates that the system may be deployed in buildings that widely use insulation materials, and hidden heat accumulation may occur before visible flames or smoke appear. In particular, the results of edge inference indicate that the model can run in real time on resource-constrained devices, supporting the possibility of large-scale monitoring applications for concealed insulation-layer fire pre-warning.
The proposed method achieves a low false positive rate while maintaining a fast response under positive abnormal heat source conditions that indicate fire risks. This suggests that the system has potential for practical deployment in buildings where insulation materials are widely used and where hidden thermal accumulation may occur before a visible flame or smoke appears. In particular, the edge-side inference results show that the model can run in real time on resource-constrained devices, supporting the possibility of large-scale monitoring applications.
In addition, the comparison with LWIR thermography shows that our proposed method changes the alarm logic from a surface-temperature-threshold decision to a multispectral pattern-recognition decision. This shift is important because hidden fires under insulation layers often produce weak and delayed surface temperature responses. By using SWIR, MWIR, and LWIR information together, our MSCMFNet can identify internal heat-accumulation patterns earlier and more robustly than single-band thermal imaging.

4.4. Limitations

Despite these contributions, several limitations remain and call for further investigation. The dataset, while relatively comprehensive, is mainly derived from laboratory experiments and thus does not fully capture the complexity of real-world building structures. For instance, factors such as multilayer insulation, embedded components (e.g., pipelines or metal frames), and variations in protective materials can all influence heat transfer and radiative characteristics, yet these factors were not fully accounted for in the current experimental setup.
In addition, the present algorithm focuses solely on providing fire-hazard probabilities and risk levels for individual image frames, without supporting fire-source localization or temperature estimation. Both capabilities are essential for practical firefighting and emergency response, and therefore represent meaningful directions for future research.
Furthermore, the performance of our algorithm in different humidity levels, dust concentrations, and other scenarios needs further validation to ensure its universality in different scenarios.

4.5. Future Work

To further enhance the applicability of the proposed method in practical scenarios, future work will consider the impact of environmental interference factors such as water vapor and dust in actual scenarios. To accommodate the differences in the thermal conductivity of different thermal insulation materials and complex working conditions in practical engineering, we will sequentially conduct experimental tests on insulation layers with varying thicknesses, multi-layer composite insulation structures, and insulation structures embedded with metal pipes and keels, collect corresponding multispectral datasets, and further validate and optimize the generalization performance of the algorithm. Meanwhile, we plan to conduct deployment tests in actual cold storage and other building scenarios with internal thermal insulation structures, collect on-site operation data, and evaluate the practical performance of the algorithm in real engineering environments.
For all the aforementioned complex working conditions, corresponding multispectral data should be collected and incorporated into the training and testing process to improve the robustness and generalization ability of the model in non-ideal environments.
In addition, hyperparameters in the current model are still set empirically. Although this strategy works well in the present experiments, it may not always be optimal for different scenarios. Future research will therefore explore more systematic ways to tune these parameters, including reinforcement learning-based optimization, with the aim of finding more stable and suitable parameter settings.
Future work may also extend the current framework from abnormal heat source risk classification to fire-source localization, temperature estimation, and fire-development trend prediction. These extensions would further improve the practical value of the system for emergency response and building fire-safety management.

5. Conclusions

Our study proposes a multi-scale cross modal fusion network MSCMFNet for detecting early abnormal heat sources beneath insulation layers to realize pre-warning of concealed insulation-layer fires. This method integrates band-specific feature extraction, two-stage multispectral fusion, cross-attention weighting, fire risk quantification, and multi-frame time validation to identify weak hidden thermal signals under complex background conditions.
Systematic ablation experiments in Section 3.1 demonstrate that each module contributes positively to the overall performance. Compared with the single-band LWIR baseline, the complete MSCMFNet achieves 98.2% detection accuracy, a 1.2% false positive rate, and a 0.9% false negative rate. The results confirm that simple multi-band concatenation is not sufficient to fully utilize multispectral information, while band-specific feature extraction and layered cross-modal fusion can more effectively capture complementary features from SWIR, MWIR, and LWIR images. The cross-attention mechanism further enhances fire-related identification features, while the temporal verification module improves alarm stability by suppressing transient environmental interference.
Comparative experiments expose an inherent limitation of traditional single-LWIR-threshold thermal imaging: sensitivity and reliability prove mutually conflicting. A low-temperature threshold readily generates false alarms under non-fire heat accumulation or environmental disturbances. Conversely, a high threshold can overlook concealed fire risks, as the insulation layer both delays and dampens the surface temperature rise. By contrast, MSCMFNet recasts the alarm decision from a surface-temperature threshold to a multispectral feature pattern, thereby delivering faster and more dependable detection under a range of interfering conditions.
Overall, our method offers an effective technical route for early warning of hidden fires within insulation materials. It demonstrates clear advantages in detection accuracy, false-alarm suppression, response speed, and edge-deployment feasibility. Future work will include field validation in real-world environments and extension of the framework to support fire-source localization and temperature estimation.


Author Contributions

Conceptualization, X.Z. and B.L.; methodology, B.L.; software, R.G.; validation, Z.C. and L.W.; formal analysis, B.L.; investigation, R.G.; resources, X.Z.; data curation, R.G.; writing—original draft preparation, B.L.; writing—review and editing, X.Z. and R.G.; visualization, Z.C.; supervision, Q.Z.; project administration, X.Z.; funding acquisition, X.Z. All authors have read and agreed to the published version of the manuscript.

Funding

This research was funded by the National Key R&D Program of China (2024YFC3014603); Liaoning Provincial Natural Science Foundation (General Program) Grant No. 2024-MS-243.

Institutional Review Board Statement

Not applicable.

Informed Consent Statement

Not applicable.

Data Availability Statement

The original contributions presented in the study are included in the article; further inquiries can be directed to the corresponding author.

Conflicts of Interest

The authors declare no conflicts of interest.

References

  1. ISO 11014:2021; Safety of Machinery—Fire Prevention and Protection. International Organization for Standardization: Geneva, Switzerland, 2021.
  2. GB/T 28009-2025; Fire Performance Requirements for Building Thermal Insulation Materials. Standardization Administration of China: Beijing, China, 2025.
  3. Lvov, M.Y.; Nikinina, S.D.; Lvov, Y.N.; Lesiv, A.V.; Serebryannikov, E.E.; Ryabikov, A.I.; Nazarov, A.A. Methods for Control and Detection of Fire-Hazardous Defects of Contacts and Contact Connections During Operation of Electrical Installations. Power Technol. Eng. 2024, 58, 3. [Google Scholar]
  4. Khan, F.; Kandola, B. Graphene oxide–based wireless sensor in fibre–reinforced hybrid composites for incipient fire detection. Compos. Part B Eng. 2025, 306, 112841. [Google Scholar] [CrossRef] [Scilit]
  5. Guzowski, B.; Lakomski, M.; Bobinski, D. Hotspot Detection in Photovoltaic Modules with Fiber Bragg Grating and Brillouin Distributed Temperature Sensors. Energies 2025, 18, 6117. [Google Scholar] [CrossRef] [Scilit]
  6. Lei, Y.; Chan, Q.N.; Xu, L.; Lee, E.W.; Lee, Y.X.; Agarwal, V.; Yeoh, G.H.; Wang, W. Smart retardant materials for fire alarm systems: Integrating flame retardancy and early detection technologies. Adv. Compos. Hybrid Mater. 2025, 8, 112. [Google Scholar] [CrossRef] [Scilit]
  7. Dobrzycki, A.D.; Bernardos, A.M. To fuse or not to fuse: Enhancing military operation object detection with multimodal late fusion and color space optimization. Appl. Intell. 2026, 56, 100. [Google Scholar] [CrossRef] [Scilit]
  8. Taşar, B.; Tatar, A.B.; Tanyildizi, A.K.; Yakut, O. Multimodal Wildfire Classification Using Synthetic Night-Vision-like and Thermal-Inspired Image Representations. Fire 2026, 9, 109. [Google Scholar] [CrossRef] [Scilit]
  9. Azarang, A.; Kehtarnavaz, N. A generative model method for unsupervised multispectral image fusion in remote sensing. Signal Image Video Process. 2022, 16, 63–71. [Google Scholar] [CrossRef] [Scilit]
  10. Sun, W.; Ren, K.; Meng, X.; Yang, G.; Li, C.; Huang, K.; Li, J.; Huang, J. Domain Transform Model Driven by Deep Learning for Anti-Noise Hyperspectral and Multispectral Image Fusion. IEEE Trans. Geosci. Remote Sens. 2024, 62, 5500117. [Google Scholar] [CrossRef] [Scilit]
  11. Qiu, Z.; Guo, H.; Hu, J.; Jiang, H.; Luo, C. Joint Fusion and Detection via Deep Learning in UAV-Borne Multispectral Sensing of Scatterable Landmine. Sensors 2023, 23, 5693. [Google Scholar] [CrossRef] [Scilit] [PubMed]
  12. He, K.; Zhang, X.; Ren, S.; Sun, J. Deep Residual Learning for Image Recognition. In Proceedings of the IEEE Conference on Computer Vision and Pattern Recognition (CVPR), Las Vegas, NV, USA, 27–30 June 2016; IEEE: New York, NY, USA, 2016; pp. 770–778. [Google Scholar]
  13. Simonyan, K.; Zisserman, A. Very Deep Convolutional Networks for Large-Scale Image Recognition. In Proceedings of the International Conference on Learning Representations (ICLR), San Diego, CA, USA, 7–9 May 2015. [Google Scholar]
  14. Tan, M.; Le, Q.V. EfficientNet: Rethinking Model Scaling for Convolutional Neural Networks. In Proceedings of the International Conference on Machine Learning (ICML), Long Beach, CA, USA, 9–15 June 2019; PMLR: London, UK, 2019; pp. 6105–6114. [Google Scholar]
  15. Liu, Z.; Mao, H.; Wu, C.Y.; Feichtenhofer, C.; Darrell, T.; Xie, S. A ConvNet for the 2020s. In Proceedings of the IEEE/CVF Conference on Computer Vision and Pattern Recognition (CVPR), New Orleans, LA, USA, 18–24 June 2022; IEEE: New York, NY, USA, 2022; pp. 11976–11986. [Google Scholar]
  16. Howard, A.G.; Zhu, M.; Chen, B.; Kalenichenko, D.; Wang, W.; Weyand, T.; Andreetto, M.; Adam, H. MobileNets: Efficient Convolutional Neural Networks for Mobile Vision Applications. arXiv 2017, arXiv:1704.04861. [Google Scholar]
  17. Dosovitskiy, A.; Beyer, L.; Kolesnikov, A.; Weissenborn, D.; Zhai, X.; Unterthiner, T.; Dehghani, M.; Minderer, M.; Heigold, G.; Gelly, S.; et al. An Image is Worth 16x16 Words: Transformers for Image Recognition at Scale. In Proceedings of the International Conference on Learning Representations (ICLR), Virtual, 3–7 May 2021. [Google Scholar]
  18. Hu, J.; Shen, L.; Sun, G. Squeeze-and-Excitation Networks. In Proceedings of the IEEE Conference on Computer Vision and Pattern Recognition (CVPR), Salt Lake City, UT, USA, 18–23 June 2018; IEEE: New York, NY, USA, 2018; pp. 7132–7141. [Google Scholar]
  19. Wang, Q.; Wu, B.; Zhu, P.; Li, P.; Zuo, W.; Hu, Q. ECA-Net: Efficient Channel Attention for Deep Convolutional Neural Networks. In Proceedings of the IEEE/CVF Conference on Computer Vision and Pattern Recognition (CVPR), Seattle, WA, USA, 13–19 June 2020; IEEE: New York, NY, USA, 2020; pp. 11534–11542. [Google Scholar]
  20. Woo, S.; Park, J.; Lee, J.-Y.; Kweon, I.S. CBAM: Convolutional Block Attention Module. In Proceedings of the European Conference on Computer Vision (ECCV), Munich, Germany, 8–14 September 2018; Springer: Berlin/Heidelberg, Germany, 2018; pp. 3–19. [Google Scholar]
  21. Vaswani, A.; Shazeer, N.; Parmar, N.; Uszkoreit, J.; Jones, L.; Gomez, A.N.; Kaiser, Ł.; Polosukhin, I. Attention Is All You Need. In Proceedings of the 31st International Conference on Neural Information Processing Systems (NeurIPS), Long Beach, CA, USA, 4–9 December 2017; Curran Associates, Inc.: Red Hook, NY, USA, 2017; pp. 5998–6008. [Google Scholar]
Figure 1. Structural design diagram of the heating table.
Fire 09 00334 g001
Figure 2. Schematic diagram and actual image of the 9-point penetrating temperature acquisition system and the overall composition of the Insulation Material Subsurface Thermal Fault Simulation Device.
Fire 09 00334 g002aFire 09 00334 g002b
Figure 3. Measurement of heating uniformity of the heating table.
Fire 09 00334 g003
Figure 4. Algorithm network structure diagram.
Fire 09 00334 g004
Figure 5. The equipment used for dataset collection.
Fire 09 00334 g005
Figure 6. Temporal evolution of surface thermal radiation fields in SWIR, MWIR and LWIR bands during 20–40 min of continuous heating at a heating table temperature of 200 °C.
Fire 09 00334 g006
Figure 7. Partial data in the dataset. The picture shows a polyurethane insulation board, with a heating table behind the insulation board. The images are captured at 30 min after heating initiation, when the heating table temperatures are 100 °C and 200 °C, respectively.
Fire 09 00334 g007
Table 1. Results of ablation experiment. Bold font indicates the best result in each column.
MethodAccuracy
(%)
FPR
(%)
FNR
(%)
Params
(M)
FLOPs
(G)
Inference Time
(RTX3090, ms)
Inference Time
(Jetson, ms)
B181.512.79.811.28.911.216.2
B286.28.37.111.215.713.519.6
B392.14.24.512.816.315.822.9
B496.32.12.313.116.816.523.9
Ours98.21.20.913.116.817.225.1
Table 2. Performance comparison at heating table temperature of 80 °C.
MethodAlarm
Threshold (°C)
Interference-Free
Scenario
Interference
Scenario
--Alert Time (s)FPR (%)Alert Time (s)FPR (%)
Infrared Thermography4046610043100
Infrared Thermography60No Alarm0No Alarm0
Infrared Thermography80No Alarm0No Alarm0
Infrared Thermography100No Alarm0No Alarm0
OursMultispectral Features and
Temporal Validation
No Alarm0No Alarm0
Table 3. Performance comparison at heating table temperature of 100 °C.
MethodAlarm
Threshold (°C)
Interference-Free
Scenario
Interference
Scenario
--Alert Time (s)FPR (%)Alert Time(s)FPR (%)
Infrared Thermography40223056100
Infrared Thermography60945084310
Infrared Thermography80No Alarm-No Alarm-
Infrared Thermography100No Alarm-No Alarm-
OursMultispectral Features&
Temporal Validation
830880
Table 4. Performance comparison at heating table temperature of 120 °C.
MethodAlarm
Threshold (°C)
Interference-Free
Scenario
Interference
Scenario
--Alert Time (s)FPR (%)Alert Time (s)FPR (%)
Infrared Thermography40168047100
Infrared Thermography60635062810
Infrared Thermography80No Alarm-No Alarm-
Infrared Thermography100No Alarm-No Alarm-
OursMultispectral Features and
Temporal Validation
380480
Disclaimer/Publisher’s Note: The statements, opinions and data contained in all publications are solely those of the individual author(s) and contributor(s) and not of MDPI and/or the editor(s). MDPI and/or the editor(s) disclaim responsibility for any injury to people or property resulting from any ideas, methods, instructions or products referred to in the content.