


Abstract
To address the discrepancy between the constant-power fire sources currently used in cable fire-related research and cable fire protection product testing and actual cable fires, this paper proposes a cable equivalent combustion simulation method based on electrical fault fires. The cable tunnel experiment platform was built and, based on energy equivalence, used an igniter to simulate a fault arc’s thermal effect and ignite the cable, obtaining the temperature rise characteristics at multiple points in the fire source area. Based on the experimental data, a simulation model for the mixed combustion of multiple cable materials was established and revised, and the heat release rate (HRR) under different fire scenarios was calculated. Then, an equivalent fire source device capable of simulating the aforementioned HRR curve was designed. The results indicate that under ignition conditions with an igniter power of 400 kW and duration of 90 s, the cable fire development exhibits nonlinear dynamic evolution, with a flame height of 0.63 m. The peak temperature rise rate and peak temperature at the measurement point reach 3.27 °C/s and 926 °C, respectively. When 39.4% of the insulation layer material of the cable participates in combustion, and the fuel molecular formula is C2.28H5.70O1.42N0.08Si0.65, the relative error between simulated and experimental temperatures during stable combustion is 3.0%. Heat release rates for mild, moderate, and severe fires stabilize near 350 kW, 420 kW, and 530 kW under this calibrated cable model. The relative error between the temperature curve from the fire source device during the stable combustion stage and that from the actual combustion experiment is 3.4%, indicating favorable equivalence.
1. Introduction
In narrow cable tunnels, cable laying is dense [1], and materials such as insulation and sheath layers are flammable [2,3]. Once a cable failure and fire occur, it is highly likely to create a high-temperature environment in the tunnel [4,5], which can damage or even ignite adjacent cables in the same channel. Therefore, research on the characteristics of tunnel fires and fire protection has attracted much attention. However, due to economic conditions, environmental pollution, and limitations in test reproducibility, it is not practical to directly burn cables for tunnel fire characteristic analysis or fire product testing. In this context, conducting equivalent simulation research on cable combustion is particularly important.
Currently, conducting experiments or simulations using a constant-power fire source is the primary method for studying the fire characteristics of cable tunnels and optimizing cable fire prevention measures. Regarding the regularity and characteristics of cable fires, most existing studies consider using other combustibles to replace cable combustion for simulating cable fires. Wang et al. [6] used an oil pool fire to simulate a cable fire, obtaining the temperature distribution above the fire source and the smoke spread characteristics inside the tunnel. The results showed that an increase in the number of cables significantly enhances the heat release rate of a fire, and smoke backflow can also lead to a further increase in local temperature. Yu et al. [7] ignited cables using a high-temperature spray gun and found that during the heating stage, the average temperature gradients of the intact cable core, cross-linked polyethylene, filling material, and outer sheath were 2.125, 1.938, 1.688, and 1.375 °C/cm, respectively. Zhang et al. [8] constructed a burning cable using a “2 kW electric heating wire + 2 m cross-linked polyethylene insulation layer” and ignited the insulation material by heating the electric heating wire, simulating the local combustion of cables caused by faulty short circuits at cable joints. Kim [9] and Cao [10] et al. used a propane gas blowtorch as a fire source to study the characteristics and spread of cable fires. When conducting numerical simulations, existing research usually simplifies the combustion cable as a constant power fire source surface, and then studies the fire characteristics inside the tunnel. An et al. [11] analyzed the temperature distribution and smoke spread characteristics under different fire source positions and wind speed conditions in a T-shaped tunnel. Niu et al. [12] analyzed the changes in the temperature above the fire source, smoke temperature at the ceiling, and the oxygen volume fraction inside the tunnel under cable fire conditions, as well as the smoke spread process inside the tunnel. Existing studies have achieved numerous results regarding the fire characteristics of cable tunnels. However, although simulating cable tunnel fires using alternative sources such as oil pool fires and burners can simplify the experimental or simulation process, this approach ignores the nonlinear dynamic evolution characteristics of real cable fires.
Regarding cable fire protection, scholars both domestically and internationally have conducted extensive research on cable arrangement and fire prevention layout. Chen et al. [13] used a butane igniter as the ignition source to build a bridge cable combustion experiment bench, and analyzed the combustion and propagation behavior of cables under different spacing arrangements. The results showed that under the working conditions of 10, 20, and 30 mm cable spacing, the spread rate of cable fires decreased with increasing spacing. Li et al. [14] used diesel as fuel and simulated cable combustion using an oil pool fire to study the flame propagation law of cables protected by fire-resistant coatings under different fire loads and wind speeds. Babu et al. [15] conducted fire tests on fire-resistant coatings with three thicknesses of 0.5 mm, 1 mm, and 1.5 mm using a flame arrester fire testing device, and analyzed the failure time and cable damage degree of coatings with different thicknesses. Pu et al. [16] conducted a simulation study on the protective effect of L-shaped fireproof partitions using FDS. The results showed that when the fire source power was 200, 400, and 600 kW, the optimal height of the L-shaped fireproof partition side plate for 110 kV cables was 0.20, 0.25, and 0.25 m. Wang et al. [17] analyzed the development law of cable tunnel fires and the fire suppression effect of fireproof partitions based on numerical simulation models without fireproof partitions and different fireproof partition forms. The above research effectively improves the fire prevention level of cable channels from the perspective of suppressing the spread of fires and reducing high-temperature damage to cables. However, there is a certain difference between a constant power fire source and an actual cable fire, which cannot accurately reflect the fire characteristics, such as the evolution process and peak intensity of the fire. The fire prevention parameters obtained and the designed fire prevention measures based on a constant power fire source may not fully meet the fire prevention needs of real fire scenarios. There is room for improvement in the equivalence, controllability, and safety of the existing experimental fire sources.
To more accurately reflect the dynamic evolution process of cable fires caused by the mixing and combustion of multiple materials, this paper combines combustion experiments with numerical simulations and proposes an equivalent simulation method for cable combustion. Firstly, the cable is ignited by simulating the thermal effect of the fault arc to obtain the temperature rise characteristics of the fire source area. Then, based on experimental data, a simulation model of cable combustion is established and corrected to obtain the heat release rate variation curves under different fire conditions. Finally, a fire source device that can simulate the heat release curve is designed to equivalently simulate the dynamic evolution process of cable electrical fault fire combustion. This device can provide technical support for fire risk assessment and fire prevention configuration optimization in cable tunnels.
2. Cable Combustion Experiment Simulating Electrical Fault Ignition
2.1. Simulation Method for Cable Fault Arc Ignition
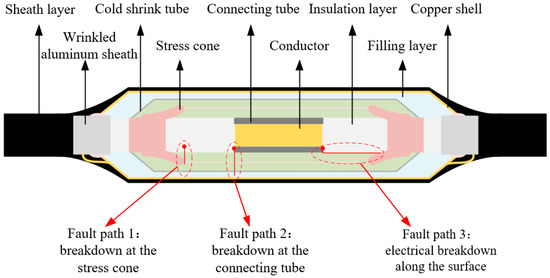
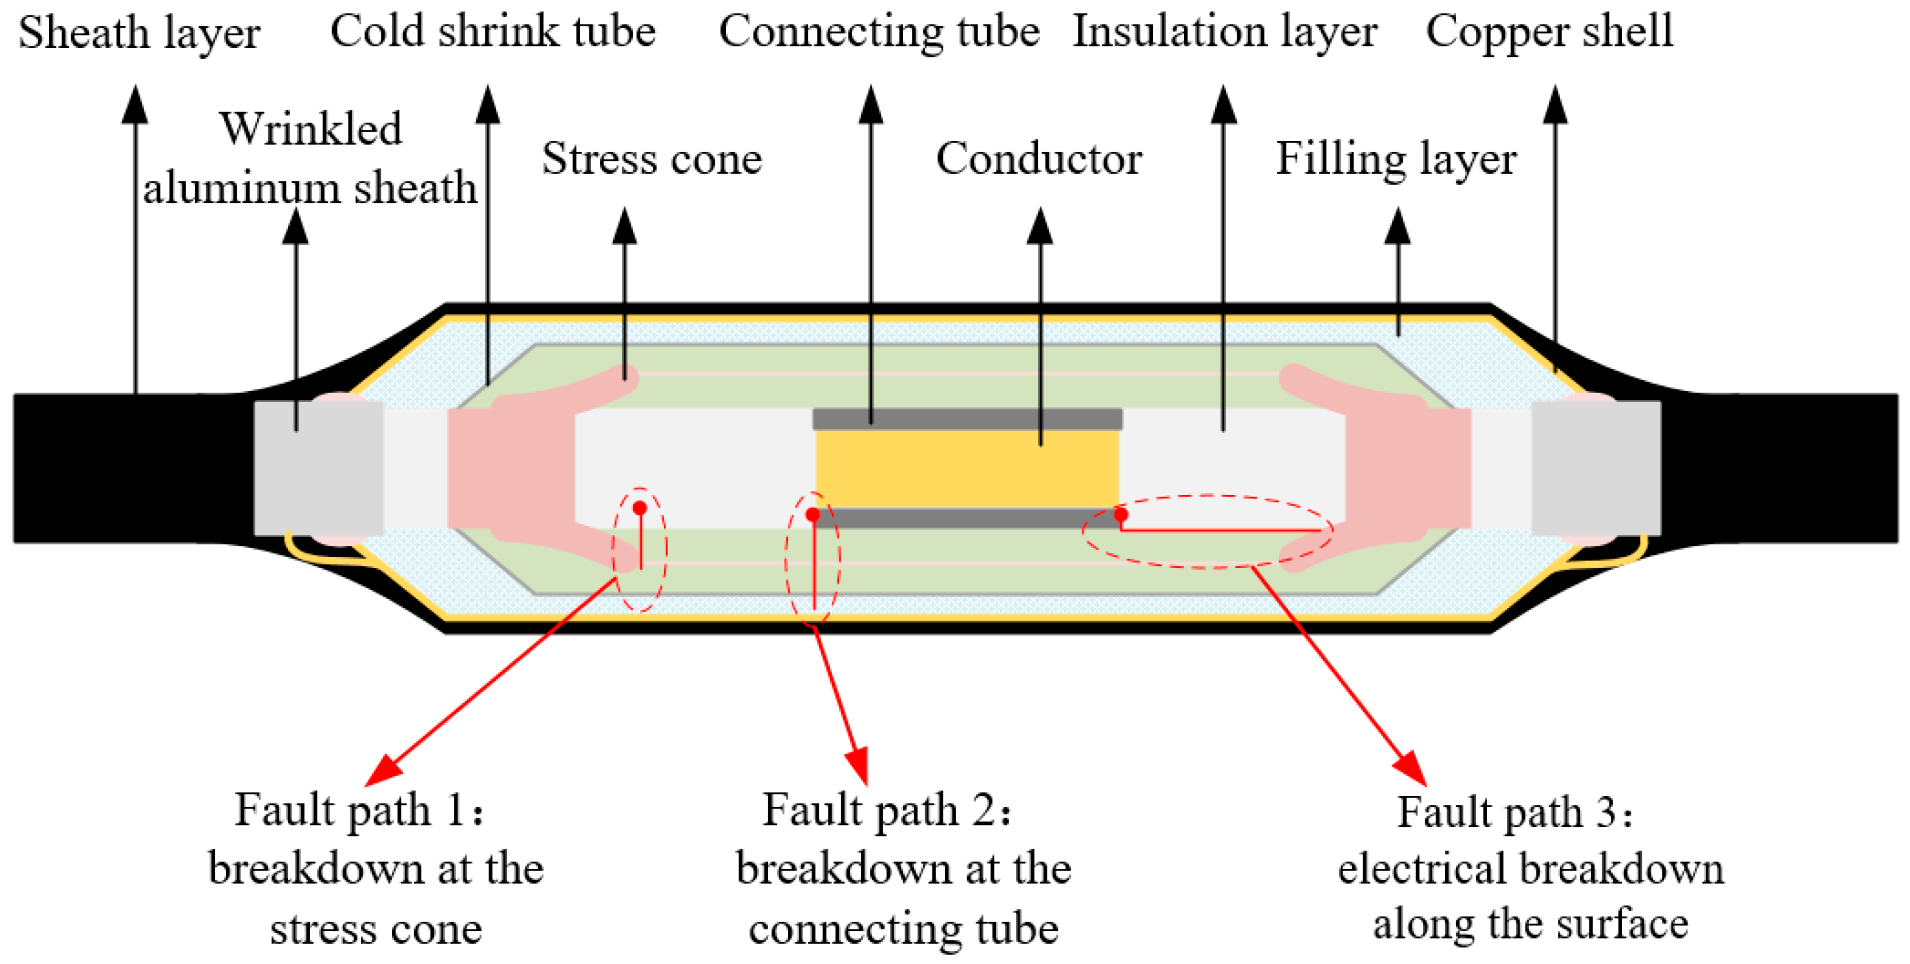
Due to their structural characteristics and material properties, the intermediate joints of cables are prone to local defects and electric field distortions under electrical, thermal, and mechanical stresses, which can cause insulation breakdown and generate fault arcs, ultimately leading to cable fires [18,19,20]. Statistical data show that over 90% of cable faults occur at cable joints, and over 70% of cable fire accidents are caused by cable joint fault arcs [21]. This paper takes the 110 kV cable intermediate joint with model ZC-YJLW02-Z-64 as an example. The main paths for generating fault arcs are shown in Figure 1, which are breakdown at the stress cone, breakdown at the connecting tube, and electrical breakdown along the surface of the connecting tube–stress cone [22,23].
Figure 1.
Schematic diagram of 110 kV cable intermediate joint and its fault path.
The energy of arcs generated by different fault paths varies significantly depending on their specific locations, discharge mechanisms, and fault operating conditions. Research has shown that the fault arc current of 110 kV cable intermediate joints is generally between 10~50 kA, the fault arc power is generally between 2~7 MW, and the fault duration is generally between 0.1~0.7 s [21,24,25]. The energy of the fault arc is mainly converted into mechanical energy at the moment of explosion, internal thermal energy that damages or even ignites the cable material, and external thermal energy that diffuses to the surrounding environment. The energy of the internal thermal energy is shown in Equation (1). However, due to limitations in experimental conditions, it is difficult to directly generate short-circuit arcs in 110 kV cables to ignite them. Therefore, based on the concept of effective energy deposition equivalence, a continuous-burning porous propane igniter was used in the experiment to replace the arc and ignite the cable. To ensure that the flame can cover the entire surface of the cable joint, the size of the igniter combustion surface is taken as 0.5 m × 0.4 m. To ensure that propane is fully burned and the flame acting on the cable joint is strong enough, the vertical distance between the combustion surface and the cable joint is taken as 0.2 m.
where E is the energy acting on the cable material; is the arc power; tarc is the duration of the arc; and ηarc is the heat transfer efficiency of the arc. When the igniter power is , the duration is tignite, and the heat transfer efficiency is ηignite, it is necessary to ensure that the energy acting on the cable material is the same.
Before cable insulation breakdown, almost all arc energy is absorbed by the cable material; when a cable breaks down and explodes, 70% to 90% of the arc energy is converted into mechanical energy and radiated heat energy that spreads outward. Taking into account the dual characteristics of energy accumulation in the early stage of breakdown and energy leakage after breakdown, the arc heat transfer efficiency is set at 30% [26]. When using an igniter to ignite cables, the main heat transfer methods are thermal radiation and convection. Considering the air thermal resistance between the combustion surface and the cable spacing, the heat transfer efficiency of the igniter is taken as 3% [27]. This paper takes the case of a short circuit arc with an energy of 5 MW and an arc lasting for 0.7 s igniting the cable as an example. After considering the heat transfer efficiency of the arc and igniter, an igniter with a combustion power of 400 kW and a duration of 87.5 s (taken as 90 s) is needed to simulate the thermal effect of the arc igniting the cable. This equivalence focuses on matching the total energy acting on cable materials at the ignition stage. Although certain differences in transient heat flux distribution exist between concentrated fault arc discharge and the distributed flame of the propane igniter, this method can be fully applied to investigate the sustained combustion behavior of cable joints after ignition.
2.2. Construction of Experimental Platform and Sample Preparation
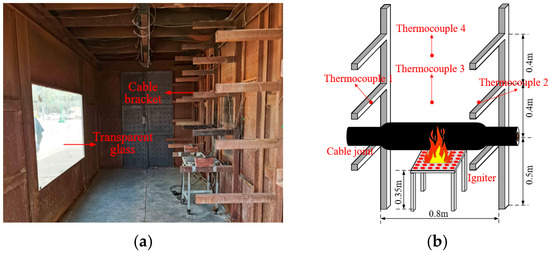
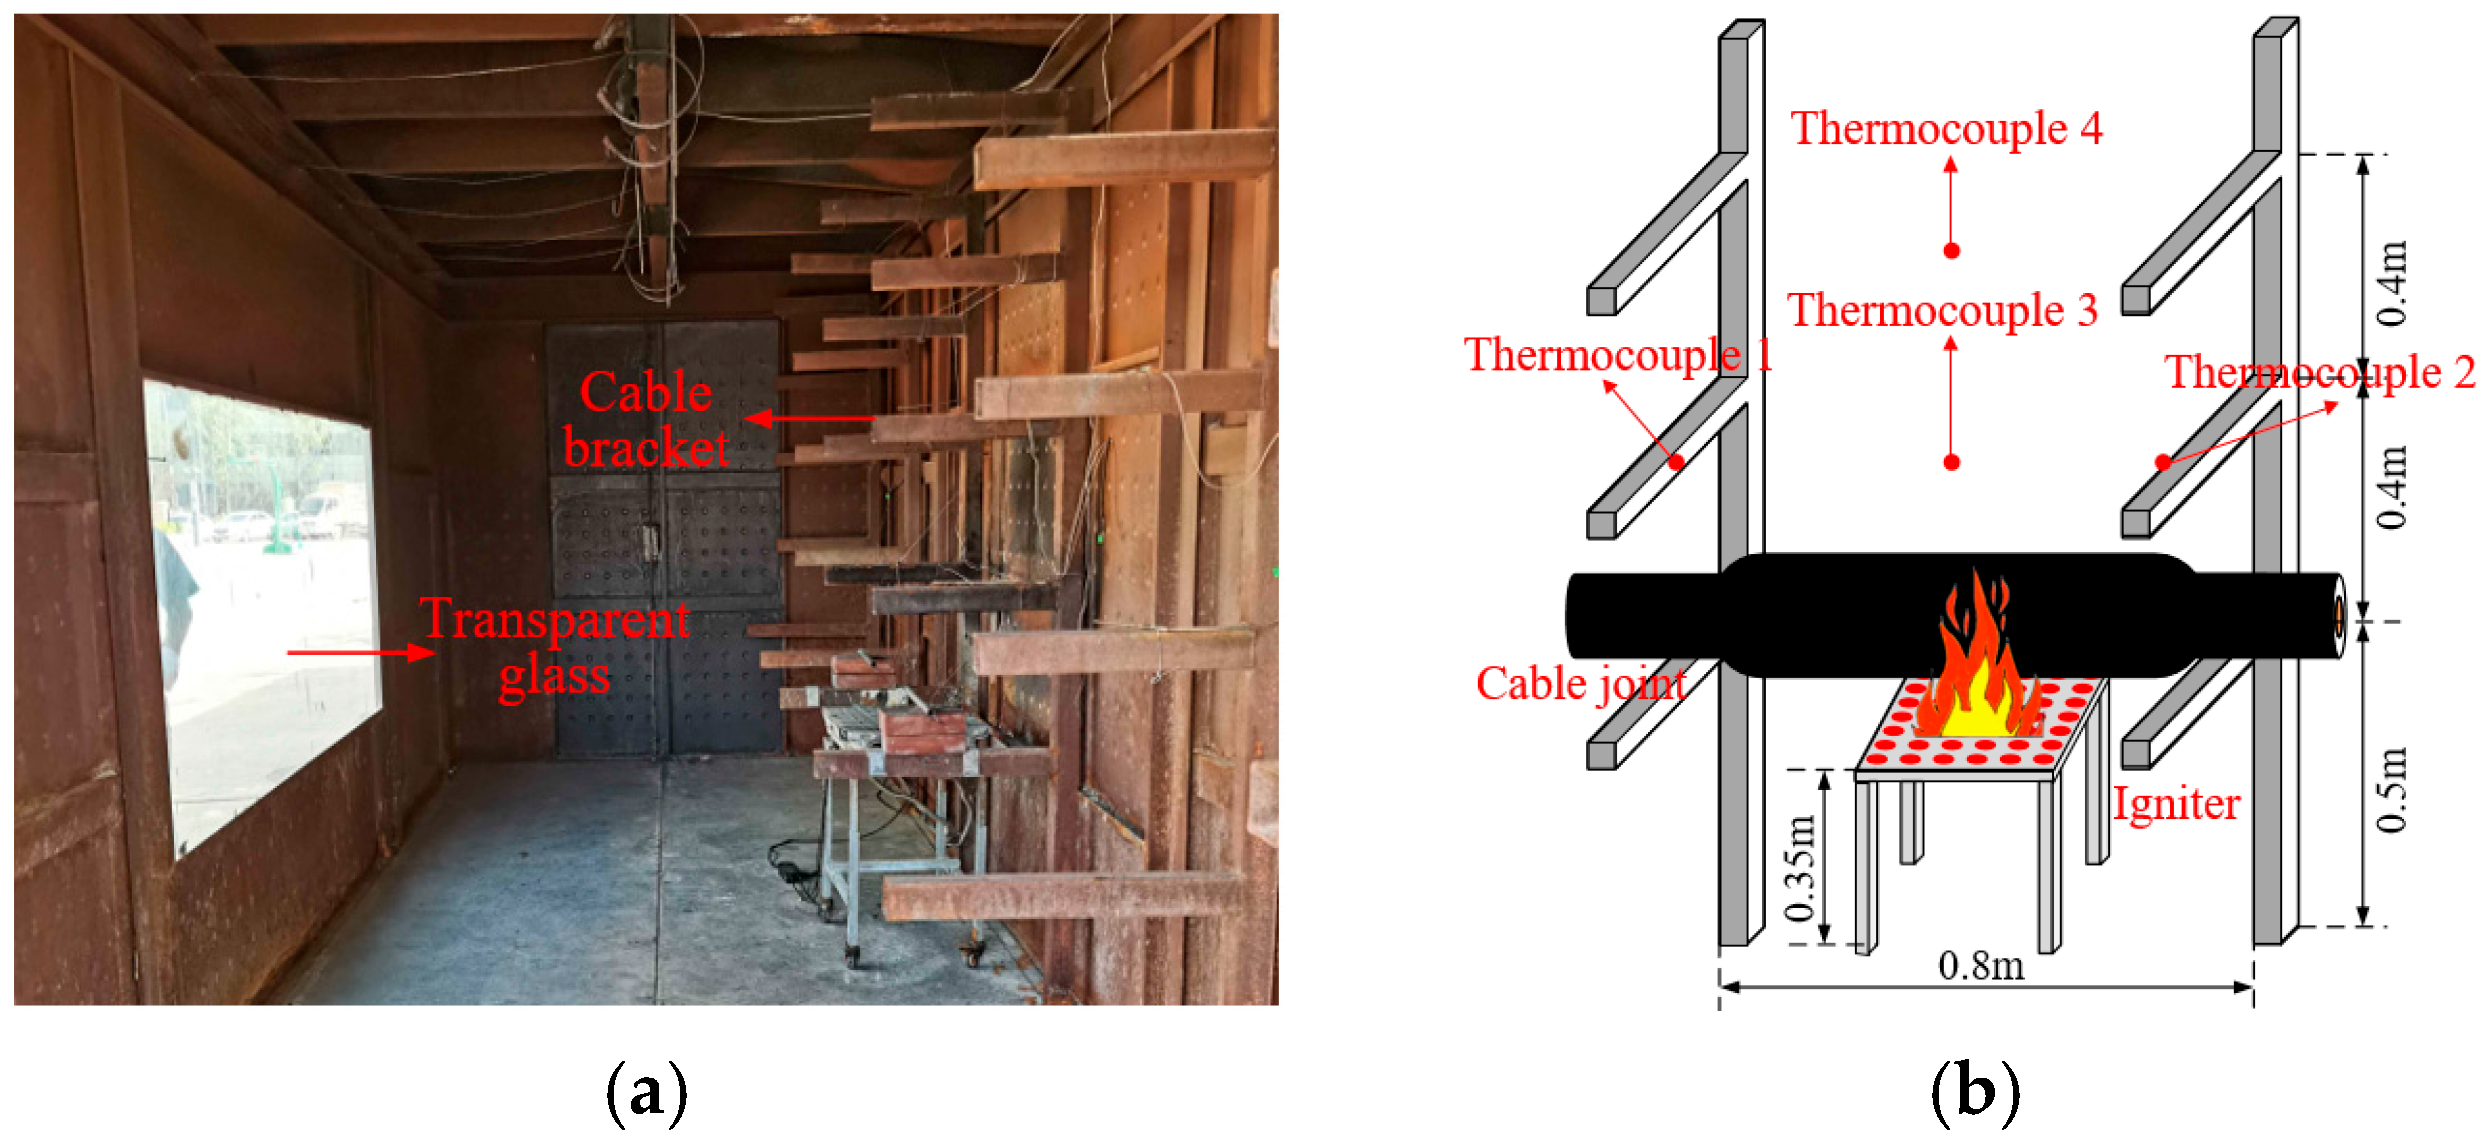
In order to better reproduce the development trend of fires in real cable tunnels, based on relevant standards [28,29], actual tunnel conditions, and experimental requirements, an equal-proportion cable tunnel fire experimental platform is established as shown in Figure 2a.
Figure 2.
Cable tunnel fire experimental platform and arrangement of cable intermediate joint combustion. (a) Experimental platform. (b) Cable joint arrangement.
The main material of the experimental platform is carbon steel, with specific dimensions of 2.3 m × 2.3 m × 6 m. Five layers of cable supports are arranged on the right side according to the actual situation of the cable tunnel, with a horizontal spacing of 0.8 m between adjacent supports. Transparent fire-resistant glass is installed on the left wall. The longitudinal direction of the cable tunnel is in a semi-closed state, simulating the natural ventilation of a narrow tunnel. Under normal circumstances, the pressure difference inside and outside the experimental platform is small, and the wind speed is close to 0 m/s.
The selected 110 kV cable intermediate joint sample has a total length of 1.2 m. The cable bodies on both sides of the sample are 0.2 m long. The protective copper shell on the outer layer of the cable joint is peeled off, exposing the internal combustibles. The cross-sectional diameter of the intermediate joint is 0.13 m. Then, from the outside to the inside, the filling layer (polyurethane, PU), cold shrink tubing (silicone rubber, SiR), and insulation layer (cross-linked polyethylene, XLPE) are each opened with a diameter of 0.05 m to simulate the state of breakdown failure and explosion at the connection tube of the cable intermediate joint. Finally, the cable joint is placed on the first layer cable bracket, with the exposed part located in the center of the two brackets and the notch facing downwards. The cable joint is 1.67 m high from the tunnel ceiling and 0.25 m from the side wall, as shown in Figure 2b. Multiple armored thermocouples with the model WRNK-191 are arranged near the middle joint of the cable to monitor the temperature rise characteristics during the combustion process.
2.3. Analysis of Experimental Results
The ambient temperature of the cable tunnel test platform is 23 °C, and the ambient humidity is 47%. Before the experiment begins, turn on the visible light camera (FDR-AX40, Shanghai Suoguang, China) and temperature acquisition device (thermocouple, Model WRNK-191, China) to record the flame shape and the fire source area temperature of the entire cable joint combustion. Under the same experimental conditions, this study conducted experiments three times to ensure the reliability of the test results.
According to existing research, the combustion process of cables ignited by electrical faults can be divided into four stages: ignition, open flame, stable combustion, and decay extinguishing [30,31,32]. During the ignition phase, the faulty cable begins to pyrolyze and melt under the influence of external heat sources or high arc temperatures, releasing a small amount of smoke; during the open flame stage, the cable begins to produce distinct flame characteristics and can maintain autonomous combustion, releasing a certain amount of smoke and heat; in the stable stage, the cable fire expands and steadily burns in the current environment, with a tendency to spread axially towards the cable; and during the attenuation and extinguishing stage, the fire will gradually dissipate when the cable material burns out, but more often it can be directly extinguished by external intervention.
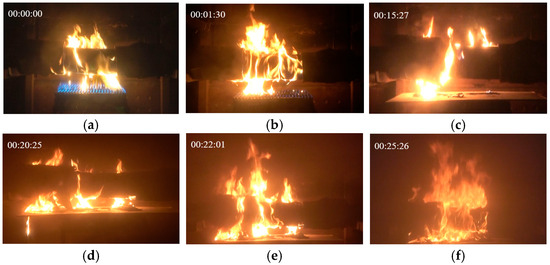
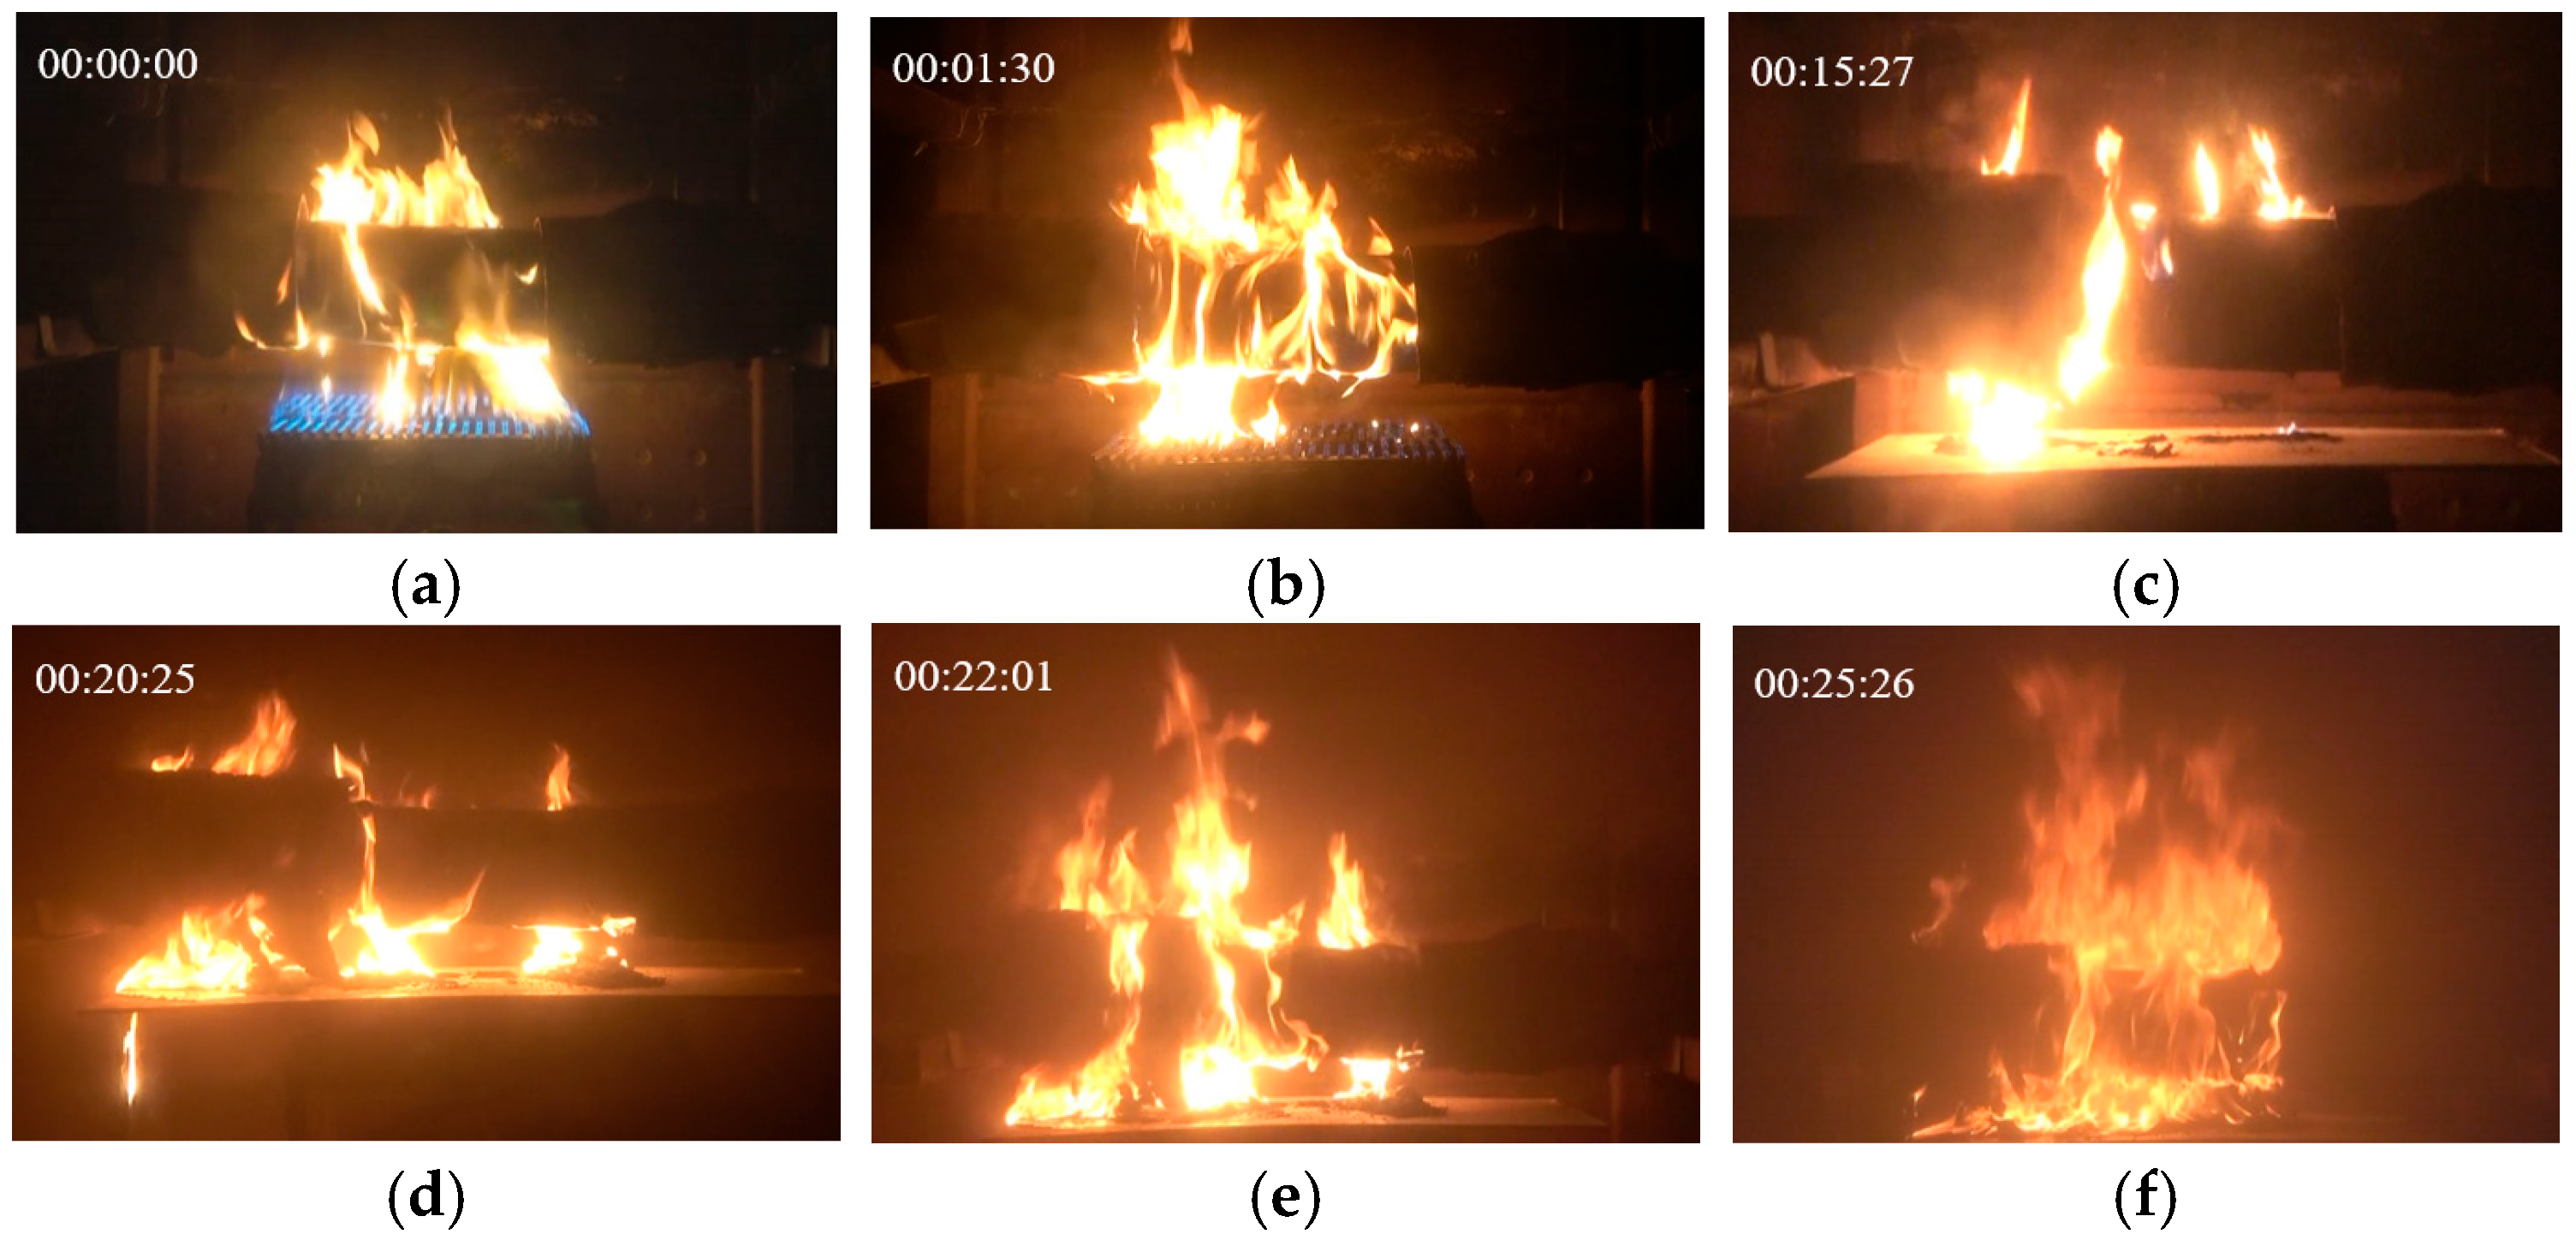
This study used an igniter to ignite the combustible material inside the cable, and the igniter ignited continuously for 90 s. As shown in Figure 3a,b, under the combined action of the igniter and the initial combustion of the cable, the cable joint was surrounded by flames, and it underwent a slight solid pyrolysis reaction while generating a small amount of soot particles. As shown in Figure 3c, in the absence of an external fire source, the joint of the cable can maintain autonomous combustion, but its fire intensity was significantly reduced. Analysis indicates that flame retardant components within the cable sheath and insulation suppress vigorous surface combustion and are restricted by pyrolysis kinetics and internal thermal transport resistance; slow subsurface pyrolysis continues, which requires considerable time to accumulate combustible gas and creates a prolonged thermal incubation period. As shown in Figure 3d, with the intensification of pyrolysis, the cable joint gradually exhibited foaming and swelling, released a large amount of flammable gas, and began to drip a small amount of molten material. At this point, the cable fire expanded significantly again.
Figure 3.
Burning process of cable intermediate joint. (a) Cable ignition. (b) Stop ignition. (c) Self-combust. (d) Dropping of molten material. (e) Expansion of fire. (f) Stable combustion.
As shown in Figure 3e, the cable joint was completely ignited, and the visibility inside the tunnel was significantly reduced due to the influence of carbon smoke particles. Analysis indicates that air flow is poor in semi-enclosed tunnels, and carbon smoke particles may form when cable materials are not fully burned. As shown in Figure 3f, the materials of each layer of the cable joint participated in the combustion, and the maximum flame height when the fire tended to stabilize reached 0.63 m, and the visibility was greatly reduced. After 5 min of stable burning of the cable, the fire did not decrease, so a fire extinguisher was used to extinguish the fire and end the burning test. Under the same experimental conditions, the experiment was repeated three times to ensure its reliability.
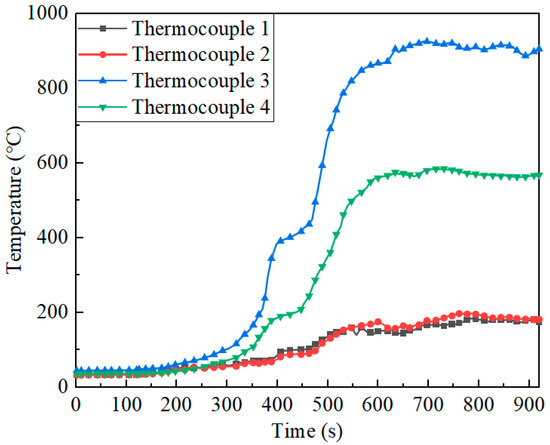
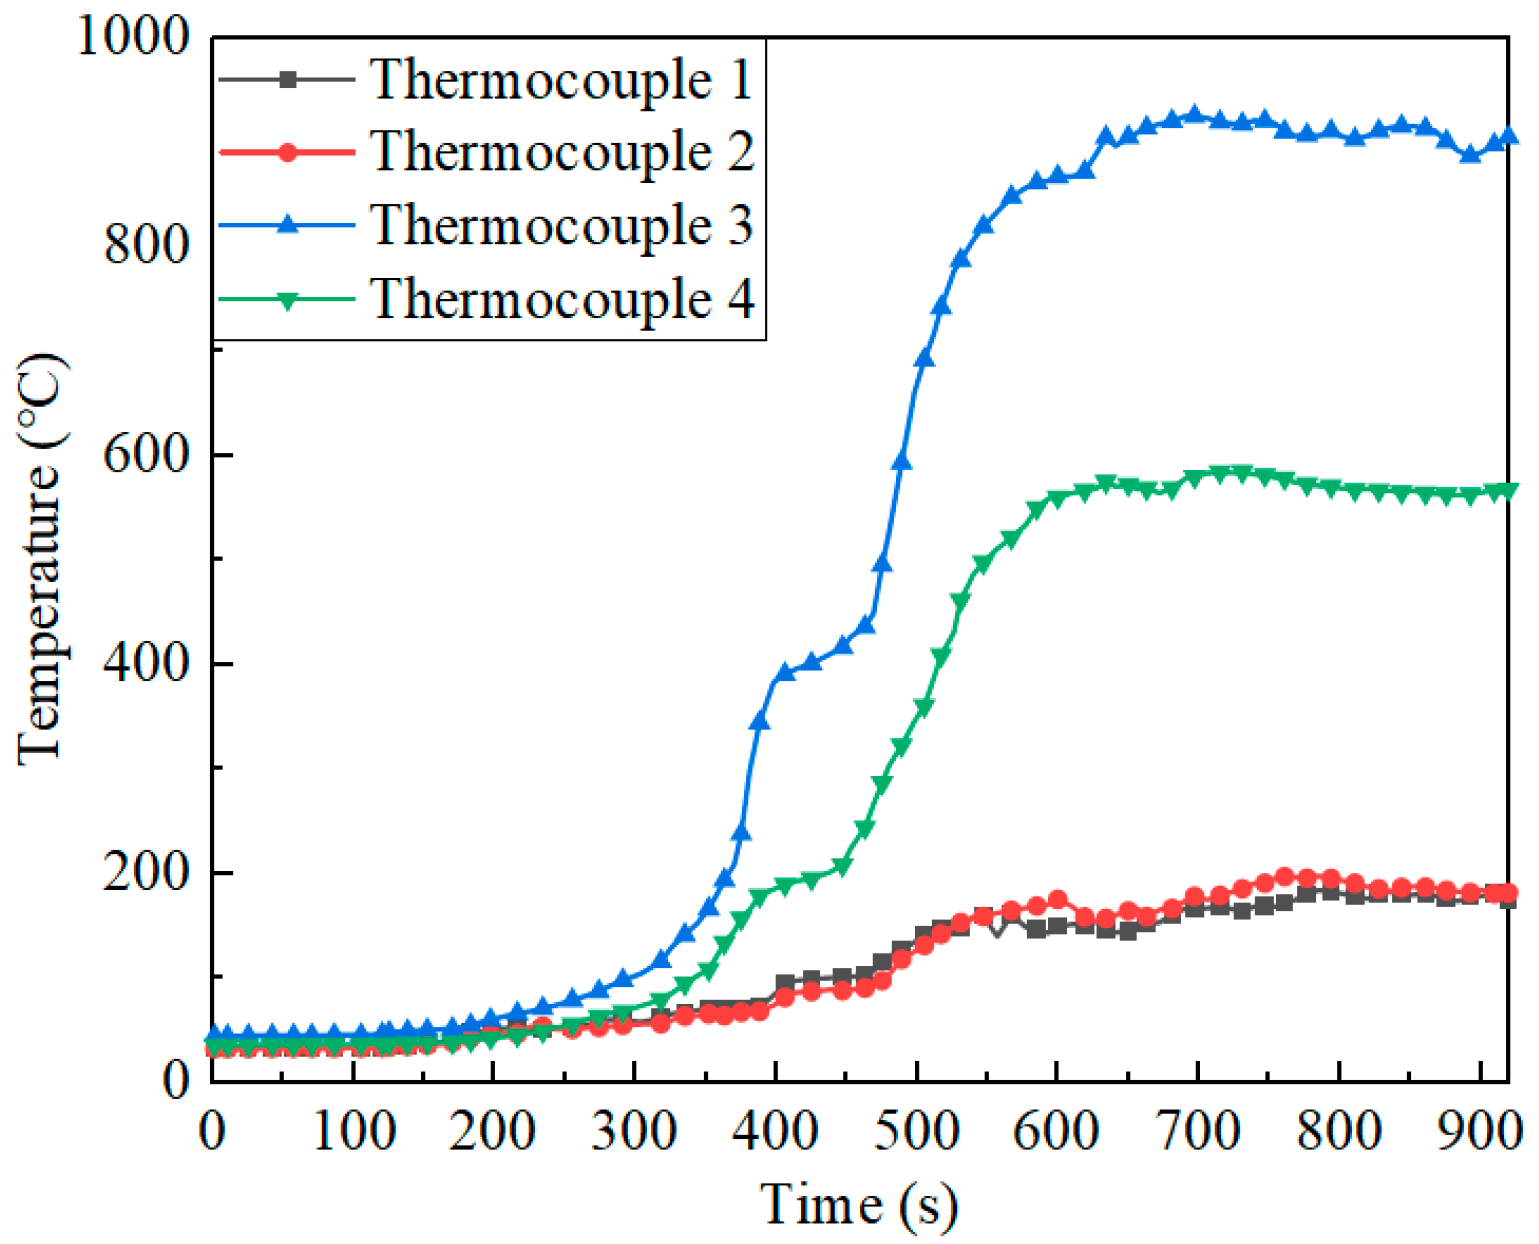
This paper aims to study the autonomous combustion characteristics of cables after ignition and, therefore, does not consider the combustion situation of cables during the ignition stage for the time being. The temperature rise characteristic curves of different temperature measurement points after autonomous combustion of the cable were obtained, as shown in Figure 4. After extinguishing the igniter, during the autonomous combustion process of the cable, the temperature at each measuring point gradually decreased to around 30 °C, and there was no significant change in temperature within 240 s. But as the pyrolysis intensified, the temperature at each temperature measurement point showed an upward trend at 274 s. Between 274 s and 398 s, the temperature at each measuring point significantly increased. Among them, the temperature rise, measured by thermocouple 3 (located directly above the flame), reached the maximum value of 2.67 °C/s, while the temperature rise rates measured by thermocouples 1, 2, and 4 were 0.26 °C/s, 0.23 °C/s, and 1.06 °C/s, respectively.
Figure 4.
Combustion temperature rise curve of cable intermediate joint.
Between 398 s and 463 s, the temperature rise trend slowed down. Analysis reveals that this may be a transitional combustion stage from surface fuel to internal fuel, where the heat release rate was temporarily reduced due to insufficient fuel supply and limited pyrolysis depth. After about 60 s, extensive pyrolysis takes place within the cable materials, the fire intensifies, and the ambient temperature rises sharply. Among them, the temperature rise rate measured by thermocouple 3 was as high as 3.27 °C/s. At 610 s, the temperatures of thermocouples 1 and 2 tended to stabilize, with average temperatures of 171 °C and 180 °C, respectively, and the highest temperatures of 184 °C and 191 °C, respectively. The position directly above the flame was affected by the lifting effect of the thermal plume, which continued to heat up for a period of time, and then the fire gradually stabilized after 656 s. The average temperatures of thermocouples 3 and 4 at 730 s were 911 °C and 572 °C, respectively, with the highest temperatures being 926 °C and 585 °C, respectively.
3. Simulation Research on Equivalent Combustion of Cables
This study uses FDS (Fire Dynamics Simulator) for numerical simulation to analyze the solid-phase pyrolysis and gas-phase reactions during the combustion process of cable joints, and establishes a cable simulation model for mixed combustion of multiple materials. Based on this model, the heat release rate curve of equivalent combustion of cable joints is obtained.
3.1. Modeling of Cable Burning Platform
This study establishes a complex mixed combustion model that conforms to thermodynamics based on the mass conservation equation, momentum conservation equation, component conservation equation, and energy conservation equation of the FDS standard as shown in Equations (2)–(5) [12,33,34].
where, among them, ρ is the material density; t is time; is the fluid velocity vector; τ is the stress tensor; p is pressure; fv is the volumetric force exerted on a fluid per unit volume; Yi is the mass score of the i-th component; Di is the diffusion coefficient of the component; is the mass of the i-th component; h is the enthalpy value of the fluid; is the heat flux vector, mainly including conductive heat flux (−k∇T) and radiative heat flux ; and is the heat release rate of combustion.
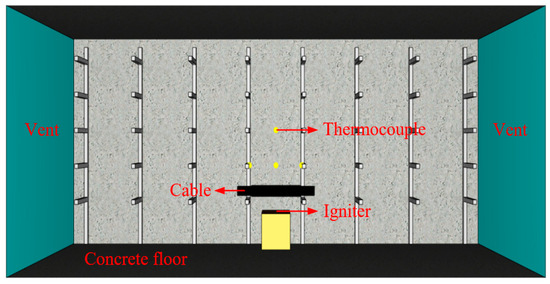
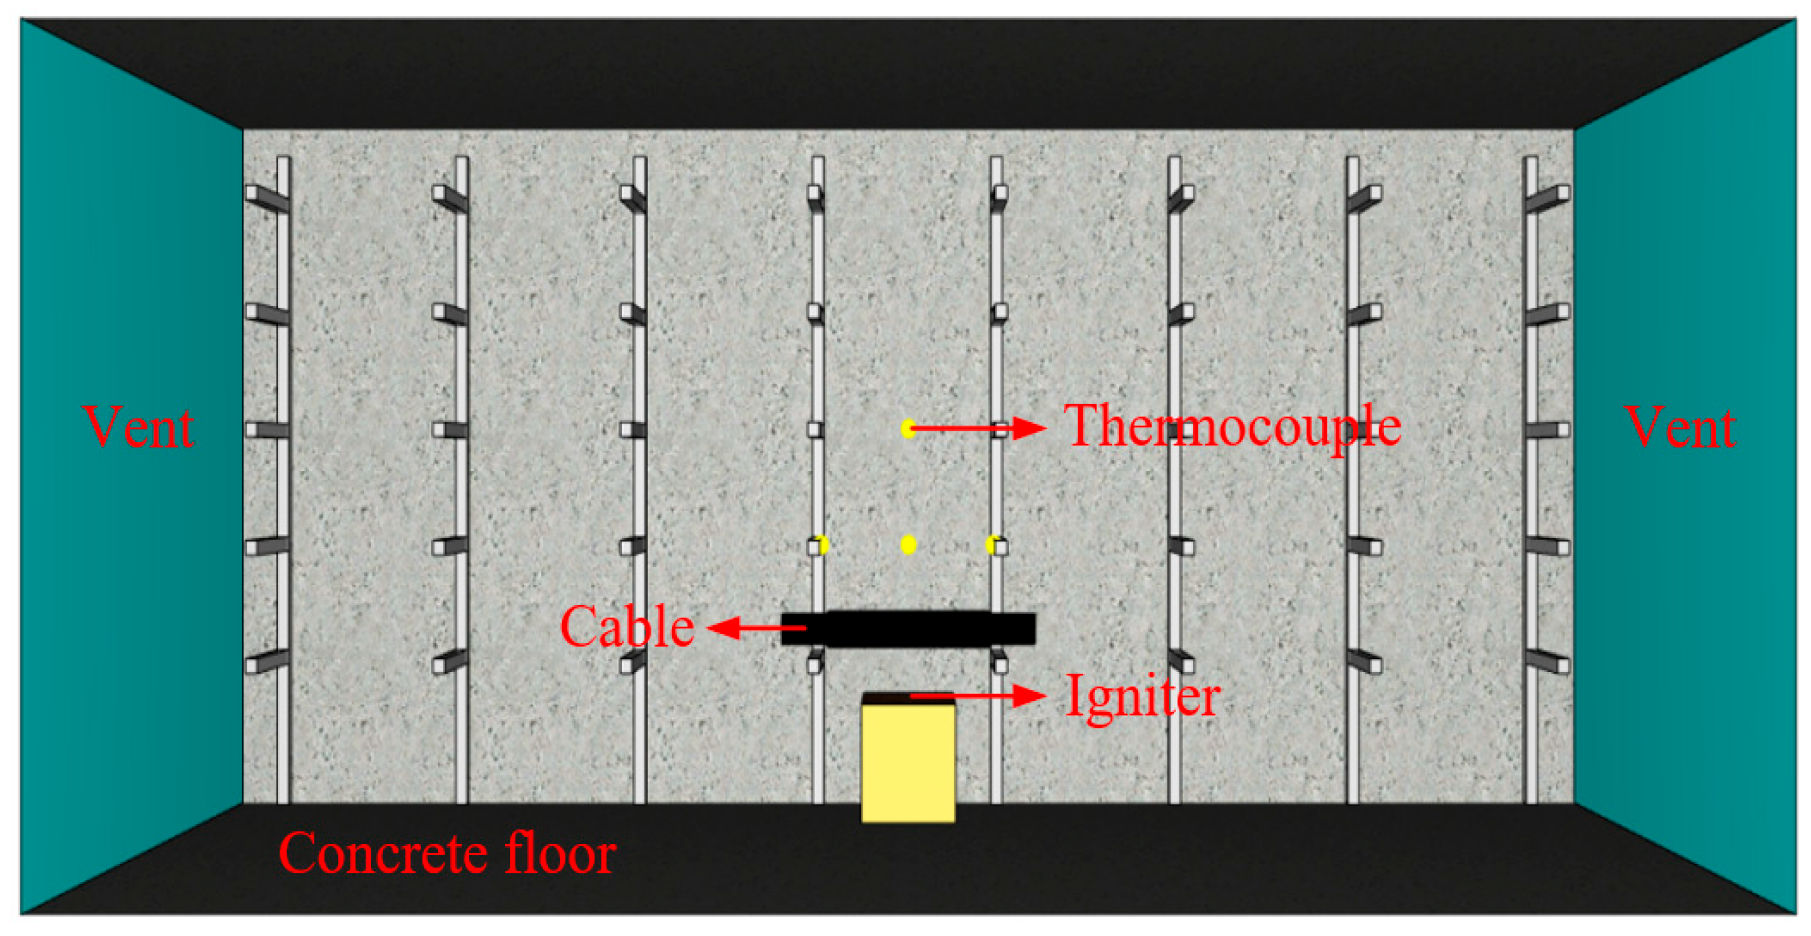
Based on the layout of the cable tunnel experiment platform structure, a simulation model of the cable tunnel was established, as shown in Figure 5. The power of the igniter is 400 kW, with a continuous ignition time of 90 s. The placement of the thermocouple is consistent with the experimental conditions.
Figure 5.
Simulation model of cable combustion experiment platform.
The structure of the cable intermediate joint is simplified, considering only the combustible materials of the filling layer (polyurethane), cold shrink tubing (silicone rubber), and insulation layer (cross-linked polyethylene). The structural parameters and thermal physical property parameters of the cable intermediate joint are shown in Table 1, where the thermal parameters of the material are obtained through reference [35] and laser thermal conductivity measurement.
Table 1.
Structure and thermophysical properties of cable joints.
3.2. Building Complex Combustion Reactions of Cables
- (1)
- General formula for combustion reaction
The combustion process of cable intermediate joints mainly generates gaseous products such as CO2, water vapor, and CO, as well as solid silica (SiO2) and soot particles produced by incomplete combustion. Trace amounts of hydrogen cyanide (HCN) are also generated. A portion of the solid SiO2 and carbon particles can be entrained by hot flue gas and suspended as aerosols. The combustion process of cables involves multiple substances reacting together, and the amount participating in combustion changes constantly with material pyrolysis. To avoid complex simulation calculations, this paper adopts a lumped combustion model to simulate the combustion behavior of cables. The reaction formula for the combustion of cable intermediate joints in the air is given by Equation (6).
where CxHyOzNmSin is the chemical molecular formula of the cable intermediate joint participating in combustion; x, y, z, m, and n represent the number of atoms in carbon, hydrogen, oxygen, nitrogen, and silicon, respectively; and k, vco, and vc represent the reaction coefficients of air, carbon monoxide, and soot particles, where .
The reaction coefficient between product CO and soot can be calculated using Equation (7).
where vp is the reaction coefficient of the product CO or C; WF is the molar mass of the cable fuel molecular formula weighted by the molar proportion of each constituent material, which can be calculated directly from its atomic composition; Wp is the molar mass of the product; and yp is the mass production rate of the product. Through experimental testing, it was found that the CO mass production rate is 22.7% and the soot yield is 6.8%.
The fuel molecular formula CxHyOzNmSin of the cable intermediate joint is determined by the proportion of fuel in each layer participating in combustion, and its calculation method is given by Equations (8) and (9).
where X1, X2, and X3 are the proportions of three reactants involved in combustion, corresponding to polyurethane (C9H14O3N2), silicone rubber (C2H6O2Si), and cross-linked polyethylene (C2H4), respectively. The reactants X1(C9H14O3N2) + X2(C2H6O2Si) + X3(C2H4) can be represented as CxHyOzNmSin; ni is the amount of substances in different combustibles; Vi is the volume of different combustibles; ρi is the density of different combustibles; and Mi is the molar mass of different combustibles.
- (2)
- Gas-phase reaction equation
The cable structure is tight, and the filling layer and cold shrink tube are thick, making it difficult to directly determine the amount of insulation material involved in combustion. Therefore, an analysis is conducted on the reaction ratio of combustion products under extreme conditions. On the basis of complete combustion of both the filling layer and the cold shrink tube, assuming that the amount of insulation layer participating in combustion accounts for 0%, 25%, 50%, 75%, and 100% of the total insulation layer, the combustion ratio of the filling material, cold shrink tube, and insulation layer material can be determined. The more insulation materials involved in combustion, the more total mixed combustion products. Calculate the amount of substances involved in combustion for the corresponding materials based on Equations (7)–(9) and the material parameters in Table 1. By calculating the ratio X1:X2:X3 of the amount of filler, shrink tubing, and insulation material, the corresponding fuel molecular formula can be obtained, as shown in Table 2.
Table 2.
Fuel molecular formula under different combustion material ratios.
The gas phase reaction equations are balanced using the mass production rates of CO and soot, as well as the atomic conservation theorem, as shown in Equations (10)–(14).
- (3)
- Complex combustion model
During the combustion process, materials undergo multiple pyrolysis processes at different temperatures, generating combustible gases and solid residues. This paper sets the pyrolysis properties of the materials in each layer of the cable intermediate joint [36,37], as shown in Table 3. To simplify the calculation process, it is assumed that all solid materials are thermally decomposed into corresponding gases, and then mixed according to the combustion ratio of the sheath layer, filling layer, and insulation layer to obtain fuel gas CxHyOzNmSin. Finally, the gas phase reaction Equations (10)–(14) are used to mix the fuel and air in proportion, and corresponding products are set to complete the modeling of the complex combustion reaction model.
Table 3.
Thermal decomposition properties of cable joint.
3.3. Cable Combustion Simulation and Model Parameter Correction
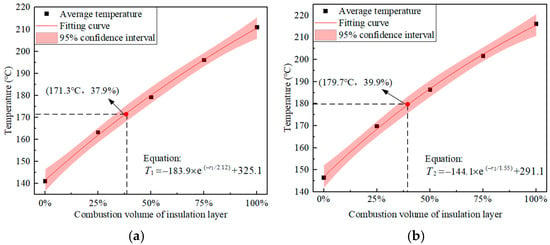
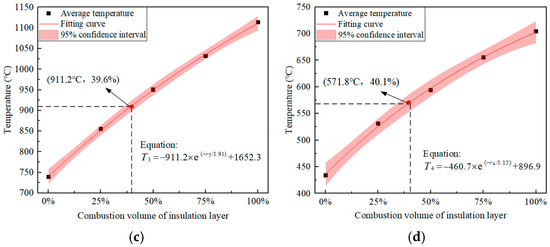
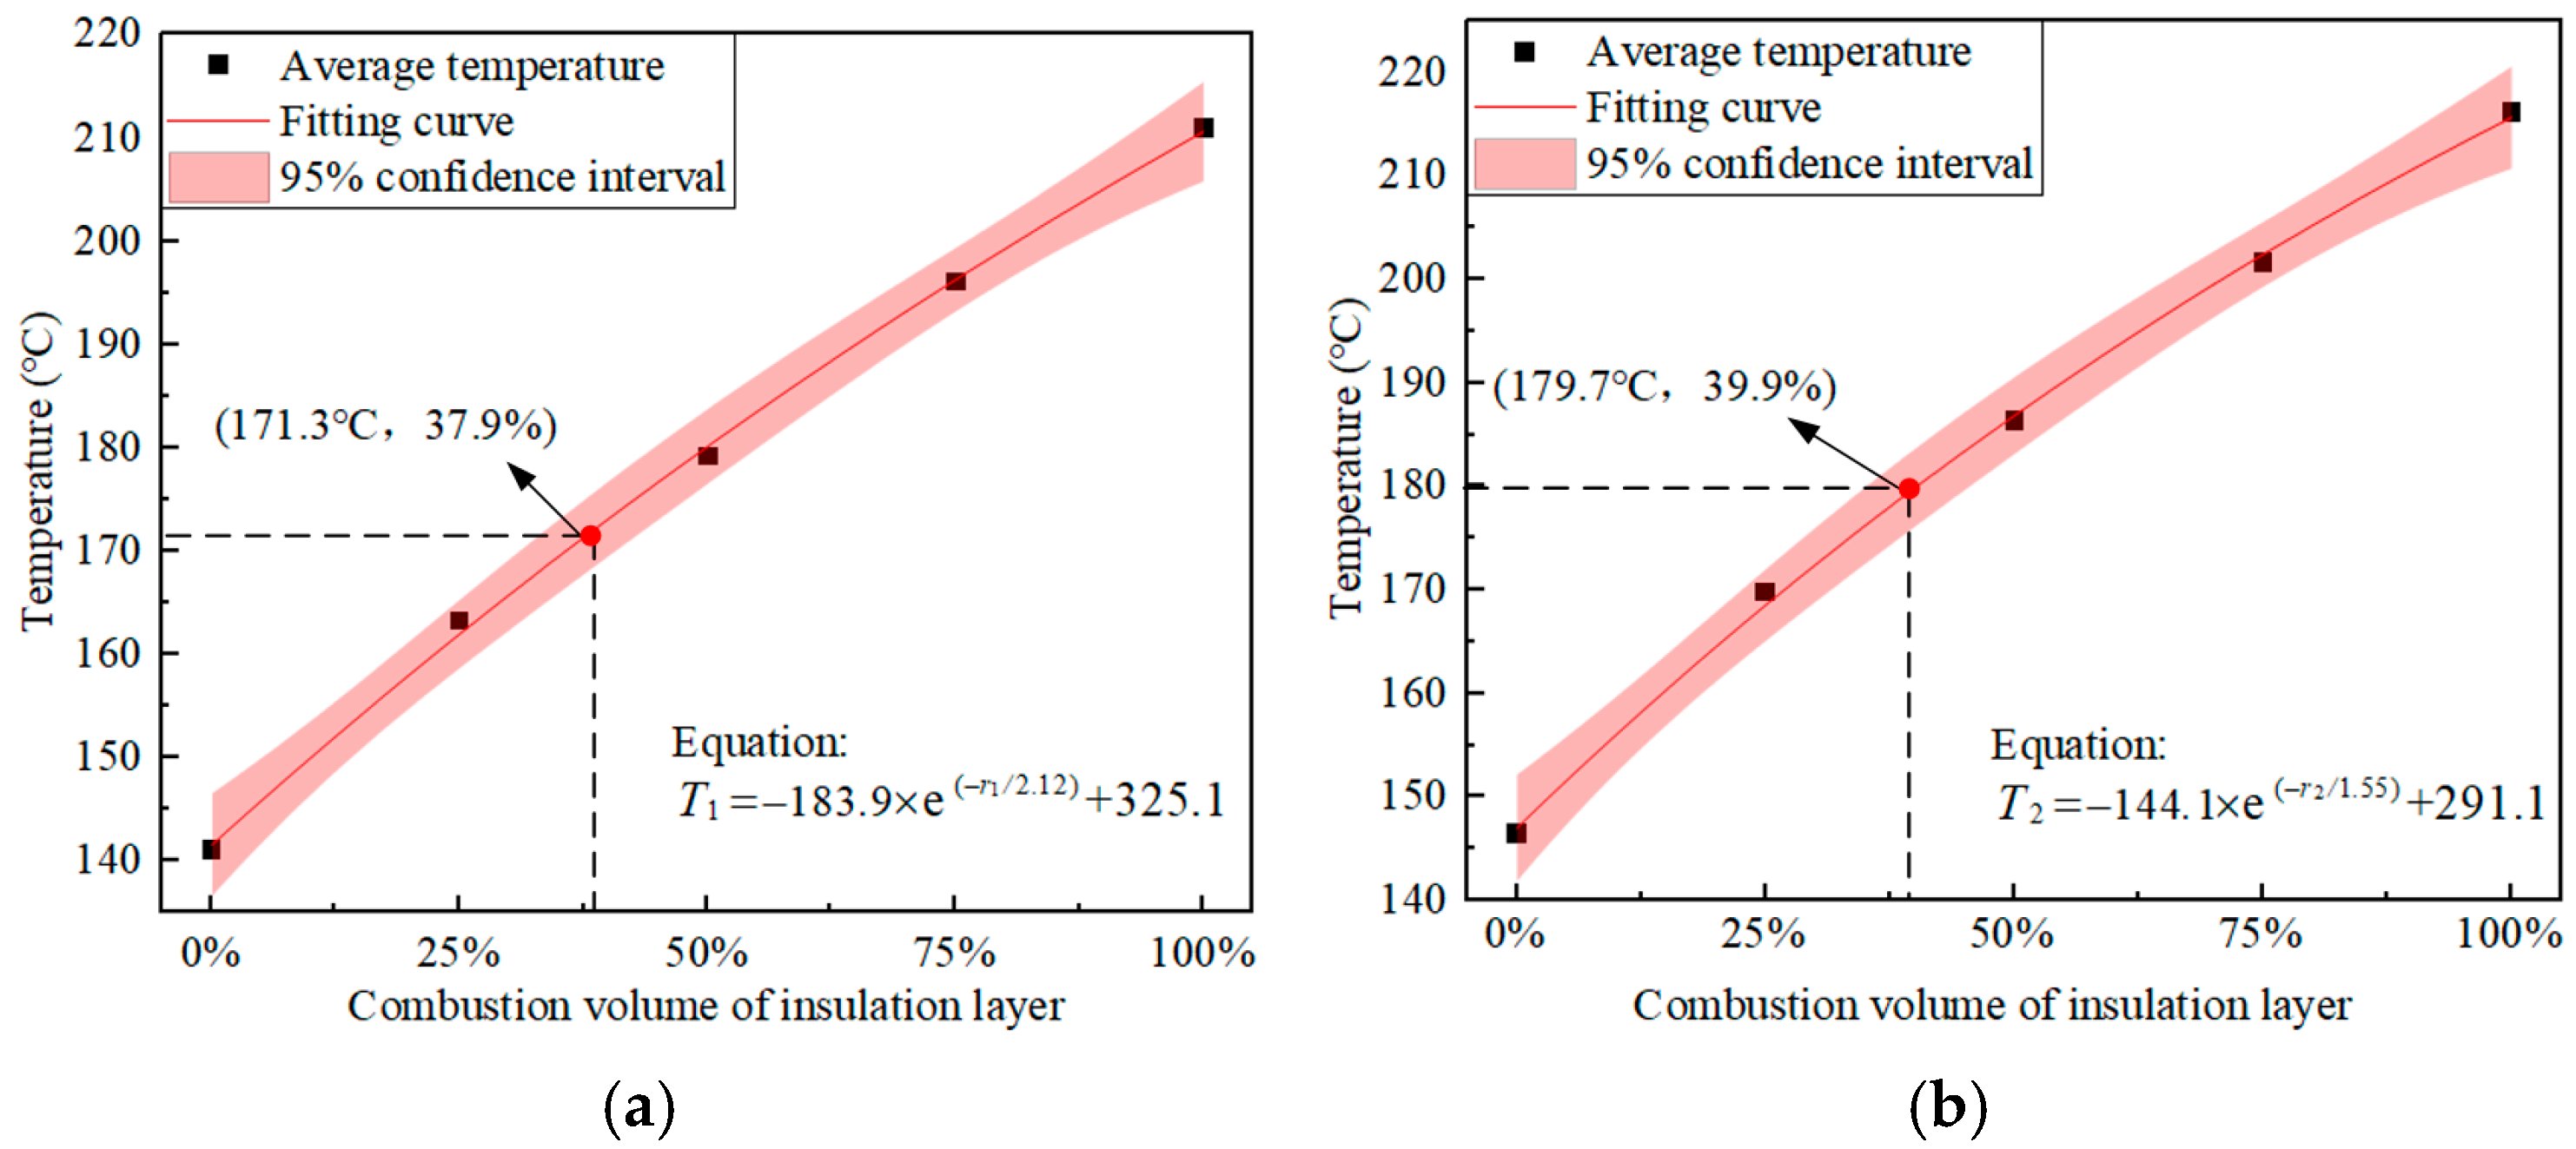
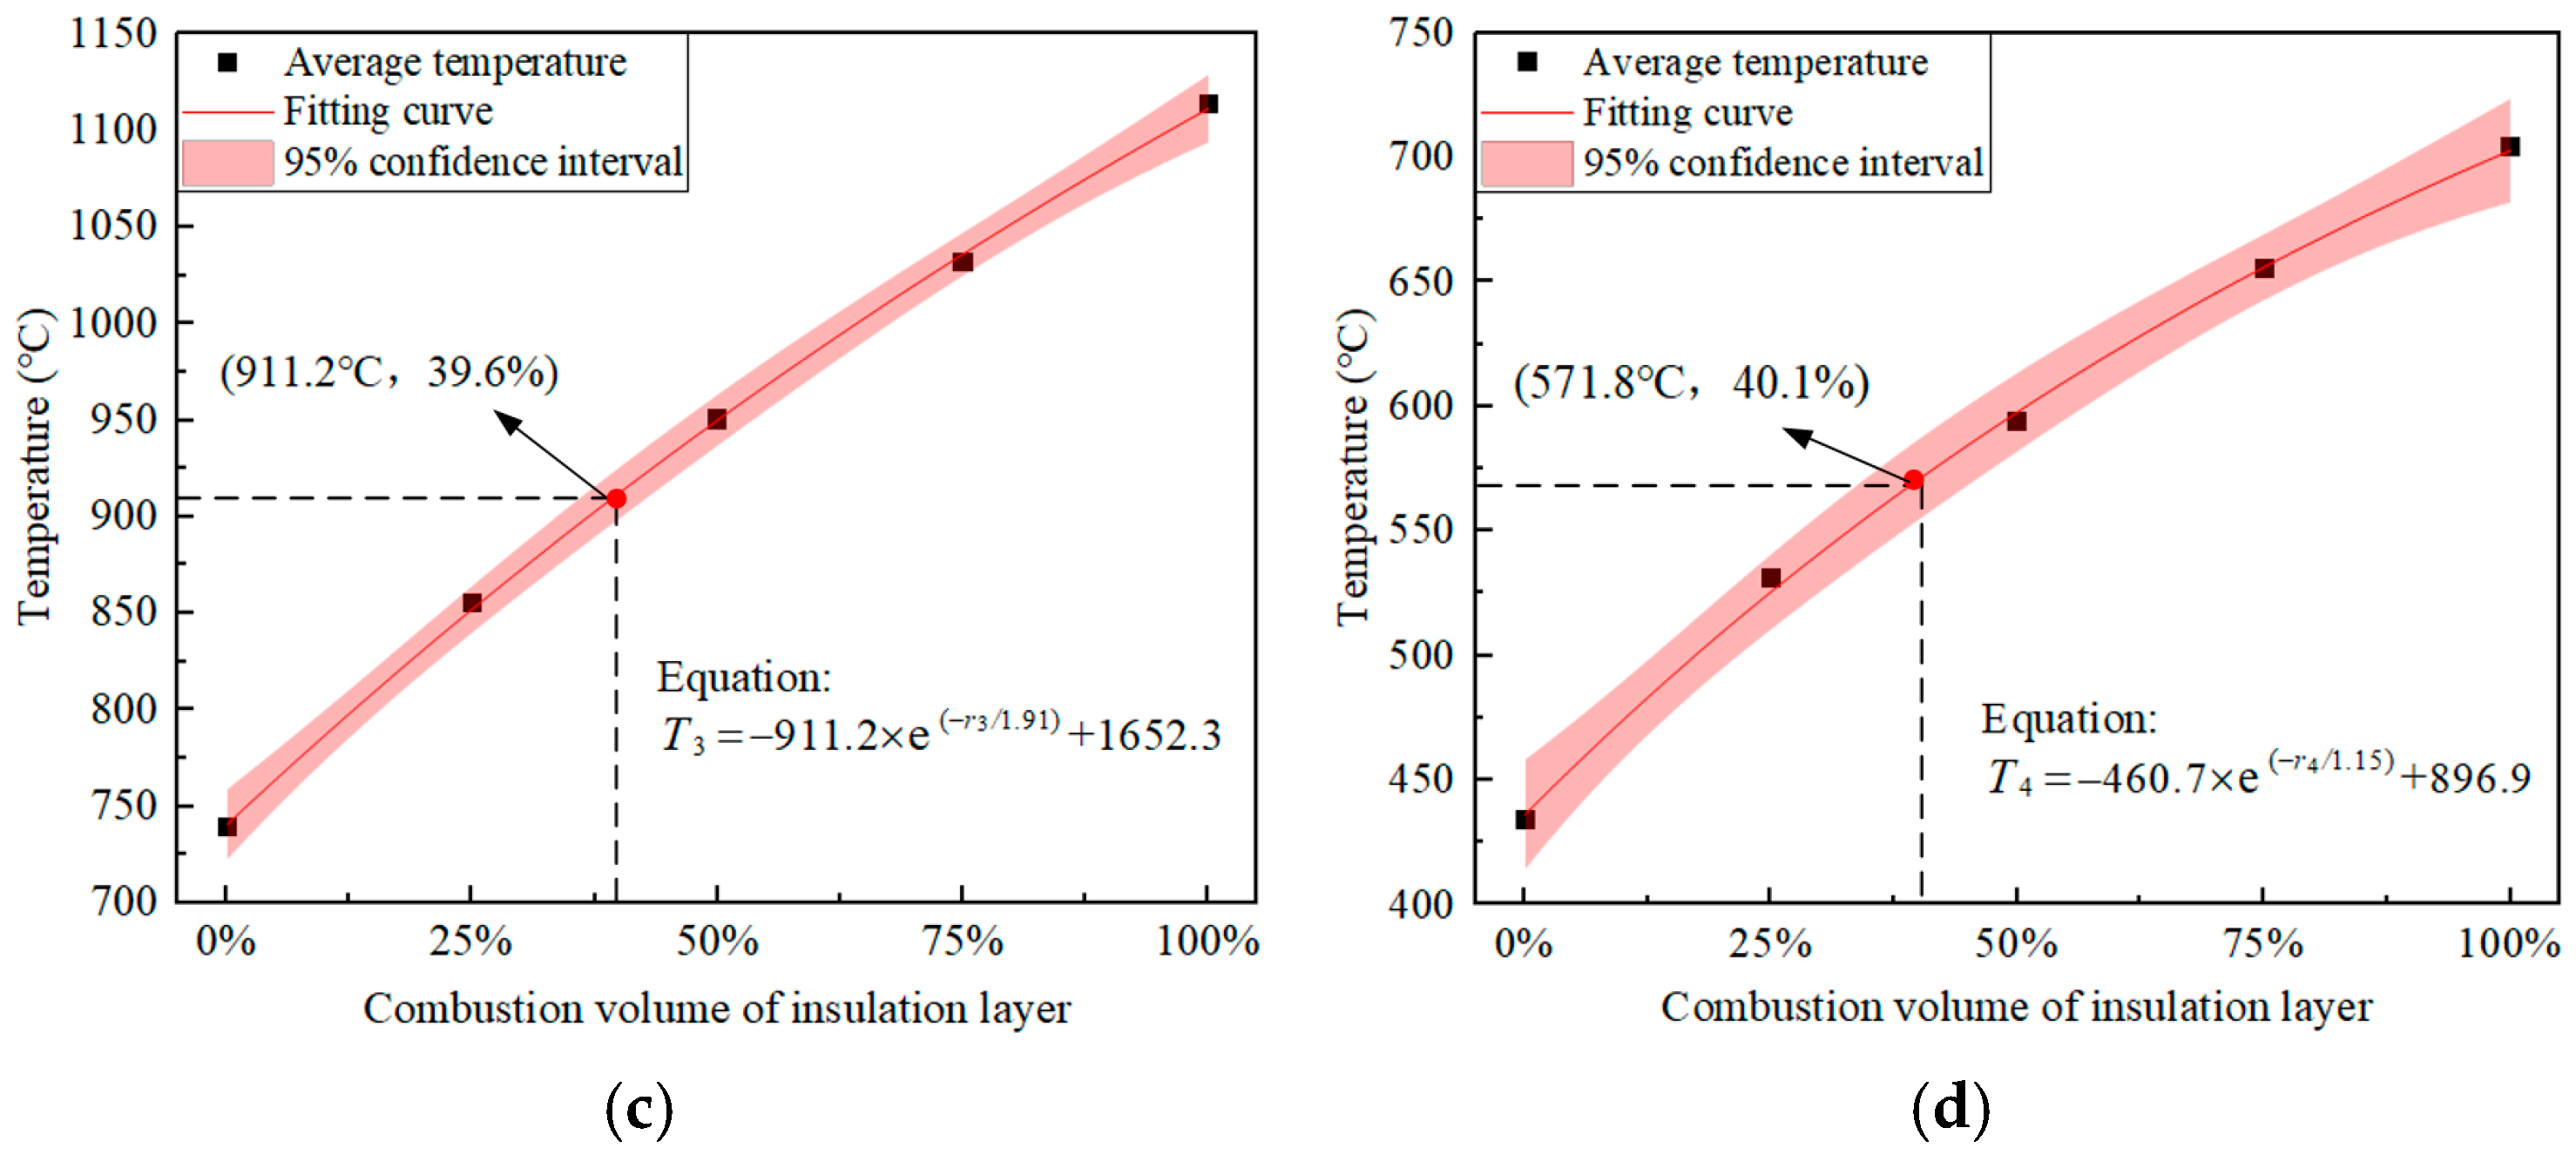
When multiple layers of cable materials including XLPE, SiR, and PU are burned together, it is difficult to directly determine the amount of the insulation layer that participates in combustion. Therefore, based on the simulation models of fuel molecular Formulas (1)–(5), the curve of the amount of insulation layer material that participated in combustion versus temperature was fitted using the average temperature of each temperature-measuring point during the stable combustion stage, as shown in Figure 6. By combining the average temperature of each temperature measurement point during the stable combustion stage obtained from the experiment, the amount of insulation layer closest to the experiment participating in combustion can be calculated.
Figure 6.
The curve of the amount of insulation layer material participating in combustion versus temperature at different temperature measurement points. (a) Thermocouple 1. (b) Thermocouple 2. (c) Thermocouple 3. (d) Thermocouple 4.
The simulation results show that the larger the amount of insulation layer participating in combustion, the more substances participate in the total combustion, and the higher the fire temperature after the simulation model stabilizes. However, as the amount of insulation layer participating in combustion increases, the temperature gradient at the temperature measurement point gradually decreases. Analysis indicates that the heat released during XLPE combustion is significantly higher than that of SiR and PU. When the XLPE content is low, the total heat release rate of the mixed combustion material will rapidly increase with the increase in its content. When the proportion of XLPE in the mixture is high, its contribution to total heat release gradually saturates, and the temperature gradient slows down. In addition, insufficient oxygen supply in the narrow tunnel leads to the generation of more CO and soot particles during mixed combustion, which also suppresses the rapid rise in ambient temperature.
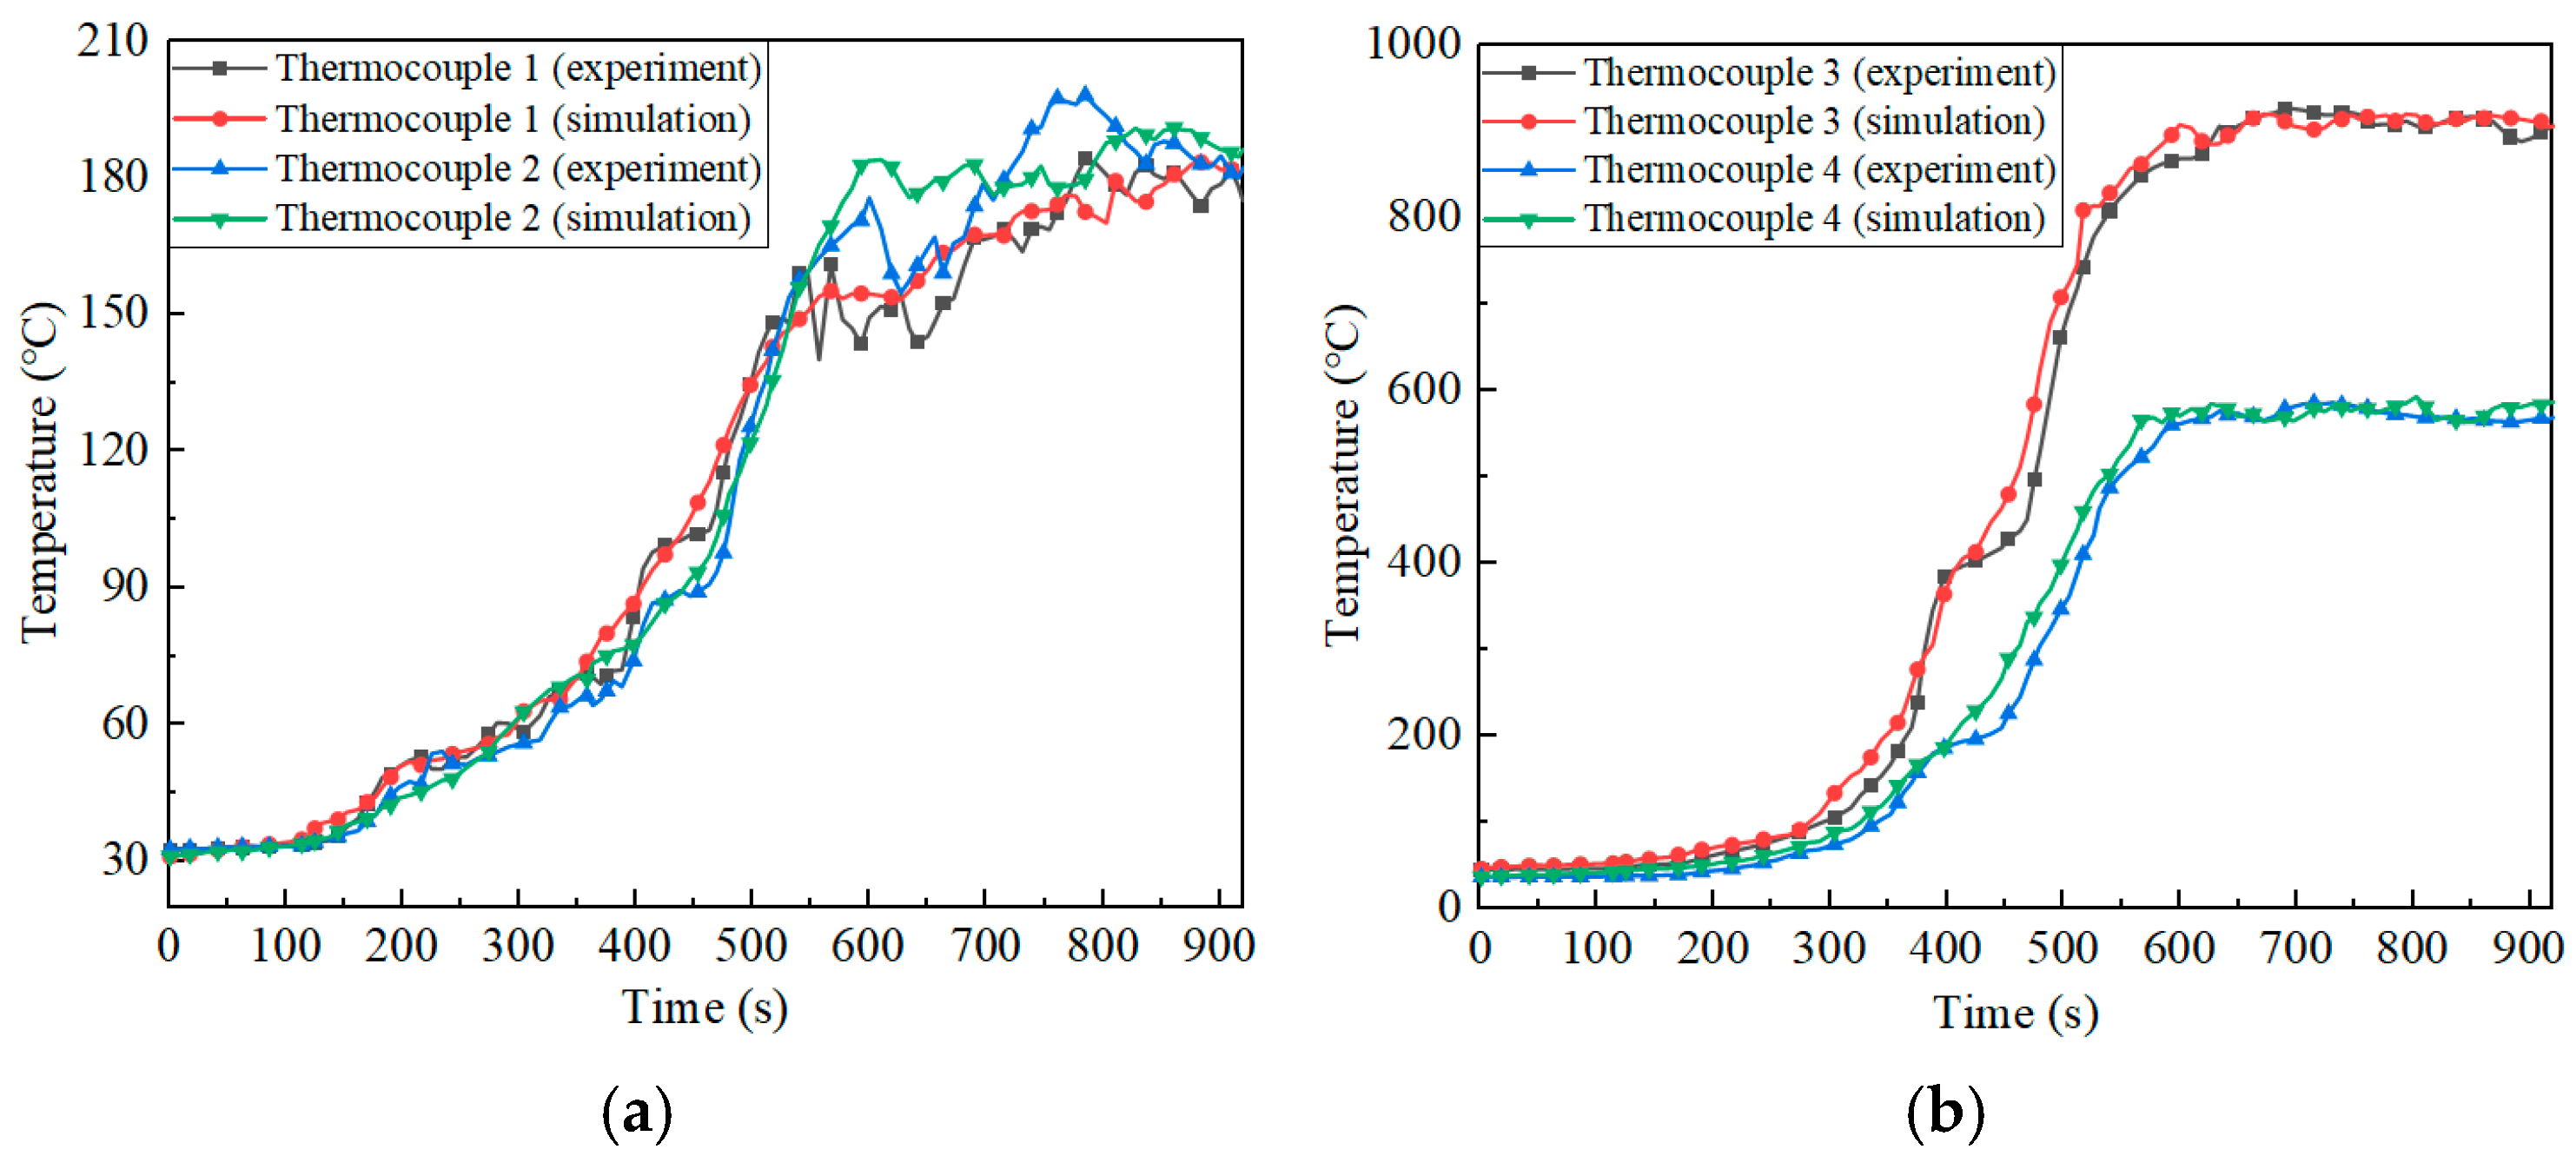
This study substituted the average temperatures of each temperature measurement point obtained from the experiment (T1 = 171 °C, T2 = 180 °C, T3 = 911 °C, T4 = 572 °C) into the fitted curve, and calculated r1 = 37.9%, r2 = 39.9%, r3 = 39.6%, r4 = 40.1%. Therefore, taking the average of each temperature measurement point, the amount of insulation layer that participated in combustion is r = 39.4%. At this time, the ratio of the amount of material in the sheath layer, filler layer, and insulation layer is X1:X2:X3 = 0.04:0.65:0.31, and the fuel molecular formula 6 is C2.28H5.70O1.42N0.08Si0.65. The equilibrium gas-phase reaction equation is shown in Equation (15). The simulation model under these parameters is established to obtain the temperature rise curves of each temperature measurement point as shown in Figure 7.
Figure 7.
Comparison of temperature measurement points between molecular formula 6 simulation combustion and combustion experiment. (a) Temperature measurement points on both sides of the fire source. (b) Temperature measurement points above the fire source.
The comparison between the temperature rise curve of the 39.4% insulation layer combustion model and the temperature rise curve of the combustion experiment is shown in Figure 8. The results show that when the fuel molecular formula is C2.28H5.70O1.42N0.08Si0.65, the relative temperature error between the simulation model and the combustion experiment throughout the entire process is 7.3%, and the relative error during the later stable combustion stage is 3.0%. This meets the requirement of equivalent combustion of cables. Therefore, C2.28H5.70O1.42N0.08Si0.65 is used as the equivalent model for the cable intermediate joint.
Figure 8.
Simulated combustion heat release rate curve of cable intermediate joint. (a) 400 kW and 90 s ignition. (b) 2 MW, 4.5 MW, 7 MW, and 0.7 s ignition.
3.4. Heat Release Rate Under Different Fire Conditions
This paper mainly studies the autonomous combustion characteristics of cables, therefore ignoring the heat release rate during the ignition process in the simulation model. Only the heat release rate curve after the joint is ignited is retained as the heat release rate of the cable joint.
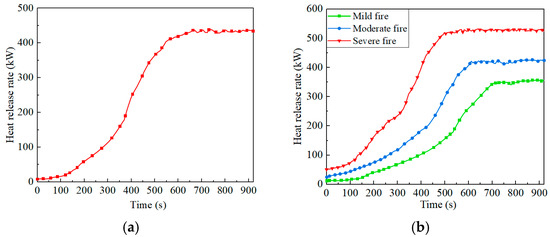
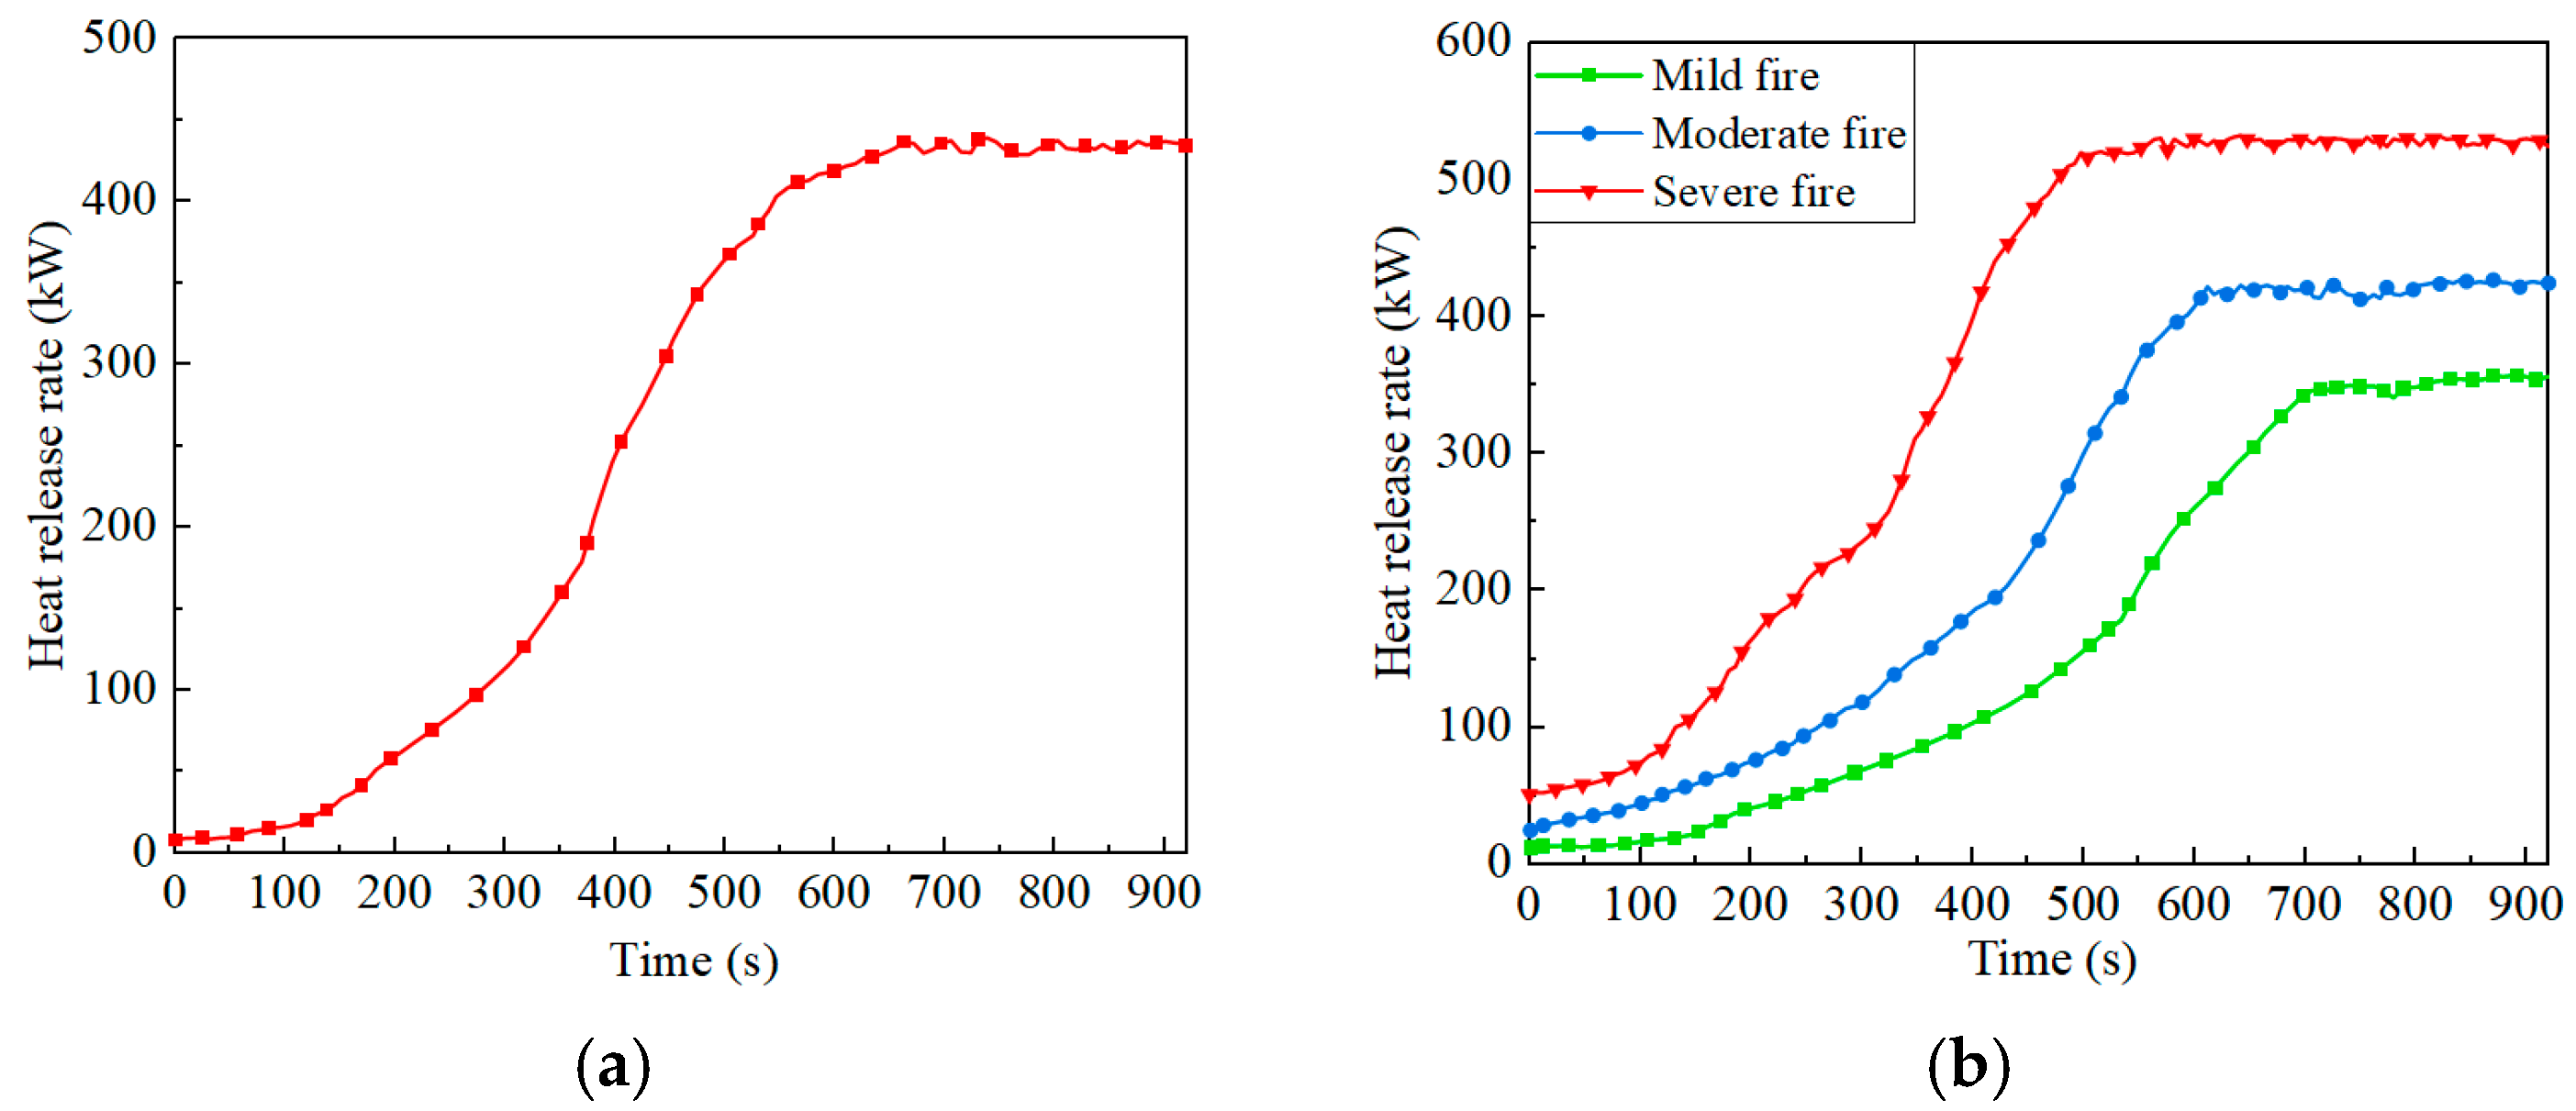
In the simulation model, a fire source with a power of 400 kW and a duration of 90 s was used to ignite the intermediate joint of a 110 kV cable. The heat release rate curve of the cable joint combustion is shown in Figure 8a. After stable combustion, its heat release rate remains at around 435 kW.
However, when the short-circuit arc power is different, there are also certain differences in the fire intensity of cable joint fires. The arc power of 110 kV cable joints is generally 2~7 MW, and the fault duration is generally 0.1~0.7 s. Therefore, changing the ignition power and duration of the ignition source in the simulation model can simulate the situation where arc energy acts on the cable and causes a fire. Similarly, based on the concept of equivalent effective energy deposition, an igniter was used to simulate the ignition effects of arcs with powers of 2 MW, 4.5 MW, and 7 MW, respectively, each lasting for 0.7 s. The obtained heat release rate curves are shown in Figure 8b. It can be seen that the heat release rates of mild, moderate, and severe fires in this type of cable joint will be maintained at around 350 kW, 420 kW, and 530 kW, respectively.
4. Cable Equivalent Combustion Simulation Fire Source Device
Based on the data of different cable heat release rates obtained from the above experiments and simulations, a fire source device that can equivalently simulate the dynamic evolution process of cable fires is designed, with a heat release rate consistent with that of cable fires.
4.1. Composition and Characteristics of Fire Source Device
When testing fire prevention products and optimizing fire protection measures for cable tunnels, existing industrial schemes usually adopt simplified fire sources following fire resistance test standards for building materials to simulate cable fires. According to current standard GB/T 9978.1 [38], the reference fire source generally adopts the slow fire model of standard t2 fire. Nevertheless, cable combustion presents a unique dynamically evolving process. Fire protection performance parameters obtained from conventional industrial test schemes may suffer insufficient engineering applicability for cable fire scenarios.
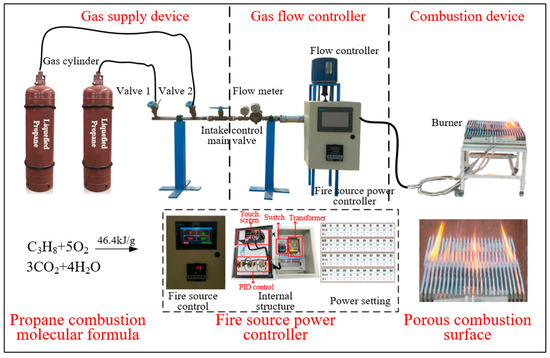
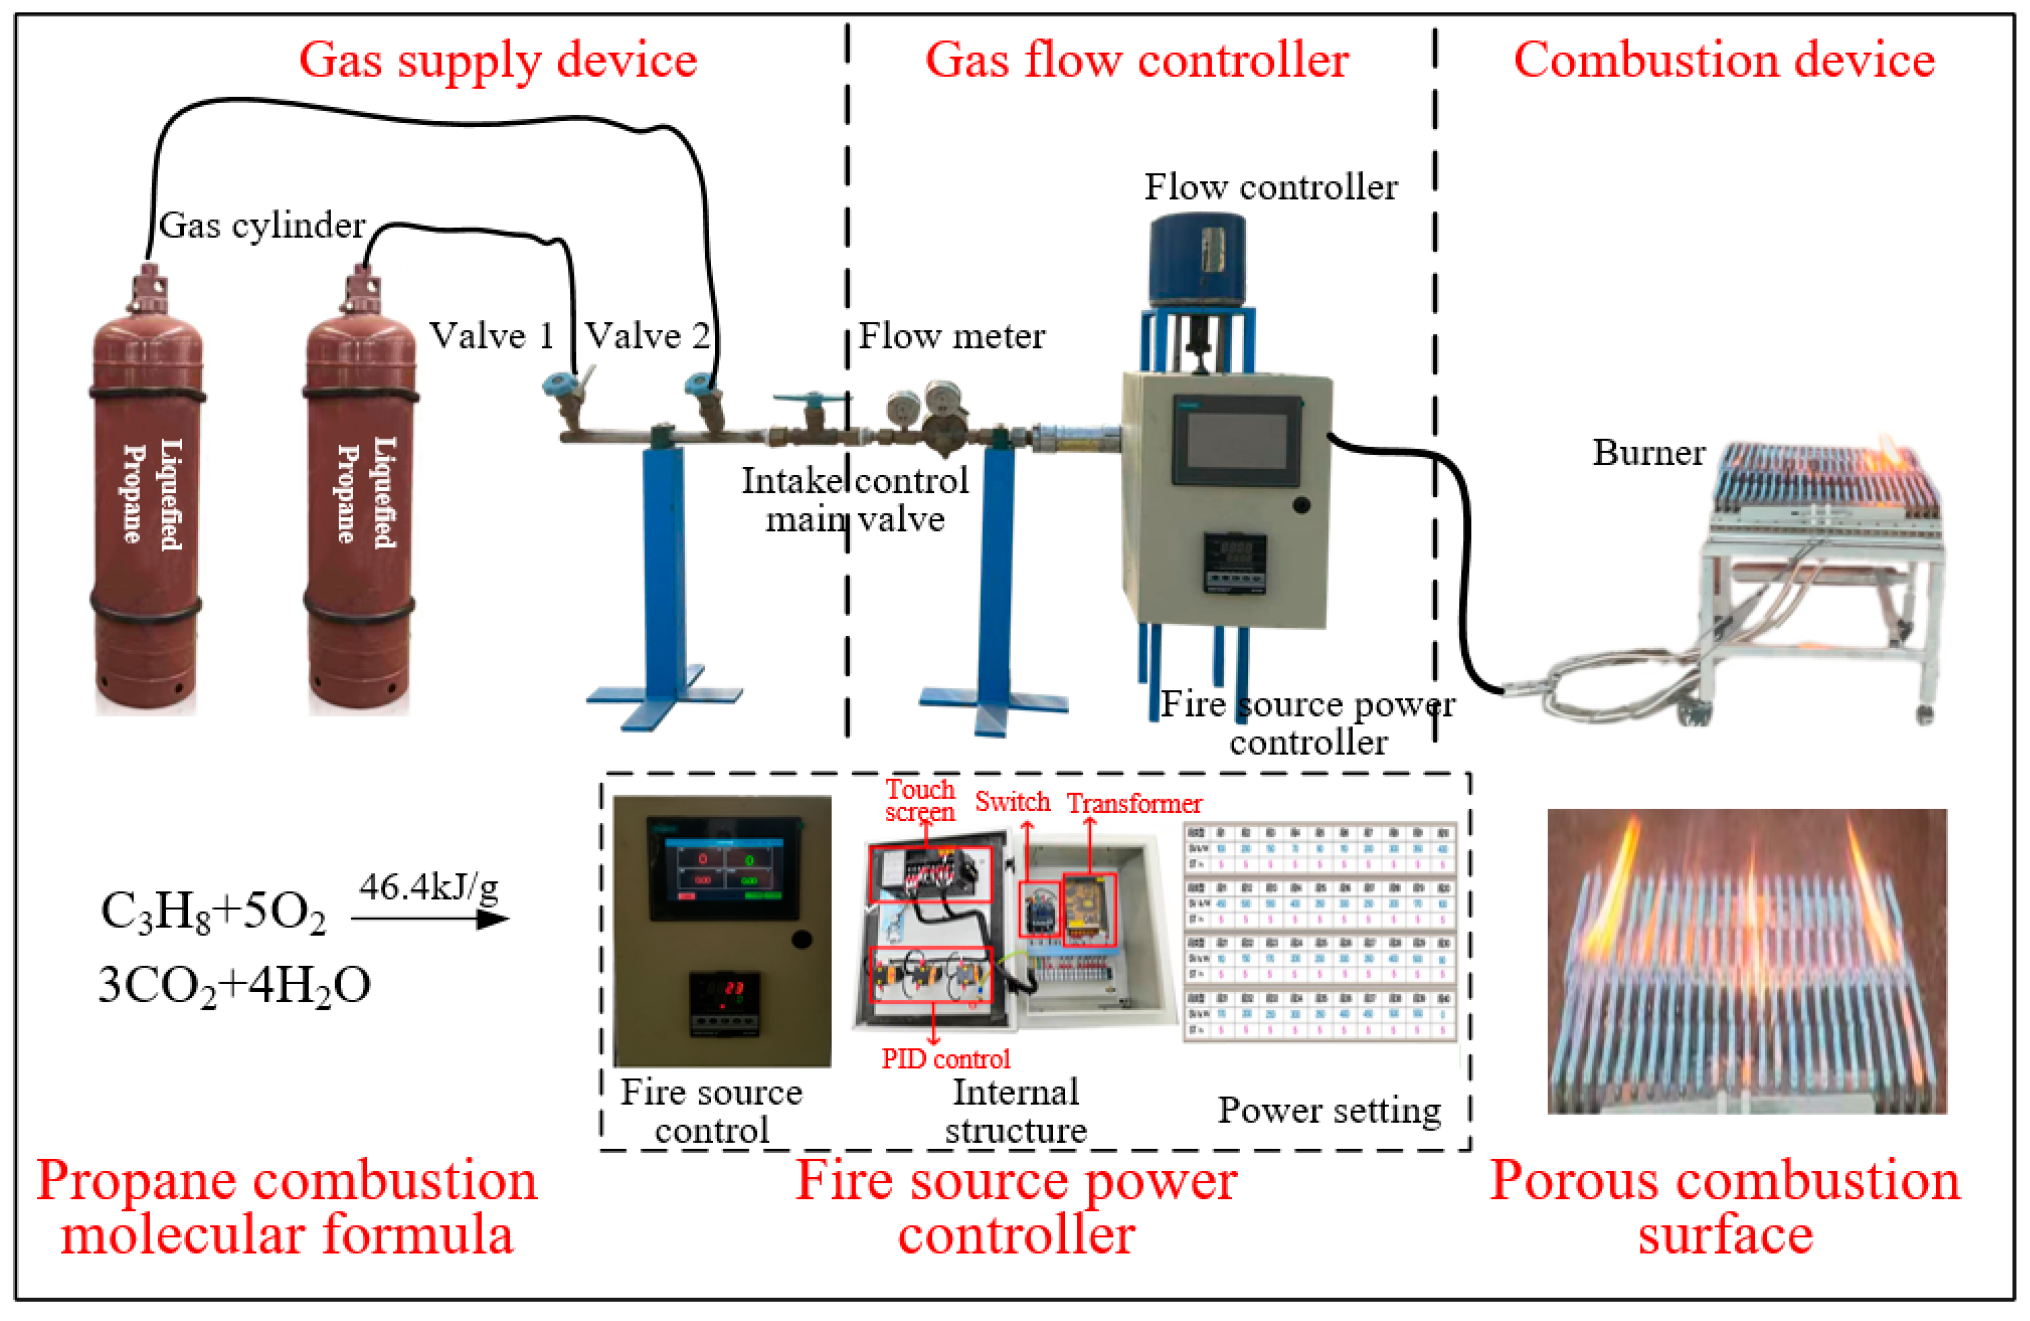
To simulate the dynamic evolution process of cable joint fires while ensuring the safety and controllability of the combustion process, an equivalent combustion source device for cable joints was designed as shown in Figure 9.
Figure 9.
Cable equivalent combustion simulation fire source device.
It consists of a gas supply device, an intake control valve, a fire source power controller, a gas flow controller, and a burner, which are used as follows:
- (1)
- The gas used in the gas supply device is propane, which has a high heat of combustion (46.4 kJ/g), high thermal efficiency, and environmental friendliness;
- (2)
- The intake control valve includes a single cylinder valve and a main valve, which can better ensure the safety of the experiment;
- (3)
- The gas flow controller is used in conjunction with the fire source power controller to change the propane gas flow entering the burner according to external control signals, in order to achieve controllable power of the fire source device;
- (4)
- The burner is designed with a porous, honeycomb-like surface, which allows gas to burn more fully and more closely to the actual fire situation. In addition, a longer sealed air duct is used to connect the burner and other equipment, ensuring that the fuel and precision devices are kept away from high-temperature sources of fire, in order to enhance the safety and reliability of the fire source simulation device.
Based on the heat release rate curve of simulated cable joint combustion and the combustion heat of propane fuel, the corresponding propane gas flow rate change in the fire source device can be calculated, and the calculation formula is given by Equation (16).
where mf is the mass flow rate of propane gas; is the heat release rate of cable combustion obtained from the simulation model; and is the combustion heat of propane, usually 46.4 kJ/g.
4.2. Equivalent Verification of Fire Source Device
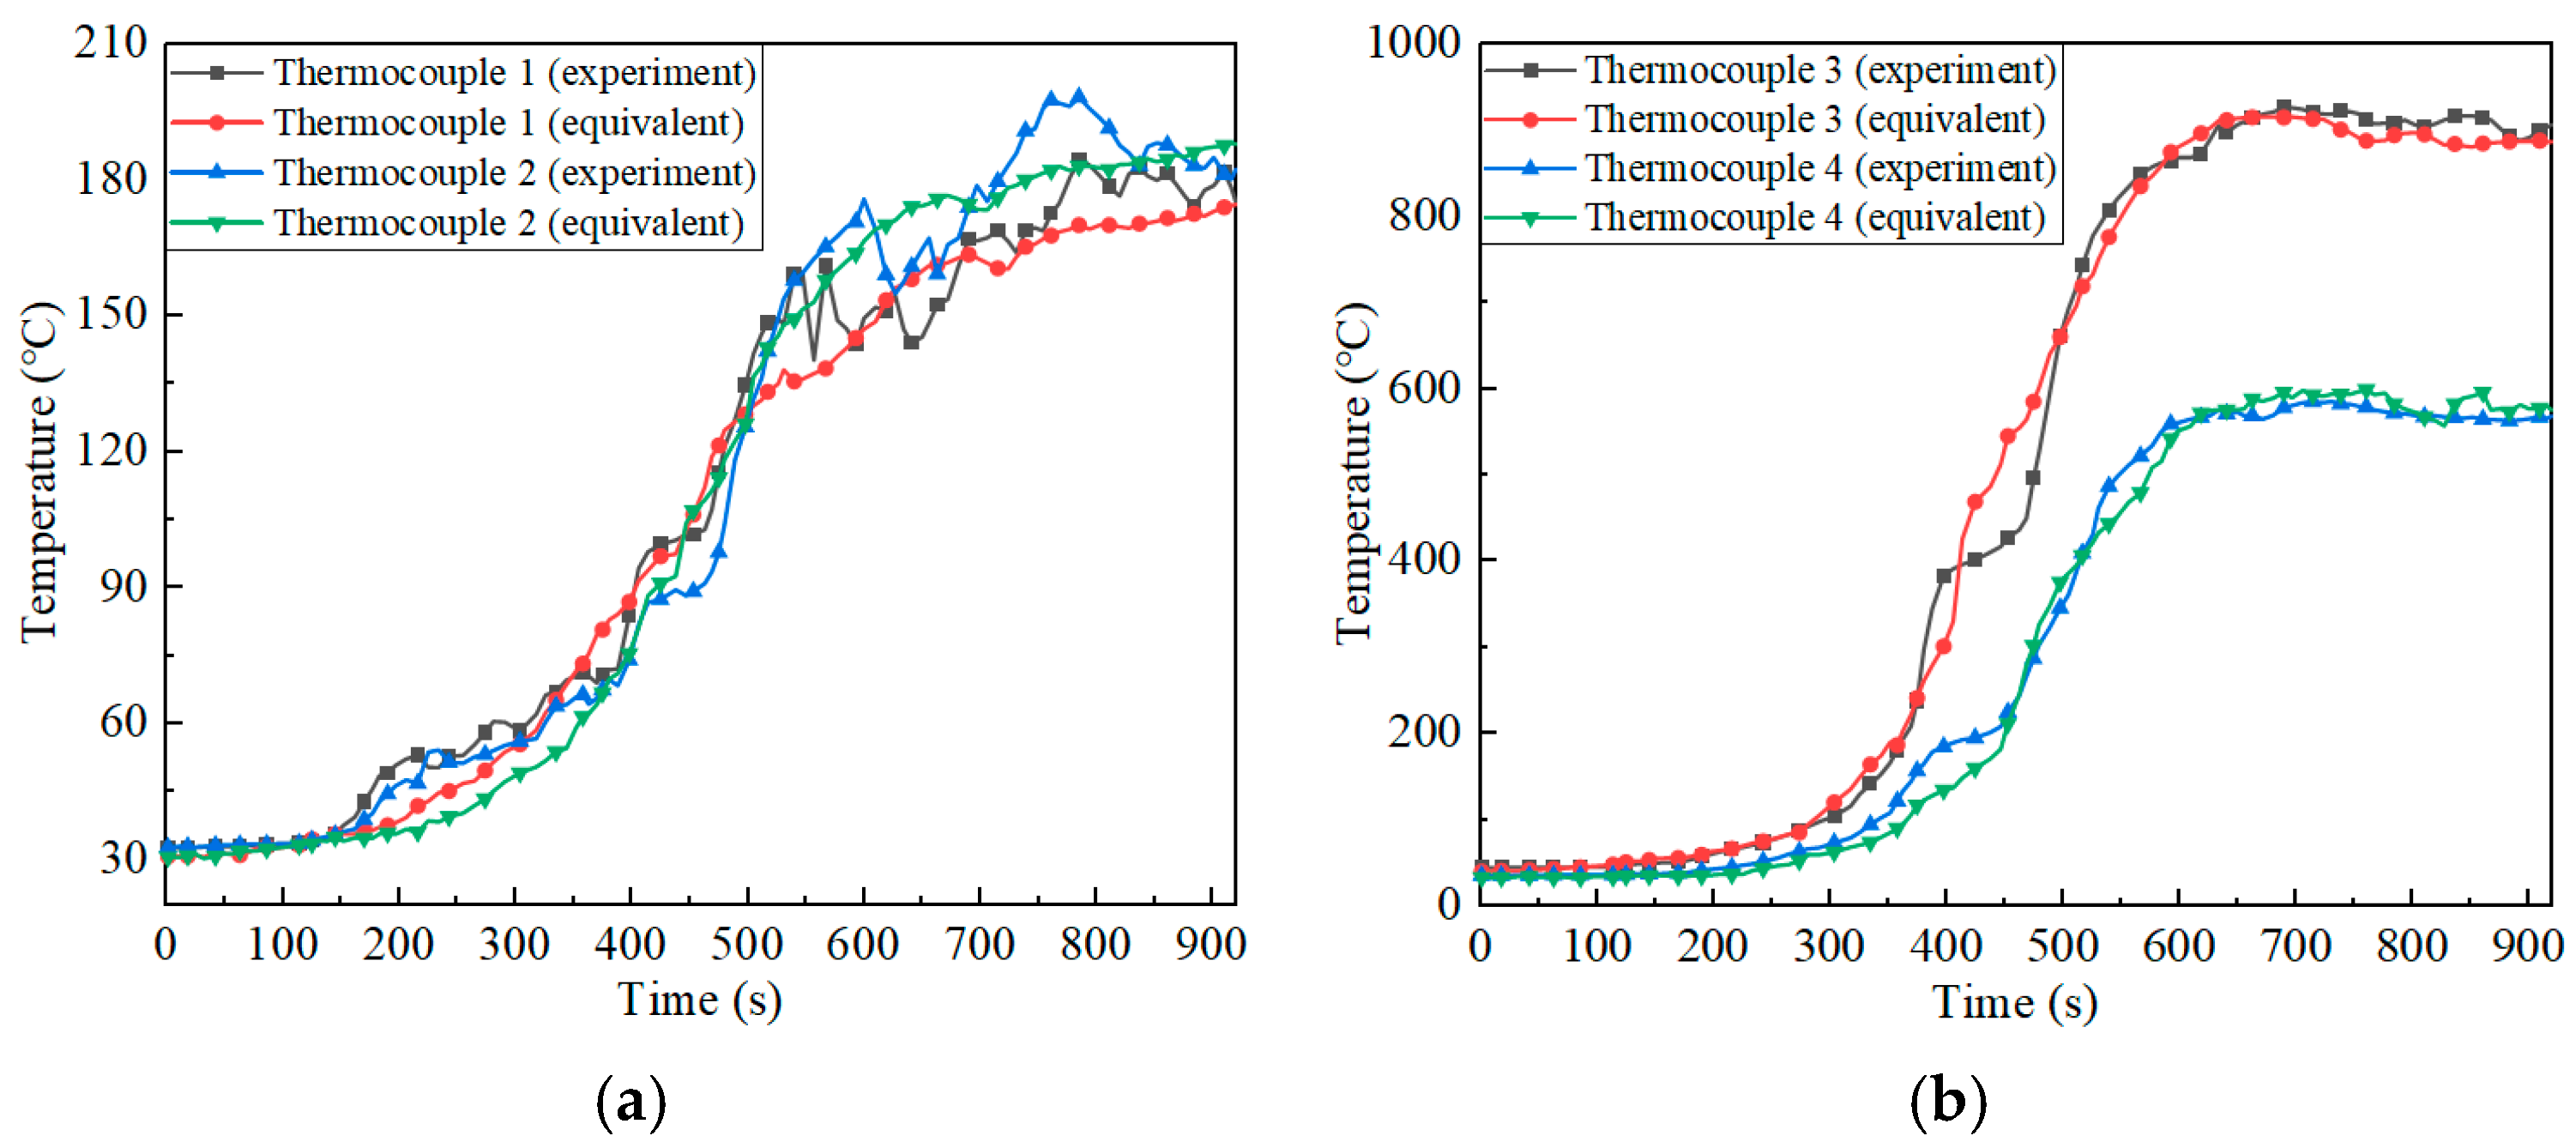
In the cable tunnel fire experiment platform, the cable joint was replaced with the burner of the fire source device, and the height of the burner surface was the same as that of the previous cable. Then, the time-intake flow curve of propane gas was set to simulate the combustion of the cable joint ignited by a 400 kW igniter. The temperature changes at each temperature-measuring point after the cable was ignited were compared between the equivalent combustion of the fire source device and the combustion experiment, as shown in Figure 10.
Figure 10.
Comparison of temperature measurement points between the equivalent combustion and the combustion experiment. (a) Temperature measurement points on both sides of the fire source. (b) Temperature measurement points above the fire source.
The results showed that during the initial spontaneous combustion stage of the cable in the first 300 s, the temperature changes in the equivalent combustion of the fire source device and the cable combustion experiment were basically consistent. During the significant temperature rise stage from 300 s to 600 s, the temperature rise curve of equivalent combustion was significantly smoother. In contrast, the combustion experiment may experience some fluctuations in temperature rise due to the transition from surface fuel to internal fuel. However, the overall temperature rise trend of the combustion test and equivalent combustion remained consistent. After 600 s, the fire gradually stabilized. During the entire combustion process, the relative error between the equivalent fire source and the temperature of the combustion experiment is 7.8%. In the stable combustion stage, the relative temperature error between equivalent combustion and the combustion experiment is 3.4%. After multiple experiments, the temperature error of equivalent combustion and the combustion experiment during the entire combustion process is less than 10%.
4.3. Application Scenarios and Comparative Analysis of the Equivalent Fire Source
The proposed equivalent fire source can be applied to multiple research scenarios concerning cable tunnel fire prevention. Typical applications include performance testing of fire-resistant materials and verification of fire protection schemes under controllable ignition boundaries. On the basis of the existing literature, typical fire sources adopted in fire experiments are compared in terms of operational characteristics and engineering applicability, as listed in Table 4.
Table 4.
Comparison of different test fire sources for cable fire experiments.
Standard t2 fire and constant-power gas burners are mature test facilities, but they cannot achieve a dynamic simulation of a cable fire. The heat release rate of pool fires cannot be actively controlled, and its combustion mechanism fails to reflect the pyrolysis characteristics of solid cable insulation. In contrast, the proposed equivalent fire source device in this paper can flexibly adjust the HRR curve according to the combustion status of cable joints, so as to equivalently reproduce the evolution characteristics of cable fires.
5. Conclusions
Based on the cable combustion experiments simulating electrical faults and cable combustion simulation analysis, this paper proposes a cable equivalent combustion simulation method that considers the dynamic evolution characteristics of fires in a cable tunnel environment, develops an equivalent fire source device, verifies its temperature rise characteristics, and draws the following conclusions:
- (1)
- This study is based on the concept of effective energy deposition equivalence, using an igniter to simulate the thermal effect of a faulty arc and ignite the cable. The experiment shows that the fire caused by cable combustion has nonlinear dynamic evolution characteristics. In the initial stage, the cable is only surrounded by a small amount of flames; as the fire develops, cable pyrolysis intensifies and releases a large amount of combustible gases, and the temperature curve of the combustion process shows an upward stable trend. Under ignition conditions with an igniter power of 400 kW and duration of 90 s, the temperature rise rate measured by thermocouple 3 is the most significant, reaching 3.27 °C/s. In the stable combustion stage, the maximum flame height reaches 0.63 m, and the highest temperature at the 0.4 m position directly above the cable joint reaches 926 °C.
- (2)
- Based on temperature data obtained from combustion experiments, the proportion of insulation layer participating in combustion in the simulation model is corrected. When 39.4% of the insulation layer material of the cable joint participates in combustion, corresponding to the fuel molecular formula C2.28H5.70O1.42N0.08Si0.65, the relative temperature errors of the simulated combustion and combustion test throughout the combustion process and combustion stability stage are 7.3% and 3.0%, respectively. The vertical flame height of the simulated combustion reaches 0.64 m, which is almost consistent with the combustion test. Based on this simulation model, the heat release rates of mild, moderate, and severe fires are maintained at around 350 kW, 420 kW, and 530 kW, respectively.
- (3)
- The equivalent combustion simulation fire source device for cable joints has the characteristics of controllable power, good equivalence, and environmental friendliness. The relative temperature errors during the entire combustion process and stable combustion stage of equivalent combustion and combustion tests are 7.8% and 3.4%, respectively, indicating good equivalence. Equivalent fire sources can effectively simulate the dynamic evolution characteristics of fires in cable tunnel environments.
Author Contributions
Writing—review and editing, Z.P.; writing—original draft, C.L.; data curation, W.G. and S.W.; conceptualization, Z.R.; methodology, Z.P. All authors have read and agreed to the published version of the manuscript.
Funding
This research was funded by the technology project managed by the headquarters of State Grid Corporation of China, “Early protection warning and flexible disposal technology for electrical fires in distribution cables” (520201250016-159-ZN). The authors appreciate the support deeply.
Institutional Review Board Statement
Not applicable.
Informed Consent Statement
Not applicable.
Data Availability Statement
The raw data are held by the author and may be made available upon request.
Acknowledgments
The authors would like to express sincere gratitude to all individuals who provided technical assistance during the experiments.
Conflicts of Interest
The authors declare no conflicts of interest.
References
- Liang, K.; Hao, X.F.; An, W.G.; Tang, Y.H.; Cong, Y.Z. Study on Cable Fire Spread and Smoke Temperature Distribution in T-shaped Utility Tunnel. Case Stud. Therm. Eng. 2019, 14, 100433. [Google Scholar] [CrossRef] [Scilit]
- Zhang, S.; Li, Y.; Lin, Q.W. Molten Dripping of Crosslinked Polyethylene Cable Insulation Under Electrical Overload. Fire 2025, 8, 387. [Google Scholar] [CrossRef] [Scilit]
- Yu, F.Y.; Wang, S.J.; Tang, K.X.; Lin, Y.F.; Wang, S.S.; Zhang, Y. Research Progress on the Fire Characteristics of Electric Cables and Wires. Fire 2024, 7, 186. [Google Scholar] [CrossRef] [Scilit]
- Prétrel, H.; Zavaleta, P.; Suard, S. Experimental Study on the Effect of Mechanical Ventilation on Cable Tray Fires in Compartments. Fire Saf. J. 2023, 138, 103792. [Google Scholar] [CrossRef] [Scilit]
- Huang, P.; Ye, S.L.; Qin, L.; Huang, Y.H.; Yang, J.; Yu, L.X.; Wu, D.J. Experimental Study on the Maximum Excess Ceiling Gas Temperature Generated by Horizontal Cable Tray Fires in Urban Utility Tunnels. Int. J. Therm. Sci. 2022, 172, 107341. [Google Scholar] [CrossRef] [Scilit]
- Wang, C.Z.; Guo, D.P.; Xu, B.Z.; Liu, C.; Miao, Z. Experimental and Numerical Simulation Study on Fire Spreading of Urban Cable Tunnels. J. Tsinghua Univ. (Sci. Technol.) 2025, 65, 532–546. [Google Scholar]
- Yu, W.; Tu, Y.; Yi, T.; Gao, F. Experimental Study on Combustion Characteristics and Heat Transfer of 220 kV High-voltage Cable Fire. Fire Sci. Technol. 2023, 42, 1187–1191. [Google Scholar]
- Zhang, J.; Xu, D.J.; Song, W.Q.; Tao, P.Y.; Xue, G. Experimental Study on Fire Characteristics of Cable Cabin in Utility Tunnel. Fire Sci. Technol. 2019, 38, 1532–1535. [Google Scholar]
- Chan, K.S.; Yong, K.J.; Sik, B.K. Experimental Study of Fire Characteristics of a Tray Flame Retardant Cable. J. Korean Soc. Saf. 2013, 28, 39–43. [Google Scholar] [CrossRef] [Scilit]
- Cao, B.T.; Liu, H.; Fan, R.; Ju, X.Y.; Yang, L.Z. Experimental and Theoretical Investigation of Longitudinal Temperature Attenuation and Smoke Movement in Urban Utility Tunnel Fires. Fire 2024, 7, 123. [Google Scholar] [CrossRef] [Scilit]
- An, W.G.; Wang, T.; Liang, K.; Zhu, G.Q. Numerical Simulation on Cable Fire in T-shaped Underground Pipe Gallery. Fire Sci. Technol. 2020, 39, 1120–1123. [Google Scholar]
- Niu, K.; Xu, D.J.; Zhang, J.; Gao, Y.S. Experimental and Numerical Simulation Study on Cable Fire in Comprehensive Pipe Gallery. Ind. Saf. Environ. Prot. 2024, 50, 1–5. [Google Scholar]
- Chen, C.K.; Xu, T.; Chen, J.; Zuo, B.Y. Combustion Characteristics of Trays Cable in Different Layouts. J. Cent. South Univ. (Sci. Technol.) 2022, 53, 4326–4334. [Google Scholar]
- Li, X.K.; Du, W.F.; Xu, Z.S. Efficiency of Fire-retardant Cable Coating in Cable Tunnel Fire Test. J. Nanjing Tech Univ. (Nat. Sci. Ed.) 2011, 33, 38–41. [Google Scholar]
- Babu, A.P.; Hemanandh, J.; Devarajan, Y.; Mishra, R.; Abraham, B.C. Experimental Testing and Evaluation of Coating on Cables in Container Fire Test Facility. Nucl. Eng. Technol. 2022, 54, 1652–1656. [Google Scholar] [CrossRef] [Scilit]
- Pu, Z.H.; He, J.; Guo, W.; Zhou, S.Y. Heat Insulation Effect Analysis and Side Panel Height Design of L-shaped Fire Baffle Height Design of L-shaped Fire Baffle. Fire Sci. Technol. 2022, 41, 615–620. [Google Scholar]
- Wang, C.; Huang, Y.S.; Jiang, Y.Q.; Xie, D.; Zhu, Z.W. Research on the Influence of Fire Partition Layout on Cable Tunnel Fires. Saf. Environ. Eng. 2023, 30, 55–63. [Google Scholar]
- Hou, S.; Fu, M.L.; Li, X.L.; Zhu, W.B.; Zhang, B.; Xu, S. Comparative Study on Performances of 220kV XLPE Cable Insulation Materials. Proc. CSEE 2023, 43, 2483–2495. [Google Scholar]
- He, D.J.; Liu, B.H.; Wang, Z.W.; Shu, Y.; Liu, M.H. Study on Fault Optimization of Intermediate Joint of Power Cable. J. Phys. Conf. Ser. 2022, 2260, 012025. [Google Scholar] [CrossRef] [Scilit]
- Liu, J.L.; Zhong, Y.Y.; Shan, Y.; Xie, Q.; Li, Y. Research on Arc Ignition Characteristics of Cables’ Insulation Under Different Temperatures Considering Thickness. IET Sci. Meas. Technol. 2025, 19, e70005. [Google Scholar] [CrossRef] [Scilit]
- Yang, X.; Sun, H.T.; Liu, Z.; Zhong, M.L.; Qiu, W.; Cui, J.J. Test and Calculation of Short-circuit Arc Explosion Wave Energy of 220 kV High Voltage Cable Joint. High Volt. Appar. 2021, 57, 44–49. [Google Scholar]
- Yang, X.; Liu, Z.; Liang, Z.; Qiu, W.; Cui, J.J.; Zhong, Q.D. Simulation Calculation of Thermal Stress Distribution of Composite Interface in Operation of High Voltage Cable Joint Under Electro-thermal Coupling. Electr. Mach. Control 2020, 24, 100–108. [Google Scholar]
- Huang, C.L.; Zhao, Y.F.; Hu, R.; Liu, G.; Tang, W.H. Moisture-induced Discharge Evolution Analysis of XLPE-SiR Insulation Interface in 10 kV Cable Joints. Guangdong Electr. Power 2024, 37, 120–128. [Google Scholar]
- Kizilcay, M.; Koch, K.H. Numerical Fault Arc Simulation based on Power Arc Tests. Eur. Trans. Electr. Power 1994, 4, 177–185. [Google Scholar] [CrossRef] [Scilit]
- Li, C.Y.; Chen, J.; Zhang, W.; Hu, L.B.; Cao, J.Y.; Liu, J.J. Influence of Arc Size on the Ignition and Flame Propagation of Cable Fire. Energies 2021, 14, 5675. [Google Scholar] [CrossRef] [Scilit]
- Dmitriev, V.A.; Poluyanov, V.N.; Poluyanova, I.N. Experimental Evaluation of the High-Current Drawn Arc Energy Balance. In Proceedings of the 2006 International Symposium on Discharges and Electrical Insulation in Vacuum; IEEE: New York, NY, USA, 2006; Volume 1, pp. 419–422. [Google Scholar]
- Ge, F.L.; Qiu, T.T.; Zhang, M.S.; Ji, J. Experimental Research on the Thermal Characteristic of Low-voltage Alternating Current (AC) Arc Faults. Fire Saf. J. 2023, 136, 103732. [Google Scholar] [CrossRef] [Scilit]
- GB 50838-2015; Technical Code for Urban Utility Tunnel Engineering. China Planning Press: Beijing, China, 2015.
- DL/T 5484-2013; Code for Design of Power Cable Tunnel. China Planning Press: Beijing, China, 2013.
- Guo, W.; Cai, J.; Ji, H.Q.; Li, H.C.; Ren, Z.G. Arc Ignition Methods and Combustion Characteristics of Small-Current Arc Faults in High-Voltage Cables. Fire 2024, 7, 352. [Google Scholar] [CrossRef] [Scilit]
- Jeremy, S.; Hugues, P.; Sylvain, S. Experimental Study of a Travelling Fire Along a Cable Tray Assembly in a Mechanically Ventilated Enclosure. Fire Saf. J. 2023, 141, 104016. [Google Scholar] [CrossRef] [Scilit]
- Zhang, J.Q.; Chen, Q.T.; Ke, Y.G.; Zhao, H.Y.; Shang, F.J.; Jia, J. Research and Mechanism Analysis of Electrically Induced Combustion Test Caused by Insulation Faults of Cable for Full-size High-voltage Switchgear Cabinet. High Volt. Appar. 2024, 60, 42–49. [Google Scholar]
- Liu, F.; Zhang, J.Q.; Gu, M.F.; Liu, Y.S.; Sun, T. Simulation of Damage Caused by Oil Fire in Cable Passage to Tunnel Cable. Fire 2024, 7, 147. [Google Scholar] [CrossRef] [Scilit]
- Wang, X.; Yao, Z.L.; Wang, Y.R.; Kong, X.Z.; Lv, Z.X. Modelling the Smoke Flow Characteristics of a Comprehensive Pipe Gallery Fire with Rectangular Section. Buildings 2024, 14, 1937. [Google Scholar] [CrossRef] [Scilit]
- Liu, K.; Xie, Q.Y. Study on Inner and Outer Temperature Distribution of High-voltage Power Cable being Overloaded. China Saf. Sci. J. 2018, 28, 92–97. [Google Scholar]
- Pu, Z.H.; Zhao, W.; Xiong, Y.Y.; Shi, X.T.; Fang, C.H. Research on Cable Combustion Simulation Based on Complex Pyrolysis and Chemical Reaction Modification. J. China Three Gorges Univ. (Nat. Sci.) 2021, 43, 88–95. [Google Scholar]
- Walter, K. Validation of the Extended COCOSYS Cable Fire Model based on a Generic FLASH-CAT Approach. Fire Saf. J. 2024, 142, 104042. [Google Scholar] [CrossRef] [Scilit]
- GB/T 9978.1-2008; Fire-Resistance Test-Elements of Building Construction-Part 1: General Requirements. Standards Press of China: Beijing, China, 2008.

Disclaimer/Publisher’s Note: The statements, opinions and data contained in all publications are solely those of the individual author(s) and contributor(s) and not of MDPI and/or the editor(s). MDPI and/or the editor(s) disclaim responsibility for any injury to people or property resulting from any ideas, methods, instructions or products referred to in the content. |
© 2026 by the authors. Licensee MDPI, Basel, Switzerland. This article is an open access article distributed under the terms and conditions of the Creative Commons Attribution (CC BY) license.