


Abstract
Mapping wildfire patterns in Wildland–Urban Interface (WUI) areas is a fundamental tool for fire management and prevention, particularly in regions where urban expansion occurs in close proximity to natural vegetation. This mapping approach makes it possible to identify critical zones and to support more effective interventions adapted to the specific conditions of each territory. This work analyzed wildfires in the state of Tocantins, Brazil, using detailed geospatial data and advanced analysis techniques and statistics to characterize the dynamics of burned areas. Data used for the project were retrieved from MapBiomas and the Geoprocessing Laboratory of the Public Ministry of Tocantins (LABGEO), applying logistic regression models to explore the relationship between the distance of WUIs and the frequency of wildfires. The methodology covered the spatial distribution of fires and the different dynamics observed by type and size of burned area, allowing for a more detailed analysis. The results indicated significant variations in the proportion of burned areas inside and outside the WUIs, suggesting that proximity to these interfaces plays a critical role in the occurrence pattern of fires. Notably, Palmas, the state capital, stood out as one of the municipalities with the highest concentration of impacts in WUI areas, highlighting the relevance of these zones in environmental risk management. The study emphasizes the importance of adopting regional approaches that consider local specificities in the management and prevention of wildfires. The integration of geospatial data with robust statistical methodologies can guide more effective management strategies, assisting in the planning of public policies adapted to the socio-environmental dynamics of Tocantins.
1. Introduction
The expansion of cities into areas previously dominated by natural vegetation has created transition zones known as Urban–Forest Interface, or Wildland–Urban Interface (WUI). These areas represent the meeting point between human infrastructure and natural ecosystems, characterized as regions of high interaction between the built environment and vegetation. This interaction intensifies the risks associated with wildfires, including habitat fragmentation, ecological conflicts and biodiversity loss, while also posing significant threats to human life and property [1,2]. The increasing urbanization and the consequent territorial expansion have transformed WUIs into a subject of scientific investigation, due to their relevance for environmental management and urban planning.
WUIs are recognized as critical zones for fire occurrence because they combine natural and anthropogenic factors that favor both fire ignition and fire spread. Ref. [3] describes the interface as areas where wildfires are more likely to reach homes, increasing the risks of human and material losses. Ref. [4] highlights that the complex spatial configurations of WUIs represent significant challenges for land management, especially in regions where the natural vegetation blends with urbanized areas. These configurations require integrated strategies that consider both preservation of the environment and urban safety. Ref. [5] argues that the WUI constitutes a nexus of conflicts between human activities and the environment, often associated with catastrophic fires that result in habitat fragmentation, proliferation of invasive species, and a decline in biodiversity.
Given its relevance, the characterization and mapping of WUIs have been the focus of various international studies. For example, ref. [6] used remote sensing tools combined with advanced statistical analyses to correlate proximity to the interface with wildfire probability in European regions. In Canada, ref. [7] applied deterministic models adapted to local characteristics to map areas susceptible to fire, highlighting the importance of regional strategies to mitigate risks. In Portugal, ref. [8] used detailed geospatial criteria to map the WUI, considering both direct and indirect interfaces with flammable vegetation. These studies demonstrate that precise delineation of interfaces is essential for the planning and implementation of effective fire prevention and combat strategies, highlighting the need for methodologies adapted to regional contexts.
In Brazil, the state of Tocantins has unique characteristics that make it especially relevant for studies on wildfires in WUIs. Located in the Cerrado biome, one of the biodiversity hotspots of the world, this state combines tropical savanna characteristics with a strong human presence, being historically marked by the use of fire in agricultural practices. These activities, although traditional, often result in uncontrolled fires that spread to natural areas, exacerbating the environmental and social impacts associated with this phenomenon [9]. Data from the National Institute for Space Research [10] reveal annual fluctuations in heat spots in Tocantins, with significant peaks in years such as 2010 and 2020, attributed to extreme weather conditions, such as prolonged droughts, and to inadequate fire management.
The analysis by [11] pointed out that the Cerrado concentrates most of the heat spots in Tocantins, with indigenous areas and agrarian reform settlements standing out as critical regions due to the intensive use of fire for agricultural activities. On the other hand, urban areas show a lower incidence of fires, reflecting the greater availability of infrastructure for firefighting and the lower amount of combustible material. These regional patterns highlight the importance of strategies adapted to local dynamics and the specific socioeconomic characteristics of the state.
Innovative practices, such as Integrated Fire Management (IFM), have been implemented in the state, particularly in the Serra Geral Ecological Station in Tocantins. This approach promotes the controlled use of fire through prescribed burns, reducing the intensity of large fires and involving local communities in environmental management [12]. The integration of technical knowledge with traditional knowledge has shown positive results, highlighting the central role of community participation in the formulation and execution of public policies.
In this context, the present study seeks to characterize and map regional wildfire patterns in the state of Tocantins, focusing on the Wildland–Urban Interface (WUI). Using geospatial data and statistical analyses, the study aims to identify the relationship between proximity to the WUI and the occurrence of fires across different size classes. Based on this analysis, the study is expected to contribute to the planning of more effective regional management and mitigation strategies, supporting the protection of ecosystems, property, and human life, as well as the formulation of more inclusive public policies adapted to regional needs.
2. Materials and Methods
The data used in this study, referring to the state of Tocantins, were obtained from the most recent report from the Directorate of Territorial and Socioeconomic Information Management (DIGIT), of the Secretariat of Planning and Budget (SEPLAN) of Tocantins, published in 2021 [13]. This information was supplemented by updated data from the 2022 census from the Brazilian Institute of Geography and Statistics [14], ensuring greater accuracy and reliability in the territorial and population analyses conducted.
For the production of maps and statistics related to the study areas, two main datasets were used: information from the MapBiomas project and geospatial data developed by the Geoprocessing Laboratory (LABGEO), linked to the Operational Support Center for Housing, Urbanism, and Environment (CAOMA) of the Public Ministry of the State of Tocantins (MP-TO). These databases provided detailed information on land use and cover, as well as records of burn scars, essential for characterizing the dynamics of forest fires in the region.
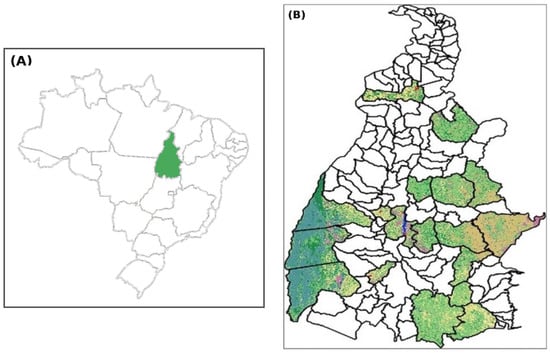
The analysis was conducted at the state level, covering two main criteria for municipality selection. The first included the five most populous municipalities in the state: Palmas, Araguaína, Gurupi, Paraíso do Tocantins, and Porto Nacional. The second considered 10% of the municipalities of Tocantins, selected based on the largest area burned between 2020 and 2023: Lagoa da Confusão, Formoso do Araguaia, Paranã, Pium, Goiatins, Lizarda, Mateiros, Rio Sono, Arraias, Tocantínia, Ponte Alta do Tocantins, Almas, Conceição do Tocantins, and Monte do Carmo [15]. In total, these 19 municipalities represent approximately 51.94% of the state population and 35.79% of the territorial area of Tocantins (Figure 1).
Figure 1.
Location of the 19 selected municipalities in the state of Tocantins, Brazil.
2.1. Fuel Area and Artificial Area
Among the classes selected in the MapBiomas project to identify the fuel areas were three major groups: (1) Forest, with subdivisions such as Formation Forestry, Savanna Formation, Mangrove, and Flooded Forest; (2) Non-Natural Formation Forestry, encompassing Wetland and Marsh Area, Grassland Formation, Apicum and Rocky Outcrop; and (3) Agriculture, covering Pasture, Agriculture (Temporary Crops and Perennial Crops), Forestry, and Land Use Mosaics. To represent the areas urbanized, the classes Urbanized Area, Mining, and Other Non-Vegetated Areas were used, the latter being part of the general category of non-vegetated areas. The relationship between these classes and the corresponding total area can be consulted in Table 1.
Table 1.
MapBiomas land use and land cover classes selected to define artificial and combustible areas.
Some elements, such as areas classified as “non-vegetated” (e.g., beaches, dunes and bodies of water), were excluded from both the categories of artificial areas and fuel areas due to their reduced or non-existent capacity for fire spread; it is for this reason that the total area in percentage in Table 1 does not reach 100%. The class “Other Non-Vegetated Areas” was included in the category of fuel areas, as it contains regions of sparse Cerrado, which have relevant burning potential, although they may, in part, have characteristics associated with urban expansion.
To avoid inconsistencies and overlaps between vegetation data and artificial areas, it was decided not to manually expand urban zones into areas that could be included in urban mapping. This decision was made to ensure greater compatibility with the original databases, in accordance with previously validated methodological procedures. Areas of lesser relevance, excluded from mapping, were considered marginal due to their insignificant representativeness in relation to the total extent analyzed.
These classes were grouped into two main categories: fuel areas and urban areas. For the creation of the buffers, the polygons of the classes designated as urban areas were initially extracted, followed by the polygons representing the fuel areas. This approach allowed for systematic grouping, facilitating the analysis and enabling the generation of maps that represent, with greater accuracy, the local dynamics of interaction between urban areas and vegetation.
2.2. Definition of Burn Scars
The mapping of burn scars was carried out through an approach that combines automatic classification and visual interpretation of image mosaics from the Sentinel-2 satellite, whose spatial resolution varies between 10 and 20 m. The methodology used by the Geoprocessing Laboratory of the Public Ministry of Tocantins (LABGEO) was developed with the support of the Google Earth Engine platform, which operates with cloud computing and uses machine learning algorithms to identify and delineate burned areas. The training of these algorithms was carried out with an extensive dataset on burns, allowing the identification of patterns and trends that assist in the preparation of scar maps.
The imagery processed by LABGEO was derived from Sentinel-2 MSI Level-2A products provided by the European Copernicus Sentinel-2 mission, operated under the European Space Agency (ESA) and Copernicus Programme. LABGEO was not responsible for operating the satellite system; instead, its role consisted of processing, validating, and analysing the satellite-derived data for the State of Tocantins. Sentinel-2 MSI: Multispectral Instrument, Level 2A, products provide systematic coverage of the study area, with a revisit frequency of approximately five days, enabling continuous environmental monitoring. After initial processing, the platform creates a mosaic of the images of the state, in which the spectral indices NBR (Normalized Burn Ratio) are calculated before and after burning events, using the spectral bands RED, NIR, SWIR1, and SWIR2. Then, the difference between the indices is calculated (NBR post-burn and NBR pre-burn), and the Random Forest classifier (ee.Classifier.smileRandomForest) is applied to categorize the areas in the mosaic. The classifier training was conducted with representative sample points of burned and unburned areas, collected in various regions of the state. After this process, the generated scars were exported to a Geographic Information System [16], where they underwent adjustments and validation by the technical team [15].
For this study, the use of MP-TO data was chosen due to its specific focus in the territory of Tocantins, providing greater accuracy in validation and a reduction in errors frequently observed in the sampling validation technique on a national scale, such as that adopted by the MapBiomas project [17]. Considering that the study area of Urban–Forest Interfaces has relatively small dimensions, manual visual review allowed for a more refined adjustment of the shapes and distributions of scars, being one of the decisive criteria for the choice of this database.
The period from 2020 to 2023 was selected based on methodological criteria related to the consistency and comparability of the spatial database used to define burn scars in the state of Tocantins. Given the objective of identifying regional wildfire patterns and relating them to the Wildland–Urban Interface (WUI), the analysis required a recent, continuous, and homogeneous time series capable of supporting comparative interpretation across the studied municipalities. The adoption of this interval made it possible to work with standardized spatial information, ensuring compatibility between the annual layers and allowing both year-by-year analysis and cumulative assessment of burn-scar occurrence over the study period. In addition, the use of four consecutive years was considered sufficient to identify spatial recurrence, interannual variation, and areas of persistent wildfire incidence, while avoiding the incorporation of older datasets that could introduce inconsistencies related to differences in data availability, processing, or spatial quality.
Additionally, the mapping covered the critical period between 20 July and 16 October of each year, which coincides with the Naturatins Ordinances, responsible for the suspension of the issuance and validity of environmental authorizations for controlled burning during the dry season in Tocantins. This temporal delimitation ensures that the data analyzed reflect the most critical conditions for the occurrence of wildfires in the state.
2.3. Definition of Buffers
QGIS 3.38 (Quantum Geographic Information System, 2024) was the software chosen for this study. It is an open-source and free-to-use tool, widely recognized for its versatility in handling, analyzing, visualizing, and publishing geospatial data. The software is compatible with various operating systems, ensuring accessibility and efficiency. The LTR (Long Term Release) version was selected due to its greater operational stability and the extended support offered, features that ensure reliability in analytical processes [16].
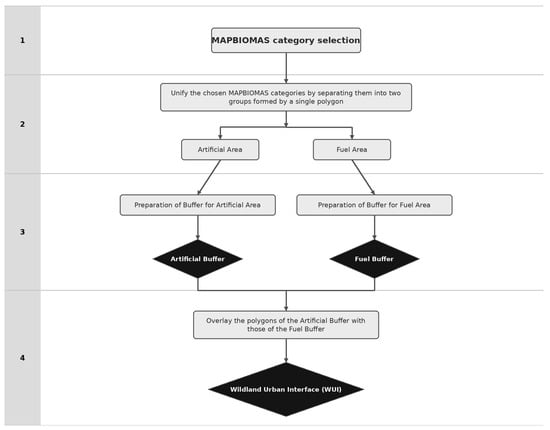
In the context of this study, the classes defined in the MapBiomas project were organized into two main categories: artificial areas and combustible areas. For each of these categories, buffers were generated, starting with the artificial areas, followed by the combustible areas. The intersection of the generated buffers resulted in the delimitation of the Urban–Forest Interface (WUI), as demonstrated in Figure 2, which served as a basis for subsequent analyses. This approach allowed for greater precision in the identification and characterization of transition areas between urban zones and vegetation, providing relevant data for the study of forest fire dynamics.
Figure 2.
Scheme for defining the WUI through buffers.
The numbers indicate the methodological steps shown in the figure: 1—selection of MapBiomas categories; 2—unification and grouping of the selected categories into artificial areas and fuel areas; 3—preparation and generation of the corresponding buffers for each group; 4—overlay of the artificial-area and fuel-area buffers to delimit the Wildland–Urban Interface (WUI).
For the initial stage of the analysis, different buffers were applied in the municipality of Palmas, TO, based on combinations derived from the current legislation in countries such as France, Italy, Portugal, and Spain. This procedure was carried out in a manner similar to the method described by [6], aligning with the updated regulations of the reference countries, as illustrated in Table 2.
Table 2.
WUI definitions in European countries (source: [6]).
The selection of these combinations aimed to encompass different levels of rigor and scope, allowing for a comparative and detailed analysis of the interaction between urban and forest areas. This approach was fundamental in establishing the boundaries of the Urban–Forest Interface (WUI), serving as a methodological basis for the rest of the study.
The buffer configuration was varied in different combinations for analysis in the municipality of Palmas, TO, based on the legislation of France, Italy, Portugal, and Spain. The most comprehensive approach used a combination of 200 m for urban areas and 400 m for forest areas, inspired by the standards adopted by France and Italy. This configuration covers a wide intersecting area, allowing for the identification of potentially more fire-susceptible interface zones. The use of wide buffers ensures that critical regions are not overlooked, providing greater coverage and a more detailed analysis of the risks associated with urban–forest areas.
Table 3 describes different configurations for delimiting areas of Urban–Forest Interface (WUI), based on the variation in buffers of artificial areas and combustible areas. The column “Artificial Area Buffer (m)” refers to the width, in meters, of the buffer delineated around urban areas, while the “Artificial Area (ha)” quantifies, in hectares, the extent of these urban or built zones. Similarly, the “Fuel Area Buffer (m)” and “Fuel Area (ha)” specify the size of the buffer and the corresponding area of vegetation potentially prone to burning. The “ WUI Area (ha)” results from the overlap of the artificial and combustible areas, defining the total extent of the Urban–Forest Interface. The “Burned Area (ha)” indicates the portion, in hectares, that effectively suffered from burns within the area of the WUI, being expressed, finally, in percentage terms in the column “%”, which quantifies the proportion of burned area in relation to the total area of the WUI, allowing for an analysis of the effectiveness and vulnerability of the different delimitations tested.
Table 3.
Information on buffers and WUI areas.
An intermediate alternative was the combination of 100 m for urban areas and 200 m for forest areas, widely used by France and Portugal. The configuration of 50 m for urban areas and 100 m for forest areas, based on the more stringent parameters adopted by Spain, emphasized areas of greater interaction directly between urban and forest zones, focusing on narrower limits.
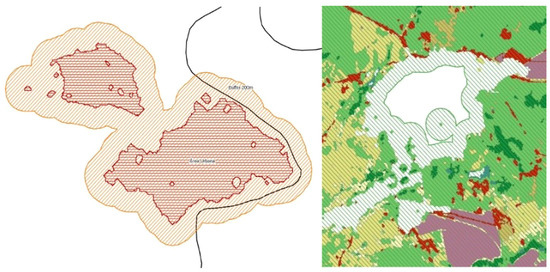
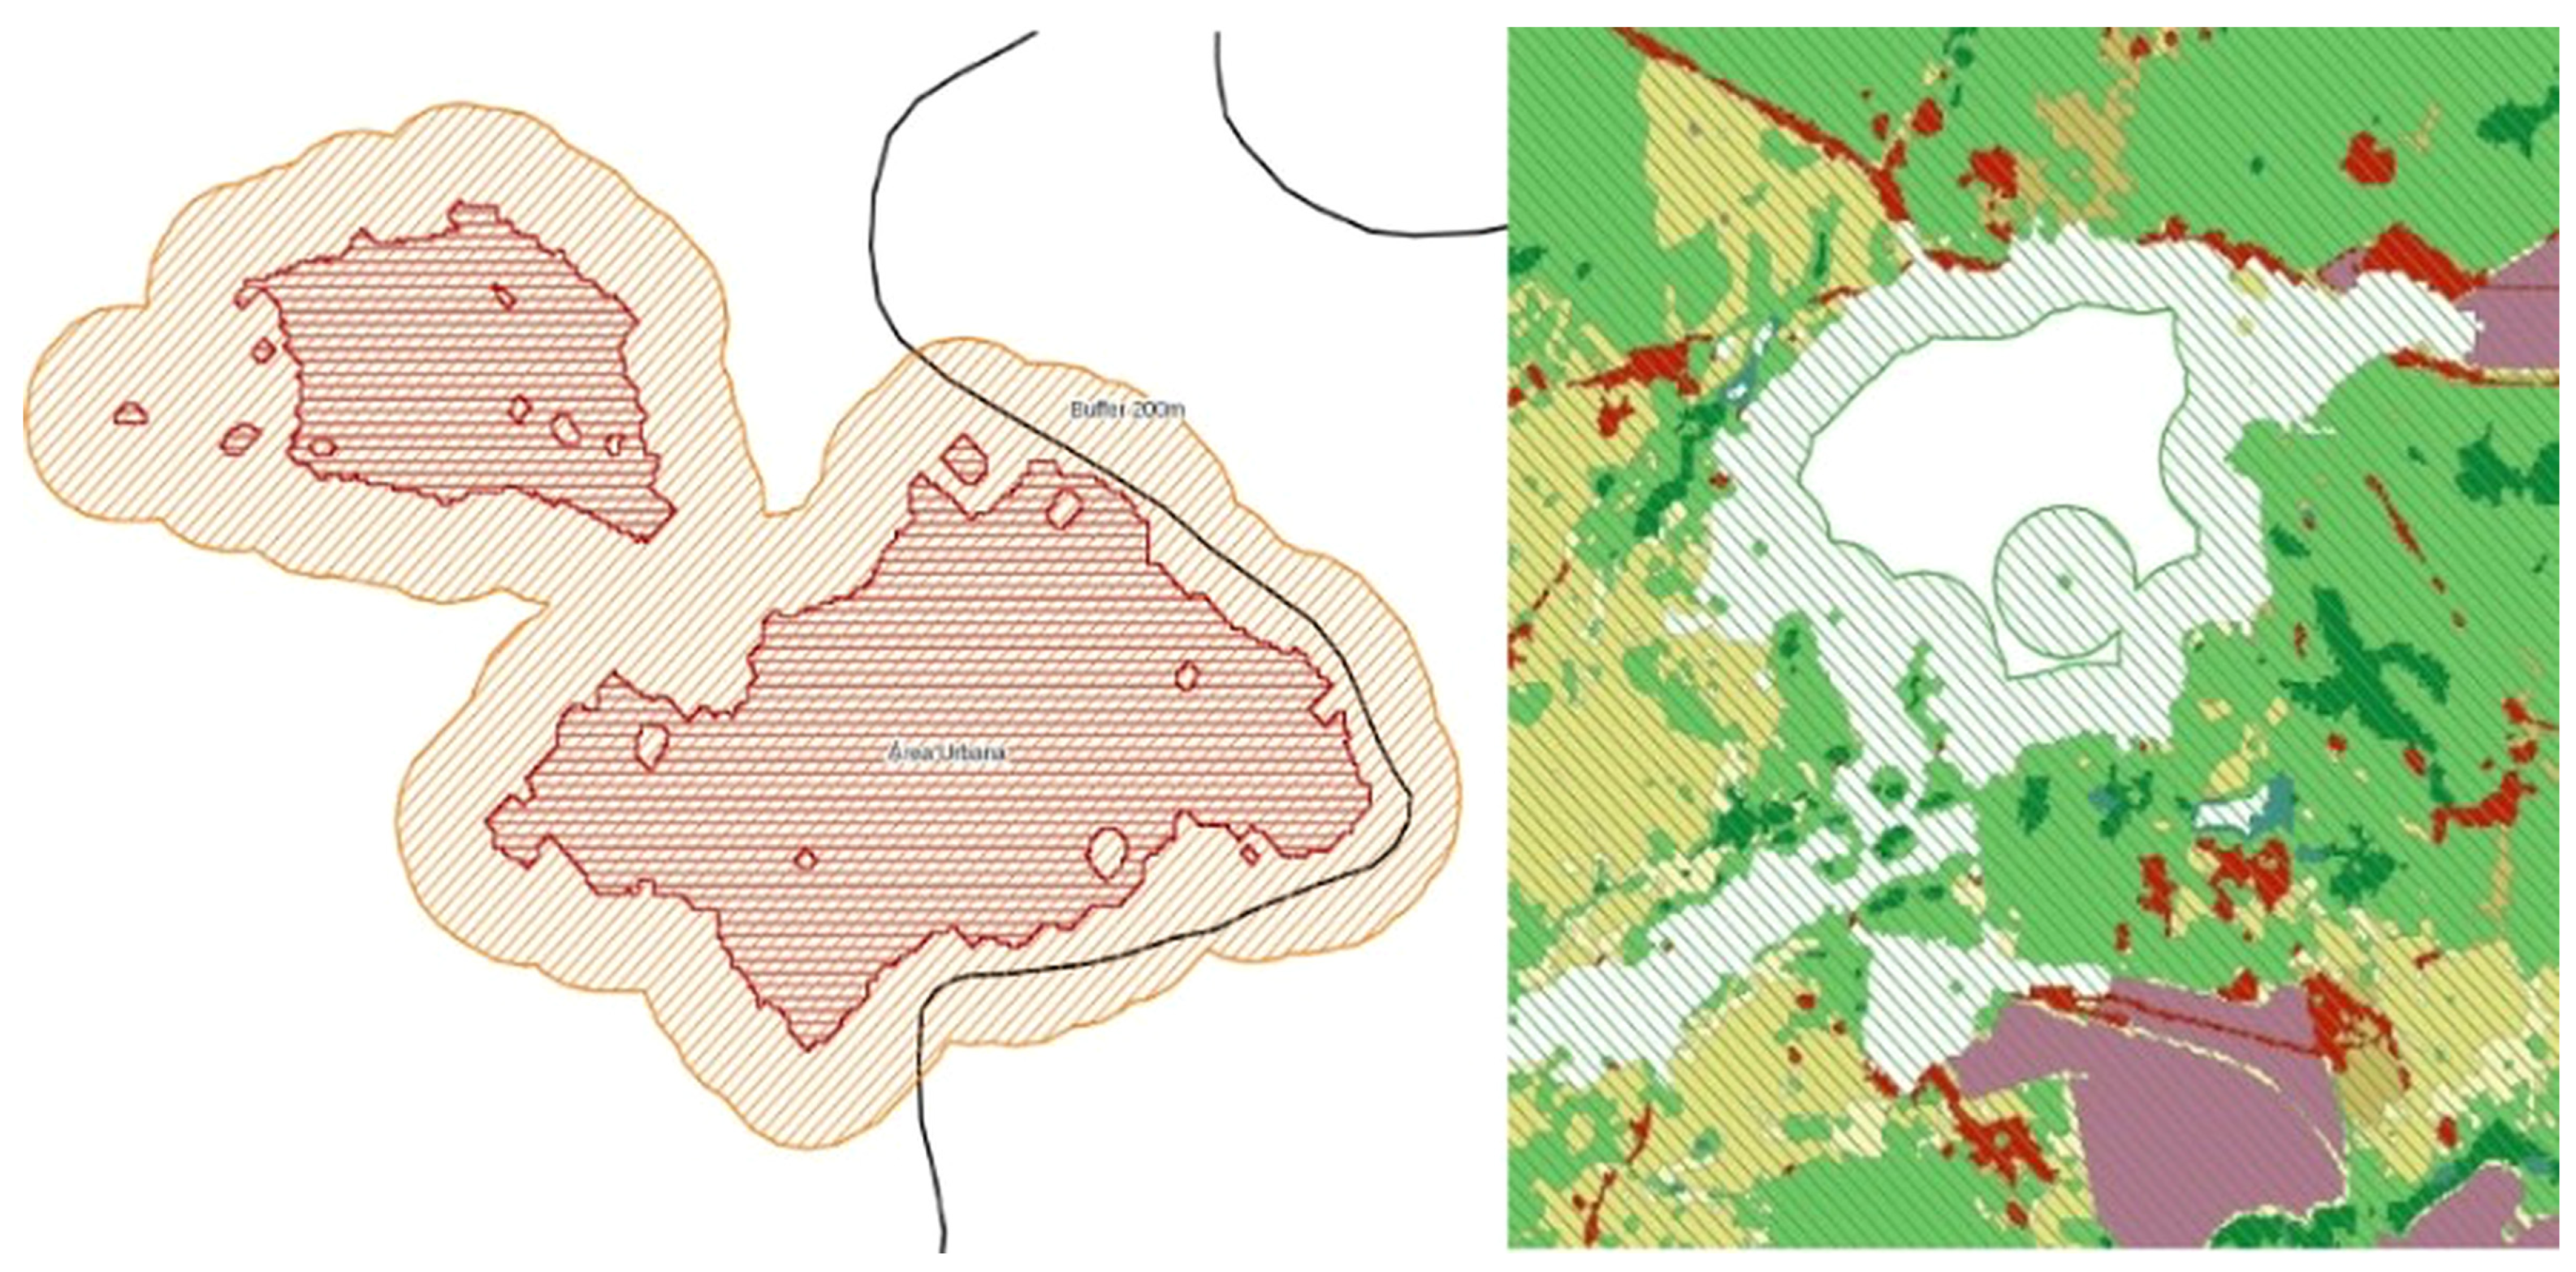
The combination of 200 m for urban areas and 200 m for forest areas, derived from Italy’s criteria, represented a balance between territorial extent and analytical precision. This configuration captured significant interface areas without dispersing the data, providing greater representativeness for analysis. Finally, the combination of 50 m for urban areas and 200 m for forest areas associated a more restricted delimitation for urban areas to a greater scope for forest areas, and has been adopted by both Spain and Italy. These combinations, which vary in their levels of rigor and extent, allowed for a robust and comparative assessment of the Urban–Forest Interfaces studied (Figure 3).
Figure 3.
Example of a buffer of an artificial area and a fuel area (demonstrative area).
In the analysis of the evaluated buffers, the configuration of 200 × 200 m stood out as the most efficient, presenting a burned area ratio of 17.59%. This result indicates a greater precision in delineating critical contact zones between urban and forest areas, highlighting its effectiveness in identifying areas more susceptible to forest fires. On the other hand, the 200 × 400 m buffer, although it presented a high ratio of 15.12%, covered a significantly larger area, with 18,081.01 hectares. This greater scope, however, resulted in a dilution in the concentration of burned areas due to the dispersion of fire hotspots, limiting its ability to focus on priority areas.
When compared to smaller configurations, such as 50 × 100 m (14.81%) and 100 × 200 m (14.33%), the 200 × 200 m model presented the best ratio between territorial scope and risk concentration. This configuration allowed for a more effective identification of the interactions that favor the spread of fire, balancing the spatial precision and the representativeness of the analyzed areas. Thus, the model of 200 × 200 m was selected as the standard for application in the other municipalities analyzed. The choice was based on technical criteria, such as artificial area, fuel area, delimitation of the WUI and the proportion of burned area within this interface, ensuring a consistent and robust approach for subsequent studies.
2.4. Applied Statistics
To carry out the statistics after defining the buffers and producing the Shapefile of the interface in Repackage format, the following were produced: a Shapefile of the scars of each municipality in separate polygons for each year; Shapefile of the scars in the urban–forest interface of each municipality for each year; Shapefile of the scars in the unified urban–forest interface (2020 to 2023) without area repetition (i.e., without overlap; even if that area burned more than once, it was counted only once); Shapefile of the scars of each unified municipality (2020 to 2023). Similar burned areas had their centroids extracted, generating a new Shapefile of the centroids of each scar of the unified municipality (2020 to 2023) and finally a Shapefile of the interface with filtering to minimize statistical noise was generated. A classification of fires was made, similar to [6], by size; this categorization is necessary for subsequent statistical analysis and is crucial to understand the dynamics of fires in the region and to direct prevention efforts and combat fire more effectively.
Here, small fires were considered to be those with an area of up to 5 hectares (ha), medium fires those with an area greater than 5 hectares (ha) up to 40 hectares (ha) and large fires those with more than 40 hectares (ha) of area. It is worth noting that regarding the small fires, it is possible that the improvement in the methodology for determining burn scars, which constantly seeks to remove the so-called “noise,” with the adjustment of the algorithm, may have considerably eliminated small areas that were not burn scars, thus generating the drastic drop between the first year and the second year of the analysis of the studied municipalities.
A statistical analysis, based on the work of [6], was conducted to identify relationships between the dataset of the studied municipality of burned areas and the distance to the nearest Urban–Forest Interface (WUI) area. A filtering operation was applied to reduce statistical noise in the data, caused by interface areas considered small and isolated, so that the distance in relation to the fire was calculated for the main interface area of the municipality.
To assess the robustness of the binary logistic regression models, a sensitivity analysis was performed focusing on the stability of model behavior under the adopted spatial preprocessing criteria. Specifically, we compared the general pattern of the estimated relationship after the filtering step used to reduce statistical noise associated with small and isolated WUI fragments. The aim was not to maximize predictive performance, but to verify whether the direction and overall behavior of the relationship between fire occurrence and distance to the nearest WUI remained stable after spatial filtering. Regarding discrepant values, extreme distance observations were not automatically excluded. Instead, they were checked against the original spatial database and retained whenever they corresponded to valid mapped burned-area centroids. Exclusion was limited to artifactual or spatially inconsistent observations resulting from mapping noise or fragmentation effects in the interface polygons.
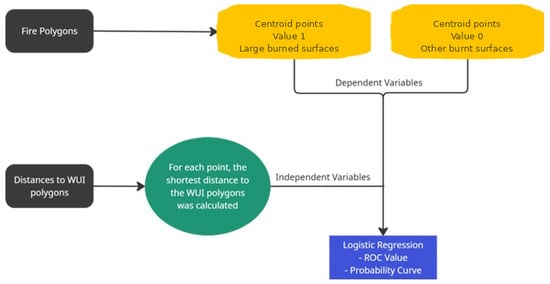
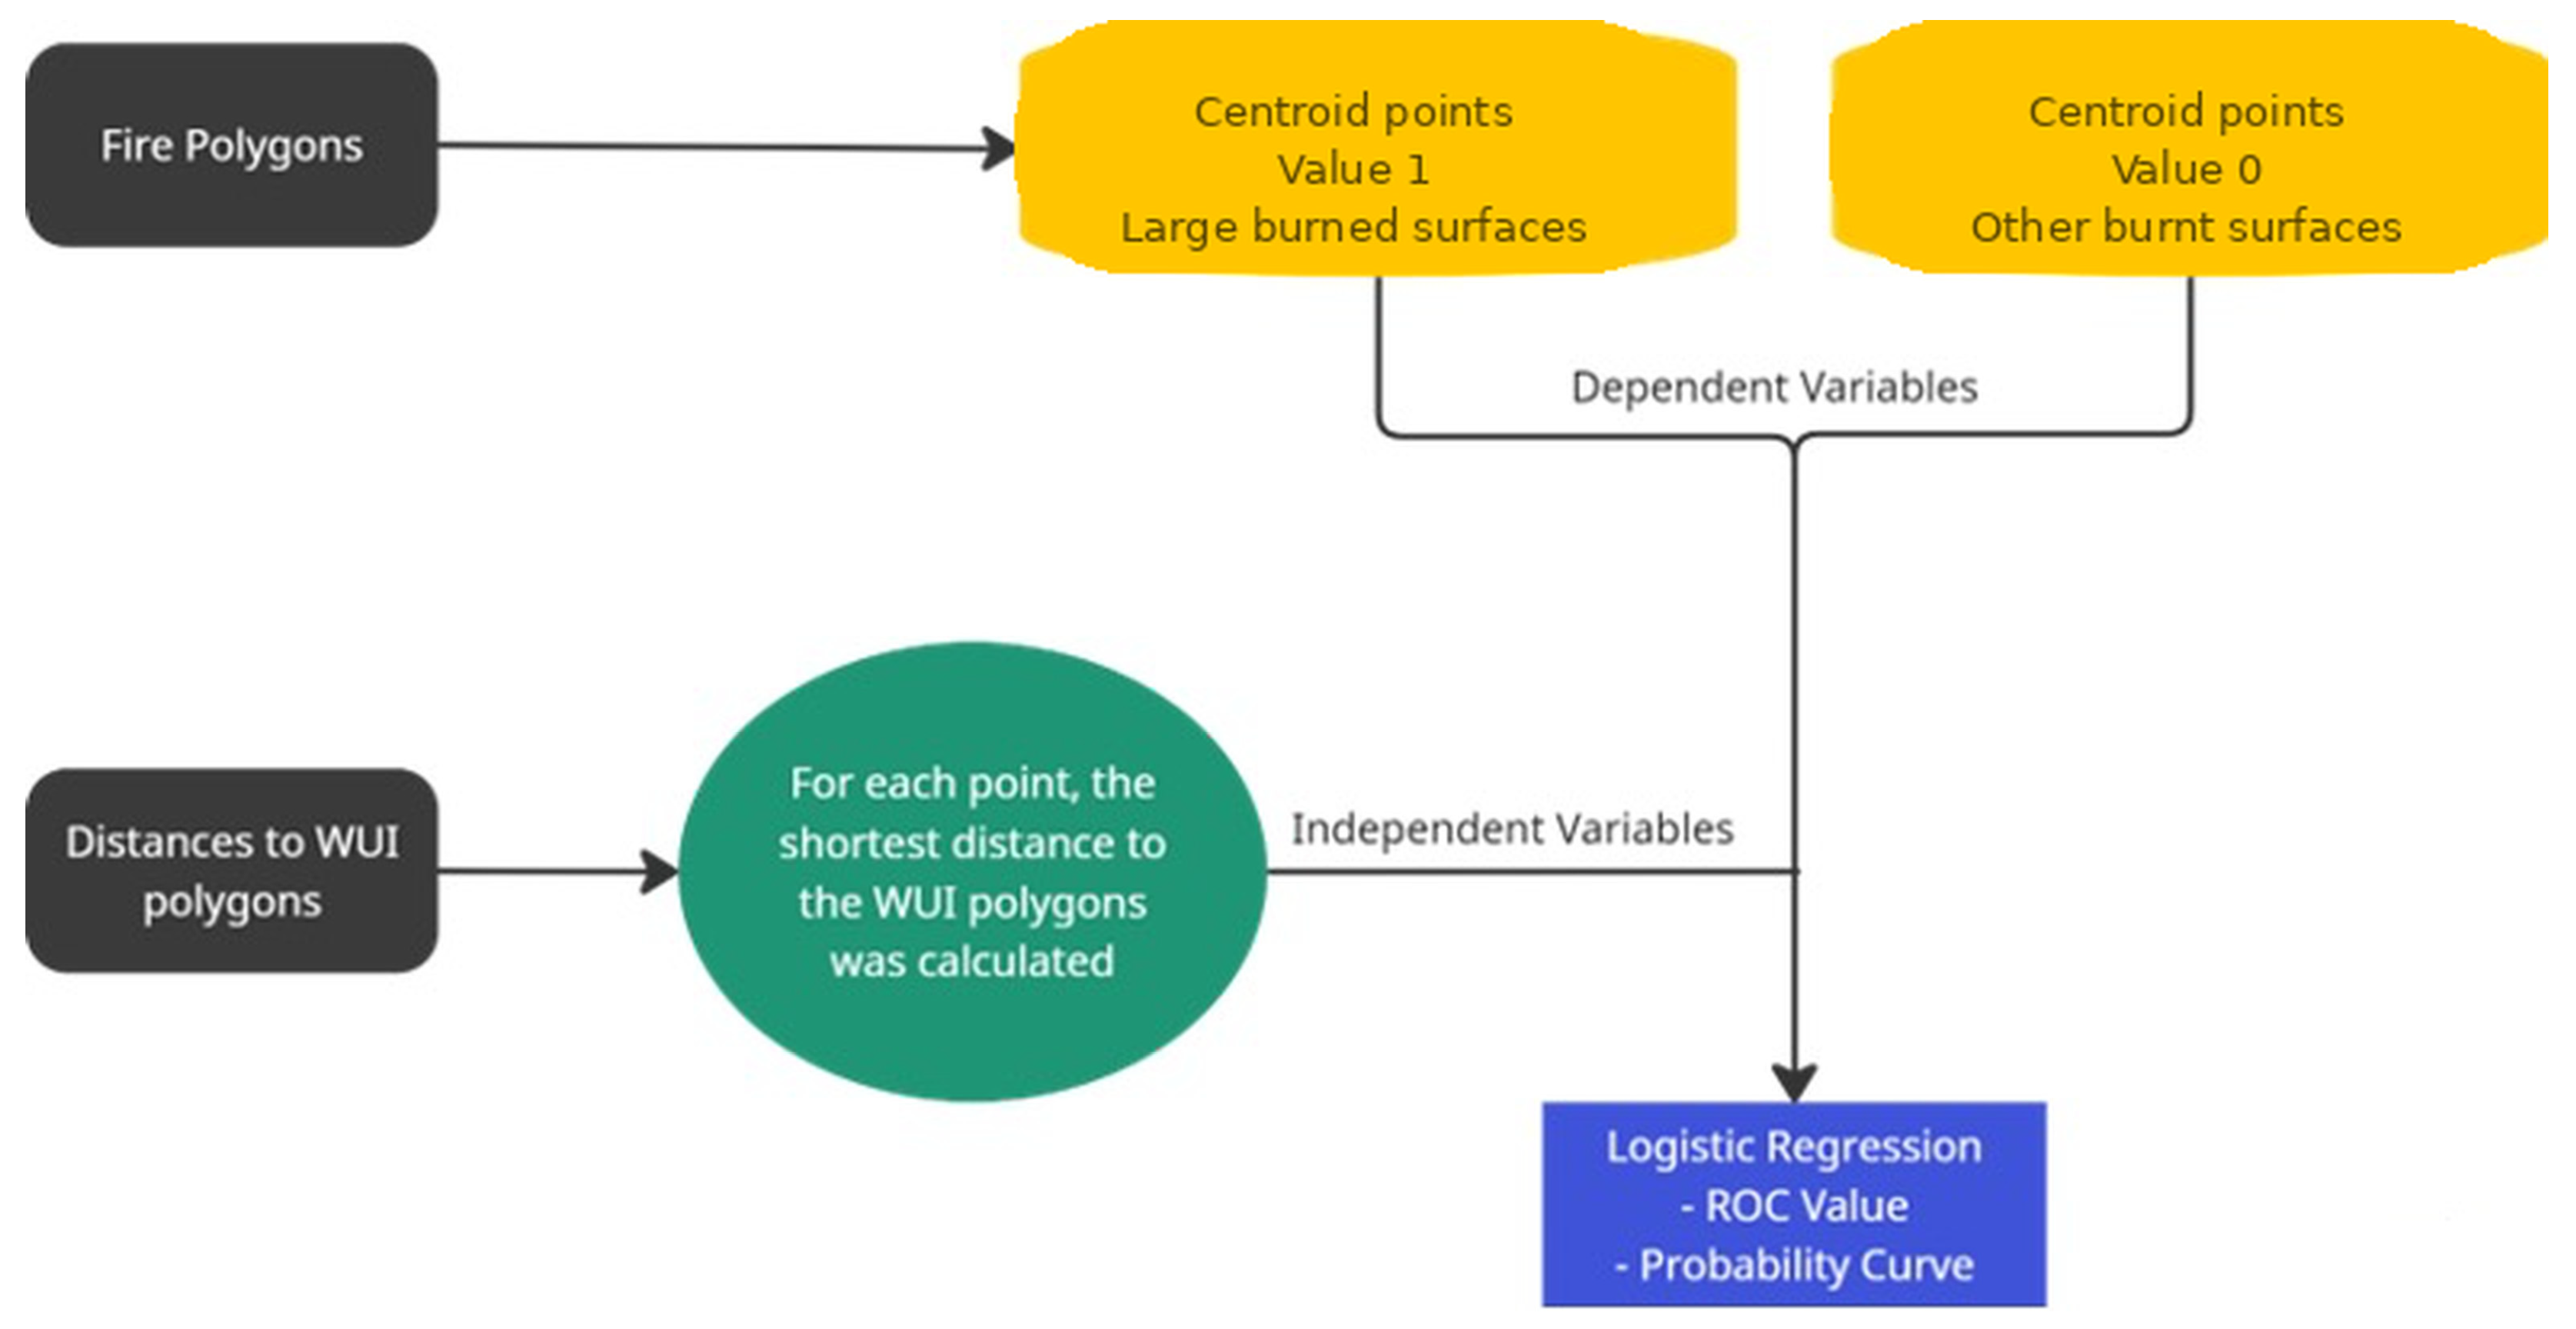
A logistic regression model (LoR) (Figure 4) was used to model the relationship between the burned areas and the independent explanatory variable, which is the distance to the nearest WUI. In this context, WUI proximity was treated as the central explanatory variable of interest, and the model was intended to assess its statistical association with wildfire occurrence in the studied municipalities, rather than to establish a fully isolated causal effect after controlling for all potential confounding variables. This model determines the probability of presence or absence of the dependent variable, according to the type of burned area, based on the values of the independent variable; “this statistical methodology has been applied in the risk analysis of forest fires, where the dependent variable is represented by different variables, such as density of burned areas [22], presence of burned areas [23], or ignition points [6,24].
Figure 4.
Analytical workflow of the logistic regression model applied to Large, Medium, and Small Burned Areas.
As noted by [6], this model can express probability on a scale from 0 to 1, and its performance can be evaluated using the area under the Receiver Operating Characteristic curve (ROC) [25,26]. Three separate analyses were conducted, one for each type of burned area: Large Burned Areas, Medium Burned Areas, and Small Burned Areas. For each analysis, observations belonging to the corresponding class were assigned a value of 1, while all remaining observations were assigned a value of 0. For example, in the analysis of Large Burned Areas, value 1 was attributed to areas classified as large, and value 0 to the remaining areas.
Ref. [6] states that the value of ROC in logistic regression is an indicator where “the discrimination threshold is set at 0.5, and values above that indicate a strong correlation.” In this work, as in [6], the burns were transformed into points through the extraction of the centroid of the polygons. This generalization allows us to count the centroid points, corresponding to the number of burned areas by type of burned area, whether they are Large Burned Areas, Medium Burned Areas or Small Burned Areas.
3. Preliminary Results
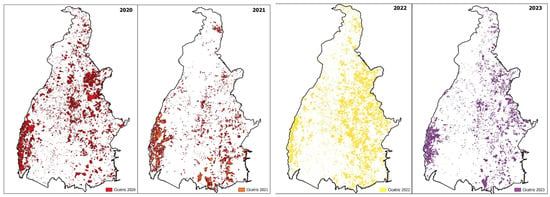
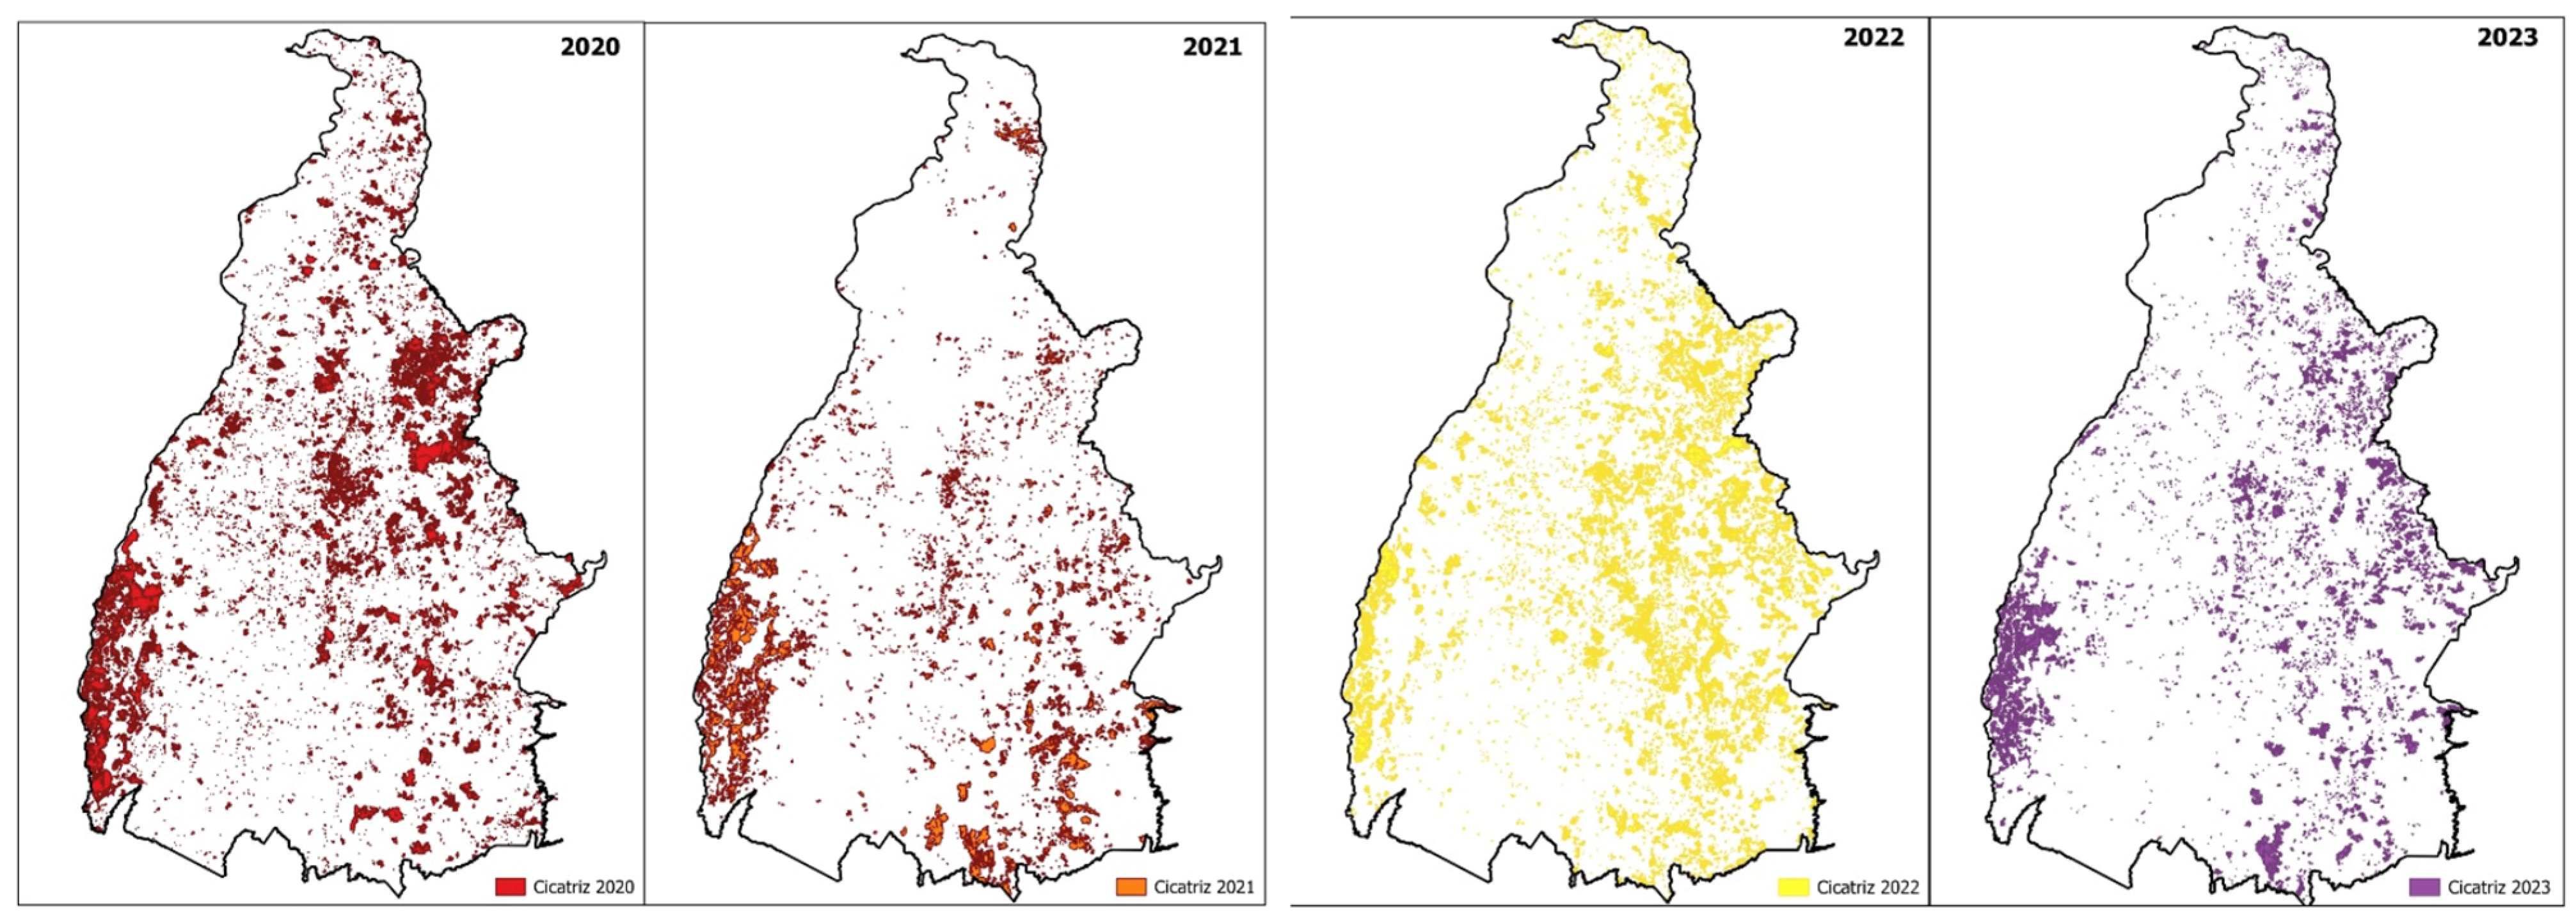
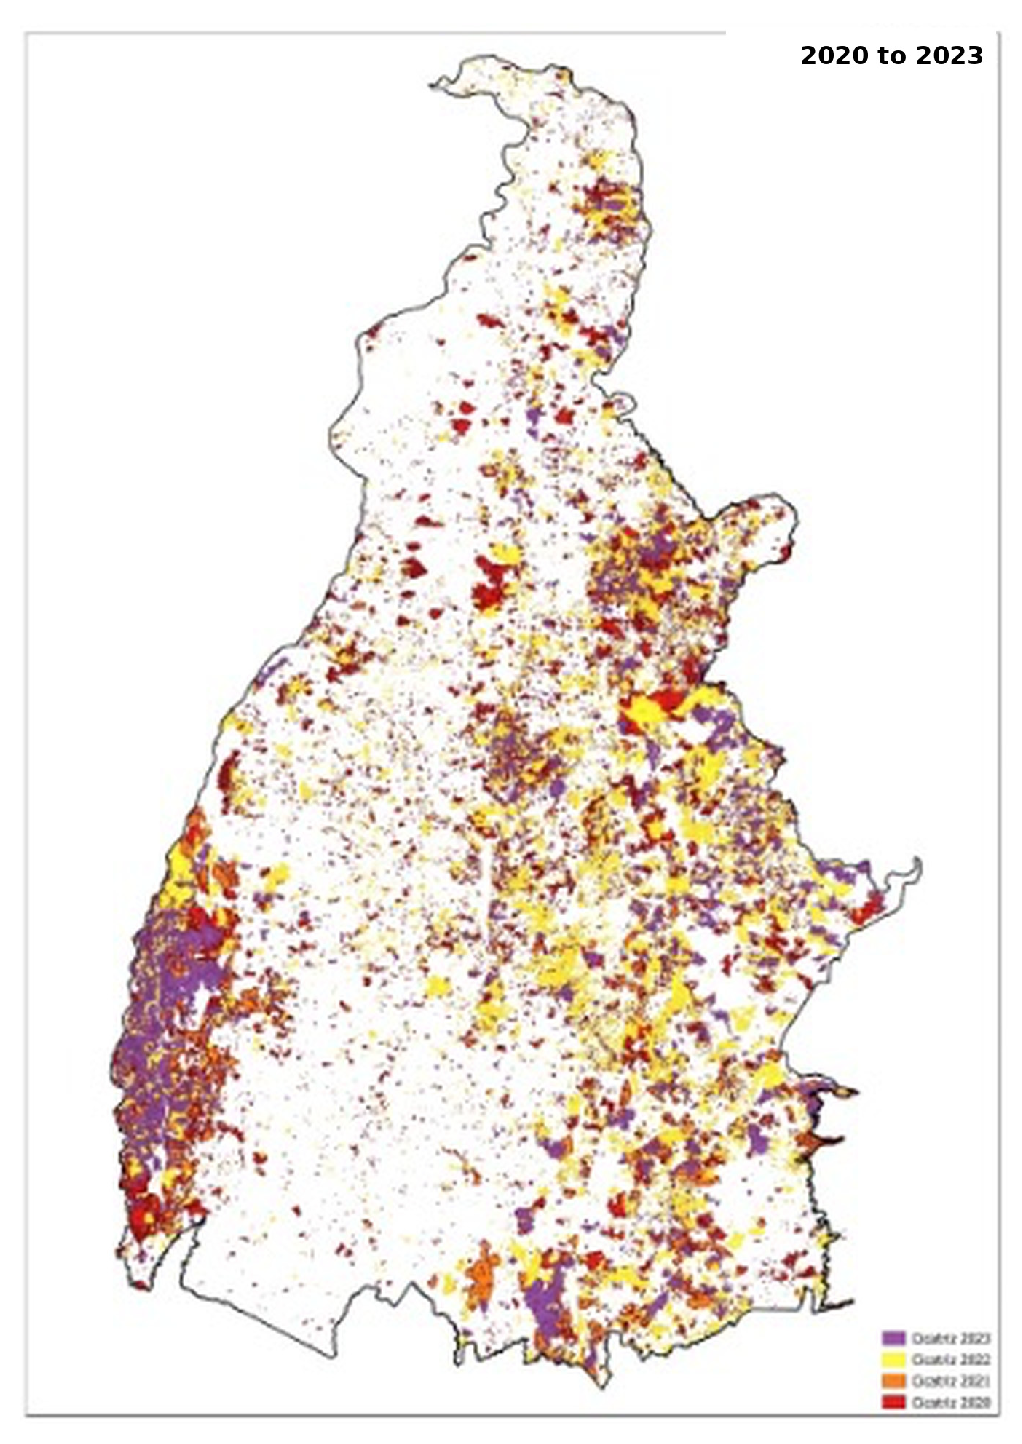
The spatial analysis of fire scars in the state of Tocantins, based on the maps generated for the years 2020 to 2023, highlights distinct patterns of occurrence throughout the state territory. The central and southern regions, covering municipalities such as Palmas, Porto Nacional, Gurupi, and Lagoa da Confusão, stand out for a high concentration of fire scars. These areas, represented by colors such as red and orange, indicative of the fires that occurred in 2020 and 2021, record a high frequency and significant intensity of burns. This scenario appears to be directly related to predominant agricultural practices, such as burning for pasture management, in addition to other anthropogenic activities. The recurrence of scars in consecutive years suggests a persistence of challenges in the management and prevention of forest fires, reinforcing the need for more effective strategies tailored to the local characteristics.
In the eastern and northeastern regions of the state, municipalities such as Araguaína, Conceição do Tocantins and Lizarda show a significant overlap of scars from burns, particularly in the years 2022 and 2023, indicated by yellow and purple on the maps. This persistence may be associated with a continuity in the use of inadequate fire management, aggravated by climatic conditions that favor the spread of the flames. The intensification of fires in these regions seems to be influenced by the expansion of the agricultural frontier and by environmental characteristics that increase the susceptibility to ignition and fire spread. This analysis highlights a critical pattern of vulnerability, in which the interactions between human activities and natural factors substantially raise the risks of uncontrolled fires.
In the far north of the state, the lower density of scars indicates a reduced incidence of large-magnitude fires, possibly due to the higher humidity naturally characteristic of this region. However, isolated scars suggest that the risk of fires is not entirely absent, even if their scale is lower compared to other regions. On the other hand, in the southwest region, which includes municipalities like Formoso do Araguaia and Paranã, there is a moderate concentration of scars, particularly in recent years. This pattern may reflect changes in the environmental conditions or local practices, which have made these areas more susceptible to wildfires.
Fires in Tocantins from 2020 to 2023
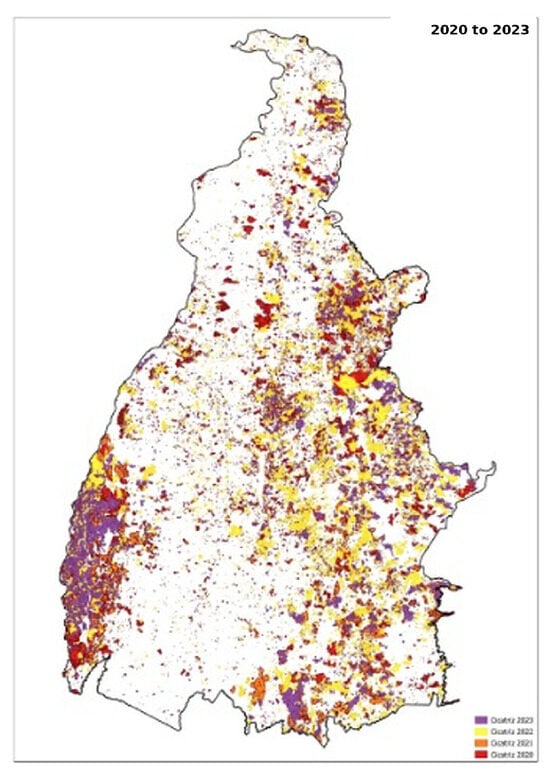
The analysis of burn scars over the study period highlights the spatial complexity of wildfire occurrence in the state of Tocantins and reinforces the challenges associated with its management. As shown in Figure 5, the annual distribution of burn scars between 2020 and 2023, together with the cumulative representation for the entire period (Figure 6), reveals recurrent concentration patterns in specific portions of the state, suggesting that wildfire occurrence is not randomly distributed in space. Rather, these patterns appear to reflect the combined influence of land use dynamics, predominant agricultural practices, and regional climatic conditions. Although methodological limitations affected the precise delimitation of some burned areas in 2021, the number and spatial continuity of the identified scars remain sufficient to support the interpretation of significant wildfire occurrence during the analyzed period. Overall, the spatial behavior observed suggests that wildfire incidence in Tocantins is shaped by a set of interacting environmental and anthropogenic drivers, which should be considered in the design of more targeted prevention and management strategies.
Figure 5.
Fire scars for Tocantins by year for the period 2020 to 2023.
Figure 6.
Fire scars for Tocantins by year and accumulated for the period 2020 to 2023.
These patterns highlight the importance of strategic interventions that consider such variables, with the aim of developing and implementing more effective mitigation actions and adaptation. Such strategies are essential to reduce both the frequency and the severity of wildfires, while simultaneously ensuring the preservation of the natural ecosystems and the protection of affected local communities.
The analysis of the municipalities, based on the presented data, highlights aspects relevant to the population, demographic density, predominant economic activities and the relationship between the areas affected by fires within the Urban–Forest Interface (WUI) and the totality of the analyzed municipalities. Palmas, the most populous municipality, has 313,349 inhabitants and the highest demographic density (102.5 inhabitants/km2), reflecting a highly urbanized profile, with a predominance of the service sector. In contrast, Mateiros has the smallest population, with 2773 inhabitants, and the lowest demographic density (0.2 inhabitants/km2), characterized by its rural predominance.
Porto Nacional and Araguaína stand out for their high urbanization rates, of 97.7% and 95.0%, respectively, both associated with the predominance of the service sector as the main economic activity. On the other hand, Paranã and Arraias have significantly lower rates of urbanization (45.7% and 38.5%, respectively), with agriculture as the main economic activity. These variations in the socioeconomic characteristics and urbanization rates directly influence the strategies of territorial management and fire control, highlighting the need for approaches specific to each context.
Regarding the areas affected by fires, Lagoa da Confusão leads with the largest burned area recorded within the municipality, totaling 882,619 ha, which represents an impressive 83.49% of its total area. This data highlights the high vulnerability of the municipality to fires and the urgent need for prevention and adequate control strategies. In contrast, Palmas has the largest fire area concentrated in the WUI, with 3450.62 ha, corresponding to 22.68% of the total area of the municipality. Mateiros, in turn, did not record fires in the WUI, suggesting a reduced impact in this specific interface. Goiatins stood out for the highest number of fire occurrences, with 2345 recorded, followed by Lagoa da Confusão, with 2048, which suggests a high frequency of fires possibly related to land use practices and environmental characteristics.
The data indicates that more urbanized municipalities, such as Porto Nacional and Palmas, tend to see burned areas concentrated in the WUI. In contrast, municipalities with lower urbanization and an economy focused on agriculture, such as Lagoa da Confusão and Formoso do Araguaia, have fires in large areas, but with less concentration in the WUI. These results reinforce the need for fire management strategies that consider the demographic and economic characteristics of each locality.
Finally, the implementation of public policies focused on fire prevention, environmental education, and the sustainable management of forest and urban areas is essential to mitigate the impacts of fires in the analyzed municipalities. These policies should be adapted to local conditions, promoting a balance between development, economic growth and environmental preservation (Table 4).
Table 4.
Information on buffer and WUI areas.
4. Results
The analysis of the data presented in Table 5 highlights significant trends regarding the probability of occurrence and the behavior of fires of different size classes in the studied municipalities, with an emphasis on the Urban–Forest Interface (WUI). In general, the values of Receiver Operating Characteristic (ROC) above 0.5 indicate the reliability of the applied forecasting models, even though there are observed variations in probabilities and in the behavior of trend curves.
Table 5.
Probability of fires in the WUI *.
For large-magnitude fires, the municipality of Lagoa da Confusão recorded the highest probability of occurrence within the WUI, with 44.90%, and an ROC value of 0.67, indicating a strong reduction in probability as the distance from the WUI increases. Paranã, with a probability of 46.38% and an ROC of 0.60, also stands out.
However, unlike Lagoa da Confusão, the trend in Paranã is one of a more gradual decrease as the distance from the WUI increases. In contrast, Tocantínia presents the lowest probability for large fires, 9.94%, and a curve trending upward, suggesting a higher risk of occurrence in areas farther from the WUI.
In the case of medium-sized fires, Conceição do Tocantins presents the highest probability within the WUI, 57.28%, with an ROC of 0.57, highlighting a trend of decreasing probability with the increase in distance from the WUI. On the other hand, Formoso do Araguaia, with a moderate probability of 33.49% and ROC of 0.52, reveals an increasing trend, indicating that medium fires are more likely in areas farther from the WUI. This pattern contrasts with the stability observed in municipalities such as Arraias and Rio Sono, where the trend curves remain constant.
Regarding small fires, Palmas stands out with the highest probability of occurrence, 47.78%, and a trend curve that decreases as the distance from the WUI increases, as indicated by the ROC of 0.55. Other municipalities, such as Tocantínia, show high probabilities of small fires (50.48%), but with a static curve, suggesting a relatively uniform distribution in relation to the proximity of the WUI. In contrast, Paranã presents a significantly lower probability for small fires (11.09%), with a trend increasing as it moves away from the WUI, indicating an atypical behavior in relation to the other analyzed locations.
These observations highlight the relevance of fire management strategies tailored to the specific conditions of each municipality. The variation in the probability and behavior of fires across different size classes within the Wildland–Urban Interface (WUI) highlights the need for context-specific approaches that take into account factors such as population density, the degree of urbanization, and predominant economic activities.
The formulation of integrated public policies is essential, focusing on environmental education, sustainable land management practices, and continuous monitoring systems for the WUIs. These measures will not only contribute to reducing the risks and impacts associated with forest fires but will also promote more effective land management, aligned with the local specificities of the analyzed municipalities.
The results obtained for Tocantins are consistent with the broader literature showing that the Wildland–Urban Interface constitutes a critical spatial context for understanding wildfire occurrence and supporting fire-risk management. In particular, the analytical relevance of distance from the WUI observed in several municipalities is in line with the findings of [7], who demonstrated that proximity to the interface may significantly influence wildfire probability in European regions. Likewise, the need for locally adapted approaches identified in this study is consistent with [8], who emphasized the importance of municipal-scale modeling for fire-risk management, and with [9], who highlighted the value of detailed geospatial criteria for delimiting the WUI in Portugal. At the same time, the Tocantins case reveals important contextual specificities. Unlike many of the international cases discussed in the literature, the wildfire patterns observed here appear to be strongly shaped not only by urban expansion and interface configuration, but also by recurrent agricultural use of fire, land use dynamics, and the ecological characteristics of the Cerrado biome. These differences reinforce that, although the WUI framework is analytically useful across different regions, its interpretation and management implications must be adapted to local socio-environmental conditions.
5. Conclusions
The analysis of the distribution and behavior of fires in the state of Tocantins reveals the complexity and diversity of factors that influence the occurrence of burns in different regions. Aspects such as population density, the degree of urbanization, and predominant economic activities are determinants in the configuration of fire scar patterns and their relationship with Urban–Forest Interface areas. More urbanized municipalities, such as Palmas and Porto Nacional, show a higher concentration of burns in the WUI, while regions with agricultural predominance, such as Lagoa da Confusão, face extensive burned areas, although with lower density in the interface.
The analyzed data highlight the need for specific regional approaches to fire management and prevention. The improper use of fire for managing rural areas, associated with favorable environmental conditions, such as unplanned agricultural expansion, and adverse climatic factors, increases the vulnerability of these areas. Thus, public policies aimed at environmental education, sustainable agricultural practices, and prevention strategies become essential, especially in the regions most susceptible. The WUIs, in particular, require greater attention due to the proximity between vegetation and urban structures, which increases the risk of damage to materials and human life. The lack of planning and monitoring exacerbates this vulnerability, requiring constant and targeted interventions.
Therefore, it is essential to adopt mitigation and adaptation strategies that consider the particularities of Tocantins municipalities. The combination of preventive practices, such as strengthening sustainable agricultural management, with coordinated and effective responses can help protect ecosystems and local populations, minimizing the environmental, social, and economic impacts of burns. In the context of the WUIs, specific measures, such as the delimitation of safety zones, the removal of plant fuels in critical areas and the awareness of local communities about the risks associated with improper land use are fundamental to reducing the vulnerability of these regions.
Additionally, the integrated management of the WUIs should be considered a priority to promote safer and more resilient urban development. Interventions such as sustainable land use planning, the creation of continuous monitoring systems, and targeted educational actions can significantly contribute to mitigating the impacts caused by fires.
Based on these observations, it is possible to propose specific regulations to guide the public authorities in delineating and monitoring the WUIs in the municipalities of Tocantins. These guidelines, based on the data and analyses discussed, may include measures such as the implementation of safety zones, the use of monitoring technologies, and the promotion of environmental awareness. The goal is to provide support for policies that are more effective in protecting both ecosystems and urban areas, ensuring the safety and sustainability of local communities.
Author Contributions
Conceptualization, I.D.B. and M.A.P.V.; Methodology, I.D.B. and M.A.P.V.; Software, I.D.B. and M.A.P.V.; Validation, I.D.B. and M.A.P.V.; Formal analysis, I.D.B. and M.A.P.V.; Investigation, I.D.B. and M.A.P.V.; Resources, I.D.B. and M.A.P.V.; Data curation, I.D.B. and M.A.P.V.; Writing—original draft, I.D.B. and M.A.P.V.; Writing—review & editing, I.D.B., M.A.P.V. and Y.F.d.A.; Visualization, I.D.B. and M.A.P.V.; Supervision, I.D.B. and M.A.P.V.; Project administration, I.D.B. and M.A.P.V.; Funding acquisition, I.D.B. and M.A.P.V. All authors have read and agreed to the published version of the manuscript.
Funding
This research received no external funding.
Institutional Review Board Statement
Not applicable.
Informed Consent Statement
Not applicable.
Data Availability Statement
The raw data supporting the conclusions of this article will be made available by the authors on request.
Conflicts of Interest
The authors declare no conflicts of interest.
References
- Bento-Gonçalves, A.; Vieira, A. Wildfires in the wildland-urban interface: Key concepts and evaluation methodologies. Sci. Total Environ. 2020, 707, 135592. [Google Scholar] [CrossRef] [Scilit]
- Radeloff, V.C.; Hammer, R.B.; Stewart, S.I.; Fried, J.S.; Holcomb, S.S.; McKeefry, J.F. The wildland-urban interface in the United States. Ecol. Appl. 2005, 15, 799–805. [Google Scholar] [CrossRef] [Scilit]
- Cohen, J.D. What Is the Wildland Fire Threat to Homes? Thompson Memorial Lecture School of Forestry; Flagstaff, A.Z., Ed.; Northern Arizona University: Flagstaff, Arizona, 2000. [Google Scholar]
- Stewart, S.I.; Radeloff, V.C.; Hammer, R.B.; Hawbaker, T.J. Defining the wildland-urban interface. J. For. 2007, 105, 201–207. [Google Scholar] [CrossRef] [Scilit]
- Platt, R.V. The Wildland–Urban Interface: Evaluating the Definition Effect. J. For. 2010, 108, 9–15. [Google Scholar] [CrossRef] [Scilit]
- Modugno, S.; Balzter, H.; Cole, B.; Borrelli, P. Mapping regional patterns of large forest fires in Wildland- Urban Interface areas in Europe. J. Environ. Manag. 2016, 172, 112–126. [Google Scholar] [CrossRef] [Scilit] [PubMed]
- Whitman, E.; Rapaport, E.; Sherren, K. Modeling fire susceptibility to delineate wildland–urban interface for municipal-scale fire risk management. Environ. Manag. 2013, 52, 1427–1439. [Google Scholar] [CrossRef] [Scilit] [PubMed]
- Pereira, J.M.C.; Alexandre, P.; Campagnolo, M.; Bar-Massada, A.; Radeloff, V.; Silva, P. Chapter 4—Fire at the Wildland Urban Interface. In Defining and mapping the wildland-urban interface in Portugal Advances in Forest Fire Research 2018; Viegas, D.X., Ed.; Universidade de Coimbra: Coimbra, Portugal, 2018; pp. 742–749. [Google Scholar] [CrossRef] [Scilit]
- Pivello, V.R. The use of fire in the Cerrado and Amazonian rainforests of Brazil: Past and present. Fire Ecol. 2011, 7, 24–39. [Google Scholar] [CrossRef] [Scilit]
- INPE—Instituto Nacional de Pesquisas Espaciais. Portal TerraBrasilis—Queimadas. Available online: https://terrabrasilis.dpi.inpe.br/queimadas/portal/ (accessed on 7 September 2024).
- Lazzarini, G.M.; Ferreira, L.C.; Felicíssimo, M.F.; Lira, R.G.; Justino, A.G.; Gomes, C.S.; Ribeiro, J.C.; Magalhães, G.R. Análise da distribuição de focos de calor no Tocantins entre 2002 e 2011. Interface Porto Nac. 2012, 2, 24–35. [Google Scholar]
- Barradas, A.C.; Borges, M.A.; Costa, M.M.; Ribeiro, K.T. Paradigmas da Gestão do Fogo em Áreas Protegidas no Mundo e o Caso da Estação Ecológica Serra Geral do Tocantins. Biodiversidade Bras. 2020, 10, 71–86. [Google Scholar] [CrossRef] [Scilit]
- Secretary of Planning and Budget (SEPLAN); D. DE G. DE I. T. E S. (DIGIT); G. DE I. S. (GEFINS). State of Tocantins—Municipal Socioeconomic Profile. 2nd Version. Palmas: [s.n.]. 2021. Available online: https://www.ifto.edu.br/ifto/colegiados/consup/documentos-aprovados/ppc/campus-araguaina/tecnico-em-planejamento-e-controle-da-producao-integrado-ao-ensino-medio/ppc-tecnico-em-planejamento-e-controle-da-producao-integrado-ao-ensino-medio-campus-araguaina-ifto.pdf (accessed on 6 May 2026).
- Brazilian Institute of Geography and Statistics (IBGE). Demographic Census 2022; IBGE: Rio de Janeiro, Brazil, 2022.
- Public Ministry of Tocantins; CAOMA. Burned Area in the State of Tocantins 2020 to 2023. Available online: https://caomampto.maps.arcgis.com/apps/dashboards/e0c8d700f181485dae7c958d0cc5d197 (accessed on 7 May 2024).
- QGIS. Welcome to the QGIS Project; QGIS Development Team: Cham, Switzerland, 2024. [Google Scholar]
- Souza, C.M.; Z. Shimbo, J.; Rosa, M.R.; Parente, L.L.; A. Alencar, A.; Rudorff, B.F.; Hasenack, H.; Matsumoto, M.; G. Ferreira, L.; Souza-Filho, P.W.; et al. Reconstructing Three Decades of Land Use and Land Cover Changes in Brazilian Biomes with Landsat Archive and Earth Engine. Remote Sens. 2020, 12, 2735. [Google Scholar] [CrossRef] [Scilit]
- Republique Française. Loi n. 2001-602 du 9 juillet 2001 d’orientation sur la forêt. Journal Officiel de la République Française, n. 159, texte n. 2. 11 July 2001. Available online: https://www.legifrance.gouv.fr/jorf/id/JORFTEXT000000223691 (accessed on 6 May 2026).
- Parlamento Italiano. Parlamento Italiano, Legge Quadro in Material di Incendi Boschivi; Legge 353/2000, Gazzetta Uff.; Parlamento Italiano: Rome, Italy, 2000; p. 280.
- Assembleia da República Portuguesa. Assembleia da República Portuguesa, Decreto Lei n. 156/2004 30 de Junho; Diário da República I Série-A; Assembleia da República Portuguesa: Lisbon, Portugal, 2004; pp. 3968–3975.
- Ministerio de la presidencia Espanya. Ministerio de la Presidencia Espanya, Ley de Montes 43/2003; Bol. Off. Estado; Ministerio de la presidencia Espanya: Madrid, Spain, 2003; Volume 280, pp. 41422–41442.
- Martinez, J.; Vega-Garcia Chuvieco, E. Human-caused wildfire risk rating for prevention planning in Spain. J. Environ. Manag. 2009, 90, 1241–1252. [Google Scholar] [CrossRef] [Scilit] [PubMed]
- Vilar, L.; Woolford, D.G.; Martell, L.D.; Martín, P.M. A model for predicting human-caused wildfire occurrence in the region of Madrid, Spain. Int. J. Wildland Fire 2010, 19, 325–337. [Google Scholar] [CrossRef] [Scilit]
- Badia, A.; Serra, P.; Modugno, S. Identifying dynamics of fire ignition probabilities in two representative Mediterranean wildland-urban interface areas. Appl. Geogr. 2011, 31, 930–940. [Google Scholar] [CrossRef] [Scilit]
- Kedem, B.; Fokianos, K. Regression Models for Time Series Analysis; John Wiley & Sons: New York, NY, USA, 2005. [Google Scholar]
- Kleinbaum, D.G.; Klein, M. Logistic Regression: A Self-Learning Test; Springer: New York, NY, USA, 2010. [Google Scholar]

Disclaimer/Publisher’s Note: The statements, opinions and data contained in all publications are solely those of the individual author(s) and contributor(s) and not of MDPI and/or the editor(s). MDPI and/or the editor(s) disclaim responsibility for any injury to people or property resulting from any ideas, methods, instructions or products referred to in the content. |
© 2026 by the authors. Licensee MDPI, Basel, Switzerland. This article is an open access article distributed under the terms and conditions of the Creative Commons Attribution (CC BY) license.