


Abstract
Accurate simulation modeling of the danger zone and real-time visualization of the toxic cloud spread during a fire and explosion at an industrial facility in a nearby urban area are in demand by rescue services conducting evacuation. Using a cellular automaton method allows us to create an optimal predictive model of the danger zone spread, combine modeling accuracy with computational speed, and consider multiple input variables and the cascading nature of an accident during visualization. The objective of this study was to develop a mobile application for calculating the parameters of the danger zone during an accident at an industrial facility caused by a toxic cloud spreading into an urban area, based on the selection of a cellular automaton algorithm. The primary objective of the study was a highly detailed visualization of the danger zone with several predicted values of toxic substance concentrations in the air. The authors developed a cellular automaton-based model, which forms the basis of the mobile application. It takes into account several variables characterizing chemicals in the explosion and fire zone, climate factors, occupancy, building parameters, and the availability of respiratory protection. The FireSoft Mobile app was developed using the Visual Studio 2022 development environment, C# 10.0, and .NET MAUI, adapted for Android 8.0 and higher. The mobile app was tested to visualize a cloud of toxic pollutants forming a hazardous zone in an urban agglomeration for cases involving an ammonia tank explosion and a large fire involving a large amount of polyvinyl chloride. The results demonstrate the app’s feasibility and effectiveness in predicting, planning, and managing evacuation measures during accidents at an industrial facility.
1. Introduction
Industrial facilities are complex technical systems, the operation of which is associated with a high risk of fire [1]. A fire at such a facility can spread according to the domino principle, whereby a fire in one component leads to cascading destruction of adjacent elements, creating the threat of a large-scale man-made disaster [2]. In this regard, the need for accurate and timely modeling of hazardous zones is of primary importance for ensuring industrial safety and protecting human lives.
The first and most obvious aspect of this need is related to ensuring the safety of personnel and populations in nearby buildings. During a fire at an enterprise, emissions of harmful substances into the atmosphere can significantly exceed the maximum permissible concentration (MPC) [3]. However, traditional methods for assessing the hazardous zone for the toxic substances spreading, based on regulatory documents and static evacuation schemes, often fail to take into account the actual dynamics of atmospheric emissions, which depend on various variables: type, volume, and location of combustible materials; the specifics of buildings; and the direction and strength of airflows [4].
The second aspect concerns evacuation management. Evacuation personnel arriving at the scene are faced with the need to quickly assess the situation and select optimal routes. A lack of reliable information about the contaminated zone can lead to erroneous decisions, including underestimating the threat to human health and life and misjudging the boundaries of hazardous zones with exceeded maximum permissible concentrations due to changes in wind direction and speed [5]. This is especially important for chemical industry facilities, where any error can have irreversible consequences.
The third aspect of the need for accurate and timely modeling of hazardous zones is damage minimization. Residential and office buildings may contain data centers, corporate offices, and banks, and disruption of their operations could result in massive indirect losses. Modeling allows us to not only predict the area of the hazardous zone contaminated by toxic combustion products but also identify the most vulnerable areas, where critical equipment, office buildings, and retail spaces are located [6].
The fourth aspect is related to the complexity of industrial facilities and the high concentration of buildings in modern cities, which are home to many industrial enterprises, including those in the chemical industry [7]. Therefore, unlike forest fires, industrial zones located in urban areas have a complex planning structure, which creates the preconditions for the nonlinear spread of a toxic gas cloud. Modeling based on the cellular automaton method allows these features to be taken into account with sufficient detail, creating a three-dimensional or two-dimensional representation of the toxic cloud with spatial discretization into cells, each of which is endowed with individual characteristics.
The fifth aspect is the need to adapt to changing conditions. Industrial enterprises and urban developments are not static objects and are dynamically evolving, so previously drawn up evacuation plans and regulatory impact zones quickly become outdated and no longer correspond to real-world conditions [8]. Therefore, operational modeling of hazardous zones using personal computers or mobile devices allows for the prompt updating of the forecast scenarios in the face of any infrastructure changes.
The sixth aspect of the need for accurate and timely modeling of hazardous zones is the psychological readiness of rescue personnel carrying out evacuations [9]. The availability of clear, visualized information about the predicted dynamics of the cloud spread of toxic combustion products allows for the provision of training that is more effective. Various aspects of the need for mobile applications arise, as they are capable of providing rapid and visual forecasting of hazard zone dynamics directly at the scene.
The first and most critical need is related to the time factor. Fires at industrial facilities develop exponentially: after crossing a certain threshold, the fire spreads like an avalanche, and atmospheric emissions increase significantly [10]. The mobile application allows the calculation of the danger zone to begin almost immediately, as soon as initial information about the fire location and weather conditions is received. This transforms forecasting from an auxiliary function into a real-time tool for operational evacuation management.
The second need stems from the mobility of the evacuation manager, who is constantly moving around the facility. Being tied to a desktop computer reduces management effectiveness [11]. A mobile application provides continuous access to forecast information any place within the facility. Geolocation automatically determines the user’s location on a map and displays it relative to the evacuation zone.
The third need is clarity and accessibility of information. The mobile app overlays the predicted spread of toxic combustion products onto a real map of the facility and the city, which is color-coded (for example, green—safe zone, yellow—threat zone, red—zone where maximum permissible concentrations are exceeded multiple times). This visualization is intuitive and requires no special training, which is especially important in conditions of stress and time constraints.
The fourth need relates to training and drills. The effectiveness of a hazard zone simulation system is directly proportional to the familiarity of evacuation personnel with it [12]. Mobile apps allow for the organization of regular training without additional costs. Personnel can practice various scenarios, become familiar with the peculiarities of the facility, and develop a strong skill set in using the tool.
The fifth need arises from working in a fire zone, where communication with remote centers may be disrupted. A mobile app capable of operating offline with preloaded site maps maintains functionality in conditions of complete isolation, when other information sources are unavailable.
The sixth need is the rapid exchange of data between evacuation management participants. Mobile devices connected to a local network provide the synchronization of forecasts between all participants in the operation. This creates a unified information space, eliminating the possibility of inconsistency.
When selecting a method for modeling a hazardous area for the spread of toxic combustion products, it should be taken into account that traditional methods for assessing hazardous areas are based on static approaches (Gaussian, Eulerian, Lagrangian, Box models), which do not take into account the actual dynamics of fire development and harmful emissions [13]. The spread rate of a toxic gas cloud depends on many variables: the type and location of combustible materials, the configuration of the building, the direction and strength of the wind, and the height and density of buildings. Without taking these factors into account, it is impossible to reliably predict how long it will take for the concentration of toxic products in the cloud to exceed the maximum permissible concentration, and which areas of residential buildings should be evacuated first. The cellular automaton method is the most promising approach for modeling the spread of clouds of toxic combustion products during fires at industrial facilities [14].
However, existing implementations of cellular automata models are primarily designed for desktop computers and are not adapted for use on mobile devices [15]. This creates a significant gap between practical needs and available tools. Personnel responsible for evacuation, as well as rescue service personnel, cannot leave the evacuation zone to work with a desktop computer or wait for a remote operator to perform a calculation and transmit the result. Therefore, a mobile application implementing a cellular automaton algorithm can bridge the gap between the need for operational analysis and interpretation of incoming data and the mobility of using visualization software.
Thus, the development and implementation of a mobile application for modeling hazardous areas during fires at industrial enterprises based on the cellular automaton method meets the urgent need for a prompt, accessible, and visual forecasting tool capable of increasing the efficiency of evacuation management and reducing risks to human life.
The objective of this study is to develop mobile software for visualizing a toxic cloud spreading during an industrial accident involving a fire or explosion of chemical containers, using a cellular automaton-based model, and to substantiate its advantages over other models (Gaussian, Eulerian, etc.). Achieving this goal requires solving a number of tasks:
- To create a mathematical model describing the formation and movement of a hazardous air cloud during a fire or explosion at an industrial facility, using the cellular automaton method;
- To develop a geometric model of a hazardous area for a fire at an industrial facility—a visualization prototype—using a mobile app;
- To create an algorithm for calculating the hazardous area for its modeling in a mobile app;
- To develop a working prototype of a mobile app for modeling the hazardous area during a fire at an industrial facility.
The research hypotheses include the following assumptions:
H1.
Using a cellular automaton method to predict the boundaries of a hazardous zone for the spread of hazardous substances during an accident at an industrial facility (explosion, fire) will allow for a more accurate description of the non-stationary processes of toxic cloud movement near residential areas than stationary models. Specifically, the frontal cellular automaton implementation in FireSoft Mobile is expected to reduce the mean absolute error of hazardous zone boundary prediction relative to a CFD reference by at least 15 percentage points compared to the Gaussian dispersion model, while keeping the full calculation time on an Android device below 10 s for a 200 × 200 cell domain.
H2.
To convert the numerical results of a model of the hazardous zone during a fire or explosion at an industrial facility into a parametric geometric model, an algorithm is required to generate the boundaries of the maximum permissible concentration (MPC) of toxic combustion products on a plane.
H3.
Developing a mobile application for the rapid modeling of hazardous zones for the spread of toxic clouds during an accident at an industrial facility will provide clear visualization and enable more effective and timely planning and implementation of efficient evacuation decisions than using software on desktop computers.
2. Materials and Methods
2.1. Review of Mobile Applications for Visualizing Hazardous Areas During Various Types of Fires
In recent years, there has been a growing number of mobile applications designed to support decision-making in the development and installation of fire safety systems, as well as during various types of fires—from forest and landscape fires to man-made ones. Analysis has shown that existing solutions have certain limitations, primarily related to the creation of static virtual models that do not account for the spread of toxic clouds in densely populated areas. Below is an overview of known mobile solutions (for smartphones and tablets running on Android and/or iOS):
1. Zonify (developed by Zonify Systems [16]) is cloud-based software for designing high-fire-hazard zones and evacuation plans, and creating virtual equipment mockups. It is a web-based platform compatible with mobile devices and accessible via a browser, optimized for tablets (Android Tablet) and iPads. Its visualization capabilities allow for the use of graphic files of building plans, photos of rooms, and equipment to apply icons of potentially hazardous sensors and zones in real time. The completed project can be instantly exported to PDF format, allowing on-site engineers to update drawings without the use of complex CAD software.
2. Fire Events Visualization System (developed by Pliszka Fire Protection Engineering) is a specialized hardware and software solution designed for monitoring and graphically displaying the status of fire safety systems at a facility [17]. The software serves as a link between complex fire detection equipment and the user—an industrial safety officer or a fire service employee—providing visual information in real time. The graphical interface displays floor plans and the precise location of sensors, control modules, and fire extinguishing zones, as well as visualizes the current status of all components. This software is used at facilities with increased safety requirements—in maritime transport, data centers, production lines, transformer substations, and cable tunnels in the energy sector.
3. Incident Response Map (developed by APX Data) is a specialized mobile software application designed for fire departments and rescue services that provides teams with instant access to critical information about facilities within the fire and fire suppression zone [18]. The application allows users to view building layouts and floor plans, and building parameters and facade images; determine the locations of nearby hydrants; and calculate the required water flow rate according to National Fire Academy (NFA) standards and display the distance to hydrants. Incident Response Map also integrates with automated dispatch systems, allowing users to receive notifications about fire service calls in real time with an automatic display of the incident location, view fire suppression plans, and view the latest fire safety inspection reports for the facility.
4. Fire3D Design (developed by Leafcutter Group Limited) is a cloud platform made for the automated design of fire alarm systems based on both 2D and 3D building and structure designs, and automatic calculations of fire protection system parameters [19]. The system provides cloud access via a browser and is aimed at creating equipment specifications, cable logs, and fire protection sensor connection diagrams.
5. Fire Hazard Matching is a specialized visualization tool within the framework of the inter-university LASH FIRE project under the auspices of the European Commission for forecasting fire hazard sources on ro-ro seagoing vessels [20]. This software allows for the visualization of the fire hazard source mapping and fire spread, planning of fire extinguishing equipment placement and safe stowage of various types of cargo, and automatic scanning of temperature anomalies using a smartphone or tablet.
To summarize the analysis of the mobile apps developed for fire services presented above, it should be noted that their primary aim is the design of fire protection and fire suppression systems. However, they are not designed to model combustion processes specific to exact locations or the spread of combustion products—toxic substances dispersed in clouds through the atmosphere. Therefore, developing a mobile app for modeling hazardous areas is a challenging and highly sought-after task.
2.2. Methods for Modeling Hazardous Zones with Propagation of Toxic Combustion Products
In our previous article [21], we considered the Gauss equation for calculating the area of a hazardous zone. Its boundaries are determined by comparing the calculated concentration of toxic combustion products with the MPC under conditions of continuous point emission and constant wind speed (1).
The following assumptions and notations are used in Formula (1):
C(x, y, z, p, z0) is the desired concentration of toxic combustion products in the hazardous area (g/m3). Note: all internal computations in the cellular automaton model use g/m3, while output values displayed to the user are automatically converted to mg/m3 for direct comparison with regulatory MPC thresholds).
Q is the emission source power, g/s;
x, y, z are the spatial coordinates of the monitoring point.
y0 is the coordinate of the emission source.
U is the average wind speed (m/s).
h is the height of the source above the surface (m).
p is the parameter characterizing the stability of the atmosphere.
z0 is a coefficient taking into account the roughness of the underlying surface.
σz, σy are the coefficients of horizontal and vertical dispersion of the impurity.
Q* = fF ∗ fW is a multiplier that corrects the concentration for the effects of dry and wet (fF and fW) deposition [22].
Analysis of Equation (1) shows that the value of C is directly determined by the values of σy and σz, which, in turn, depend on the type of atmospheric stratification and the nature of the underlying surface.
The main disadvantage of Gaussian models is their limitation to hypothetical constant conditions [23]. More sophisticated and realistic are non-stationary deterministic models (Eulerian and Lagrangian), which are capable of reflecting the dynamics of the emission over time [13]. However, increased accuracy in these models is achieved at the cost of increased computational complexity, and the developer is always forced to seek a compromise between the adequacy of the process description and the speed of calculation.
The Eulerian model is characterized by high accuracy and low computational speed, since it considers the propagation of a pollutant at fixed points in space through advection–diffusion equations. Unlike the Lagrangian model, which focuses on the movement of individual particles, the Eulerian model considers changes in concentration in a specific volume [24].
where C(x, y, z, t) is the concentration of the toxic substance at time t;
u(v, w) is the wind speed vector (velocity field);
K(Kx, Ky, Kz) are the mass turbulence coefficients;
S is the emission intensity;
σ is the chemical decomposition coefficient of hazardous substances in the atmosphere.
Lagrangian models are characterized by average accuracy and computation speed, which reduces their effectiveness in complex conditions [25]. The concentration at a fixed point in space is determined by the total contribution of particles entering a given cell during time Δt:
where mj is the mass of particle j;
ΔV is the cell volume;
f(xj − X) is the distribution function, most often a Gaussian kernel.
Box models, characterized by low accuracy and high calculation speed, assume an instantaneous release and uniform distribution of substance concentration within a volume (box) that moves downwind and expands due to air entrainment. The formula describes the change in cloud mass, volume, density, and velocity over time, taking into account the heaviness of the gas and turbulent mixing. In its simplest form, the concentration of harmful substances C in a volume V is calculated as follows [26]:
where Q—emission intensity (g/s);
q—air flow rate through the box, m3/s.
In [14,27], the choice of cellular automata algorithms is justified by their key advantages. These include: physical clarity of the rules for transitions between states reflecting the processes of transport, diffusion, and reactions; computational efficiency due to the simplicity of data structures; high potential for parallel computing, which ensures compatibility with modern hardware architectures; and the ability to directly take into account external influences (e.g., wind direction and strength) and static obstacles in the path of substance propagation; as well as the achievement of high simulation speed with a minimum number of easily calibrated parameters.
According to the approach described in [28], cellular automata models of gas dynamics, based on empirical assumptions, simple computational algorithms and heuristic rules, allow us not only to reproduce a qualitative picture of the spatio-temporal evolution of a cloud of toxic emissions (formed during fires and explosions), but also to obtain quantitative estimates of their statistical properties. In [29], for example, two modifications of such models are proposed: an asynchronous one, implementing the naive diffusion mechanism of T. Toffoli, and a block-synchronous one, known as TM-diffusion using the Margolus neighborhood.
Of considerable interest is the diffusion modeling algorithm based on a cellular automaton with a von Neumann neighborhood, which, according to [30], is implemented under the following conditions.
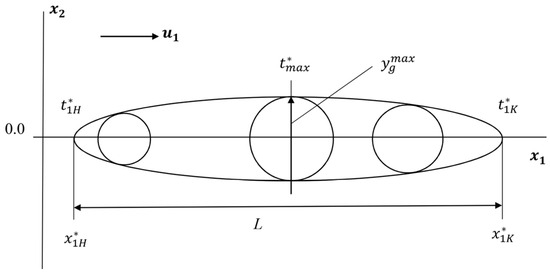
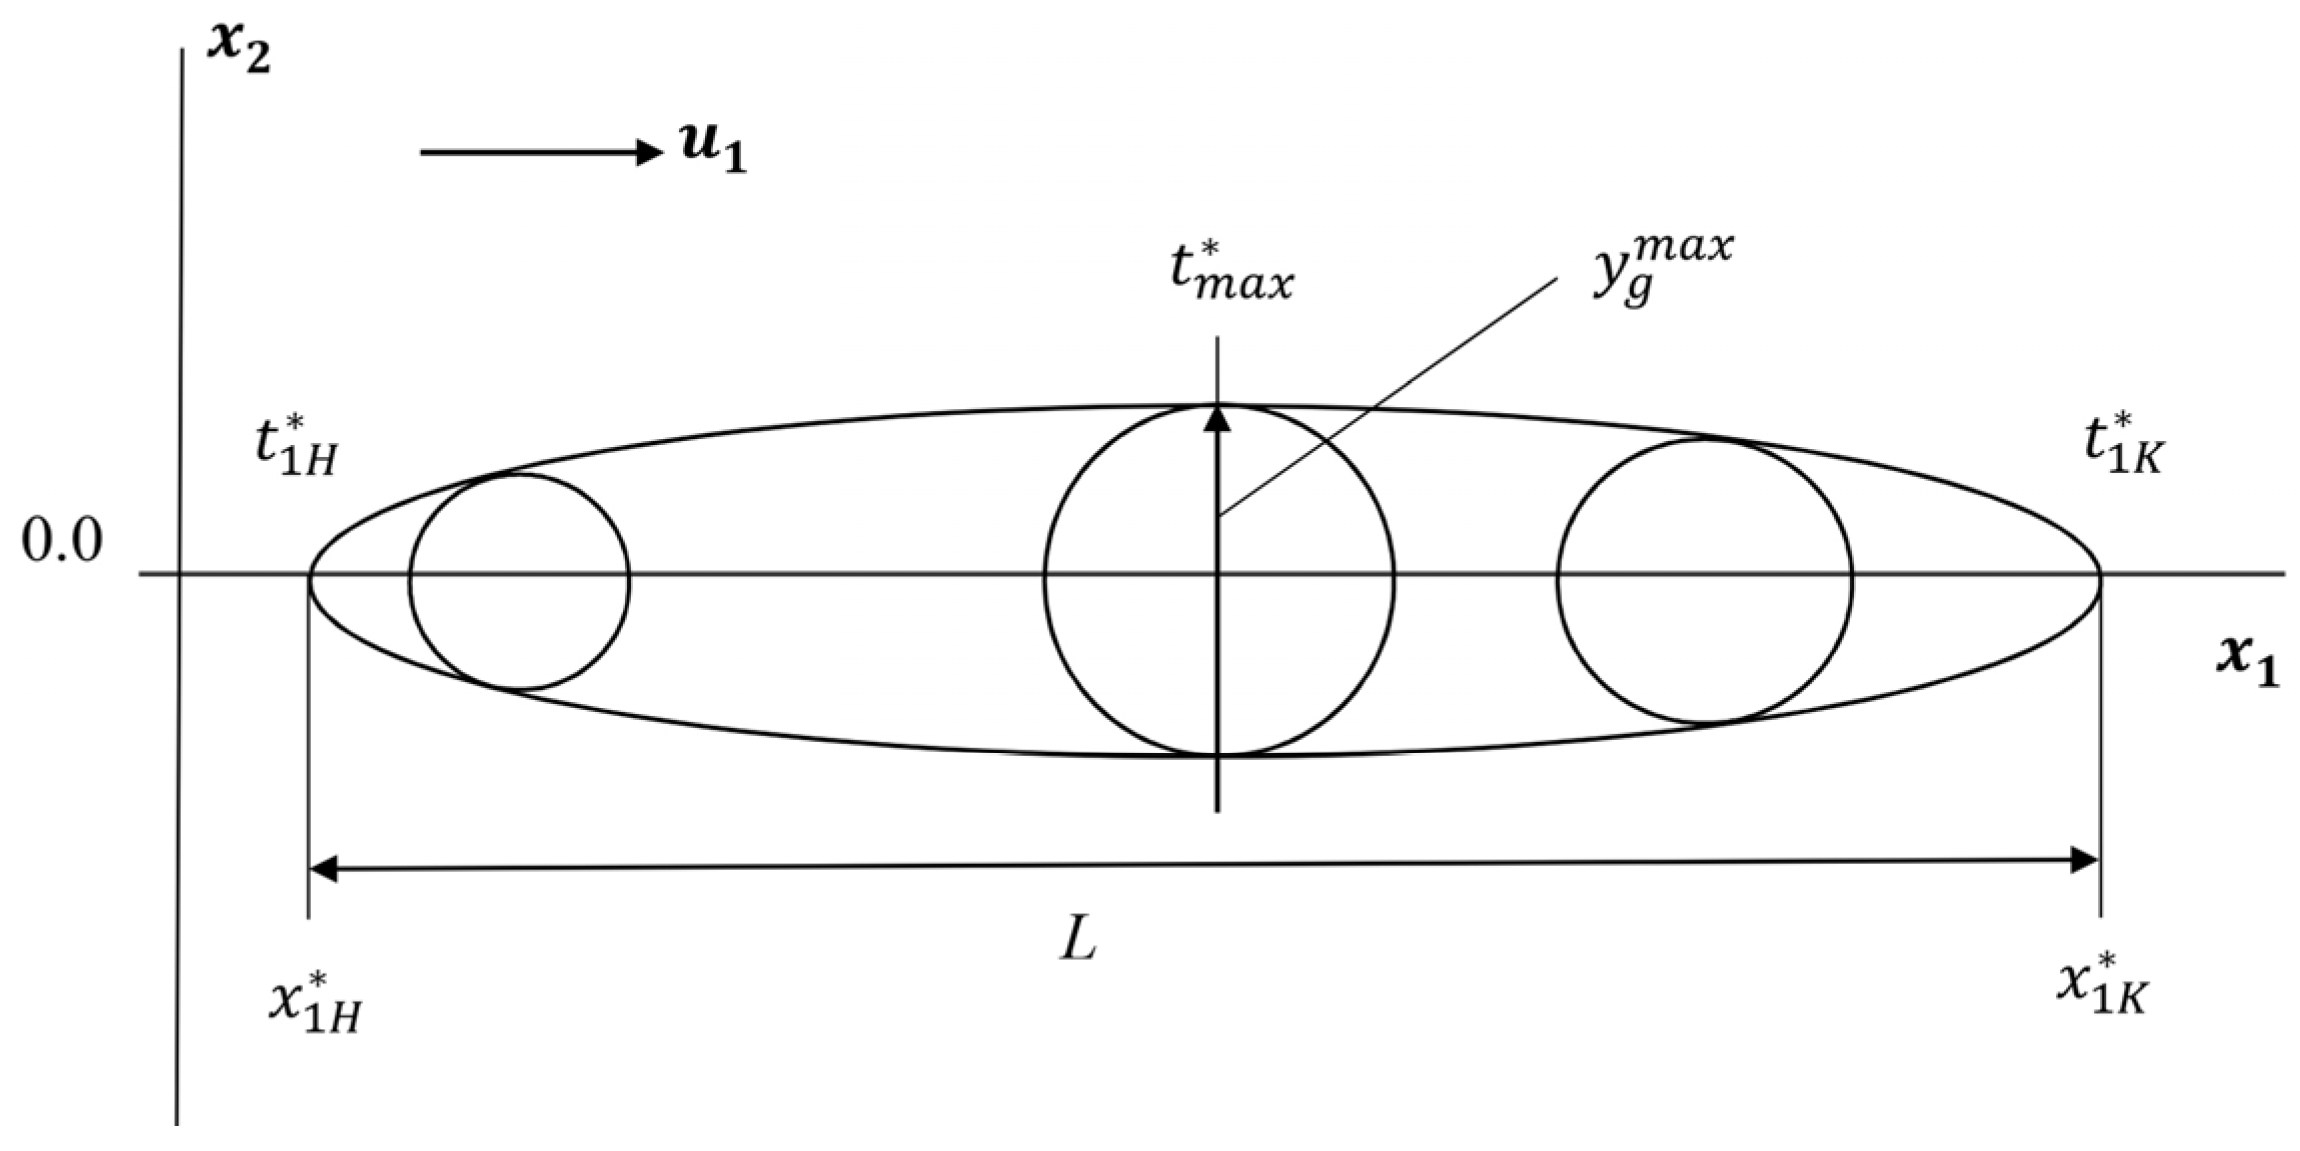
Firstly, in a two-dimensional flat model, the toxic cloud and emission zone are represented by a regular grid of cells, the size of which is tied to the map scale. The concentration of the impurity, averaged over the height, allows us to construct isopleths to which a tangent in the form of a circle can be drawn at any point (Figure 1). The danger zone is geometrically described by the upper and lower isopleths, drawn as tangents to circles of radius a = yg (1.5, t*, with a minimum at 0 and a maximum ). Inside these circles, the concentration exceeds the MPC; outside, it is below. The length of the affected zone is calculated as the difference in coordinates along the x1 axis between the moments of the end of the fire and the beginning of the cloud spread ; : , where [31].
Figure 1.
Simplified isopleths of the hazardous zone for a continuous point-source emission: upper and lower isopleths are tangent to circles of radius a = yg(1.5, t*), defining the MPC boundary; the zone length L = x1K − x1H is determined by the downwind coordinates at fire onset (ta) and end (tp) [32].
Secondly, the use of an integrated approach that combines the modeling of all stages of toxic cloud movement—emission during an accident, wind transport, turbulent diffusion and deposition on the terrain—requires a simultaneous analysis of meteorological parameters, emission conditions and the characteristics of the dispersion of impurities over the underlying surface.
Third, the fact that the cellular automaton model is probabilistic in nature due to the unique conditions of each emission is taken into account. The model parameters are random variables with an unknown distribution law. Assuming their normality, it is possible to calculate concentration isopleths from measurements and an interval estimate of the contaminated area with a confidence probability using the “three sigma rule” [31].
Fourth, the algorithm proposed in this article modifies the standard cellular automaton rules using the Monte Carlo method. The toxic cloud is represented here by a set of test particles distributed across cells, taking into account obstacles. The computational scheme includes the stages of initialization, particle motion, and concentration map construction.
2.3. Scheme of the Frontal Algorithm of Cellular Automaton
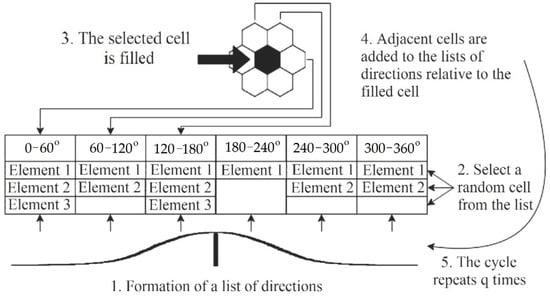
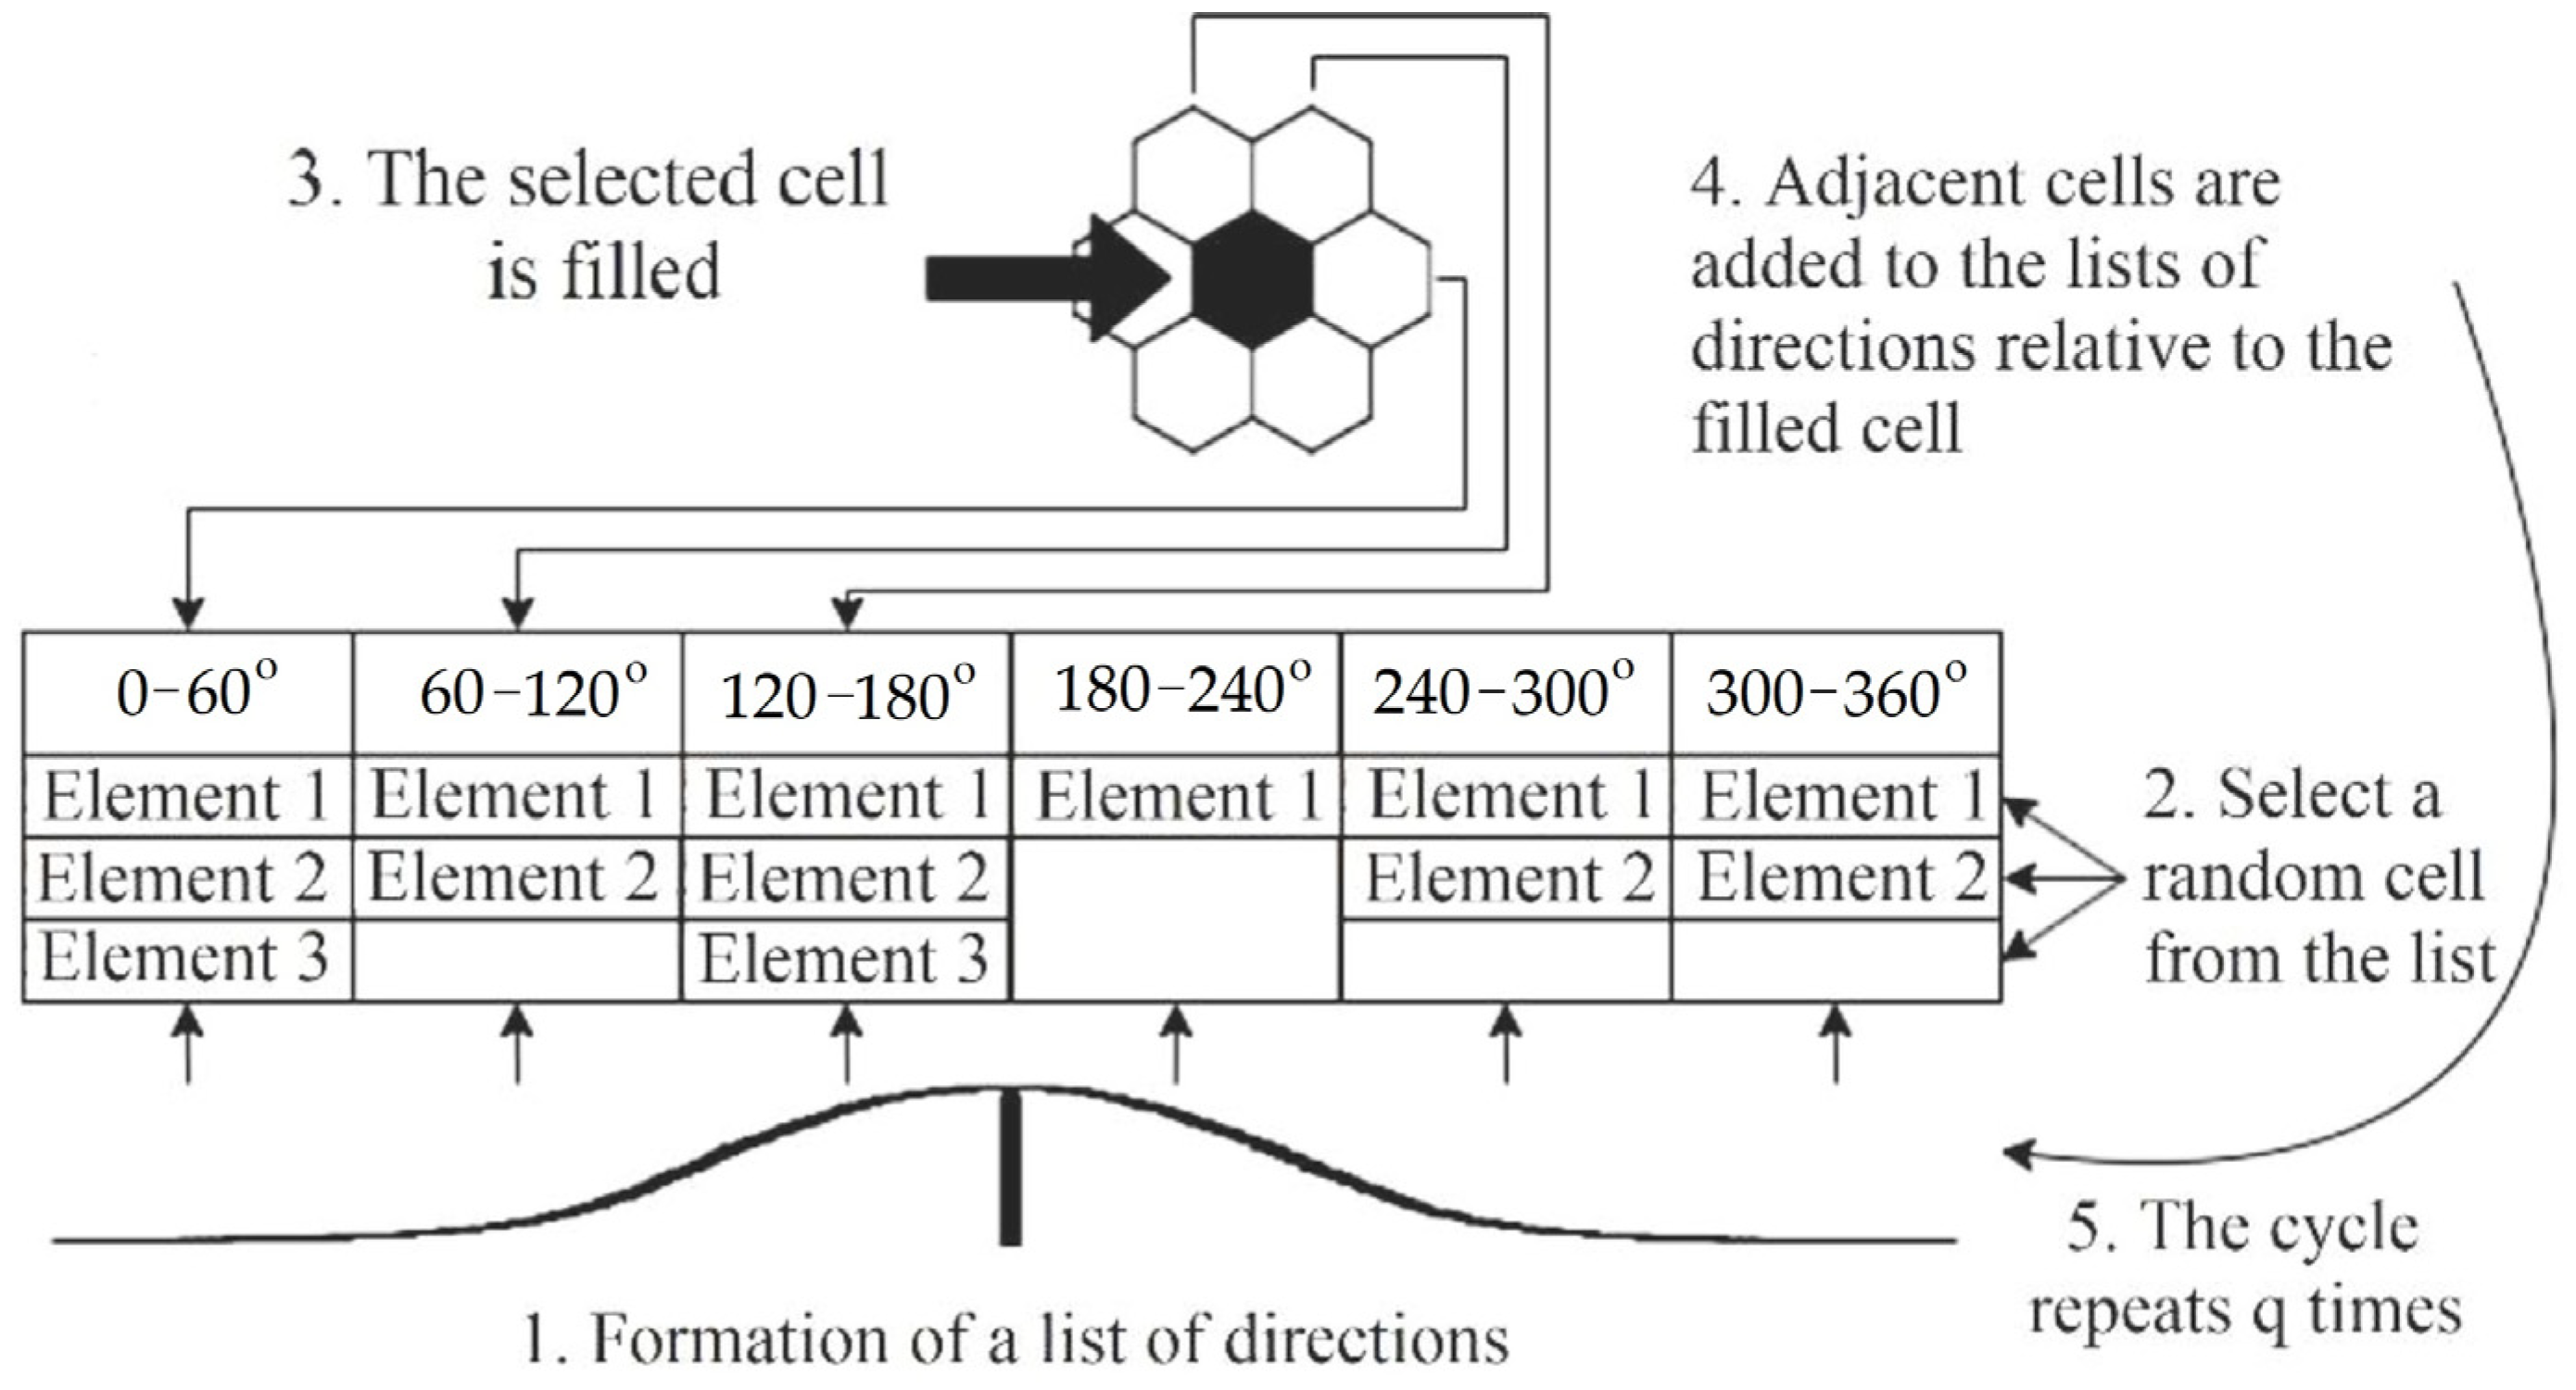
The algorithmic scheme of the modified frontal cellular automaton (Figure 2) includes several sequential steps.
Figure 2.
Formula for constructing the PS transition-direction list in the frontal cellular automaton algorithm: wn is the Gaussian-distributed angular perturbation (mean 0, standard deviation σ); U is wind speed; the exponential factor weights each hexagonal neighbor by its alignment with the dominant wind direction [21].
Before describing each step, the key numerical parameters of the implementation are specified for reproducibility. The computational domain is discretized into a regular hexagonal grid with a default cell side length h = 10 m (adjustable from 5 m to 50 m via application settings). The domain size is Nrow × Ncol = 200 × 200 cells by default, covering a 2 km × 2 km area, sufficient for the accident scales considered. The time step is Δt = h/(Uadv + Udif), where Uadv is the wind advection speed projected in the dominant propagation direction and Udif is an effective diffusion velocity estimated from the Pasquill–Gifford atmospheric stability class; for typical conditions (U = 2–5 m/s, stability class D), this gives Δt = 1–3 s. Monte Carlo convergence is assessed by monitoring the variance of the running mean of the dangerous zone length: sampling terminates when the relative change over five consecutive iterations falls below 1%, which is satisfied in 40–60 iterations for the tested scenarios. The concentration at each free cell is updated as C(t + Δt) = C(t) + ΔCadv + ΔCdif − ΔCdep, where ΔCadv is the advective flux from upwind hexagonal neighbors, ΔCdif is the Fickian diffusive exchange with all six neighbors, and ΔCdep is the dry deposition sink (deposition velocity vd = 0.01 m/s for gaseous species). Cells marked as solid obstacles (buildings) are assigned C = 0 and excluded from the update; particles arriving at an obstacle cell are reflected to the nearest free cell.
The first step is to form a list of PS transitions, which is constructed using calculation Formula (4).
where wn is a normally distributed random variable that specifies the stochastic perturbation of the transition angle (mean = 0; standard deviation σ calibrated from field data, typically σ = 0.3–0.6 rad); n is the index over the hexagonal neighborhood directions (n = 1…6). The transition probability list PS = {(Δrown, Δcoln, wn)} represents the set of candidate neighbor cells together with their normalized transition weights. nm is a set of PL transitions that depend on the number of cells interacting in the central cell’s neighborhood pattern. In particular, in the von Neumann environment, this corresponds to nm = 4, and in the Moore environment, nm = 8. In this behavior, as in the previous one [21], we used a hexagonal two-dimensional grid pattern with nm = 6.
Each weight wn is computed as the product of a Gaussian angular factor exp(−Δθ2/2σ2) and an advection term (1 + U cos Δθ), where Δθ = cellAngle − windDir + wn is the angular deviation between the candidate direction and the dominant wind direction. The Gaussian factor ensures that cells aligned with the wind receive higher weights, while the advection term introduces a linear boost proportional to wind speed U (m/s), physically reflecting the preferential downwind transport of the toxic cloud. Weights are subsequently normalized so that their sum equals unity, enabling Monte Carlo sampling of the next propagation direction.
The second step is selecting an element of the initial list of PS directions. To find the index of the cell to be filled, a generator of random numbers uniformly distributed in the interval [0, 1] is used (Figure 2).
In the third step, the cell is filled: its state is updated, after which the emission region expands.
In the fourth step, the list of directions is updated: links to adjacent cells are added to it according to the hexagonal pattern, excluding already filled cells and barrier cells.
The isopleth plotting algorithm involves several steps. First, a separate data array is created for each concentration level, with the indices of all arrays being identical at the start. Next, during dispersion ellipse modeling, nn contaminant particles are generated and moved. After this, all cells with concentrations below C ≤ C are removed from the array corresponding to the target level C*. What remains is the boundary of the hazardous contamination zone, displayed on the map as the C* isoline.
The fifth step is to repeat the calculation cycle.
Representing the data as a “family” of isolines improves the stability of frontal cellular automaton modeling of a hazard zone. Each isoline is constructed using a limited array of cells, the size of which is determined by the area of the contaminated zone (in sectors).
2.4. Review of Software Products for Modeling Fire Spread Based on Cellular Automata Models
In recent years, a number of software implementations of cellular automata models of fire propagation have been developed, primarily running on desktop computers running MS Windows. The authors’ review of modern software products in the field of fire safety and firefighting visualization is presented below:
1. PROPAGATOR (developed by CIMA Research Foundation) is an operational model for forest fire propagation prediction. The system uses an accelerated Numba-based kernel and supports stochastic modeling [33]. The program supports various types of combustible materials (13 models according to the Anderson classification), takes into account the influence of wind and terrain, is able to specify multiple ignition sources, and works with GeoTIFF raster data.
2. Cell2Fire, developed by an international group of researchers (University of Chile, University of Toronto, UC Davis), is an open-source cellular simulator of forest fire propagation [34]. It allows for more accurate modeling of elliptical fire spread contours, support for parallel computing, and statistical analysis of modeling results.
3. PyTorchFire (developed by Meta) is a modern forest fire simulator with support for GPU acceleration and differentiable cellular automata [35]. Key features of this software package include: the use of the PyTorch framework for implementing calculations, millisecond performance in real-world scenarios, and the ability to calibrate parameters.
4. Predict and Contain is a research project and software developed by an international team of students and researchers. The project implements real-time visualization of fire spread in open areas using Matplotlib 3.10.9 [36]. The software allows for the creation of 2D maps with spatial discretization, consideration of landscape type (forest, road, etc.), and color visualization of the current state of cells.
All of the cellular automata-based software products presented above are designed to model open-air fires, including forest fires, and allow for the construction of the fire spread zones. However, the spread of chemical combustion products in the form of a toxic cloud is insufficiently reflected in cellular automata-based models, with the exception of our proposed FireSoft III software product [21]. In turn, among the mobile applications we described previously, there are no cellular automata-based software products.
2.5. Algorithms for Calculating the Contours of a Hazardous Cloud for Modeling Based on Cellular Automata
The cellular automaton algorithm with simulated particle flight takes into account the effects of terrain development; it ensures the stability of solutions and a low level of numerical diffusion errors. Disadvantages include reduced performance due to the simulation of particle flight; for small values of scattering variance, algorithms with von Neumann neighborhoods lead to the distortion of cloud shape [37].
The empirical cellular automaton algorithm ensures high computation speed and the absence of “noise” in the modeling results, stable boundaries of the modeled region, and the ability to take the wind field into account. A disadvantage is the reduced forecast information content.
A modified frontal cellular automaton algorithm increases the processing speed of data when calculating the contamination zone in the case of complex obstacle configurations. Disadvantages include a reduction in the stability of modeling results and limited ability to simulate near-wall wind.
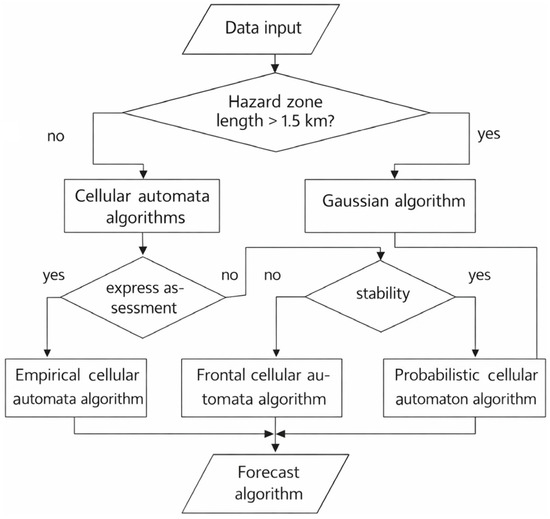
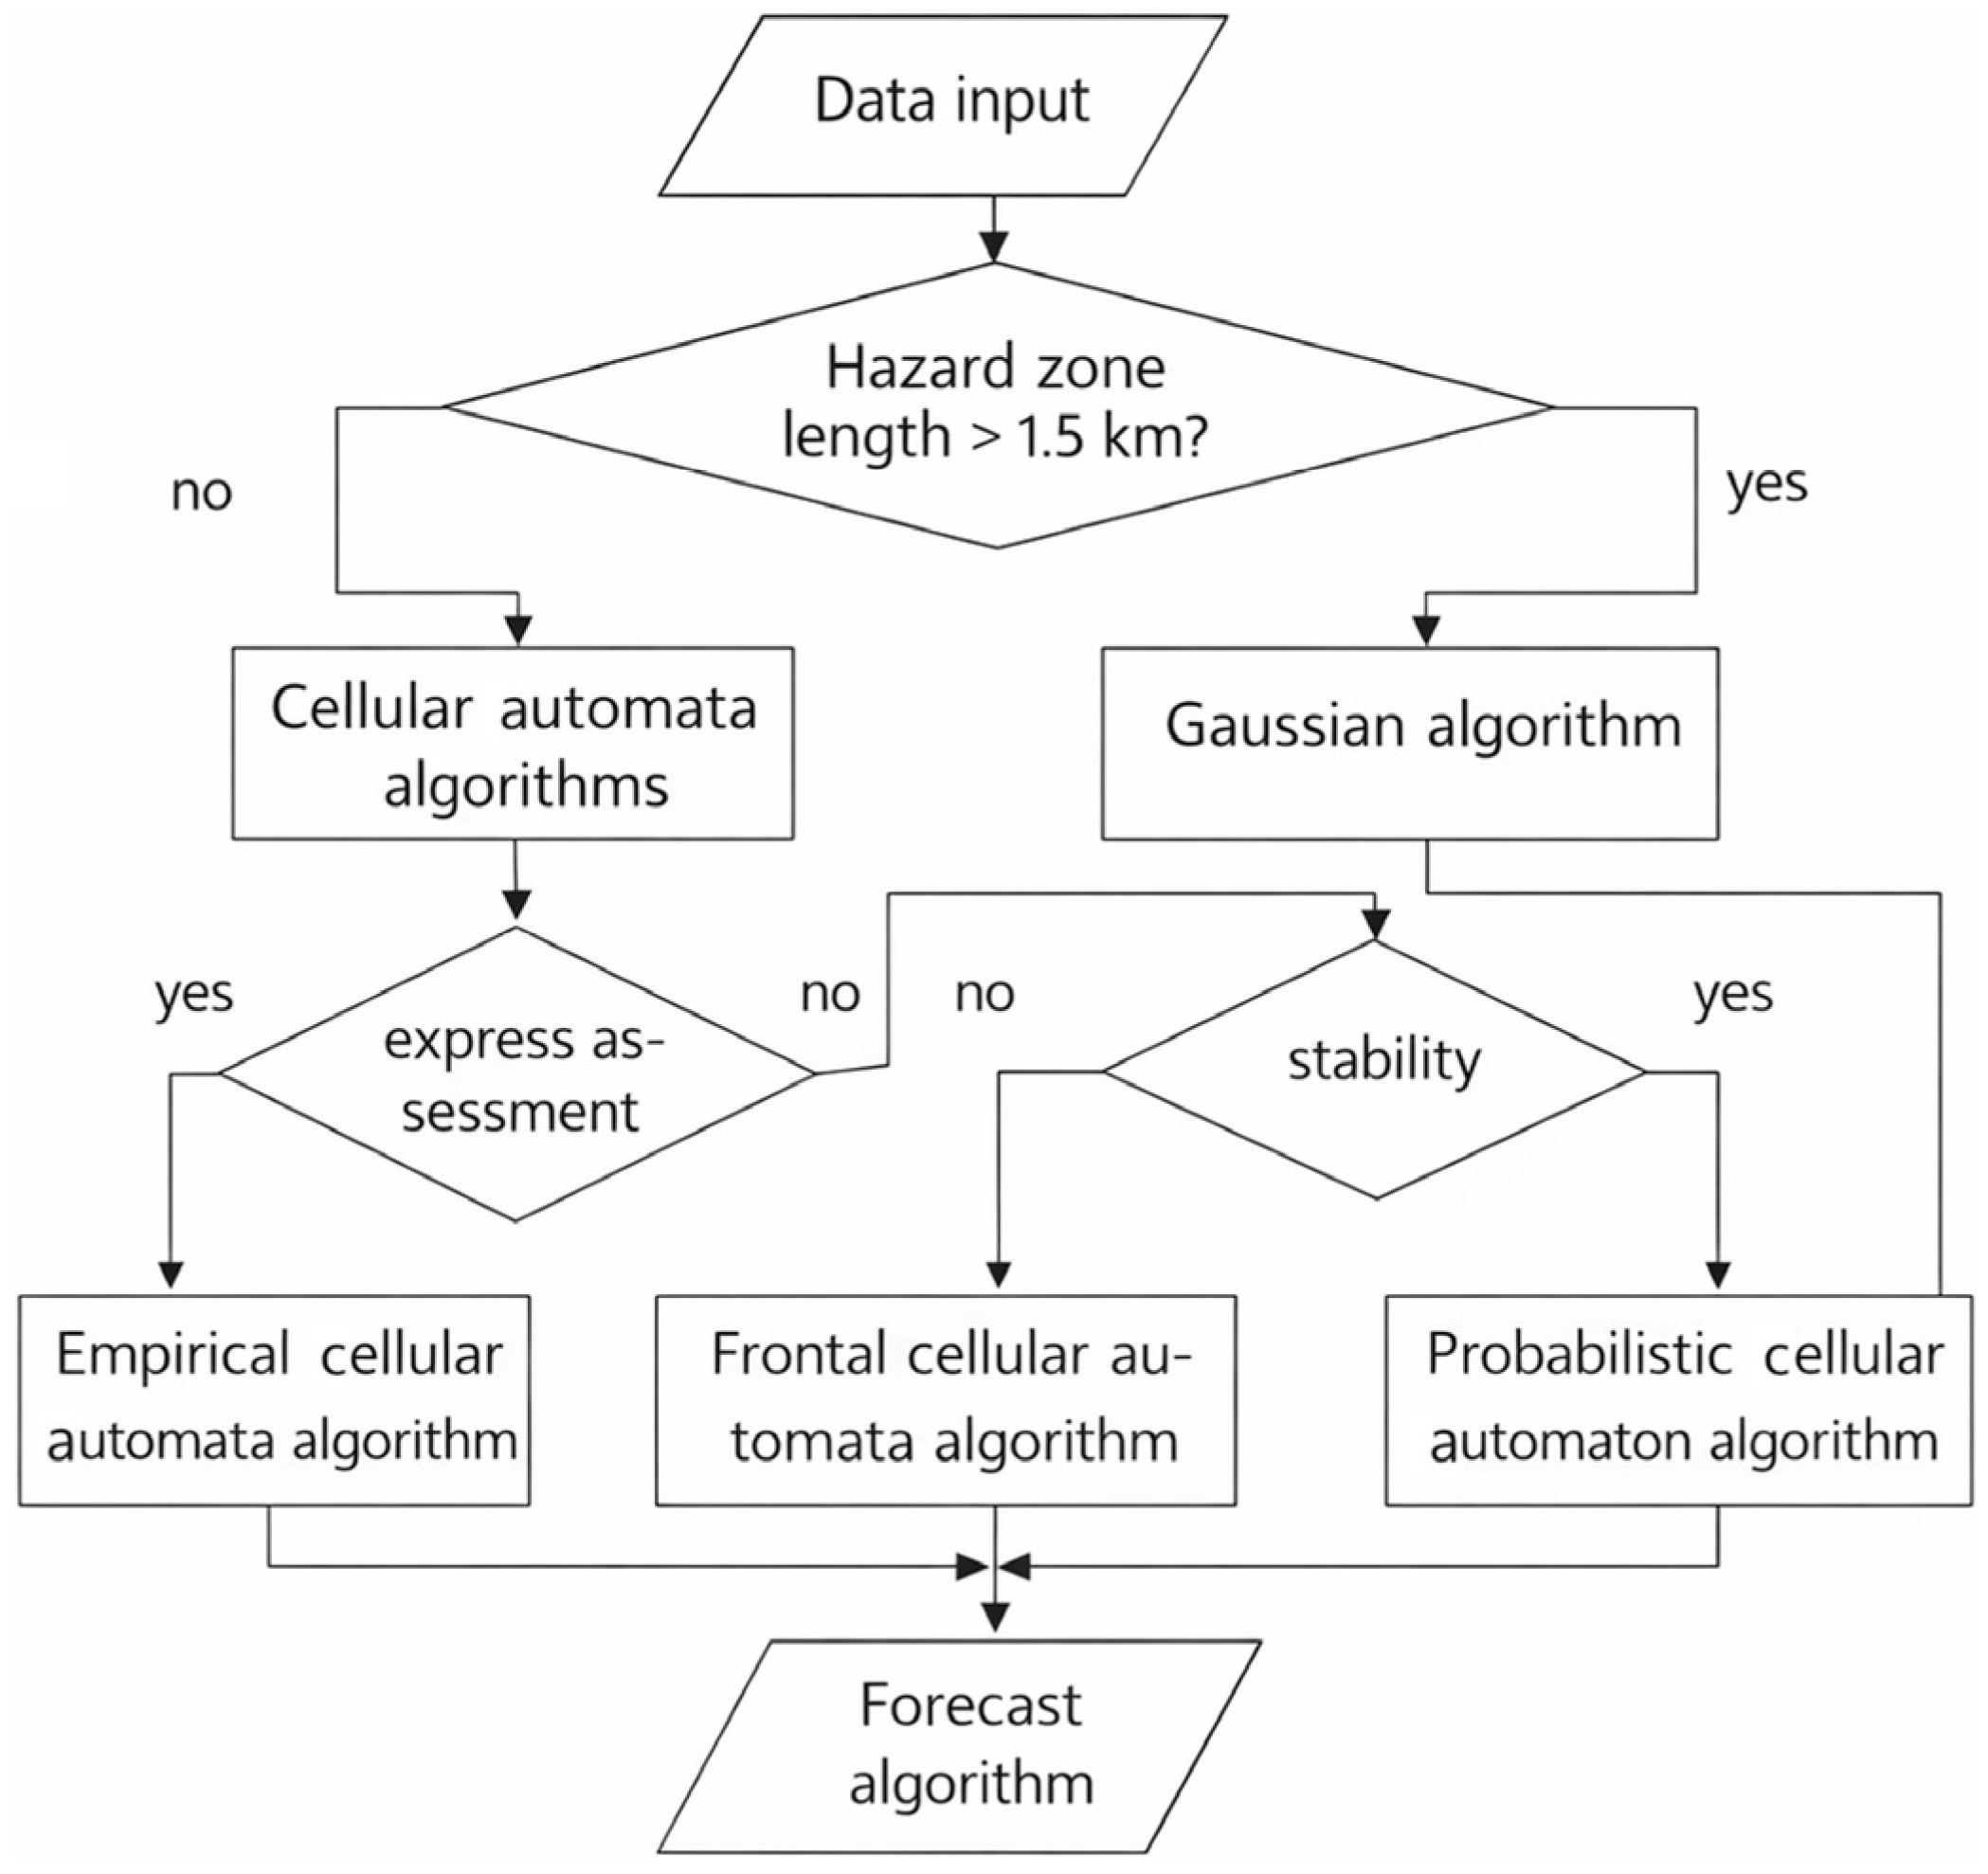
Considering advantages and disadvantages of different cellular automata algorithms, a forecasting algorithm selection scheme was developed (Figure 3). The input data for selection are reference measurements of hazardous substance concentrations and forecasting requirements. The threshold value of dangerous zone length L > 1.5 km used in Figure 3 as a decision criterion is grounded in two complementary considerations. First, regulatory emergency planning zones for large chemical facilities (e.g., Russian standard GOST R 22.0.05) prescribe a minimum protective action distance of 1.0–1.5 km for Class I hazardous substances (ammonia, chlorine) under neutral atmospheric stability. Second, analysis of case studies computed with FireSoft III [21] showed that, for sources with emission rates exceeding 1 kg/s, the zone where the time-averaged concentration remains above the MPC consistently extends beyond 1.5 km under moderate wind conditions (U = 2–5 m/s). Below this distance the probabilistic cellular automaton is sufficiently accurate (mean absolute error < 8% vs. benchmark CFD); beyond it, the frontal cellular automaton is required to capture nonlinear advection dynamics correctly.
Figure 3.
Schematic diagram of the selection of the cellular automaton forecasting algorithm based on the scale of the hazardous zone (L, km) and forecasting accuracy requirements. The 1.5 km threshold separates the operating domains of the probabilistic and frontal cellular automaton variants; the dashed branch indicates the fallback to the empirical algorithm for rapid screening.
The choice of a specific algorithm depends on the scale of the accidental release’s consequences, the requirements for calculation speed and forecast information content, and the ability to account for specific dispersion factors:
- An empirical cellular automaton algorithm is used for rapid assessment of the operational situation during a localized accident;
- A probabilistic cellular automaton algorithm is selected to obtain more informative and stable forecasts during a localized accident;
- A frontal cellular automaton algorithm is used to generate an intermediate forecast for any accident scale.
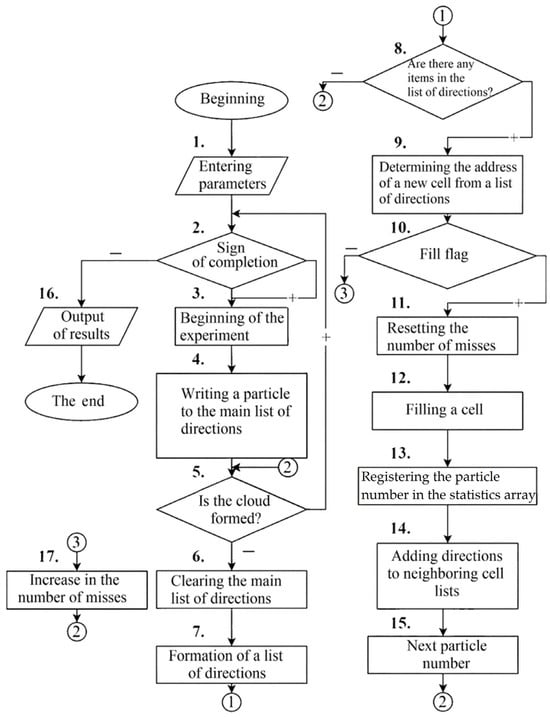
For the development of a mobile application, we believe it is advisable to use a frontal cellular automaton algorithm, which best meets the conditions for quickly updating the prediction of the size and visualization of the boundaries of the danger zone (Figure 4).
Figure 4.
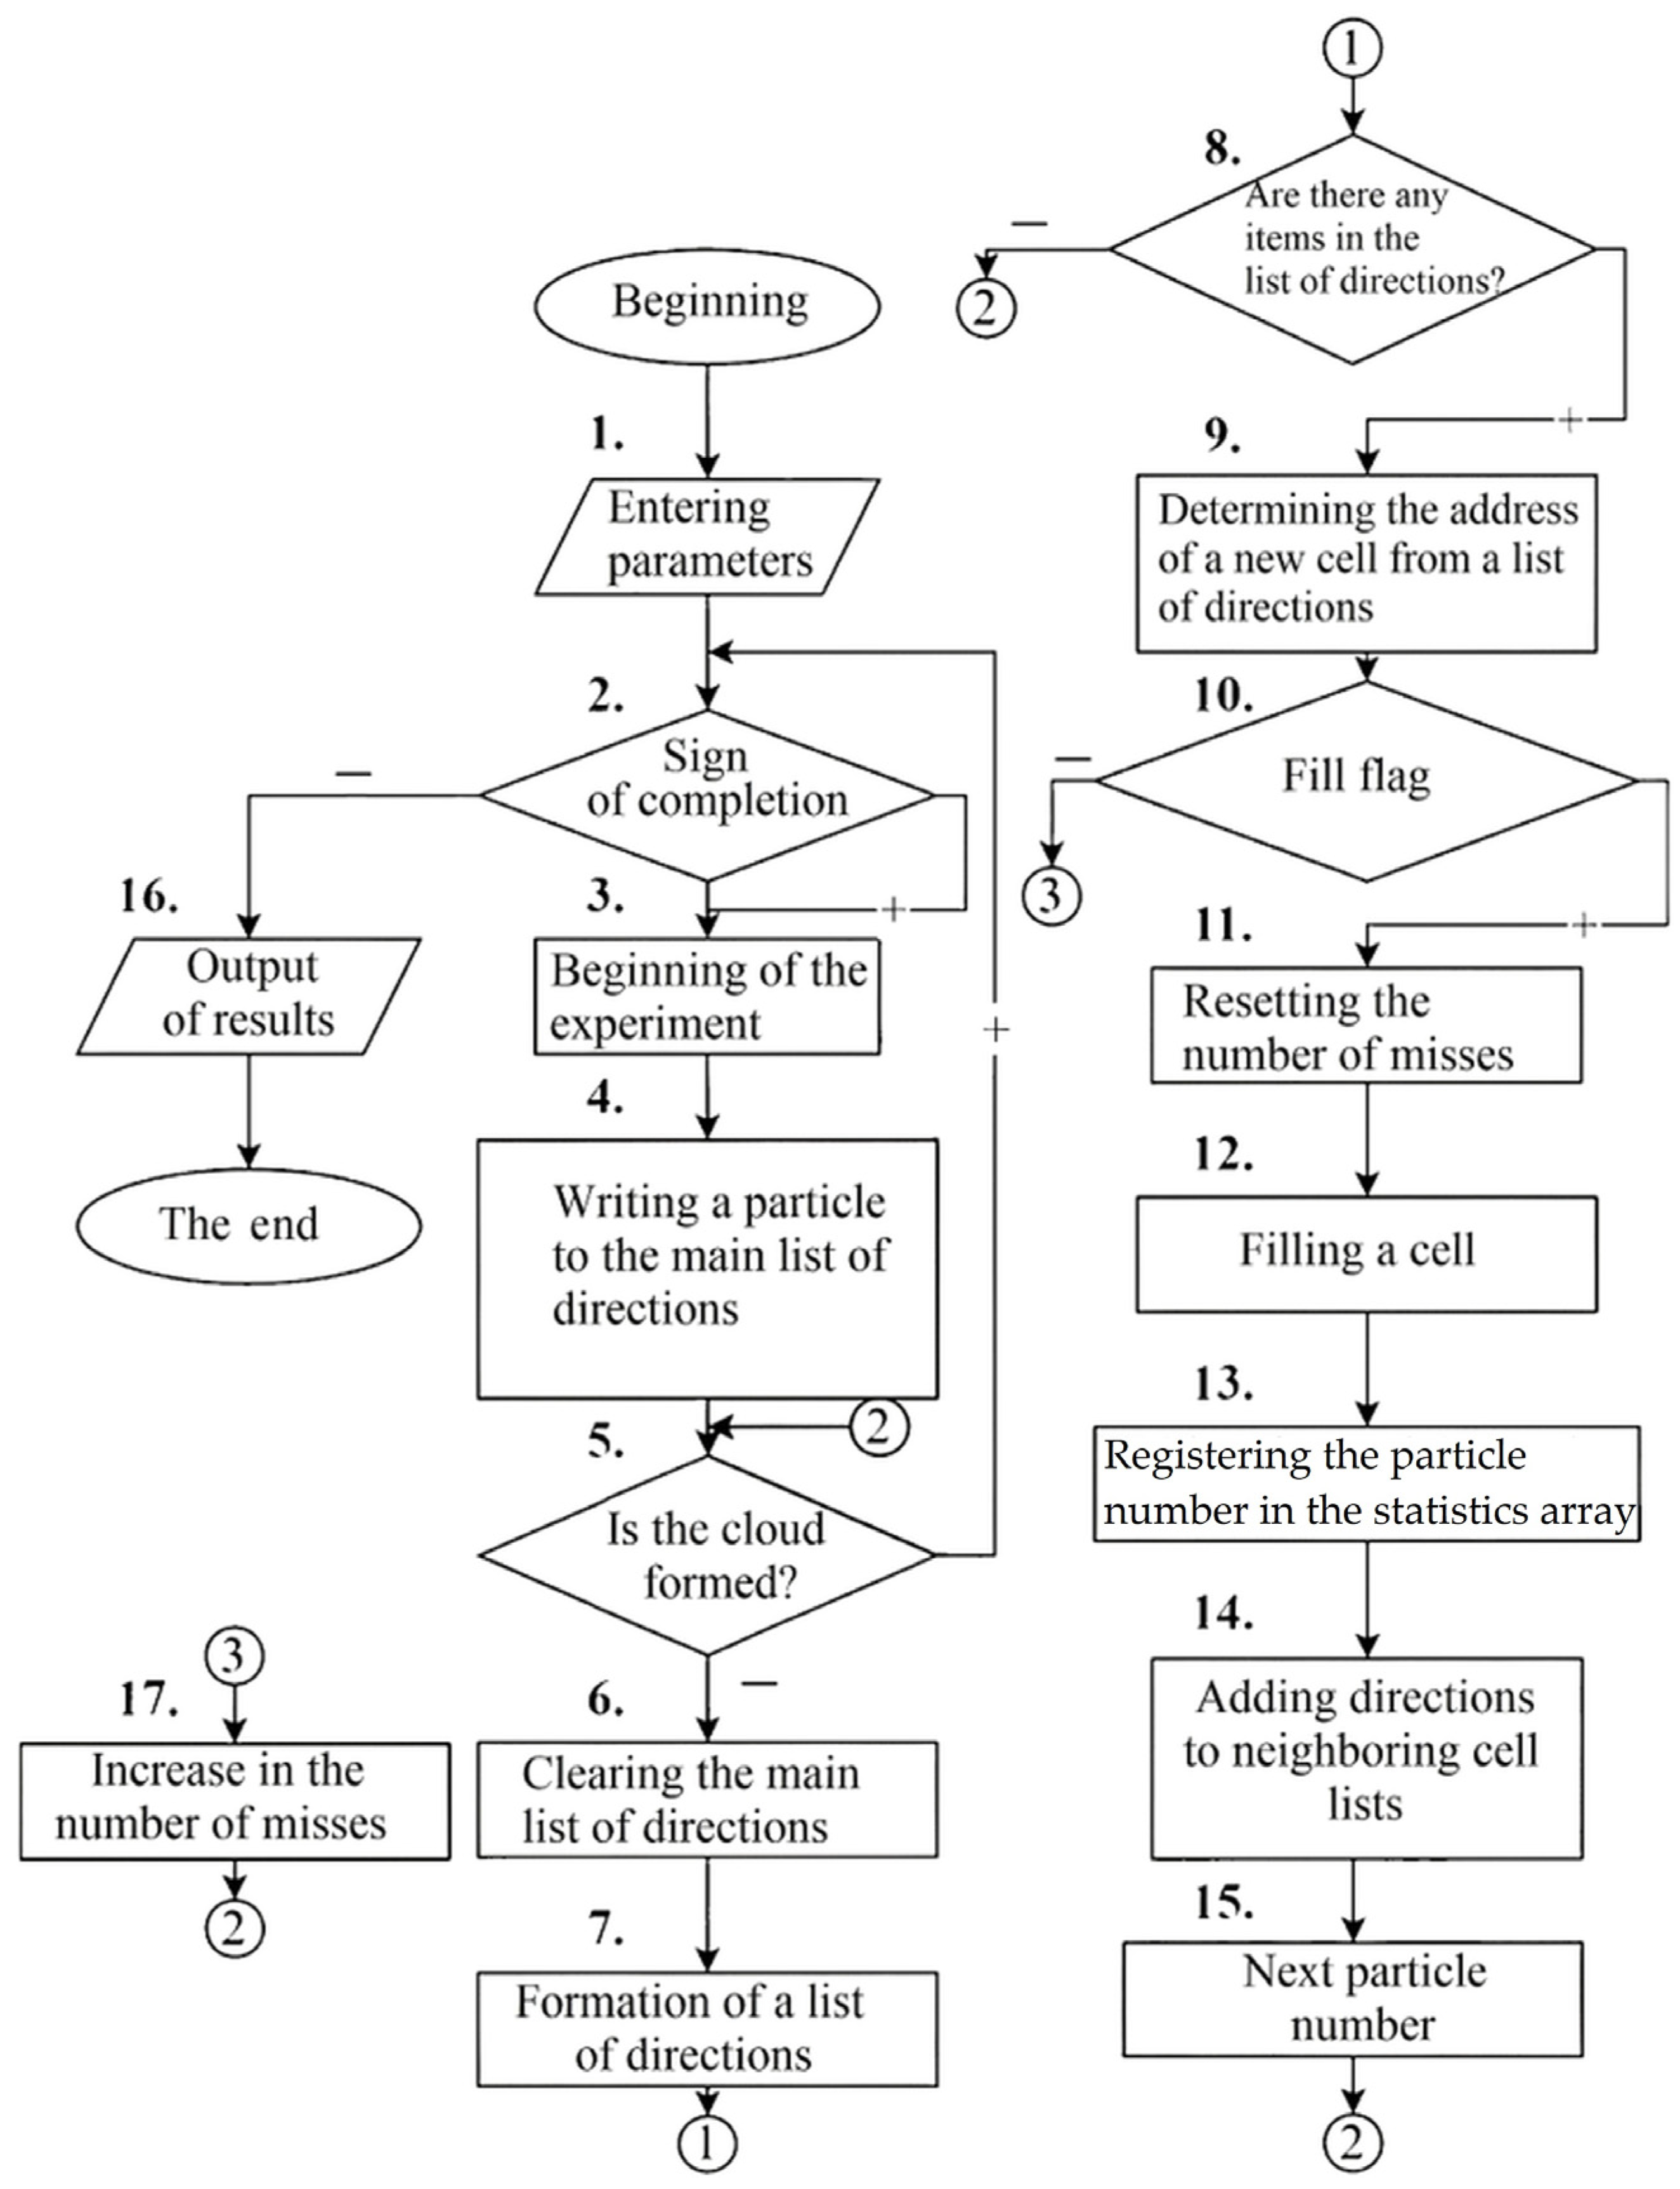
Flowchart of the frontal cellular automaton algorithm for calculating hazardous zone parameters during an industrial accident: initialization of particle positions and stopping criteria (blocks 1–2); stochastic direction-list generation via Monte Carlo sampling from the PS transition list (blocks 3–7); cell selection, occupancy check, and concentration map update (blocks 9–17) [21].
The calculation begins with entering the parameters (block 1) and specifying the stopping criteria (block 2). The number of experiments is chosen to ensure stable results with reasonable time expenditures. If the experiments continue, block 3 resets (initializes) the variables for the next run. Block 4 determines whether the particle’s motion corresponds to the existing list of directions. Block 5 checks whether the final result can be formed. If the cloud has not yet been created, the master list of directions is reset (block 6) and recalculated (block 7) according to the rules for normally distributed data. Next, the address of a new cell is selected (block 9) and checked to see whether it contains a toxic substance (block 10). The algorithm checks for the presence of an impurity in the selected cell. If the cell is empty, a sequence of actions is performed: resetting the miss counter (block 11), filling the cell with the cloud (block 12), registering the particle number in the statistics array (block 13), adding all neighbors of the given cell to the direction lists (block 14), and updating the particle index (block 15). If the cell already contains an admixture, the miss counter is simply incremented by one (block 17).
3. Results
3.1. FireSoft Mobile as a Mobile Application for Rapid Visualization of a Hazard Zone During an Accident at an Industrial Facility Based on Cellular Automata
The mobile application developed by the authors as a result of the study—FireSoft Mobile—is an extension of previously presented desktop version FireSoft III [21] and implements the function of predictive visualization of combustion product propagation, based not on the Gaussian model, but on a cellular automaton algorithm. Both cellular automata algorithms—probabilistic and frontal—were used in creating the application; the closest ones were accepted as the final values. The FireSoft Mobile development environment is Visual Studio 2022 with support for C# 10.0 and the .NET MAUI (Multi-platform App UI) framework, focused on creating cross-platform mobile applications for the Android platform. A built-in SQLite database is used for local storage of data on objects and accident parameters, which ensures completely autonomous operation of the application without connecting to a remote server.
FireSoft Mobile extends FireSoft III [21] in three key respects that constitute the principal innovative contribution of the present work. First, FireSoft III is a desktop Windows application requiring a workstation; FireSoft Mobile runs natively on Android 8.0+ devices, enabling on-site use by emergency personnel without access to a desktop computer or a network connection. Second, FireSoft III requires a skilled operator to interpret tabular numerical output; FireSoft Mobile overlays color-coded concentration isopleths directly on a live urban map with automatic MPC threshold comparison, making the result immediately actionable for non-specialist users. Third, FireSoft III performs a single deterministic run of the frontal cellular automaton; FireSoft Mobile adds a Monte Carlo ensemble layer (50 iterations by default) that quantifies result uncertainty and ensures convergence of the hazardous zone boundary estimate, as described in Section 2.3. These enhancements preserve the validated cellular automaton core of FireSoft III while transforming it into a rapid, mobile, uncertainty-aware field tool.
The FireSoft Mobile application architecture is implemented using the MVVM (Model–View–ViewModel) pattern, which ensures a clear separation of the cellular automaton computation logic from the display layer. The use of C# in conjunction with .NET MAUI enables the development of high-performance Android code with access to the platform’s native APIs. Asynchronous tasks (async/await) and parallel computing via TPL (Task Parallel Library) are used to optimize the computing load on the mobile processor. The database of accidents, explosions, and fires at industrial facilities is built on SQLite as a relational model, allowing for the retrieval of the data based on required parameters. Map data is accessed through the Mapsui library, which supports offline overlay of vector layers on raster map fragments.
FireSoft Mobile is designed for emergency response personnel (EMERCOM, rescue services), industrial safety engineers, ecologists, and risk management specialists at industrial facilities. The app is targeted at users who need quick mobile forecasting of hazardous chemical dispersion zones directly at the scene of an emergency (explosions, fires with toxic gas emissions: ammonia, dioxins, phosgene). Designed for Android mobile devices (version 8.0 and higher), it provides express calculations in the field, taking into account complex topography (buildings, obstacles). The app minimizes user expertise requirements through simplified touchscreen parameter input and visualization of results directly on the site map.
FireSoft Mobile, developed by the authors, differs from existing mobile applications for visualizing fire safety measures and equipment primarily in that it allows for the creation of models of toxic cloud spread from combustion products during a fire or explosion, rather than before it (i.e., modeling fire alarms, distributing flammable materials, and obtaining data about the facility where the fire occurred). Quantitative comparison of the frontal cellular automaton with other models is presented in Table 1, and computational performance of FireSoft Mobile on Android devices in Table 2.
Table 1.
Quantitative comparison of the frontal cellular automaton (FCA) in FireSoft Mobile with Gaussian, Eulerian, and Lagrangian dispersion models (ammonia release, Q = 2 kg/s; U = 3 m/s; stability class D; flat terrain; 200 × 200 cell grid, cell size 10 m).
Table 2.
Computational performance of FireSoft Mobile on representative Android devices (ammonia explosion scenario, 200 × 200 cell grid, 50 Monte Carlo iterations, offline/flight mode, 30 repeated runs per device).
As shown in Table 1, the frontal cellular automaton implemented in FireSoft Mobile achieves a mean absolute error of 10–18% relative to the CFD reference, a reduction of 15–25 percentage points compared to the classical Gaussian model (28–35%). This improvement derives from the explicit encoding of building obstacles at cell resolution and per-step concentration updates, both absent in the Gaussian model. The Eulerian model reaches lower errors (8–14%) but requires 120–600 s on a desktop workstation, precluding real-time mobile use. The Lagrangian model offers intermediate accuracy at acceptable desktop speed but is not adapted for Android. The frontal cellular automaton therefore represents the optimal balance between accuracy and computational efficiency for the mobile emergency-response context.
Table 2 confirms that FireSoft Mobile completes a full hazardous zone calculation in under 7 s even on entry-level hardware, and under 2 s on a flagship device. Peak RAM consumption remains below 115 MB across all tested devices, well within the Android 8.0 allocation limit. Zero crashes occurred across all 30 offline test runs per device, verifying the stability of the SQLite-based offline architecture. All output concentration values are expressed in mg/m3 for direct comparison with regulatory MPC thresholds; internal computation uses g/m3 units with automatic unit conversion at the display stage.
Furthermore, FireSoft Mobile provides a visualization accuracy no less accurate than other mobile applications and allows for the complete visualization of the simulated hazard zone (Table 3). However, the main fundamental difference is that FireSoft Mobile is designed specifically for modeling toxic clouds of combustion products overlaid on urban development.
Table 3.
Comparison of FireSoft Mobile with other mobile applications for visualizing fire safety and evacuation measures.
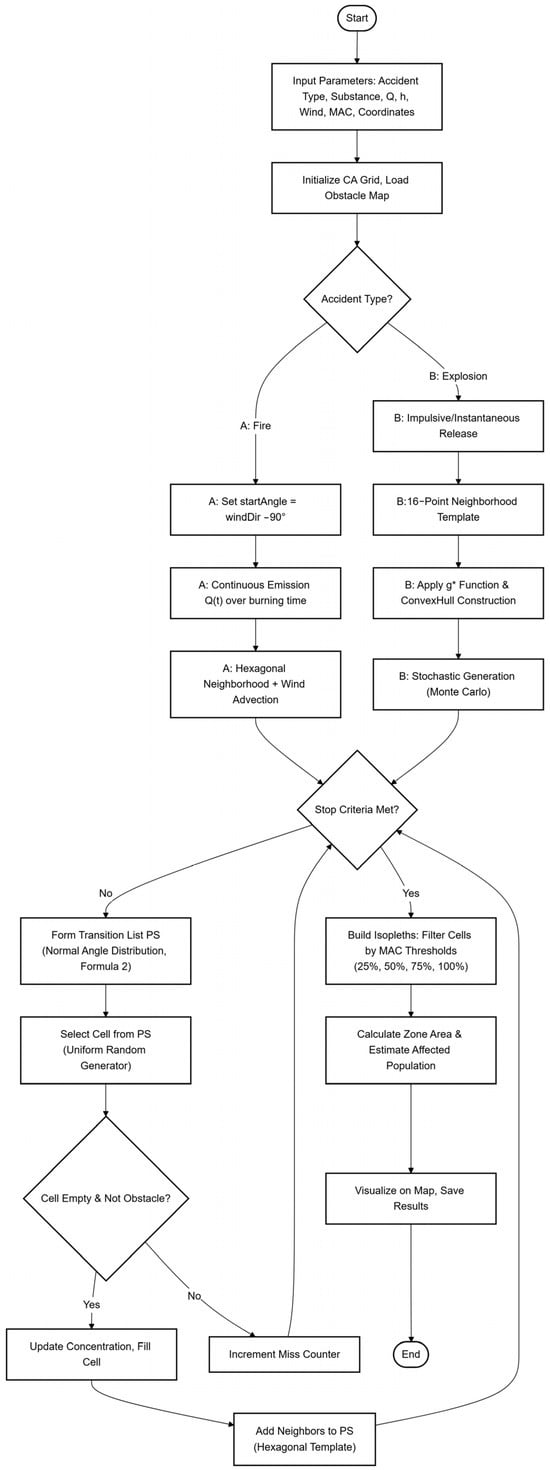
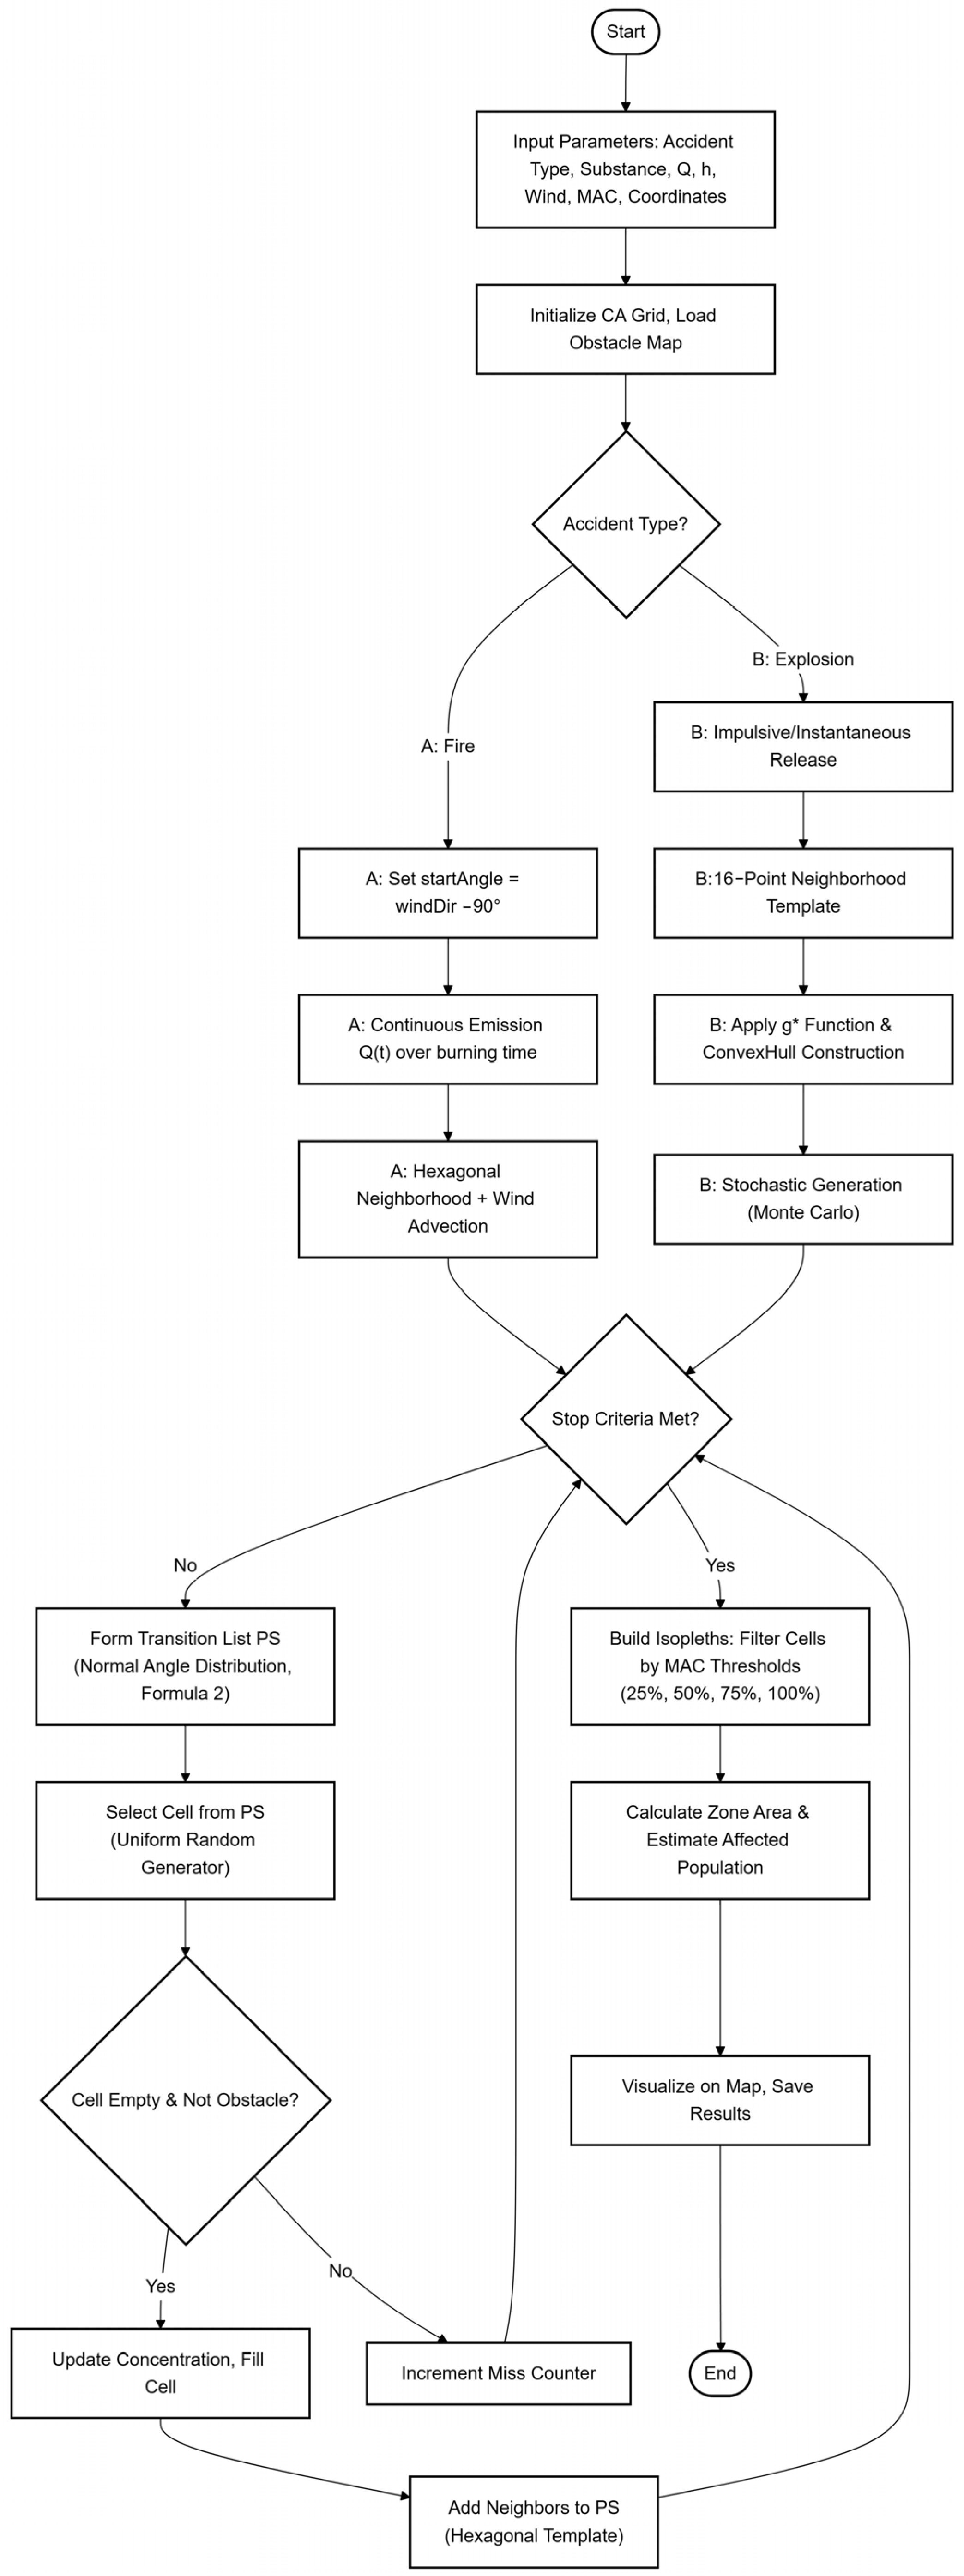
The algorithms for solving the problem of modeling the hazardous zone of toxic substance cloud propagation in the FireSoft Mobile application for an explosion-type and fire emergency are shown in Figure 5. The implementation of the algorithms is adapted for the Android mobile platform using asynchronous execution of computational tasks.
Figure 5.
Parallel flowcharts of the FireSoft Mobile hazardous zone calculation algorithms for two emergency types: (left) explosion—initialization of spherical shock-wave propagation, isopleth construction via frontal cellular automaton, and concentration map generation; (right) fire—continuous-source emission setup, probabilistic or frontal cellular automaton selection based on the L > 1.5 km criterion (Figure 3), and iterative isoline rendering. Both branches share the same SQLite map-overlay and color-coding output stage.
Examples of source code for a software tool for simulating a hazardous area during an industrial accident involving an explosion and/or fire are presented in Appendix A.
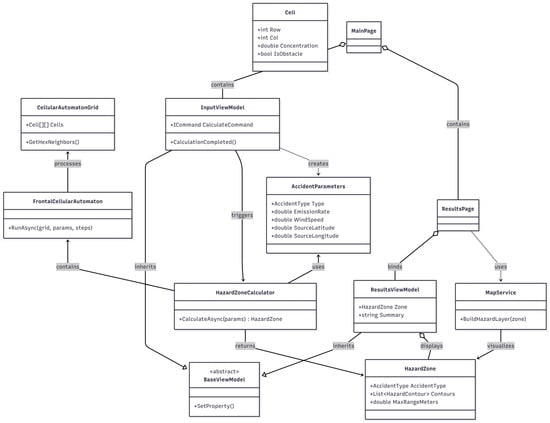
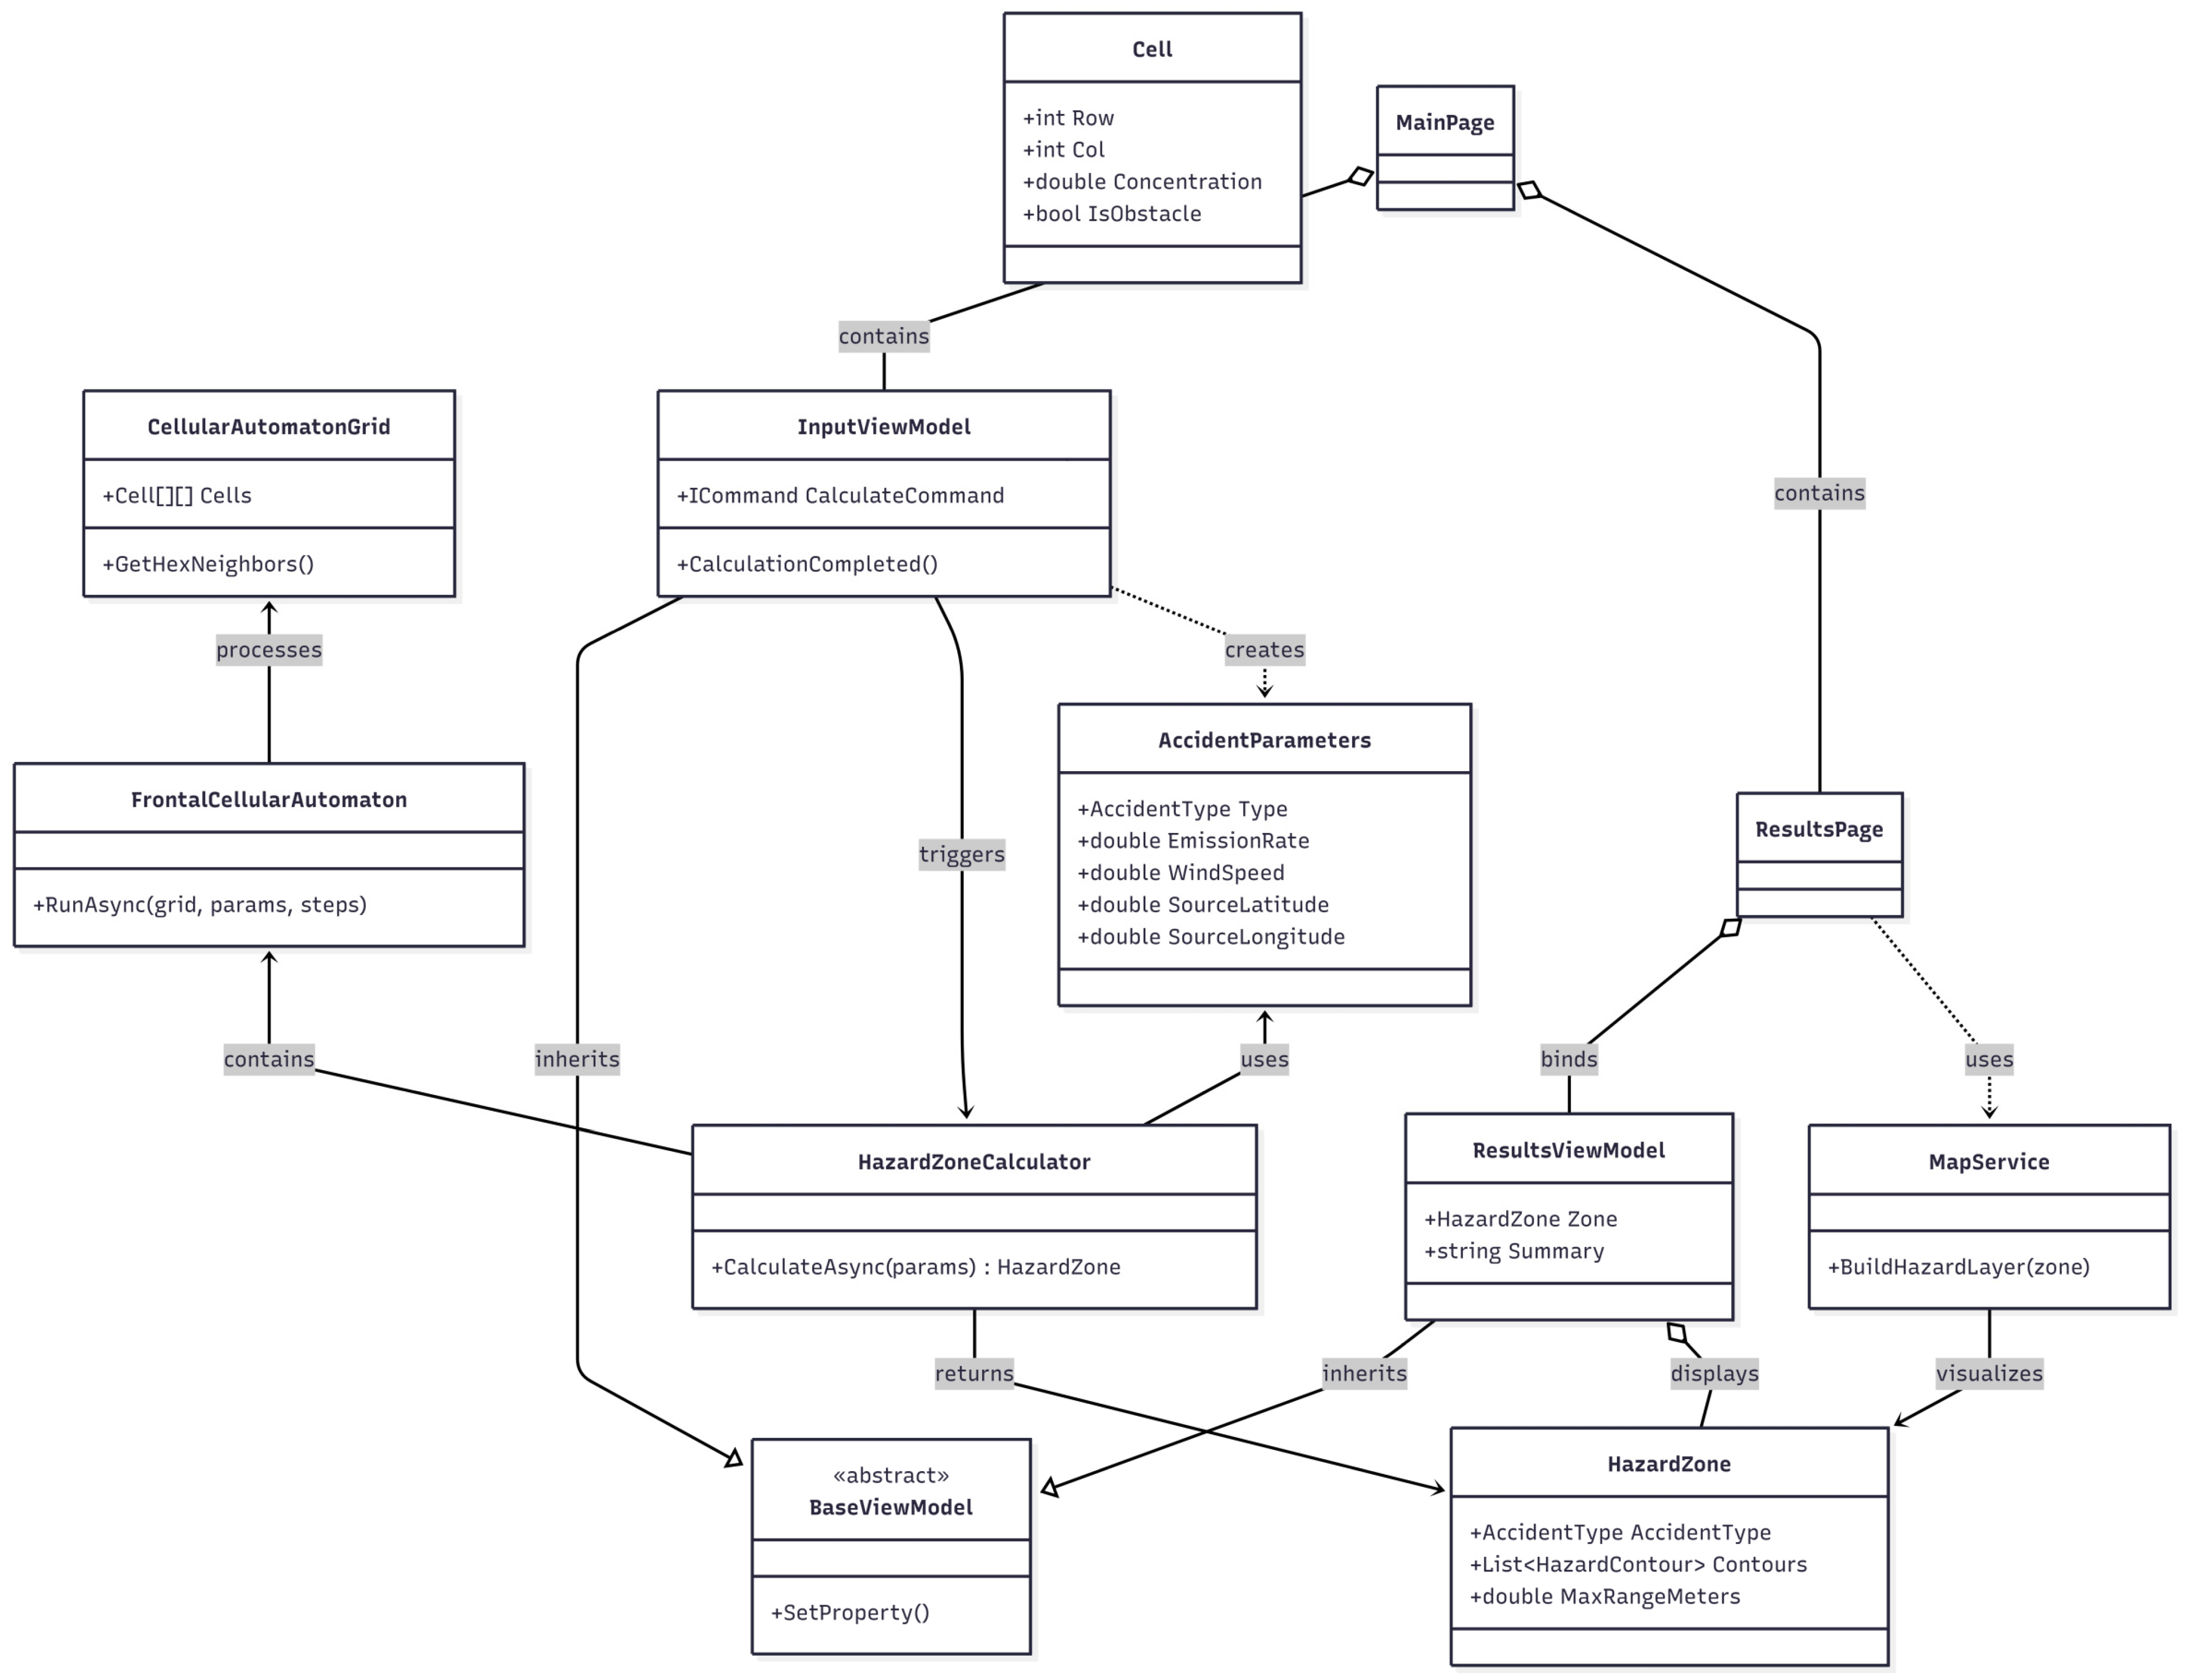
The class diagram used in FireSoft Mobile is shown in Figure 6.
Figure 6.
UML class diagram of the FireSoft Mobile application: core classes (HazardZoneModel, CellularAutomataEngine, MonteCarloSampler, MapRenderer), their attributes and methods, and inter-class associations; the SQLiteRepository class mediates all offline data persistence for maps, substance parameters, and scenario results.
Overall, FireSoft Mobile is optimized for real-time operation directly on a mobile device during a fire or explosion at an industrial facility. Unlike desktop versions, the mobile app provides immediate access to calculations anywhere in the evacuation zone, without requiring a desktop computer, and is the preferred tool for emergency services in urban areas.
To conduct a computational experiment modeling the spread of a toxic cloud, parameters defined by a standard set of input data were used. This set is generally accepted in accident impact assessments.
1. Parameters of the emergency (explosion, fire, or a combination of both): The simulation was performed for two accident scenarios—the explosion of a 25-ton railway tank car (releasing a cloud of toxic ammonia), and a fire involving 50 tons of polyvinyl chloride (PVC)—accompanied by the release of a number of highly toxic compounds into the atmosphere: phosgene and hydrogen chloride, which are highly toxic substances, as well as dioxins (carcinogens). The duration of the fire was 12 h.
2. The properties and quantity of the hazardous substance released into the environment: Dioxins are persistent supertoxicants with carcinogenic properties, causing chloracne and immunosuppression. Phosgene is an asphyxiant gas that causes delayed pulmonary edema. Hydrogen chloride (hydrochloric acid when in contact with water) causes chemical burns to the respiratory tract, eyes, and skin. All of these combustion products are highly hazardous to humans even at slightly elevated maximum permissible concentrations.
3. MPC in the air for populated areas: Dioxins—5 × 10⁻⁷ mg/m3; phosgene—2 × 10⁻³ mg/m3; chlorine–hydrogen—0.2 mg/m3. These values are extremely small, so the actual concentration in the cloud may exceed them by tens and hundreds of times.
4. Meteorological conditions and terrain: Wind speed—2.5 and 3.5 m/s; direction—south (explosion) and northeast (fire); temperature—18–20 °C. Terrain—urban development (distance between buildings 25 m, height 10 m).
5. Characteristics of the population at risk: The settlement is directly adjacent to the source of the cloud emission; population—1500 people; no more than 10% are provided with personal respiratory protective equipment.
The constants included in the model are density of PVC—1.37 t/m3, ammonia—0.68 t/m3, and temperature of intensive thermal destruction of PVC—350 °C [38].
3.2. FireSoft Mobile Software Interface
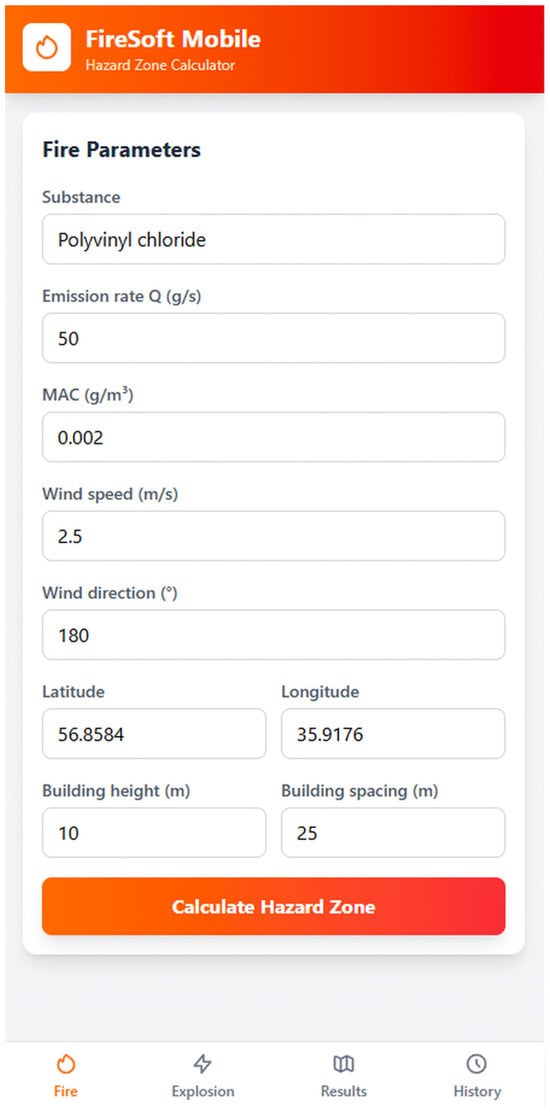
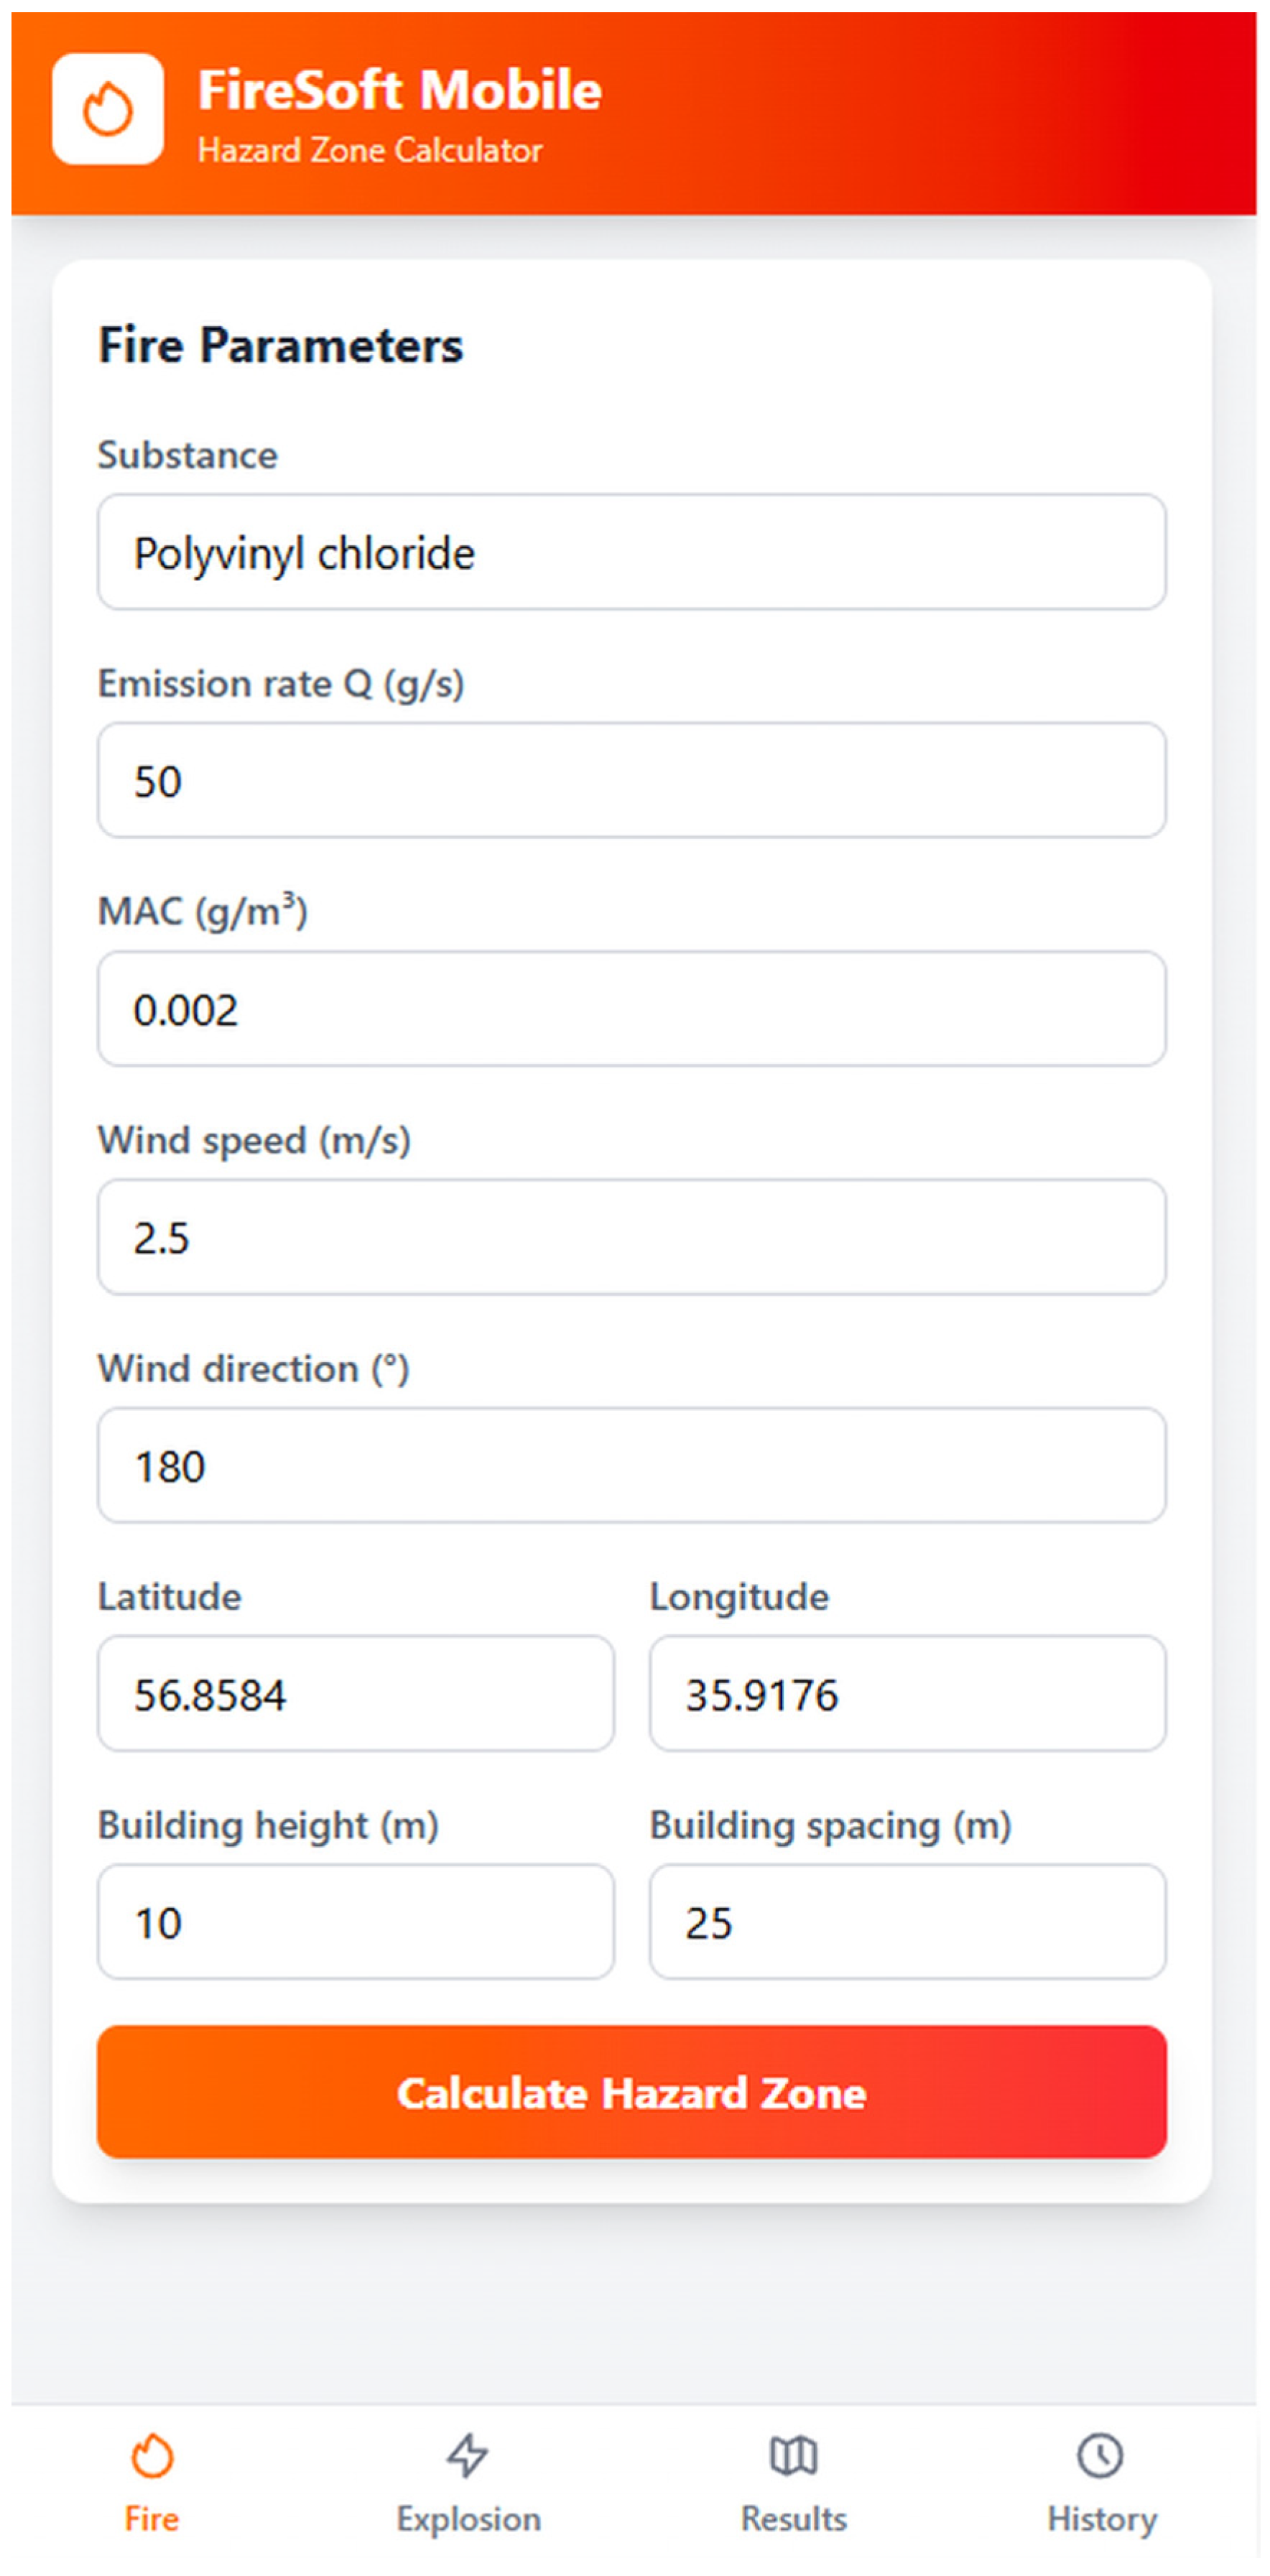
The FireSoft Mobile app features an intuitive interface optimized for use on Android smartphones and tablets. Navigation is via the bottom panel of tabs “Fire” and “Explosion,” which open the corresponding parameter entry screen. Entering input data to define a hazard zone for the “Fire” accident type is shown in Figure 7.
Figure 7.
FireSoft Mobile input screen for the “Fire” accident type: fields for substance name, emission rate Q (kg/s), wind speed U (m/s) and direction (degrees), atmospheric stability class (A–F), building height (m), and respiratory protection availability; the “Calculate” button triggers the cellular automaton engine.
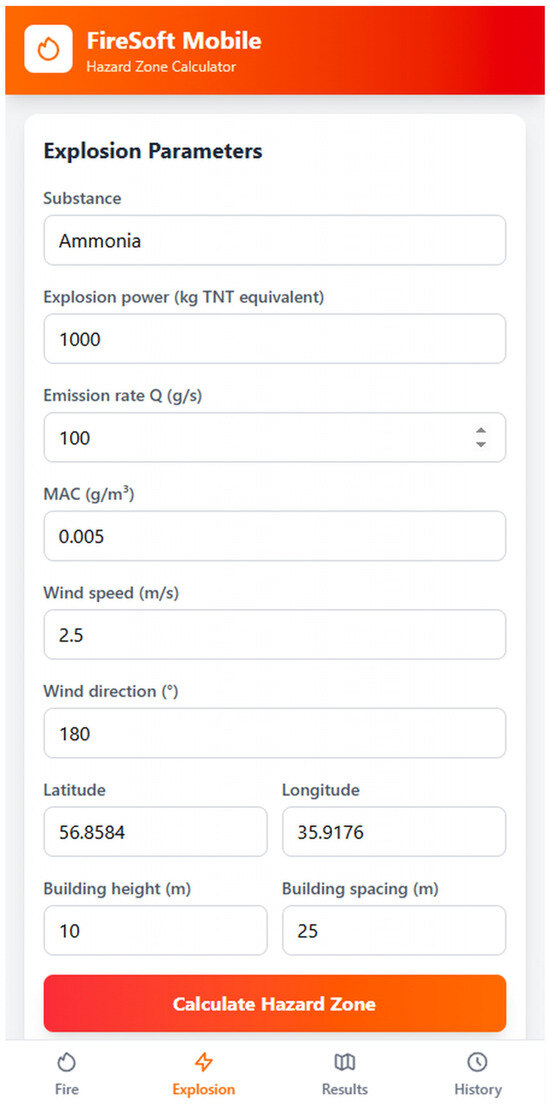
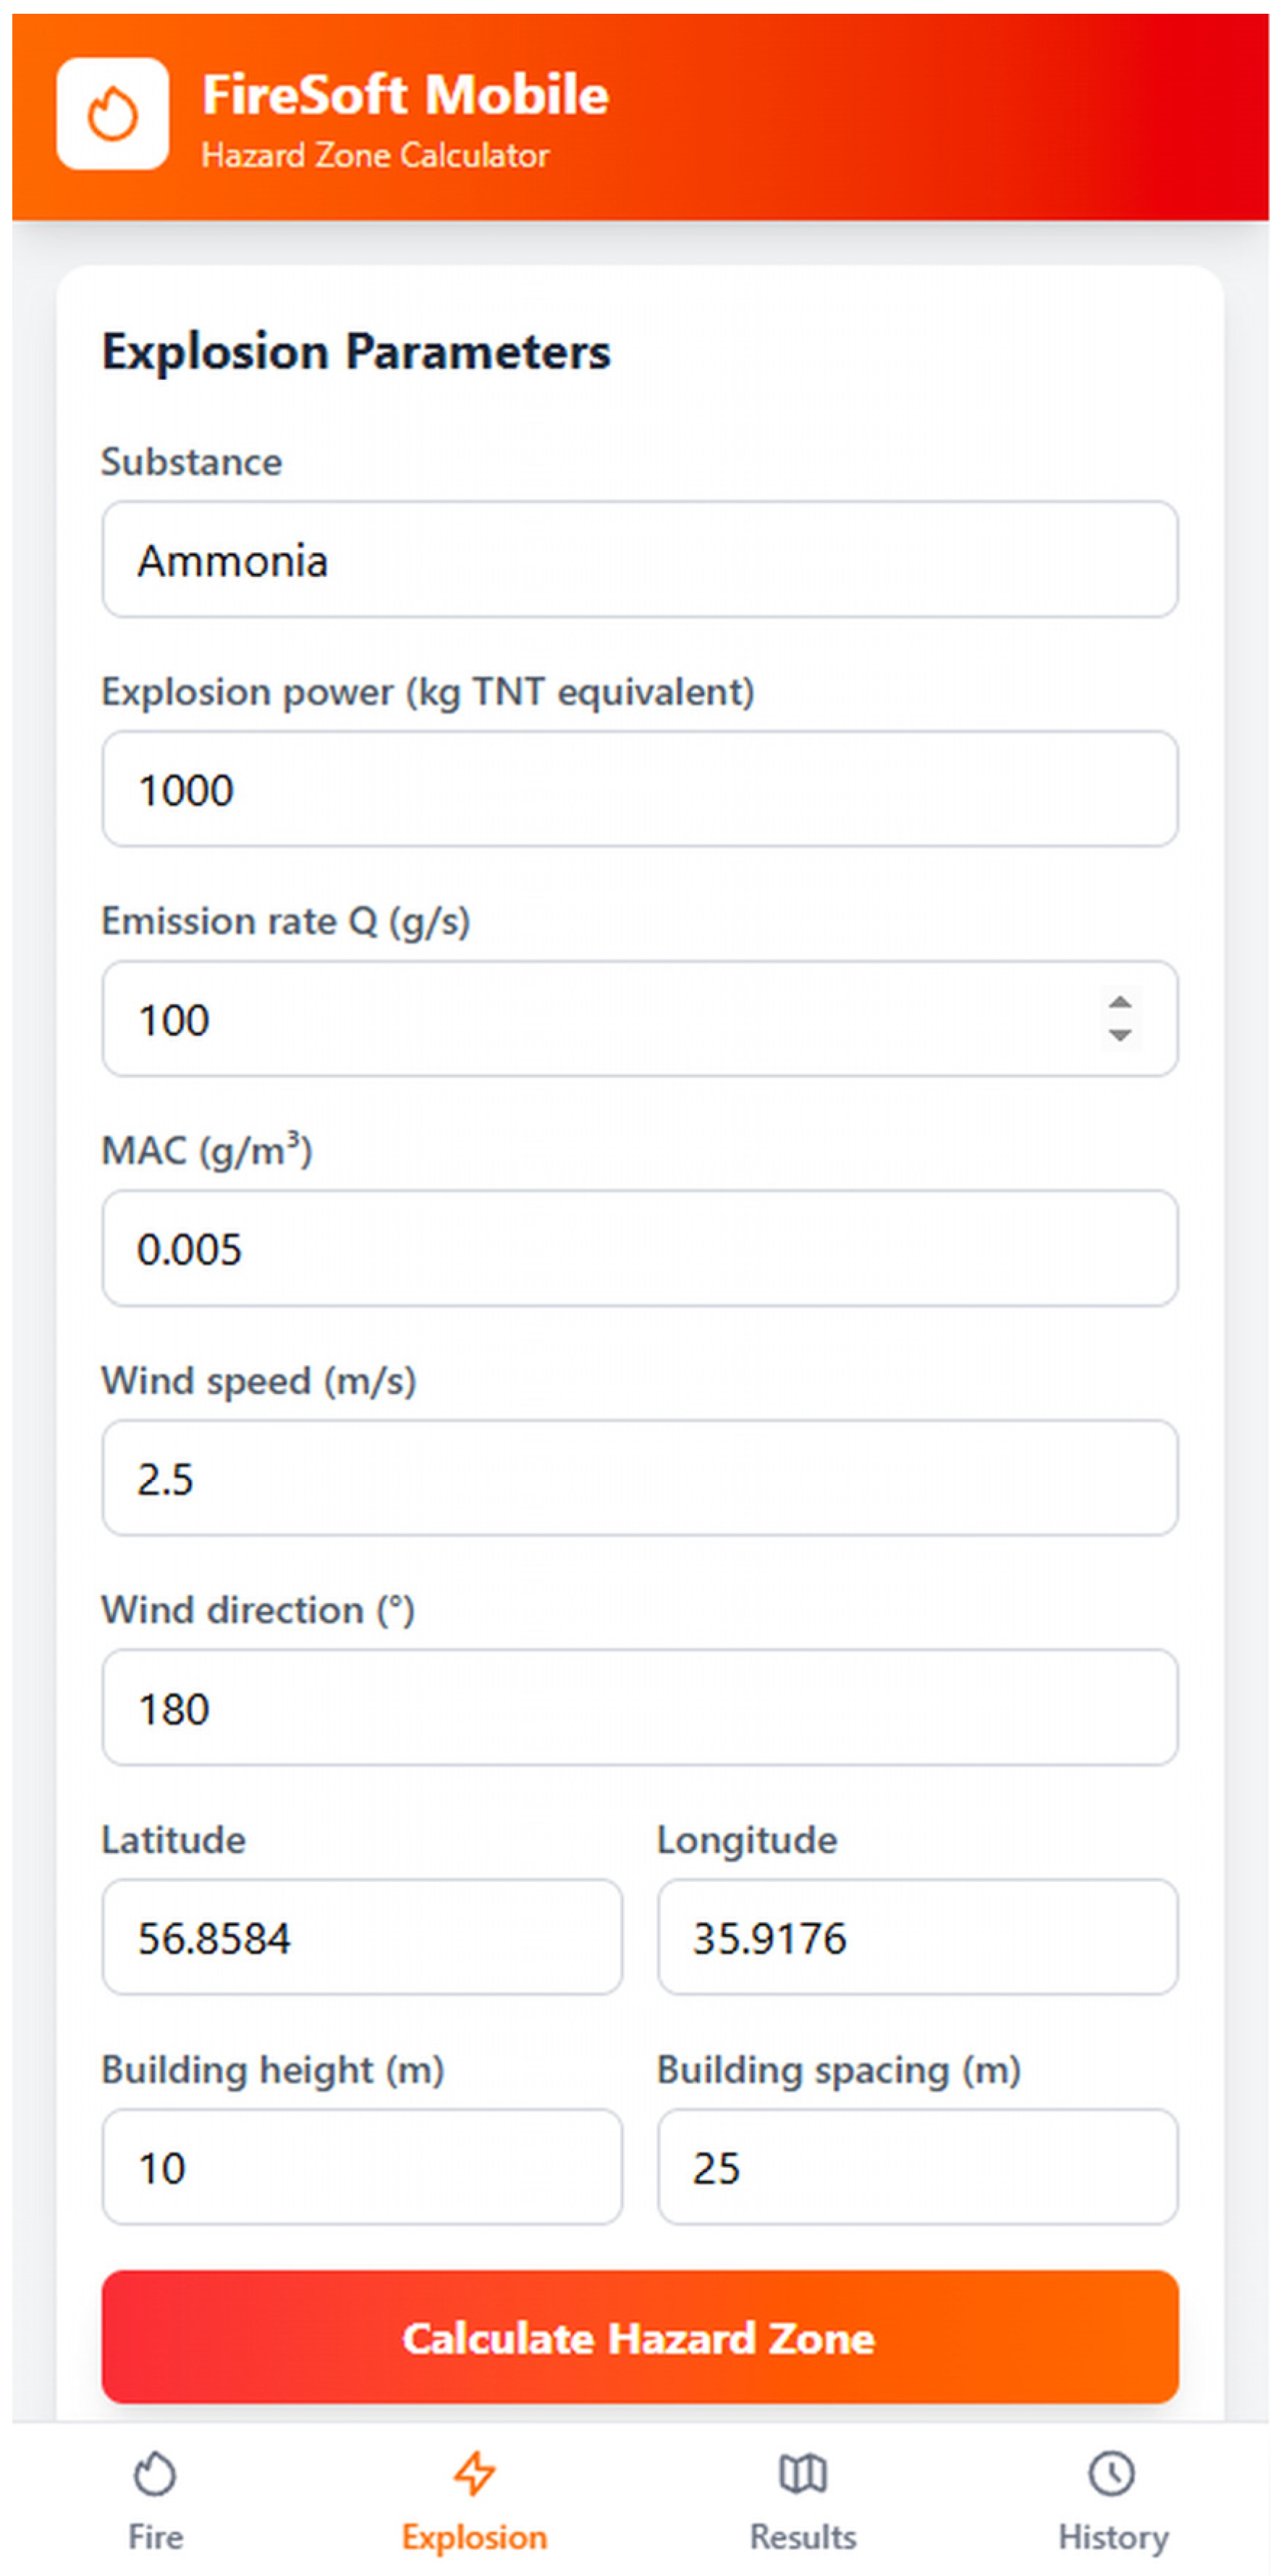
The input data for determining the hazard zone for an explosion-type accident is shown in Figure 8.
Figure 8.
FireSoft Mobile input screen for the “Explosion” accident type: fields for substance name and stored mass (kg), tank geometry, ignition fraction, wind parameters, terrain type, and occupancy density; output parameters include overpressure radius (m) and toxic zone length L (km).
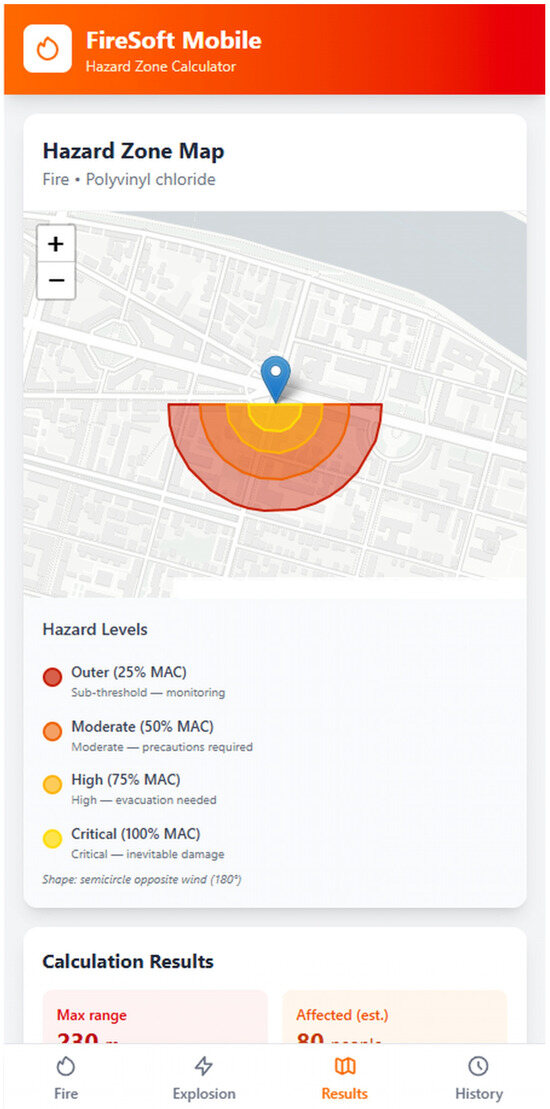
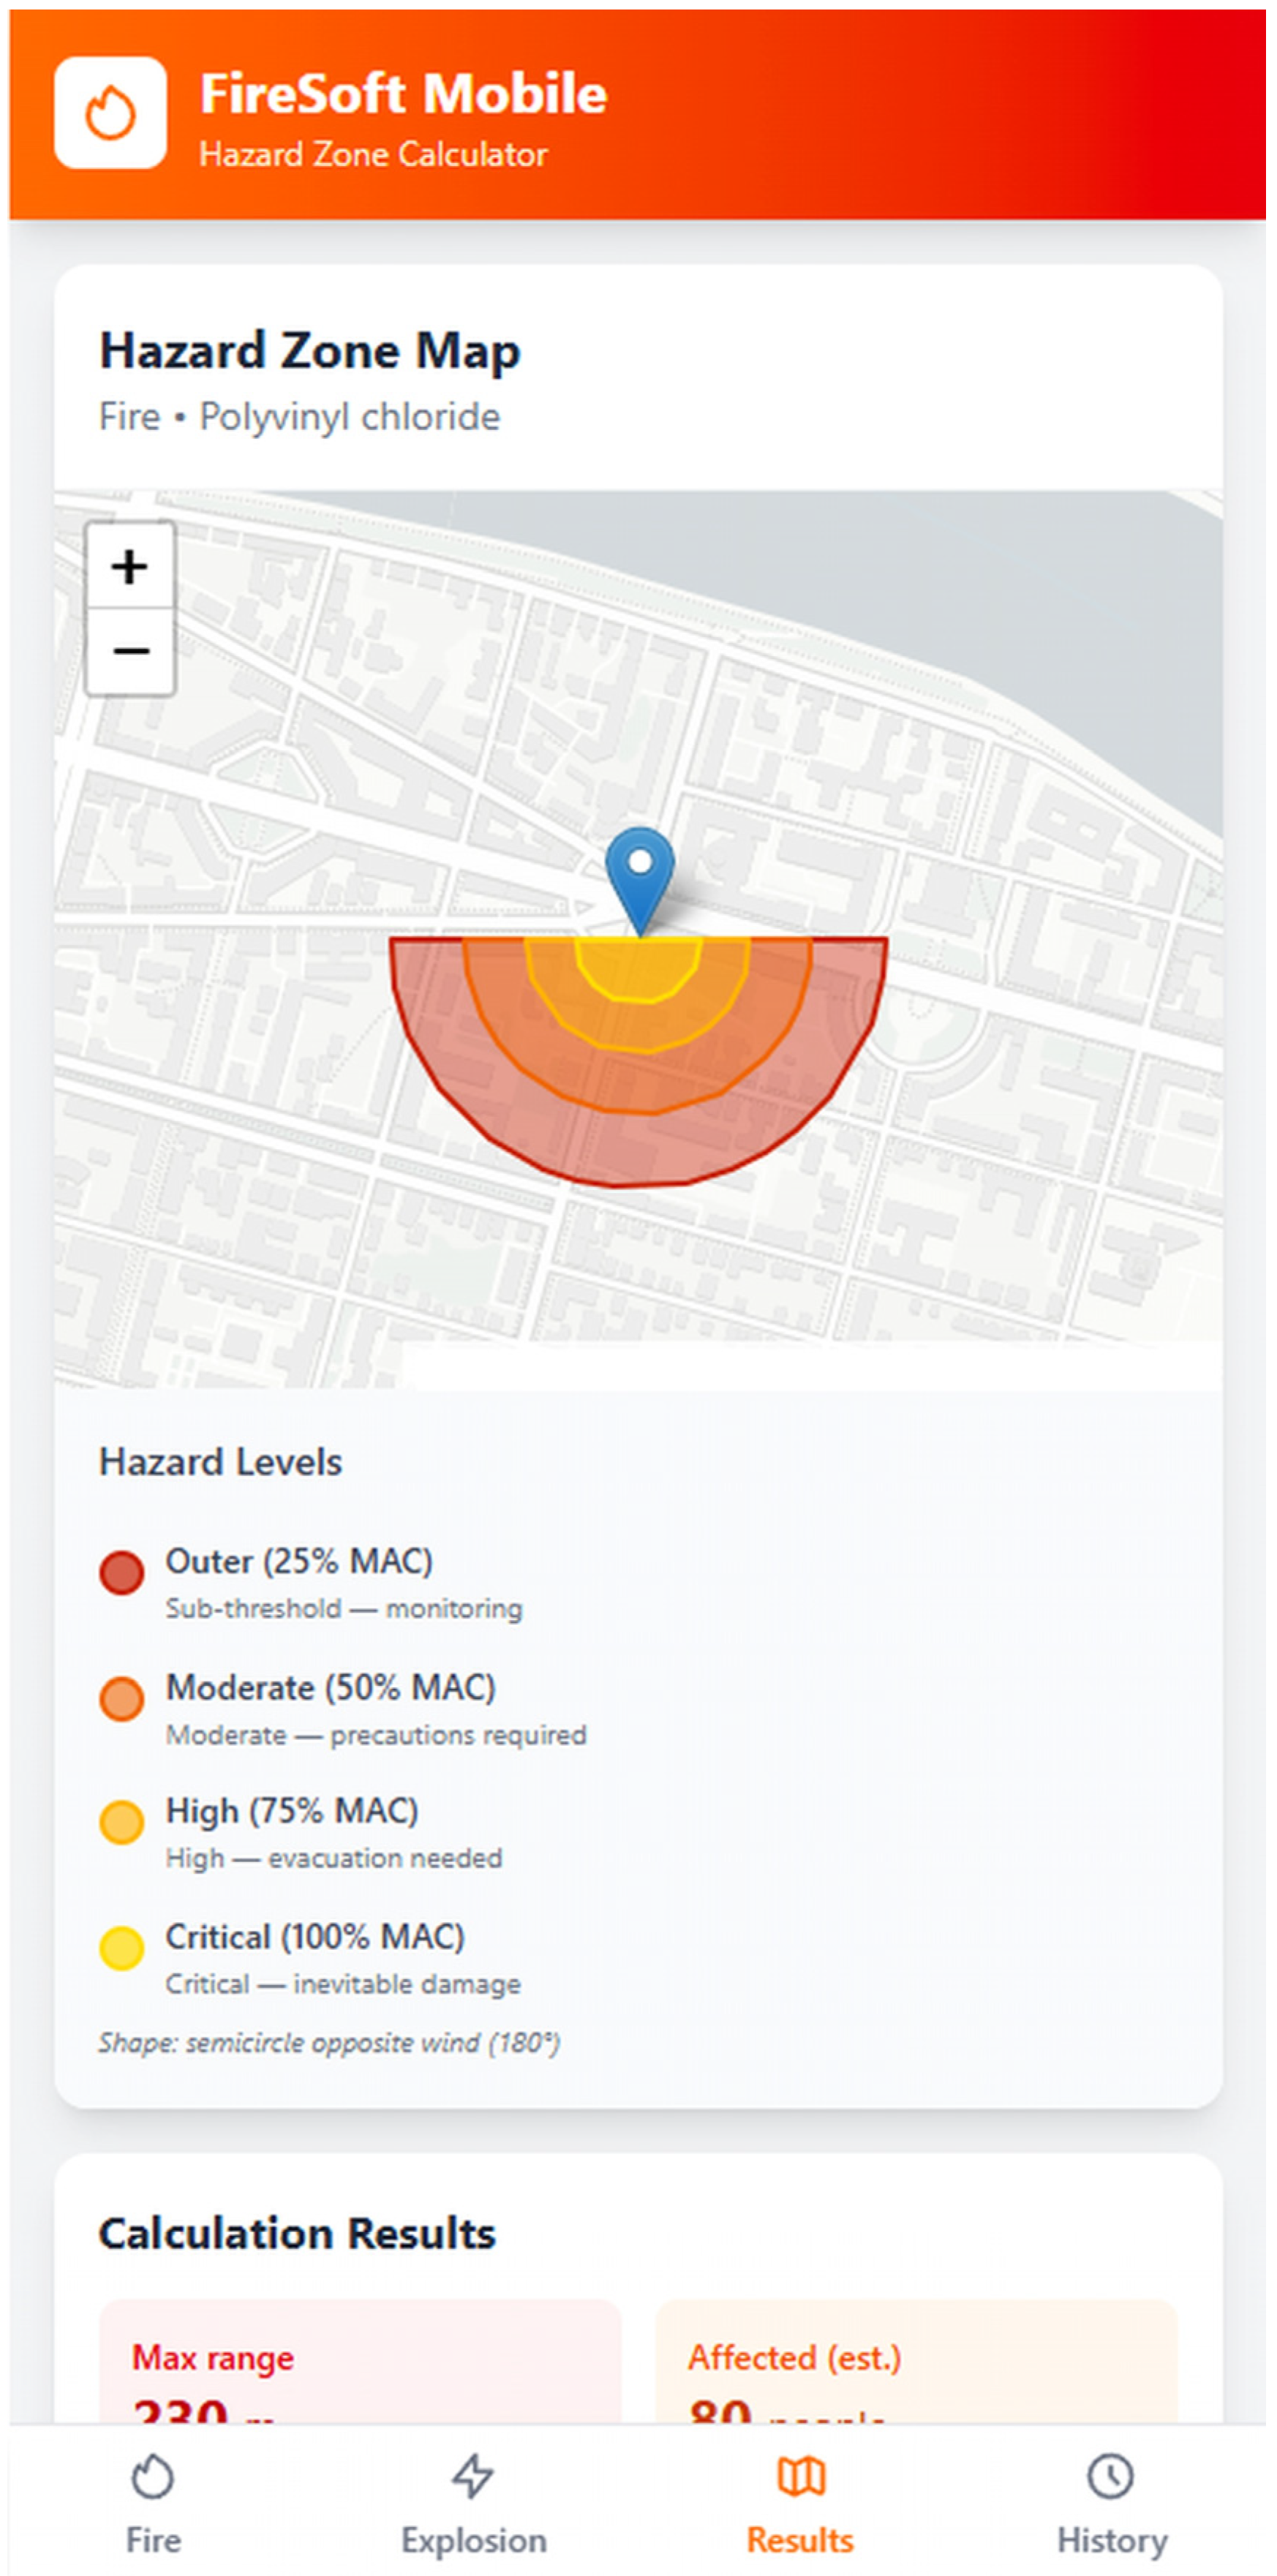
The FireSoft Mobile application allows for the estimation of the potential number of residents of a populated area near an emergency facility who may be affected by the spread of a toxic cloud. After entering data on the Explosion or Fire screens, the Calculate button becomes active; clicking it performs the calculation and opens the Results screen with the output data. For the fire scenario (Figure 9), the zone is represented as a semicircle oriented opposite to the wind direction (with a start angle of startAngle = −windDir − 90°), with four concentration levels: the outer level (25% of the threshold) denotes subthreshold concentrations where the risk is minimal, but monitoring is possible; the 50% level corresponds to a moderate hazard with concentrations approaching the MPC, requiring precautions; the 75% level indicates a high concentration exceeding the MPC, requiring evacuation; the internal level (100%) reflects the zone of maximum danger with critical concentrations, where injury is inevitable without protection.
Figure 9.
FireSoft Mobile results screen for the PVC tank fire scenario: color-coded hazardous zone overlaid on the urban map. Four concentration bands are shown: light yellow = 25% MPC (0.25 mg/m3, monitoring recommended); yellow = 50% MPC (0.50 mg/m3, precautions required); orange = 75% MPC (0.75 mg/m3, evacuation required); dark red = 100% MPC (1.00 mg/m3, critical zone, protection mandatory). Wind speed U = 3 m/s, direction NE, stability class D; zone length L = 1.8 km.
The obtained calculated data on the size of the potential danger zone and its graphical representation (visualization on a fragment of the area map) during a fire are shown in Figure 9.
As Figure 9 shows, the FireSoft Mobile app quickly displays a graphic representation of the airborne contamination cloud over a downloaded building map file, depending on the type of accident (explosion/fire) and wind speed and direction. The visualization is based on a cellular automaton model that generates multi-level contamination zone structures with gradient contours of toxic substance concentrations, taking into account the cSPZ threshold (1 mg/m3) and the spread dynamics.
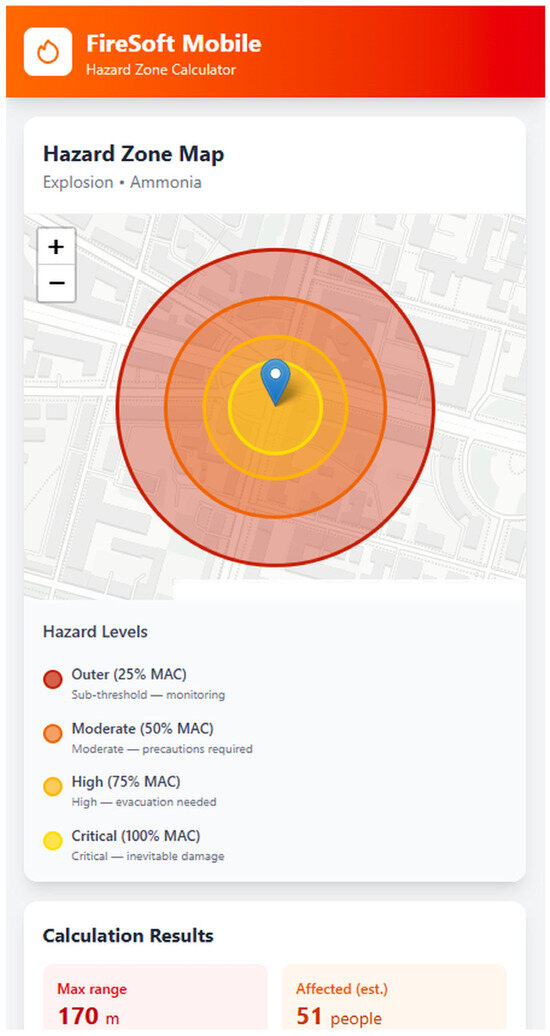
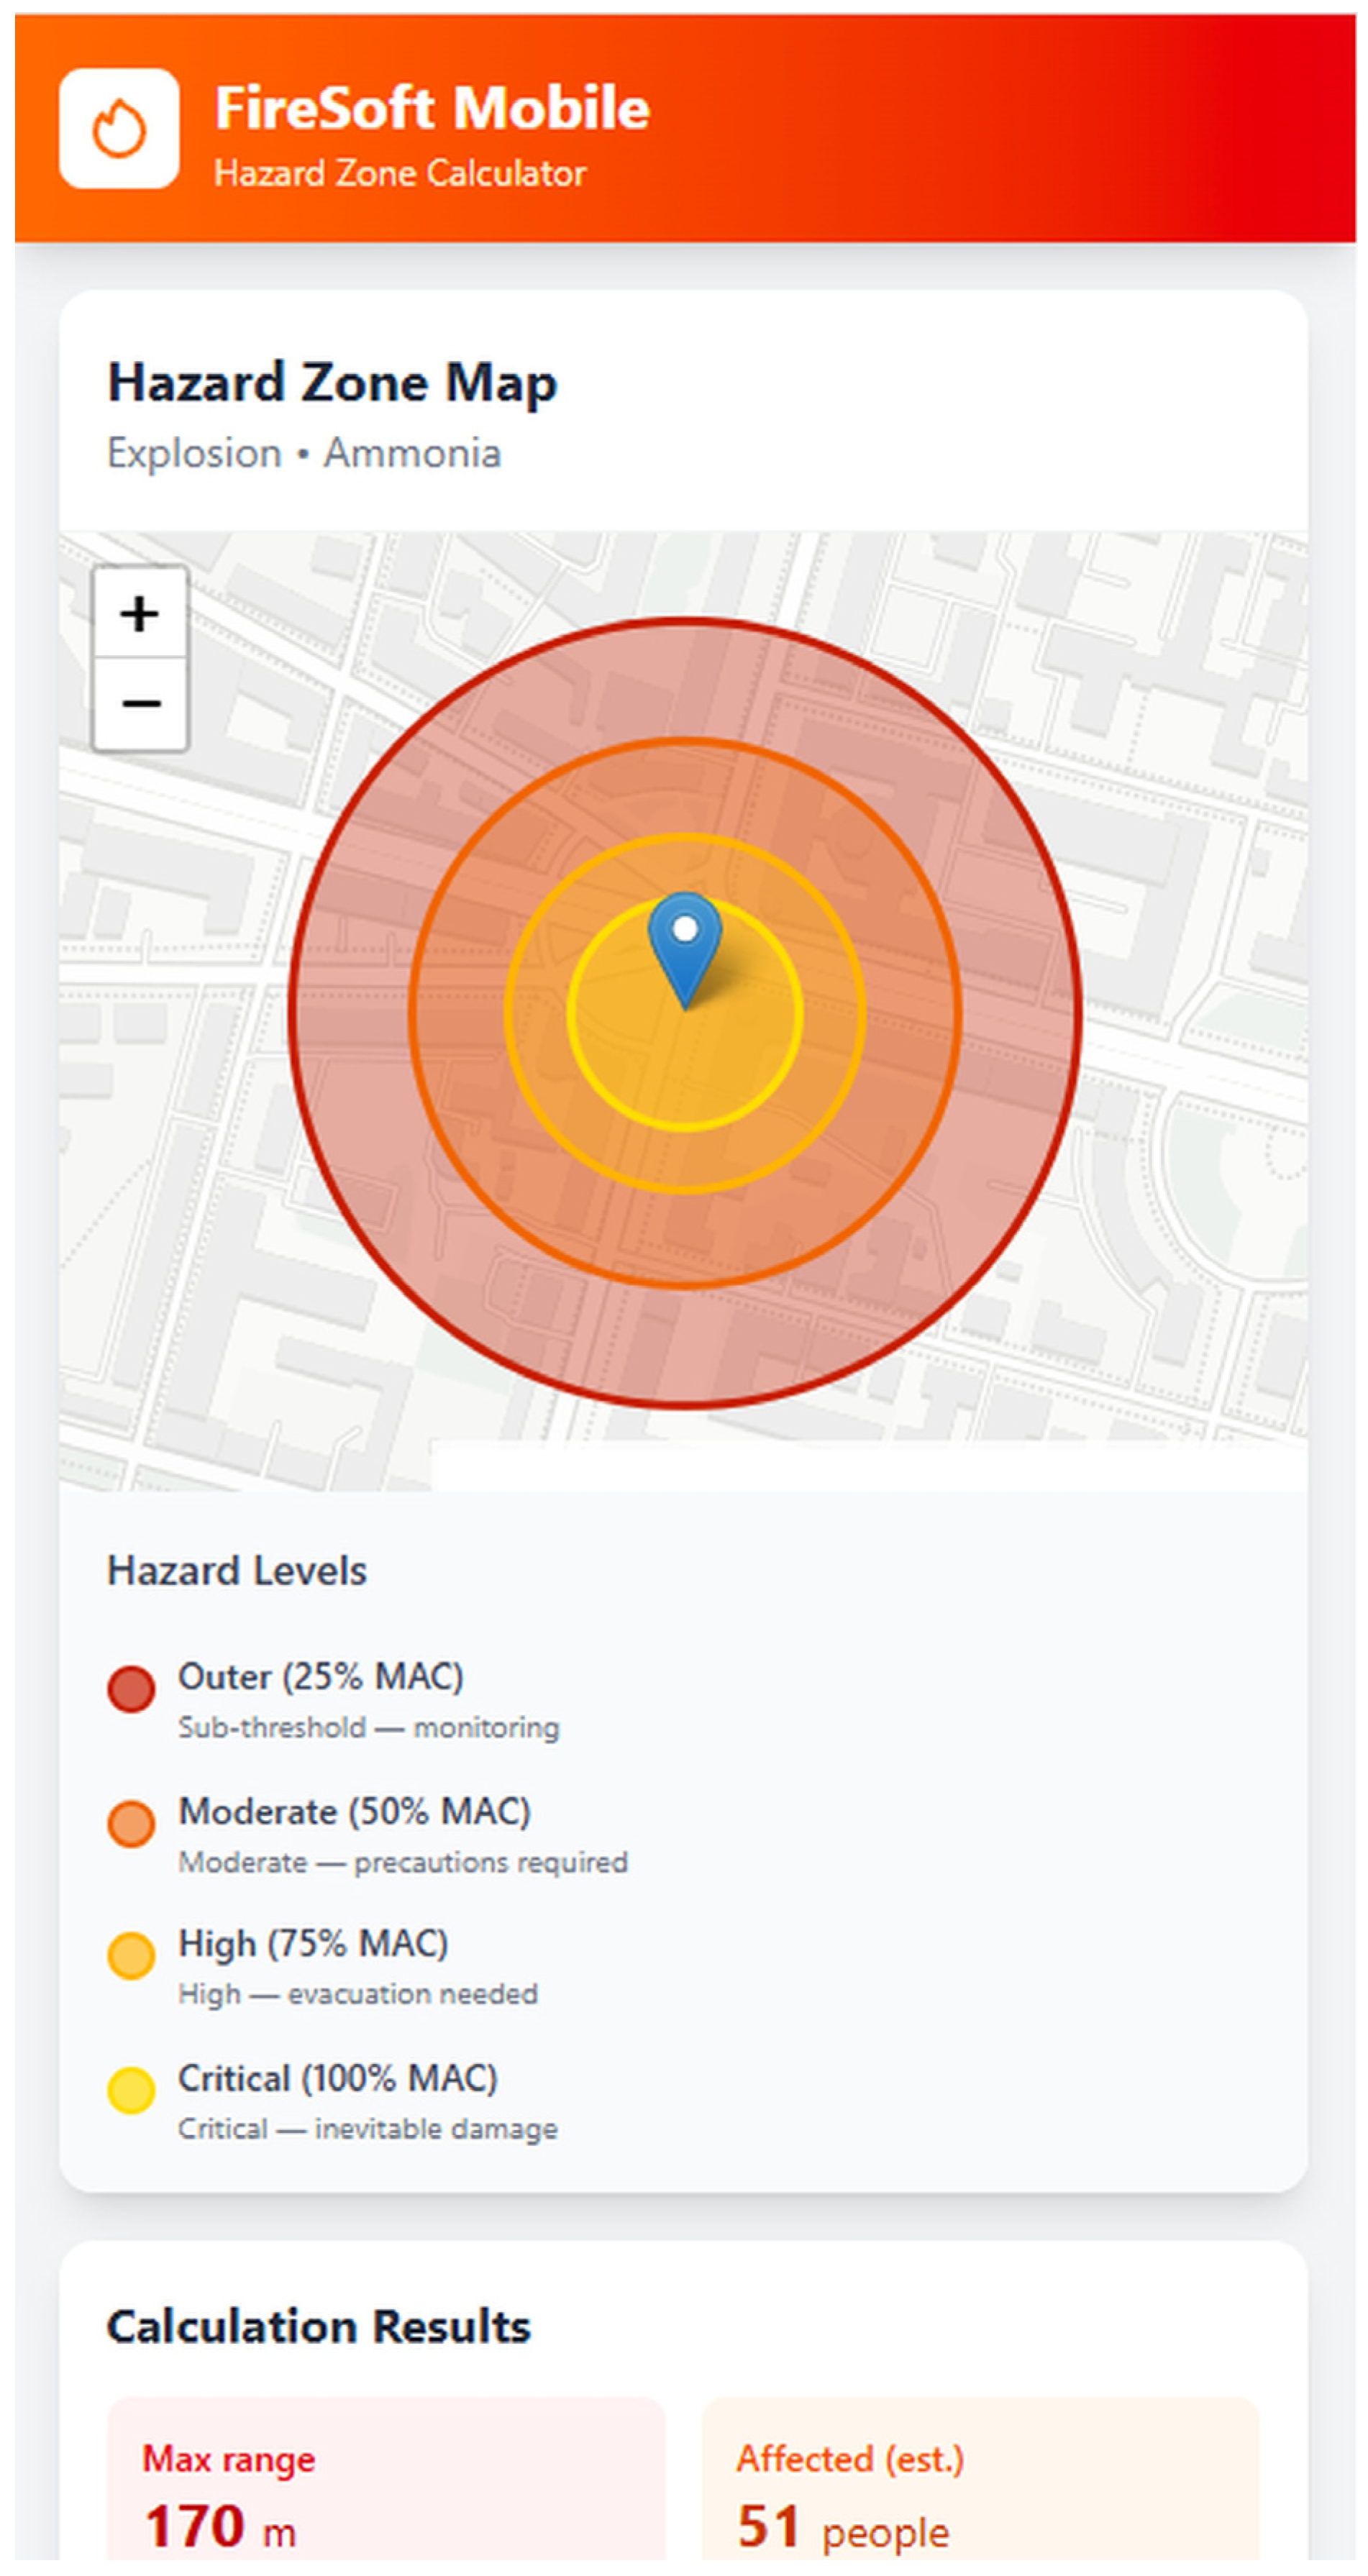
Similarly, for the explosion accident type (Figure 10), the zone is visualized as a multi-level elliptical structure with a convex hull obtained by the ConvexHull algorithm integrating a 16-point neighborhood pattern and a modifying function g*. Each level of the ellipse corresponds to a proportional decrease in concentration from the maximum (in the center, at the source) to the periphery: the inner ellipse (100% level) represents the highest hazard zone with concentrations significantly exceeding the MPC, where immediate evacuation and the use of personal protective equipment are required; the 75% level denotes a high-risk area with concentrations close to critical, suitable for a short-term stay in protective equipment; the 50% level reflects a moderate hazard with concentrations at or slightly above the MPC, where local protective measures are possible; the outer level (25%) indicates a transition zone with subthreshold concentrations, useful for monitoring and security perimeter planning. This multi-level structure takes into account stochastic factors (Monte Carlo method) and obstacles, providing irregular boundaries with interval estimates (95% confidence level), which is especially relevant for dense gases in urban areas, where traditional models provide distortions of up to 30%. Overall, this visualization not only improves forecast accuracy (by 15–25% compared to Gaussian approaches) but also supports rapid boundary adjustment (0.5–1 s. on a standard PC), expanding the possibilities for inverse modeling of emission sources and optimizing the emergency measures.
Figure 10.
FireSoft Mobile results screen for the ammonia warehouse fire scenario (dioxins, HCl, CO): color-coded hazardous zone overlaid on the urban map using the same four concentration bands as Figure 9 (25/50/75/100% MPC). Wind speed U = 2 m/s, direction SW, stability class C; zone length L = 2.4 km, computed via the frontal cellular automaton branch (L > 1.5 km criterion, Figure 3). Predicted number of residents in the 100% MPC zone: 312.
The color palette for the predicted danger zone components in Figure 10 is the same as for Figure 9. Overall, comparing the results of hazard zone modeling for various types of accidents at an industrial facility, obtained using the FireSoft III software ([21]) previously developed by the authors, the following conclusions can be drawn.
First, the visualization accuracy of the cellular automaton-based modeling results using FireSoft III software for PCs running the Windows operating system is similar to that achieved with FireSoft Mobile. This makes this application for Android devices (smartphones, tablets) a promising tool for evacuation management.
Second, the use of the cellular automaton method as the basis for the mathematical model—the core of the FireSoft Mobile application—provides significant advantages for the operational management of evacuation operations, as it ensures high accuracy and fast calculations.
Thirdly, FireSoft Mobile is designed to fill the gap in mobile applications for fire safety and regulatory services workers, which is associated with the lack of applications for modeling hazardous areas (Table 1).
4. Discussion
An approach to visualizing the spread of toxic substances during fires and explosions at industrial facilities, based on the development of a mobile app for evacuation service personnel, utilizes a frontal cellular automaton algorithm. This enables a relatively quick forecast of the spread of the danger zone for any scale of accident. This is important for emergency services, who receive real-time and visual data on the progress of the fire and the cloud spread. The mathematical model presented in this article, which is linked to the cellular automaton algorithm and the software code of the mobile app, allows for a clear and visual determination of hazard levels and the corresponding dimensions of the danger zone for those personnel located near or within the spreading toxic cloud. These personnel can thus make evacuation decisions autonomously, without contacting the control center, in the event of changes in wind direction and speed, fire intensity, or new explosions.
The key advantage of the FireSoft Mobile app, based on cellular automaton, is its separate visualization of the predicted toxic cloud spread zone under various accident scenarios and hazardous substance emission rates. This allows for the redrawing of the hazard zone map when new parameters are entered, determining the potential number of victims, adjusting the evacuation plan, and redistributing evacuation service efforts. Furthermore, IT staff at emergency services can customize FireSoft Mobile to suit their needs, taking into account the specifics of individual businesses and landscapes (proximity to a river, city parks, medical centers, etc.).
In turn, the limitations of the proposed model for predicting a danger zone and visualizing it using a mobile application are characteristic of the cellular automaton method used in FireSoft Mobile, which we mentioned in a previous article [21]: the complexity of the mathematical model increases with increasing detail of the terrain (development) map, since the lines (isopleths) enveloping the danger zone are constructed based on iterative calculations, which inevitably become more complex. We see opportunities to overcome these limitations in the future using cloud-computing algorithms with the help of mobile Internet or Wi-Fi. Modernization of the Android application for modeling danger zones has potential for future use in virtual and augmented reality devices, which may be equipped for fire and evacuation service personnel.
5. Conclusions
This article presents a cross-platform mobile application, FireSoft Mobile (development environment: Visual Studio 2022, C# 10.0, .NET MAUI; operation system: Android 8.0 and higher). The application is based on a mathematical cellular automaton model designed to calculate the parameters of and visualize hazardous zones—clouds of combustion products during fires and explosions at industrial enterprises. The front-end cellular automaton used by the authors enables highly detailed modeling of the movement of a toxic cloud during an accident at an enterprise near an urban agglomeration, taking into account a complex set of variables (wind parameters, terrain features, building height, etc.). The cellular automaton model offers an advantage over Gaussian, Eulerian, and Lagrangian models, ensuring a balance between forecast accuracy and computation speed. The danger zone is visualized in the mobile application using offline maps with color-coded concentrations of toxic substances in the air (from 25% to 100% of the maximum permissible concentration), which is intuitive for emergency services personnel. The use of asynchronous computing and a local SQLite database enables the FireSoft Mobile app to operate autonomously without connecting to remote servers, providing an advantage in real-life emergency situations. Application testing scenarios are presented in the article, including an ammonia tank explosion and a PVC fire, producing a toxic cloud of dioxins, hydrogen chloride, and other gases. Visualization results ensure the rapid assessment of the affected area and the number of potential victims, as well as the adjustment of evacuation measures in the event of changes in weather conditions, combustion dynamics, or multiple explosions. A comparison of FireSoft Mobile’s application area with existing apps demonstrated the advantage of the mobile app, which provides hazard zone modeling and direct determination of its key parameters by emergency personnel, providing effective evacuation. This enables rescuers to reduce time for making decisions about evacuating residents from residential areas adjacent to industrial facilities, coordinate the actions of emergency personnel, and thereby reduce risks to public health and safety. Prospects for further development of the FireSoft Mobile application are related to the integration of a mobile device (smartphone, tablet) with AR glasses to superimpose the boundaries of a dangerous zone directly on the terrain, and the use of cloud computing to increase the detail of the model while maintaining speed.
Author Contributions
Conceptualization, F.A.-A., Y.M. and S.Z.; methodology, F.A.-A., Y.M. and S.Z.; validation, O.Z. and R.F.; formal analysis, F.A.-A.; investigation, F.A.-A., Y.M. and O.Z.; resources, Y.M. and F.A.-A.; data curation, F.A.-A. and R.F.; writing—original draft preparation, O.Z. and F.A.-A.; writing—review and editing, Y.M. and S.Z.; visualization, O.Z.; supervision, F.A.-A.; project administration, S.Z., O.Z. and F.A.-A.; funding acquisition, F.A.-A. and R.F. All authors have read and agreed to the published version of the manuscript.
Funding
This research received no external funding.
Informed Consent Statement
Not applicable.
Data Availability Statement
The original contributions presented in the study are included in the article; further inquiries can be directed to the corresponding author.
Conflicts of Interest
The authors declare no conflicts of interest.
Appendix A
Examples of source code for the FireSoft Mobile application for cellular automaton-based hazard zone modeling.
//────────────────────────────────────────────────────────────────────────
// 1. MODELS
// ────────────────────────────────────────────────────────────────────────
namespace FireSoftMobile.Models
{
/// <summary>
/// Type of emergency situation
/// </summary>
public enum AccidentType { Fire, Explosion }
/// <summary>
/// Toxic substance concentration level relative to the Maximum Permissible Concentration (MPC)
/// </summary>
public enum ConcentrationLevel
{
Safe = 0, // < 25% MPC
Low = 25, // 25–50% MPC
Moderate = 50, // 50–75% MPC
High = 75, // 75–100% MPC
Critical = 100 // > 100% MPC
}
/// <summary>
/// Accident input parameters provided by the user
/// </summary>
public class AccidentParameters
{
public AccidentType Type { get; set; }
// Emission source parameters
public double EmissionRate { get; set; } // Q, g/s
public double SourceHeight { get; set; } // h, m
public string SubstanceName { get; set; } = ““;
public double MPCValue { get; set; } // MPC, g/m3
// Meteorological conditions
public double WindSpeed { get; set; } // U, m/s
public double WindDirectionDeg { get; set; } // wind direction, °
public double Temperature { get; set; } // T, °C
public int AtmosphericStabilityClass { get; set; } // stability class A–F
// Object parameters
public double BuildingHeight { get; set; } // building height, m
public double BuildingSpacing { get; set; } // spacing between buildings, m
// GPS coordinates of the source
public double SourceLatitude { get; set; }
public double SourceLongitude { get; set; }
}
/// <summary>
/// A single cell of the cellular automata grid
/// </summary>
public class Cell
{
public int Row { get; set; }
public int Col { get; set; }
public double Concentration { get; set; } // current concentration, g/m3
public bool IsObstacle { get; set; } // building/obstacle
public bool IsSource { get; set; } // emission source
public ConcentrationLevel Level =>
Concentration <= 0 ? ConcentrationLevel.Safe:
Concentration < 0.25 ? ConcentrationLevel.Low:
Concentration < 0.50 ? ConcentrationLevel.Moderate:
Concentration < 0.75 ? ConcentrationLevel.High:
ConcentrationLevel.Critical;
}
/// <summary>
/// Cellular automata grid (two-dimensional array of cells)
/// </summary>
public class CellularAutomataGrid
{
public int Rows { get; }
public int Cols { get; }
public double CellSizeMeters { get; }
public Cell[,] Cells { get; }
public CellularAutomataGrid(int rows, int cols, double cellSize = 10.0)
{
Rows = rows;
Cols = cols;
CellSizeMeters = cellSize;
Cells = new Cell[rows, cols];
for (int r = 0; r < rows; r++)
for (int c = 0; c < cols; c++)
Cells[r, c] = new Cell { Row = r, Col = c };
}
/// <summary>Von Neumann neighborhood list (4 directions)</summary>
public IEnumerable<Cell> GetVonNeumannNeighbors(int row, int col)
{
int[][] dirs = { new[]{−1,0}, new[]{1,0}, new[]{0,−1}, new[]{0,1} };
foreach (var d in dirs)
{
int nr = row + d [0], nc = col + d [1];
if (nr >= 0 && nr < Rows && nc >= 0 && nc < Cols)
yield return Cells[nr, nc];
}
}
/// <summary>Hexagonal neighborhood list (6 directions)</summary>
public IEnumerable<Cell> GetHexNeighbors(int row, int col)
{
int[][] dirs = { new[]{−1,0}, new[]{1,0}, new[]{0,−1}, new[]{0,1},
new[]{−1,1}, new[]{1,−1} };
foreach (var d in dirs)
{
int nr = row + d [0], nc = col + d [1];
if (nr >= 0 && nr < Rows && nc >= 0 && nc < Cols)
yield return Cells[nr, nc];
}
}
}
/// <summary>
/// Hazard zone boundary (isopleth) for a single concentration level
/// </summary>
public class HazardContour
{
public ConcentrationLevel Level { get; set; }
public List<(double Lat, double Lon)> Points { get; set; } = new();
public double AreaSqMeters { get; set; }
}
/// <summary>
/// Result of a hazard zone calculation
/// </summary>
public class HazardZone
{
public AccidentType AccidentType { get; set; }
public DateTime CalculatedAt { get; set; } = DateTime.Now;
public List<HazardContour> Contours { get; set; } = new();
public double MaxRangeMeters { get; set; }
public int EstimatedAffectedPeople { get; set; }
public string DominantSubstance { get; set; } = ““;
}
}
//// ────────────────────────────────────────────────────────────────────────
// 2. SERVICES
// ────────────────────────────────────────────────────────────────────────
namespace FireSoftMobile.Services
{
using FireSoftMobile.Models;
//── 2.1 Frontal Cellular Automata Algorithm ───────────────────────────────
/// <summary>
/// Frontal cellular automata algorithm for simulating
/// the spread of a toxic cloud (modified FCA).
/// Monte Carlo method for stochastic direction generation.
/// </summary>
public class FrontalCellularAutomata
{
private readonly Random _rng = new();
/// <summary>
/// List of transition directions PS (computed using formula (2))
/// </summary>
private List<(int dRow, int dCol, double weight)> BuildTransitionList(
double windDirRad, double windSpeed, double sigma)
{
var ps = new List<(int, int, double)>();
// 6-point hexagonal neighborhood template
int[][] hexDirs = { new[]{−1,0}, new[]{1,0}, new[]{0,−1},
new[]{0,1}, new[]{−1,1}, new[]{1,−1} };
foreach (var d in hexDirs)
{
// wn—normally distributed random variable (transition angle)
double wn = _rng.NextGaussian(0, sigma);
double cellAngle = Math.Atan2(d [0], d [1]);
double angleDiff = Math.Abs(NormalizeAngle(cellAngle−windDirRad + wn));
double weight = Math.Exp(-angleDiff * angleDiff/(2 * sigma * sigma))
* (1 + windSpeed * Math.Cos(angleDiff));
ps.Add((d [0], d [1], weight));
}
return ps;
}
References
- Lipina, S.A.; Akchurin, R.I. Modern methods of assessing the impact of the industrial sector on the sustainable development of the regions of operation. Econ. Innov. Manag. 2025, 3, 40–49. [Google Scholar] [CrossRef] [Scilit]
- Cherevko, M.A.; Lukyanenok, P.P.; Ligai, A.A. Analysis of innovative development of upstream segment enterprises in the context of global industry challenges. Econ. Innov. Manag. 2024, 3, 59–69. [Google Scholar] [CrossRef] [Scilit]
- Liliaeva, A.A.; Chernikova, T.M. Application of ESG principles in the fuel and energy complex. Econ. Innov. Manag. 2025, 2, 87–93. [Google Scholar] [CrossRef] [Scilit]
- Bykov, A.I.; Novak, A.V. Methodology for constructing models of zone thermal damage during a fire on a gas pipeline. Fire Explos. Saf. 2018, 11, 41–50. [Google Scholar] [CrossRef] [Scilit]
- Tsvirkun, A.D.; Rezchikov, A.F.; Filimonyuk, L.Y.; Samartsev, A.A.; Ivashchenko, V.A.; Bogomolov, A.S.; Kushnikov, V.A. System of integrated simulation of spread of hazardous factors of fire and evacuation of people from indoors. Autom. Remote Control 2022, 83, 692–705. [Google Scholar] [CrossRef] [Scilit]
- Kumaneeva, M.K.; Zonova, O.V.; Sheveleva, O.B. ESG transformation: Decoupling effect in industrial region. Econ. Innov. Manag. 2026, 1, 83–89. [Google Scholar] [CrossRef] [Scilit]
- Ilkovičová, Ľ.; Ilkovič, J.; Meziani, Y. Industrial Clusters in Slovakia-Urban Development. Buildings 2023, 13, 2506. [Google Scholar] [CrossRef] [Scilit]
- Li, Y.; Chen, X.; Wan, J.; Liu, H.; Cui, W.; Wang, Q. Urban Renewal Potential of Old Urban Areas in Resource-Based Cities in Developing Countries: A Case Study of Dongsheng District, Ordos, China. Buildings 2024, 14, 3065. [Google Scholar] [CrossRef] [Scilit]
- Zabrodina, T.I.; Muryasova, L.F.; Torgashin, D.A.; Khripunova, S.V. Psychological readiness for professional activity and psychoemotional state employees of the units of the Ministry of Emergency Situations of the Ministry of Emergency Situations of Russia. Perspect. Sci. Educ. 2023, 66, 440–454. [Google Scholar] [CrossRef] [Scilit]
- Yoon, U.; Kim, J.; Kim, H.; Kim, Y. Development of a Combustible Material Pyrolysis Model for Ultra-Fast Analysis: A Study on the Behavior of Ultra-Fast Fire in Industrial Complexes. Fire 2025, 8, 417. [Google Scholar] [CrossRef] [Scilit]
- Alam, J.; Habib, M.A.; Husk, D. Evacuation planning for persons with mobility needs: A combined optimization and traffic microsimulation modelling approach. Int. J. Disaster Risk Reduct. 2022, 80, 103164. [Google Scholar] [CrossRef] [Scilit]
- Wang, Z.; Jia, G. Simulation-Based and Risk-Informed Assessment of the Effectiveness of Tsunami Evacuation Routes Using Agent-Based Modeling: A Case Study of Seaside, Oregon. Int. J. Disaster Risk Sci. 2022, 13, 66–86. [Google Scholar] [CrossRef] [Scilit]
- Muhammad, H.; Xuan, W.; Wang, M.; Su, G. Review of spatial scale dispersion models (ATDMs) to simulate environmental dispersion and deposition of radionuclides and the overview of GIS coupling with dispersion models. Int. J. Adv. Nucl. React. Des. Technol. 2024, 6, 256–280. [Google Scholar] [CrossRef] [Scilit]
- Kier, L.B.; Cheng, C.K.; Seybold, P.G. Cellular Automata Models of Chemical Systems. SAR QSAR Environ. Res. 2000, 11, 79–102. [Google Scholar] [CrossRef] [Scilit] [PubMed]
- Tao, Z.; Sun, H.; Deng, B.; Wang, J.; Calautit, J. Integrating computational fluid dynamics (CFD) and machine learning to improve urban green infrastructure for heat mitigation and air quality: A systematic review. Build. Environ. 2025, 284, 113516. [Google Scholar] [CrossRef] [Scilit]
- Zonify. The Engineers Platform. Available online: https://zonify.co.uk/ (accessed on 8 April 2026).
- Pliszka. The Protection Engineering. Available online: https://pliszka.pl/en/products/fire-visualisations/ (accessed on 8 April 2026).
- APX. Incident Response Map. Available online: https://apxdata.com/smartmap/#:~:text=multiple%20log%2Dins.-,Incident%20Response%20Map,information%20at%20times%20of%20emergency (accessed on 8 April 2026).
- Fire 3D. #1 UK Fire Alarm Design Software. Available online: https://www.fire3ddesign.com/ (accessed on 8 April 2026).
- European Commission. LASH FIRE Project. Available online: https://ec.europa.eu/research/participants/documents/downloadPublic?documentIds=080166e50085dde5&appId=PPGMS#:~:text=They%20could%20also%20be%20equipped,The%20automated%20guided%20vehicle%20(AGV) (accessed on 8 April 2026).
- Abu-Abed, F.; Matveev, Y.; Fedyakin, R.; Zhironkina, O.; Zhironkin, S. Software for Hazard Zone Visualization in Case of Fire at Industrial Facility Based on Cellular Automaton Method. Fire 2026, 9, 63. [Google Scholar] [CrossRef] [Scilit]
- Matveev, Y.; Abu-Abed, F.; Chernishev, L.; Zhironkin, S. Visualization of Hazardous Substance Emission Zones During a Fire at an Industrial Enterprise Using Cellular Automaton Method. Fire 2025, 8, 250. [Google Scholar] [CrossRef] [Scilit]
- Donnelly, J.; Daneshkhah, A.; Abolfathi, S. Forecasting global climate drivers using Gaussian processes and convolutional autoencoders. Eng. Appl. Artif. Intell. 2024, 128, 107536. [Google Scholar] [CrossRef] [Scilit]
- Belikhov, A.B.; Legotin, D.L.; Sukhov, A.K. Modern computer models of the spread of pollutants in the atmosphere. KSU Bull. 2013, 1, 14–19. [Google Scholar]
- Tsyro, S.G. Regional Model for Studying the Physical and Chemical Properties of Suspended Particles in Europe. Ph.D. Thesis, A.I. Voeikov Main Geophysical Observatory, Moscow, Russia, 2008; 166p. [Google Scholar]
- Chernyshev, L.O. Visualization and Analysis of Emergency Emissions of Chemically Hazardous Substances at Industrial Enterprises. Ph.D. Thesis, Tver State Technical University, Tver, Russia, 2025; 147p. [Google Scholar]
- Bandman, O.L. Invariants of cellular automata models for reaction-diffusion processes. Appl. Discret. Math. 2012, 3, 108–118. [Google Scholar] [CrossRef] [Scilit]
- Wolf-Gladrow, D.A. Lattice-Gas Cellular Automata and Lattice Boltzmann Models: An Introduction; Springer: Berlin/Heidelberg, Germany, 2004; 314p. [Google Scholar]
- Toffoli, T. Cellular Automata as an Alternative to (rather than approximation of Differential Equations in Modeling Physics. Phys. D Nonlinear Phenom. 1984, 10, 117–127. [Google Scholar] [CrossRef] [Scilit]
- Azimi, M.; Jamali, Y.; Mofrad, M.R.K. Accounting for Diffusion in Agent Based Models of Reaction-Diffusion Systems with Application to Cytoskeletal Diffusion. PLoS ONE 2011, 6, e25306. [Google Scholar] [CrossRef] [Scilit] [PubMed]
- Stull, R. Pollutant dispersion. In Practical Meteorology: An Algebra-Based Survey of Atmospheric Science; University of British Columbia: Vancouver, BC, Canada, 2017; 926p. [Google Scholar]
- Matveev, Y.; Abu-Abed, F.; Zhironkina, O.; Zhironkin, S. Software Supporting the Visualization of Hazardous Substance Emission Zones During a Fire at an Industrial Enterprise. Fire 2025, 8, 279. [Google Scholar] [CrossRef] [Scilit]
- PROPAGATOR, How to Simulate Fire Dynamics. Available online: https://www.cimafoundation.org/en/news/propagator-how-to-simulate-fire-dynamics/ (accessed on 8 April 2026).
- Paisa, C.; Carrasco, J.; Martellc, D.L.; Weintraub, A.; Woodruff, D.L. Cell2Fire: A Cell Based Forest Fire Growth Model. Available online: https://ar5iv.labs.arxiv.org/html/1905.09317 (accessed on 8 April 2026).
- Cheng, S.; Xia, Z. PyTorchFire: A Differentiable Cellular Automata-Based Wildfire Simulator with GPU Acceleration. In Proceedings of the EGU General Assembly 2025, Vienna, Austria, 27 April–2 May 2025. EGU25-13425. [Google Scholar] [CrossRef] [Scilit]
- Predict and Contain. Real-Time Spread Prediction for Effective Disaster Response. Available online: https://devpost.com/software/predict-and-contain (accessed on 8 April 2026).
- Matveev, Y.N.; Chernyshev, L.O. Automated decision support system for predicting the processes of dispersion of chemically hazardous substances. Softw. Prod. Syst. 2021, 2, 307–315. [Google Scholar] [CrossRef] [Scilit]
- Khaydarova, G.; Mukhiddinov, B.; Ilkhom, J.; Nurkulov, F. Thermal Characteristics of Compositions of Polyvinyl Chloride with Flame Retardants. Universe Tech. Sci. 2023, 2, 43–48. [Google Scholar] [CrossRef] [Scilit]

Disclaimer/Publisher’s Note: The statements, opinions and data contained in all publications are solely those of the individual author(s) and contributor(s) and not of MDPI and/or the editor(s). MDPI and/or the editor(s) disclaim responsibility for any injury to people or property resulting from any ideas, methods, instructions or products referred to in the content. |
© 2026 by the authors. Licensee MDPI, Basel, Switzerland. This article is an open access article distributed under the terms and conditions of the Creative Commons Attribution (CC BY) license.