Article

Construction and Application of an Emergency Monitoring Indicator Evaluation Model Based on the Spatiotemporal Evolution of Forest Fires

National Institute of Natural Hazards, Beijing 100085, China
*
Author to whom correspondence should be addressed.
Fire 2026, 9(5), 178; https://doi.org/10.3390/fire9050178
Submission received: 19 January 2026 / Revised: 3 April 2026 / Accepted: 10 April 2026 / Published: 22 April 2026
(This article belongs to the Special Issue Buoyancy Controlled Fire Behaviors Under Special Environments)

Abstract

The lack of scientific methods for selecting monitoring indicators and equipment undermines the efficiency of forest fire emergency response. To address this gap, we developed a novel evaluation model for emergency monitoring indicators based on the spatiotemporal evolution of forest fires. The model, comprising four primary and eight secondary factors, leverages a hybrid TriFAHP and DBN approach to objectively determine factor weights based on survey data from 20 domain experts. The results indicate that the primary factor weights rank as follows: Monitorability (0.3807) > Timeliness (0.3353) > Sensitivity (0.1874) > Feasibility (0.0966). Four indicators (wind speed, temperature, flame, and gas) were identified as the most suitable for core monitoring. Furthermore, stage-specific monitoring strategies were proposed, prioritizing different core indicators across the ignition, spread, and fully developed fire stages. An indicator and equipment association was established, recommending optimal configurations such as UAV-mounted thermal imagers and lidar anemometers. The practical applicability of the proposed framework was successfully validated through real-world case studies, including the 2019 to 2020 Australia bushfires. This study provides a standardized framework aligning indicators, equipment, and scenarios, offering theoretical and practical guidance for optimizing emergency monitoring systems.

1. Introduction

Forest fires represent a highly destructive global environmental challenge, characterized by a complex and highly non-linear spatiotemporal evolution Eslamzadeh et al. [1]. On a temporal scale, forest fires typically progress through four rapidly evolving stages: ignition, spread, fully developed, and decline [2]. Spatially, fire spread exhibits significant heterogeneity. The fireline acts as the critical advancing front, dictating the morphology of burning zones with varying intensities, such as the fire head and flanks [3]. For instance, established fire behavior models like FARSITE rely on key parameters describing fireline development—specifically, fireline intensity, movement speed, and spread direction—to predict fire propagation [4]. Given that these parameters exhibit highly non-linear variations over time, the rapid spatiotemporal evolution of forest fires poses a tremendous challenge to emergency response efforts. Consequently, it is imperative that monitoring systems possess the capability to track these dynamic changes in real time with high accuracy.
Current research on forest fire prediction and monitoring predominantly focuses on two main areas. The first area involves collaborative monitoring using multi-sensors and unmanned aerial vehicles (UAVs) for early warning, timely detection, and auxiliary firefighting. For instance, Momeni and Hashem [5] developed a collaborative system utilizing sensors and drones to track temperature data, demonstrating its efficacy in accurately identifying fires and assisting in suppression. Similarly, Tareq [6] simulated wildfire scenarios using sensor networks to monitor indicators such as smoke, temperature, humidity, and wind speed. The second area focuses on constructing probability prediction and disaster risk assessment models driven by extensive historical fire and meteorological data. For example, Zacharakis and Tsihrintzis [7] comprehensively analyzed 230 studies on integrated modeling approaches for estimating forest fire danger—incorporating machine learning, geographic information systems (GIS), remote sensing, and various modeling techniques—to develop an Integrated Wildfire Danger Risk System (IWDRS). Palatkin et al. [8] discussed the application of logistic regression (LR) in evaluating forest fire probabilities, demonstrating that fire predictions based on meteorological data (e.g., temperature, humidity, wind speed, and precipitation) play a pivotal role in risk management and loss reduction. Furthermore, Hiremath and Kannan [9] developed a random forest-based classifier utilizing prior-day observations of land surface temperature, near-surface air temperature, relative humidity, and soil moisture to predict the occurrence of fire events. Collectively, these studies have significantly advanced the prevention and control of forest fires.
However, during the deployment phase prior to active monitoring, particularly in the context of emergency monitoring at active firefighting scenes, there remains a notable lack of systematic research on how to scientifically select applicable monitoring indicators and matching equipment. Historically, the selection of these indicators and equipment has relied heavily on the subjective, empirical judgment of rescue personnel. This reliance on experience-based configuration severely compromises the efficiency of emergency fire monitoring and can even delay critical rescue operations. Therefore, to accurately grasp the fire’s trajectory and trends during the rapid spread phase, a more critical and foundational step must be taken prior to the actual implementation of monitoring: precisely determining which equipment should be utilized to monitor which key indicators. Addressing this issue holds profound practical significance: it provides a standardized and scientific basis for the rapid and precise allocation of monitoring resources in highly complex and dynamic fire environments. Furthermore, by fundamentally transforming the passive, experience-driven traditional models, this scientific configuration serves as a crucial prerequisite for scientifically commanding firefighting and rescue operations, thereby minimizing fire-induced losses to the greatest extent possible.
Conducting this critical research, however, is fraught with significant challenges. First, the emergency monitoring phase demands exceptionally high Timeliness and accuracy. Response efforts are a race against time, as both direct and indirect losses escalate exponentially as the fire progresses. Second, the extreme environments of active fire scenes impose severe hardware constraints on monitoring equipment. Certain monitoring devices may function adequately during the initial stages but are highly prone to failure as ambient temperatures surge. Furthermore, dense smoke and particulate matter can severely degrade the monitoring accuracy of many instruments. Finally, during sudden emergency outbreaks, there is typically a distinct lack of sufficient and highly relevant historical data for the specific context. Consequently, attempting to reference previous studies and rely on historical data-driven methods to select applicable indicators and monitoring equipment in real time is difficult. Facing these numerous research bottlenecks, the integration of the Triangular Fuzzy Analytic Hierarchy Process (TriFAHP) and a Deep Belief Network (DBN) demonstrates high applicability in this study [10]. This hybrid method effectively handles small sample sizes by quantifying the implicit experience of domain experts and processing fuzzy evaluations without requiring massive historical datasets. Furthermore, this method has already been successfully applied in various other complex decision-making fields, providing an excellent methodological reference for this research [11].
Given the lack of a theoretical basis for scientifically selecting monitoring indicators and equipment prior to the actual deployment phase, this study constructs a novel applicability evaluation model for emergency monitoring indicators and equipment using the integrated TriFAHP and DBN method [12]. This is achieved based on a comprehensive analysis of the spatiotemporal evolution characteristics of forest fires and the specific demands of emergency monitoring. The specific structure of this paper is as follows: Section 2 details the spatiotemporal evolution characteristics of forest fires and the integrated methodology. Section 3 presents the quantitative evaluation results for both the core monitoring indicators and their matching equipment, alongside the proposed staged monitoring strategies. Section 4 discusses the statistical validation of the model, provides empirical support through practical case studies, and explores the methodological limitations and future research directions. Finally, Section 5 concludes this study. The core significance of this work is that it not only provides a solid theoretical foundation and quantitative tools for the scientific selection of monitoring indicators and equipment during the emergency response phase, but also perfectly complements previous research focused on improving fire monitoring accuracy, thereby jointly refining the comprehensive monitoring and prevention system for forest fires.

2. Methods

2.1. Methodology

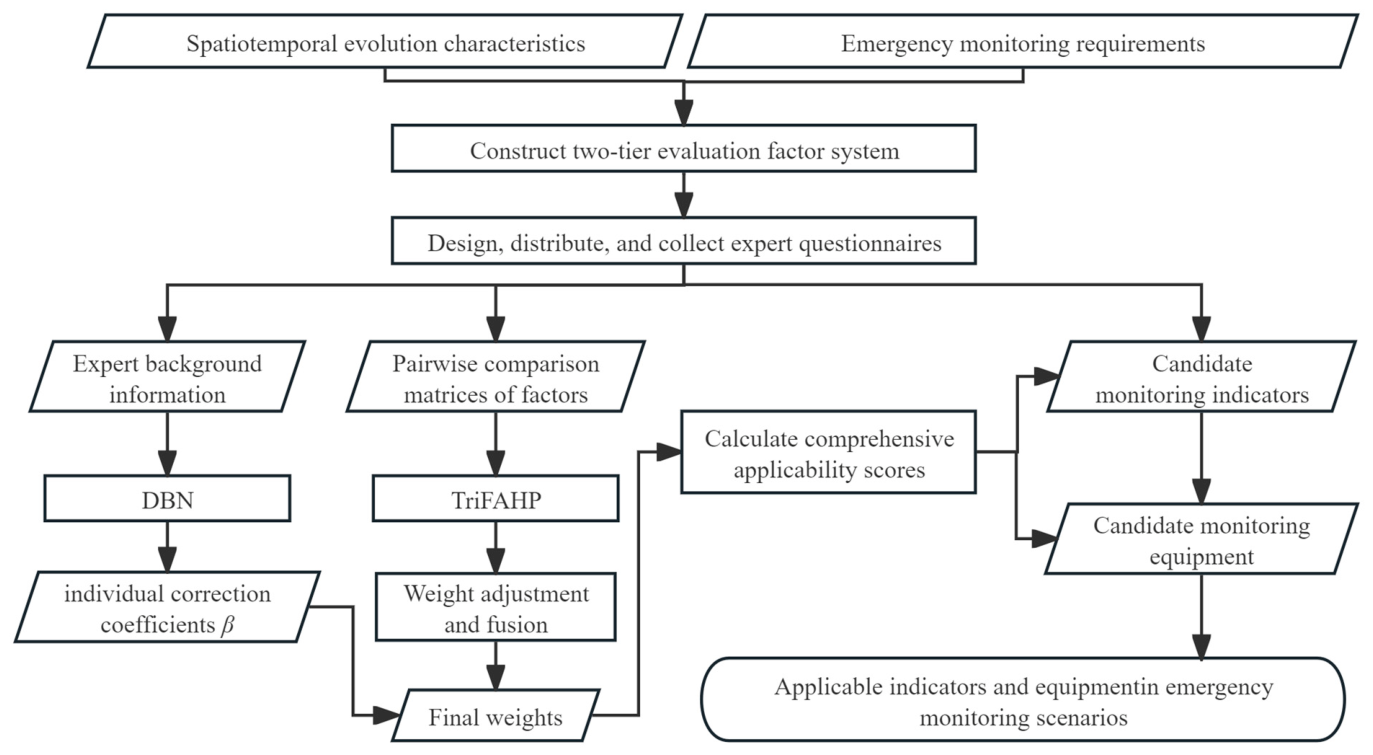
This study designed a comprehensive evaluation workflow to support the scientific selection of monitoring indicators and their corresponding equipment during forest fire emergency responses. The entire evaluation process consists of four sequential phases (Figure 1). Phase (1) involves the construction of the evaluation models. Based on an in-depth analysis of the spatiotemporal evolution characteristics of forest fires and the specific demands of emergency monitoring, a two-tier evaluation factor system for monitoring indicators, alongside a highly correlated evaluation model for monitoring equipment, was established. Phase (2) encompasses a two-stage longitudinal questionnaire design and evaluation data collection. Stage one was designed to collect the experts’ pairwise comparison results for the evaluation factors and their initial scores for the candidate monitoring indicators. Stage two was a follow-up survey deployed after the core indicators were identified, aiming to collect the experts’ scores exclusively for the monitoring equipment that technically matched those selected core indicators. Phase (3) focuses on model weight calculation. To enhance the objectivity of subjective weighting, a Deep Belief Network (DBN) was integrated with the Triangular Fuzzy Analytic Hierarchy Process (TriFAHP) to process the collected questionnaire data, thereby calculating the objective weights of the evaluation factors at each level. Finally, Phase (4) entails a sequential comprehensive evaluation and application. By incorporating the calculated weight results, the most applicable monitoring indicators were first evaluated and selected. Subsequently, based on the finalized core indicators, their matching equipment in emergency monitoring scenarios was ultimately evaluated.

2.2. Emergency Monitoring Requirements for Forest Fires

In previous studies on forest fire monitoring, researchers have increasingly recognized that different stages of fire development present distinctly different key influencing factors on the effectiveness of monitoring systems [13]. For instance, some scholars have pointed out that the ability to capture weak, early-stage signals dictates the success of fire early warning and initial suppression [14]. Other studies have emphasized that, under extreme fire conditions, the operational stability of equipment and the real-time transmission of data are the core foundations for supporting dynamic tactical decisions [15,16]. These influencing factors are inextricably linked to the highly non-linear spatiotemporal evolution of forest fires [17]. Therefore, to construct a scientific emergency monitoring evaluation system, this study systematically summarizes the core demands of emergency monitoring by integrating these key influencing factors—derived from a comprehensive literature review—with the four specific stages of fire evolution.
During the ignition phase, the core demand is the earliest possible detection of weak heat sources or smoke beneath the canopy or on the surface [18]. This requires that the monitoring indicators and accompanying equipment possess exceptionally high sensitivity to sudden signal variations, enabling precise intervention before the fire spreads uncontrollably. For example, Yao et al. [19] utilized Himawari-8/9 imagery as the primary data source and introduced a spatial feature (STF)-based forest fire detection method. This approach significantly enhanced the recognition capability for low-temperature fire pixels, thereby greatly improving the sensitivity of rapid fire spot identification during the early stages of a forest fire.
In the spread phase, as the fire expands rapidly with fluctuating directions, the emergency command center must quickly locate the fireline and dynamically analyze fire behavior. For instance, Valencia et al. [20] utilized unmanned aerial vehicle (UAV) technology to generate high-resolution, two-dimensional measurements of Byram’s fireline intensity in the study area, revealing the rapid, non-linear dynamic variations in the fireline intensity across the entire plot. Consequently, monitoring efforts during this stage must balance high Timeliness with adequate spatial coverage, preventing the loss of optimal firefighting windows due to delayed information [21].
Once the fire enters the fully developed phase, the situation becomes highly complex, characterized by extreme environments such as intense heat, dense smoke, and strong convective winds. At this point, it is imperative to ensure that monitoring equipment can overcome environmental interferences and operate stably. Thus, there is a profound emphasis on the high feasibility and reliability of the monitoring schemes and hardware equipment under actual high-stress conditions. To achieve these complex monitoring objectives that heavily rely on stringent Timeliness and extensive spatial coverage, Internet of Things (IoT) systems are widely deployed, utilizing diverse sensor networks to monitor environmental and fire parameters in real time and track potential fire risks. These devices typically include sensors for temperature, humidity, gas concentrations (e.g., CO, PM2.5), wind speed and direction, as well as visible light and infrared imaging sensors [22,23,24,25,26,27,28].
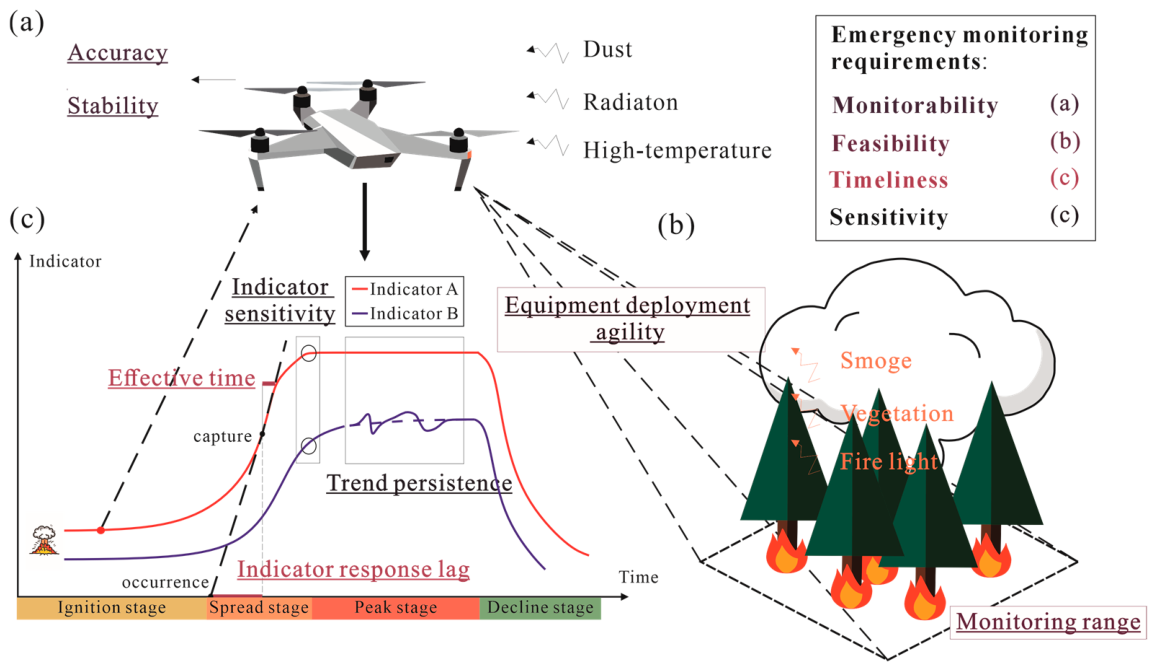
Finally, during the decline phase, as the fire is gradually brought under control, the monitoring focus shifts toward the precise assessment of residual smoldering spots, burned areas, and disaster-induced damage. This requires the acquired monitoring data to exhibit high accuracy and Monitorability, thereby effectively supporting post-disaster mop-up and evaluation operations. As demonstrated by Ioannis Kotaridis [29], precise and regularly updated maps of burned surface areas are crucial for fire management. By delineating the extent of burned areas using Sentinel-2 and Landsat-8 optical data, the proposed results showed remarkable consistency with actual ground truth. As shown in Figure 2, based on the systematic elucidation of the core demands across these stages and existing monitoring technologies, this study distills the four key dimensions that govern the efficacy of both emergency monitoring indicators and their corresponding equipment:
1. Monitorability: The system must work stably and provide accurate data in harsh conditions like high heat and thick smoke [30], thereby providing a reliable basis for risk assessment and early-warning decision making. This links to the model factors “accuracy” and “stability” [31].
2. Feasibility: After ensuring the measurability of the indicators, it is necessary to determine whether they can be effectively deployed and achieve adequate coverage in a vast and complex fire scene. Therefore, feasibility primarily considers the monitoring scope and the agility of equipment deployment [32].
3. Timeliness: The monitoring data must be updated fast enough to match the speed of fire change [30]. Accordingly, this study deconstructs Timeliness into two components: “response lag” and “effective duration [33]”.
4. Sensitivity: The monitoring indicators must accurately reflect the current fire status, sensitively capture its sudden changes, and reliably indicate its evolving trend to support decision making [34].

2.3. Emergency Monitoring Indicator Evaluation Model

Based on a comprehensive analysis of the spatiotemporal evolution of forest fires and the requirements of emergency monitoring, this study develops an evaluation model with a two-layer hierarchical structure. The definitions and significance of each evaluation factor in disaster monitoring are presented in Table 1.
Furthermore, to scientifically assess the matching monitoring equipment in the later stages of this study, an equipment applicability evaluation model was concurrently established. Because the first three primary dimensions, namely Monitorability, Feasibility, and Timeliness, are intrinsically correlated with the hardware performance and operational deployment of monitoring devices, they were specifically extracted to construct this equipment evaluation model. The rationale for this adaptation is that the “Sensitivity” dimension primarily characterizes the inherent physical relationship between a monitoring indicator and the disaster’s evolution. Conversely, the performance of physical hardware in extreme fire environments is predominantly dictated by its data acquisition accuracy (Monitorability), operational speed (Timeliness), and deployment viability under extreme constraints (Feasibility). Therefore, utilizing these three specific dimensions provides a highly targeted and mechanically sound basis for evaluating the hardware equipment.

2.4. Weight Calculation for the Emergency Monitoring Indicator Evaluation Model

2.4.1. Expert Selection and Data Collection

We invited 20 experts for a questionnaire survey. The experts came from three related fields: forest fire rescue (8), on-site monitoring (7), and emergency management (5). The rationale for selecting experts from these three specific domains is that they span the entire operational spectrum of forest fire emergency response, ranging from frontline execution to back-end command and decision making. Furthermore, to prevent institutional or economic clustering, these experts were deliberately recruited from multiple distinct provinces and organizations across the country. This diverse geographic and economic background ensures that the resulting evaluation is not skewed by localized administrative policies or specific regional budgets. Because they occupy different roles, their perspectives on monitoring requirements naturally differ in focus. Integrating their multi-dimensional views ensures a comprehensive and well-rounded assessment of emergency monitoring needs. All experts had over 7 years of work experience and had taken part in at least 6 practical projects. Although a sample size of 20 may appear limited from a purely statistical perspective, multiple studies have confirmed that AHP models constructed by 10 to 30 strictly screened senior experts exhibit robust performance in structural validity, weight stability, and practical decision-support capabilities. Furthermore, international standards such as ISO/IEC 17065 [49] and the European Commission’s Joint Research Centre (JRC) guidelines also endorse the principle that expert depth takes precedence over breadth in qualitative modeling methods based on expert consensus [50,51].
The survey was conducted over a comprehensive three-month period using a two-stage follow-up design under an anonymous protocol to ensure objective responses. In the first stage, the 20 experts were asked to complete the pairwise comparison matrices and score the broad list of candidate monitoring indicators. After the algorithm processed these initial data and successfully identified the highest-priority core indicators, the second stage of the survey was initiated one month later. In this follow-up stage, the exact same panel of experts was tracked and invited to evaluate a specifically curated list of monitoring equipment. This equipment was strictly selected based on its ability to monitor the core indicators identified in stage one. The survey was conducted over a two-month period under an anonymous protocol to ensure objective responses. The complete questionnaire and judgment matrix examples are provided in Appendix A, Appendix B and Appendix C. Their decision-making styles were also recorded, as such characteristics can influence judgment [52]. Specifically, the “radicalism indicator” (ranging from 0 to 1) was quantitatively extracted from the experts’ objective scoring behaviors during the pairwise comparison process. In the fundamental 1 to 9 scale of AHP, a conservative decision-maker tends to assign conservative or neutral values (such as 1, 2, or 3), reflecting caution and a psychological tendency to avoid asserting the absolute dominance of one factor over another. Conversely, a radical or highly confident decision-maker more frequently utilizes extreme values (such as 7, 8, or 9), indicating strong preferences and decisiveness. Mathematically, this indicator was calculated by evaluating the variance and the frequency of extreme values within the scores assigned by each expert in their judgment matrices, followed by a min-max normalization. This data-driven extraction ensures that the quantification of decision-making styles is strictly rigorous and objective. Nevertheless, we acknowledge that this expert selection may inherently introduce minor institutional or regional biases, which the subsequent DBN algorithm is specifically designed to mitigate.
Upon collecting the questionnaires, a strict consistency check was performed to validate the mathematical and logical coherence of the data before any complex algorithm integration. At the individual level, the original pairwise comparison matrices of all 20 experts were rigorously verified. The calculated average Consistency Ratio (CR) for the expert group was 0.0329, which is well below the standard threshold of 0.1. This confirms a high degree of logical coherence in the experts’ initial judgments. Only judgment matrices that passed this consistency check were permitted to enter the subsequent TriFAHP and DBN processing stages. This pre-screening practice effectively prevented any fundamental logical contradictions from being propagated or amplified during the non-linear DBN weighting and fuzzy aggregation processes.

2.4.2. TriFAHP and DBN Integration Process

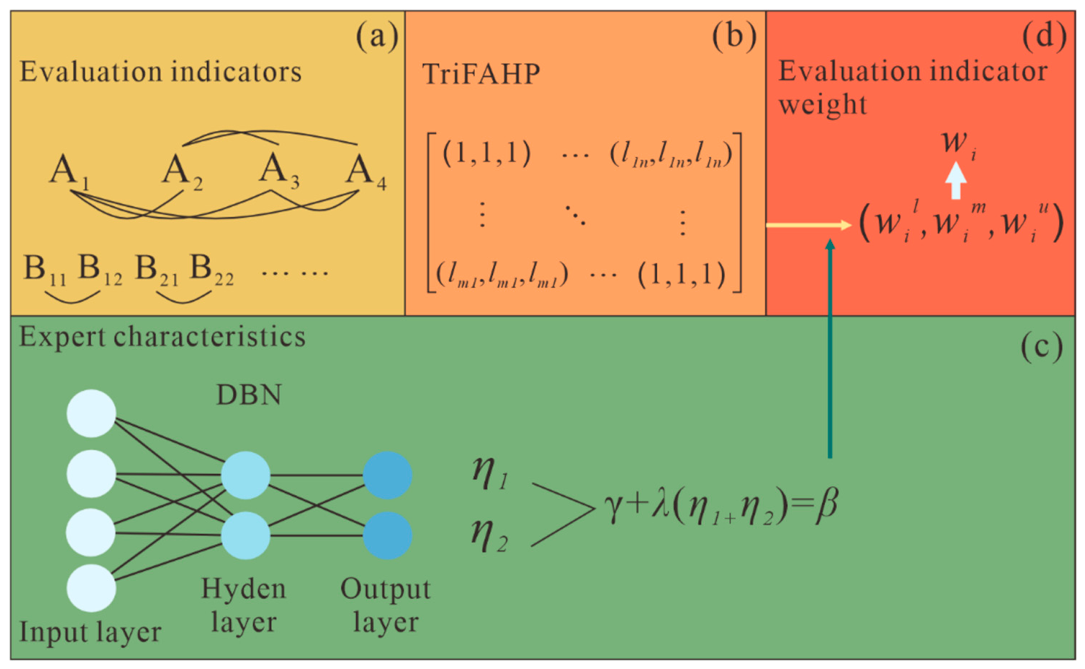
A hybrid approach combining the Triangular Fuzzy Analytic Hierarchy Process (TriFAHP) and a Deep Belief Network (DBN) was employed to calculate the weights. Simply put, a Deep Belief Network (DBN) is an advanced multi-layered machine learning model that automatically learns hidden, hierarchical patterns from complex data without requiring pre-labeled examples [53]. In this study, it acts intuitively as an “expert bias detector” that recognizes an individual’s underlying scoring habits (e.g., being consistently conservative or radical) to objectively calibrate their final weighting. To briefly delineate this methodology, TriFAHP was utilized to capture and quantify the inherent fuzziness and hesitation in human judgment by employing triangular fuzzy numbers rather than crisp values [54]. Concurrently, the DBN acts as an unsupervised feature extractor that delves into the latent patterns of expert scoring data to identify individual “decision-making styles” and potential biases. Based on these extracted latent features, the DBN generates a personalized correction coefficient β to calibrate the original scores and penalize extreme subjective deviations. Through this dynamic weighting mechanism, the DBN effectively mitigates the interference of individual subjectivity, systematically transforming purely subjective expert ratings into more objective, reliable, and consensus-driven final weights [55]. The specific steps are as follows (see Figure 3).
First, the evaluation factors were scored by experts through pairwise comparisons. The fuzziness in these judgments was processed using the TriFAHP method.
Subsequently, a DBN was utilized to analyze the subjective characteristics underlying the expert scores. Four expert attributes served as input to the model: professional field, years of experience, number of projects participated in, and a radicalism indicator (derived from experts’ choices in simulated monitoring scenarios). The numerical features (years of experience, number of projects, radicalism indicator) were standardized, and the categorical feature (professional field) was encoded using one-hot encoding.
The DBN was constructed with a single hidden layer, implemented as a Restricted Boltzmann Machine (RBM). The input layer corresponded to the preprocessed feature dimensions (3 numerical + 3 from one-hot encoding, totaling 6 nodes). The hidden layer contained two nodes, designed to extract the experience weight feature (η1) and the decision-style feature (η2), respectively. The architectural parameters, including the single hidden layer, two nodes, a learning rate of 0.05, and 200 iterations, were configured based on deep learning principles for small-sample environments [53]. Restricting the model to a shallow architecture with only two hidden nodes reduces the number of free parameters. This design forces the network to focus on extracting essential latent patterns, such as general scoring tendencies, and helps prevent the overfitting and noise-fitting issues that frequently occur in complex models. In addition, a moderate learning rate of 0.05 ensures stable model convergence without oscillation. Setting the training limit to 200 iterations allows sufficient feature extraction while preventing the network from over-training on random fluctuations within the limited dataset of 20 experts [55].
The preprocessed expert data were then fed into the trained DBN. Through forward propagation, the activation values of the two hidden nodes were obtained. These latent variables were normalized to produce the final quantified experience weight feature (η1) and decision-style feature (η2). The entire process was implemented using the BernoulliRBM module from the scikit-learn library, whose unsupervised learning nature helped mitigate overfitting risks given the sample size.
These normalized features were then used to calculate a personalized correction coefficient, β, for each expert. Referring to previous studies that applied DBNs to quantify decision-making styles, the calculation follows the formula β = γ + λ(0.5η1 + 0.5η2), where γ denotes the consensus coefficient (set to 0.7), λ represents the adjustment intensity (set to 0.3), and η1 and η2 correspond to the two DBN outputs. Setting γ to 0.7 preserves the robust baseline consensus of the expert group, while an adjustment intensity of 0.3 permits a meaningful yet controlled moderation based on individual behavioral traits [56,57,58,59].
Based on the expert correction coefficients β and the judgment matrices, the fuzzy geometric mean of each factor ( w i o r i g i n ) was calculated using Equation (1). This was followed by normalization and defuzzification to obtain the deterministic weights ( w i represent the primary weight of the i-th primary factor, and w j represent the local weight of the j-th secondary factor under the i-th primary factor). The global weight of each secondary factor ( W j g l o b a l ) was then derived (Equation (2)).
Ultimately, the comprehensive applicability score (S) for each monitoring indicator is computed through the weighted aggregation of these global weights and the k-th expert’s evaluation scores (Scoreijk) for the corresponding secondary factors (Equation (3)). The mathematical formulation is corrected and clarified as follows:
w i o r i g i n = e x p k = 1 K β k · l i , k β k , e x p k = 1 K β k · m i , k β k , e x p k = 1 K β k · u i , k β k = w i l , w i m , w i u
w i = w i l + w i m + w i u 3 , W j g l o b a l = w i × w i j
S = 1 K 1 K ( i = 1 4 j = 1 2 W j g l o b a l × S c o r e i j k )

2.4.3. Stability and Robustness Analysis of the Weights

To assess the stability and reliability of the calculated weights, a non-parametric bootstrap analysis was performed. Using the original dataset of the 20 experts’ judgment matrices and their personalized correction coefficients β, 1000 bootstrap samples were generated by random resampling with replacement. Multiple studies indicate that for estimating the standard errors or confidence intervals of common statistics, such as means, medians, or correlation coefficients, reaching 1000 iterations is generally sufficient to achieve adequate accuracy and robustness [60,61,62]. This iteration count effectively balances computational efficiency with the need to ensure the stable convergence of the non-parametric distribution, particularly when dealing with a limited original sample size. For each sample, the entire TriFAHP-DBN weight calculation process (Equations (1)–(3)) was replicated. The 95% confidence intervals (CI) for each factor weight were then derived from the 2.5th and 97.5th percentiles of the resulting bootstrap distributions.

2.5. Overview of Common Monitoring Indicators for Forest Fires

To assess the applicability of forest fire monitoring indicators in emergency fire suppression, a systematic literature retrieval and screening process was conducted to identify and evaluate candidate indicators. The literature search was executed across core academic databases, including Web of Science, Scopus, and IEEE Xplore, primarily focusing on publications from the past decade. The search strategy utilized combinations of keywords such as (“forest fire” OR “wildfire”) AND (“monitoring indicators” OR “emergency response” OR “sensor detection”).
Upon retrieving the initial pool of the literature, specific inclusion and exclusion criteria were explicitly defined to filter the candidate indicators and ensure their practical feasibility. For the indicators, the inclusion criteria required that they must exhibit observable and rapid dynamic changes during the short-term active fire suppression phase. Conversely, the exclusion criteria were set to filter out static environmental variables that do not change considerably over short periods (e.g., topography, soil type) and macro-level socio-economic factors. Most importantly, a strict “indicator-equipment pairing” criterion was enforced. This criterion mandated that for every selected indicator, there must be technologically mature, field-deployable monitoring equipment currently available. If an indicator is theoretically valuable but lacks a matching portable or remote-sensing device for immediate frontline deployment, it was strictly excluded to ensure operational relevance.
The initial survey results identified four main categories of indicators: physical state, meteorological, environmental, and human-factor indicators. Applying the aforementioned criteria, the environmental and human-factor indicators were strictly excluded. In contrast, physical state indicators and meteorological indicators exhibit clear temporal variability during forest fires. Furthermore, they are fully supported by mature technical hardware, such as portable weather stations, UAV-mounted thermal imagers, and gas detectors, thereby perfectly aligning with the “indicator-equipment pairing” standards. Based on this rigorous screening process, the highly relevant physical state and meteorological indicators are summarized in Table 2.

3. Evaluation Results of Emergency Monitoring Indicators for Forest Fires

3.1. Analysis of Expert Characteristics and β Values

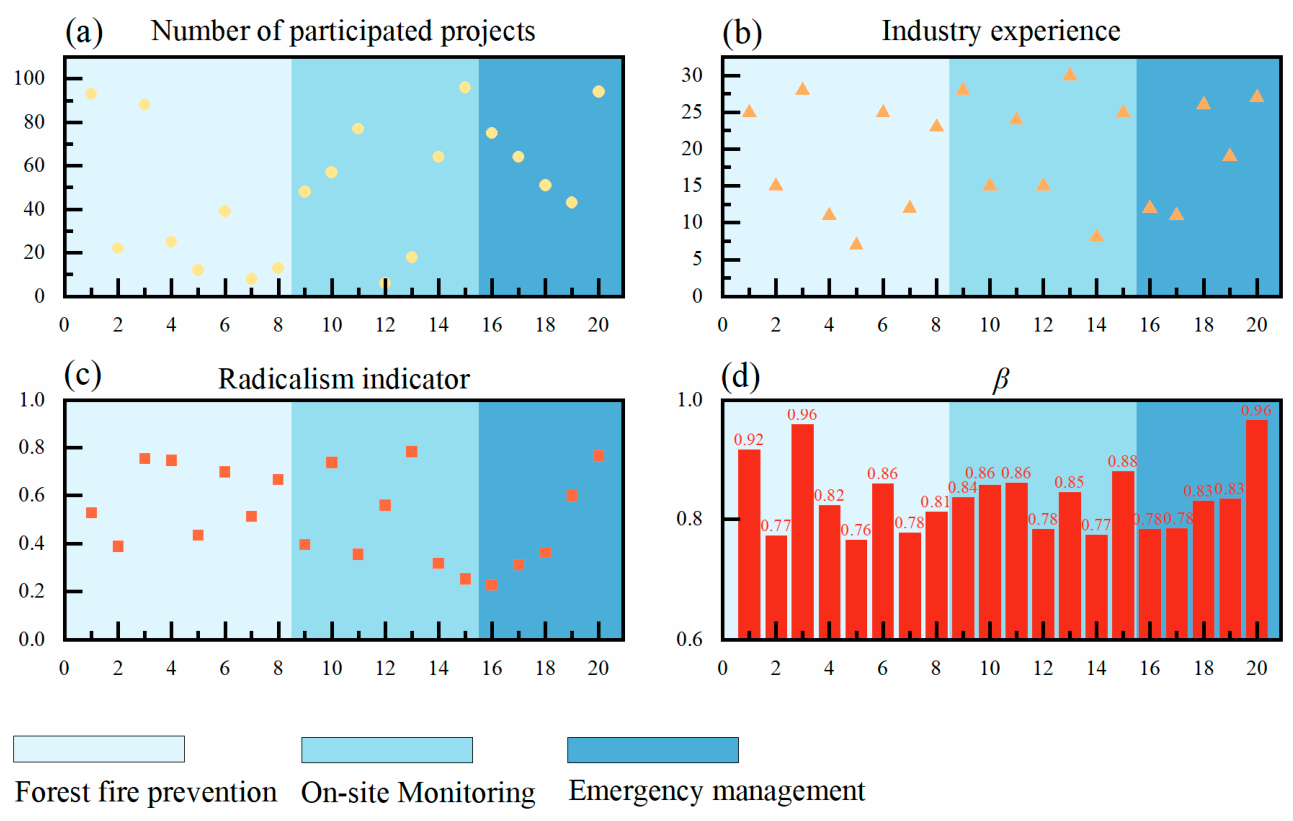
As shown in Figure 4, the 20 experts’ professional tenure ranges from 7 to 30 years, encompassing participation in 6 to 96 practical projects. Regarding decision-making styles, the quantitative extraction revealed 8 experts as radical (radicalism indicator > 0.6), 7 as neutral (0.3 to 0.6), and 5 as conservative (radicalism indicator < 0.3).
The calculated personalized correction coefficients (β) range from 0.750 to 0.975, with 13 experts (65%) receiving β values below 0.850. This wide distribution of β values quantitatively demonstrates the substantial individual differences and inherent subjective biases arising from the experts’ diverse professional backgrounds and operational focuses. Consequently, applying the DBN model to generate these personalized coefficients is highly necessary. It effectively penalizes extreme biases and ensures the mathematical objectivity and reliability of the final weighting process.

3.2. Model Evaluation Result

Based on the valid pairwise comparison matrices with an average Consistency Ratio (CR) of 0.0329, the deterministic weights for the forest fire emergency monitoring indicator evaluation model were calculated. The 95% confidence intervals (CIs) derived from the 1000 bootstrap resampling iterations are presented in Table 3. The ranking of the primary evaluation factors is as follows: Monitorability (0.3807) > Timeliness (0.3353) > Sensitivity (0.1874) > Feasibility (0.0966). The non-overlapping bootstrap confidence intervals confirm that these weight differences are statistically significant. Among the secondary factors, accuracy (0.6135) and indicator response lag (0.8000) dominated their respective primary dimensions. This weight distribution highlights that optimizing a forest fire emergency monitoring system must strictly prioritize data accuracy and real-time acquisition.
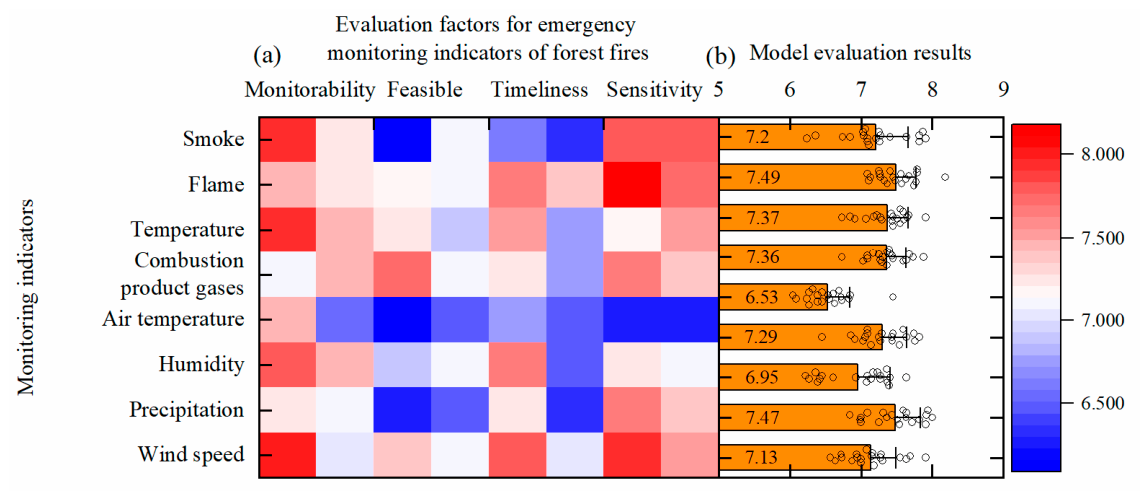
Following the weight calculation, the comprehensive applicability scores (S) for each candidate monitoring indicator were computed using Equation (3). The evaluation results revealed a distinct group of four core indicators: wind speed, temperature, flame, and combustion product gas. Their scores were significantly higher than those of the other candidates, justifying their selection as the most suitable indicators for emergency monitoring. However, this ordering should be interpreted as a flexible guidance tool for emergency decision making rather than an absolute hierarchy, as the optimal choice dynamically shifts depending on specific contextual factors. For instance, regarding the physical evolution of fire stages, the distinct disaster demands inherently dictate that flame and wind speed take precedence during the ignition phase, whereas temperature emerges as the core indicator during the fully developed stage. Furthermore, regarding terrain types, in steep or inaccessible mountainous regions, indicators relying on heavy ground equipment might see a significant decrease in their feasibility scores, making remote sensing indicators like temperature and smoke much more preferable. Additionally, concerning resource availability, in scenarios with constrained budgets or limited technical support, highly intuitive visual indicators such as flame and smoke monitored via basic optical devices would naturally rank higher than complex combustion gas concentrations requiring expensive analytical instruments. Therefore, this model provides a scientific baseline that frontline commanders should dynamically adjust based on actual field constraints. The detailed scores across the primary dimensions for these indicators are illustrated in Figure 5.
Based on the evaluation ranking of indicators and their multidimensional performance profiles revealed in Figure 5, the core competencies and application boundaries of each indicator can be delineated. For instance, the temperature indicator scored highest in Monitorability and Sensitivity but received only a moderate score in Feasibility. This characteristic determines its primary suitability for monitoring high-intensity fire scenarios where stable deployment is possible and precise tracking of fire intensity is required. Consequently, forest fire emergency monitoring should not rely on a single indicator or a fixed combination. Instead, it should dynamically prioritize the most pertinent indicators based on the spatiotemporal evolution of the fire and the core demands of each stage. Accordingly, a differentiated monitoring priority scheme is proposed:
1. Ignition stage: Indicators with high Sensitivity and Timeliness are critical. Flame and wind speed scored highest in these dimensions (as per Figure 5), supporting their prioritization for early detection. In contrast, while temperature and gas are also sensitive, they typically respond more slowly to initial ignition signals compared to the immediate visual detection of flame and the immediate influence of wind on initial fire behavior.
2. Spread stage: Demands for spatial coverage and data frequency increase. Wind speed maintains a high composite score and is the dominant meteorological driver of spread, confirming its role as a key indicator. While temperature and gas remain detectable during this phase, they provide less direct information about the direction and rate of fire front movement compared to wind speed and flame morphology, which are essential for tactical firefighting decisions.
3. Fully developed stage: Environmental extremes necessitate robust and stable data. Temperature, which demonstrated the highest score in Monitorability, is prioritized for tracking fire intensity under stable conditions. Flame and gas monitoring may be compromised by dense smoke and extreme heat during this stage, whereas temperature sensing (e.g., thermal imaging) can penetrate smoke and provide reliable intensity mapping.

3.3. Weight Calculation and Evaluation Results for Matching Monitoring Equipment

Following the “indicator-equipment pairing” logical framework established in Section 2, a dedicated evaluation was conducted for the hardware equipment matching the four core indicators. As previously justified, the equipment evaluation model specifically adopted three primary dimensions: Monitorability, Feasibility, and Timeliness. By re-normalizing the previously established weight vectors to exclude the Sensitivity dimension, the global weights for the equipment evaluation model were derived and are presented in Table 4.
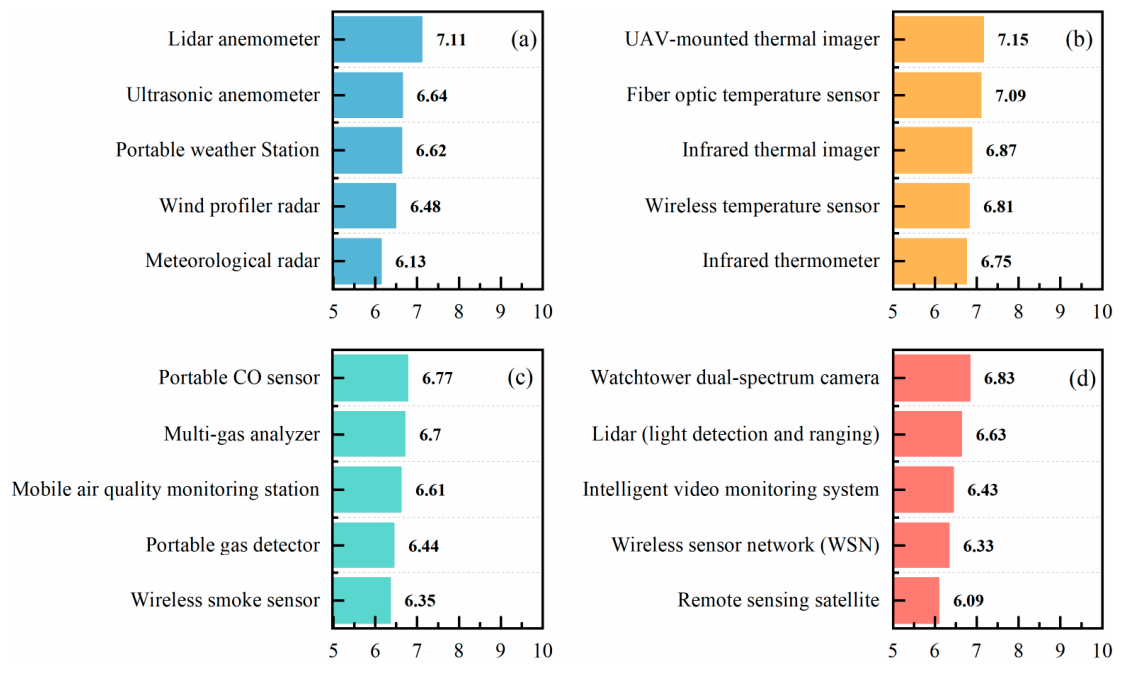
To evaluate the practical applicability of the equipment, a follow-up survey was deployed to the identical panel of experts during the second stage of data collection. The curated list of matching equipment and the specific scoring questionnaire utilized for this stage are detailed in Appendix C. Based on the calculated equipment evaluation weights and the experts’ aggregated scores, the final suitability scores for various monitoring devices were computed and are displayed in Figure 6.
The results indicate a strong technological consensus regarding operational effectiveness in complex fire scenes. For instance, among the equipment matching the temperature indicator, UAV-mounted thermal imagers received the highest score (7.15). This quantitatively reflects their superior data acquisition accuracy and agile deployment capabilities in highly dynamic environments. Similarly, lidar anemometers scored highest (7.11) for wind speed monitoring. These quantitative evaluation results successfully translate the theoretical monitoring indicators into tangible, optimal equipment configurations, providing direct hardware selection guidance for frontline emergency response.

4. Discussion

4.1. Statistical Validation and Discriminative Power of the Model

This study employs the individual correction coefficient β to mitigate subjective biases during the expert scoring process, setting the basic consensus coefficient at γ = 0.7 and the individual adjustment intensity at λ = 0.3. To ensure the scientific validity of these key parameter settings, a comprehensive sensitivity analysis was conducted on γ. This analysis was performed under the strict constraint of γ + λ = 1, with γ systematically varied in increments of 0.1 within the operational range of 0.5 to 1.0. The objective was to investigate how fluctuations in these threshold parameters influence the final global weights of the primary evaluation dimensions and the ultimate ranking of the monitoring indicators.
The analytical outcomes presented in Table 5 reveal that as γ shifts from 0.5 to 1.0, minor mathematical fluctuations occur in the absolute values of the dimensional weights. However, the hierarchical ranking of the primary dimensions (Monitorability, Timeliness, Sensitivity, Feasibility) remains absolutely stable. Notably, the calculation of standard deviations for the weight vectors across all levels under different γ values reveals that when γ = 0.7 (corresponding to λ = 0.3), the volatility of the weight results is minimized, indicating optimal model stability. This quantitative evidence proves that assigning a baseline weight of 0.7 to preserve group consensus, while reserving 0.3 to accommodate valuable individual heuristic traits, optimally balances decision-making conformity and innovation.
Furthermore, when γ = 1.0 and λ = 0.0, the model reverts to the traditional Triangular Fuzzy Analytic Hierarchy Process, stripping away the DBN’s feature extraction and personalized correction. The weight distribution generated under these conditions is designated as “before correction,” representing the raw expert consensus. By comparing this benchmark against the distribution “after correction” (γ = 0.7), a significant reduction in subjective dispersion was observed.
As delineated in Table 6, the implementation of the DBN-derived β correction successfully reduced the statistical dispersion of weights across all indicators by an average of approximately 30%. This firmly quantifies the efficacy of the proposed mechanism in filtering out subjective expert biases and establishing a highly objective group consensus.
Building upon these mathematically stable weights, the comprehensive applicability scores (S) for each monitoring indicator were computed. To assess the statistical significance of the observed scoring differences, a non-parametric Kruskal–Wallis H test was executed on the underlying expert-derived data, followed by post hoc Dunn’s tests for rigorous pairwise comparisons. This approach is highly appropriate for the ordinal nature of expert scoring data when evaluating multiple independent candidates. The Kruskal–Wallis test revealed a statistically significant divergence in the overall applicability scores among the evaluated indicators (H = 87.4, p < 0.001). The post hoc analysis confirmed that the median scores of the top four core indicators (wind speed, temperature, flame, and gas) were significantly higher than those of the remaining candidates (adjusted p < 0.01 for all significant pairwise comparisons). No significant difference was detected between the specific scores of wind speed and flame (adjusted p > 0.05), indicating their comparable necessity in acute emergency contexts. This rigorous statistical sequence provides an irrefutable justification for selecting these specific variables as the core monitoring targets.
Finally, to verify the structural validity of the underlying evaluation model, the inter-correlations among the four primary dimensions were analyzed (presented in Table 7). Moderate positive correlations were identified between Monitorability and Timeliness (r = 0.57) and between Feasibility and Sensitivity (r = 0.52). The variance inflation factors (VIF) for all dimensions were extremely low (ranging from 1.7 to 2.4), which is fundamentally below the common threshold of 5. This confirms the complete absence of harmful multicollinearity, guaranteeing that each dimension contributes unique and independent evaluative information.

4.2. Case Studies and Empirical Support for the Monitoring Strategies

While the proposed evaluation framework and multi-stage monitoring strategies are theoretically derived, their practical rationality and operational accuracy are strongly corroborated by recent large-scale real-world wildfire responses. A prominent example is the operational technology deployed during the catastrophic Australian bushfires from 2019 to 2020 [75]. During the initial ignition and early warning phases, response agencies heavily relied on satellite telemetry and dispersed sensor networks to capture nascent thermal anomalies and smoke plumes. As the crisis escalated into the rapid spread stage, Unmanned Aerial Vehicles (UAVs) equipped with lidar anemometers were dispatched to map real-time wind fields, successfully predicting the fireline trajectory. Subsequently, during the fully developed stage characterized by extreme heat and dense smoke, UAV-mounted thermal imagers were deployed to penetrate the visual obstructions and precisely map the core burning zones. Similarly, based on a phased management philosophy, emergency management departments in China have successfully constructed short-term fire risk prediction systems utilizing dynamic MODIS meteorological data [76].
Furthermore, numerous single-stage empirical studies have provided strong support for the evaluation results of this research. For instance, Yao, Yang, Zhang and Liu [19] utilized satellite imagery to monitor temperature and abnormal fire spot indicators during the early stage of fires, which effectively triggered rapid early warnings. Conversely, Valencia, Melnik, Kelly, Jerram, Wallace, Aguilar-Arguello, Katurji, Pearce, Gross and Strand [20] utilized UAV technology to dynamically track fireline intensity and wind evolution during the fire spread stage, significantly assisting in fire containment. These real-world operational deployments perfectly mirror the core indicators (flame, wind speed, temperature) and the top-ranked equipment (UAV thermal imagers, lidar anemometers) quantitatively identified by our evaluation model. This demonstrates that the staged monitoring theory proposed in this study is practically feasible and highly reasonable. Moreover, this study lays a solid theoretical foundation for “how to scientifically select these indicators and equipment,” effectively complementing previous research paradigms that relied heavily on empirical habits. Simultaneously, the practical achievements of previous studies conversely validate the scientific accuracy and applicability of our evaluation model.

4.3. Methodological Contributions, Limitations, and Future Integrations

The primary methodological contribution of this research lies in providing a rigorous theoretical foundation for indicator selection. Historically, previous studies and emergency protocols have directly adopted conventional indicators based on empirical habits, lacking a systematic justification for “why these specific indicators must be chosen.” By deconstructing the physical performance boundaries of both indicators and hardware, this study replaces subjective experience with a quantifiable, multi-dimensional decision-making paradigm, significantly enhancing the scientific rigor of emergency resource allocation.
Despite establishing a relatively comprehensive evaluation system, this framework exhibits certain inherent limitations. First, regarding the evaluation subjects, the pool of candidate monitoring indicators and equipment collected and analyzed may not be entirely exhaustive and might not fully encompass all emerging niche technologies. Second, regarding the evaluation dimensions, the factors considered by the model may not be comprehensive enough. For example, during the equipment applicability evaluation process, the model did not incorporate economic factors such as financial cost or procurement logistics. The original intention behind this design was based on the study’s core premise: in extreme emergency scenarios, there is an exceptionally high operational interdependency between monitoring indicators and equipment. This dictates that during severe crisis management, life-saving operational performance (such as accuracy, stability, and deployment agility) must take absolute precedence over economic considerations. Therefore, the evaluation factors were strictly restricted to the performance domain. Nevertheless, we acknowledge that the omission of economic and cost constraints limits the model’s utility in guiding holistic administrative procurement planning.
To address these limitations and further deepen the practical value of this research, future studies can be expanded along two primary trajectories. Horizontally, future research can apply this evaluation framework to more detailed forest fire classifications (such as downhill fires or crown fires) or specifically consider the impact of different vegetation types (such as coniferous forests, broadleaf forests, or shrublands) on fire behavior [77]. This will enable a more refined and scenario-specific evaluation and recommendation of applicable indicators and equipment. Vertically, future studies should focus on deepening the model’s operational integration. By positioning this model as a preliminary decision-support engine for fire emergency response and integrating it with advanced Artificial Intelligence (AI) and Internet of Things (IoT) technologies, subsequent systems can radically optimize the automated recognition of initial forest fire signals, thereby securing critical time windows for subsequent precise disposal. Moreover, the underlying theoretical foundation regarding emergency monitoring requirements established in this study is, to a certain extent, applicable to other types of disasters. Consequently, by appropriately substituting the candidate indicator pool and the corresponding evaluation dimensions, this integrated TriFAHP and DBN evaluation paradigm is expected to be successfully transferred to other disaster emergency environments, such as geological hazard emergency monitoring.

5. Conclusions

This study addressed the critical gap in systematic decision-support tools for the scientific selection of monitoring indicators, the coordinated configuration of multi-indicator schemes, and the rational optimization of monitoring equipment in forest fire emergency response. By integrating the spatiotemporal evolution characteristics of forest fires with emergency monitoring requirements, and employing a hybrid weighting method combining the Triangular Fuzzy Analytic Hierarchy Process (TriFAHP) and Deep Belief Network (DBN), the research establishes a standardized evaluation framework. The main conclusions are as follows:
(1) A robust evaluation model for forest fire emergency monitoring indicators was established. The model, structured with four primary and eight secondary factors, utilized the TriFAHP-DBN combined method to objectively determine factor weights. The reliability of the weight system was confirmed through a high expert consensus (CR = 0.0329), bootstrap confidence interval testing, and sensitivity analysis. These validations collectively demonstrated that the core conclusions remain highly stable under weight perturbations.
(2) Wind speed, temperature, flame, and combustion product gas were evaluated as highly applicable indicators for forest and grassland fires. Furthermore, by integrating these quantitative evaluation results with the spatiotemporal evolution rules of fires, a differentiated monitoring strategy was formulated to prioritize specific indicators across the ignition, spread, and fully developed stages.
(3) Extending the indicator evaluation logic, a structured equipment assessment model was constructed. Based on this extended framework, devices such as UAV-mounted thermal imagers and lidar anemometers were evaluated as the most applicable monitoring equipment.


Author Contributions

Conceptualization, C.W. and J.L.; methodology, J.L.; software, J.L.; validation, J.L. and Y.W.; investigation, G.G.; resources, G.G.; data curation, J.L.; writing—original draft preparation, J.L.; writing—review and editing, C.W. and G.G.; funding acquisition, G.G. All authors have read and agreed to the published version of the manuscript.

Funding

This research was funded by the National Key R&D Program of China, grant number 2024YFB3411305.

Data Availability Statement

The original contributions presented in this study are included in the article material. Further inquiries can be directed to the corresponding author.

Conflicts of Interest

The authors declare no conflicts of interest.

Abbreviations

The following abbreviations are used in this manuscript:
TriFAHPTriangular Fuzzy Analytic Hierarchy Process
DBNDeep Belief Networks
RBMRestricted Boltzmann Machine
CD-kContrastive Divergence-k
CI Confidence Interval
CRConsistency Ratio
VIFVariance Inflation Factor
UAVUnmanned Aerial Vehicle
LoRaLong Range

Appendix A. Evaluation Factor Comparison Questionnaire Based on TriFAHP

Dear Expert, thank you for participating in this survey. Before proceeding to the core evaluation, please kindly provide your basic professional background information in Table A1. This information is strictly confidential and will exclusively be utilized by the algorithm to calculate personalized correction coefficients, thereby ensuring the maximum mathematical objectivity of the final evaluation weights.
Table A1. Basic expert information.
Number of projects involved:                                    
Years of experience:                                    
Field of expertise:                                    
Following the background information, this section is used to establish the relative importance of evaluation factors via expert pairwise comparison. Using your professional expertise, please assess the importance of the left-side factor (A) against the top-side factor (B), entering three values (l, m, u) in the corresponding cell to represent a triangular fuzzy number.
Please utilize the standard 1–9 scale to compare factors within the same hierarchy and determine their relative importance.
Table A2. Meaning of importance scale (based on the 1–9 scale method).
ScaleMeaning (Comparison of A and B)
1A is equally important as B.
3A is slightly more important than B.
5A is obviously (or strongly) more important than B.
7A is strongly (or very strongly) more important than B.
9A is extremely more important than B.
2, 4, 6, 8Intermediate values between the adjacent judgments above.
ReciprocalIf B is more important than A, please take the reciprocal of the above scales (e.g., 1/3, 1/5, etc.).
Example of how to fill in the form: If you believe the importance of “Accuracy” (A) compared to “Monitoring Frequency” (B) lies between “Slightly Important” and “Obviously Important,” and is most likely “Slightly Important,” you should fill in (2, 3, 4).
Table A3. Pairwise comparison matrix of primary evaluation factors.
A/BMonitorabilityFeasibilityTimelinessSensitivity
Monitorability(1, 1, 1)
Feasibility (1, 1, 1)
Timeliness (1, 1, 1)
Sensitivity (1, 1, 1)
Note: Cells along the diagonal are set to 1. Since the matrix is reciprocal (Aij = 1/Aji), you only need to complete either the upper or lower triangular section. The system will generate the other section automatically.
Table A4. Pairwise comparison matrix of secondary factors under Monitorability.
A/BAccuracyStability
Accuracy(1, 1, 1)
Stability (1, 1, 1)
Table A5. Pairwise comparison matrix of secondary factors under Feasibility.
A/BEquipment DeploymentScope of the Monitoring Function
Equipment deployment(1, 1, 1)
Scope of the monitoring function (1, 1, 1)
Table A6. Pairwise comparison matrix of secondary factors under Timeliness.
A/BLagging Response of IndicatorsEffective Duration of Monitoring Indicators
Lagging response of indicators(1, 1, 1)
Effective duration of monitoring indicators (1, 1, 1)
Table A7. Pairwise comparison matrix of secondary factors under sensitivity.
A/BSensitivity to Sudden DisastersSustainability of Indicator Trends
Sensitivity to sudden disasters(1, 1, 1)
Sustainability of indicator trends (1, 1, 1)

Appendix B. Expert Scoring Form for Forest and Grassland Fire Emergency Monitoring Indicators

This appendix is used for experts to directly score the performance of specific monitoring indicators across various secondary evaluation factors. Experts are required to assign an integer score ranging from 1 to 10 based on the applicability of the indicator in emergency monitoring scenarios, according to the following criteria. Table A9 presents the scoring form for forest fire emergency monitoring indicators along with the scoring results from one expert.
Table A8. Meaning of the importance scale.
ScaleMeaning
8 to 10 points (Very important)The indicator performs excellently in this aspect and represents a core advantage for emergency monitoring.
5 to 7 points (Important)The indicator performs well in this aspect and possesses good applicability.
2 to 4 points (Average)The indicator performs averagely in this aspect or has obvious limitations.
Table A9. Scoring sheet for forest fire emergency monitoring indicators.
Emergency Monitoring IndicatorsMonitorabilityFeasibilityTimelinessSensitivity
AccuracyStabilityEquipment DeploymentScope of the Monitoring FunctionLagging Response of IndicatorsEffective Duration of Monitoring IndicatorsSensitivity to Sudden DisastersSustainability of Indicator Trends
Smoke76545454
Flame87545465
Temperature98656587
Combustion product gases65434332
Air temperature76545454
Humidity76545454
Precipitation87545487
Wind speed54433232

Appendix C. Expert Scoring Form for the Applicability of Emergency Monitoring Equipment

This appendix is used to evaluate the applicability of common forest fire monitoring equipment in emergency scenarios. Based on the typical technical characteristics of various types of equipment and practical emergency experience, experts are requested to assign an integer score ranging from 1 to 10 for their performance across each evaluation factor, according to the following criteria. Table A10 presents the scoring results from one expert regarding the applicability of emergency monitoring equipment.
Scoring criteria:
Eight to ten points (Excellent performance): The equipment possesses a prominent advantage in this aspect and fully meets the stringent requirements of emergency monitoring.
Five to seven points (Good performance): The equipment performs reliably in this aspect and is capable of successfully handling emergency monitoring tasks.
Two to four points (Average or limited performance): The equipment has obvious shortcomings or limitations in this aspect, requiring careful consideration before emergency application.
1 point (Poor performance): The characteristics of the equipment in this aspect are unsuitable for emergency monitoring scenarios.
Table A10. Expert scoring sheet for the applicability of emergency monitoring equipment.
Monitoring EquipmentAccuracyStabilityEquipment DeploymentScope of the Monitoring FunctionLagging Response of IndicatorsEffective Duration of Monitoring Indicators
Lidar anemometer99108910
Ultrasonic anemometer8710798
Portable weather station995879
Wind profiler radar976656
Meteorological radar976656
UAV-mounted thermal imager665465
Fiber optic temperature sensor555555
Infrared thermal imager555555
Wireless temperature sensor843434
Infrared thermometer445434
Portable CO sensor644434
Multi-gas analyzer444354
Mobile air quality monitoring station333333
Portable gas detector231221
Wireless smoke sensor99108910
Watchtower dual-spectrum camera777777
Lidar (light detection and ranging)866565
Intelligent video monitoring system555555
Wireless sensor network (WSN)888888
Remote sensing satellite879798

References

  1. Eslamzadeh, M.K.; Grilo, A.; Cruz, P.E. All Lives Matter: A Model for Resource Allocation to Fire Departments in Portugal. Fire 2024, 7, 206. [Google Scholar] [CrossRef] [Scilit]
  2. Masinda, M.M.; Sun, L.; Wang, G.; Hu, T. Moisture content thresholds for ignition and rate of fire spread for various dead fuels in northeast forest ecosystems of China. J. For. Res. 2020, 32, 1147–1155. [Google Scholar] [CrossRef] [Scilit]
  3. Dong, S.; Jiang, Y.; Yu, X. Analyses of the Impacts of Climate Change and Forest Fire on Cold Region Slopes Stability by Random Finite Element Method. Landslides 2021, 18, 2531–2545. [Google Scholar] [CrossRef] [Scilit]
  4. Devkota, J.U. Statistical analysis of active fire remote sensing data: Examples from South Asia. Environ. Monit. Assess. 2021, 193, 608. [Google Scholar] [CrossRef] [Scilit]
  5. Momeni, M.; Al-e-Hashem, S.M.J.M. Collaboration of thermal sensors and drones in fighting wildfires; Mathematical model and heuristic approach. Internet Things 2024, 26, 101168. [Google Scholar] [CrossRef] [Scilit]
  6. Tareq, K. Ultra-Low-Power Architecture for the Detection and Notification of Wildfires Using the Internet of Things. IoT 2023, 4, 1–26. [Google Scholar] [CrossRef] [Scilit]
  7. Zacharakis, I.; Tsihrintzis, V.A. Integrated wildfire danger models and factors: A review. Sci. Total Environ. 2023, 899, 165704. [Google Scholar] [CrossRef] [Scilit]
  8. Palatkin, V.; Andryushin, A.; Getmantsev, D. Using Logistic Regression for Fire Prediction Based on Meteorological Data. In Proceedings of the Materials of the International Scientific and Practical Conference Dedicated to the 95th Anniversary of Voronezh State Forest Engineering University Named After G. F. Morozov and the 80th Anniversary of the Victory in the Great Patriotic War of 1941–1945 «Modeling Information Systems and Technologies—2025», Metz, France, 4–6 June 2025; pp. 363–368. [Google Scholar] [CrossRef] [Scilit]
  9. Hiremath, H.; Kannan, S.R. Integrated Anomaly Detection and Early Warning System for Forest Fires in the Odisha Region. Atmosphere 2024, 15, 1284. [Google Scholar] [CrossRef] [Scilit]
  10. Liu, B.; Chen, Z.; Qu, M.; Yuan, F.; Mabi, A.; Sheng, M.; Liu, J.; Han, F.; Zhang, W.; Huo, H. Dextral shear initiation of the Kangguer Shear Zone in the East Tianshan: Constraints from a “porphyroclast” system. J. Asian Earth Sci. 2024, 268, 106114. [Google Scholar] [CrossRef] [Scilit]
  11. Więckowski, J.; Kizielewicz, B.; Sałabun, W. Fuzzy RANCOM: A novel approach for modeling uncertainty in decision-making processes. Inf. Sci. 2025, 694, 121716. [Google Scholar] [CrossRef] [Scilit]
  12. Wang, G.; Qiao, J.; Bi, J.; Zhou, M. An Efficient Deep Belief Network with Fuzzy Learning for Nonlinear System Modeling. In Proceedings of the 2019 IEEE International Conference on Systems, Man and Cybernetics (SMC), Bari, Italy, 6–9 October 2019; pp. 3549–3554. [Google Scholar] [CrossRef] [Scilit]
  13. Crowley, M.A.; Stockdale, C.A.; Johnston, J.M.; Wulder, M.A.; Liu, T.; McCarty, J.L.; Rieb, J.T.; Cardille, J.A.; White, J.C. Towards a whole-system framework for wildfire monitoring using Earth observations. Glob. Change Biol. 2022, 29, 1423–1436. [Google Scholar] [CrossRef] [Scilit]
  14. Mohapatra, A.; Trinh, T. Early Wildfire Detection Technologies in Practice—A Review. Sustainability 2022, 14, 12270. [Google Scholar] [CrossRef] [Scilit]
  15. Xu, Y.; Li, J.; Zhang, F. A UAV-Based Forest Fire Patrol Path Planning Strategy. Forests 2022, 13, 1952. [Google Scholar] [CrossRef] [Scilit]
  16. Abdusalomov, A.; Umirzakova, S.; Bakhtiyor Shukhratovich, M.; Mukhiddinov, M.; Kakhorov, A.; Buriboev, A.; Jeon, H.S. Drone-Based Wildfire Detection with Multi-Sensor Integration. Remote Sens. 2024, 16, 4651. [Google Scholar] [CrossRef] [Scilit]
  17. Or, D.; Furtak-Cole, E.; Berli, M.; Shillito, R.; Ebrahimian, H.; Vahdat-Aboueshagh, H.; McKenna, S.A. Review of wildfire modeling considering effects on land surfaces. Earth-Sci. Rev. 2023, 245, 104569. [Google Scholar] [CrossRef] [Scilit]
  18. Varotsos, C.A.; Krapivin, V.F.; Mkrtchyan, F.A. A New Passive Microwave Tool for Operational Forest Fires Detection: A Case Study of Siberia in 2019. Remote Sens. 2020, 12, 835. [Google Scholar] [CrossRef] [Scilit]
  19. Yao, H.; Yang, Z.; Zhang, G.; Liu, F. Forest Fire Detection Based on Spatial Characteristics of Surface Temperature. Remote Sens. 2024, 16, 2945. [Google Scholar] [CrossRef] [Scilit]
  20. Valencia, A.; Melnik, K.O.; Kelly, R.J.; Jerram, T.C.; Wallace, H.; Aguilar-Arguello, S.; Katurji, M.; Pearce, H.G.; Gross, S.; Strand, T. Mapping fireline intensity and flame height of prescribed gorse wildland fires. Fire Saf. J. 2023, 140, 103862. [Google Scholar] [CrossRef] [Scilit]
  21. Zhai, G.; Dou, L.; Gu, Y.; Zhou, H.; Feng, L.; Jiang, L.; Dong, J.; Sun, J.; Li, H. From spark to suppression: An overview of wildfire monitoring, progression prediction, and extinguishing techniques. Int. J. Appl. Earth Obs. Geoinf. 2025, 140, 104600. [Google Scholar] [CrossRef] [Scilit]
  22. Battistoni, P.; Cantone, A.A.; Martino, G.; Passamano, V.; Romano, M.; Sebillo, M.; Vitiello, G. A Cyber-Physical System for Wildfire Detection and Firefighting. Future Internet 2023, 15, 237. [Google Scholar] [CrossRef] [Scilit]
  23. Lertsinsrubtavee, A.; Kanabkaew, T.; Raksakietisak, S. Detection of forest fires and pollutant plume dispersion using IoT air quality sensors. Environ. Pollut. 2023, 338, 122701. [Google Scholar] [CrossRef] [Scilit] [PubMed]
  24. Freira, D.; Coutinho, C. Wildfire Detection Based on IoT Technology. In Proceedings of the 2024 8th International Symposium on Multidisciplinary Studies and Innovative Technologies (ISMSIT), Ankara, Turkiye, 7–9 November 2024; pp. 1–6. [Google Scholar] [CrossRef] [Scilit]
  25. Lioliopoulos, P.; Oikonomou, P.; Boulougaris, G.; Kolomvatsos, K. Real-Time Monitoring of Wildfire Pollutants for Health Impact Assessment. In Proceedings of the IGARSS 2024—2024 IEEE International Geoscience and Remote Sensing Symposium, Athens, Greece, 7–12 July 2024; pp. 2373–2378. [Google Scholar] [CrossRef] [Scilit]
  26. Lioliopoulos, P.; Oikonomou, P.; Boulougaris, G.; Kolomvatsos, K. Integrated Portable and Stationary Health Impact-Monitoring System for Firefighters. Sensors 2024, 24, 2273. [Google Scholar] [CrossRef] [Scilit] [PubMed]
  27. Huynh-Ly, T.-N. Comparison of Methods for Designing and Deploying an IoT-Based Forest Fire Warning System: A Case Study in An Giang, Vietnam. Int. J. Res. Appl. Sci. Eng. Technol. 2025, 13, 3480–3487. [Google Scholar] [CrossRef] [Scilit]
  28. Janardhan, M.; Likhitha, B.; Purandeswari, O.; Rani, P.; Harshini, G. IoT and AI for Efficient Forest Fire Detection, Monitoring, and Risk Prediction With Real-Time Alerts. In Proceedings of the 2025 5th International Conference on Trends in Material Science and Inventive Materials (ICTMIM), Kanyakumari, India, 7–9 April 2025. [Google Scholar]
  29. Kotaridis, I.; Lazaridou, M. Integrating image segmentation in the delineation of burned areas on Sentinel-2 and Landsat 8 data. Remote Sens. Appl. Soc. Environ. 2023, 30, 100944. [Google Scholar] [CrossRef] [Scilit]
  30. Fei, L.; Li, T.; Ding, W. Dempster–Shafer theory-based information fusion for natural disaster emergency management: A systematic literature review. Inf. Fusion 2024, 112, 102585. [Google Scholar] [CrossRef] [Scilit]
  31. Reddy, P.D.K.; Margala, M.; Shankar, S.S.; Chakrabarti, P. Early fire danger monitoring system in smart cities using optimization-based deep learning techniques with artificial intelligence. J. Reliab. Intell. Environ. 2024, 10, 197–210. [Google Scholar] [CrossRef] [Scilit]
  32. Huang, X.; Tian, Z.; Wang, C.; Xie, F.; Ji, J. Research on Mine Smoke Detection Technology Based on Multi-Feature Fusion Analysis. Fire Technol. 2024, 60, 3829–3851. [Google Scholar] [CrossRef] [Scilit]
  33. An, R.; Lin, P.; Liu, C.; Zhong, M.; Li, Z.; Chen, W.; Xia, Y. Smoke diffusion mechanism and mitigation design for fire accidents in a tunnel-groove structure of a large hydropower station. Tunn. Undergr. Space Technol. 2024, 149, 105785. [Google Scholar] [CrossRef] [Scilit]
  34. Deng, L.; Yuan, H.; Chen, J.; Zhang, M.; Su, G.; Zhou, Y.; Chen, Y. Experimental investigation and field application of acoustic emission array for landslide monitoring. Landslides 2024, 21, 71–81. [Google Scholar] [CrossRef] [Scilit]
  35. Gara, T.W.; Rahimzadeh-Bajgiran, P.; Weiskittel, A. Determination of foliar traits in an ecologically distinct conifer species in Maine using Sentinel-2 imagery and site variables: Assessing the effect of leaf trait expression and upscaling approach on prediction accuracy. ISPRS J. Photogramm. Remote Sens. 2022, 193, 150–163. [Google Scholar] [CrossRef] [Scilit]
  36. Xu, H.; Zhang, G.; Chu, R.; Zhang, J.; Yang, Z.; Wu, X.; Xiao, H. Detecting forest fire omission error based on data fusion at subpixel scale. Int. J. Appl. Earth Obs. Geoinf. 2024, 128, 103737. [Google Scholar] [CrossRef] [Scilit]
  37. Aslan, Y.E.; Korpeoglu, I.; Ulusoy, Ö. A framework for use of wireless sensor networks in forest fire detection and monitoring. Comput. Environ. Urban Syst. 2012, 36, 614–625. [Google Scholar] [CrossRef] [Scilit]
  38. Theiler, M.; Ibáñez, S.; Legatiuk, D.; Smarsly, K. Metaization concepts for monitoring-related information. Adv. Eng. Inform. 2020, 46, 101158. [Google Scholar] [CrossRef] [Scilit]
  39. Sabino, A.; Lima, L.N.; Brito, C.; Feitosa, L.; Caetano, M.F.; Barreto, P.S.; Silva, F.A. Forest fire monitoring system supported by unmanned aerial vehicles and edge computing: A performance evaluation using petri nets. Clust. Comput. 2024, 27, 9735–9755. [Google Scholar] [CrossRef] [Scilit]
  40. De la Fuente, R.; Aguayo, M.M.; Contreras-Bolton, C. An optimization-based approach for an integrated forest fire monitoring system with multiple technologies and surveillance drones. Eur. J. Oper. Res. 2024, 313, 435–451. [Google Scholar] [CrossRef] [Scilit]
  41. Mitsopoulos, P.; Peña, M. Characterizing Coastal Wind Speed and Significant Wave Height Using Satellite Altimetry and Buoy Data. Remote Sens. 2023, 15, 987. [Google Scholar] [CrossRef] [Scilit]
  42. Meng, L.; O’Hehir, J.; Gao, J.; Peters, S.; Hay, A. A theoretical framework for improved fire suppression by linking management models with smart early fire detection and suppression technologies. J. For. Res. 2024, 35, 86. [Google Scholar] [CrossRef] [Scilit]
  43. Zheng, S.; Gao, P.; Zhou, Y.; Wu, Z.; Wan, L.; Hu, F.; Wang, W.; Zou, X.; Chen, S. An Accurate Forest Fire Recognition Method Based on Improved BPNN and IoT. Remote Sens. 2023, 15, 2365. [Google Scholar] [CrossRef] [Scilit]
  44. Wang, Z.; He, B.; Chen, R.; Fan, C. Improving Wildfire Danger Assessment Using Time Series Features of Weather and Fuel in the Great Xing’an Mountain Region, China. Forests 2023, 14, 986. [Google Scholar] [CrossRef] [Scilit]
  45. Jolly, W.M.; Freeborn, P.H.; Bradshaw, L.S.; Wallace, J.; Brittain, S. Modernizing the US National Fire Danger Rating System (version 4): Simplified fuel models and improved live and dead fuel moisture calculations. Environ. Model. Softw. 2024, 181, 106181. [Google Scholar] [CrossRef] [Scilit]
  46. Al-Smadi, Y.; Alauthman, M.; Al-Qerem, A.; Aldweesh, A.; Quaddoura, R.; Aburub, F.; Mansour, K.; Alhmiedat, T. Early Wildfire Smoke Detection Using Different YOLO Models. Machines 2023, 11, 246. [Google Scholar] [CrossRef] [Scilit]
  47. Yu, P.; Wei, W.; Li, J.; Du, Q.; Wang, F.; Zhang, L.; Li, H.; Yang, K.; Yang, X.; Zhang, N.; et al. Fire-PPYOLOE: An Efficient Forest Fire Detector for Real-Time Wild Forest Fire Monitoring. J. Sens. 2024, 2024, 2831905. [Google Scholar] [CrossRef] [Scilit]
  48. Shao, Y.; Zhu, Q.; Feng, Z.; Sun, L.; Yue, P.; Wang, A.; Zhang, X.; Su, Z. Utilizing Grid Data and Deep Learning for Forest Fire Occurrences and Decision Support: A Case Study in the Ningxia Hui Autonomous Region. Forests 2023, 14, 2418. [Google Scholar] [CrossRef] [Scilit]
  49. ISO/IEC 17065:2012; Conformity Assessment: Requirements for Bodies Certifying Products, Processes and Services. ISO: Geneva, Switzerland, 2012.
  50. Nguyen, H.N.; Lasa, G.; Iriarte, I.; Atxa, A.; Unamuno, G.; Galfarsoro, G. Datasets of skills-rating questionnaires for advanced service design through expert knowledge elicitation. Sci. Data 2022, 9, 321. [Google Scholar] [CrossRef] [Scilit]
  51. Lukinskiy, V.; Lukinskiy, V.; Bazhina, D. Refining the analytic hierarchy process: A statistical and methodological exploration of expert judgments. Alex. Eng. J. 2025, 125, 526–536. [Google Scholar] [CrossRef] [Scilit]
  52. Shukla, A.K.; Muhuri, P.K. A novel deep belief network architecture with interval type-2 fuzzy set based uncertain parameters towards enhanced learning. Fuzzy Sets Syst. 2024, 477, 108744. [Google Scholar] [CrossRef] [Scilit]
  53. Hinton, G.E.; Osindero, S.; Teh, Y.-W. A Fast Learning Algorithm for Deep Belief Nets. Neural Comput. 2006, 18, 1527–1554. [Google Scholar] [CrossRef] [Scilit]
  54. Wicaksono, F.D.; Arshad, Y.B.; Sihombing, H. Norm-dist Monte-Carlo integrative method for the improvement of fuzzy analytic hierarchy process. Heliyon 2020, 6, e03607. [Google Scholar] [CrossRef] [Scilit]
  55. Schmidhuber, J. Deep learning in neural networks: An overview. Neural Netw. 2015, 61, 85–117. [Google Scholar] [CrossRef] [Scilit]
  56. Salakhutdinov, R.; Tenenbaum, J.B.; Torralba, A. Learning with Hierarchical-Deep Models. IEEE Trans. Pattern Anal. Mach. Intell. 2013, 35, 1958–1971. [Google Scholar] [CrossRef] [Scilit]
  57. Cheng, Q.; Li, H.; Wu, Q.; Ma, L.; Ngan, K.N. Parametric Deformable Exponential Linear Units for deep neural networks. Neural Netw. 2020, 125, 281–289. [Google Scholar] [CrossRef] [Scilit] [PubMed]
  58. Wang, H.; Chen, Q.; Zhang, B. Transient stability assessment combined model framework based on cost-sensitive method. IET Gener. Transm. Distrib. 2020, 14, 2256–2262. [Google Scholar] [CrossRef] [Scilit]
  59. Nilashi, M.; Samad, S.; Minaei-Bidgoli, B.; Ghabban, F.; Supriyanto, E. Online Reviews Analysis for Customer Segmentation through Dimensionality Reduction and Deep Learning Techniques. Arab. J. Sci. Eng. 2021, 46, 8697–8709. [Google Scholar] [CrossRef] [Scilit]
  60. Rosenfeld, J.P.; Ward, A.; Meijer, E.H.; Yukhnenko, D. Bootstrapping the P300 in diagnostic psychophysiology: How many iterations are needed? Psychophysiology 2016, 54, 366–373. [Google Scholar] [CrossRef] [Scilit]
  61. Mostofian, B.; Zuckerman, D.M. Statistical Uncertainty Analysis for Small-Sample, High Log-Variance Data: Cautions for Bootstrapping and Bayesian Bootstrapping. J. Chem. Theory Comput. 2019, 15, 3499–3509. [Google Scholar] [CrossRef] [Scilit]
  62. Amalnerkar, E.; Lee, T.H.; Lim, W. Reliability analysis using bootstrap information criterion for small sample size response functions. Struct. Multidiscip. Optim. 2020, 62, 2901–2913. [Google Scholar] [CrossRef] [Scilit]
  63. Shang, D.; Zhang, F.; Yuan, D.; Hong, L.; Zheng, H.; Yang, F. Deep Learning-Based Forest Fire Risk Research on Monitoring and Early Warning Algorithms. Fire 2024, 7, 151. [Google Scholar] [CrossRef] [Scilit]
  64. Zheng, S.; Zou, X.; Gao, P.; Zhang, Q.; Hu, F.; Zhou, Y.; Wu, Z.; Wang, W.; Chen, S. A Forest Fire Recognition Method Based on Modified Deep CNN Model. Forests 2024, 15, 111. [Google Scholar] [CrossRef] [Scilit]
  65. Ji, L.; Haifeng, L.; Fang, W. A Semi-Supervised Method for Real-Time Forest Fire Detection Algorithm Based on Adaptively Spatial Feature Fusion. Forests 2023, 14, 361. [Google Scholar] [CrossRef] [Scilit]
  66. Yanuarsyah, I.; Suwarno, Y.; Hudjimartsu, S. The Use of Hotspot Spatial Clustering and Multitemporal Satellite Imagery to Facilitate Peat Land Degradation in West Kalimantan, Indonesia (Case Study in Mensiku Miniwatershed of Kapuas River). IOP Conf. Ser. Earth Environ. Sci. 2016, 47, 012046. [Google Scholar] [CrossRef] [Scilit]
  67. Jiayao, W.; Timothy, T.O.; Linhua, J.; Dongfang, Z. A New Data Fusion Algorithm for Wireless Sensor Networks Inspired by Hesitant Fuzzy Entropy. Sensors 2019, 19, 784. [Google Scholar] [CrossRef] [Scilit] [PubMed]
  68. Cassanova, J.L.; Qin, X.; Li, Z.; Calle, A.; Sanz, J.; Zhang, X.; Deng, G.; Salvador, P.; Goldhammer, J.G.; Li, G.; et al. Early Warning and Damage Assessment for Forest Fire. In Dragon 2 Final Results and Dragon 3 Kickoff Symposium, Beijing, China, 25–29 June 2012; ESA Communications: Noordwijk, The Netherlands, 2013; Volume 31, p. 704. [Google Scholar]
  69. Zhang, F.; Xu, Y.; Chou, J.; Hu, Y.H. A Novel Petri Nets-Based Modeling Method for the Interaction between the Sensor and the Geographic Environment in Emerging Sensor Networks. Sensors 2016, 16, 1571. [Google Scholar] [CrossRef] [Scilit] [PubMed]
  70. Yili, Z.; Yandong, Z.; Weiping, L.; Shengbo, L.; Ruting, Y. An Intelligent Wireless System for Field Ecology Monitoring and Forest Fire Warning. Sensors 2018, 18, 4457. [Google Scholar] [CrossRef] [Scilit] [PubMed]
  71. Hao, S.; Zhenheng, X.; Hao, L. An evaluation of the response of vegetation greenness, moisture, fluorescence, and temperature-based remote sensing indicators to drought stress. J. Hydrol. 2023, 625, 130125. [Google Scholar] [CrossRef] [Scilit]
  72. Dembelov, M.G.; Ovdin, M.E. Fire Danger Indicator for the Forest Environment Using Meteorological and GPS data on the Territory of the Transbaikal National Park. Bull. Irkutsk State Univ. Ser. Earth Sci. 2024, 49, 29–39. [Google Scholar] [CrossRef] [Scilit]
  73. Han, X.Y.; Ya, S.Q.; Tong, X.Y. An Environmentally Aware Scheme of Wireless Sensor Networks for Forest Fire Monitoring and Detection. Future Internet 2018, 10, 102. [Google Scholar] [CrossRef] [Scilit]
  74. Hyun, S.J.; Beom, S.S.; Young, R. Deep Learning-Based Projection of Occurrence Frequency of Forest Fires under SSP Scenario: Exploring the Link between Drought Characteristics and Forest Fires. Sustainability 2022, 14, 5494. [Google Scholar] [CrossRef] [Scilit]
  75. Ullah, F.; Khan, S.; Munawar, H.; Qadir, Z.; Qayyum, S. UAV Based Spatiotemporal Analysis of the 2019–2020 New South Wales Bushfires. Sustainability 2021, 13, 10207. [Google Scholar] [CrossRef] [Scilit]
  76. Zhang, J.-H.; Yao, F.-M.; Liu, C.; Yang, L.-M.; Boken, V.K. Detection, Emission Estimation and Risk Prediction of Forest Fires in China Using Satellite Sensors and Simulation Models in the Past Three Decades—An Overview. Int. J. Environ. Res. Public Health 2011, 8, 3156–3178. [Google Scholar] [CrossRef] [Scilit]
  77. Carta, F.; Zidda, C.; Putzu, M.; Loru, D.; Anedda, M.; Giusto, D. Advancements in Forest Fire Prevention: A Comprehensive Survey. Sensors 2023, 23, 6635. [Google Scholar] [CrossRef] [Scilit]
Figure 1. The methodological evaluation workflow for the applicability of forest fire emergency monitoring indicators and equipment.
Fire 09 00178 g001
Figure 2. Conceptual diagram of the emergency monitoring requirements for forest fires.
Fire 09 00178 g002
Figure 3. Flowchart for determining the weights of forest fire emergency monitoring indicators. (a) shows that the process begins with collecting experts’ opinions on pairwise comparisons of evaluation factors. (b) shows that the triangular fuzzy matrix method is then applied to analyze the expert judgments. (c) indicates that the collected expert data are used to calculate individual correction coefficients β through DBN model training. Finally, (d) demonstrates that these coefficients are integrated with TriFAHP calculations to optimize the indicator weight values.
Fire 09 00178 g003
Figure 4. Expert characteristics and calculated values of β. (a) Total number of practical projects participated in by the experts; (b) professional tenure of the experts; (c) quantitative radicalism indicator derived from expert scoring behaviors; (d) calculated personalized correction coefficient (β) based on the data recorded in the preceding panels.
Fire 09 00178 g004
Figure 5. Evaluation results of forest fire emergency monitoring indicators. (a) Mean expert scores for the monitoring indicators across monitorability, feasibility, timeliness, and sensitivity dimensions; (b) final applicability scores for each monitoring indicator and the degree of dispersion in expert ratings.
Fire 09 00178 g005
Figure 6. Evaluation results of forest fire emergency monitoring equipment. (a) Evaluation of equipment for wind speed monitoring; (b) evaluation of equipment for temperature monitoring; (c) evaluation of equipment for smoke monitoring; (d) evaluation of equipment for flame monitoring.
Fire 09 00178 g006
Table 1. Definitions of evaluation factors and their significance in disaster monitoring.
First-Level Assessment FactorSecondary Assessment FactorDefinitionSignificance in Disaster Monitoring
MonitorabilityAccuracyThe deviation between the monitoring data and the actual status.Affects the reliability of early warnings and helps avoid false or missed alarms [35,36].
StabilityThe continuous working ability of the system in harsh environments.Ensures the long-term validity of monitoring data [37,38].
FeasibilityEquipment deployment agilityThe total time required from decision making for monitoring to the equipment being in place and transmitting valid data.Provides effective data during critical decision-making windows [39,40].
Scope of the monitoring functionThe maximum spatial range over which a single monitoring device can effectively collect representative data [41].It is related to the cost of establishing a monitoring network and the ability to understand the overall fire situation.
TimelinessLagging response of indicatorsThe time delay between the actual occurrence of a key change in a forest fire and the reliable capture and output of this change by the monitoring system [42].Evaluates the delay between an event’s occurrence and its detection [43].
Effective duration of monitoring indicatorsThe duration from when monitoring indicator data are collected until they can no longer accurately reflect the current environmental status, losing their value for supporting rescue decisions [44].Determines the remaining useful life of a data point in a changing environment [45].
SensitivitySensitivity to sudden disastersThe initial response capability and response amplitude of monitoring indicators to critical fire conditions and key emergencies.Enables rapid detection of key turning points, such as fireline acceleration or sudden intensity changes, minimizing underreporting risks [46,47].
Sustainability of indicator trendsThe stability and reliability of the direction of change in an indicator after its response [48].Captures characteristics of impending disasters and provides a basis for early warning [44].
Table 2. Summary of commonly used physical and meteorological monitoring indicators for forest fires.
Indicator CategorySpecific IndicatorsApplication
SmokeSmoke presence, concentration, diffusion pattern, smoke type, thin smoke pixels, etc.Typically appears in the early stage of a fire, with a spread area much larger than the actual fire, making it a key indicator for early fire detection and for locating the fire [63,64].
FlameFlame color, motion characteristics, area change rate, flicker frequency, acute circular angle, etc.Helps effectively distinguish real fires from flame-like obstructions and identify different types of fires [64,65].
TemperatureLocal temperature, radiance temperature, hot spots (surface temperature)Core indicator of fire occurrence; brightness temperature from satellite remote sensing is used to identify high-temperature heat sources and classify fires [66,67].
Combustion product gasConcentration of CO and CO2Specific gases released during combustion are monitored by satellites to assess the fire’s scale and damage [68,69].
Meteorological temperatureAir temperature, dew point temperature, and monthly maximum/average temperatureInfluences the drying of combustible materials, fire occurrence probability, and fire spread. It is the core input for various fire risk indicators [70,71,72].
HumidityRelative humidity, air humidity, monthly minimum/average relative humidityLow humidity reduces fuel moisture and increases flammability, thereby increasing the risk of fire [67,73,74].
PrecipitationPrecipitation, 24 h cumulative precipitation, consecutive dry daysIt directly influences forest humidity and fuel moisture, making it an important factor in preventing fire occurrence [67,73,74].
Wind powerWind speed, wind direction, 10 m open wind speedIt influences both the speed and direction of fire spread and accelerates fuel drying [72].
Table 3. Calculated weights of model evaluation factors.
First-Level Assessment FactorWeight Value95% Bootstrap CISecondary Assessment FactorLocal WeightGlobal Weight
Monitorability0.3807[0.3521, 0.4089]Accuracy0.61350.2336
Stability0.38650.1471
Feasibility0.0966[0.0823, 0.1138]Equipment deployment agility0.80000.0773
Scope of the monitoring function0.20000.0193
Timeliness0.3353[0.3102, 0.3615]Lagging response of indicators0.80000.2682
Effective duration of monitoring indicators0.20000.0671
Sensitivity0.1874[0.1650, 0.2122]Sensitivity to sudden disasters0.49400.0926
Sustainability of indicator trends0.50600.0948
Table 4. Emergency monitoring equipment evaluation model.
First-Level Assessment FactorWeight ValueSecondary Assessment FactorLocal WeightGlobal Weight
Monitorability0.4685Accuracy0.61350.2874
Stability0.38650.1811
Feasibility0.1189Equipment deployment agility0.80000.0951
Scope of the monitoring function0.20000.0238
Timeliness0.4126Lagging response of indicators0.80000.3301
Effective duration of monitoring indicators0.20000.0825
Table 5. Results of model parameter sensitivity analysis.
γMonitorability WeightFeasibility WeightTimeliness WeightSensitivity WeightVariance (×10−5)
1.00.3920.0970.3280.18316.83
0.90.3880.0970.3300.18514.75
0.80.3840.0970.3330.18613.02
0.70.3810.0970.3350.18711.35
0.60.3770.0970.3380.18812.51
0.50.3730.0960.3410.19015.23
Table 6. Comparison of expert weight distribution dispersion before and after β correction.
Before Correction (γ = 1.0)After Correction (γ = 0.7)Degree of Dispersion Reduction
Standard Deviation (SD0)Coefficient of Variation (CV0)Standard Deviation (SD1)Coefficient of Variation (CV1)Reduction in Standard DeviationReduction in Coefficient of Variation
Monitorability (A1)0.04310.97%0.0307.67%30.2%30.1%
Feasibility (A2)0.04012.20%0.0288.54%30.0%30.0%
Timeliness (A3)0.02714.75%0.01910.16%29.6%31.1%
Sensitivity (A4)0.01717.53%0.01212.37%29.4%29.4%
Table 7. Correlation matrix among the four primary evaluation dimensions.
DimensionMonitorabilityFeasibilityTimelinessSensitivity
Monitorability1
Feasibility0.281
Timeliness0.570.191
Sensitivity0.390.520.431
Note: Values are Spearman’s rank correlation coefficients. All variance inflation factors (VIFs) were <2.5, indicating no significant multicollinearity.
Disclaimer/Publisher’s Note: The statements, opinions and data contained in all publications are solely those of the individual author(s) and contributor(s) and not of MDPI and/or the editor(s). MDPI and/or the editor(s) disclaim responsibility for any injury to people or property resulting from any ideas, methods, instructions or products referred to in the content.