


Abstract
Wildfires are part of terrestrial ecosystem processes; however, their frequency and intensity have recently increased due to both natural and anthropogenic factors. Geospatial data are essential for analyzing land cover changes at high spatial resolution, making the development of tools that use this information to detect burned areas particularly important, especially in regions of high ecological value. This study aimed to detect burned areas within the Iztaccíhuatl–Popocatépetl Protected Natural Area in central Mexico using a logistic regression model based on spectral variables such as NDVI, RBRc, and SWIR2 derived from Sentinel-2 imagery. The agreement between observed and classified data yielded Kappa coefficients and overall accuracy values of 0.79. Model performance varied with probability threshold: low thresholds achieved higher metrics, while high thresholds produced a more conservative delineation that was spatially more coherent with the reference polygons, prioritizing pixels with higher probability of being affected and generating maps more consistent with actual burned areas. Overall, the model performed well in detecting burned areas, providing a useful tool for fire monitoring. However, it is recommended to conduct analyses by vegetation type to increase model accuracy, as phenological variability associated with vegetation types can influence spectral responses and reduce precision.
1. Introduction
Wildfires are a global phenomenon that forms part of the planet’s functioning, influencing ecosystem patterns and processes such as vegetation structure, the carbon cycle, and climate [1,2,3]. These events can be of natural origin or induced by human activities, and their frequency and intensity are being modified by climate change at a global level [4,5]. Globally, between 2001 and 2020, an average of 774 million hectares were burned annually, with local increases in several forested regions [6]. Although wildfires are an essential component in some ecosystems, in recent years some regions of Europe and North America have experienced an increase in their frequency and intensity. This increase has caused significant adverse impacts on forests and human health, due to the greater number of high-severity fires and the expansion of burned area [7,8]. These fires are one of the disturbance problems in forests, broadly affecting ecological, economic, and social aspects in different countries around the world, highlighting the importance of recovery measures, cooperation, and impact mitigation [9].
Remote sensing and remote sensors have become fundamental tools for monitoring different ecosystems and vegetation covers [10]. Since the launch of the first satellites, these technologies quickly positioned themselves as efficient alternatives for detecting large-scale changes on the Earth’s surface [11]. Their application facilitates the analysis of variations in plant cover and health status, contributing to conducting studies in regions with difficult access and extreme climatic conditions [12]. In recent decades, the use of satellite data collected from these sensors, along with other spatiotemporal information sources, has provided fundamental advances in the detection of disturbances in forest ecosystems, especially in understanding the dynamics and impacts of fires on forest cover [13,14,15].
The use of satellite imagery provides relevant information for discriminating disturbed areas in forest ecosystems. Among the most commonly used sensors are images from the Sentinel-2 satellite, which offer a spatial resolution of 10 m [16,17]. Based on the information contained in the spectral bands, particularly near-infrared (NIR) and shortwave infrared (SWIR) [18], this sensor allows effective distinction between burned and unburned areas, as well as assessment of different levels of fire severity [19]. In combination with Geographic Information System (GIS) tools, Sentinel-2 has established itself as an effective platform for mapping fire-affected areas at different scales, facilitating impact measurement and planning of ecological restoration strategies [20,21].
The use of Sentinel-2 time series in conjunction with spectral indices such as the Normalized Difference Vegetation Index (NDVI), the Relativized Burn Ratio with phenological correction (RBRc), and SWIR bands, allows for the analysis of post-fire changes, as these produce variations at the pixel level in the images [22]. These indices have demonstrated high performance in detecting burned areas; however, models based on them are not universal, as their efficiency depends on spatiotemporal conditions, such as vegetation type and image acquisition dates, factors that influence the behavior of spectral metrics [23]. Nevertheless, the combination of these indices with Sentinel-2 bands has shown high accuracy in the identification and mapping of wildfires [24,25]. In particular, the use of RBRc consistently improves the mapping of burned areas, as it reduces the effect of phenological changes in vegetation and more accurately delineates affected areas [26].
The combination of spatial multi-criteria evaluation models allows for improved efficiency compared to individual methods, as they adapt to the specific characteristics of each region for detecting forest disturbances [27]. This is because multiple studies have integrated different variables to detect and map fires, achieving high performance in delineating burned areas. Therefore, these models constitute an effective tool for forest planning and management [28,29]. Consequently, the study of fire occurrence detection through models is considered a central approach in the management of these phenomena, and their selection should be based on the structure of the specific data for each ecosystem [30].
The Iztaccíhuatl-Popocatépetl Protected Natural Area (PNA) is one of the most important strategic ecosystems in central Mexico, characterized by diverse land tenure and high-mountain forests that fulfill biodiversity conservation and ecosystem service functions. However, there is currently a high risk to the ecosystem due to the recurrence of wildfires in recent years [31,32]. In this regard, given the ecological relevance and vulnerability of this type of ecosystem to wildfires, it is necessary to develop detection models for study areas with special characteristics. Therefore, the present study aims to detect burned areas within the PNA using a logistic regression model based on Sentinel-2 imagery and spectral variables summarized through per-pixel mean values. This approach allows the extraction of a representative post-fire spectral signal, reducing the influence of short-term variability and observation-specific noise, and thereby supporting a more reliable identification of affected areas for improved management, recovery, and conservation of this strategic ecosystem.
2. Materials and Methods
2.1. Study Area
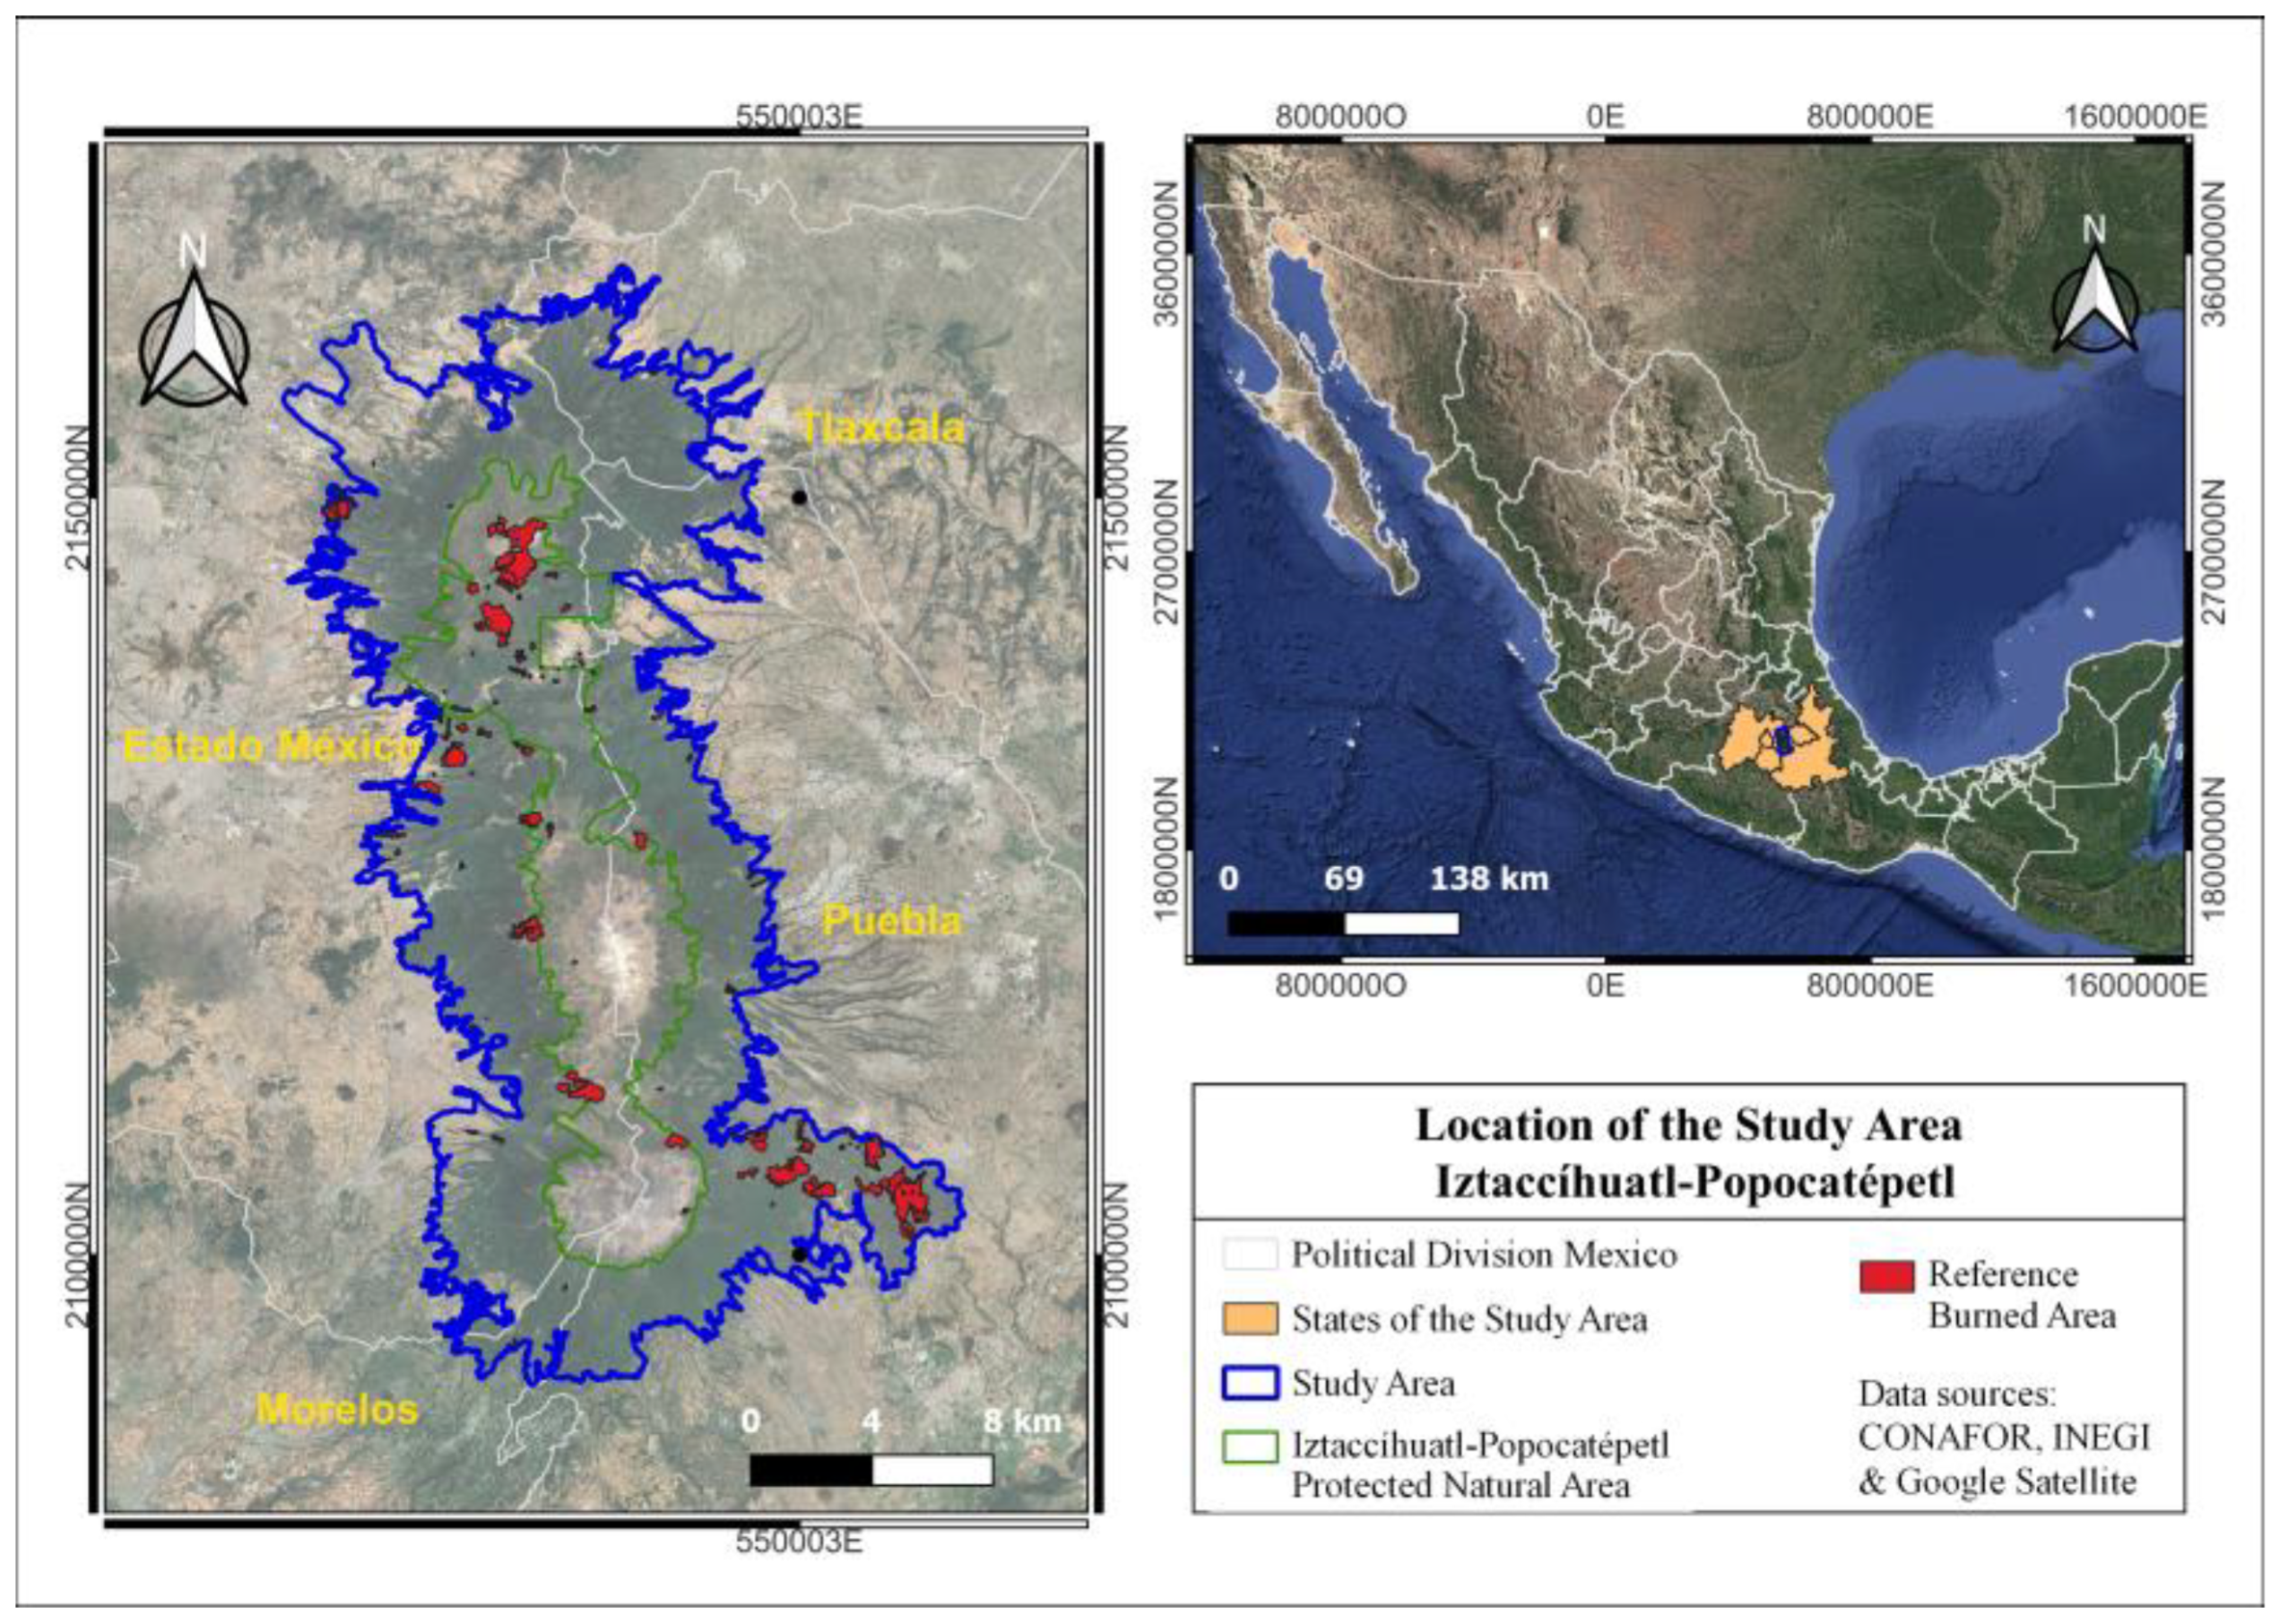
The study area is located within the Trans-Mexican Volcanic Belt in central Mexico, specifically in the Iztaccíhuatl-Popocatépetl Protected Natural Area. This region covers 153,394 ha and contains ecosystems of significant ecological value (Figure 1). Polygons from the National Forestry Commission (CONAFOR; https://snif.cnf.gob.mx/incendios/) corresponding to the 2023 fire season (20 January 2026) were used as reference data to extract the information required for the development of the logistic regression model for burned-area detection [33].
Figure 1.
Location of the Iztaccíhuatl-Popocatépetl study area.
The study area exhibits high ecological diversity, harboring temperate subhumid high-mountain ecosystems within an altitudinal range of 2589 to 5454 m above sea level [34]. This area encompasses a Protected Natural Area characterized by coniferous forests, oak forests, and high-mountain grasslands, constituting one of the most ecologically significant ecosystems in central Mexico. Additionally, the region presents diverse land tenure arrangements, including ejidos, communal lands, private properties, and federal lands [31,32]. Due to its ecological importance and variety of high-mountain ecosystems, this area represents a suitable model for studying fire dynamics and high-mountain ecosystem management.
2.2. Burned Area Polygons
The reference polygons used to extract data from burned areas were obtained from CONAFOR and subsequently verified. These polygons correspond to wildfires that occurred during the January–May 2023 fire season (Table 1). In addition, a reference polygon representing unburned areas was defined within the study area, considering that multiple polygons corresponding to burned areas were present and that the remaining surface showed no evidence of fire disturbance. This polygon was delineated to ensure that it was located outside previously identified burned regions. A point grid with a 30 m spacing was generated within the reference polygons for both burned and unburned areas, taking into account the fire occurrence date and the corresponding month for each polygon, in order to extract the variables required for development the logistic regression model. The 30 m spacing was selected to ensure that each point adequately captured the spatial variability of the areas of interest.
Table 1.
Reference polygons of burned areas for 2023.
For spatial sampling, all points contained within the burned area polygons were considered. In contrast, because the unburned area covered a substantially larger extent within the study area, points corresponding to this class were selected randomly. This procedure allowed class balance to be maintained by selecting an equal number of points from burned and unburned areas, thereby ensuring the statistical robustness of the model. In addition, random sampling within the unburned areas enabled a representative coverage of the spatial variability associated with different vegetation and geological conditions present in the study area, which corresponds to a mountainous environment within a volcanic reserve.
Finally, as a quality control step, all points were validated using the Normalized Burn Ratio (NBR). Points classified as burned exhibited low NBR values indicative of fire disturbance, whereas points within unburned polygons corresponded to unaffected surfaces.
2.3. Detector Variable Selection
The selection of detection variables for the logistic regression model was based on criteria of information complementarity, absence of multicollinearity, and biophysical relevance. The RBRc index was selected and computed using pre-fire and post-fire imagery with a 30-day post-fire window, incorporating a phenological correction that enhances its sensitivity under different vegetation cover conditions [26]; In addition, NDVI and the SWIR2 band were derived exclusively from post-fire imagery, as NDVI captures the status of living vegetation and photosynthetic activity [35]; while SWIR2 is sensitive to vegetation water content and post-fire structural changes [36]. Independence among variables was assessed using the Variance Inflation Factor (VIF) and Pearson correlation analysis, confirming the absence of multicollinearity.
2.4. Sentinel-2 Composites and Spectral Variable Extraction
Sentinel-2 satellite images were processed on the Google Earth Engine (GEE) plat-form, limited to the study area. Images corresponding to the period from January to May 2023 were selected, as these months record the highest fire occurrence and greatest availability of cloud-free scenes. To improve data quality, masks were applied to exclude clouds, shadows, and invalid pixels, ensuring that images were cloud-free and suitable for spectral analysis. For the analyzed period, monthly composites based on mean values of optical bands were calculated. These monthly composites allowed for stable representation of spectral variability before and after fires.
For the generated monthly composites, the spectral indices NDVI and RBRc, as well as the SWIR2 band, were calculated. NDVI and SWIR2 were derived exclusively from post-fire imagery, whereas RBRc was computed using paired pre-fire and post-fire images, considering a 30-day post-fire window. Each burned-area polygon was temporally linked to the composite corresponding to the month in which the recorded fire occurred, ensuring that the extracted spectral values captured the characteristic post-fire signature of each event. These spectral values were subsequently integrated into a single multitemporal composite summarizing the five months analyzed (January–May 2023) by calculating per-pixel average values. From this five-month composite, NDVI, RBRc, and SWIR2 values were extracted for each point of the 30 m systematic grid located within the reference polygons. Each point was characterized by its binary class (burned or unburned) and its corresponding spectral values.
Multitemporal composites were generated using per-pixel mean values of the NDVI and RBRc indices, as well as the SWIR2 band, as a spectral aggregation strategy aimed at integrating information from the analyzed period and attenuating the influence of extreme values and temporal noise associated with individual observations. This approach enables a more stable and representative spectral signal of post-fire conditions by reducing the impact of atypical scenes, residual cloud contamination, and short-term spectral variability [37,38].
2.5. Model Development and Evaluation
Logistic regression is a statistical technique used to model the probability of occurrence of a binary event, in this case, the presence or absence of burned areas [39]. The modeling process was performed in R-Studio, beginning with data extracted from rasters and reference polygons for the study period, which were compiled into an Excel database, coding the classes as burned (0) and unburned (1). Subsequently, the data were split into a development set (70%) and a test set (30%), selecting the NDVI and RBRc indices and the SWIR2 band as independent variables. With these detection variables, a LASSO-regularized logistic regression model was fitted, which incorporates penalization to improve variable selection and model generalization [40].
To evaluate the performance of the model, detected probabilities for each class were calculated on the test set. These probabilities correspond to continuous values between 0 and 1 generated by the penalized logistic regression model. From these probabilities, the ROC curve was constructed to evaluate the discriminatory capacity of the model [41]. Subsequently, a classification reference threshold was obtained using the Youden index, which maximizes the sum of sensitivity and specificity, determining the cutoff value that best separates the burned and unburned classes according to the data [42]. In addition to this threshold-independent assessment, a threshold-dependent evaluation was performed using the True Skill Statistic (TSS; Hanssen–Kuipers discriminant). TSS was calculated from the confusion matrix as the sum of sensitivity and specificity minus one, and the optimal probability threshold was defined as the value that maximized the TSS [43].
2.6. Evaluation of Spatial Detection Performance
The model was applied to a single composite constructed from the monthly mean values of each spectral band and index, evaluating each pixel to calculate the probability of burned area occurrence based on its spectral characteristics. The model produced a continuous probability raster ranging from 0 to 1. Based on these probabilistic rasters, a probability-thresholding approach was implemented to generate multiple versions of binary burned area maps, in order to assess how different relative cutoffs affect spatial detection [44]. The maps were reclassified into binary form by assigning a value of 1 to burned pixels and 0 to unburned pixels, using probability-based thresholds as cutoff values. In this analysis, probability thresholds ranging from 0.10 to 0.90 were evaluated at increments of 0.10. Lower probability thresholds tend to maximize burned-area detection but include pixels with moderate probabilities, thereby increasing the occurrence of false positives. In contrast, higher probability thresholds retain only pixels with a high likelihood of burned-area occurrence.
The performance of the binary maps was evaluated using the set of reference polygons, extracting the detected values per polygon and determining the binary detection per polygon. To assess the discriminatory capacity of the model, detections obtained for each percentile were compared with observed values, constructing confusion matrices and obtaining accuracy, sensitivity, specificity, and Kappa coefficient metrics. Additionally, a graphical analysis of spectral detections was performed, including density histograms to visualize the distribution of NDVI, RBRc, and SWIR2 between burned and unburned areas [45].
3. Results
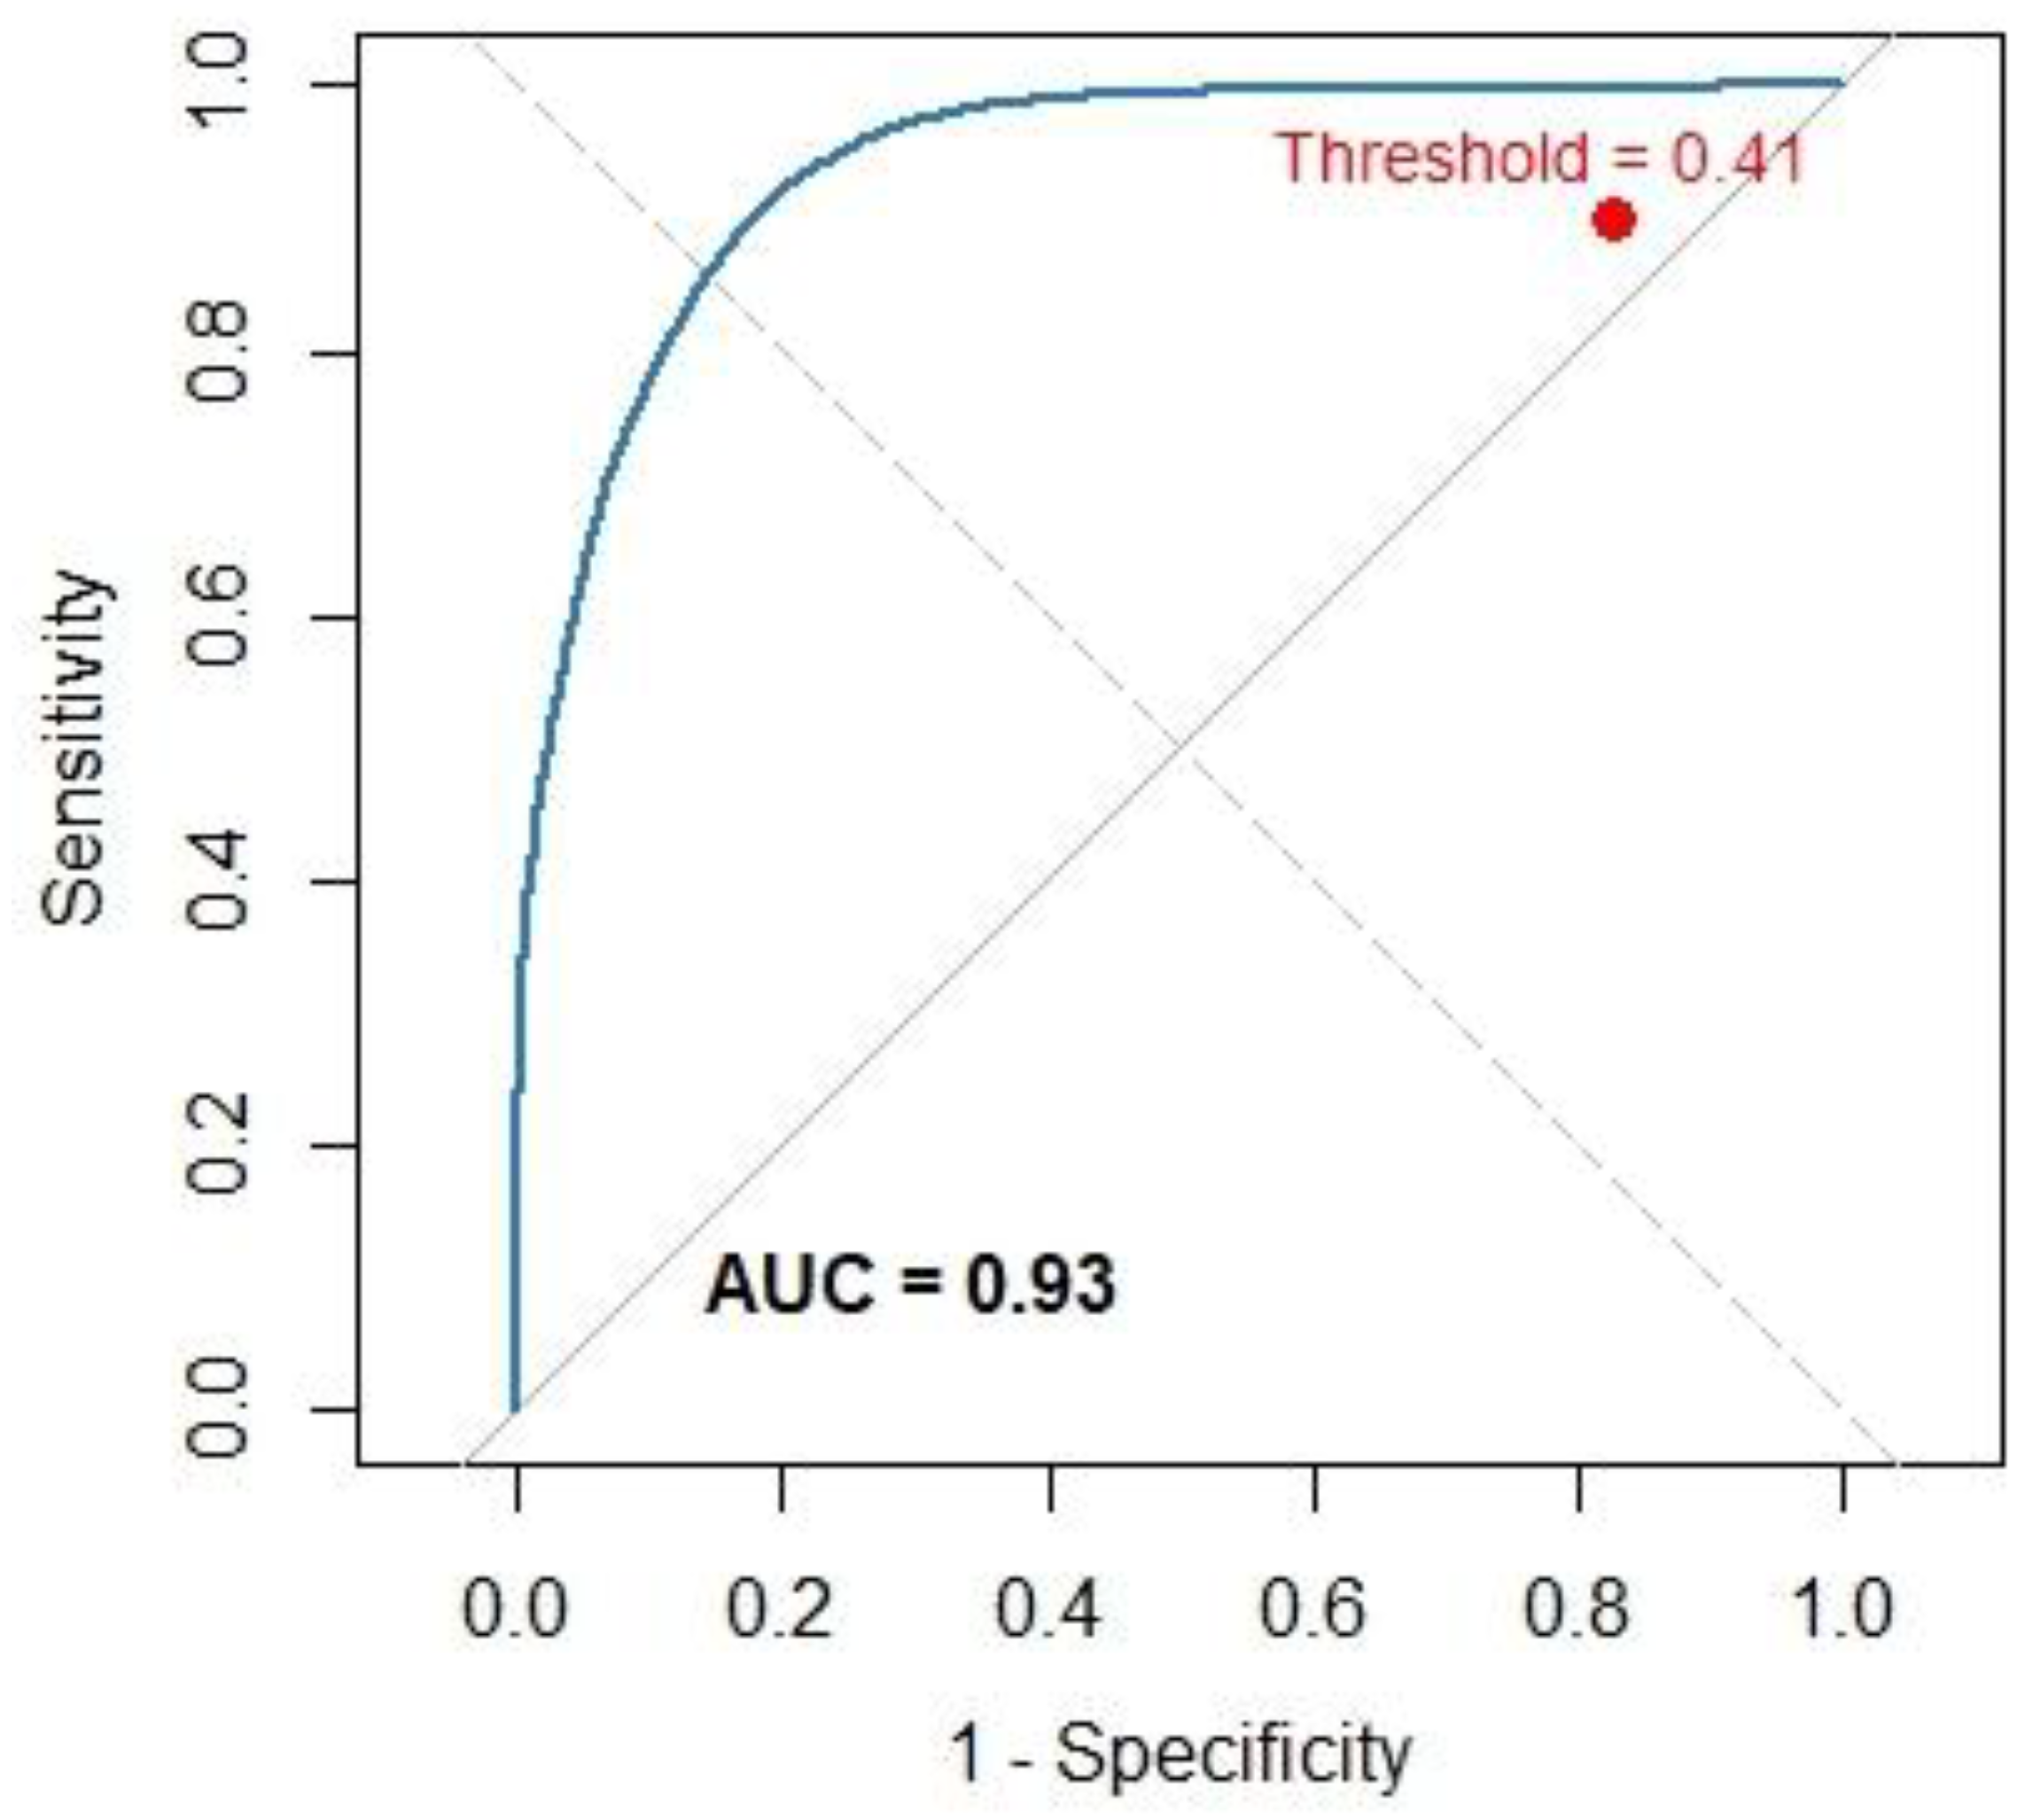
The multicollinearity analysis among detector variables showed VIF values of 1.26 for RBRc, 1.25 for NDVI, and 1.02 for SWIR2, indicating absence of multicollinearity among variables. Pearson correlations between variable pairs were moderate: r(RBRc-NDVI) = −0.74, r(RBRc-SWIR2) = 0.66, and r(NDVI-SWIR2) = −0.88, indicating that each variable contributes complementary information to the model. Regarding the penalized logistic regression model (LASSO), with spectral indices and bands derived from different areas, the model exhibited high performance in the classification of burned areas. With an optimal threshold of 0.41, it achieved a sensitivity of 0.87 for correctly detecting fire-affected areas and a specificity of 0.92 for excluding unburned areas. The overall accuracy was 0.90, the Kappa coefficient was 0.80 and the TSS reached 0.71, indicating a high discriminatory capacity of the model, evidencing high agreement between observed and detected values, demonstrating the model’s efficacy in discriminating forest fire-impacted areas based on the data used for model development.
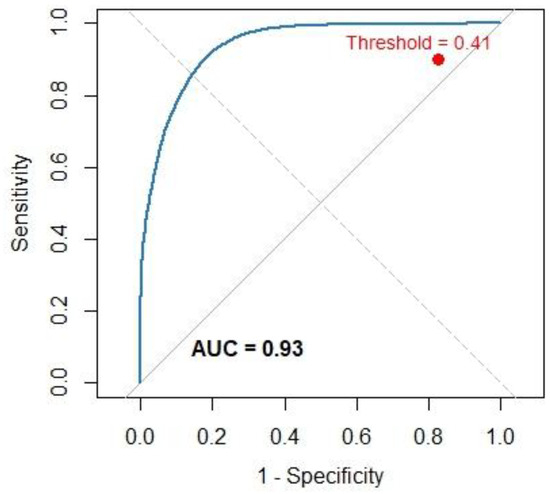
The ROC curve generated from the burned area detections of the logistic regression model, based on the data used, shows the model’s ability to discriminate burned areas (Figure 2). The area under the curve (AUC) was 0.93, indicating excellent discriminatory capacity. Likewise, the optimal threshold, determined using the Youden index, was 0.41, which shows the balance between sensitivity and specificity of the model on the data used for model development.
Figure 2.
ROC curve with optimal threshold for burned area data.
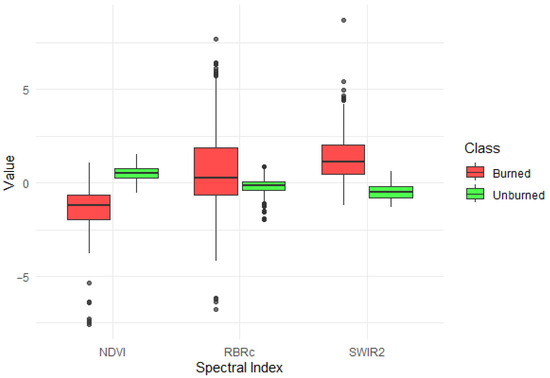
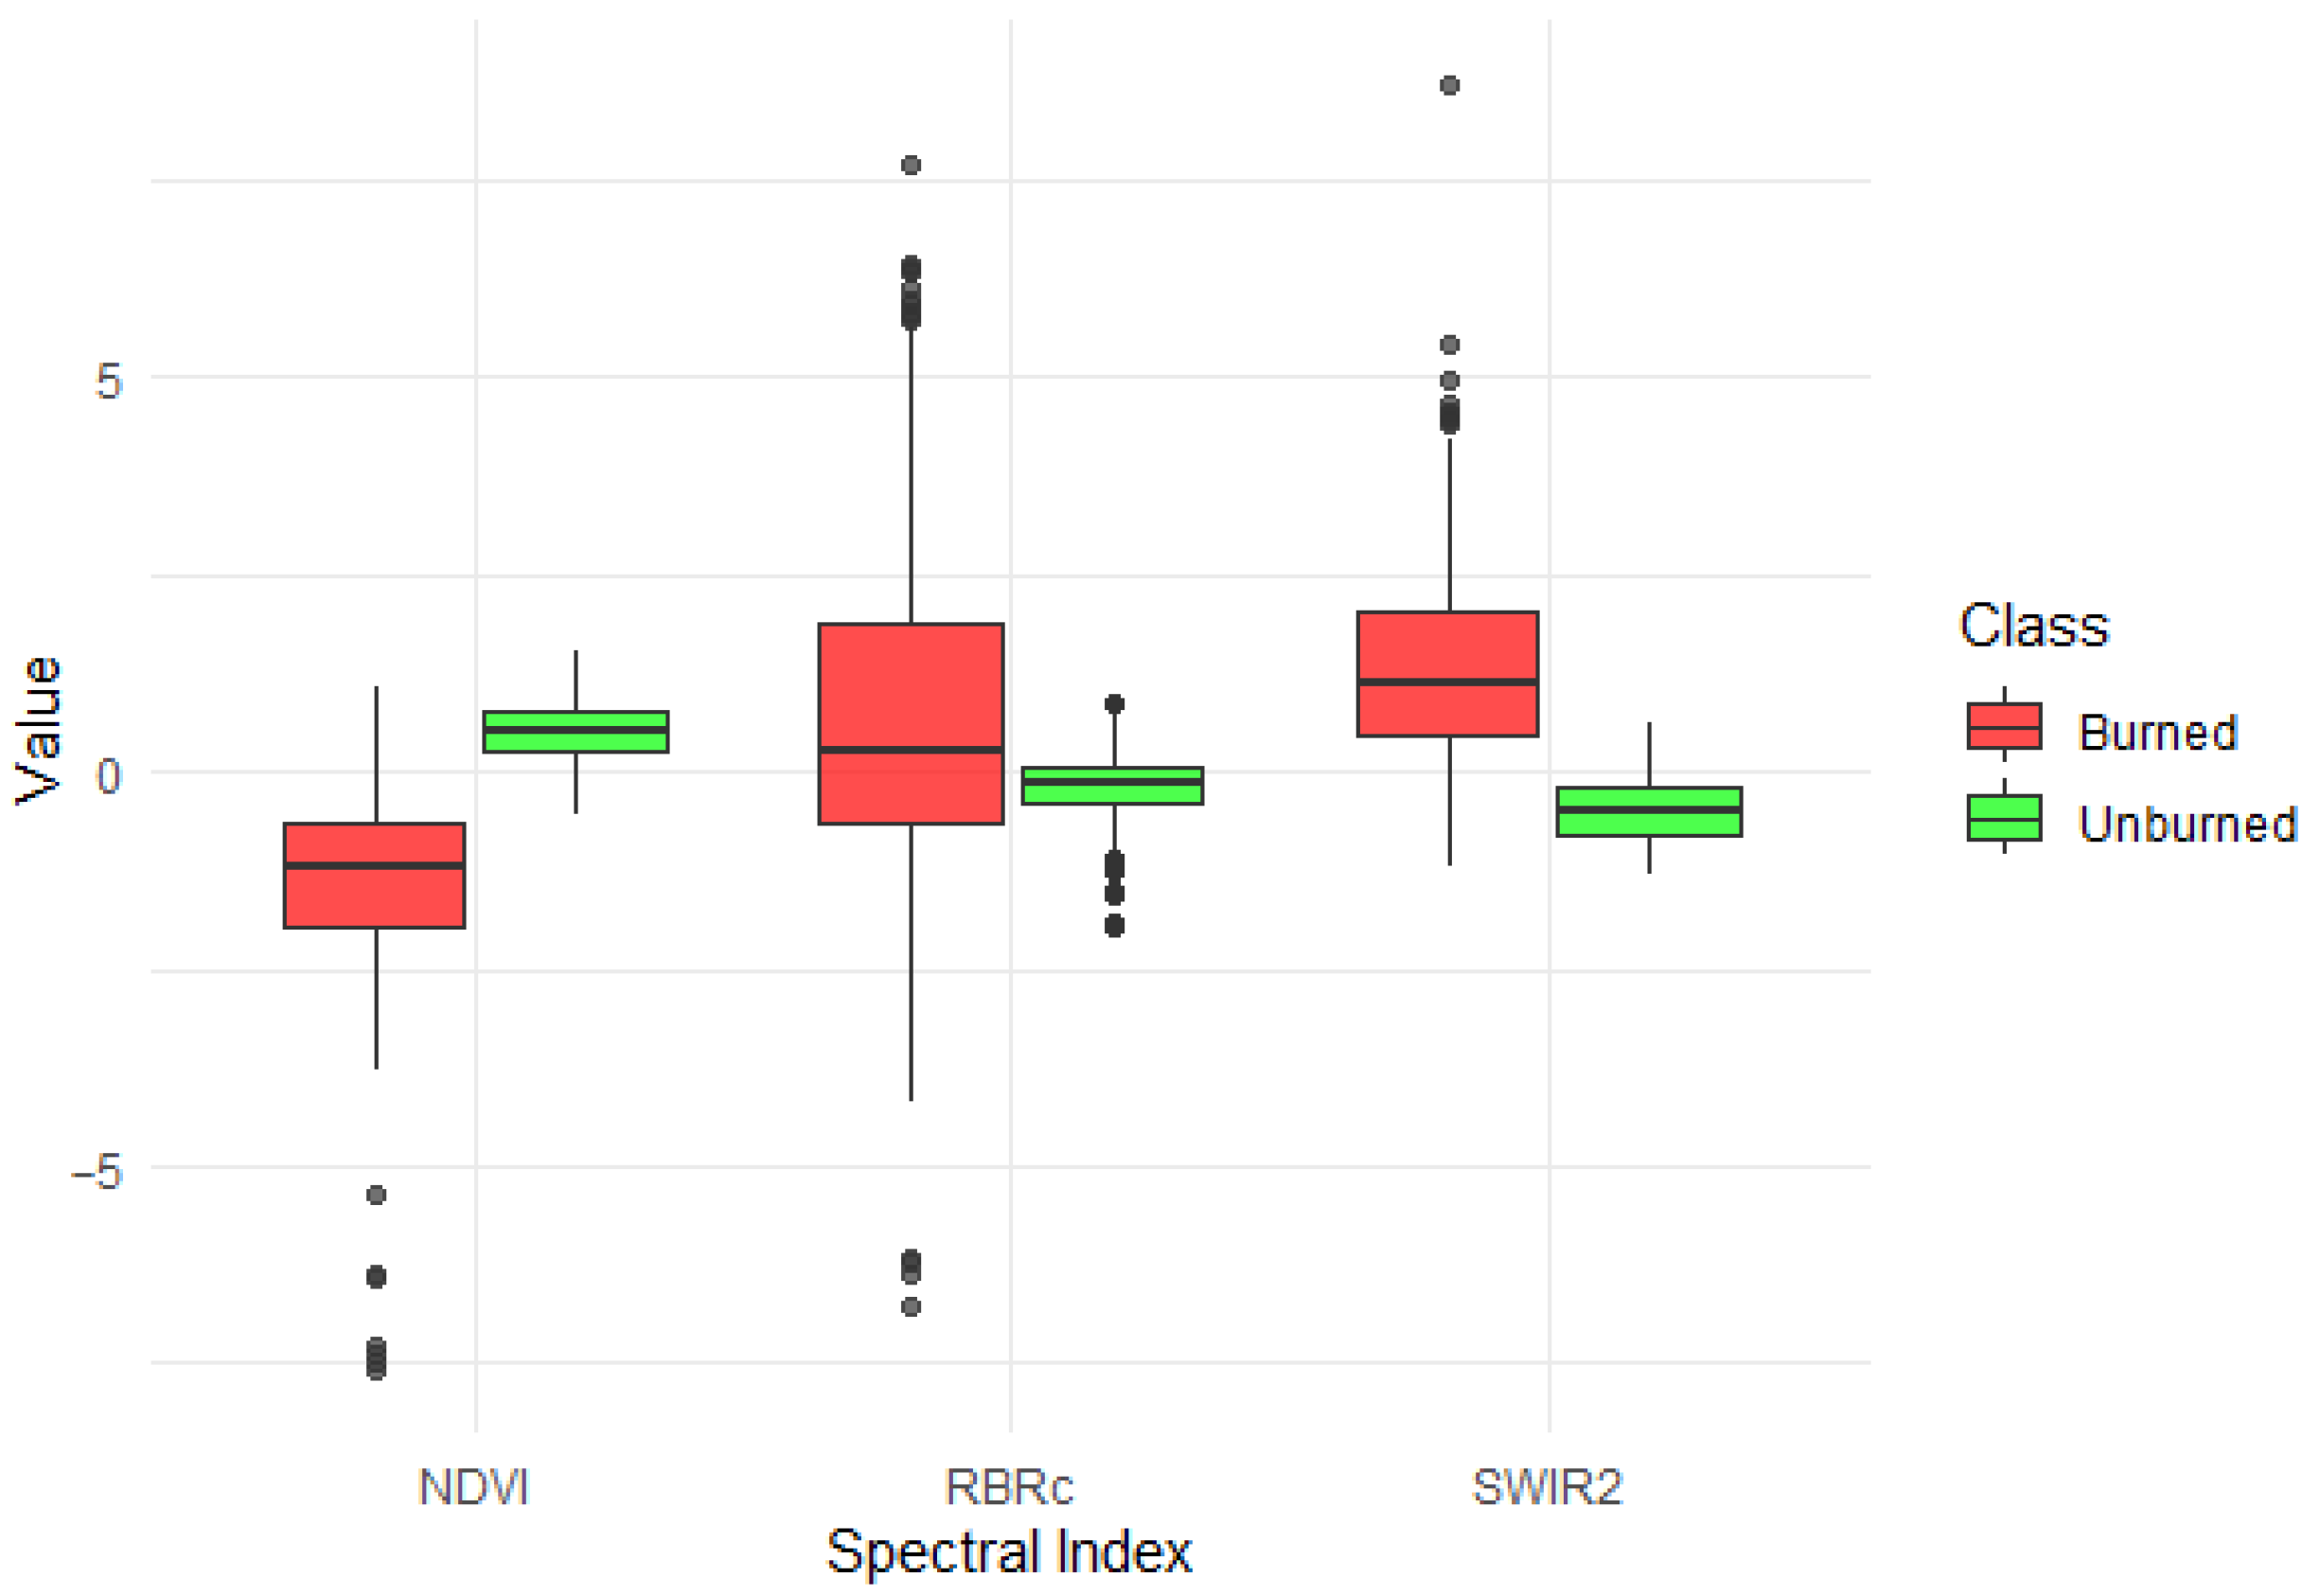
For the regression model, the NDVI, RBRc, and SWIR2 spectral indices and band were employed to detect burned and unburned classes. Figure 3 illustrates the distribution of values for these detections. NDVI values were significantly lower in burned areas, reflecting post-fire loss of green vegetation. Conversely, RBRc and SWIR2 values were elevated in burned zones, consistent with increased short-wave infrared reflectance. These differences reveal distinct class separation, confirming the capability of these variables to detect fire-affected areas through logistic regression modeling.
Figure 3.
Distribution of detections by class.
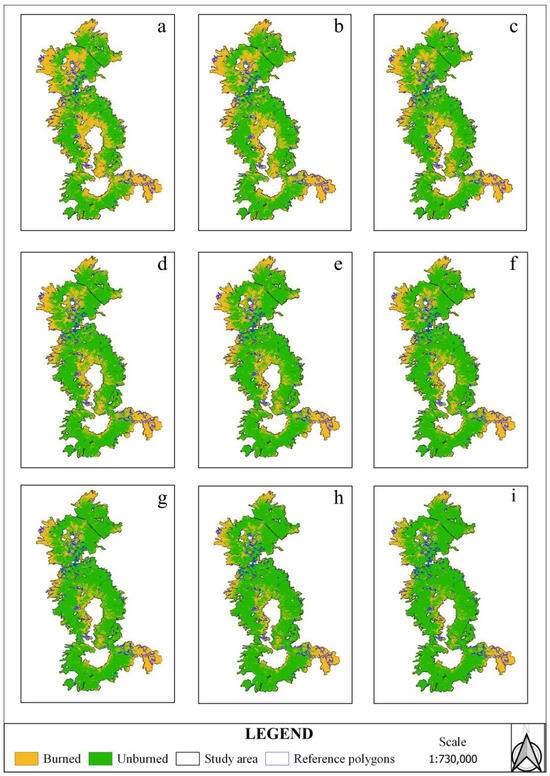
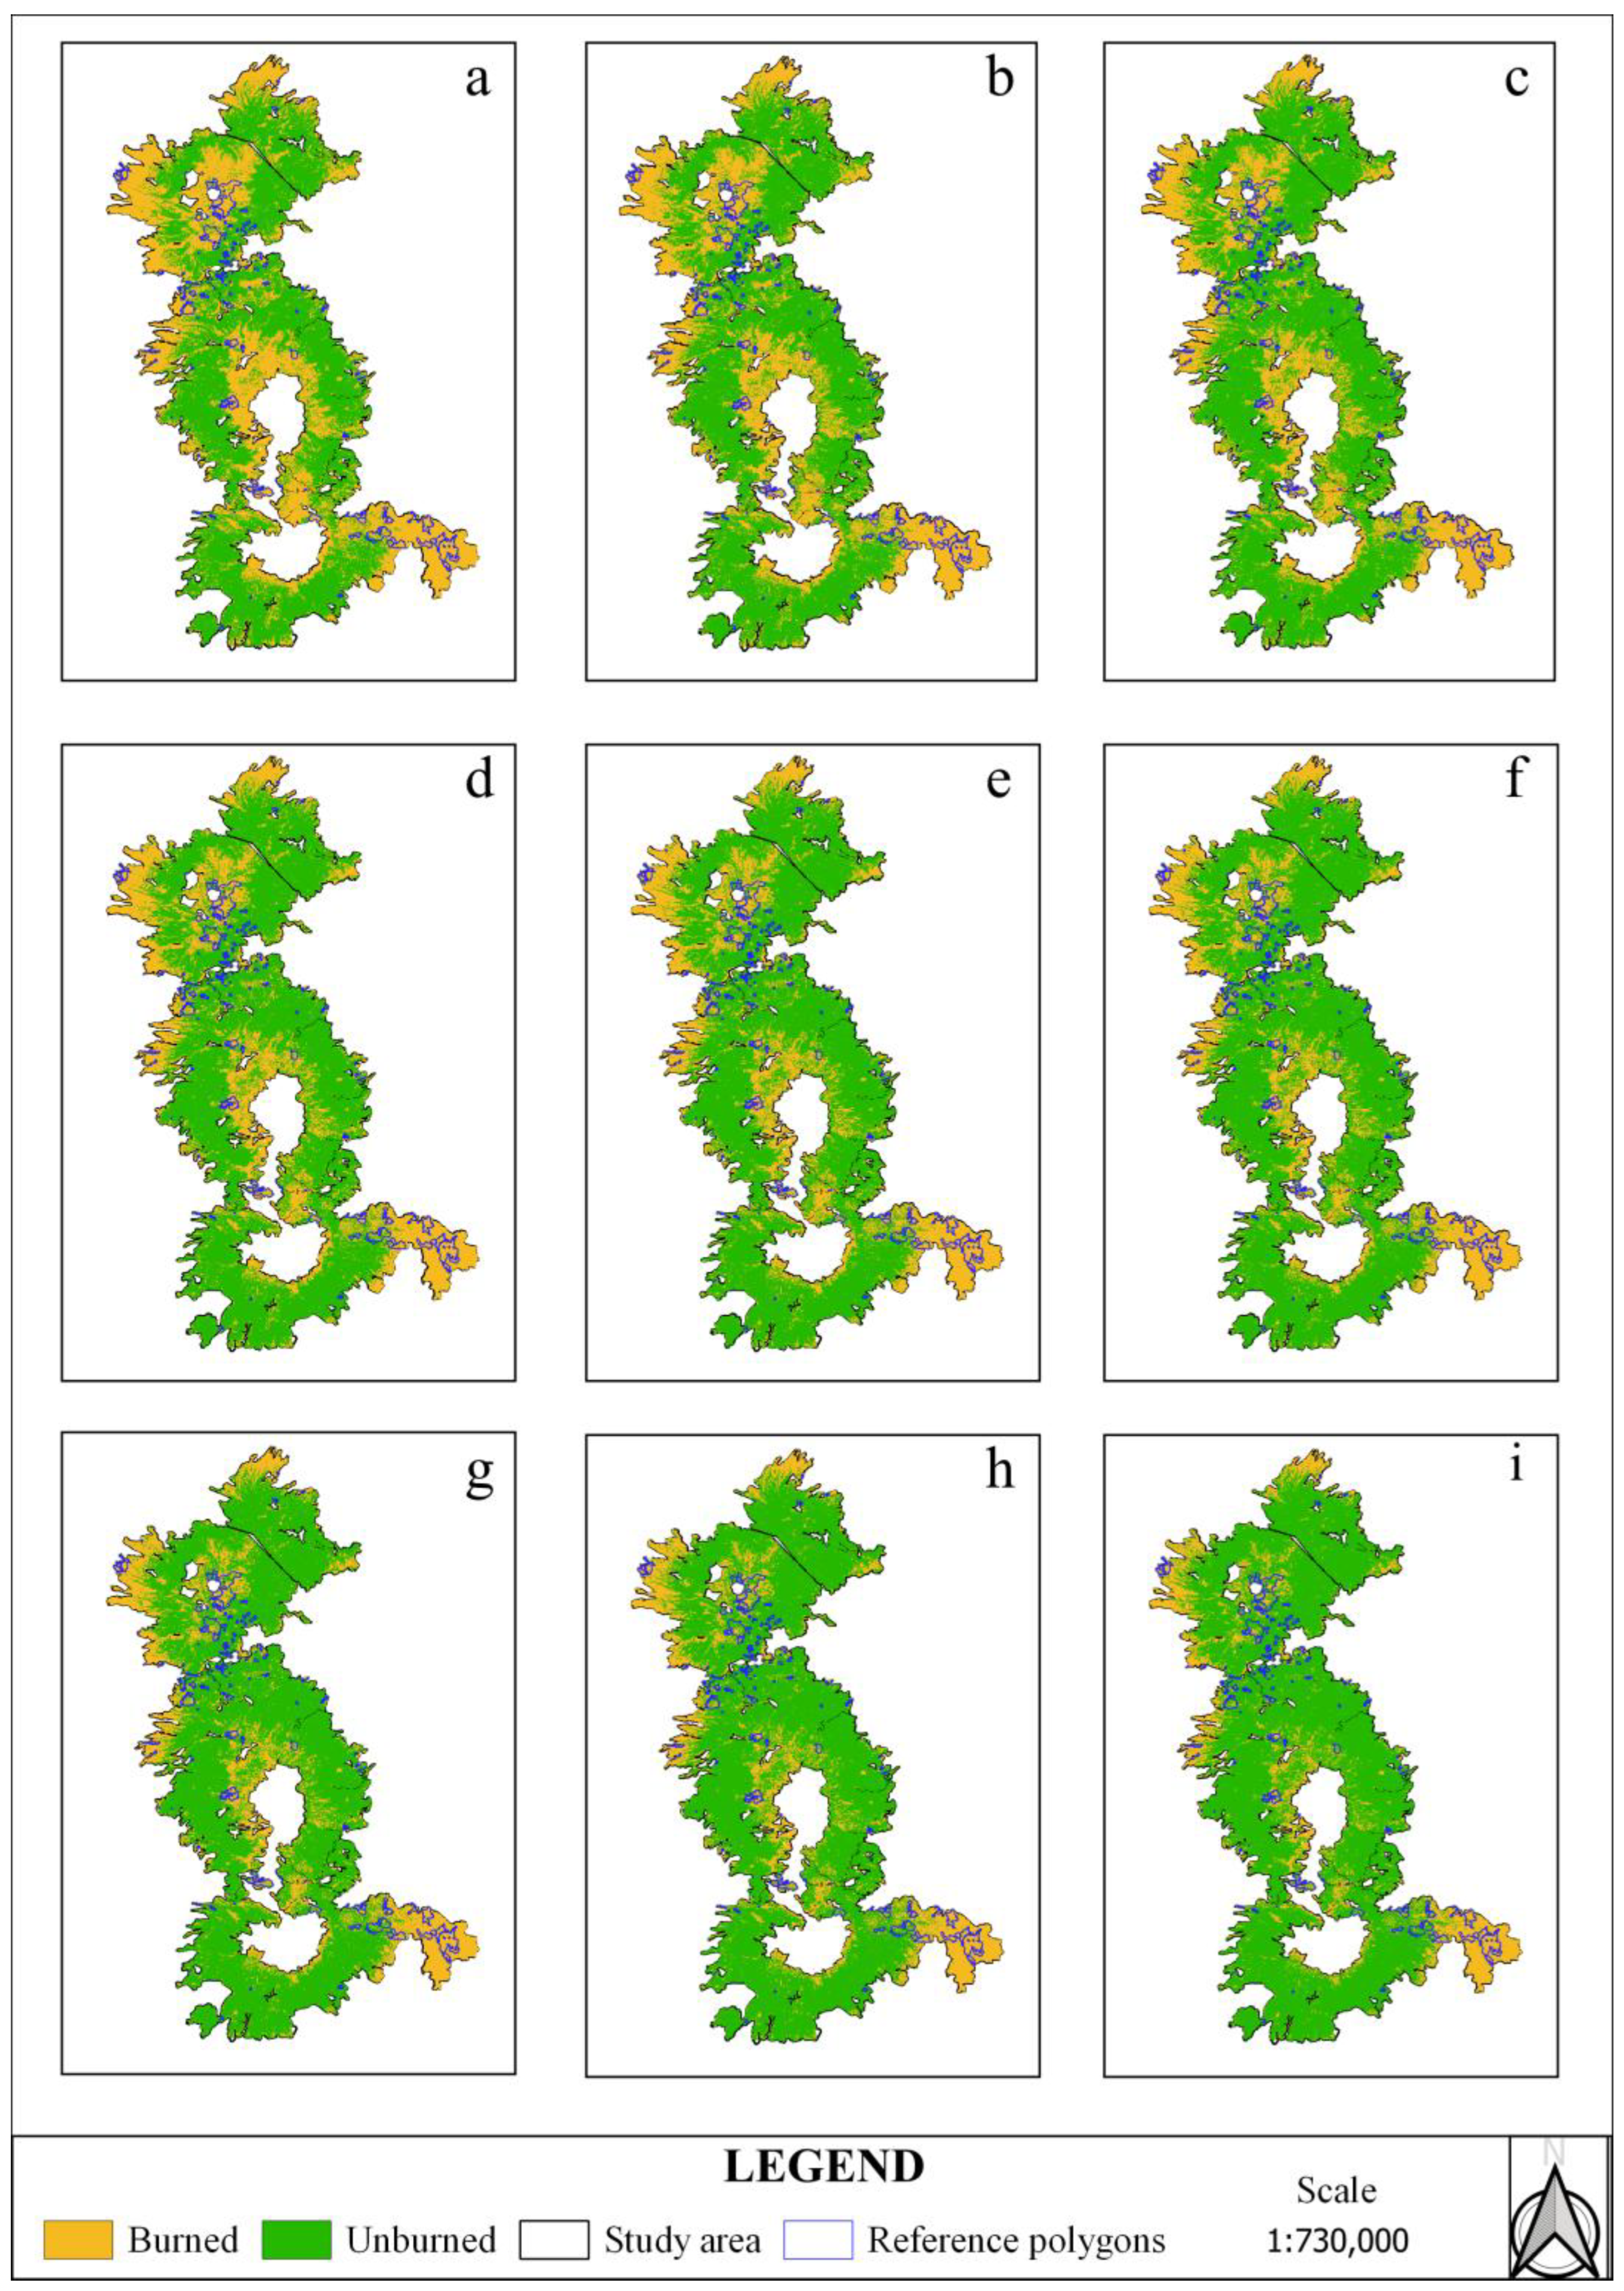
Figure 4 shows the spatial distribution of detected burned areas across the entire study area derived from the application of probability thresholds ranging from 0.10 to 0.90 (panels a–i), which allowed the spatial extent of fire impact to be estimated based on the probabilities generated by the regression model. Lower probability thresholds delineate more extensive burned-area patterns relative to the reference polygons, whereas increasing the threshold progressively reduces the detected burned-area extent. Higher probability thresholds result in more conservative maps, characterized by improved visual and geometric correspondence with the reference burned areas, as well as by the identification of pixels with a higher likelihood of having been affected by fire. Overall, this behavior demonstrates how probability threshold selection directly influences burned-area mapping and the spatial delineation of fire impacts on vegetation cover at the regional scale.
Figure 4.
Burned area maps generated using different probability thresholds: probability threshold: 0.10 (a), 0.20 (b), 0.30 (c), 0.40 (d), 0.50 (e), 0.60 (f), 0.70 (g), 0.80 (h), 0.90 (i).
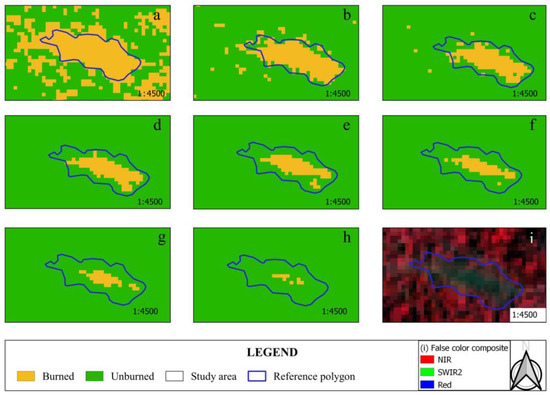
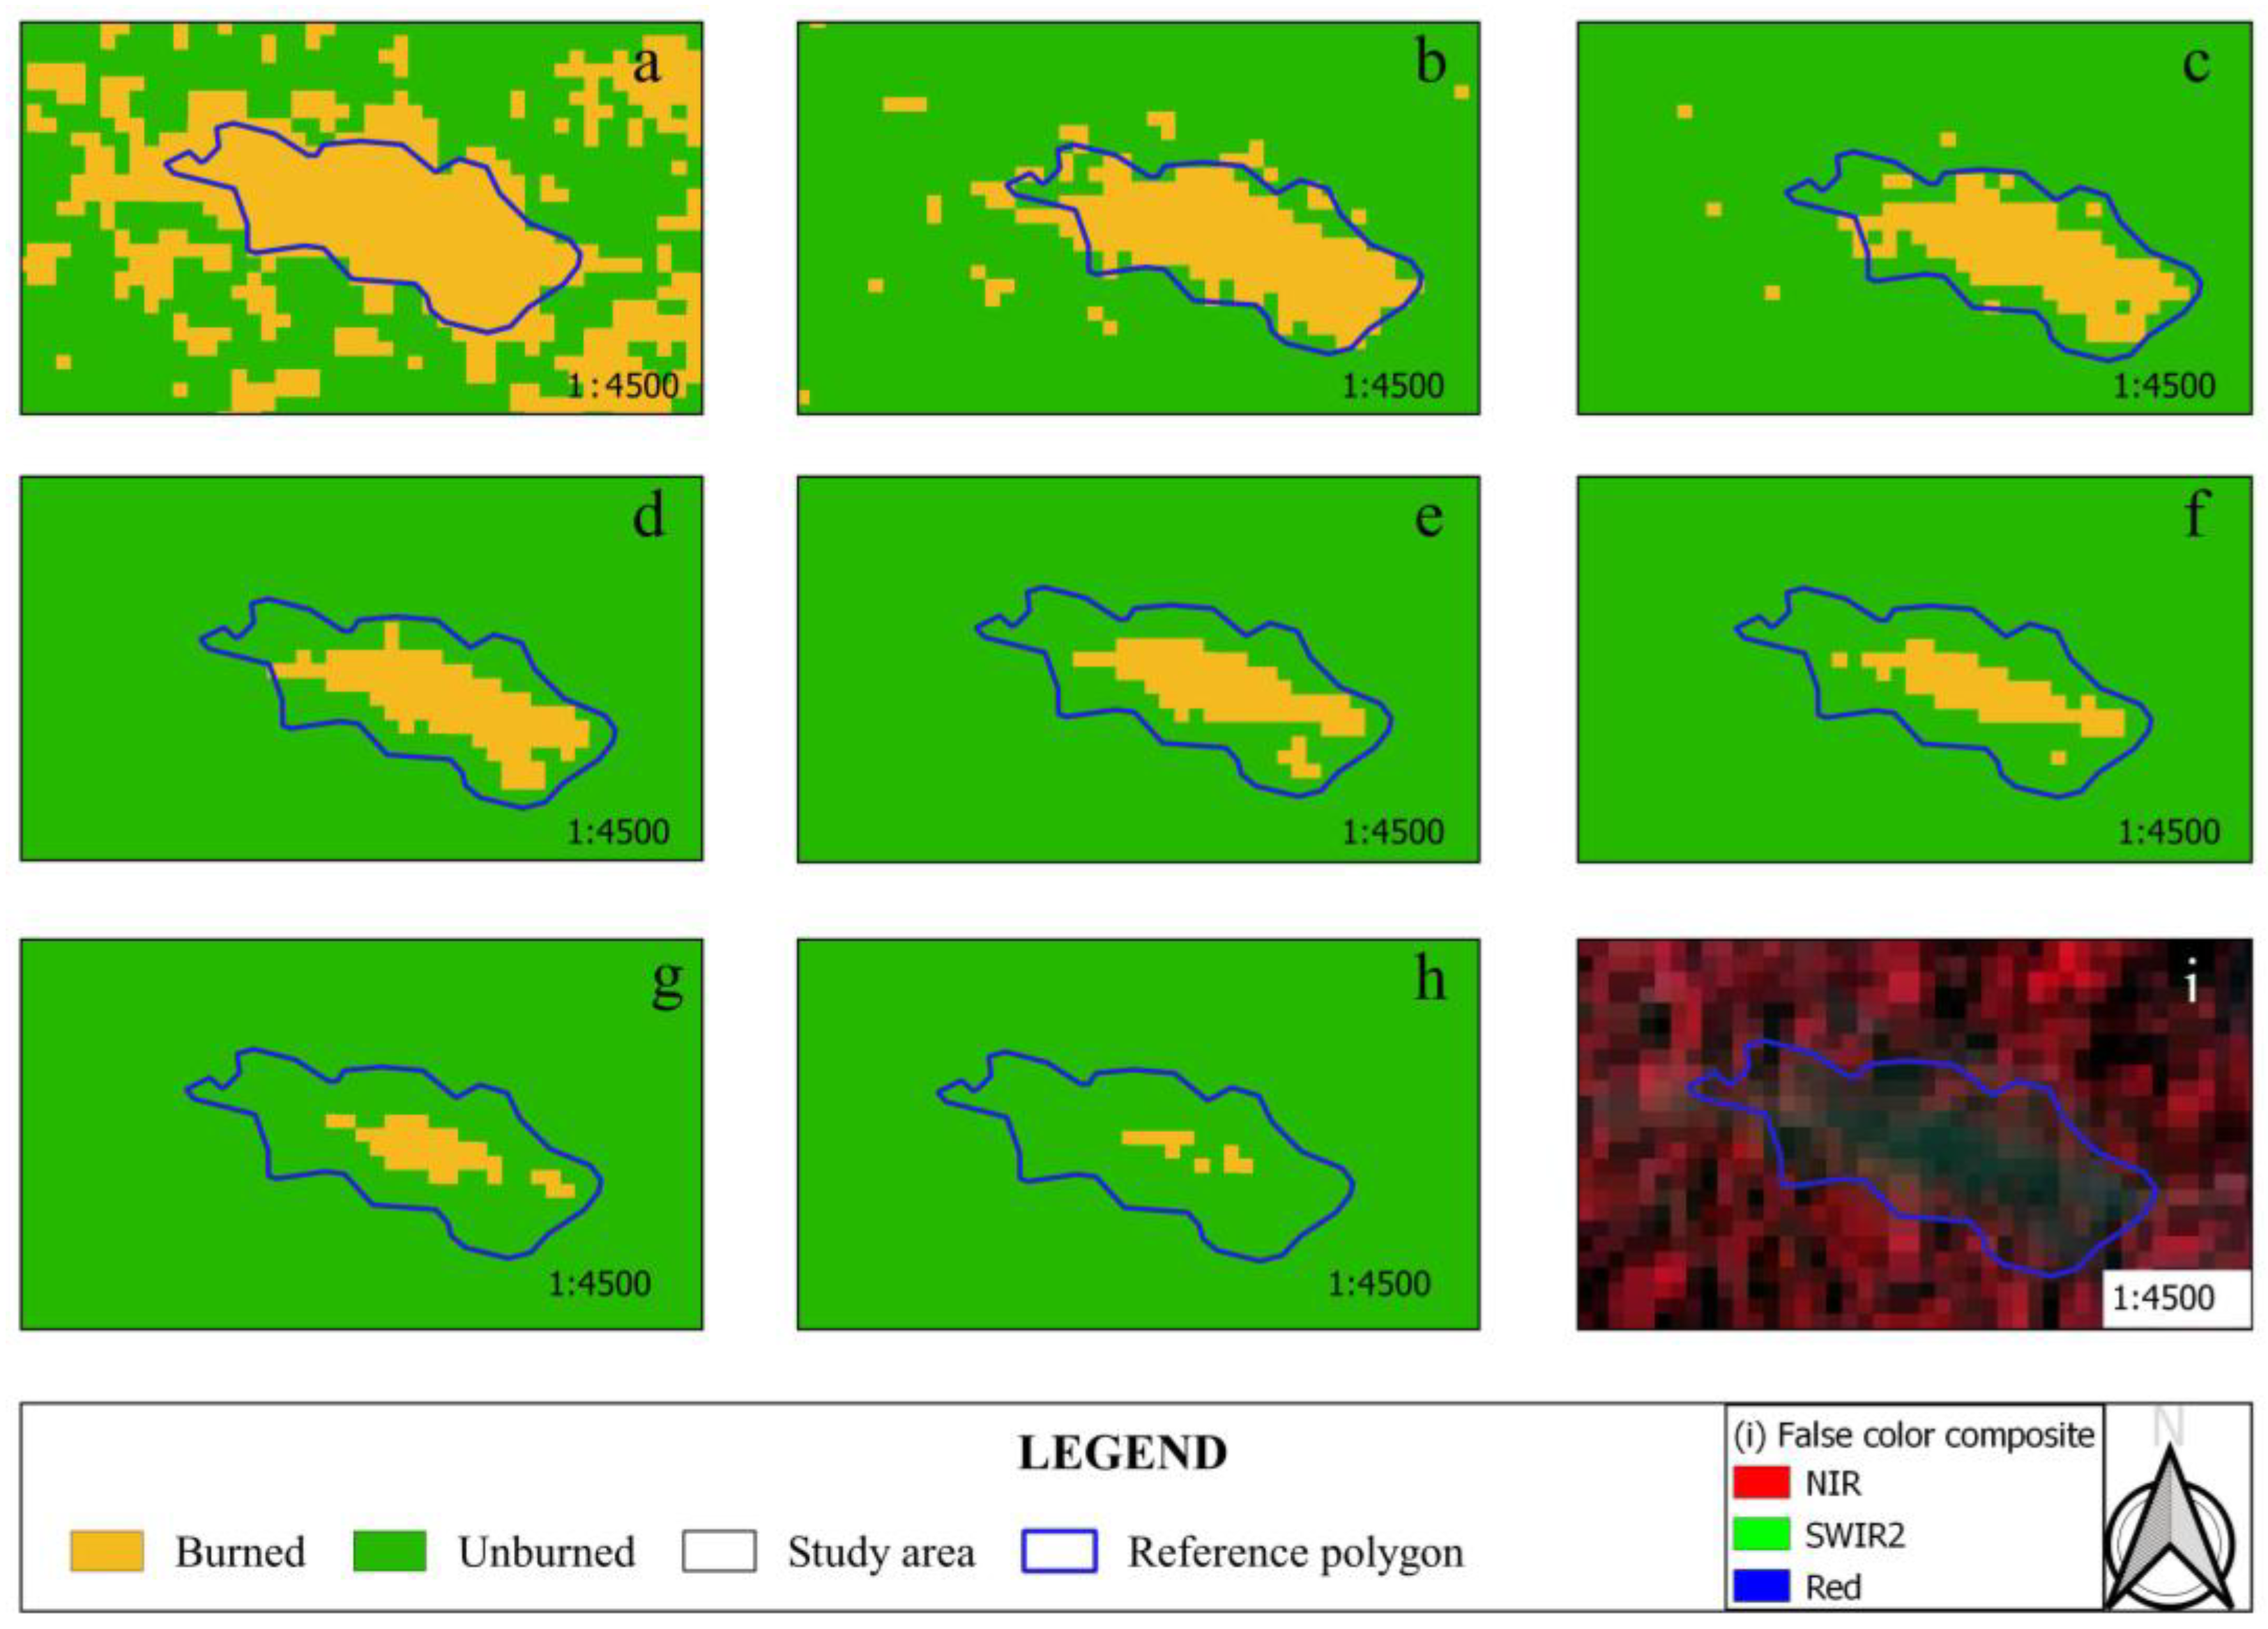
Figure 5 presents a detailed example of the spatial behavior of the probabilistic model within a representative reference polygon. Lower probability thresholds (panels a–b) produce more extensive burned-area estimates, leading to overestimation associated with a more permissive classification criterion. Intermediate probability thresholds (panels c–f) improve spatial agreement, reflecting a balance between commission and omission errors and showing better geometric alignment with the reference polygon. In contrast, increasing the probability threshold (panels g–i) reduces the extent of the detected burned area, concentrating it primarily within the polygon and resulting in more conservative and restrictive maps.
Figure 5.
Spatial detail of burned-area detections within a reference polygon: 0.10 (a), 0.20 (b), 0.30 (c), 0.40 (d), 0.50 (e), 0.60 (f), 0.70 (g), 0.80 (h), false color composite (i).
Model performance varied as a function of the probability threshold applied for burned area detection (Table 2). Overall accuracy remained high, starting at 0.79 with a threshold of 0.10, increasing to 0.89 at intermediate thresholds (0.50–0.70), and decreasing slightly at higher thresholds. Sensitivity progressively increased from 0.61 (threshold 0.10) to 0.99 (threshold 0.90), indicating an enhanced ability of the model to correctly identify burned areas at higher thresholds. In contrast, specificity declined from 0.97 to 0.68, reflecting an increase in commission errors. Model performance varied with the probability threshold. Lower thresholds achieved higher sensitivity, whereas higher thresholds increased specificity but substantially reduced the detection of burned areas. The Kappa coefficient reached its maximum value (0.79) at a probability threshold of 0.20, indicating the highest overall agreement. Beyond this threshold, Kappa decreased steadily as the threshold increased. Overall, low to intermediate thresholds (particularly 0.20) provided the most suitable balance between omission and commission errors while maintaining high classification agreement. Overall, the results indicate that the selection of the probability threshold significantly influences the trade-off between omission and commission errors. While lower thresholds tend to overestimate burned area, intermediate thresholds provide a more balanced performance, and higher thresholds prioritize a more conservative detection, associated with pixels exhibiting higher certainty of burn occurrence. This behavior is reflected in maps showing a more spatially coherent delineation of burned areas compared to those derived from lower probability thresholds.
Table 2.
Performance of the logistic regression model for burned area detection based on probability threshold (0.10–0.90).
4. Discussion
The logistic regression model showed good performance in detecting burned areas, evidencing the effectiveness of integrating relevant variables within a detection approach aimed at improving tools used to discriminate between burned and unburned areas. In this regard, logistic regression becomes a simple and competitive model for classifying large binary datasets, even in scenarios with imbalanced classes, standing out against other more complex algorithms applied to burned area analysis using satellite imagery [46,47]. The obtained values of sensitivity, specificity, accuracy, AUC, and Kappa coefficient, all close to 0.90, confirm high agreement between observed data and detected values. This behavior indicates that the logistic regression model was fitted with a balanced and representative dataset, demonstrating the model’s capacity to detect fire-affected areas during the period of highest fire occurrence and data availability (January–May). These results are consistent with previous research in other regions seeking tools for forest management, reporting efficient performance when employing spectral variables sensitive to detecting forest disturbances caused by fires, achieving metrics above 0.87 [48,49].
The RBRc and NDVI indices, together with the SWIR2 band, were determinant detected variables in the model, as they possess special characteristics for detecting forest disturbances caused by fires. The combined use of multiple indices and spectral bands allows clear separability between burned and unburned areas, due to the spectral sensitivity of these indices to fire [50,51]. In particular, NDVI shows high capacity to discriminate affected areas, where low values reflect the loss of vegetation cover and reduction in photosynthetic activity following the fire [47,52,53]. In contrast, elevated values of RBRc and the SWIR2 band in burned zones are associated with increased reflectance in the shortwave infrared, resulting from the presence of ash, exposed soils, and charred vegetation [54]. The use of relative indices with phenological correction, such as RBRc, contributes to maintaining and improving performance in burned area detection, even when the composite period is extended or dry ecosystems are analyzed [26,55]. The integration of multiple indices with spectral bands favors more precise classification of burned and unburned pixels [46]. In this regard, the differentiated spectral response of the detector supports the model’s capacity to discriminate fire-affected areas, confirming the relevance of the selected variables to represent spectral changes induced by fire.
Thresholds derived from different methodological approaches have been widely used as a tool within detection models to improve burned area detection, particularly in contexts where data exhibit an uneven distribution [26,56]. In this study, a spatial evaluation based on probability thresholds enabled an assessment of how different threshold levels influence the delineation of burned areas and their agreement with reference polygons. This approach, which integrates time series and monthly composites, enhances the spectral characterization of vegetation and reduces noise associated with cloud cover, shadows, and atmospheric contamination, resulting in improved accuracy in the detection of land cover patterns [57,58,59]. In line with this approach, the results obtained for the different probability thresholds indicate that, although lower threshold values exhibit better quantitative performance, their application tends to spatially overestimate the extent of burned areas. In contrast, higher probability thresholds, despite being associated with a slight reduction in overall performance metrics, produce a more conservative spatial delineation that shows greater coherence with the reference polygons by prioritizing pixels with a higher likelihood of being affected by fire. In this regard, the use of more conservative percentiles or stricter probability thresholds contributes to reducing commission errors in burned area detection [20,60]. Overall, these results indicate that integrating the model with more conservative probability thresholds provides a more realistic and spatially more accurate representation of the extent of fire-affected areas.
The evaluation of the probability raster against the reference polygons allowed an assessment of the model’s behavior across different percentiles and, consequently, its actual capacity to discriminate burned areas. This procedure represents a relevant methodological approach, as recent studies have demonstrated the usefulness of percentile-based thresholds for improving the classification of fire-affected areas [44,61]. In the present study, most of the evaluated probability thresholds exhibited good performance, maintaining an appropriate balance between omission and commission errors. Threshold selection was based on validation using reference polygons, which revealed that low probability thresholds tend to produce a spatial overestimation of burned area, intermediate thresholds provide a suitable balance between omission and commission errors, and high probability thresholds show greater spatial agreement with the reference data. These findings are consistent with previous studies that have reported high spatial agreement when applying optimal thresholds derived from detection models [62,63]. However, a critical aspect of model validation is the availability of reference polygons that are spatially and temporally comparable to burned area maps, as their absence or incompleteness may introduce biases in the estimation of accuracy metrics by omitting unrecorded fire events [64,65]. This limitation is reflected in the differences observed between the metrics derived from model development data and those obtained from detections validated with reference polygons, suggesting the presence of estimation bias and its potential impact on the interpretation of the model’s actual performance.
Likewise, spectral response and, therefore, accuracy may vary according to coverage type [66,67]. Although the model incorporated an index with phenological correction, the seasonal dynamics of vegetation may continue to influence remote interpretation due to different structural factors depending on vegetation type. For example, in pine forests, it has been found that post-fire regeneration develops distinctive phenological patterns that can persist for several years, sustainably modifying canopy structure and the spectral response of vegetation [68]. Meanwhile, in mixed oak-pine forests, the marked climatic seasonality and deciduous phenology of oaks generate a decrease in vegetation vigor during the dry season, which can partially mimic post-fire spectral conditions and increase confusion between burned and unburned areas [55].
Therefore, logistic regression models applied in regions with particular geographic, ecological, and climatic characteristics, as in the case study, represent a significant advance in the detection of burned areas with high ecological value. Their implementation in zones with similar conditions could contribute to improving the temporal and spatial characterization of burned areas [69]. This approach, by combining statistical techniques with robust remote sensing data and spectral information, allows increased precision in the detection and monitoring of areas affected by forest fires. Each index or spectral band provides complementary information; therefore, the integration of multiple indices and bands improves class separability and reduces false positives compared to methods based on a single fire index [70,71,72]. Likewise, in future studies it is relevant to incorporate topographic variables, especially in regional analyses, as areas with greater shading tend to decrease model accuracy in contrast to more illuminated zones [47,52]. Additionally, the inclusion of vegetation cover type is fundamental, given that phenology and spectral response before and after fire vary according to vegetation class [73,74,75]. Therefore, incorporating these variables in subsequent research will allow optimization of detection models and strengthen fire management in territories with particular environmental conditions, as occurs in the study zone, which possesses high ecological value due to the presence of Protected Natural Areas.
5. Conclusions
The LASSO-penalized logistic regression model, fitted with the NDVI and RBRc indices and the SWIR2 spectral band, demonstrated outstanding performance in classifying burned areas. Each of these variables provides relevant information for detection, reflecting the spectral changes associated with fire impact on vegetation and post-fire reflectance variations. The use of per-pixel means values to summarize the multitemporal information enabled statistically robust results and visually coherent maps, supporting a more accurate identification of burned areas.
Burned area mapping based on the probabilities detected by the model, integrating different probability thresholds, enabled a consistent identification of the spatial distribution of fire-affected areas within the study region. Although low probability thresholds exhibited better performance in terms of global accuracy metrics, they tended to spatially overestimate the extent of burned areas. In contrast, intermediate probability thresholds achieved a balance between omission and commission errors, while higher probability thresholds generally provided a more conservative and spatially coherent delineation consistent with the reference polygons. In this context, the use of probability thresholds represents an effective strategy for optimizing burned area detection in probabilistic models.
Finally, the regression model demonstrates potential as a tool for fire monitoring in areas of high ecological importance, such as the study zone. The integration of spectral variables with a probabilistic estimation model proved to be an efficient strategy for delineating fire-affected areas, balancing omission and commission errors. However, it is recommended to validate this method in other ecosystems and periods, as well as to conduct differentiated analyses by vegetation type, which could improve the model’s robustness and transferability.
Author Contributions
Conceptualization, E.S.C.-M., and P.M.L.-S.; Data curation, E.S.C.-M.; Formal analysis, E.S.C.-M.; Methodology, E.S.C.-M., and P.M.L.-S.; Software, E.S.C.-M. and P.M.L.-S.; Supervision, P.M.L.-S., and J.M.-L.; investigation, E.S.C.-M.; Visualization, E.S.C.-M.; Writing—original draft, E.S.C.-M.; Writing—review and editing, E.S.C.-M., P.M.L.-S., J.M.-L., C.W., and L.d.L.M.-D. All authors have read and agreed to the published version of the manuscript.
Funding
This research received no external funding.
Institutional Review Board Statement
Not applicable.
Informed Consent Statement
Not applicable.
Data Availability Statement
The data presented in this study are publicly available.
Acknowledgments
This study was made possible through the financial support provided by Secretariat of Science, Humanities and Technology (SECIHTI) for doctoral studies.
Conflicts of Interest
The authors declare no conflicts of interest.
Abbreviations
| ANP | Protected Natural Area |
| AUC | Area Under the Curve |
| CONAFOR | National Forestry Commission |
| GEE | Google Earth Engine |
| LASSO | Least Absolute Shrinkage and Selection Operator |
| NBR | Normalized Burn Ratio |
| NDVI | Normalized Difference Vegetation Index |
| RBRc | Relativized Burn Ratio corrected |
| TSS | True Skill Statistic |
| SWIR2 | Shortwave Infrared2 |
References
- Eckert, S.; Hüsler, F.; Liniger, H.; Hodel, E. Trend analysis of MODIS NDVI time series for detecting land degradation and regeneration in Mongolia. J. Arid Environ. 2015, 113, 16–28. [Google Scholar] [CrossRef] [Scilit]
- Hudiburg, T.; Mathias, J.; Bartowitz, K.; Berardi, D.M.; Bryant, K.; Graham, E.; Kolden, C.A.; Betts, R.A.; Lynch, L. Terrestrial carbon dynamics in an era of increasing wildfire. Nat. Clim. Change 2023, 13, 1306–1316. [Google Scholar] [CrossRef] [Scilit]
- Trotta, G.; Cadez, L.; Boscutti, F.; Vuerich, M.; Asquini, E.; Boscarol, G.; Cingano, P.; Azzani, G.; Pischedda, S.; Tomao, A.; et al. Interpreting the shifts in forest structure, plant community composition, diversity, and functional identity by using remote sensing-derived wildfire severity. Fire Ecol. 2024, 20, 94. [Google Scholar] [CrossRef] [Scilit]
- Bond, W.J.; Keane, R.E. Fires, Ecological Effects of. In Reference Module in Life Sciences; Elsevier: Amsterdam, The Netherlands, 2017. [Google Scholar] [CrossRef] [Scilit]
- Bowman, D.M.J.S.; Balch, J.K.; Artaxo, P.; Bond, W.J.; Carlson, J.M.; Cochrane, M.A.; D’Antonio, C.M.; DeFries, R.S.; Doyle, J.C.; Harrison, S.P.; et al. Fire in the Earth System. Science (1979) 2009, 324, 481–484. [Google Scholar] [CrossRef] [Scilit] [PubMed]
- Chen, Y.; Hall, J.; Van Wees, D.; Andela, N.; Hantson, S.; Giglio, L.; Van Der Werf, G.R.; Morton, D.C.; Randerson, J.T. Multi-decadal trends and variability in burned area from the fifth version of the Global Fire Emissions Database (GFED5). Earth Syst. Sci. Data 2023, 15, 5227–5259. [Google Scholar] [CrossRef] [Scilit]
- D’Evelyn, S.M.; Jung, J.; Alvarado, E.; Baumgartner, J.; Caligiuri, P.; Hagmann, R.K.; Henderson, S.B.; Hessburg, P.F.; Hopkins, S.; Kasner, E.J.; et al. Wildfire, Smoke Exposure, Human Health, and Environmental Justice Need to be Integrated into Forest Restoration and Management. Curr. Environ. Health Rep. 2022, 9, 366–385. [Google Scholar] [CrossRef] [Scilit]
- Dupuy, J.; Fargeon, H.; Martin-StPaul, N.; Pimont, F.; Ruffault, J.; Guijarro, M.; Hernando, C.; Madrigal, J.; Fernandes, P.; Dupuy Jean-lucDupuy, J. Climate change impact on future wildfire danger and activity in southern Europe: A review. Ann. For. Sci. 2020, 77, 35. [Google Scholar] [CrossRef] [Scilit]
- Kala, C.P. Environmental and socioeconomic impacts of forest fires: A call for multilateral cooperation and management interventions. Nat. Hazards Res. 2023, 3, 286–294. [Google Scholar] [CrossRef] [Scilit]
- Almalki, R.; Khaki, M.; Saco, P.M.; Rodriguez, J.F. Monitoring and Mapping Vegetation Cover Changes in Arid and Semi-Arid Areas Using Remote Sensing Technology: A Review. Remote Sens. 2022, 14, 5143. [Google Scholar] [CrossRef] [Scilit]
- Chuvieco, E.; Mouillot, F.; van der Werf, G.R.; San Miguel, J.; Tanasse, M.; Koutsias, N.; García, M.; Yebra, M.; Padilla, M.; Gitas, I.; et al. Historical background and current developments for mapping burned area from satellite Earth observation. Remote Sens. Environ. 2019, 225, 45–64. [Google Scholar] [CrossRef] [Scilit]
- Saavedra-Mera, K.A. Perspectivas sobre el uso de tecnología de teledetección para el monitoreo de la deforestación y degradación forestal. Multidiscip. Collab. J. 2024, 2, 1–12. [Google Scholar] [CrossRef] [Scilit]
- Chuvieco, E. Global impacts of fire. In Earth Observation of Wildland Fires in Mediterranean Ecosystems; Springer: Berlin/Heidelberg, Germany, 2009; pp. 1–10. [Google Scholar] [CrossRef] [Scilit]
- Otón, G.; Ramo, R.; Lizundia-Loiola, J.; Chuvieco, E. Global detection of long-term (1982–2017) Burned Area with AVHRR-LTDR data. Remote Sens. 2019, 11, 2079. [Google Scholar] [CrossRef] [Scilit]
- Wooster, M.J.; Roberts, G.J.; Giglio, L.; Roy, D.; Freeborn, P.; Boschetti, L.; Justice, C.; Ichoku, C.; Schroeder, W.; Davies, D.; et al. Satellite remote sensing of active fires: History and current status, applications and future requirements. Remote Sens. Environ. 2021, 267, 112694. [Google Scholar] [CrossRef] [Scilit]
- Reinosch, E.; Backa, J.; Adler, P.; Deutscher, J.; Eisnecker, P.; Hoffmann, K.; Langner, N.; Puhm, M.; Rüetschi, M.; Straub, C.; et al. Detailed validation of large-scale Sentinel-2-based forest disturbance maps across Germany. Forestry 2025, 98, 437–453. [Google Scholar] [CrossRef] [Scilit]
- Sobrino, J.A.; Llorens, R.; Fernández, C.; Fernández-Alonso, J.M.; Vega, J.A. Relationship between forest fires severity measured in situ and through remotely sensed spectral indices. Forests 2019, 10, 457. [Google Scholar] [CrossRef] [Scilit]
- Luo, H.; Wu, J. An Assessment of the Suitability of Sentinel-2 Data for Identifying Burn Severity in Areas of Low Vegetation. J. Indian Soc. Remote Sens. 2022, 50, 1135–1144. [Google Scholar] [CrossRef] [Scilit]
- Llorens, R.; Sobrino, J.A.; Fernández, C.; Fernández-Alonso, J.M.; Vega, J.A. A methodology to estimate forest fires burned areas and burn severity degrees using Sentinel-2 data. Application to the October 2017 fires in the Iberian Peninsula. Int. J. Appl. Earth Obs. Geoinf. 2021, 95, 102243. [Google Scholar] [CrossRef] [Scilit]
- Amos, C.; Petropoulos, G.P.; Ferentinos, K.P. Determining the use of Sentinel-2A MSI for wildfire burning & severity detection. Int. J. Remote Sens. 2019, 40, 905–930. [Google Scholar] [CrossRef] [Scilit]
- Filipponi, F. BAIS2: Burned Area Index for Sentinel-2. Proceedings 2018, 2, 364. [Google Scholar] [CrossRef] [Scilit]
- Lasaponara, R.; Abate, N.; Fattore, C.; Aromando, A.; Cardettini, G.; Di Fonzo, M. On the Use of Sentinel-2 NDVI Time Series and Google Earth Engine to Detect Land-Use/Land-Cover Changes in Fire-Affected Areas. Remote Sens. 2022, 14, 4723. [Google Scholar] [CrossRef] [Scilit]
- Fornacca, D.; Ren, G.; Xiao, W. Evaluating the Best Spectral Indices for the Detection of Burn Scars at Several Post-Fire Dates in a Mountainous Region of Northwest Yunnan, China. Remote Sens. 2018, 10, 1196. [Google Scholar] [CrossRef] [Scilit]
- Gupta, P.; Shukla, A.K.; Shukla, D.P. Sentinel 2 based burn severity mapping and assessing post-fire impacts on forests and buildings in the Mizoram, a north-eastern Himalayan region. Remote Sens. Appl. 2024, 36, 101279. [Google Scholar] [CrossRef] [Scilit]
- Suwanprasit, C.; Shahnawaz. Mapping burned areas in Thailand using Sentinel-2 imagery and OBIA techniques. Sci. Rep. 2024, 14, 9609. [Google Scholar] [CrossRef] [Scilit]
- Silva-Cardoza, A.I.; Vega-Nieva, D.J.; Briseño-Reyes, J.; Briones-Herrera, C.I.; López-Serrano, P.M.; Corral-Rivas, J.J.; Parks, S.A.; Holsinger, L.M. Evaluating a New Relative Phenological Correction and the Effect of Sentinel-Based Earth Engine Compositing Approaches to Map Fire Severity and Burned Area. Remote Sens. 2022, 14, 3122. [Google Scholar] [CrossRef] [Scilit]
- Yakubu, I.; Mireku Gyimah, D.; Duker, A.A. Review of methods for modelling forest fire risk and hazard. Afr. J. Environ. Sci. Technol. 2015, 9, 155–165. [Google Scholar] [CrossRef] [Scilit]
- Catry, F.X.; Rego, F.C.; Bação, F.L.; Moreira, F. Modeling and mapping wildfire ignition risk in Portugal. Int. J. Wildland Fire 2009, 18, 921–931. [Google Scholar] [CrossRef] [Scilit]
- Nhongo, E.J.S.; Fontana, D.C.; Guasselli, L.A.; Bremm, C. Probabilistic modelling of wildfire occurrence based on logistic regression, Niassa Reserve, Mozambique. Geomat. Nat. Hazards Risk 2019, 10, 1772–1792. [Google Scholar] [CrossRef] [Scilit]
- Gao, C.; Lin, H.L.; Hu, H.Q.; Song, H. A review of models of forest fire ocurrence prediction in China. Ying Yong Sheng Tai Xue Bao/J. Appl. Ecol. 2020, 31, 3227–3240. [Google Scholar] [CrossRef]
- Lenero, L.A.; Escamilla, M.; de Azcarate, J.G.; Gonzalez-Trapaga, A.; Cleef, A.M. Vegetación alpina de los volcanes Popocatépetl, Iztaccíhuatl y Nevado de Toluca. In Biodiversidad de la Faja Volcánica Transmexicana; Luna, I., Morrone, J.J., Espinosa, D., Eds.; FES-Zaragoza-CONABIO: Iztapalapa, Mexico, 2015; pp. 179–198. [Google Scholar]
- Quiroz-Ibarra, A.; Torres-Lima, P.; Conway-Gómez, K. Community adaptive capacity in Peri-urban natural protected areas: A case study near Mexico City. Sustainability 2020, 12, 4416. [Google Scholar] [CrossRef] [Scilit]
- Comisión Nacional Forestal. Incendios; Sistema Nacional de Información Forestal—Comisión Nacional Forestal: Jalisco, Mexico, 2025; Available online: https://snif.cnf.gob.mx/incendios/ (accessed on 13 May 2025).
- Arriola Padilla, V.J.; Martínez Estrada, E.; Ortega-Rubio, A.; Pérez Miranda, R.; Gijón Hernández, A.R. Deterioro en áreas naturales protegidas del centro de México y del Eje Neovolcánico Transversal. Investig. Cienc. Univ. Autónoma Aguascalientes 2014, 60, 37–49. [Google Scholar]
- Arboit, M.E.; Maglione, D.S. Análisis multitemporal y multiespacial del Índice de Vegetación de Diferencia Normalizada (NDVI) y del índice de Vegetación Ajustado al Suelo (SAVI) en centros urbanos forestados y oasis irrigados, con climas secos. Boletín Estud. Geográficos 2018, 109, 13–60. [Google Scholar]
- Huang, H.; Roy, D.P.; Boschetti, L.; Zhang, H.K.; Yan, L.; Kumar, S.S.; Gomez-Dans, J.; Li, J. Separability analysis of Sentinel-2A Multi-Spectral Instrument (MSI) data for burned area discrimination. Remote Sens. 2016, 8, 873. [Google Scholar] [CrossRef] [Scilit]
- Parks, S.A.; Holsinger, L.M.; Voss, M.A.; Loehman, R.A.; Robinson, N.P. Mean composite fire severity metrics computed with Google Earth Engine offer improved accuracy and expanded mapping potential. Remote Sens. 2018, 10, 879. [Google Scholar] [CrossRef] [Scilit]
- Qiu; Qiu, S.; Zhu, Z.; Olofsson, P.; Woodcock, C.E.; Jin, S. Evaluation of Landsat Image Compositing Algorithms. Remote Sens. Environ. 2022, 285, 113375. [Google Scholar] [CrossRef] [Scilit]
- Hosmer, D.W.; Lemeshow, S. Introduction to the Logistic Regression Model. In Applied Logistic Regression; Wiley: Hoboken, NJ, USA, 2000. [Google Scholar]
- Tibshiranit, R. Regression Shrinkage and Selection via the Lasso. J. R. Stat. Soc. Ser. B 1996, 58, 267–288. [Google Scholar] [CrossRef] [Scilit]
- Fawcett, T. An introduction to ROC analysis. Pattern Recognit. Lett. 2006, 27, 861–874. [Google Scholar] [CrossRef] [Scilit]
- Youden, W.J. Index for rating diagnostic tests. Cancer 1950, 1, 310. [Google Scholar] [CrossRef] [Scilit]
- Allouche, O.; Tsoar, A.; Kadmon, R. Assessing the accuracy of species distribution models: Prevalence, kappa and the true skill statistic (TSS). J. Appl. Ecol. 2006, 43, 1223–1232. [Google Scholar] [CrossRef] [Scilit]
- Wang, S.S.C.; Wang, Y. Quantifying the effects of environmental factors on wildfire burned area in the south central US using integrated machine learning techniques. Atmos. Chem. Phys. 2020, 20, 11065–11087. [Google Scholar] [CrossRef] [Scilit]
- Fielding, A.H.; Bell, J.F. A review of methods for assessment of prediction errors in conservation presence/absence models. Environ. Conserv. 1997, 24, 38–49. [Google Scholar] [CrossRef] [Scilit]
- Militino, A.F.; Goyena, H.; Pérez-Goya, U.; Ugarte, M.D. Logistic regression versus XGBoost for detecting burned areas using satellite images. Environ. Ecol. Stat. 2024, 31, 57–77. [Google Scholar] [CrossRef] [Scilit]
- Pu, R.; Gong, P. Determination of Burnt Scars Using Logistic Regression and Neural Network Techniques from a Single Post-Fire Landsat 7 ETM Image. Photogramm. Eng. Remote Sens. 2004, 70, 841–850. [Google Scholar] [CrossRef] [Scilit]
- Peng, W.; Wei, Y.; Chen, G.; Lu, G.; Ye, Q.; Ding, R.; Hu, P.; Cheng, Z. Analysis of Wildfire Danger Level Using Logistic Regression Model in Sichuan Province, China. Forests 2023, 14, 2352. [Google Scholar] [CrossRef] [Scilit]
- Pham, B.T.; Jaafari, A.; Avand, M.; Al-Ansari, N.; Dinh Du, T.; Yen, H.P.H.; Phong, T.V.; Nguyen, D.H.; Le, H.V.; Mafi-Gholami, D.; et al. Performance evaluation of machine learning methods for forest fire modeling and prediction. Symmetry 2020, 12, 1022. [Google Scholar] [CrossRef] [Scilit]
- Ba, R.; Song, W.; Li, X.; Xie, Z.; Lo, S. Integration of multiple spectral indices and a neural network for burned area mapping based on MODIS data. Remote Sens. 2019, 11, 326. [Google Scholar] [CrossRef] [Scilit]
- Wu, B.; Zheng, H.; Xu, Z.; Wu, Z.; Zhao, Y. Forest Burned Area Detection Using a Novel Spectral Index Based on Multi-Objective Optimization. Forests 2022, 13, 1787. [Google Scholar] [CrossRef] [Scilit]
- Plybour, C.; Laosuwan, T. The Application of Remote Sensing Technology to Investigation of Areas Burned by Forest Fires. ARPN J. Eng. Appl. Sci. 2023, 18, 1039–1045. [Google Scholar] [CrossRef] [Scilit]
- Zahabnazouri, S.; Belmont, P.; David, S.; Wigand, P.E.; Elia, M.; Capolongo, D. Detecting Burn Severity and Vegetation Recovery After Fire Using dNBR and dNDVI Indices: Insight from the Bosco Difesa Grande, Gravina in Southern Italy. Sensors 2025, 25, 3097. [Google Scholar] [CrossRef] [Scilit]
- Liu, S.; Zheng, Y.; Dalponte, M.; Tong, X. A novel fire index-based burned area change detection approach using Landsat-8 OLI data. Eur. J. Remote Sens. 2020, 53, 104–112. [Google Scholar] [CrossRef] [Scilit]
- Balcázar Medina, O.E.; Jardel Peláez, E.J.; Vega-Nieva, D.J.; Silva-Cardoza, A.I.; Cuevas Guzmán, R. Mapping Soil Burn Severity and Crown Scorch Percentage with Sentinel-2 in Seasonally Dry Deciduous Oak and Pine Forests in Western Mexico. Remote Sens. 2025, 17, 2307. [Google Scholar] [CrossRef] [Scilit]
- De Jong, M.C.; Wooster, M.J.; Kitchen, K.; Manley, C.; Gazzard, R.; McCall, F.F. Calibration and evaluation of the Canadian Forest Fire Weather Index (FWI) System for improved wildland fire danger rating in the United Kingdom. Nat. Hazards Earth Syst. Sci. 2016, 16, 1217–1237. [Google Scholar] [CrossRef] [Scilit]
- Xie, S.; Liu, L.; Yang, J. Time-series model-adjusted percentile features: Improved percentile features for land-cover classification based on landsat data. Remote Sens. 2020, 12, 3091. [Google Scholar] [CrossRef] [Scilit]
- Azzari, G.; Lobell, D.B. Landsat-based classification in the cloud: An opportunity for a paradigm shift in land cover monitoring. Remote Sens. Environ. 2017, 202, 64–74. [Google Scholar] [CrossRef] [Scilit]
- Hansen, M.C.; Egorov, A.; Roy, D.P.; Potapov, P.; Ju, J.; Turubanova, S.; Kommareddy, I.; Loveland, T.R. Continuous fields of land cover for the conterminous United States using Landsat data: First results from the Web-Enabled Landsat Data (WELD) project. Remote Sens. Lett. 2011, 2, 279–288. [Google Scholar] [CrossRef] [Scilit]
- Chuvieco, E.; Opazo, S.; Sione, W.; Del Valle, H.; Anaya, J.; Di Bella, C.; Cruz, I.; Manzo, L.; López, G.; Mari, N.; et al. Global burned-land estimation in Latin America using MODIS composite data. Ecol. Appl. 2008, 18, 64–79. [Google Scholar] [CrossRef] [Scilit]
- Guo, Z.; Li, W.; Ciais, P.; Sitch, S.; Van Der Werf, G.R.; Bowring, S.P.K.; Bastos, A.; Mouillot, F.; He, J.; Sun, M.; et al. Reconstructed global monthly burned area maps from 1901 to 2020. Earth Syst. Sci. Data 2025, 17, 3599–3618. [Google Scholar] [CrossRef] [Scilit]
- Bastarrika, A.; Chuvieco, E.; Martín, M.P. Mapping burned areas from landsat TM/ETM+ data with a two-phase algorithm: Balancing omission and commission errors. Remote Sens. Environ. 2011, 115, 1003–1012. [Google Scholar] [CrossRef] [Scilit]
- Chen, X.; Zhang, Y.; Wang, S.; Zhao, Z.; Liu, C.; Wen, J. Comparative study of machine learning methods for mapping forest fire areas using Sentinel-1B and 2A imagery. Front. Remote Sens. 2024, 5, 1446641. [Google Scholar] [CrossRef] [Scilit]
- Franquesa, M.; Vanderhoof, M.K.; Stavrakoudis, D.; Gitas, I.Z.; Roteta, E.; Padilla, M.; Chuvieco, E. Development of a standard database of reference sites for validating global burned area products. Earth Syst. Sci. Data 2020, 12, 3229–3246. [Google Scholar] [CrossRef] [Scilit]
- Sali, M.; Piaser, E.; Boschetti, M.; Brivio, P.A.; Sona, G.; Bordogna, G.; Stroppiana, D. A burned area mapping algorithm for sentinel-2 data based on approximate reasoning and region growing. Remote Sens. 2021, 13, 2214. [Google Scholar] [CrossRef] [Scilit]
- Boschetti, L.; Roy, D.P.; Giglio, L.; Huang, H.; Zubkova, M.; Humber, M.L. Global validation of the collection 6 MODIS burned area product. Remote Sens. Environ. 2019, 235, 111490. [Google Scholar] [CrossRef] [Scilit]
- España-Boquera, M.L.; Champo-Jiménez, O.; Uribe-Salas, M.D. Extensión y severidad de incendios forestales en Michoacán, México en 2021 a partir de imágenes sentinel-2. Polibotanica 2024 57, 125–144. [CrossRef] [Scilit]
- Walker, J.J.; Soulard, C.E. Phenology patterns indicate recovery trajectories of ponderosa pine forests after high-severity fires. Remote Sens. 2019, 11, 2782. [Google Scholar] [CrossRef] [Scilit]
- Reiner, A.L.; Baker, C.; Wahlberg, M.; Rau, B.M.; Birch, J.D. Region-Specific Remote-Sensing Models for Predicting Burn Severity, Basal Area Change, and Canopy Cover Change following Fire in the Southwestern United States. Fire 2022, 5, 137. [Google Scholar] [CrossRef] [Scilit]
- Deshpande, M.V.; Pillai, D.; Jain, M. Agricultural buerned area detection using an integrated approach utilizing multi spectral instrument based fire and vegetation indices from Sentinel-2 satellite. MethodsX 2022, 108, 101741. [Google Scholar] [CrossRef] [Scilit]
- Liu, C.L.; Wang, Y.R.; Liu, W.Y. Multi-index remote sensing for post-fire damage assessment: Accuracy, carbon loss, and conservation implications. Front. For. Glob. Change 2025, 8, 1577612. [Google Scholar] [CrossRef] [Scilit]
- Smiraglia, D.; Filipponi, F.; Mandrone, S.; Tornato, A.; Taramelli, A. Agreement index for burned area mapping: Integration of multiple spectral indices using Sentinel-2 satellite images. Remote Sens. 2020, 12, 1862. [Google Scholar] [CrossRef] [Scilit]
- Jimeno-Llorente, L.; Marcos, E.; Fernández-Guisuraga, J.M. The Effects of Fire Severity on Vegetation Structural Complexity Assessed Using SAR Data Are Modulated by Plant Community Types in Mediterranean Fire-Prone Ecosystems. Fire 2023, 6, 450. [Google Scholar] [CrossRef] [Scilit]
- Li, W.; Xu, Q.; Yi, J.; Liu, J. Predictive model of spatial scale of forest fire driving factors: A case study of Yunnan Province, China. Sci. Rep. 2022, 12, 19029. [Google Scholar] [CrossRef] [Scilit]
- Serra, L.; Juan, P.; Díaz-Avalos, C.; Aragó, P.; Chaudhuri, S.; Trilles, S. Classification of wildfires in relation to land cover types and associated variables by applying cluster analysis: A case study in the Iberian Peninsula. Environ. Monit. Assess. 2025, 197, 1–23. [Google Scholar] [CrossRef] [Scilit]

Disclaimer/Publisher’s Note: The statements, opinions and data contained in all publications are solely those of the individual author(s) and contributor(s) and not of MDPI and/or the editor(s). MDPI and/or the editor(s) disclaim responsibility for any injury to people or property resulting from any ideas, methods, instructions or products referred to in the content. |
© 2026 by the authors. Licensee MDPI, Basel, Switzerland. This article is an open access article distributed under the terms and conditions of the Creative Commons Attribution (CC BY) license.