


Abstract
The traditional solid-state method was employed in this study to prepare Mn-Zn ferrite. By adjusting the sintering temperature and the MoO3 doping ratio, the evolution of its structural and magnetic properties was systematically investigated. Fe2O3, MnO, and ZnO were used as the main raw materials, with MoO3 serving as an additive. MoO3 was doped at molar ratios ranging from 0 to 1000 ppm under experimental conditions involving a sintering temperature between 1125 °C and 1165 °C and an oxygen concentration of 1.5%. The addition of an appropriate amount of MoO3 led to an increase in the Q value, which consequently resulted in a reduction in the loss. The formation of a single-phase spinel structure was confirmed by X-ray diffraction analysis. Observations of the surface morphology revealed that the grain size also increased with the increase in MoO3 content, a trend consistent with the enhanced grain growth kinetics at higher MoO3 levels. In this study, a Mn-Zn ferrite material with excellent comprehensive performance was successfully prepared under the optimal conditions of a sintering temperature of 1150 °C and a MoO3 doping concentration of 500 ppm. A Q value of 22.3 was obtained for this material at 25 °C, while a Q value of 15.7 was obtained at 100 °C. At room temperature, a Q value of 192.4 was measured at a test frequency of 500 kHz, and a Q value of 137.2 was measured at 1 MHz. At a frequency of 500 kHz, a loss of 27.1 kW/m3 was observed at 25 °C, and a loss of 53.6 kW/m3 was observed at 100 °C. At a frequency of 1 MHz, a loss of 88.2 kW/m3 was recorded at 25 °C, while a loss of 183.7 kW/m3 was recorded at 100 °C. Additionally, the lattice constant was stabilized in the range of 8.52–8.53 Å, indicating favorable structural stability.
1. Introduction
Mn-Zn ferrite is the most widely used soft magnetic material in high-frequency power electronics, switching power supplies, electromagnetic filtering, and communication devices. By virtue of its high permeability, high saturation magnetic flux density, and low power loss, it serves as the core medium for efficient energy conversion and electromagnetic compatibility [1,2]. With the development of devices toward higher frequencies, miniaturization, and lower losses, conventional Mn-Zn ferrite still faces bottlenecks in terms of grain uniformity and density, making it difficult to meet the requirements of demanding operating conditions [3]. Ionic doping and oxide modification are considered the most effective and industrially feasible approaches for regulating the microstructure and magnetoelectric properties of such materials [4]. As a typical high-valence oxide additive, MoO3 can promote uniform grain growth and enhance density during the sintering process. Additionally, it increases resistivity and suppresses eddy current loss through grain boundary modification, thereby optimizing permeability, saturation magnetization, and power loss [5,6]. At present, the structure–property relationship among MoO3 doping concentration, microstructural evolution, and magnetic properties still requires systematic clarification. To this end, the effect of MoO3 addition on the phase structure, microstructure, and magnetic properties of Mn-Zn ferrite was systematically investigated in this study, with the aim of providing experimental support for the composition design and process optimization of high-performance soft magnetic ferrites [7].
In this study, Mn-Zn ferrite was prepared using a conventional solid-state method. The evolution of its structure and magnetic properties was systematically investigated by adjusting the sintering temperature and the MoO3 doping ratio [8]. Using Fe2O3, MnO, and ZnO as the main raw materials, with molar percentages of 56.17%, 39.44%, and 4.28%, respectively, and MoO3 as an additive, Mn0.816Zn0.091Fe2.093MoxO4 ferrite was prepared at MoO3 molar ratios ranging from 0 to 1000 ppm. An orthogonal experimental design was adopted to explore the effects of sintering temperatures from 1120 °C to 1165 °C and MoO3 doping concentrations from 0 to 1000 ppm under an oxygen concentration of 1.5%. The phase composition, elemental valence states, and microstructure of the samples were characterized by X-ray diffraction (XRD), X-ray photoelectron spectroscopy (XPS), Scanning electron microscopy (SEM), and energy-dispersive spectroscopy (EDS), while magnetic properties such as hysteresis loops, quality factor Q, loss, and effective permeability were measured using a B-H analyzer and a high-precision inductive component tester [9,10]. Through the synergistic regulation of processing conditions and doping, this study aimed to address the issue of high losses at excessively high temperature and high frequency in conventional Mn-Zn ferrite and to refine the correlation mechanism among sintering temperature, doping ratio, microstructure, and magnetic properties. The findings provide practical references for the industrial production and targeted design of high-performance Mn-Zn ferrite and are of significant importance for improving the efficiency and reliability of high-frequency power electronic devices.
2. Materials and Methods
2.1. Material Preparation and Experimental Design
In this study, Mn0.816Zn0.091Fe2.093MoxO4 ferrite was prepared by a conventional solid-state method, using Fe2O3, MnO, and ZnO as the main raw materials, with molar percentages of 56.17%, 39.44%, and 4.28%, respectively. To systematically investigate the effects of sintering temperature and MoO3 doping concentration on the structural and magnetic properties of the material, a multi-factor experimental scheme based on orthogonal design principles was implemented. The sintering temperature was set at 1120 °C, 1135 °C, 1150 °C, and 1165 °C, while the MoO3 doping concentration was controlled within the range of 0–1000 ppm across five gradients. The heating rate during sintering was maintained at 1.5 °C/min, and the cooling rate was maintained at 5 °C/min. The entire heating process lasted 1000 min, the holding time was maintained at 240 min, and the cooling time was maintained at 300 min. The combinations of variables were proportioned according to orthogonal design principles to ensure the systematic nature of the experimental parameters and the comparability of the results [11]. Although multiple process conditions were covered in the experiment, the focus of the study was concentrated on the effect of MoO3 doping concentration on the properties of Mn-Zn ferrite. The testing environments were set at 25 °C and 100 °C to simulate room-temperature and high-temperature conditions, and the testing frequencies were set at 500 kHz and 1 MHz to simulate low-frequency and high-frequency environments. Through various characterization techniques such as XRD, XPS, SEM, EDS, and hysteresis loop measurements, the influence of varying MoO3 doping concentration on the crystal structure, valence state distribution, microstructure, and magnetic properties of the samples was systematically analyzed. Data from the remaining parameter groups were used as auxiliary references to verify the reliability of the experimental conclusions.
2.2. Characterization Methods and Performance Testing
For structural characterization, the phase composition was analyzed by X-ray diffraction, and the elemental valence states were analyzed by X-ray photoelectron spectroscopy. Scanning electron microscopy and energy-dispersive spectroscopy were employed to observe the microstructure and elemental distribution. For magnetic property measurement, the hysteresis loop was measured using a B-H analyzer, while the quality factor Q, loss, and effective permeability were measured using a high-precision inductive component tester. The X-ray diffractometer used in this study is a D8 ADVANCE model manufactured by Bruker AXS GmbH, Karlsruhe, Germany. The X-ray photoelectron spectrometer is an ESCALAB 250Xi instrument supplied by Thermo Fisher Scientific, Waltham, MA, USA. The scanning electron microscope equipped with an energy-dispersive X-ray spectrometer is model SEM3200, produced by Core Instrument Quantum Technology Co., Ltd., Hefei, Anhui Province, China. The B-H analyzer is model SY-8218 manufactured by Iwasaki Communications Machine Co., Ltd., Suginami-ku, Tokyo, Japan. The high-frequency precision LCR digital bridge is model UC2876 provided by Youce Electronic Technology Co., Ltd., Changzhou, Jiangsu Province, China.
3. Results and Discussion
3.1. The Effect of Different MoO3 Doping Concentrations on the Performance Loss of Mn0.816Zn0.091Fe2.093MoxO4 Was Investigated
3.1.1. Effect of Different Sintering Temperatures on Performance Loss
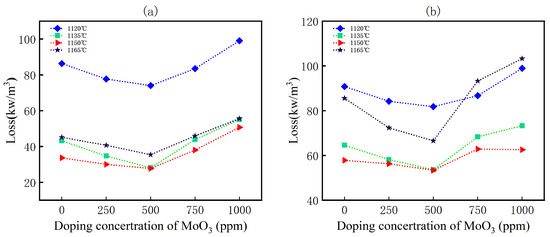
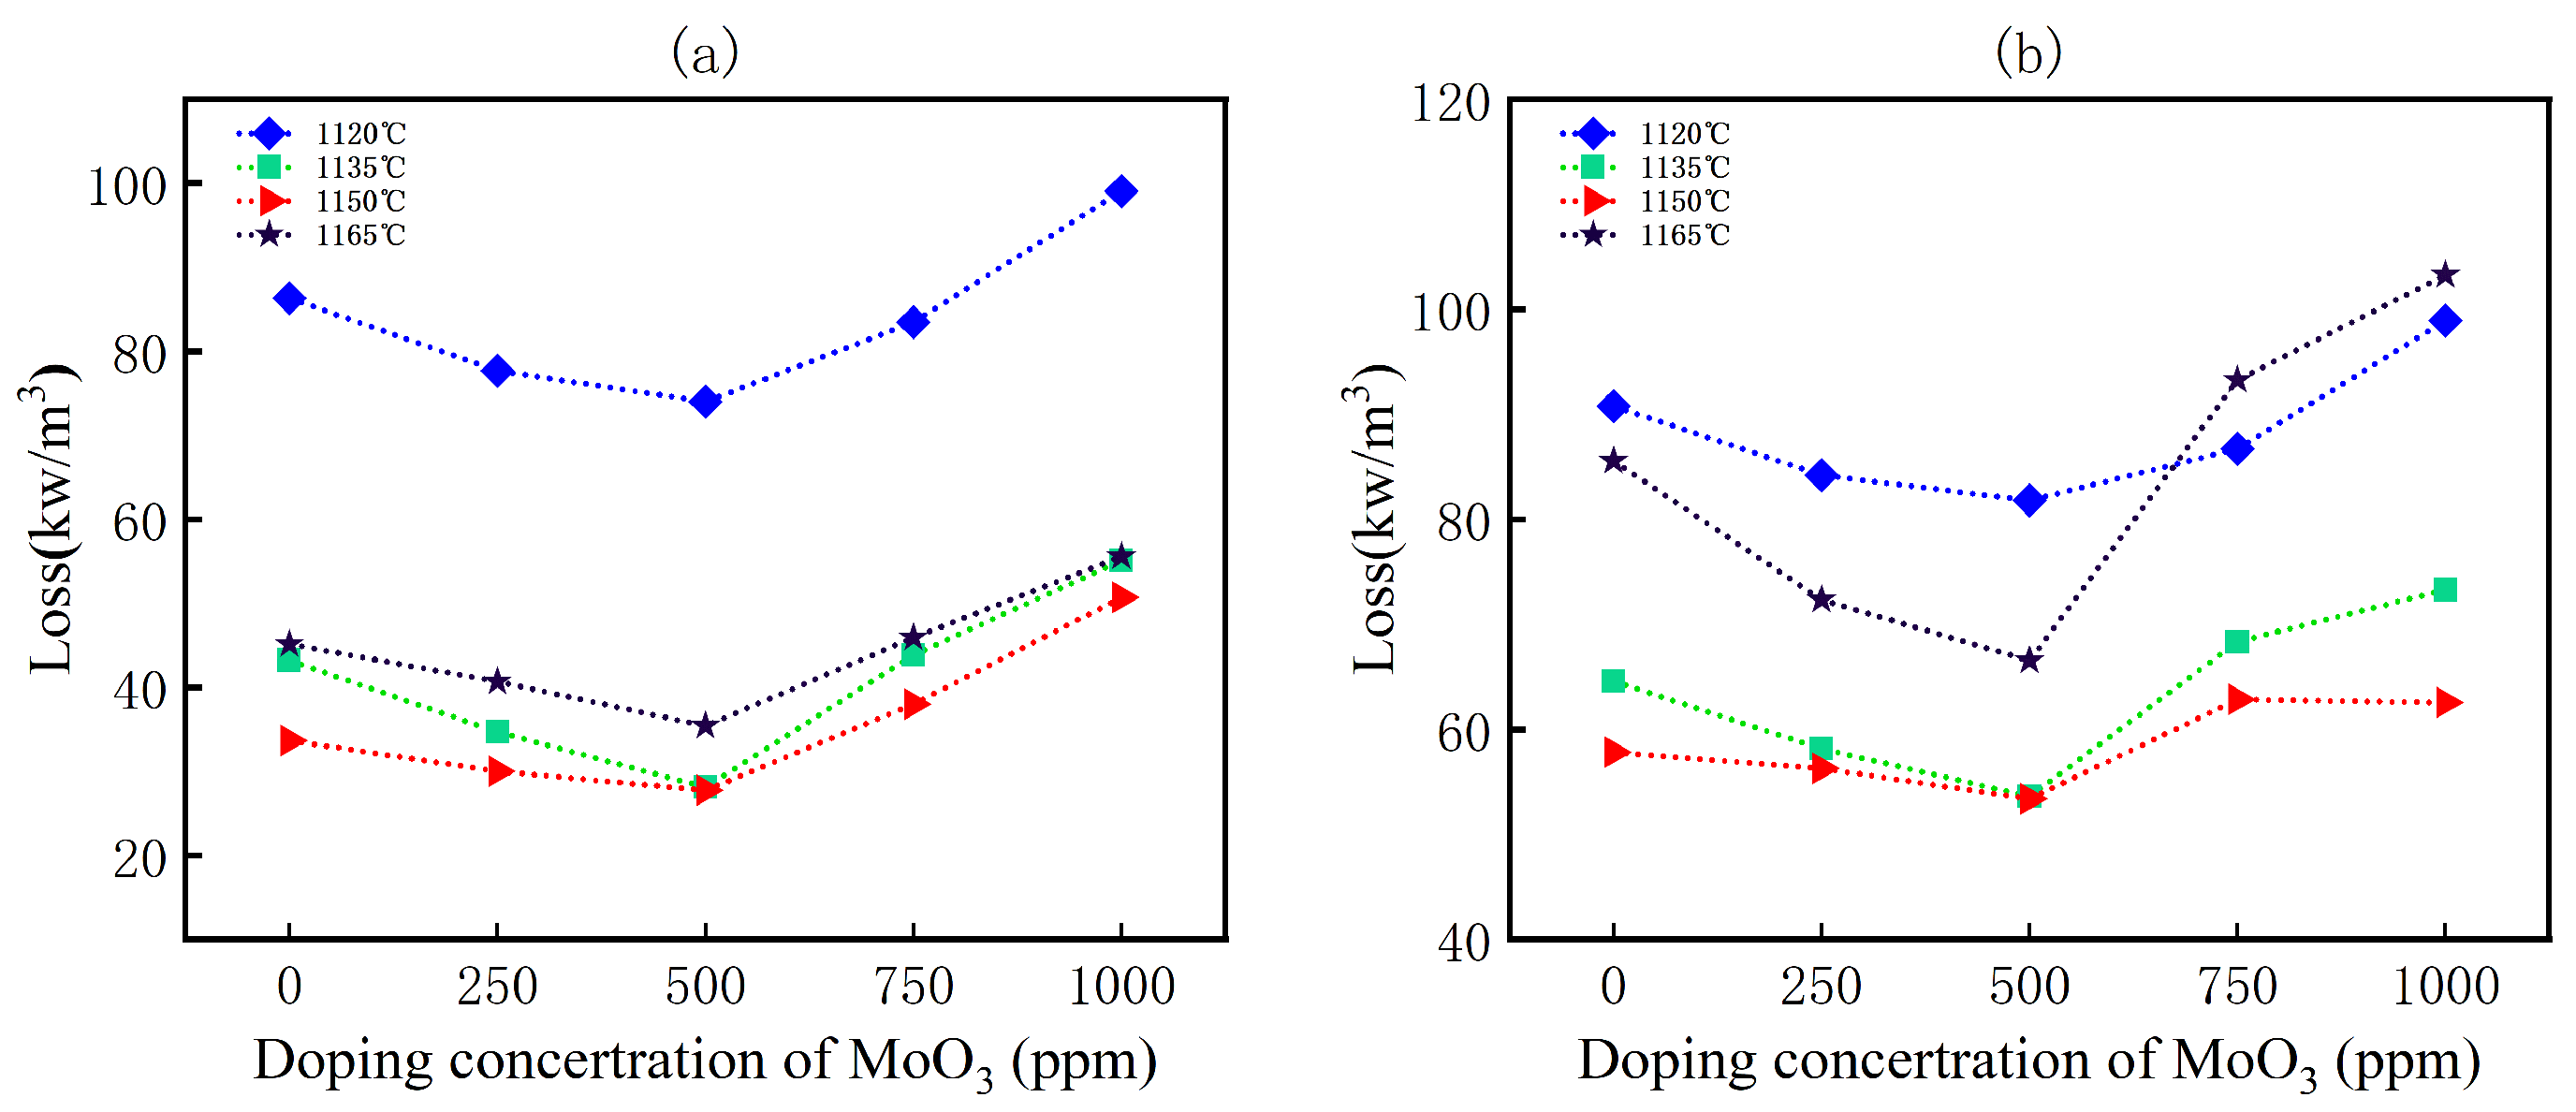
Figure 1 shows the effect of MoO3 doping concentration on the loss of Mn0.816Zn0.091Fe2.093MoxO4 ferrite at different sintering temperatures. Overall, the loss of Mn0.816Zn0.091Fe2.093MoxO4 ferrite was observed to first decrease and then increase with increasing MoO3 doping concentration, reaching the lowest point at 500 ppm. Moreover, at a sintering temperature of 1150 °C, the loss curve was positioned at the lowest part of the graph overall, indicating the lowest loss. From this, it can be understood that an appropriate amount of MoO3 promotes uniform grain refinement, reduces porosity, and increases grain boundary resistance, leading to an increase in the Q value, thereby simultaneously suppressing hysteresis loss and eddy current loss. Among the samples, the one sintered at 1150 °C exhibited the optimal overall performance, under which conditions the grain structure and grain boundary resistance reached a balance, and the magnetic properties were most stable [11,12]. Thus, MoO3 was shown to have a significant inhibitory effect on loss, and this effect followed the rule of “beneficial in appropriate amounts, harmful in excess.” This was attributed to the partial substitution of Fe3+ by Mo6+ at low MoO3 contents, which formed a high-resistance layer at the grain boundaries and effectively reduced eddy current loss [13]. In summary, an appropriate amount of MoO3 doping not only reduces loss but also improves high-temperature stability. The primary reason for this is that Mo6+ increases grain boundary resistance and inhibits excessive grain growth. The sample with a MoO3 doping concentration of 500 ppm, sintered at 1150 °C, achieved the lowest loss and the optimal overall magnetic properties.
Figure 1.
Variation in loss with MoO3 doping concentration for Mn0.816Zn0.091Fe2.093MoxO4 ferrite at different sintering temperatures: (a) 25 °C, (b) 100 °C.
3.1.2. Effect of Different Test Temperatures and Frequencies on Performance Loss
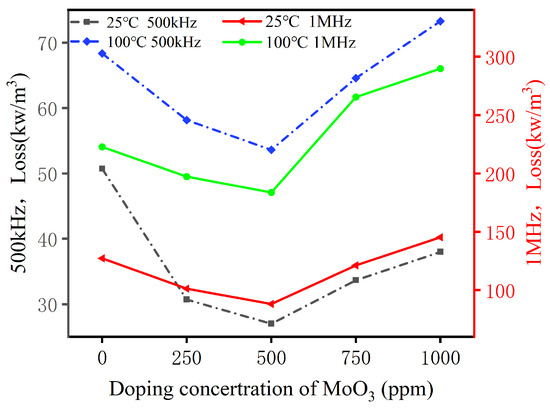
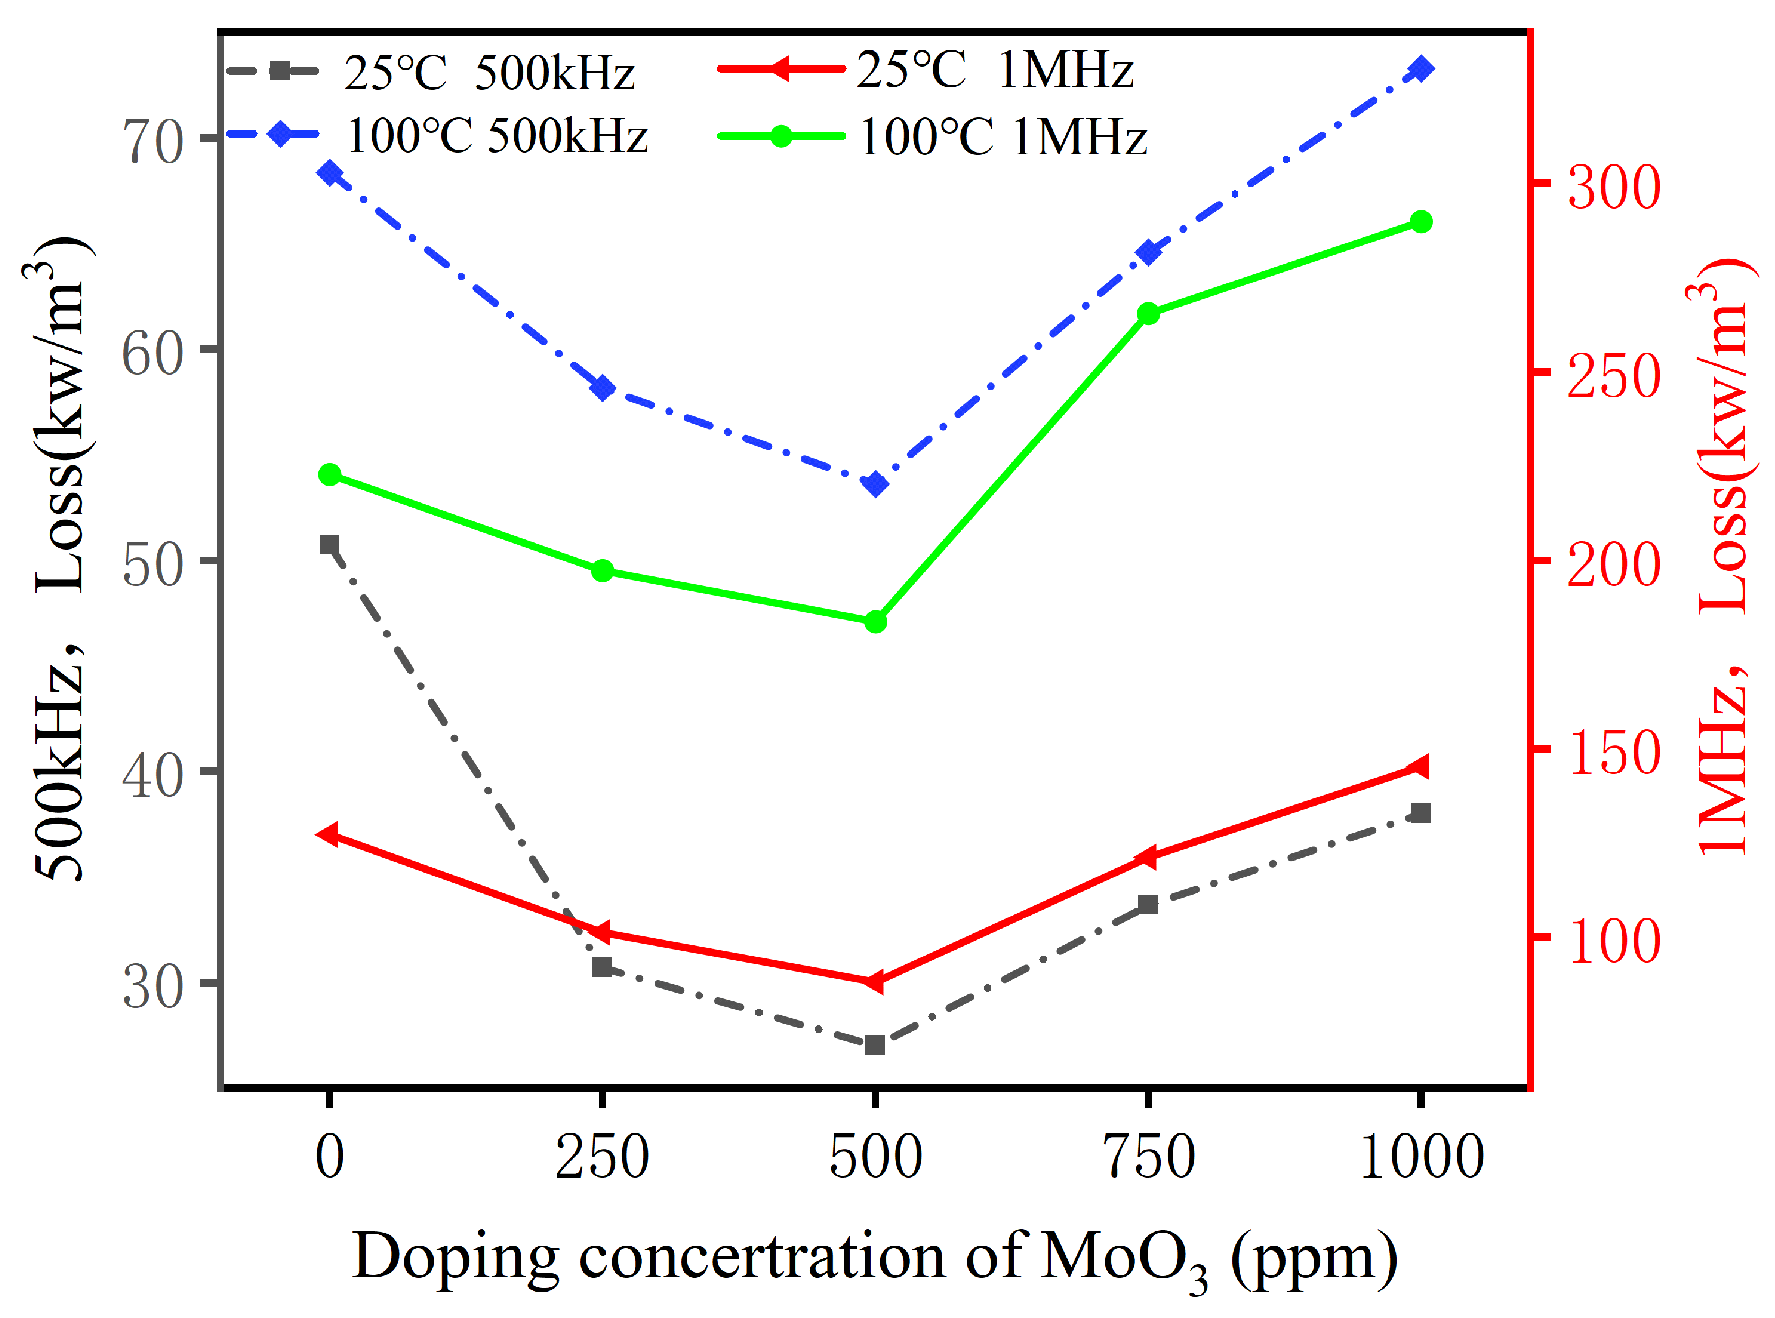
Figure 2 shows the variation curves of ferrite loss with MoO3 doping concentration under test conditions of 500 kHz/1 MHz and 25 °C/100 °C. At 1 MHz, the loss was generally higher than that at 500 kHz, which was attributed to the hysteresis of magnetic domain wall response at high frequencies and the increase in eddy current loss. Meanwhile, the optimization effect of MoO3 doping concentration on loss was limited with increasing test frequency [14,15]. At 25 °C and 100 °C, the loss initially decreased and then increased with increasing doping concentration, reaching the lowest point at 500 ppm. Under this condition, the magnetic domain structure of the material was stable, and the internal stress was low, leading to a synergistic reduction in hysteresis loss and eddy current loss. Excessive doping (>500 ppm) led to an increase in porosity and pore size, as shown in Figure 2, which increased the resistance to magnetic domain wall motion and resulted in increased loss. At 100 °C, the loss was significantly higher than that at 25 °C overall. The high temperature induced thermal disturbance of magnetic domains, which enhanced the core loss and weakened the regulatory effect of doping on loss, ultimately leading to increased loss [16]. In summary, both the increase in temperature and the increase in frequency resulted in increased loss in the samples and weakened the positive regulation of magnetic properties by doping. The lowest ferrite loss was observed at a doping concentration of 500 ppm under test conditions of 500 kHz/1 MHz and 25 °C/100 °C, exhibiting a typical characteristic of “beneficial in appropriate amounts, harmful in excess.”
Figure 2.
Variation in loss with MoO3 doping concentration for Mn0.816Zn0.091Fe2.093MoxO4 ferrite under test conditions of 500 kHz (left axis) and 1 MHz (right axis) at different temperatures.
3.2. Effect of MoO3 Doping Concentration on the Structure and Magnetic Properties of Mn0.816Zn0.091Fe2.093MoxO4 Ferrite
3.2.1. Evolution of Structure and Morphology
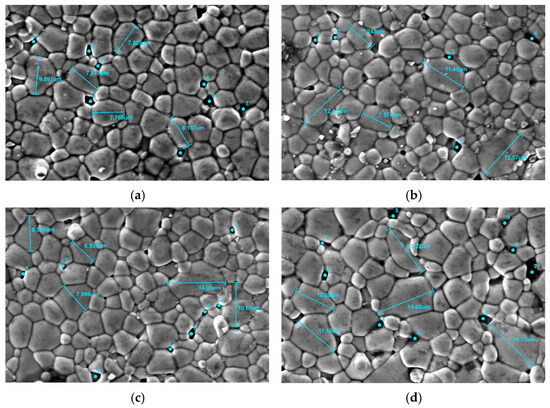
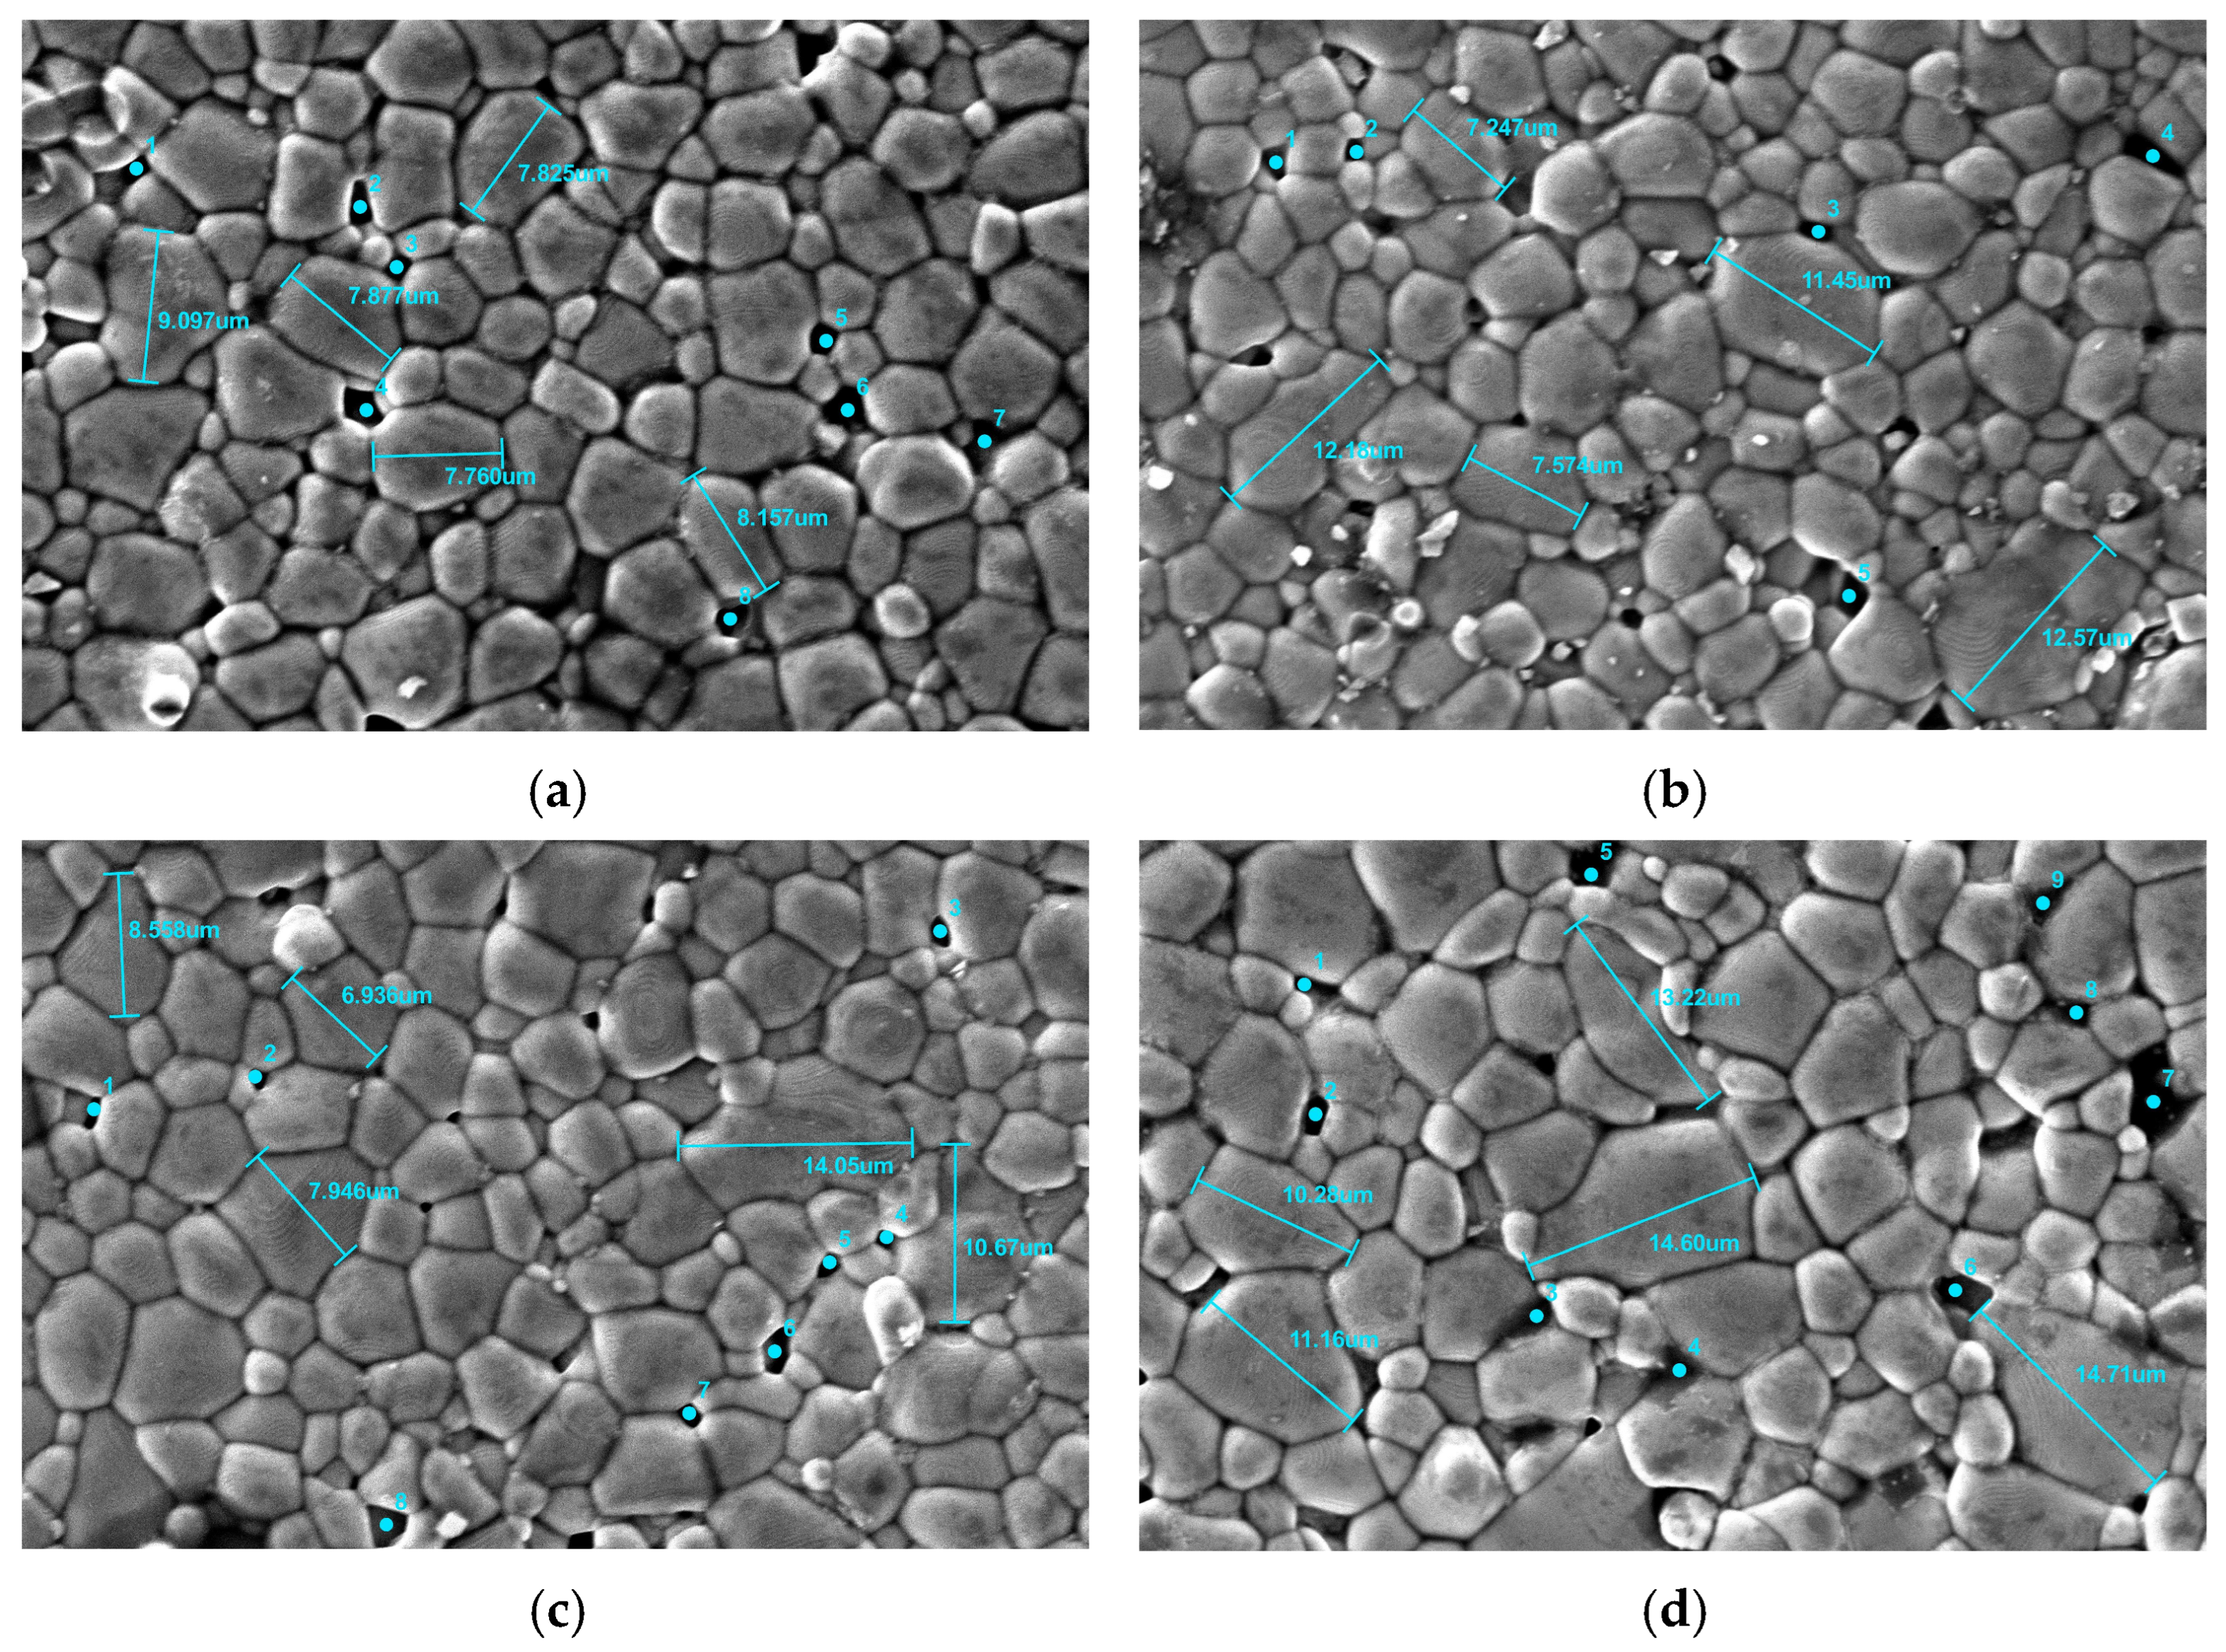
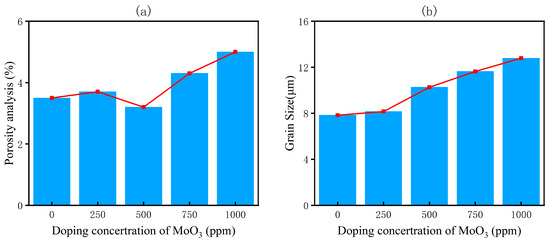
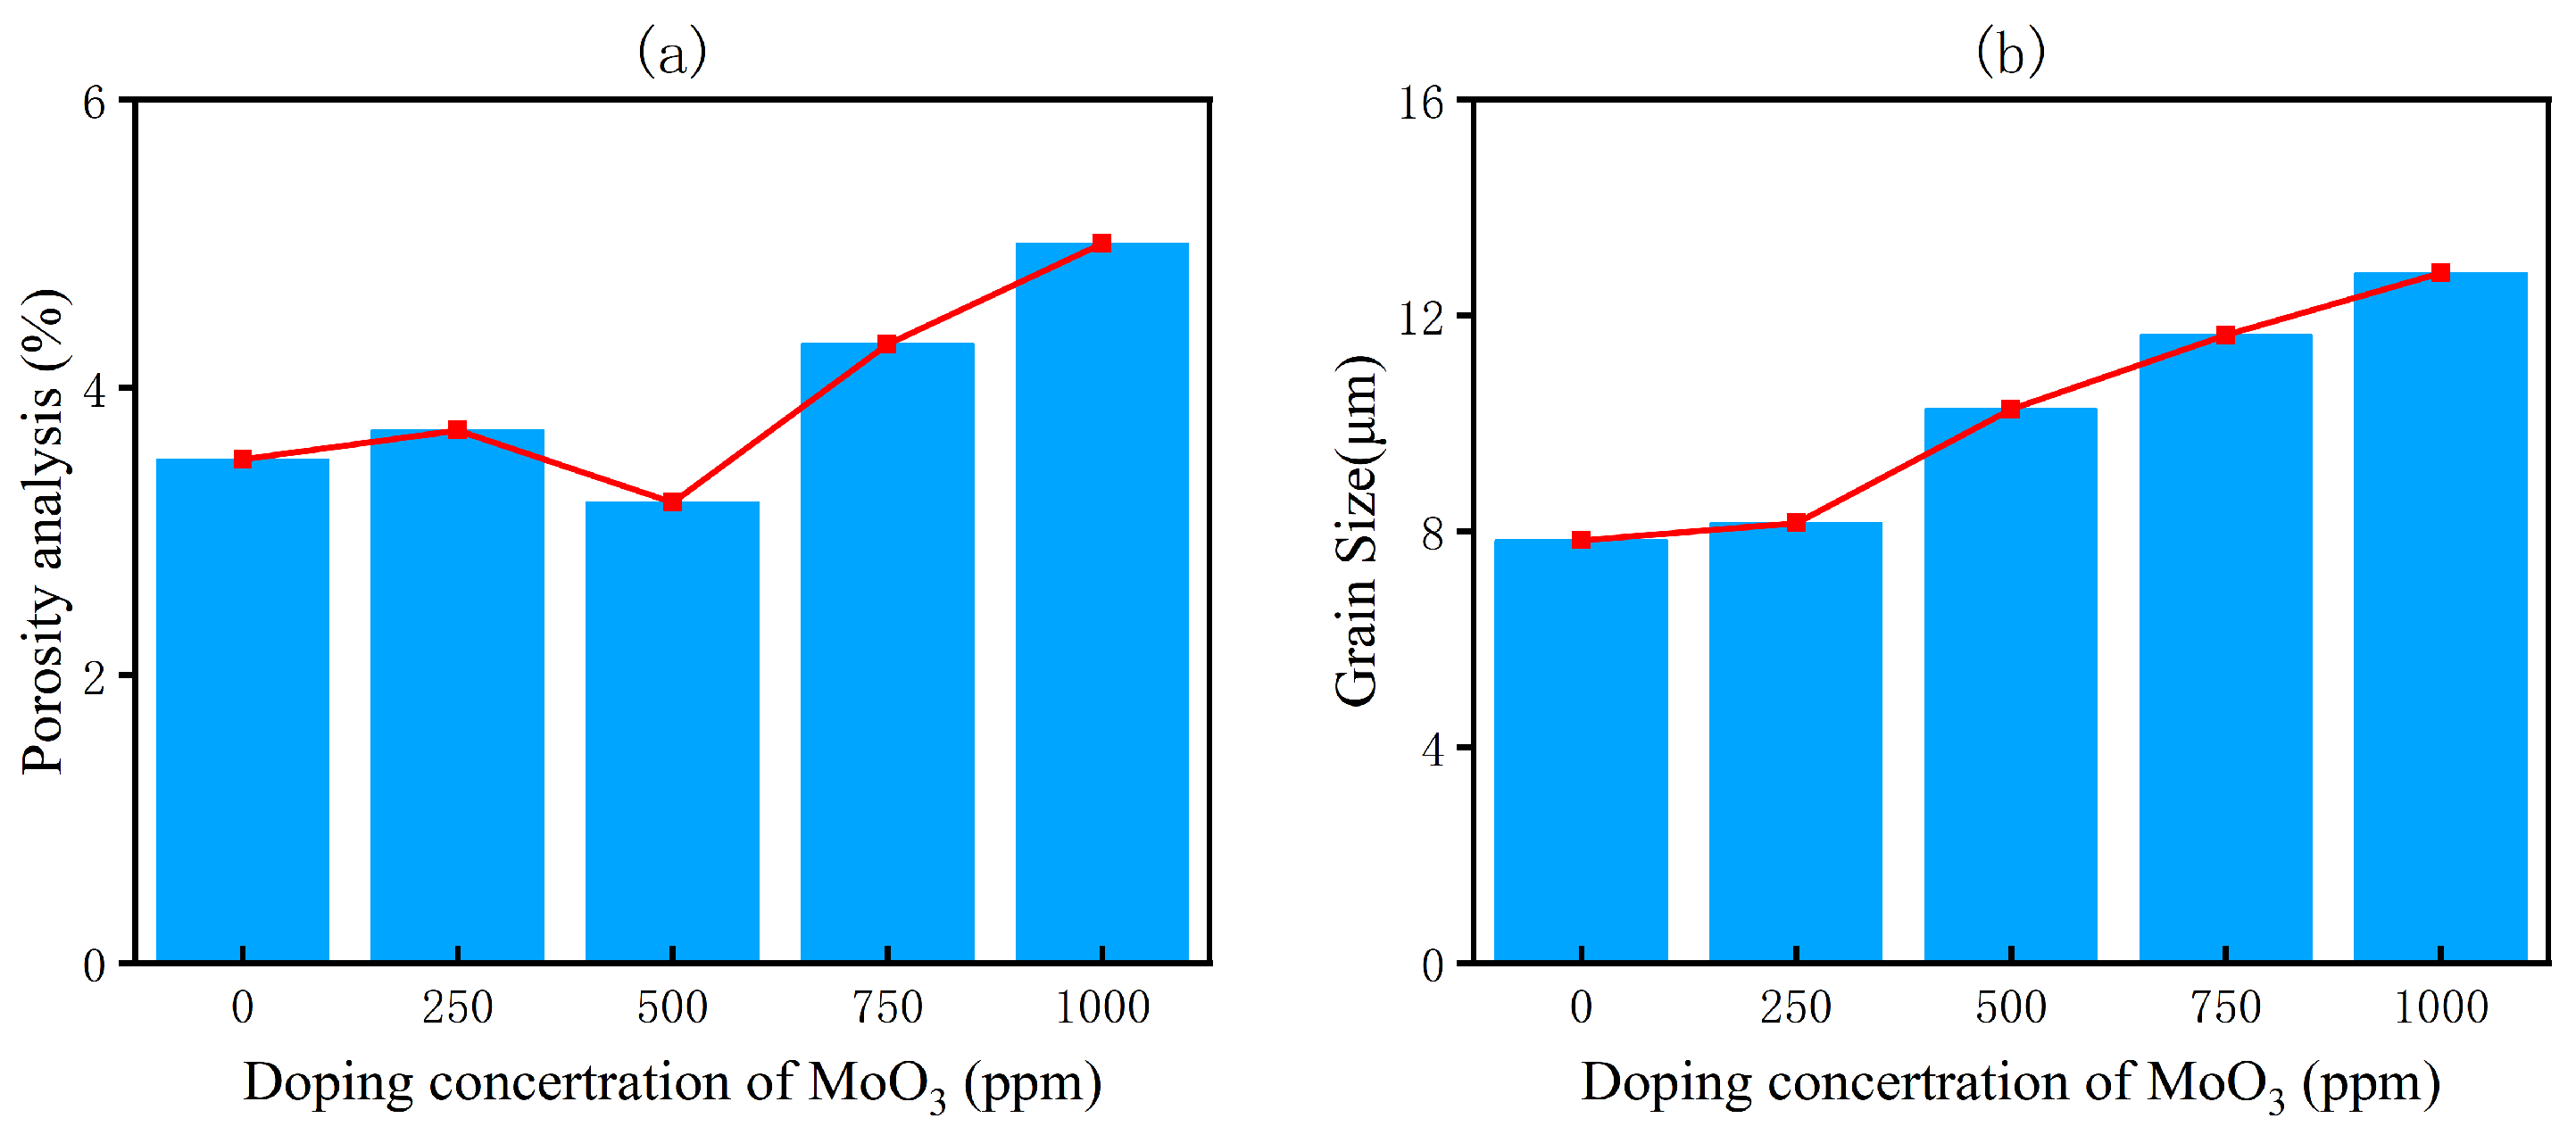
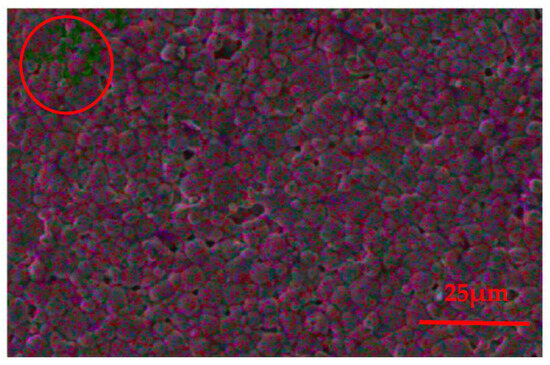
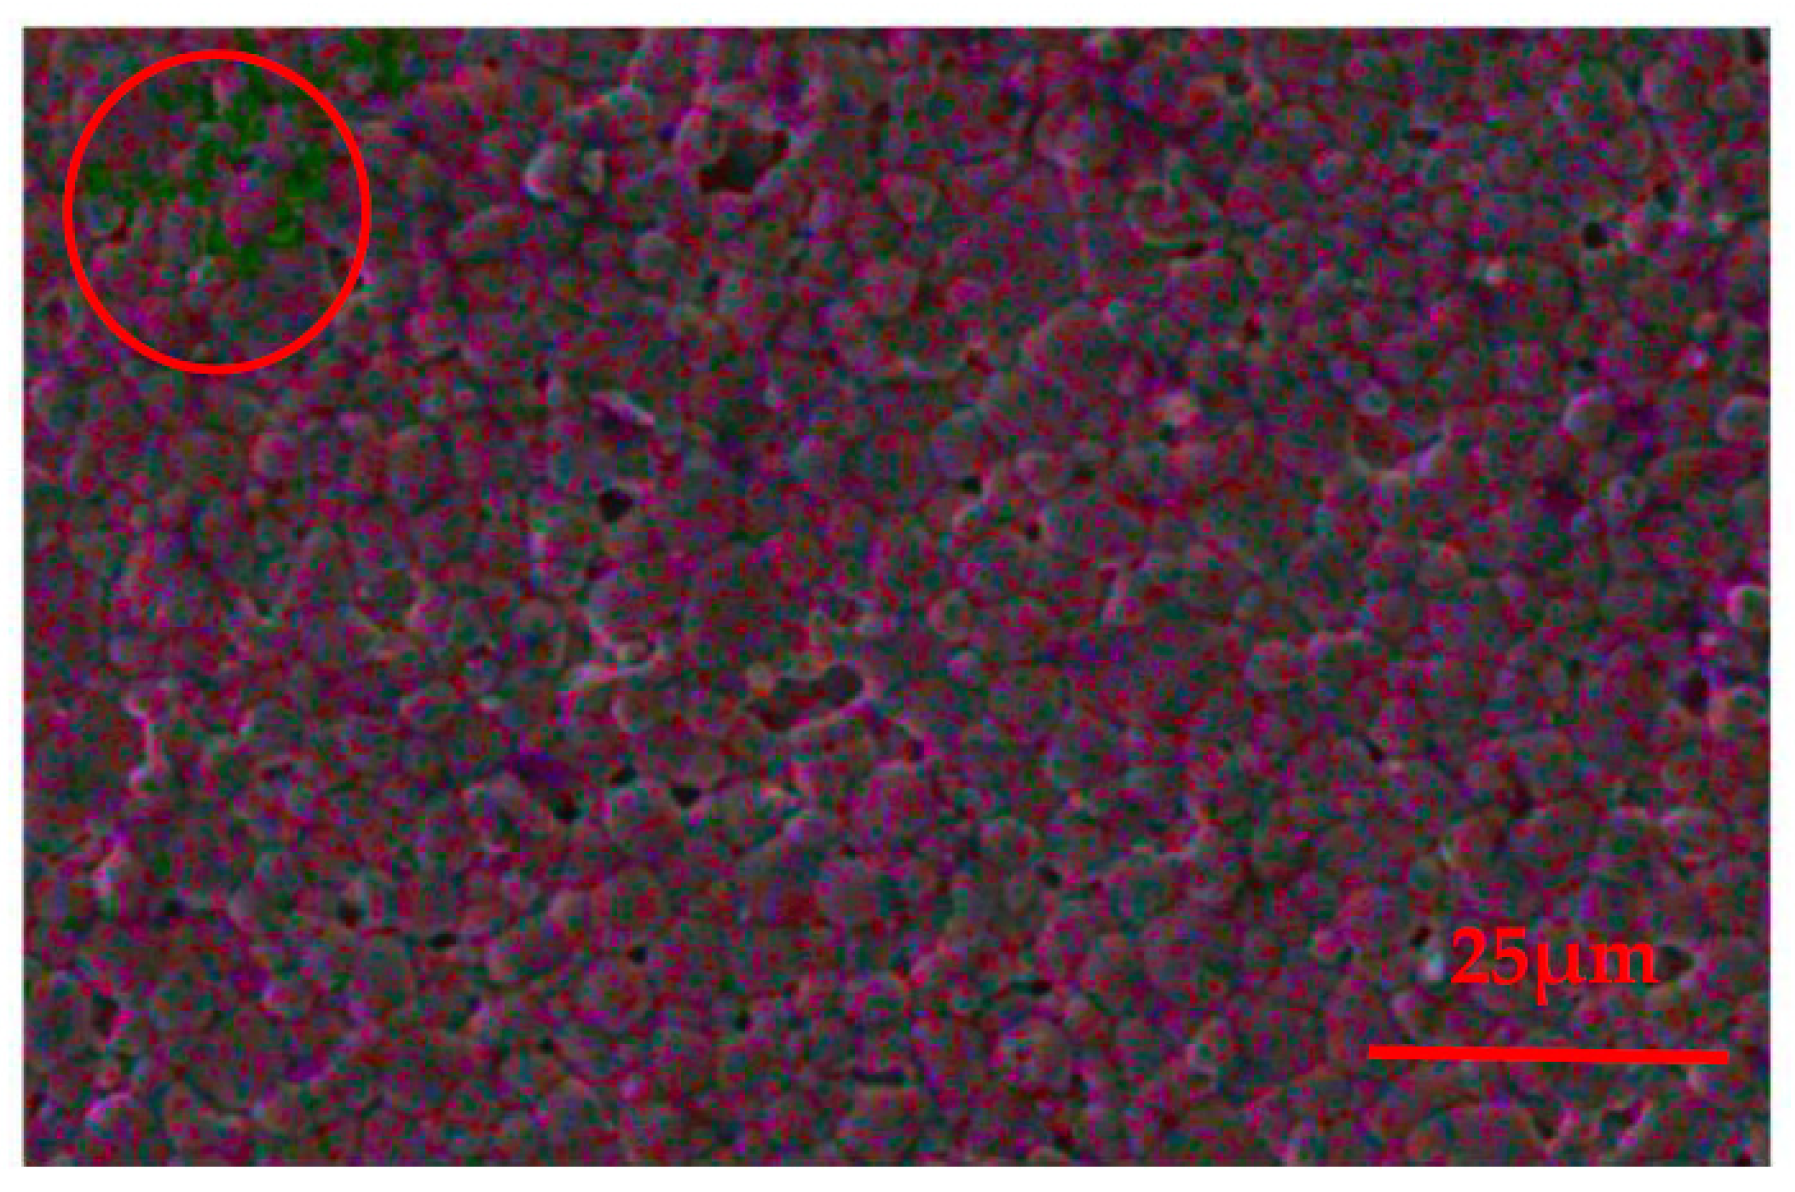
Figure 3 shows the surface SEM images of Mn0.816Zn0.091Fe2.093MoxO4 ferrite samples. With increasing MoO3 content, the microstructure of the Mn-Zn ferrite exhibited significant changes. Figure 4 presents the porosity and grain size calculated from the SEM images. In Figure 3a, a small number of discrete, tiny dark pores were observed, mostly located at triple grain junctions or grain edges. The pore sizes were generally small, and no interconnected pores were observed. A small number of bright white particles were visible on the surface, which were irregular in shape and relatively dispersed. These were attributed to the doped MoO3 or introduced impurities [17]. Figure 3b shows the microstructure of the ferrite at a doping concentration of 500 ppm, which was highly uniform and dense. The grains were well-developed without any abnormal growth defects. As shown in Figure 4a, the porosity was controlled at a low level. The white particles were mostly located at triple grain junctions or grain edges, a phenomenon consistent with Figure 5 (indicated by circles), where Mo elements were clearly observed to be distributed at triple junctions or grain boundaries, serving to fill pores. This microstructure served as the basis for achieving excellent magnetic properties, indicating that the doping regulation was effective. From Figure 3c and Figure 4b, it can be seen that at a doping concentration of 750 ppm, the porosity began to gradually increase and the grain size gradually increased, which was consistent with the pattern of enhanced grain growth kinetics. Compared with the previous figures, the ferrite sample in Figure 3d exhibited significantly lower density and higher porosity, with the presence of obviously enlarged pore sizes (point 7). High porosity is a critical disadvantage for magnetic ceramics, directly leading to increased loss [18].
Figure 3.
SEM images of Mn0.816Zn0.091Fe2.093MoxO4 ferrite at different Mo doping concentrations: (a) x = 250 ppm, (b) x = 500 ppm, (c) x = 750 ppm, (d) x = 1000 ppm. The dots are used to mark the positions of pores, and the horizontal lines are employed to measure grain size.
Figure 4.
Mn0.816Zn0.091Fe2.093MoxO4 ferrite at different Mo doping concentrations: (a) porosity analysis; (b) grain size. The color line and the bar chart represent the same set of data.
Figure 5.
EDS mapping of Mn0.816Zn0.091Fe2.093MoxO4 ferrite at a doping concentration of 500 ppm.
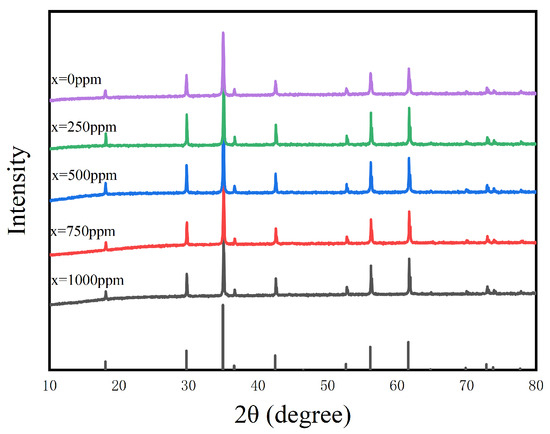
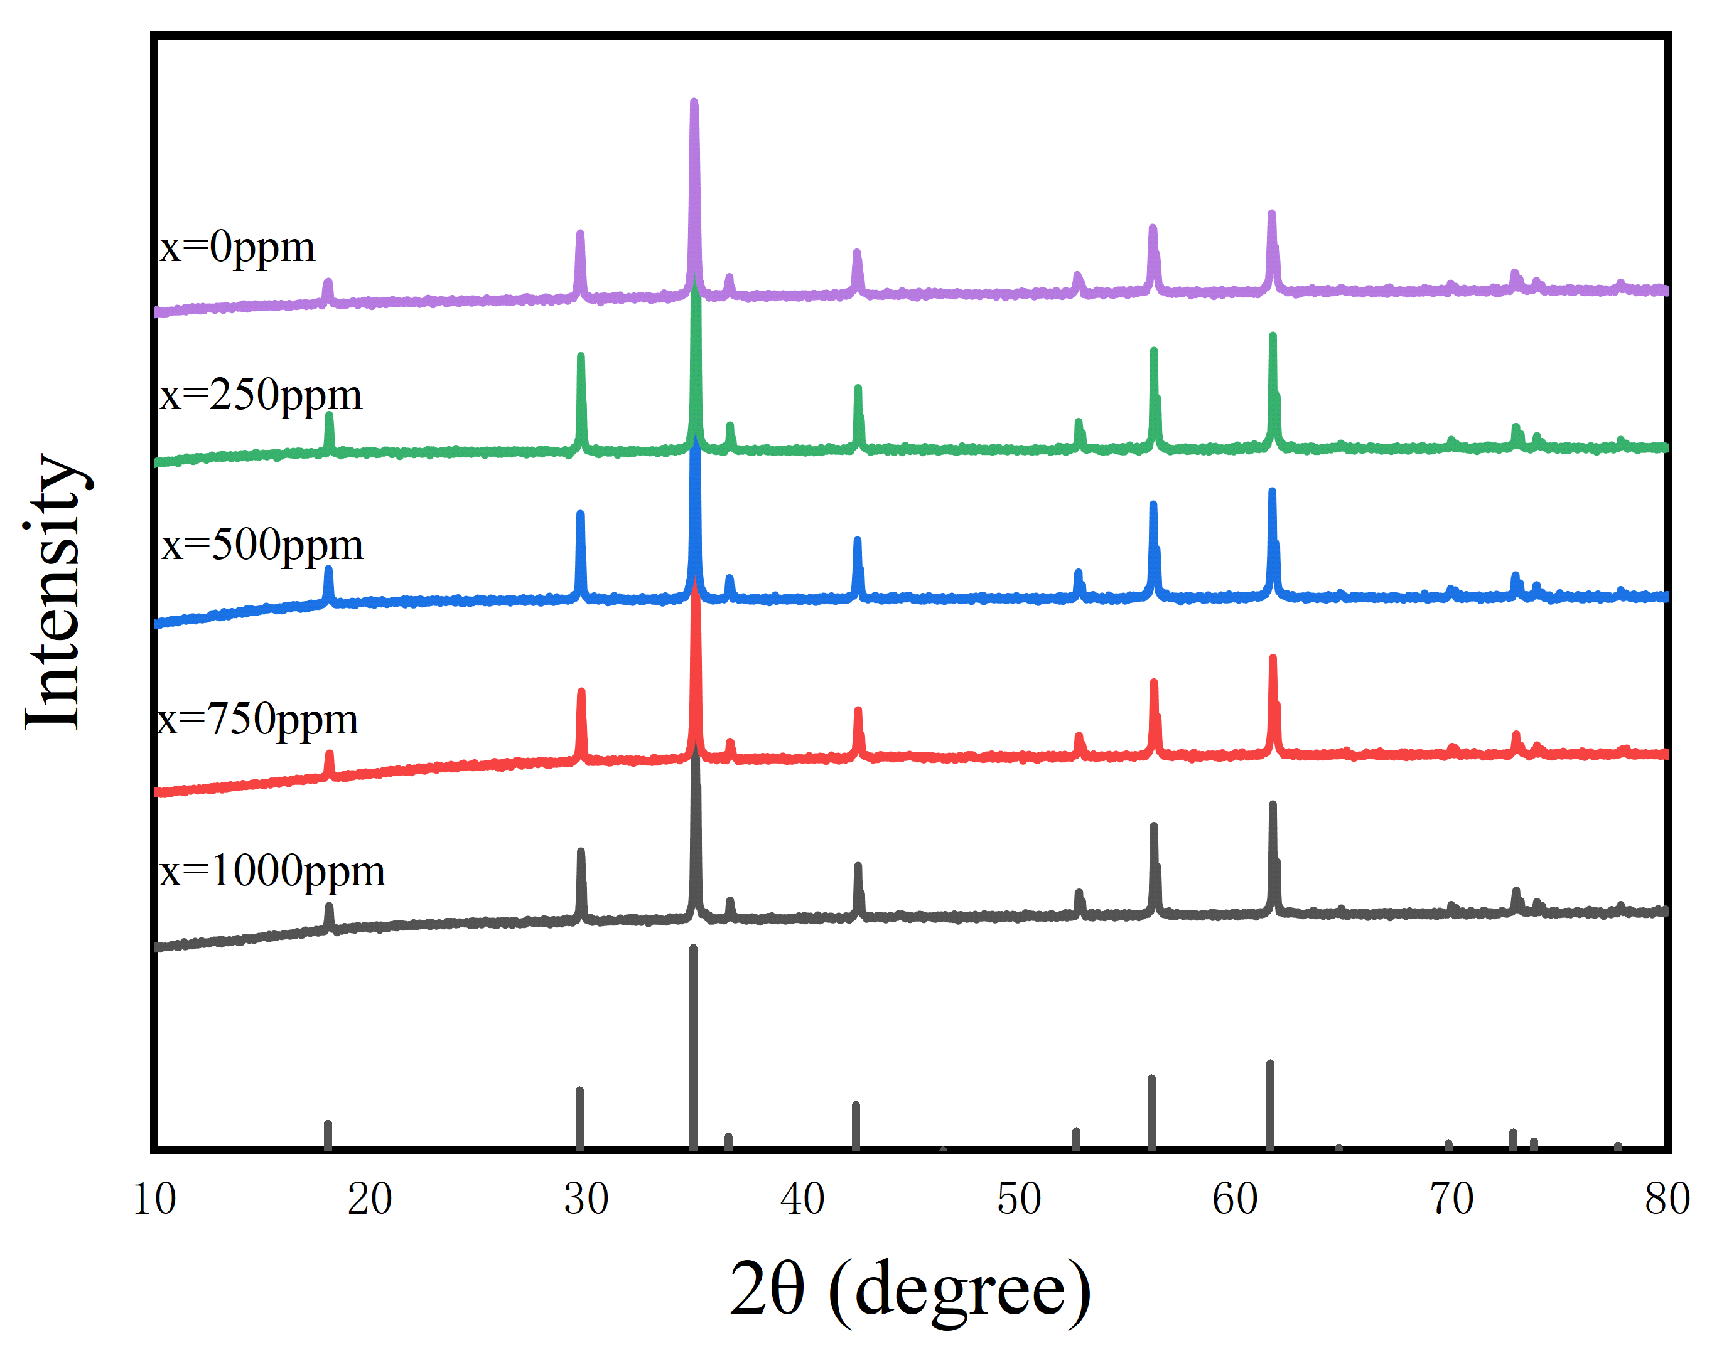
Figure 6 shows the XRD patterns of Mn-Zn ferrite samples with different MoO3 doping concentrations. From the overall peak positions and characteristic diffraction intensities, all samples exhibited typical spinel structure diffraction peaks corresponding to the (220), (311), (400), (422), (511), and (440) crystal planes. No significant shifts in peak positions were observed, nor were any additional impurity phases detected, indicating that within the range of MoO3 doping, Mo6+ was successfully incorporated into the lattice without disrupting the main spinel phase structure. This suggests that the samples possessed good phase purity [19,20]. The lattice constant (a) of the samples was determined by fitting the XRD data using software, and the crystallite size (D) was calculated using the Scherrer formula. These values, along with the full width at half maximum (FWHM) of the corresponding diffraction peaks, are summarized in Table 1. As shown in Table 2, at low doping concentrations, the radius of the dopant ion Mo6+ matched well with that of the matrix ion Fe3+, which was consistent with the stability of the lattice constant. The lattice constant a was observed to be stable in the range of 8.52–8.53 Å, conforming to the structural stability rule that “appropriate doping does not induce significant lattice distortion” [21,22]. From the results, it can be seen that with increasing MoO3 doping concentration, the crystallite size of the samples gradually increased, which was consistent with the grain growth behavior observed in Figure 4b. The effect of ion substitution defects introduced by doping on grain growth was characterized as follows: “a small number of defects inhibit grain growth, a moderate number regulate grain growth, and a high number strongly inhibit grain growth” [23]. Overall, the XRD results indicated that an appropriate amount of MoO3 doping did not alter the main spinel phase structure of the Mn-Zn ferrite.
Figure 6.
XRD patterns of Mn0.816Zn0.091Fe2.093MoxO4 ferrite with different MoO3 doping concentrations.
Table 1.
Full width at half maximum (FWHM), crystallite size, and lattice constant of Mn0.816Zn0.091Fe2.093MoxO4 ferrite at different MoO3 doping concentrations.
Table 2.
Key magnetic performance parameters of Mn0.816Zn0.091Fe2.093MoxO4 ferrite at different MoO3 doping concentrations measured at 25 °C.
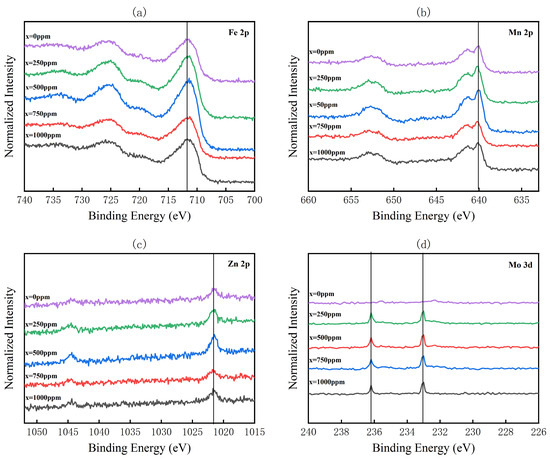
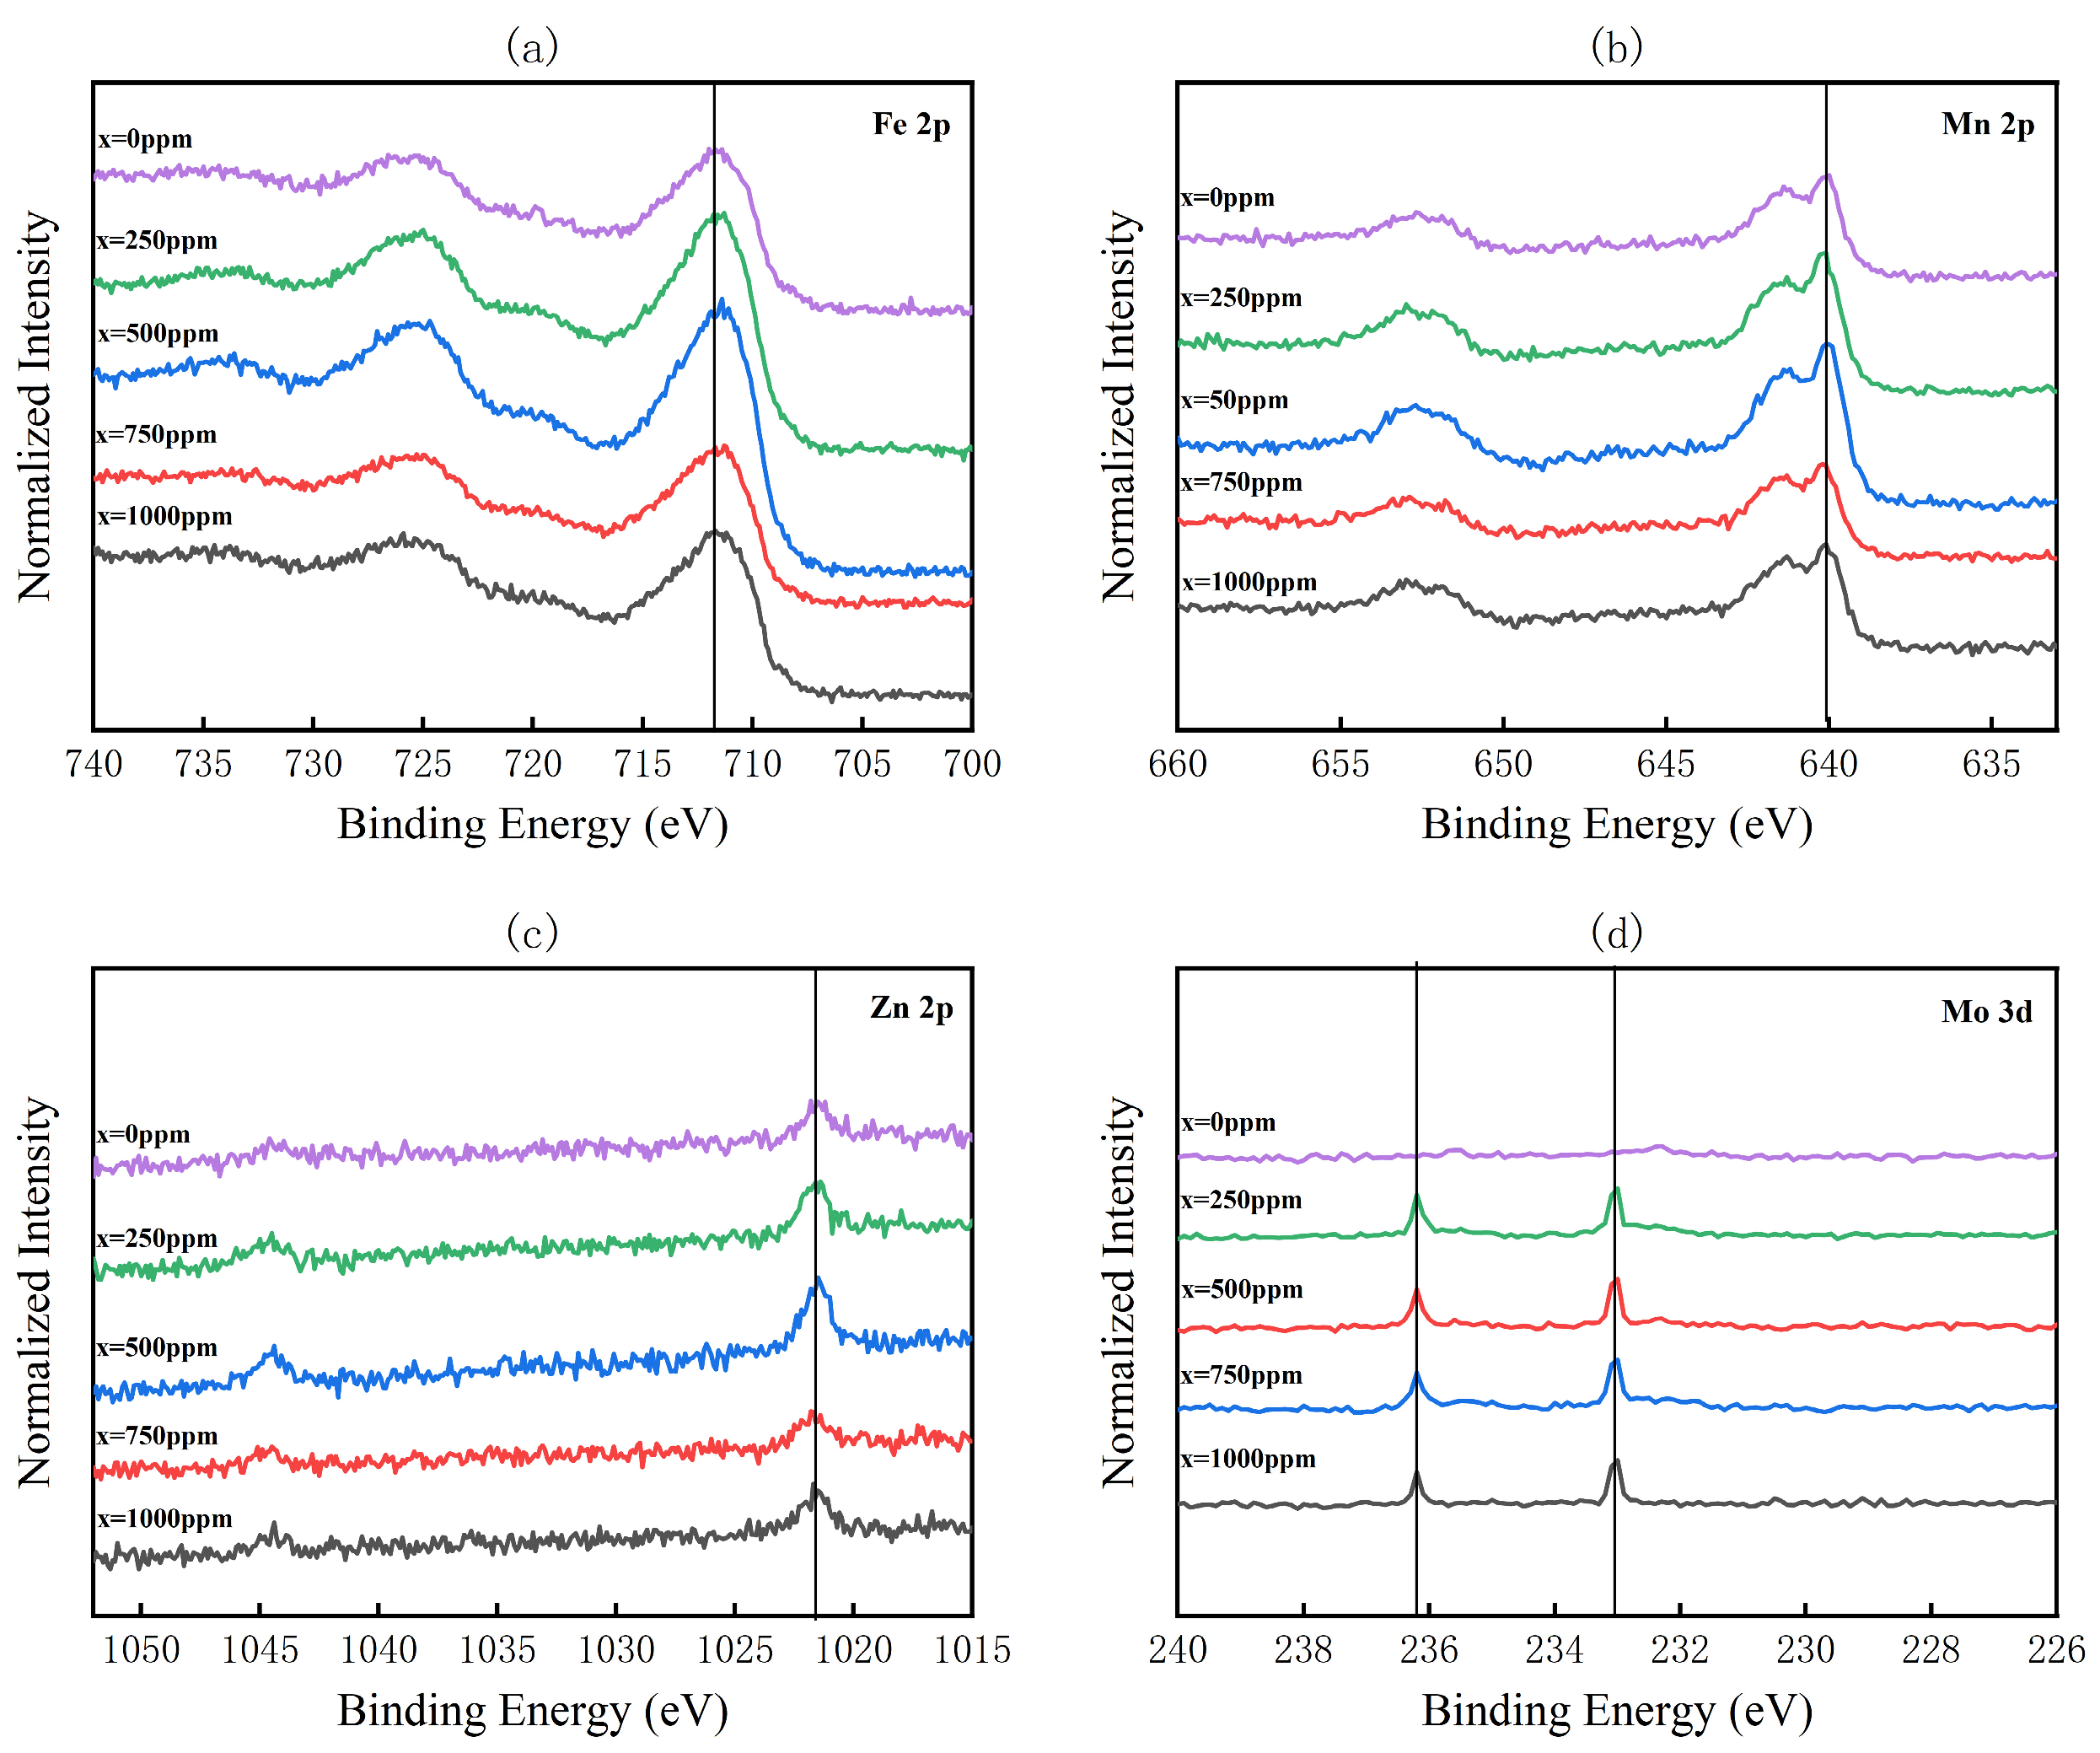
Figure 7 shows the high-resolution XPS spectra of Fe, Mn, Zn, and Mo for samples with different MoO3 doping concentrations. The introduction of Mo6+ was found to have a certain influence on the valence state environment of the metal elements in the Mn-Zn ferrite. First, in the Fe 2p spectra, a slight binding energy shift was observed in the main Fe 2p3/2 peak with increasing MoO3 doping concentration, indicating that the Fe2+/Fe3+ ratio in the lattice was modulated and the electron density was redistributed. Due to the higher valence state of Mo6+, its partial substitution in the lattice induced charge compensation in the adjacent Fe, leading to the oxidation of some Fe2+ to Fe3+ and promoting the adjustment of the lattice oxygen coordination environment toward a higher valence state [24,25]. The Mn 2p spectra also exhibited a slight binding energy shift with increasing MoO3 doping concentration, indicating that the Mn2+/Mn3+ ratio underwent subtle changes. The introduction of Mo6+ enhanced the overall oxidizing nature of the lattice, favoring the retention of Mn in a higher valence state, which contributed to enhanced lattice stability and reduced oxygen vacancy formation. The Zn 2p peak shape remained largely unchanged, indicating that the tetrahedral sites occupied by Zn2+ did not undergo significant changes in their chemical environment, consistent with the stable coordination of Zn in the spinel structure. Notably, in the Mo 3d spectra, the peak intensity was relatively weak within this doping range, but the binding energy position was consistent with the characteristic peak of Mo6+, further indicating that the introduced MoO3 mainly existed in the ferrite as Mo6+ without forming other valence states or impurity phases [26]. This suggested that the incorporation of trace amounts of MoO3 primarily regulated the valence state balance of Fe/Mn in the lattice through the charge compensation effect induced by the high-valence state, rather than directly altering the coordination structure of Zn. In summary, MoO3 doping modulated the lattice charge distribution through its high-valence characteristic, thereby influencing the valence state composition of Fe and Mn, leading to further optimization of the local electronic structure of the material [27,28]. This valence state regulation effect is of great significance for the subsequent improvement of magnetic properties, providing an electronic structure-level basis for the performance enhancement of Mn-Zn ferrite achieved through MoO3 doping.
Figure 7.
XPS spectra of Mn0.816Zn0.091Fe2.093MoxO4 ferrite at different MoO3 doping concentrations: (a) Fe 2p XPS spectra; (b) Mn 2p XPS spectra; (c) Zn 2p XPS spectra; (d) Mo 3d XPS spectra. The vertical lines serve to verify the occurrence of peak shifts.
3.2.2. Changes in Magnetic Properties
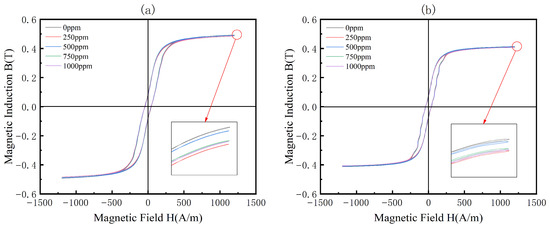
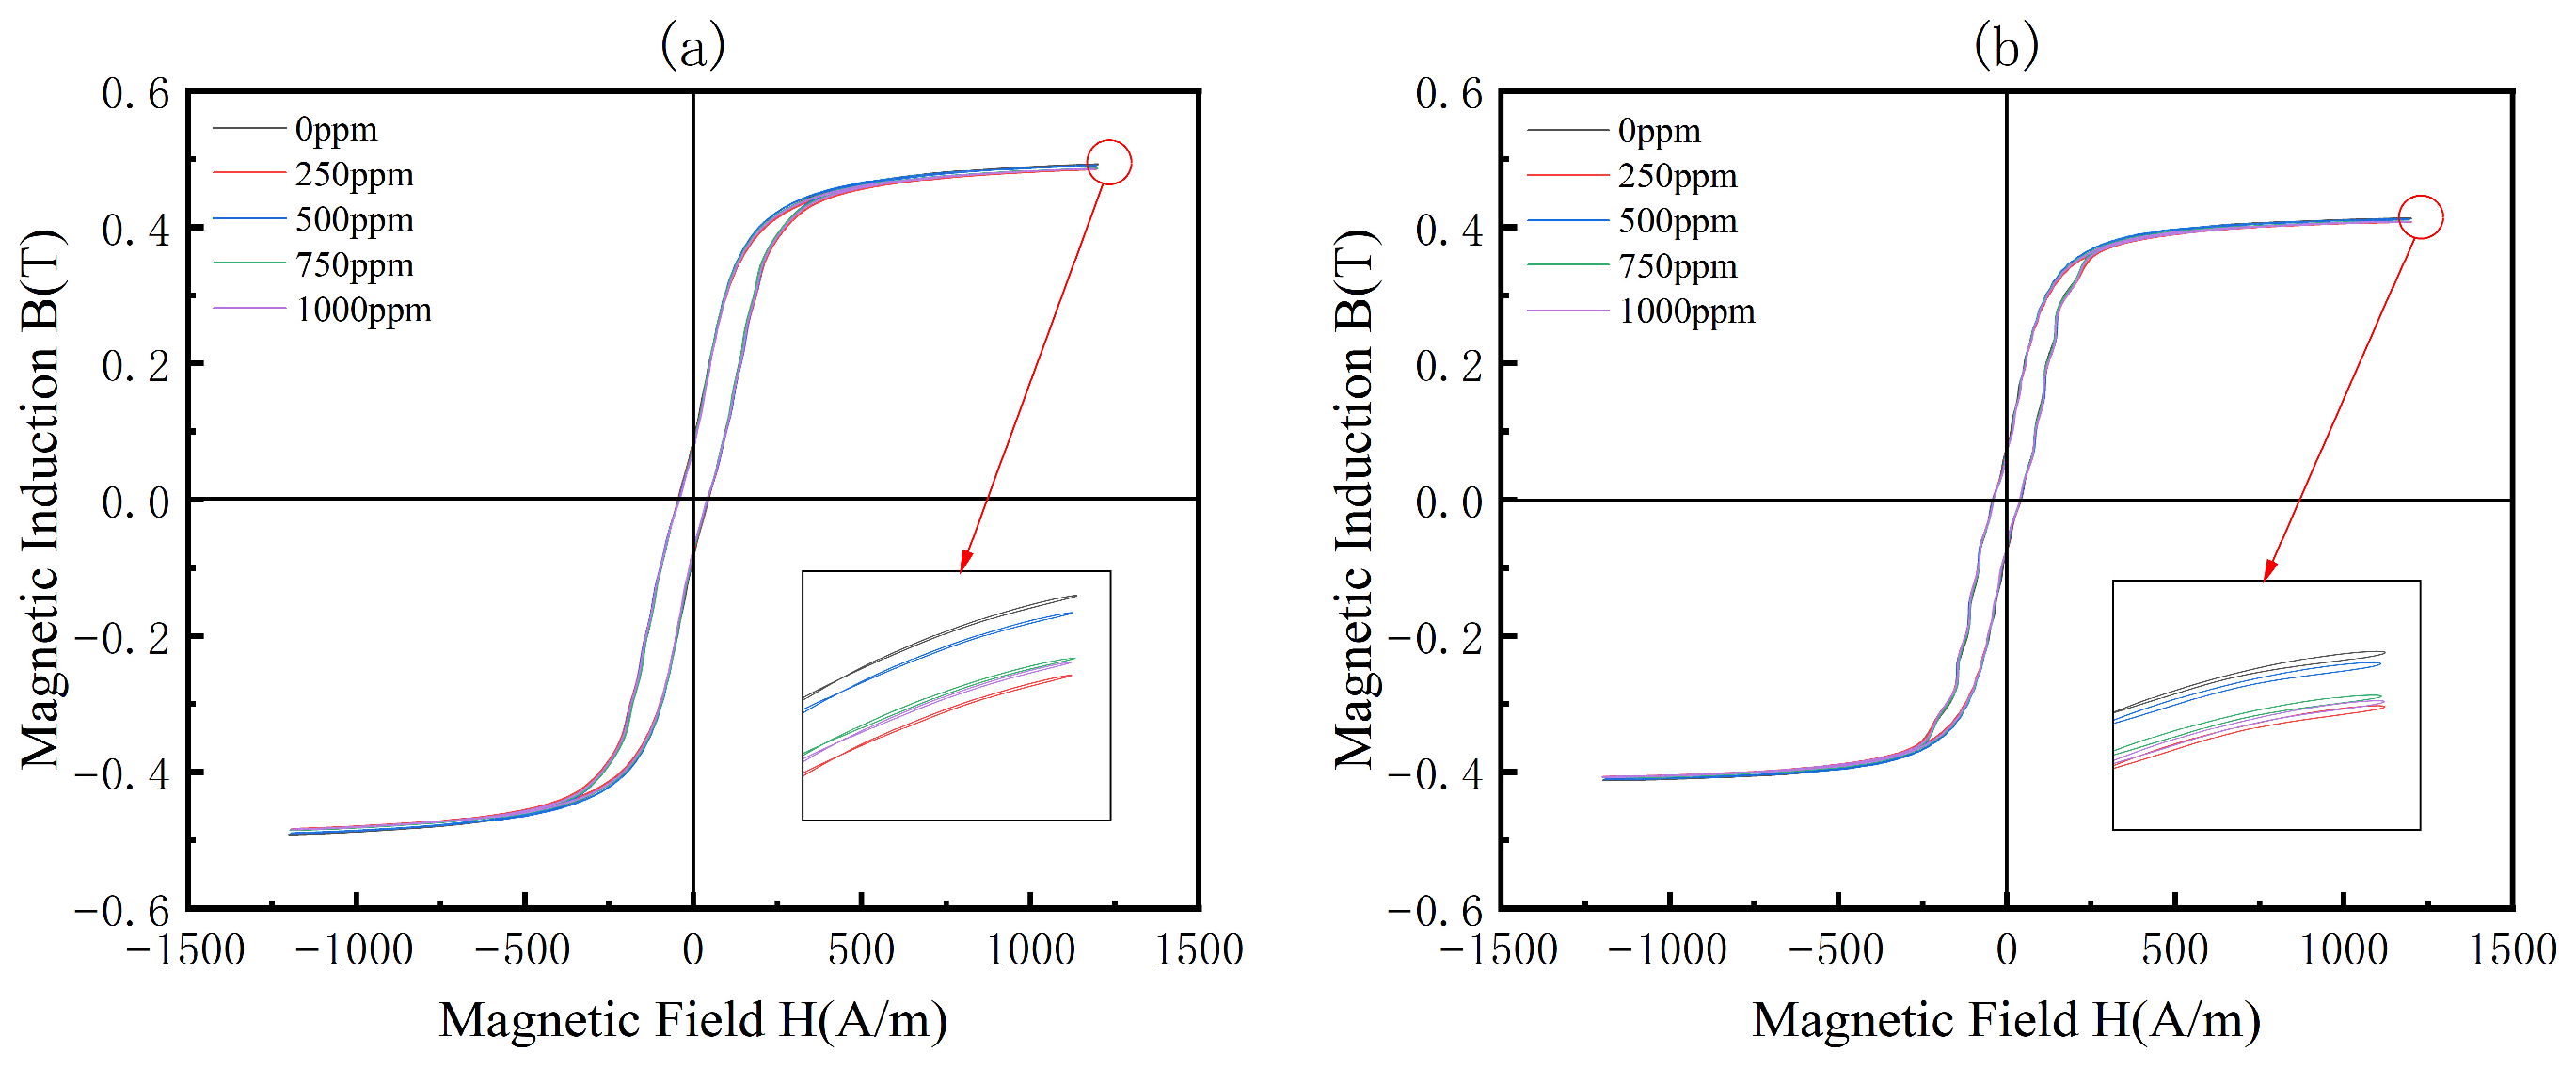
Figure 8 shows the hysteresis loops of Mn0.816Zn0.091Fe2.093MoxO4 ferrite samples with different MoO3 doping concentrations measured at 25 °C and 100 °C. The relevant magnetic parameters, including coercivity (Hc), remanent magnetic induction (Br), and saturation magnetic induction (Bs), are listed in Table 2 and Table 3. By comparing the hysteresis loops at 25 °C and 100 °C overall, it was observed that the hysteresis loops at 100 °C were slightly steeper, indicating that thermal energy enhancement led to more active magnetic domain wall motion, while the saturation magnetic induction decreased slightly. This trend was consistent with the changes in magnetic induction data presented in Table 2 and Table 3 [29]. This phenomenon was attributed to the thermal excitation at elevated temperatures disturbing the stability of magnetic moment orientation [30]. The saturation magnetic induction of the ferrite samples initially increased and then decreased, while the coercivity first decreased and then increased. This trend was primarily associated with changes in grain size, densification degree, and magnetic domain structure. As shown in Figure 4, with increasing MoO3 doping concentration, the grain size gradually increased, while porosity first decreased and then increased, resulting in significant changes in the degree of densification. These factors became the main influences on magnetic induction and coercivity [31,32]. When the MoO3 doping concentration was 500 ppm, the synergistic effect between grain growth and densification reached an optimum, characterized by fewer pores, gradually increasing grain size, easier magnetic domain wall motion, and more ordered magnetic moment orientation. This resulted in higher magnetic induction and lower coercivity. These findings indicated that at an appropriate MoO3 doping concentration, optimizing grain size and pore structure contributed to achieving higher magnetic flux density and lower coercivity, thereby improving the soft magnetic properties [33].
Figure 8.
Comparison of hysteresis loops of Mn0.816Zn0.091Fe2.093MoxO4 ferrite at different MoO3 doping concentrations: (a) hysteresis loops measured at 25 °C; (b) hysteresis loops measured at 100 °C.
Table 3.
Key magnetic performance parameters of Mn0.816Zn0.091Fe2.093MoxO4 ferrite at different MoO3 doping concentrations measured at 100 °C.
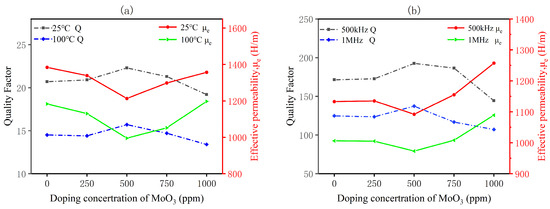
Figure 9a and Figure 9b show the variation in quality factor (Q value) and effective permeability (μe) of the ferrite with MoO3 doping concentration under test conditions of 25 °C/100 °C and 500 kHz/1 MHz, respectively. The Q value of the ferrite samples was observed to first increase and then decrease, reaching a peak simultaneously at 500 ppm. This was attributed to the role of an appropriate amount of MoO3 as a sintering aid, which promoted grain refinement, reduced porosity, and improved sample densification [34]. This phenomenon was consistent with the trend presented in Figure 4, thereby leading to a reduction in coercivity, an increase in Q value, and a decrease in loss. The effective permeability (μe) generally exhibited a trend of first decreasing and then increasing. This was explained by the fact that during the initial stage of densification, grain refinement led to a reduction in the number of domain walls, hindering domain wall displacement. In the later stage, grain growth resulted in a decrease in the domain wall displacement distance, giving rise to the observed initial decrease followed by an increase [35,36]. Under high-temperature (100 °C) and high-frequency (1 MHz) test conditions, the Q value and effective permeability of the ferrite samples were generally lower than those measured under room-temperature and low-frequency conditions. This was because the high temperature induced thermal disturbance of magnetic domains, while the high frequency caused hysteresis in magnetic domain wall response. The combined effect of these factors led to increased loss, thereby weakening the positive regulatory effect of MoO3 doping on the magnetic properties [37,38]. In summary, the optimization effect of MoO3 doping on the magnetic properties of the ferrite was found to depend on the test temperature and frequency. A doping concentration of 500 ppm was identified as the optimal concentration for achieving high performance; however, the advantages of this concentration were diminished under high-temperature and high-frequency conditions [39].
Figure 9.
Variation in Q value (left axis) and effective permeability (right axis) with MoO3 doping concentration for Mn0.816Zn0.091Fe2.093MoxO4 ferrite samples at different MoO3 doping concentrations: (a) variation with MoO3 doping concentration at different temperatures; (b) variation with MoO3 doping concentration at different frequencies.
4. Conclusions
In this study, Mn0.816Zn0.091Fe2.093MoxO4 ferrite was prepared using a conventional solid-state method. By systematically adjusting the sintering temperature and MoO3 doping ratio, the evolution of the material’s structural and magnetic properties was revealed. In terms of structure, it was confirmed that within the doping range of 0–1000 ppm, all samples formed a single spinel structure, with the lattice constant remaining stable and consistent with grain growth kinetics. The optimal conditions were determined to be a sintering temperature of 1150 °C and a MoO3 doping concentration of 500 ppm. The loss and magnetic properties of the ferrite samples were evaluated under test conditions of 25 °C/100 °C and 500 kHz/1 MHz. It was demonstrated that although high temperature and high frequency weakened the beneficial effects of MoO3 doping, the optimal doping concentration of 500 ppm remained unchanged with increasing test temperature and frequency. The characteristic of MoO3 doping in Mn-Zn ferrite as “beneficial in appropriate amounts and harmful in excess” was further confirmed.
Author Contributions
Conceptualization, S.L. and Z.W.; methodology, S.L. and Z.W.; validation, S.L. and H.Y.; formal analysis, S.L. and H.Y.; investigation, S.L., W.L.; resources, W.L.; data curation, S.L.; writing—original draft preparation, S.L.; writing—review and editing, C.W.; visualization, S.L.; supervision, X.S. and C.W.; project administration, X.S. and C.W.; funding acquisition, W.L. and X.S. All authors have read and agreed to the published version of the manuscript.
Funding
This research was funded by [Key R&D Program of Shandong Province, China] grant number [2024CXPT017] And The APC was funded by [Key R&D Program of Shandong Province, China].
Data Availability Statement
The data presented in this study are available on request from the corresponding author.
Conflicts of Interest
Xinglian, Song Wenju Liao and Zhen Wang were employed by ShanDong Chunguang Magnetoelectric Technology Co., Ltd. The remaining authors declare that the research was conducted in the absence of any commercial or financial relationships that could be construed as a potential conflict of interest.
References
- Al-Bassami, N.; Mansour, S.; Abdel-Fattah, E.; Abdo, M. Ce-Co-Mn-Zn ferrite nano catalyst: A synergetic effect of rare earth Ce3+ on enhanced optical properties and photocatalysis. Ceram. Int. 2023, 49, 20601–20612. [Google Scholar] [CrossRef] [Scilit]
- Alghamdi, A.A.; Sadeq, M.; Abdel-Fattah, E.; Qutub, M.A.; Abdo, M. Cr-substituted Mn–Zn ferrite nanoparticles: A study of optical, photocatalytic degradation, and radiation shielding evolution. Opt. Mater. 2024, 155, 115904. [Google Scholar] [CrossRef] [Scilit]
- Augustin, M.; Balu, T. Synthesis and characterization of metal (Mn, Zn) ferrite magnetic nanoparticles. Mater. Today Proc. 2015, 2, 923–927. [Google Scholar] [CrossRef] [Scilit]
- Beatrice, C.; Bottauscio, O.; Chiampi, M.; Fiorillo, F.; Manzin, A. Magnetic loss analysis in Mn–Zn ferrite cores. J. Magn. Magn. Mater. 2006, 304, e743–e745. [Google Scholar] [CrossRef] [Scilit]
- Beatrice, C.; Dobák, S.; Tsakaloudi, V.; Ragusa, C.; Fiorillo, F.; Martino, L.; Zaspalis, V. Magnetic loss, permeability, and anisotropy compensation in CoO-doped Mn-Zn ferrites. AIP Adv. 2018, 8, 047803. [Google Scholar] [CrossRef] [Scilit]
- Beatrice, C.; Tsakaloudi, V.; Dobák, S.; Zaspalis, V.; Fiorillo, F. Magnetic losses versus sintering treatment in Mn-Zn ferrites. J. Magn. Magn. Mater. 2017, 429, 129–137. [Google Scholar] [CrossRef] [Scilit]
- D’souza, A.; Deepak Kumar, M.; Chatim, M.; Naik, V.; Naik, P.P.; Tangsali, R. Effect of rare-earth doping on magnetic and electrical transport properties of nanoparticle Mn–Zn ferrite. Adv. Sci. Lett. 2016, 22, 773–779. [Google Scholar] [CrossRef] [Scilit]
- Dinesh, A.; Raja, K.K.; Manikandan, A.; Almessiere, M.; Slimani, Y.; Baykal, A.; Alorfi, H.S.; Hussein, M.A.; Khan, A. Sol–gel combustion synthesis and photocatalytic dye degradation studies of rare earth element Ce substituted Mn–Zn ferrite nanoparticles. J. Mater. Res. Technol. 2022, 18, 5280–5289. [Google Scholar] [CrossRef] [Scilit]
- Dippong, T.; Levei, E.-A.; Toloman, D.; Barbu-Tudoran, L.; Cadar, O. Investigation on the formation, structural and photocatalytic properties of mixed Mn-Zn ferrites nanoparticles embedded in SiO2 matrix. J. Anal. Appl. Pyrolysis 2021, 158, 105281. [Google Scholar] [CrossRef] [Scilit]
- Dobák, S.; Beatrice, C.; Fiorillo, F.; Tsakaloudi, V.; Ragusa, C. Magnetic loss decomposition in Co-doped Mn-Zn ferrites. IEEE Magn. Lett. 2018, 10, 7100205. [Google Scholar] [CrossRef] [Scilit]
- Fiorillo, F.; Beatrice, C.; Bottauscio, O.; Carmi, E. Eddy-current losses in Mn-Zn ferrites. IEEE Trans. Magn. 2013, 50, 6300109. [Google Scholar] [CrossRef] [Scilit]
- Gawas, U.; Verenkar, V.; Vader, V.; Jain, A.; Meena, S.S. Effects of sintering temperature on microstructure, initial permeability and electric behaviour of Ni-Mn-Zn ferrites. Mater. Chem. Phys. 2022, 275, 125250. [Google Scholar] [CrossRef] [Scilit]
- Ghazanfar, U.; Siddiqi, S.; Abbas, G. Structural analysis of the Mn–Zn ferrites using XRD technique. Mater. Sci. Eng. B 2005, 118, 84–86. [Google Scholar] [CrossRef] [Scilit]
- Jeong, W.H.; Song, B.M.; Han, Y.H. Analysis of power losses in Mn–Zn ferrites. Jpn. J. Appl. Phys. 2002, 41, 2912. [Google Scholar] [CrossRef] [Scilit]
- Jiang, K.; Li, K.; Peng, C.; Zhu, Y. Effect of multi-additives on the microstructure and magnetic properties of high permeability Mn–Zn ferrite. J. Alloys Compd. 2012, 541, 472–476. [Google Scholar] [CrossRef] [Scilit]
- Kącki, M.; Ryłko, M.S.; Hayes, J.G.; Sullivan, C.R. Measurement methods for high-frequency characterizations of permeability, permittivity, and core loss of Mn-Zn ferrite cores. IEEE Trans. Power Electron. 2022, 37, 15152–15162. [Google Scholar] [CrossRef] [Scilit]
- Kącki, M.; Ryłko, M.S.; Hayes, J.G.; Sullivan, C.R. Analysis and experimental investigation of high-frequency magnetic flux distribution in Mn-Zn ferrite cores. IEEE Trans. Power Electron. 2022, 38, 703–716. [Google Scholar] [CrossRef] [Scilit]
- Khatun, N.; Hossain, M.S.; Begum, M.H.A.; Islam, S.; Tanvir, N.I.; Bhuiyan, R.H.; Al-Mamun, M. Effect of sintering temperature on structural, magnetic, dielectric and optical properties of Ni–Mn–Zn ferrites. J. Adv. Dielectr. 2021, 11, 2150028. [Google Scholar] [CrossRef] [Scilit]
- Li, Z.; Ying, Y.; Wang, N.; Zheng, J.; Yu, J.; Li, W.; Qiao, L.; Cai, W.; Li, J.; Huang, H.; et al. Effect of compressive stress on power loss of Mn–Zn ferrite for high-frequency applications. Ceram. Int. 2022, 48, 17723–17728. [Google Scholar] [CrossRef] [Scilit]
- Liu, Y.; He, S. Development of low loss Mn–Zn ferrite working at frequency higher than 3 MHz. J. Magn. Magn. Mater. 2008, 320, 3318–3322. [Google Scholar] [CrossRef] [Scilit]
- Mallesh, S.; Srinivas, V. A comprehensive study on thermal stability and magnetic properties of MnZn-ferrite nanoparticles. J. Magn. Magn. Mater. 2019, 475, 290–303. [Google Scholar] [CrossRef] [Scilit]
- Rezaei, B.; Kermanpur, A.; Labbaf, S. Effect of Mn addition on the structural and magnetic properties of Zn-ferrite nanoparticles. J. Magn. Magn. Mater. 2019, 481, 16–24. [Google Scholar] [CrossRef] [Scilit]
- Rosales, M.; Plata, A.; Nicho, M.; Brito, A.; Ponce, M.; Castano, V. Effect of sintering conditions on microstructure and magnetic properties of Mn-Zn ferrites. J. Mater. Sci. 1995, 30, 4446–4450. [Google Scholar] [CrossRef] [Scilit]
- Sakaki, Y.; Matsuoka, T. Hysteresis losses in Mn-Zn ferrite cores. IEEE Trans. Magn. 1986, 22, 623–625. [Google Scholar] [CrossRef] [Scilit]
- Sharma, K.; Aggarwal, N.; Kumar, N.; Sharma, A. A review paper: Synthesis techniques and advance application of Mn-Zn nano-ferrites. Mater. Today Proc. 2023; in press.
- Shokrollahi, H.; Janghorban, K. Influence of additives on the magnetic properties, microstructure and densification of Mn–Zn soft ferrites. Mater. Sci. Eng. B 2007, 141, 91–107. [Google Scholar] [CrossRef] [Scilit]
- Suh, J.; Song, B.; Han, Y. Temperature dependence of power loss of Mn-Zn ferrites at high frequency. IEEE Trans. Magn. 2002, 36, 3402–3404. [Google Scholar] [CrossRef] [Scilit]
- Sun, B.; Ma, D.; Bai, G.; Lu, J.; Yang, K.; Wang, K.; Xu, X.; Zhai, Y.; Quan, W.; Han, B. Correlating the microstructure of Mn–Zn ferrite with magnetic noise for magnetic shield applications. Ceram. Int. 2023, 49, 11960–11967. [Google Scholar] [CrossRef] [Scilit]
- Thakur, P.; Taneja, S.; Sindhu, D.; Lüders, U.; Sharma, A.; Ravelo, B.; Thakur, A. Manganese zinc ferrites: A short review on synthesis and characterization. J. Supercond. Nov. Magn. 2020, 33, 1569–1584. [Google Scholar] [CrossRef] [Scilit]
- Töpfer, J.; Angermann, A. Complex additive systems for Mn-Zn ferrites with low power loss. J. Appl. Phys. 2015, 117, 17A504. [Google Scholar] [CrossRef] [Scilit]
- Tsakaloudi, V.; Beatrice, C.; Fiorillo, F.; Zaspalis, V. Magnetic loss versus temperature and role of doping in Mn-Zn ferrites. J. Magn. Magn. Mater. 2024, 603, 172228. [Google Scholar] [CrossRef] [Scilit]
- Tsakaloudi, V.; Zaspalis, V. Synthesis of a low loss Mn–Zn ferrite for power applications. J. Magn. Magn. Mater. 2016, 400, 307–310. [Google Scholar] [CrossRef] [Scilit]
- Tsutaoka, T.; Kasagi, T.; Nakamura, T.; Hatakeyama, K. High frequency permeability of Mn-Zn ferrite and its composite materials. J. Phys. IV 1997, 7, C1-557–C1-558. [Google Scholar] [CrossRef] [Scilit]
- Tung, M.; Chang, W.; Liu, C.; Liu, T.; Chen, C.; Tseng, T.-Y. Study of loss mechanisms of Mn-Zn ferrites in the frequency from 1 MHz to 10 MHz. IEEE Trans. Magn. 1993, 29, 3526–3528. [Google Scholar] [CrossRef]
- Vaidyanathana, G.; Arulmurugana, R.; Likhiteb, S.; Anantharamanc, M.; Vaidyad, M.; Senthilrama, N. Effect of preparation on magnetic properties of Mn-Zn ferrite. Indian J. Eng. Mater. Sci. 2004, 11, 289–294. [Google Scholar]
- Venkataraju, C.; Sathishkumar, G.; Sivakumar, K. Effect of Cd on the structural, magnetic and electrical properties of nanostructured Mn–Zn ferrite. J. Magn. Magn. Mater. 2011, 323, 1817–1822. [Google Scholar] [CrossRef] [Scilit]
- Wang, S.-F.; Chiang, Y.-J.; Hsu, Y.-F.; Chen, C.-H. Effects of additives on the loss characteristics of Mn–Zn ferrite. J. Magn. Magn. Mater. 2014, 365, 119–125. [Google Scholar] [CrossRef] [Scilit]
- Wu, T.; Ding, F.; Li, D.; Zhong, H. Composition Dependent Structural and Magnetic Properties of Mn−Zn Ferrite. ChemistrySelect 2020, 5, 14978–14985. [Google Scholar] [CrossRef] [Scilit]
- Zhong, X.; Guo, X.; Zou, S.; Yu, H.; Liu, Z.; Zhang, Y.; Wang, K. Improving soft magnetic properties of Mn-Zn ferrite by rare earth ions doping. AIP Adv. 2018, 8, 047807. [Google Scholar] [CrossRef] [Scilit]

Disclaimer/Publisher’s Note: The statements, opinions and data contained in all publications are solely those of the individual author(s) and contributor(s) and not of MDPI and/or the editor(s). MDPI and/or the editor(s) disclaim responsibility for any injury to people or property resulting from any ideas, methods, instructions or products referred to in the content. |
© 2026 by the authors. Licensee MDPI, Basel, Switzerland. This article is an open access article distributed under the terms and conditions of the Creative Commons Attribution (CC BY) license.