


Abstract
Chinese cabbage cultivation requires timely monitoring because environmental conditions and visible crop abnormalities can change rapidly. This study presents SMART-CAB, an edge-based Artificial Intelligence of Things (AIoT) system that integrates environmental sensing, YOLOv5-based crop condition detection, sensor threshold actuation, notification, and context-aware access control. Temperature–humidity, soil moisture, and light sensors, a camera, and relay-controlled ventilation, irrigation, and supplemental lighting are connected through three Raspberry Pi devices. Python programs acquire sensor readings at a median interval of 60 s and switch the actuators according to temperature thresholds and binary dry/wet and dark/bright sensor states; crop images are analyzed by YOLOv5; records are stored in a MariaDB database accessed through a PHP web platform; Gmail notifications are issued for configured detections; and Normal or Limited access states are assigned from user role, login time, and network source. YOLOv5 outputs generate records and alerts but do not control actuators. The detector was trained on 2530 farm-collected, manually annotated images split at image level into training, validation, and test subsets (1772/505/253). On the held-out test set, micro-averaged precision, recall, and F1-score were 90.76%, 88.13%, and 89.42% at a confidence threshold of 0.25 (94.01%, 78.63%, and 85.62% at the 0.70 alert threshold), with an inference latency of 1.42 s per image. Command acknowledgment rates were 98.00–99.33%, physical tests confirmed 87 out of 90 commanded actuator state changes, 78 out of 80 notifications (97.5%) were delivered, and all 100 login trials matched the access policy. These results demonstrate the technical feasibility of the integrated system for small-scale Chinese cabbage cultivation.
1. Introduction
Agricultural production is increasingly affected by environmental variability, including extreme heat, irregular rainfall, drought, and prolonged periods of high humidity. Such conditions can influence plant growth, soil moisture availability, pest pressure, and disease development, increasing the need for cultivation practices capable of continuously observing environmental changes and supporting timely intervention before visible crop damage becomes severe [1,2]. In parallel, agricultural labor shortages and population aging make frequent manual field inspection increasingly difficult to sustain, particularly in cultivation environments that require regular observation of crop conditions and environmental variables [3]. These challenges have increased the demand for intelligent agricultural systems capable of continuous monitoring, automated response, and remote management.
Chinese cabbage production depends on appropriate environmental management because temperature, relative humidity, soil moisture, and illumination directly influence crop development. Insufficient irrigation may restrict plant growth, whereas excessive soil moisture can increase the risk of unfavorable crop conditions. Similarly, abnormal temperature, humidity, and illumination can contribute to visible plant abnormalities. Under conventional cultivation management, crops are typically inspected periodically rather than continuously, creating a temporal gap between the occurrence of an environmental or crop abnormality and its recognition by the operator. Continuous digital monitoring can reduce this gap by collecting environmental measurements and crop images at regular intervals, preserving historical information, and providing timely information for cultivation management.
1.1. Related Work
Recent developments in the Internet of Things (IoT), embedded computing, edge computing, computer vision, and artificial intelligence (AI) have provided a technological foundation for intelligent agricultural systems [4,5,6,7,8,9,10,11]. IoT-enabled greenhouse and cultivation platforms can continuously acquire environmental measurements and support automated control [4,5], while the integration of AI with IoT has enabled data-driven monitoring and intelligent management in agricultural environments [7,8,9]. Computer vision and deep learning techniques have also been increasingly applied to crop monitoring and image-based agricultural analysis [6,10]. In particular, deep learning models have been applied to field cabbage detection and positioning [12] and to target spraying of cabbage plant centers [13]; AI-based UAV monitoring and disease identification of Brassica plants has been reviewed [14]; and improved YOLO models have been used for Chinese cabbage seedling belt detection and seedling emergence monitoring [15,16]. These developments demonstrate the potential of combining sensing, intelligent computation, and automated control to reduce dependence on conventional manual agricultural management.
Despite these advances, existing smart agriculture studies frequently concentrate on individual components of the cultivation process rather than their integration into a complete operational workflow. Smart greenhouse systems have demonstrated environmental sensing and automated control [4,5], AIoT research has emphasized connected agricultural data acquisition and intelligent management [7,8,9], and computer vision studies have demonstrated deep-learning-based crop detection and monitoring [6,12,13,14,15,16]. However, practical cultivation management requires environmental measurements, crop images, intelligent analysis, physical control, historical records, notifications, and remote user interaction to operate cooperatively within a unified system. For example, detecting a visual crop abnormality becomes more operationally useful when the corresponding image and prediction are stored, made available for historical analysis, communicated to an authorized operator, and considered together with environmental and controller information.
More recent studies have further emphasized the convergence of IoT, AI, computer vision, and edge computing in smart agriculture. AIoT architectures increasingly combine distributed sensing with intelligent data processing to support irrigation management, crop monitoring, disease assessment, and automated decision making [17,18,19]. Edge computing approaches have also gained attention because agricultural data can be processed closer to the cultivation environment, reducing dependence on continuous cloud connectivity and supporting more responsive local decisions [20,21]. Recent frameworks have integrated IoT sensors with computer vision and AI to enable real-time crop monitoring and management [22,23], while other studies have explored virtual sensing, intelligent environmental monitoring, and data-driven agricultural automation [24]. At the same time, recent reviews highlight scalability, interoperability, cybersecurity, sensor reliability, and integration of heterogeneous agricultural technologies as continuing challenges for practical smart farming deployment [25,26]. Collectively, these studies indicate a transition from isolated sensing or prediction models to more integrated, intelligent, and connected agricultural systems; however, achieving coordinated sensing, visual analysis, physical control, persistent data management, notification, and access-controlled user interaction within a single operational platform remains an important research challenge.
Among studies that combine several of these elements, Rahman et al. [9] described an AIoT-based hydroponic system for crop recommendation and nutrient parameter monitoring; Jiang et al. [12] developed a field cabbage detection and positioning system based on an improved YOLOv8n model; Zhang et al. [13] integrated a remote deep learning recognition model with a precision target spraying system for cabbage plant centers; and Tariq et al. [21] proposed an edge-enabled framework integrating IoT, lightweight deep learning, and agentic AI for context-aware farming. SMART-CAB is positioned relative to these systems by combining, within one deployed prototype, environmental sensing, image-based crop condition detection, sensor threshold actuation, persistent records, notification, and role- and context-based access control. A functionality comparison is provided in (Section 5).
1.2. Research Gap and Contributions
Furthermore, smart agriculture platforms operate as cyber–physical systems in which sensing, computation, communication, physical control, data storage, and user interaction are interconnected. Security is therefore essential, as unauthorized remote access to irrigation, ventilation, lighting, crop images, or historical data may create operational risks. Integrating role-based permissions with contextual login information can strengthen access control by restricting higher-risk functions under less trusted conditions.
Cybersecurity has also been examined for connected agricultural and food sector systems. Asfha and Vaish [27] applied a fuzzy inference system to information security risk analysis in food processing industrial information systems and found data theft affecting electronic data to be the highest-risk threat (75.67%). For IoT networks, Jenifer and Prakash [28] proposed an attack-specific, optimized Rivest–Shamir–Adleman (RSA) security scheme that combines fuzzy anomaly detection and naïve Bayes attack classification with a variable encryption strategy. These studies address risk assessment, trusted networking, and secure data transmission at the network and device levels. Web access in the present prototype uses HTTPS (TLS 1.2 or later; Section 2.7), but the study does not evaluate encrypted device-to-server transmission, device authentication, or intrusion detection; its security contribution is limited to application-level, role-based, and context-aware access control, and secure transmission between edge devices and the server is identified as future work.
Another challenge is connecting image-based crop analysis with physical cultivation management. Beyond identifying visible crop conditions, an operational platform should store analysis results, maintain historical records, notify users, and associate crop information with environmental and controller data. Therefore, a unified AIoT architecture is needed to integrate sensing, edge computing, visual analysis, automated control, data management, notification, and access-controlled remote use within a single cultivation workflow.
To address this gap, this study proposes SMART-CAB, an integrated AIoT cyber-physical system for intelligent Chinese cabbage cultivation. The system combines environmental sensing and crop image acquisition with Raspberry Pi-based edge computing, YOLOv5 crop condition analysis, relay-controlled irrigation, ventilation and supplemental lighting, persistent data storage, abnormality notification, and web-based management. Environmental actuation is governed by sensor threshold rules, whereas YOLOv5 detections generate visual condition records and notifications without directly controlling actuators. Role-based access control is further combined with login time and network source evaluation to assign Normal or Limited access states.
Unlike studies focused on individual sensing, control, or deep learning components, SMART-CAB emphasizes system-level integration rather than proposing a new object detection algorithm. The system was implemented using three Raspberry Pi devices and evaluated in a small-scale Chinese cabbage cultivation environment. The visual analysis module used 2530 original farm-collected and manually annotated images divided into training, validation, and test subsets before augmentation; augmenting only the training subset produced a final dataset of 6074 images. Component- and system-level evaluations were then conducted to assess AI detection, edge deployment, sensing, actuator command acknowledgment, notification, contextual access control, and overall operational integration.
The aim of this study is to design, implement, and evaluate an integrated AIoT cyber–physical system that links environmental sensing, image-based crop condition detection, sensor threshold actuation, persistent data management, abnormality notification, and context-aware access control within a single workflow for small-scale Chinese cabbage cultivation and to quantify the performance of each component under deployment conditions. The novelty of the study lies in this system-level integration—in particular, the separation of AI-based visual monitoring from rule-based actuation and the combination of role-based permissions with a quantified login context rule—rather than in a new detection algorithm.
The main contributions of this study are summarized as follows:
- We developed SMART-CAB architecture for Chinese cabbage cultivation by integrating environmental sensing, crop image acquisition, Raspberry Pi-based edge computing, automated irrigation, ventilation and supplemental lighting, and remote web-based management within a single operational platform.
- A farm-collected dataset of 2530 original manually annotated Chinese cabbage images is randomly split at image level into training, validation, and test subsets, with augmentation applied only to the training subset to produce a final 6074-image dataset for YOLOv5-based visual condition analysis. The trained image analysis component is integrated into the SMART-CAB workflow to provide predicted conditions, confidence scores, detected regions, annotated images, historical records, and data export.
- We implement a unified data management and access control framework to manage environmental measurements, camera images, AI analysis results, controller records, abnormality notifications, historical visualization, and CSV export. Role-based access control is further combined with contextual evaluation of login time and network source to assign Normal or Limited access states.
- SMART-CAB is deployed and quantitatively evaluated in a small-scale Chinese cabbage cultivation environment. The evaluation covers AI detection, edge computing performance, environmental sensing, actuator command acknowledgment, abnormality notification, contextual access control, and operational system integration, demonstrating the technical feasibility of the proposed AIoT architecture.
2. SMART-CAB System Architecture
2.1. System Overview
SMART-CAB is organized as an integrated cyber–physical architecture with sensing and image acquisition, edge computation, physical control, application services, database management, and security functions. Figure 1 shows the SMART-CAB architecture. Chinese cabbage is monitored by environmental sensors and a camera. Sensor and image data are transmitted to Raspberry Pi devices, which provide local acquisition, processing, control, and communication. Relay modules connect the edge layer to the fan, water pump, and supplemental light. The remote application and database provide persistent storage, visualization, account management, historical analysis, notification, and export.
Figure 1.
SMART-CAB architecture integrating environmental control, visual monitoring, alerts, data management, and contextual access control.
The architecture follows a sequential operational workflow: Sense → Process → Decide → Actuate → Observe → Store → Notify. Environmental measurements and crop images are sensed first. Edge devices process sensor readings and communicate with the application layer. Sensor threshold rules and authorized user commands determine actuator states, whereas YOLOv5 processes crop images to generate visual condition records and notifications; YOLOv5 predictions do not directly control actuators. The resulting records are stored, visualized, and used for notification or later analysis. Contextual access decisions are applied at login, and backend authorization checks are implemented for restricted operations.
The functional characteristics and principal quantitative parameters of the architecture are as follows. (i) Sensing layer: a DHT11 temperature–humidity sensor (manufacturer-specified range 0–50 °C and 20–90% RH), binary soil moisture and light state modules, and a Logitech USB camera; environmental records are stored at a median interval of 60 s. (ii) Edge layer: three Raspberry Pi devices running Python 3.10 on Raspberry Pi OS for sensor acquisition, image capture, relay control, and server communication; the YOLOv5 model occupies 14.1 MB, uses a 640 × 640 input, and requires 1.42 s per image (0.70 FPS) with 72.0% average CPU utilization, 1.84 GB average RAM usage, and 6.8 W average active power (Section 4.2). (iii) Actuation layer: three relay-controlled devices (ventilation fan, water pump, and supplemental light) operated by threshold rules or manual commands (Section 2.5), with reported mean command acknowledgment latencies of 2.5–3.1 s. (iv) Application and data layer: a PHP 8.4.7 web platform on Apache HTTP Server 2.4.52 with a MariaDB 10.6.22 database storing environmental, camera, AI, controller, and user records and Gmail notifications issued when a configured target class is detected with a confidence of at least 0.70 (mean delivery latency 4.7 s). (v) Access control layer: three user roles combined with two contextual access states (Normal and Limited) assigned from login time and network source (Section 2.7).
2.2. Environmental Sensing
The environmental sensing subsystem contains three principal measurement types. The DHT11 sensor provides temperature and relative humidity. The soil moisture sensor represents soil status using dry/wet classification. The photoresistor represents light conditions using a binary classification between darker and sufficiently bright states. Sensor programs run on Raspberry Pi devices and transfer readings to the application database.
The use of binary soil and light states is a deliberate characteristic of the implemented prototype. The current system does not represent soil moisture as a calibrated volumetric water content (VWC) percentage or light as a calibrated illuminance measurement. Consequently, the results are interpreted as operational sensor states rather than as agronomic measurements with laboratory-level calibration. Because these outputs are binary, numerical measurement errors are not reported for soil moisture and illumination.
The web platform provides both current readings and historical visualization. This allows an operator to inspect the present state while also examining patterns over a selected date. The historical record is important because isolated sensor values provide limited context; time-series information can reveal changes that may correspond to control activity or crop observations.
2.3. Edge Computing
Three Raspberry Pi devices provide the edge computing infrastructure. Their functions include sensor acquisition, image capture, device control execution, and communication with the remote server. Placing these operations near the cultivation environment provides a clear boundary between local physical operations and remote application services. The Raspberry Pi model, the allocation of these functions among the three devices, and the device on which YOLOv5 inference is executed are specified in Section 3.2.
The edge layer is also responsible for threshold-based environmental control. In automatic mode, sensor conditions are compared with predefined system conditions, and the relevant relay-controlled device is activated or deactivated. In manual mode, authorized users can operate the devices from the web interface. Each controller action is logged with the Raspberry Pi identifier, operating mode, device state, activation time, and deactivation time.
This architecture supports modular replacement. Sensors or actuators can be changed without redesigning the entire application layer, while the image analysis model can be replaced or updated independently of the basic sensing and control infrastructure.
2.4. AI-Based Crop Analysis
The visual analysis subsystem uses YOLOv5 to detect visually abnormal cabbage leaf conditions. The system accepts images captured by the camera or uploaded through the web interface. After processing, the model returns the predicted category, confidence score, and bounding box locations. The original image, annotated image, prediction information, Raspberry Pi identifier, and detection time are stored as an AI record.
The four visual condition classes are leaf discoloration, disease-like condition, leaf holes, and abnormal leaf water condition; the same class names are used in Section 3.3. The platform also provides a separate growth stage function that categorizes images into seedling, growing, and harvesting stages. This growth stage function is an interface feature only; its model, training data, and performance were not evaluated in this study and are not reported. The distinction between condition detection and disease diagnosis is important: the system identifies visible patterns learned from the annotated images and does not establish laboratory-confirmed disease etiology.
2.5. Automated Environmental Control
The control subsystem consists of a ventilation fan, irrigation water pump, and supplemental light, each connected through relay modules. The fan provides ventilation and temperature-related response, the pump supports irrigation when dry soil conditions are detected, and the supplemental light provides illumination when the light condition is insufficient.
The system supports automatic and manual control. Automatic control is executed from the edge environment according to predefined conditions. Manual control is available to authorized users through the web platform. The distinction between automatic and manual operation is retained in the controller log, enabling later review of how each device was operated.
In automatic mode, the configured sensor threshold rules are as follows: the ventilation fan is activated when temperature is ≥30 °C and deactivated when it is ≤27 °C; the fan retains its previous state between 27 °C and 30 °C; the water pump is activated when the binary soil moisture sensor reports dry and deactivated when it reports wet; and the supplemental (grow) light is activated when the photoresistor input indicates dark and deactivated when it indicates bright. Because the soil moisture and light inputs are binary states, no volumetric water content (VWC) or illuminance (lux) thresholds are used. The rules are evaluated once per 60 s sensor cycle, and the sensor state, requested actuator state, and command acknowledgment are stored as separate fields. YOLOv5 predictions are not inputs to these rules and do not directly control actuators.
The evaluation reports command acknowledgments and acknowledgment latency. These measures characterize the command–response pathway; acknowledgment alone does not establish physical fan rotation, water delivery, or light activation. Physical state changes were therefore verified in a separate test (Section 3.6).
2.6. Web Platform and Database
The web platform provides a common interface for environmental monitoring, camera surveillance, cabbage AI records, growth stage records, controller histories, user administration, notifications, historical visualization, and CSV export. The interface is responsive and was developed using HTML5, CSS3, JavaScript ES6, Bootstrap, and PHP 8.4.7. Apache HTTP Server 2.4.52 and MariaDB 10.6.22 provide the web server and database environments.
The database stores multiple record types so that system operation can be examined retrospectively. Environmental measurements can be related to time, while camera and AI records preserve the image analysis history. Controller records preserve device activity, and user records support role management. This creates a unified operational history instead of distributing evidence across separate applications.
2.7. Security and Access Control
SMART-CAB uses three primary user roles: administrator, data scientist, and user. Administrators manage user accounts, Raspberry Pi devices, sensor records, camera records, AI analysis records, and controller logs (Table 1). Data scientists can inspect environmental monitoring, cabbage image analysis, growth stage analysis, historical records, controller records, visualization, and CSV export. General users have access to real-time environmental measurements, camera monitoring, recent identification records, and authorized control functions.
Table 1.
Role-based access structure.
Permissions are determined jointly by user role and contextual access state. The contextual state can restrict the functions available to a role, but Normal access does not grant administrative rights to every user; account management and other administrator functions remain subject to administrator authorization in both Normal and Limited states. The two access state names used throughout this manuscript are Normal and Limited.
In this study, context denotes two attributes of each login request that the application can evaluate without additional sensors: the local login time t (24 h clock, hh:mm) and the network source n, classified as the trusted Wi-Fi network, a mobile hotspot, or an unknown network. The time attribute is mapped to a time score T ∈ {0, 5, 10} according to Equation (1) and the network attribute to a network score N ∈ {5, 10} according to Equation (2); the combined contextual value T + N therefore ranges from 5 to 20:
where t is the local login time and n is the network source identified through the SSID allowlist described below. The score values are ordinal design settings that rank daytime use on the trusted network highest; they were selected by the authors to encode the intended access policy and were not derived empirically.
The system uses a configurable SSID allowlist for contextual network classification. The configured trusted SSID is SmartFarm_Trusted. A matching identifier is classified as trusted, while other identifiers are classified as untrusted. SSID matching is a contextual signal rather than proof of user identity or network authenticity because an SSID can be copied or spoofed. The SSID is captured once from the connecting client at login, compared by exact string match against the allowlist, and stored with the session; it is not independently validated by BSSID, certificate-based, or WPA2/WPA3-Enterprise authentication.
The access state A is then assigned according to Equation (3):
Under the implemented scoring rule, Normal access requires a trusted network and a login time between 08:00 and 23:00. Because N = 10 is required, the condition T + N ≥ 15 is equivalent to T ≥ 5; the scores are a compact encoding of this rule retained for reproducibility and were not optimized or validated as a security measure.
The access state is calculated after successful login and stored in the user session. Interface-level restrictions are supplemented by backend application programming interface (API) checks intended to prevent a user from obtaining a restricted function simply by bypassing a front-end control. The deployed configuration uses HTTPS with a minimum of TLS 1.2 for web access, stores passwords as Argon2id hashes with a unique salt per password, terminates sessions after 15 min of inactivity, and locks an account for 15 min after five consecutive failed login attempts. When the network identity (SSID) is unavailable, network-dependent privileged functions are denied. The access state is not re-evaluated while a session remains active; a change in login time window or network takes effect only at the next login, which occurs after logout or after the 15 min inactivity timeout. Under Limited access, all roles retain the live sensor dashboard, whereas historical AI records, CSV export, fan, pump, and light commands, configuration changes, and user management are denied.
2.8. End-to-End Operational Workflow
The complete workflow begins with environmental sensing and crop image acquisition. Sensor values are collected by Raspberry Pi devices and transmitted to the application environment. Crop images are captured and retained as camera records. When an image is selected for analysis, YOLOv5 generates visual condition predictions and associated confidence scores and bounding boxes. Independently of the visual analysis, sensor readings can trigger threshold-based actuator operation, while authorized users can issue manual commands.
The resulting sensor, image, AI, and controller events are stored in the database. If YOLOv5 detects a configured target class with a confidence of at least 0.70, the system stores the analysis result and sends a Gmail notification containing the timestamp, detected class, confidence score, and event identifier. This operational alert threshold is distinct from the 0.25 confidence threshold used for detection evaluation in Section 3.4. Detection performance at the 0.70 threshold is reported separately in Section 4.2. AI detections generate records and notifications but do not trigger actuator responses. Authorized users can then review the image, confidence information, environmental history, and controller records through the web platform. Historical records can be filtered and exported in CSV format. Access to these functions is conditioned by role and contextual access state.
- Sense: collect temperature, humidity, soil state, light state, and crop images.
- Process: acquire and prepare sensor/image data at the edge and process crop images using YOLOv5.
- Decide: compare environmental conditions with predefined control logic and evaluate user access context. YOLOv5 predictions are not used in actuator decisions.
- Actuate: activate or deactivate the fan, water pump, and supplemental light in automatic or manual mode.
- Observe: display current conditions, camera images, AI results, and controller states through the web platform.
- Store: retain environmental, camera, AI, user, and controller records in MariaDB.
- Notify: send abnormality notifications through Gmail and preserve the corresponding event for later review.
3. Materials and Methods
3.1. Deployment Environment
The prototype was deployed in a small-scale Chinese cabbage cultivation environment using cultivation containers. Sensors were positioned around the cultivation area, a camera was installed for image acquisition, and the fan, water pump, and supplemental light were connected to relay modules. Three Raspberry Pi devices provided sensor acquisition, image capture, controller execution, and communication with the remote server.
The deployment was designed as a small-scale experimental cultivation environment for evaluating the integrated operation of SMART-CAB. The experimental setup enabled assessment of environmental sensing, crop image acquisition, AI-based visual analysis, edge computing performance, actuator command acknowledgment, abnormality notification, contextual access control, and persistent operational data management within a unified AIoT platform.
The deployment period was defined as 1 August 2026 at 00:00 to 31 August 2026 at 00:00, excluding the endpoint, corresponding to 720 scheduled hours. Environmental sensors were configured to sample at 60 s intervals, equivalent to 43,200 scheduled samples per sensor stream. Visual monitoring had a nominal five-second interval during active periods, while actuator command logging was event-driven. These figures describe the scheduled configuration rather than measured uptime, and visual monitoring was not necessarily active throughout the deployment.
3.2. Hardware and Software Configuration
The SMART-CAB prototype was implemented using three Raspberry Pi 4 Model B computers with 4 GB of RAM (Raspberry Pi Ltd., Cambridge, UK) for sensor acquisition, image capture, environmental control, and communication. Environmental conditions were monitored using a DHT11 temperature–humidity sensor (Aosong Electronics Co., Ltd., Guangzhou, China), a soil moisture sensor (DFRobot, Shanghai, China) for dry/wet soil condition detection, and a photoresistor (Sunrom Technologies, Ahmedabad, India) for light condition detection, while a Logitech camera (Logitech International S.A., Lausanne, Switzerland) was used to acquire Chinese cabbage images. Three relay modules based on SRD-05VDC-SL-C relays (Ningbo Songle Relay Co., Ltd., Ningbo, China) controlled the connected actuators, including one ventilation fan (SUNON, Kaohsiung, Taiwan) for ventilation and temperature-related control, one water pump (Ningbo Jiayin Electro Mechanical Technology Co., Ltd., Ningbo, China) for automatic or manual irrigation, and one supplemental light (Shenzhen Meijiu Lighting Co., Ltd., Shenzhen, China) for illumination. System development and preparation were performed on a Windows 11 computer equipped with an Intel Core i5-1235U processor and 8 GB of memory. The Raspberry Pi programs were developed using Python 3.10 on Raspberry Pi OS, while the web platform was implemented using HTML5, CSS3, JavaScript ES6, Bootstrap 5.3.3, and PHP 8.4.7. Apache HTTP Server 2.4.52 was used as the web server, with MariaDB 10.6.22 and phpMyAdmin 5.1.1 for database storage and management. OpenCV 4.8.0 supported image processing, while YOLOv5 v6.2 implemented in PyTorch 2.1.0 was used for AI implementation and Roboflow web platform was employed for image annotation. Visual Studio Code 1.94 and Thonny 4.0.1 were used as the primary development tools. The Raspberry Pi model used was Raspberry Pi 4 Model B with 4 GB of RAM (all three devices). Device 1 performed environmental data acquisition and threshold-based control, Device 2 performed camera acquisition and local image preparation, and Device 3 hosted the web interface and database and coordinated the system; YOLOv5 inference was executed on Device 3.
The components were selected for low cost, availability, and compatibility with a single Python-based software stack. The DHT11 provides digital temperature and relative humidity readings over a single wire interface without an external analog to digital converter, and its manufacturer-specified ranges (0–50 °C and 20–90% RH, with stated accuracies of ±2 °C and ±5% RH) cover the conditions of the small-scale deployment; its resolution and accuracy are, however, lower than those of higher-grade sensors such as the DHT22 or SHT3x series, which limits the precision of the reported temperature and humidity values. The binary soil moisture and photoresistor modules were used because the implemented control rules require only dry/wet and dark/bright states. Raspberry Pi single board computers were selected because they run a full Linux operating system with Python, provide general purpose input/output pins for sensor and relay interfacing and USB ports for the camera, and can host the PyTorch-based YOLOv5 model so that acquisition, control, and image analysis can share one platform. YOLOv5 was selected for its mature open-source implementation, the availability of small model variants suited to resource-constrained hardware, and the established use of YOLO family detectors for cabbage detection [12,15,16].
3.3. Dataset Preparation and Model Training
The original dataset comprised 2530 Chinese cabbage images randomly divided at the image level into 1772 training images, 505 validation images, and 253 test images before augmentation. Rotation and brightness adjustment were subsequently applied only to the training subset, increasing it to 5316 images. The validation and test subsets remained unaugmented, producing a final dataset of 6074 images. This procedure prevented augmented versions of a given source image from appearing across subsets. However, splitting was not grouped by plant, capture session, or day; therefore, related images may occur across subsets, and plant- or session-independent generalization cannot be established. The resulting dataset composition is summarized in Table 2. The original images were collected directly from a Chinese cabbage farm, captured variations in orientation, illumination, and background conditions, and were manually annotated and preprocessed using Roboflow at a resolution of 640 × 640 pixels. Four visual crop condition categories were defined: leaf discoloration, disease-like condition, leaf holes, and abnormal leaf water condition. These categories represent observable visual conditions rather than laboratory-confirmed diagnoses. For annotation, leaf discoloration denoted yellowing, browning, or other localized color change of leaf tissue without visible perforation; disease-like condition denoted spots, lesions, or necrotic patches resembling disease symptoms; leaf holes denoted visible perforations or chewed leaf margins; and abnormal leaf water condition denoted wilting, curling, or water-soaked leaf appearance. Where conditions overlapped, each visibly distinct region was boxed separately with the label that best matched its dominant appearance. Bounding boxes were drawn in YOLO format as tight boxes around each visible target, with one predefined class label assigned per target instance, and annotation quality was assessed through double annotation: 253 images (10.0% of the 2530 original images) were independently annotated by a second annotator, yielding a Cohen’s κ of 0.86 for image-level condition labels, and disagreements were reviewed by a third reviewer and resolved by consensus. The healthy/normal condition was not included as a detector class; image regions without a target condition box were treated as background, and 18 out of the 253 test images (7.1%) contained no target condition instance. The prepared dataset was used to train YOLOv5 v6.2, which generates the predicted condition category, confidence score, and bounding box location. Training used the YOLOv5s architecture initialized with COCO-pretrained weights, an input size of 640 × 640 pixels, 100 epochs, a batch size of 16, the stochastic gradient descent (SGD) optimizer with an initial learning rate of 0.01, and a random seed of 42; the checkpoint with the highest validation mAP was selected as the final model; the selected weights were then evaluated once on the held-out test subset. The resulting prediction is stored together with the original and annotated images, acquisition time, and device identifier.
Table 2.
Dataset composition before and after training set augmentation.
3.4. Evaluation Protocol
The performance of SMART-CAB was evaluated at both the component and system levels to determine the effectiveness of the proposed AIoT architecture for Chinese cabbage monitoring and management. The evaluation covered six major aspects: (1) AI-based crop condition detection, (2) environmental sensing, (3) actuator command acknowledgment, (4) notification performance, (5) contextual access control, and (6) edge deployment performance. In addition, operational database records were examined to characterize recorded activity across sensing, image acquisition, AI processing, actuator control, data storage, and remote management (Table 3).
Table 3.
Evaluation framework for the SMART-CAB system.
For AI-based crop condition detection, the held-out test set was used to evaluate the YOLOv5 model using precision, recall, F1-score, and class-wise average precision (AP). Precision, recall, and F1-score were calculated at a single operating point defined by the confirmed confidence threshold of 0.25, with a detection counted as a true positive when it matched a ground truth annotation at an Intersection over Union (IoU) of at least 0.50. Precision, recall, and F1-score were additionally calculated at the operational alert threshold of 0.70 (Section 2.8) using the same IoU matching criterion. AP, in contrast, summarizes a precision–recall curve rather than a single confidence operating point. Class-wise AP was computed at an IoU threshold of 0.50 (AP@0.50); evaluation used an input size of 640 × 640 pixels, a non-maximum suppression (NMS) IoU threshold of 0.45, and a maximum of 300 detections per image. The mean of the four class-wise AP@0.50 values is reported as mAP@0.5. Per-class AP values and per-class TP, FP, and FN counts were further examined to identify differences among the four visual condition categories. Only aggregate and per-class TP, FP, and FN counts were recorded; a multiclass confusion matrix was not generated, so class to class misclassifications are not analyzed. Edge deployment performance was evaluated using inference latency, processing rate in frames per second (FPS), central processing unit (CPU) utilization, random access memory (RAM) consumption, model size, and active power consumption.
Environmental sensing was evaluated in terms of measurement error, expressed as mean absolute error (MAE), missing data rate, and sampling interval. Actuator command handling was evaluated through repeated commands to the ventilation fan, water pump, and supplemental light, with acknowledgment rate and mean acknowledgment latency used as indicators. Notification performance was evaluated through repeated abnormality alert trials by measuring successful and failed Gmail deliveries and end-to-end delivery latency. Finally, the contextual access control mechanism was evaluated under different combinations of login time and network source to determine whether the system correctly assigned the predefined Normal or Limited access state.
3.5. AI and Edge Deployment Evaluation
The YOLOv5-based crop condition analysis module was evaluated using the held-out, unaugmented test set of 253 images. Detection performance was assessed using precision, recall, F1-score, and class-wise AP. Precision and recall quantify the proportions of correct positive detections and detected target instances, respectively, while the F1-score represents their harmonic mean. AP summarizes the precision–recall curve of each class at an IoU threshold of 0.50, and the mean of the four class-wise AP values is reported as mAP@0.5. Per-class TP, FP, and FN values were additionally examined to identify differences among the four visual condition categories. Edge deployment efficiency was evaluated using average inference latency, processing rate (FPS), CPU utilization, RAM usage, model size, and active power consumption. Precision, recall, and F1-score were calculated using their standard definitions from the information retrieval literature [29]: Precision = TP/(TP + FP), Recall = TP/(TP + FN), and F1-score is the harmonic mean of precision and recall.
Here, , , and denote true positive, false positive, and false negative detections, respectively. TP, FP, and FN were counted at the confidence threshold of 0.25 and matching IoU threshold of 0.50 described in Section 3.4, and micro-averaged precision, recall, and F1-score were obtained by pooling these counts across the four classes before computing these metrics. AP values were computed over the full precision–recall curve of each class at an IoU threshold of 0.50.
3.6. Environmental Sensing and Actuator Evaluation
Environmental sensing performance was evaluated in terms of measurement accuracy, data continuity, and acquisition frequency. Measurement agreement was quantified by the mean absolute error (MAE) between paired sensor and reference readings, calculated as in Equation (4):
where Si is the i-th sensor reading, Ri is the paired reference reading, and N is the number of valid sensor–reference pairs. Sensor and reference readings must use the same measurement scale. Accordingly, temperature MAE is expressed in °C and relative humidity MAE in percentage points of relative humidity. Temperature readings were compared with a calibrated digital thermometer at reference levels of 20, 25, and 30 °C and relative humidity readings with a calibrated thermo-hygrometer at approximately 40%, 60%, and 80% RH; three paired readings were taken at each level, giving nine sensor–reference pairs per parameter. Because the soil moisture and light inputs are binary states (Section 2.2), they were not evaluated by MAE. The missing data rate is defined as the proportion of expected records that were not successfully recorded; its interpretation requires an explicit expected record count and a distinction between loss of shared records and failures of individual sensors.
The median sampling interval was calculated from consecutive environmental records. For each actuator, 150 commands were issued. The acknowledgment rate was calculated as the number of commands receiving a corresponding acknowledgment divided by the number issued. Acknowledgment latency was defined as the interval between command issuance by the controller and receipt of the corresponding acknowledgment. This interval does not represent physical actuation time. Physical actuation was therefore evaluated in a separate test in which each actuator underwent 30 commanded ON/OFF state changes, and each change was checked for confirmation of the corresponding physical device state.
3.7. Notification Evaluation
The Gmail-based abnormality notification mechanism was evaluated through 80 alert trials triggered by abnormal crop condition events. For each trial, successful or failed notification delivery was recorded, and end-to-end latency was measured from alert generation to notification delivery. Performance was evaluated using delivery success rate, mean latency, median latency, standard deviation, and 95th percentile latency. The 80 alert events were scripted test events generated to evaluate delivery only. The trials evaluated notification delivery after an alert had been generated; they did not assess whether alerts were correctly triggered, so false alarm and missed alert rates were not determined.
3.8. Evaluation Protocol for Contextual Access Control
The contextual access control mechanism was evaluated using 100 login attempts distributed across six combinations of login time and network source. Each observed access decision was compared with the expected Normal or Limited state defined by the contextual access policy in Section 2.7. The test scenarios included daytime, evening, and late-night access through trusted Wi-Fi, mobile hotspot, and unknown network conditions. Policy decision agreement was calculated as the proportion of login attempts for which the obtained access state matched the expected state. Access state testing was conducted separately from backend authorization testing; the latter is reported in Section 4.4.
4. Results
4.1. Operational System Performance
The SMART-CAB prototype functionally integrated environmental sensing, crop image acquisition, edge processing, AI-based crop condition analysis, physical control, persistent data storage, abnormality notification, and contextual access control within a unified AIoT platform. The database contained 56,815 environmental records, 723 camera records, 77 AI analysis records, and 1843 actuator control records (499 fan-control, 612 pump control, and 732 supplemental light control records). These totals describe retained activity. Because they are not broken down by sensor stream, device, or recording period, they do not establish sampling completeness, uninterrupted operation, or correct physical control. The platform operated through three Raspberry Pi devices and supported six registered users. The retained records are summarized in Table 4.
Table 4.
Operational records retained in the SMART-CAB database.
4.2. AI Detection and Edge Deployment Results
The reported aggregate counts comprised 334 true positives, 34 false positives, and 45 false negatives, yielding micro-averaged precision, recall, and F1-score values of 90.76%, 88.13%, and 89.42%, respectively in Table 5. The confirmed confidence and matching IoU thresholds were 0.25 and 0.50. At the operational alert threshold of 0.70 (matching IoU 0.50), the model produced 298 true positives, 19 false positives, and 81 false negatives, giving micro-averaged precision, recall, and F1-score values of 94.01%, 78.63%, and 85.62%, respectively. Raising the confidence threshold from 0.25 to 0.70 therefore increased precision by 3.25 percentage points but reduced recall by 9.50 percentage points. The mAP@0.5, calculated as the mean of the four class-wise AP@0.50 values, was 86.58%. The 253 test images contained 379 annotated target instances (leaf discoloration, 118; disease-like condition, 101; leaf holes, 84; abnormal leaf water condition, 76; calculated as TP + FN in Table 6). The Wilson 95% confidence intervals were 87.4–93.3% for micro-averaged precision and 84.5–91.0% for micro-averaged recall. These values are summarized in Table 5 as an aggregate detection count summary rather than a confusion matrix; the pooled counts cannot reconstruct class to class misclassifications.
Table 5.
Aggregate detection count summary and derived metrics.
Table 6.
Per-class YOLOv5 detection results.
Per-class performance is presented in Table 6. Leaf discoloration achieved the highest reported AP of 91.3%, followed by disease-like conditions (88.7%), leaf holes (84.2%), and abnormal leaf water conditions (82.1%). Leaf discoloration also achieved balanced precision and recall of 91.53%, whereas abnormal leaf water conditions produced the lowest precision (87.50%), recall (82.89%), and F1-score (85.14%). Within these reported results, abnormal leaf water conditions had the lowest reported AP, precision, recall, and F1-score of the four visual condition categories.
The edge deployment results are summarized in Table 7. The deployed model required an average of 1.42 s per image, corresponding to a processing rate of 0.70 FPS. Average CPU utilization was 72.0%, increasing to a peak of 86.5%, while average and peak RAM usage were 1.84 GB and 2.10 GB, respectively. The model occupied 14.1 MB, and average active power consumption was 6.8 W. These results characterize the computational requirements of the crop analysis module under the implemented edge configuration. The 1.42 s latency was timed from the moment an image became available to the inference pipeline until the inference result was returned; database writing was excluded. Latency was measured on a Raspberry Pi 4 Model B (4 GB RAM; Device 3) using 640 × 640 RGB inputs at a batch size of 1, and 20 warm-up inferences were followed by 200 measured inferences, giving a median latency of 1.39 s/image (interquartile range 1.31–1.53 s/image). During measurement, camera capture and the web service remained active, and no other benchmark workload was intentionally launched. Active power was measured with an inline USB power meter as the 5 min average following a 60 s stabilization period.
Table 7.
Edge deployment performance.
Beyond the quantitative detection and edge deployment performance, the trained model was integrated into the SMART-CAB web platform for operational record management. The interface screenshots in Figure 2, Figure 3 and Figure 4 were captured on 16 December 2025 and illustrate the implemented interfaces; they are not part of the evaluation data. As shown in Figure 2, authorized users can retrieve and filter camera surveillance records by Raspberry Pi identifier, model, and date. Cabbage AI analysis records are managed through a corresponding interface and contain the predicted condition, confidence score, annotated image, detection time, and associated image information. This integration enables AI outputs to be retained and reviewed as part of the historical crop monitoring workflow.
Figure 2.
SMART-CAB camera surveillance record management interface. The green bounding box indicates a YOLOv5 detection labeled “growing stage” with a confidence score of 25.5%.
Figure 3.
Representative examples of the cabbage condition analysis stages (the panels show different images): (a) input image containing an abnormal leaf condition, (b) YOLOv5 output with detected regions, and (c) web-based image analysis result interface.
Figure 4.
SMART-CAB environmental monitoring results: (a) current temperature and relative humidity and (b) historical temperature and humidity trends.
Representative crop condition detection outputs are presented in Figure 3. The three panels are independent representative examples of each stage and do not show the same image. Figure 3a shows an input cabbage image containing an abnormal leaf condition, Figure 3b shows a YOLOv5 output with bounding boxes identifying detected abnormal regions in another test image, and Figure 3c shows the web-based analysis record, including the predicted condition and confidence score. Together, the panels illustrate the stages of the image analysis workflow, from crop image input and AI-based localization to presentation of the result through the SMART-CAB web interface.
4.3. Environmental Sensing and Actuator Results
The environmental sensing results are presented in Table 8. The temperature MAE was 0.42 °C, and the relative humidity MAE was 2.60 percentage points (nine paired readings each). The observed temperature MAE describes agreement with the reference readings under the evaluated conditions and does not establish the guaranteed accuracy of the sensor. Because the soil moisture and light sensors provide binary state outputs (Section 2.2), errors in percentage points of VWC or in lux are not applicable to these parameters. Missing data rates are not reported in this study. The median sampling interval was 60 s. As illustrated in Figure 4, the monitoring interface displays current temperature and relative humidity measurements together with their historical variations, enabling users to examine environmental conditions over a selected period.
Table 8.
Environmental sensor evaluation.
Table 9 summarizes the reported command acknowledgment results. Out of 150 commands issued per actuator, 148 fan commands, 147 pump commands, and 149 light commands were acknowledged, corresponding to acknowledgment rates of 98.67%, 98.00%, and 99.33%, respectively. The Wilson 95% confidence intervals for these rates (fan, 95.3–99.6%; pump, 94.3–99.3%; light, 96.3–99.9%) overlap substantially; the differences among the three actuators are therefore not interpreted as a performance ranking. Reported mean acknowledgment latencies were 2.8, 3.1, and 2.5 s. These descriptive differences do not establish statistically significant differences between actuators or verify successful physical operation. In the separate physical actuation test, 29 out of 30 commanded fan state changes (96.7%), 28 out of 30 pump state changes (93.3%), and 30 out of 30 light state changes (100.0%) were physically confirmed.
Table 9.
Reported command acknowledgment rates and latencies.
4.4. Notification and Access Control Results
The Gmail-based abnormality notification results are summarized in Table 10. Out of 80 alert trials, 78 notifications were delivered and two failed, resulting in a delivery success rate of 97.5%. The mean notification latency was 4.7 s with a median of 4.2 s, a standard deviation of 1.6 s, and a 95th percentile latency of 7.5 s. The causes of the two failed deliveries were not logged. Because the trials assessed delivery rather than alert correctness, false alarm and missed alert rates are not reported. The instance-level detection results at the 0.70 alert threshold (Section 4.2) characterize the precision–recall trade-off at the operating point used for alert generation, but they do not substitute for an event-level evaluation of alert correctness.
Table 10.
Gmail notification performance.
The contextual access control results are presented in Table 11. All 100 evaluated login attempts produced the access state expected under the predefined policy, corresponding to 100% policy decision agreement across the tested scenarios. This result assesses implementation of the rule and does not establish resistance to adversarial attacks. Daytime and evening access through trusted Wi-Fi was correctly assigned the Normal state when the predefined contextual requirements were satisfied. In contrast, hotspot access and late-night access were assigned the Limited state. Notably, daytime hotspot access remained Limited despite reaching a numerical contextual score of 15 because the trusted-Wi-Fi requirement was not satisfied.
Table 11.
Contextual access control evaluation.
Backend authorization checks are implemented in addition to front-end interface restrictions and were tested separately from the access state scenarios in Table 11 by issuing requests directly to protected endpoints (Table 12). Each of the eight tests was repeated five times (40 requests in total), and the server returned the expected decision in all 40 requests: Limited access requests for current sensor readings were permitted, whereas Limited access requests for historical AI records, CSV export, actuator commands, and settings changes were rejected with HTTP 403; an authenticated administrator retrieved historical AI records; an unauthenticated request was rejected with HTTP 401; and five consecutive incorrect passwords triggered the configured 15 min account lockout. In a separate session expiry test, a protected request issued after 15 min of inactivity was rejected and redirected to the login page. These tests confirm enforcement of the configured authorization rules for the listed endpoints but do not constitute penetration testing or establish resistance to other attack types.
Table 12.
Backend authorization tests.
Overall, SMART-CAB demonstrated functional integration of environmental sensing, crop image acquisition, AI-based visual analysis, Raspberry Pi-based edge processing, actuator command handling, persistent data management, abnormality notification, and contextual access control. The YOLOv5 module achieved a micro-averaged F1-score of 89.42%, with an mAP@0.5 of 86.58%, while reported actuator command acknowledgment rates ranged from 98.00% to 99.33%. The Gmail notification mechanism achieved a 97.5% delivery success rate, the contextual access mechanism showed 100% policy decision agreement across the evaluated login scenarios, and all 40 backend authorization requests (eight tests, five repetitions each) returned the expected decision. In addition, the retained 56,815 environmental records and 1843 actuator control records describe recorded activity but do not establish sampling completeness, uninterrupted operation, or correct physical control. Collectively, these results support the technical feasibility of SMART-CAB as an integrated AIoT cyber–physical platform for Chinese cabbage monitoring and management with role- and context-based access control.
5. Discussion
The experimental results demonstrate that SMART-CAB can integrate environmental sensing, crop image analysis, edge computing, sensor-threshold-based actuator control, persistent data management, abnormality notification, and contextual access control within a unified AIoT cyber–physical platform. Unlike smart agriculture approaches that primarily emphasize individual functions such as environmental monitoring, greenhouse control, or crop detection, the main contribution of SMART-CAB lies in connecting these functions into an operational workflow in which sensing, analysis, response, storage, notification, and access-controlled remote interaction operate cooperatively. This system-level integration directly addresses the research gap identified in the Introduction.
The crop condition detection results correspond to micro-averaged precision, recall, and F1-score values of 90.76%, 88.13%, and 89.42%, respectively, and the mAP@0.5 was 86.58%. Localization performance under stricter IoU criteria is not reported. Performance also varied across the four visual condition categories, with leaf discoloration achieving the highest reported AP of 91.3% and abnormal leaf water conditions the lowest at 82.1%. This variation suggests that visually distinctive abnormalities can be detected more consistently, whereas conditions characterized by subtler or more variable appearance remain more challenging. Importantly, SMART-CAB does not treat these predictions as laboratory-confirmed disease diagnoses; they represent visual crop condition categories learned from the annotated farm images. This distinction is consistent with the intended operational role of the AI module.
The edge deployment results indicate that crop image analysis can be performed within the implemented Raspberry Pi-based environment on a Raspberry Pi 4 Model B (Device 3). An average inference time of 1.42 s/image, corresponding to 0.70 FPS, was achieved with a 14.1 MB model, 72.0% average CPU utilization, 1.84 GB average RAM usage, and 6.8 W average active power consumption. Although this processing rate is not intended for high frame rate video analytics, it is appropriate for the periodic image-based monitoring workflow implemented in SMART-CAB, where crop images are captured or uploaded and analyzed individually. The results therefore support the use of edge computing for local agricultural monitoring while also indicating that further model optimization or more capable edge hardware would be required for higher-frequency visual analysis.
The sensing and actuator command results illustrate another aspect of the proposed cyber–physical architecture. Environmental measurements were recorded with a median sampling interval of 60 s; missing data rates were not quantified. Meanwhile, reported command acknowledgment rates for the ventilation fan, water pump, and supplemental light were 98.67%, 98.00%, and 99.33%, respectively, with mean acknowledgment latencies between 2.5 and 3.1 s. These findings indicate that the sensing layer and the command acknowledgment pathway can support periodic environmental monitoring and the issuing of environmental control commands, and a separate test physically confirmed 96.7%, 93.3%, and 100.0% of commanded fan, pump, and light state changes, respectively. The retained 56,815 environmental records and 1843 actuator control records indicate that these components generated records within a shared data management workflow, but they do not establish sampling completeness, uninterrupted operation, or correct physical control.
The notification and security mechanisms extend SMART-CAB beyond conventional sensing and control functionality. The Gmail notification subsystem achieved a 97.5% delivery success rate across 80 abnormality alert trials, with a mean delivery latency of 4.7 s and a 95th percentile latency of 7.5 s. This provides a practical connection between AI-based abnormality detection and human intervention. In parallel, the contextual access control mechanism produced the expected access state for all 100 evaluated login attempts, corresponding to 100% policy decision agreement under the predefined policy; this assesses implementation of the rule rather than resistance to attack. The combination of role-based permissions with login time and network source information provides an additional access control layer for functions such as device control, historical AI records, and data export. Backend authorization checks are intended to reduce reliance on interface-level restrictions alone, although their coverage of restricted endpoints was not comprehensively tested.
The findings are consistent with the broader direction of existing smart agriculture research, in which IoT-based greenhouse systems support continuous environmental monitoring and automated control, while AIoT and computer vision approaches increasingly provide intelligent crop analysis. However, the distinction of SMART-CAB is not the introduction of a new object detection algorithm. Rather, YOLOv5 is incorporated as one component of a broader operational architecture that connects environmental sensing, image analysis, physical actuation, historical storage, user notification, and contextual access control. This positioning is important because the practical value of crop condition detection increases when its output can be stored, reviewed alongside environmental and controller histories, communicated to users, and incorporated into an operational management platform. Table 13 compares SMART-CAB with the integrated systems discussed in Section 1.1 at the functionality level.
Table 13.
Functionality comparison of SMART-CAB with related integrated systems.
Quantitatively, the cabbage-specific vision systems in Table 13 report higher detection or speed values than SMART-CAB: Jiang et al. [12] reported an mAP of 93.9% for field cabbage detection, and Zhang et al. [13] reported an image processing time of 29.50 ms for cabbage plant center recognition, whereas SMART-CAB achieved a micro-averaged F1-score of 89.42% and an inference latency of 1.42 s per image. These values are not directly comparable, because the cited systems address cabbage plant detection, positioning, or plant center localization with different datasets, metrics, and hardware, whereas SMART-CAB classifies four visual condition categories on a Raspberry Pi-based configuration. Conversely, none of the compared systems reports environmental control command acknowledgment, notification delivery, or context-aware access control, so the corresponding SMART-CAB values (98.00–99.33% acknowledgment, 97.5% notification delivery, and 100% policy decision agreement) have no direct counterpart. Among the studies reviewed, no cabbage cultivation AIoT platform was identified that integrates all of these functions and reports comparable end-to-end metrics.
This study has several limitations. First, the current prototype was evaluated in a small-scale Chinese cabbage cultivation environment using cultivation containers rather than in a commercial greenhouse or large open-field deployment. Second, although the 2530 original farm-collected images contain realistic field variation, the image-level split was not grouped by plant, capture session, or day, so plant- or session-independent generalization cannot be established, and broader evaluation across farms, seasons, growth conditions, camera configurations, and illumination environments would strengthen evidence of model generalizability. Third, the visual categories represent observable crop conditions rather than laboratory-confirmed disease diagnoses. In addition, the detector was not compared with alternative object detection baselines, was not evaluated on a separate set of images captured by the deployed camera (which may differ in quality and viewpoint from the training images), and inter-annotator agreement was assessed on a 10% double-annotated subset (Cohen’s κ = 0.86) rather than on the full dataset. Fourth, longer-term experiments are required to determine whether the integrated control strategy produces measurable agronomic benefits such as improved yield, reduced water consumption, reduced energy use, or earlier intervention. Fifth, the environmental sensors were evaluated with limited reference instrument and calibration documentation; quantitative accuracy is therefore reported only for temperature and relative humidity, and missing data rates were not quantified. Sixth, physical actuator operation was confirmed in a dedicated 30-transition test for each actuator (Section 4.3), but the resulting environmental response, such as the temperature change after fan activation or the soil moisture state change after irrigation, was not quantified across the deployment. Seventh, the reported record totals and command acknowledgments do not independently establish environmental control effectiveness, uninterrupted operation, or agronomic benefit. Subsystem-specific availability, data completeness, behavior during connectivity loss, and environmental responses following actuation require further documentation or evaluation. Finally, the contextual access mechanism was evaluated for agreement with predefined access rules rather than through a comprehensive cybersecurity assessment. SSID-based classification is susceptible to spoofing and is not a standalone security boundary. Apart from the eight endpoint authorization tests in Table 12, resistance to network impersonation, session manipulation, unauthorized API requests, and other attacks has not been established.
In addition, the aggregate detection metrics were computed from the recorded per-class counts; a repeated evaluation of the final checkpoint on the test annotations would further strengthen these results. Alert evaluation assessed message delivery only; event-level false-alarm and missed-alert rates were not measured. At the 0.70 operating threshold, the instance-level recall of 78.63% indicates that some abnormal regions would not generate an alert, so the notification function should be regarded as a decision-support aid rather than an exhaustive monitoring guarantee.
Future work should therefore extend SMART-CAB to larger and more diverse cultivation environments, expand the image dataset across seasons and farms, and investigate lightweight or optimized AI models for faster edge inference. More comprehensive field experiments should quantify resource consumption, crop growth, yield, and intervention effectiveness over complete cultivation cycles. The sensing subsystem could also be extended with calibrated soil-moisture and illumination sensors and additional environmental parameters. From the security perspective, future studies could incorporate stronger device authentication, encrypted device to server communication, detailed audit mechanisms, and systematic penetration testing. These extensions would enable SMART-CAB to progress from a functionally integrated small-scale prototype toward a more scalable, quantitatively validated, and secure smart-agriculture platform.
6. Conclusions
This study presented SMART-CAB, an integrated AIoT cyber–physical system for intelligent Chinese cabbage cultivation. The proposed platform combines environmental sensing, crop image acquisition, Raspberry Pi-based edge computing, YOLOv5-based visual crop condition analysis, sensor-threshold-based automatic and manual control of ventilation, irrigation, and supplemental lighting, persistent data management, abnormality notification, and contextual access control within a unified operational workflow. The system was implemented using three Raspberry Pi devices and evaluated using 2530 original farm-collected Chinese cabbage images, expanded to a final dataset of 6074 images by augmenting only the training subset, together with component- and system-level experiments.
Experimental results support the technical feasibility of the proposed system. The YOLOv5 model achieved micro-averaged precision, recall, and F1-score values of 90.76%, 88.13%, and 89.42%, respectively, at a confidence threshold of 0.25, and 94.01%, 78.63%, and 85.62% at the operational alert threshold of 0.70; the mean of the four reported class-wise AP values was 86.58%, while edge inference required 1.42 s/image. Reported command acknowledgment rates for the fan, water pump, and supplemental light were 98.67%, 98.00%, and 99.33%, respectively; in a separate physical test, 29 out of 30, 28 out of 30, and 30 out of 30 commanded state changes were confirmed for the fan, pump, and light, respectively. The Gmail notification mechanism achieved a 97.5% delivery success rate, and all 100 evaluated login attempts produced the access state expected under the predefined policy (100% policy decision agreement), which assesses rule implementation rather than attack resistance. In addition, the platform accumulated 56,815 environmental records, 723 camera records, 77 cabbage AI records, and 1843 actuator control records, which document activity across sensing, analysis, control, storage, and remote management; uptime and data completeness were not measured.
The principal contribution of SMART-CAB is therefore not a new object detection algorithm but the system-level integration of AI, IoT sensing, edge computing, physical actuation, data management, notification, and contextual access control for practical crop monitoring and response. Future work will extend the platform to larger cultivation environments, more diverse farms and seasonal conditions, calibrated environmental sensing, optimized edge AI models, and longer-term cultivation experiments to quantify effects on resource consumption, crop growth, and yield. Comprehensive cybersecurity testing and stronger device-level protection will also be investigated to support deployment at larger operational scales.
Author Contributions
Conceptualization, C.-F.L., Y.-S.L., and A.U.R.; methodology, Y.-S.L. and A.U.R.; software, J.E.L., T.-Y.C., and M.-Y.L.; validation, J.E.L., T.-Y.C., M.-Y.L., and A.U.R.; formal analysis, A.U.R.; investigation, J.E.L., T.-Y.C., and M.-Y.L.; resources, C.-F.L. and Y.-S.L.; data curation, J.E.L., T.-Y.C., and M.-Y.L.; writing—original draft preparation, A.U.R.; writing—review and editing, C.-F.L., Y.-S.L., and A.U.R.; visualization, M.-Y.L. and A.U.R.; supervision, C.-F.L. and Y.-S.L.; project administration, C.-F.L.; funding acquisition, C.-F.L. All authors have read and agreed to the published version of the manuscript.
Funding
This research was partially supported by the National Science and Technology Council (NSTC), Taiwan, under Grant NSTC 115-221-E-035-075.
Data Availability Statement
The data supporting the findings of this study, including the farm-collected image dataset, the image-level training/validation/test split lists, annotation files, trained model weights, evaluation scripts, source code, and the sensor threshold control configuration, are not publicly available but can be obtained from the corresponding author upon reasonable request.
Acknowledgments
The authors used ChatGPT (GPT-6, OpenAI) to generate icons for Figure 1.
Conflicts of Interest
The authors declare no conflicts of interest.
Abbreviations
The following abbreviations are used in this manuscript:
| Abbreviation | Full form |
| AI | Artificial Intelligence |
| AIoT | Artificial Intelligence of Things |
| AP | Average Precision |
| API | Application Programming Interface |
| CSV | Comma-Separated Values |
| DHT11 | Digital Humidity and Temperature Sensor |
| FPS | Frames per Second |
| IoU | Intersection over Union |
| MAE | Mean Absolute Error |
| RAM | Random Access Memory |
| SMART-CAB | Smart Monitoring and Response Technology for Chinese Cabbage |
| SSID | Service Set Identifier |
| VWC | Volumetric Water Content |
| YOLOv5 | You Only Look Once Version 5 |
References
- Fanzo, J.; Carducci, B.; Louis-Jean, J.; Herrero, M.; Karl, K.; Rosenzweig, C. Climate change, extreme weather events, food security, and nutrition: Evolving relationships and critical challenges. Annu. Rev. Nutr. 2025, 45, 335–360. [Google Scholar] [CrossRef] [Scilit] [PubMed]
- Hossain, M.M.; Sultana, F.; Mostafa, M.; Ferdus, H.; Rahman, M.; Rana, J.A.; Islam, S.S.; Adhikary, S.; Sannal, A.; Hosen, A.E.; et al. Plant disease dynamics in a changing climate: Impacts, molecular mechanisms, and climate-informed strategies for sustainable management. Discov. Agric. 2024, 2, 132. [Google Scholar] [CrossRef] [Scilit]
- Kriebs, A. Population aging and sustainable farming in China. Nat. Aging 2023, 3, 367. [Google Scholar] [CrossRef] [Scilit]
- Rayhana, R.; Xiao, G.; Liu, Z. Internet of Things empowered smart greenhouse farming. IEEE J. Radio Freq. Identif. 2020, 4, 195–211. [Google Scholar] [CrossRef] [Scilit]
- Farooq, M.S.; Javid, R.; Riaz, S.; Atal, Z. IoT-based smart greenhouse framework and control strategies for sustainable agriculture. IEEE Access 2022, 10, 99394–99420. [Google Scholar] [CrossRef] [Scilit]
- Akbar, J.U.M.; Kamarulzaman, S.F.; Muzahid, A.J.M.; Rahman, M.A.; Uddin, M. A comprehensive review on deep learning-assisted computer vision techniques for smart greenhouse agriculture. IEEE Access 2024, 12, 4485–4522. [Google Scholar] [CrossRef] [Scilit]
- Luo, X.; Xiong, S.; Jia, X.; Zeng, Y.; Chen, X. AIoT-enabled data management for smart agriculture: A comprehensive review on emerging technologies. IEEE Access 2025, 13, 102964–102993. [Google Scholar] [CrossRef] [Scilit]
- Adli, H.K.; Remli, M.A.; Wan Salihin Wong, K.N.S.; Ismail, N.A.; González-Briones, A.; Corchado, J.M.; Mohamad, M.S. Recent advancements and challenges of AIoT application in smart agriculture: A review. Sensors 2023, 23, 3752. [Google Scholar] [CrossRef] [Scilit] [PubMed]
- Rahman, M.A.; Chakraborty, N.R.; Sufiun, A.; Banshal, S.K.; Tajnin, F.R. An AIoT-based hydroponic system for crop recommendation and nutrient parameter monitorization. Smart Agric. Technol. 2024, 8, 100472. [Google Scholar] [CrossRef] [Scilit]
- Min, X.; Ye, Y.; Xiong, S.; Chen, X. Computer vision meets generative models in agriculture: Technological advances, challenges and opportunities. Appl. Sci. 2025, 15, 7663. [Google Scholar] [CrossRef] [Scilit]
- Catota-Ocapana, P.; Minaya-Andino, C.; Astudillo, P.; Pichoasamin, D. Smart control models used for nutrient management in hydroponic crops: A systematic review. IEEE Access 2025, 13, 13070–13087. [Google Scholar] [CrossRef] [Scilit]
- Jiang, P.; Qi, A.; Zhong, J.; Luo, Y.; Hu, W.; Shi, Y.; Liu, T. Field cabbage detection and positioning system based on improved YOLOv8n. Plant Methods 2024, 20, 96. [Google Scholar] [CrossRef] [Scilit] [PubMed]
- Zhang, H.; Hu, J.; Shi, H.; Liu, C.; Wu, M. Precision target spraying system integrated with remote deep learning recognition model for cabbage plant centers. Smart Agric. 2024, 6, 85–95. [Google Scholar] [CrossRef]
- Ali, Z.A.; Deng, D.; Shaikh, M.K.; Hasan, R.; Khan, M.A. AI-based UAV swarms for monitoring and disease identification of Brassica plants using machine learning: A review. Comput. Syst. Sci. Eng. 2024, 48, 1–34. [Google Scholar] [CrossRef] [Scilit]
- Gao, X.; Wang, G.; Qi, J.; Wang, Q.; Xiang, M.; Song, K.; Zhou, Z. Improved YOLO v7 for sustainable agriculture significantly improves precision rate for Chinese cabbage (Brassica pekinensis Rupr.) seedling belt (CCSB) detection. Sustainability 2024, 16, 4759. [Google Scholar] [CrossRef] [Scilit]
- Chen, X.; Liu, T.; Han, K.; Jin, X.; Wang, J.; Kong, X.; Yu, J. TSP-YOLO-based deep learning method for monitoring cabbage seedling emergence. Eur. J. Agron. 2024, 157, 127191. [Google Scholar] [CrossRef] [Scilit]
- Muhammed, D.; Ahvar, E.; Ahvar, S.; Trocan, M.; Montpetit, M.-J.; Ehsani, R. Artificial Intelligence of Things (AIoT) for smart agriculture: A review of architectures, technologies and solutions. J. Netw. Comput. Appl. 2024, 228, 103905. [Google Scholar] [CrossRef] [Scilit]
- Nawaz, M.; Babar, M.I.K. IoT and AI for smart agriculture in resource-constrained environments: Challenges, opportunities and solutions. Discov. Internet Things 2025, 5, 24. [Google Scholar] [CrossRef] [Scilit]
- Sharma, K.; Shivandu, S.K. Integrating artificial intelligence and Internet of Things (IoT) for enhanced crop monitoring and management in precision agriculture. Sens. Int. 2024, 5, 100292. [Google Scholar] [CrossRef] [Scilit]
- Sapna; Gauttam, H.; Chauhan, V.; Pattanaik, K.K.; Trivedi, A.; Ghosh, H. A comprehensive review of edge computing empowered smart agriculture: Trends, opportunities and future directions. Comput. Electron. Agric. 2026, 241, 111252. [Google Scholar] [CrossRef] [Scilit]
- Tariq, M.U.; Saqib, S.M.; Mazhar, T.; Khan, M.A.; Shahzad, T.; Hamam, H. Edge-enabled smart agriculture framework: Integrating IoT, lightweight deep learning, and agentic AI for context-aware farming. Results Eng. 2025, 28, 107342. [Google Scholar] [CrossRef] [Scilit]
- Kuan, Y.N.; Goh, K.M.; Lim, L.L. Systematic review on machine learning and computer vision in precision agriculture: Applications, trends, and emerging techniques. Eng. Appl. Artif. Intell. 2025, 148, 110401. [Google Scholar] [CrossRef] [Scilit]
- Thilakarathne, N.; Abu Bakar, M.; Abas, P.; Yassin, H. Internet of Things enabled smart agriculture: Current status, latest advancements, challenges and countermeasures. Heliyon 2025, 11, e42136. [Google Scholar] [CrossRef] [Scilit] [PubMed]
- Chourlias, A.; Violos, J.; Leivadeas, A. Virtual sensors for smart farming: An IoT- and AI-enabled approach. Internet Things 2025, 32, 101611. [Google Scholar] [CrossRef] [Scilit]
- Raj, M.; Prahadeeswaran, M. Revolutionizing agriculture: A review of smart farming technologies for a sustainable future. Discov. Appl. Sci. 2025, 7, 937. [Google Scholar] [CrossRef] [Scilit]
- Kumar, S.N.; Suriyan, K.; Jacob, A.T.; Varghese, A.; Francis, E. Smart farming for a sustainable future: Implementing IoT-based systems in precision agriculture. Bull. Natl. Res. Cent. 2025, 49, 71. [Google Scholar] [CrossRef] [Scilit]
- Asfha, A.E.; Vaish, A. Information security risk analysis in food processing industry using a fuzzy inference system. Inform. Autom. 2023, 22, 1083–1102. [Google Scholar] [CrossRef] [Scilit]
- Jenifer, R.R.; Prakash, V.S.J. Rivest-Shamir-Adleman algorithm optimized to protect IoT devices from specific attacks. Inform. Autom. 2024, 23, 1423–1453. [Google Scholar] [CrossRef] [Scilit]
- Van Rijsbergen, C.J. Information Retrieval, 2nd ed.; Butterworths: London, UK, 1979. [Google Scholar]
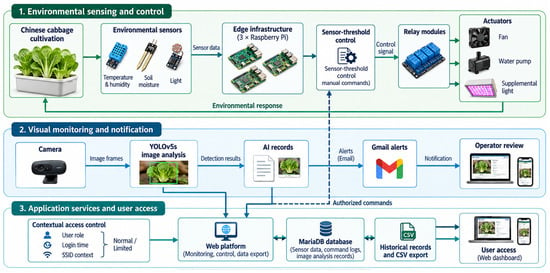
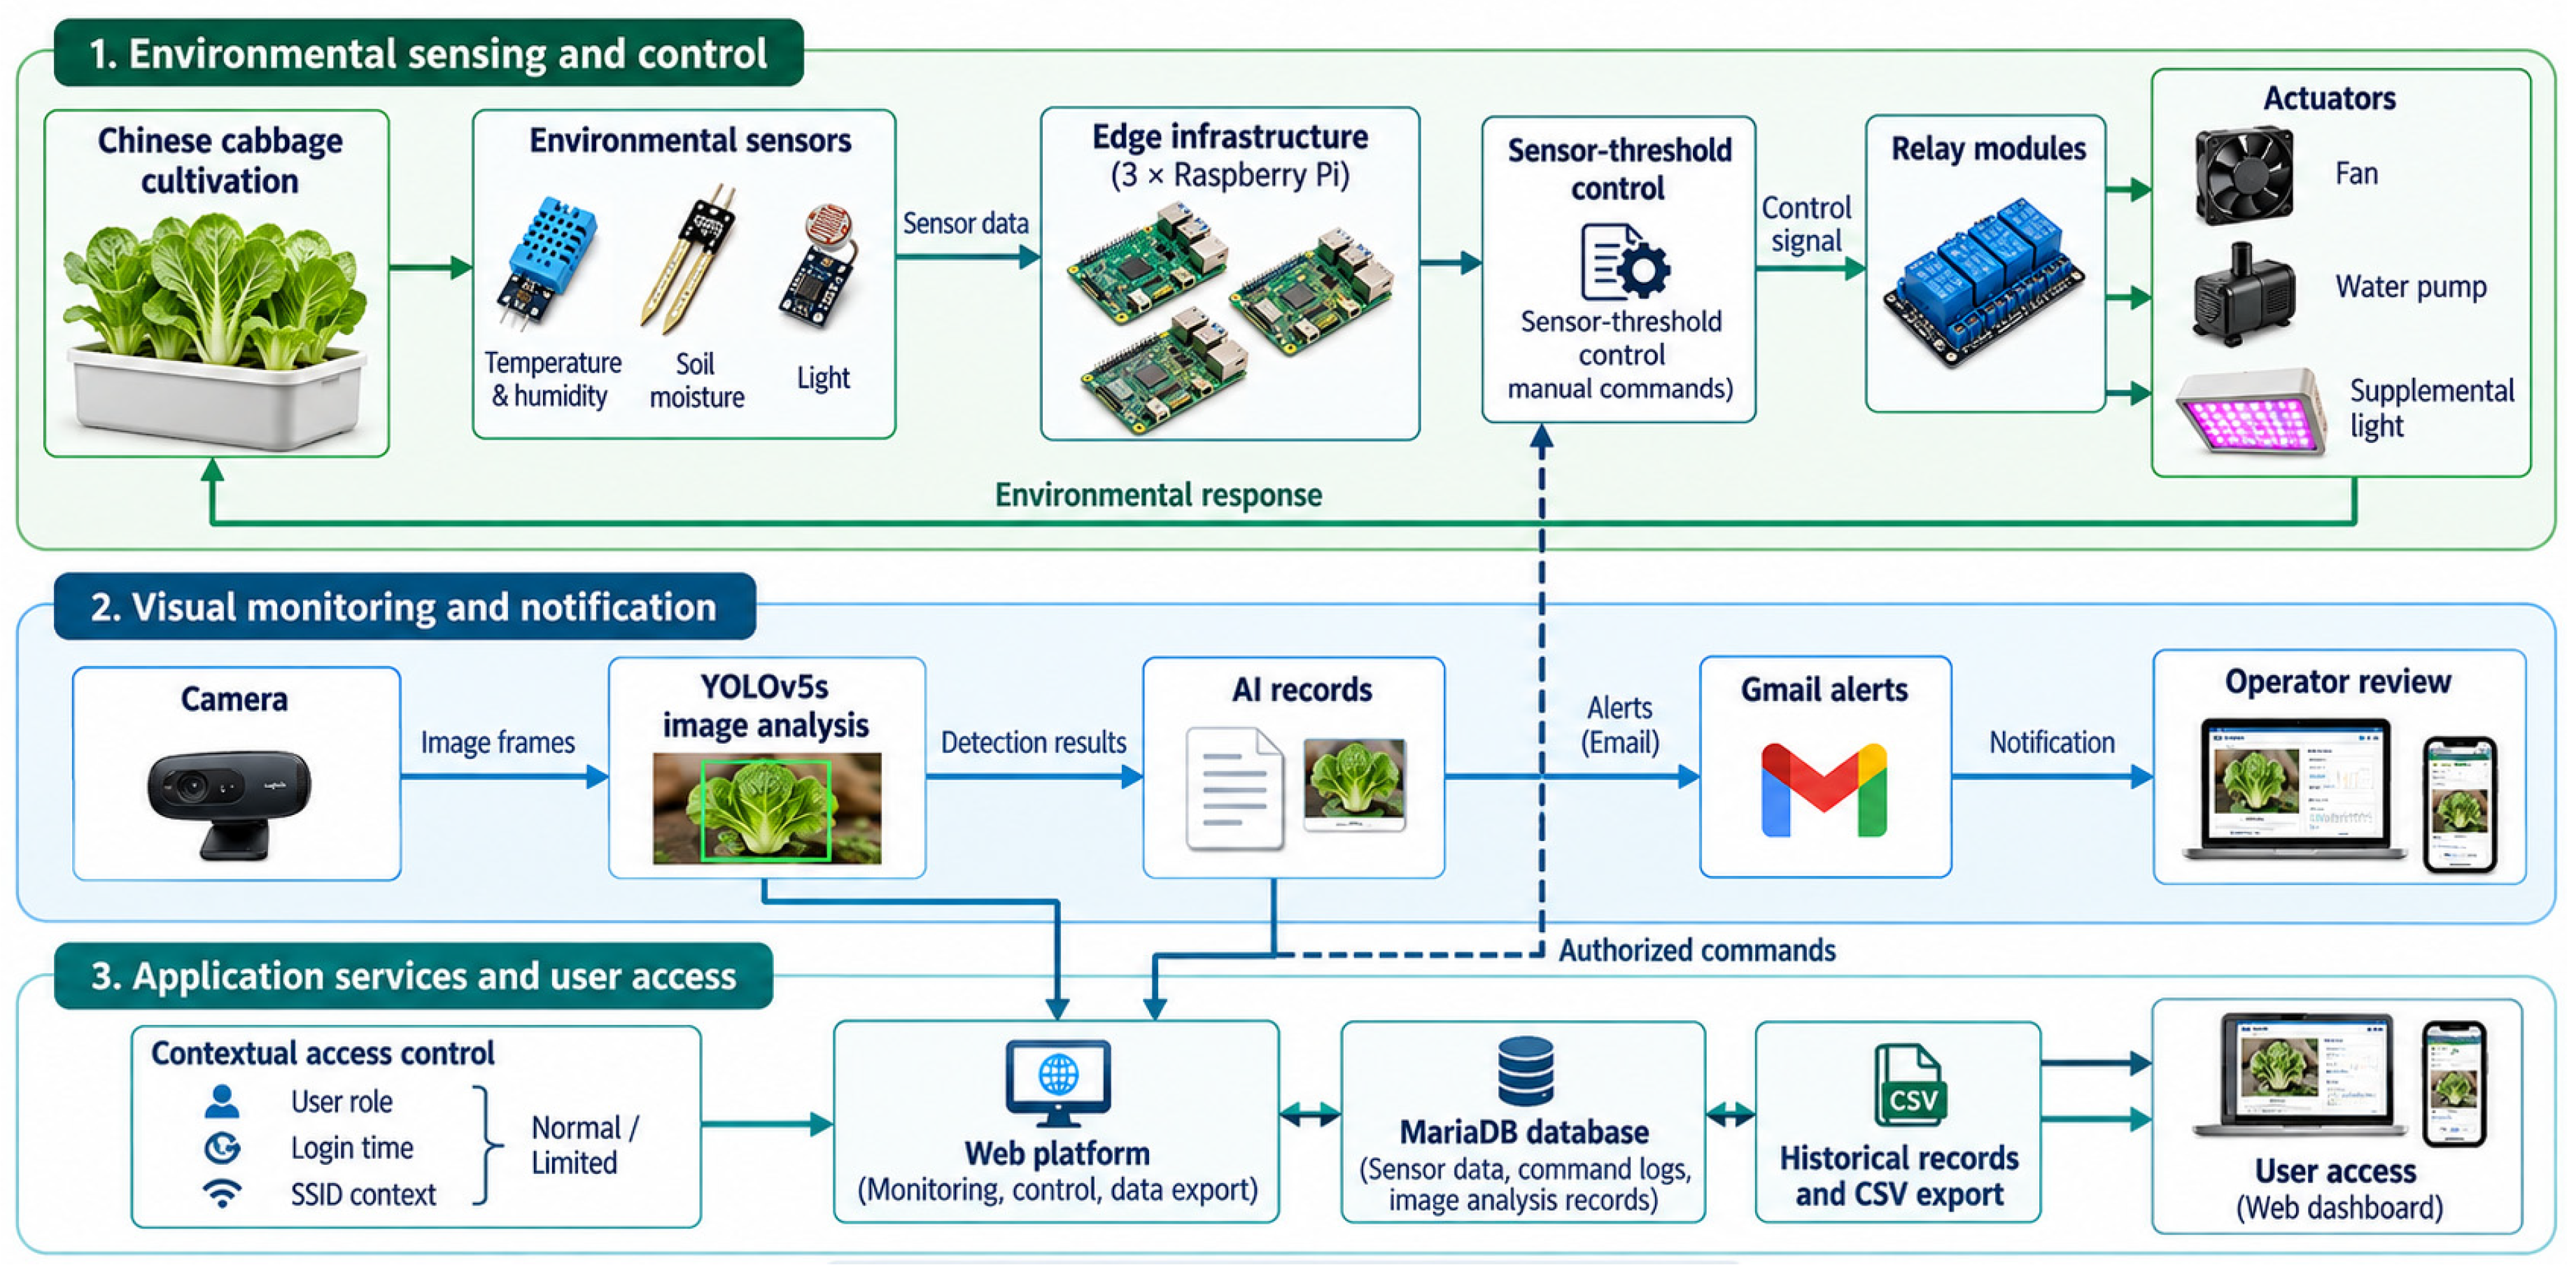
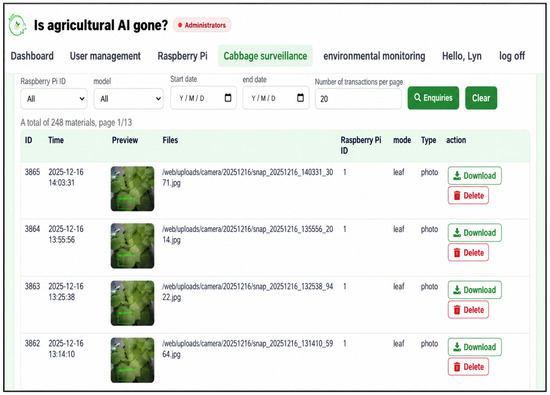
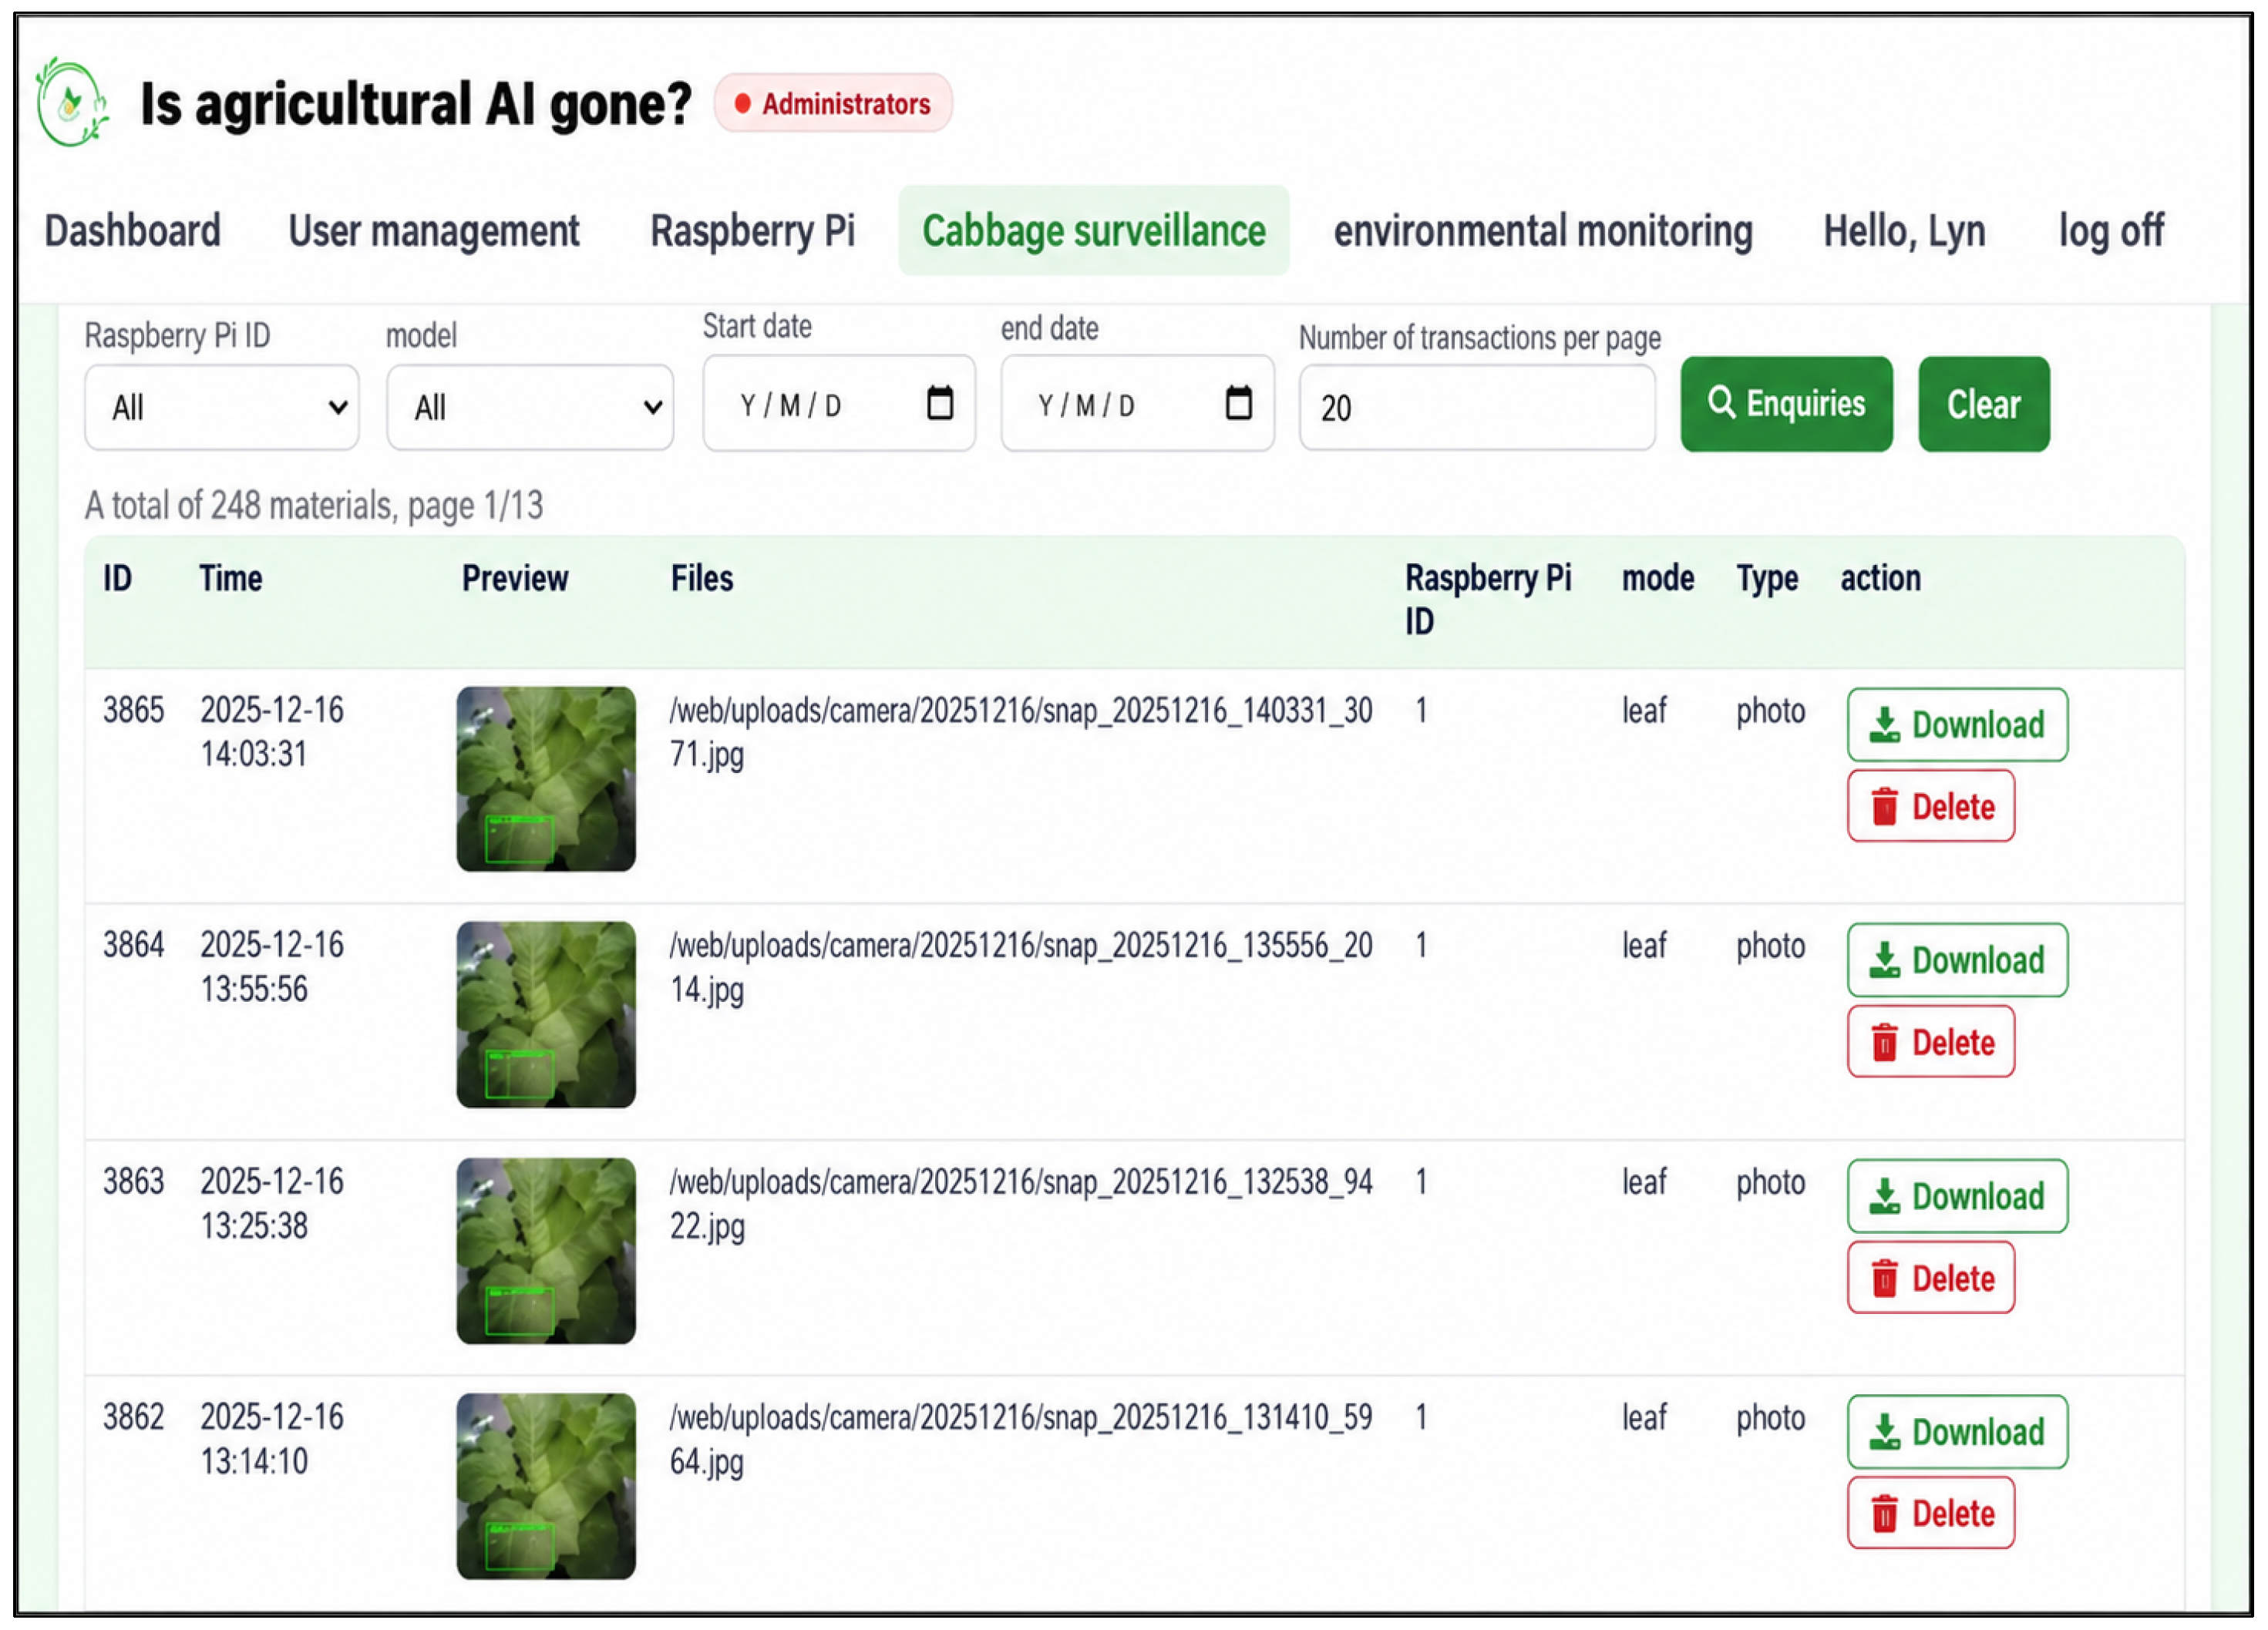
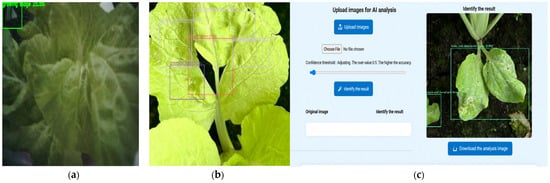
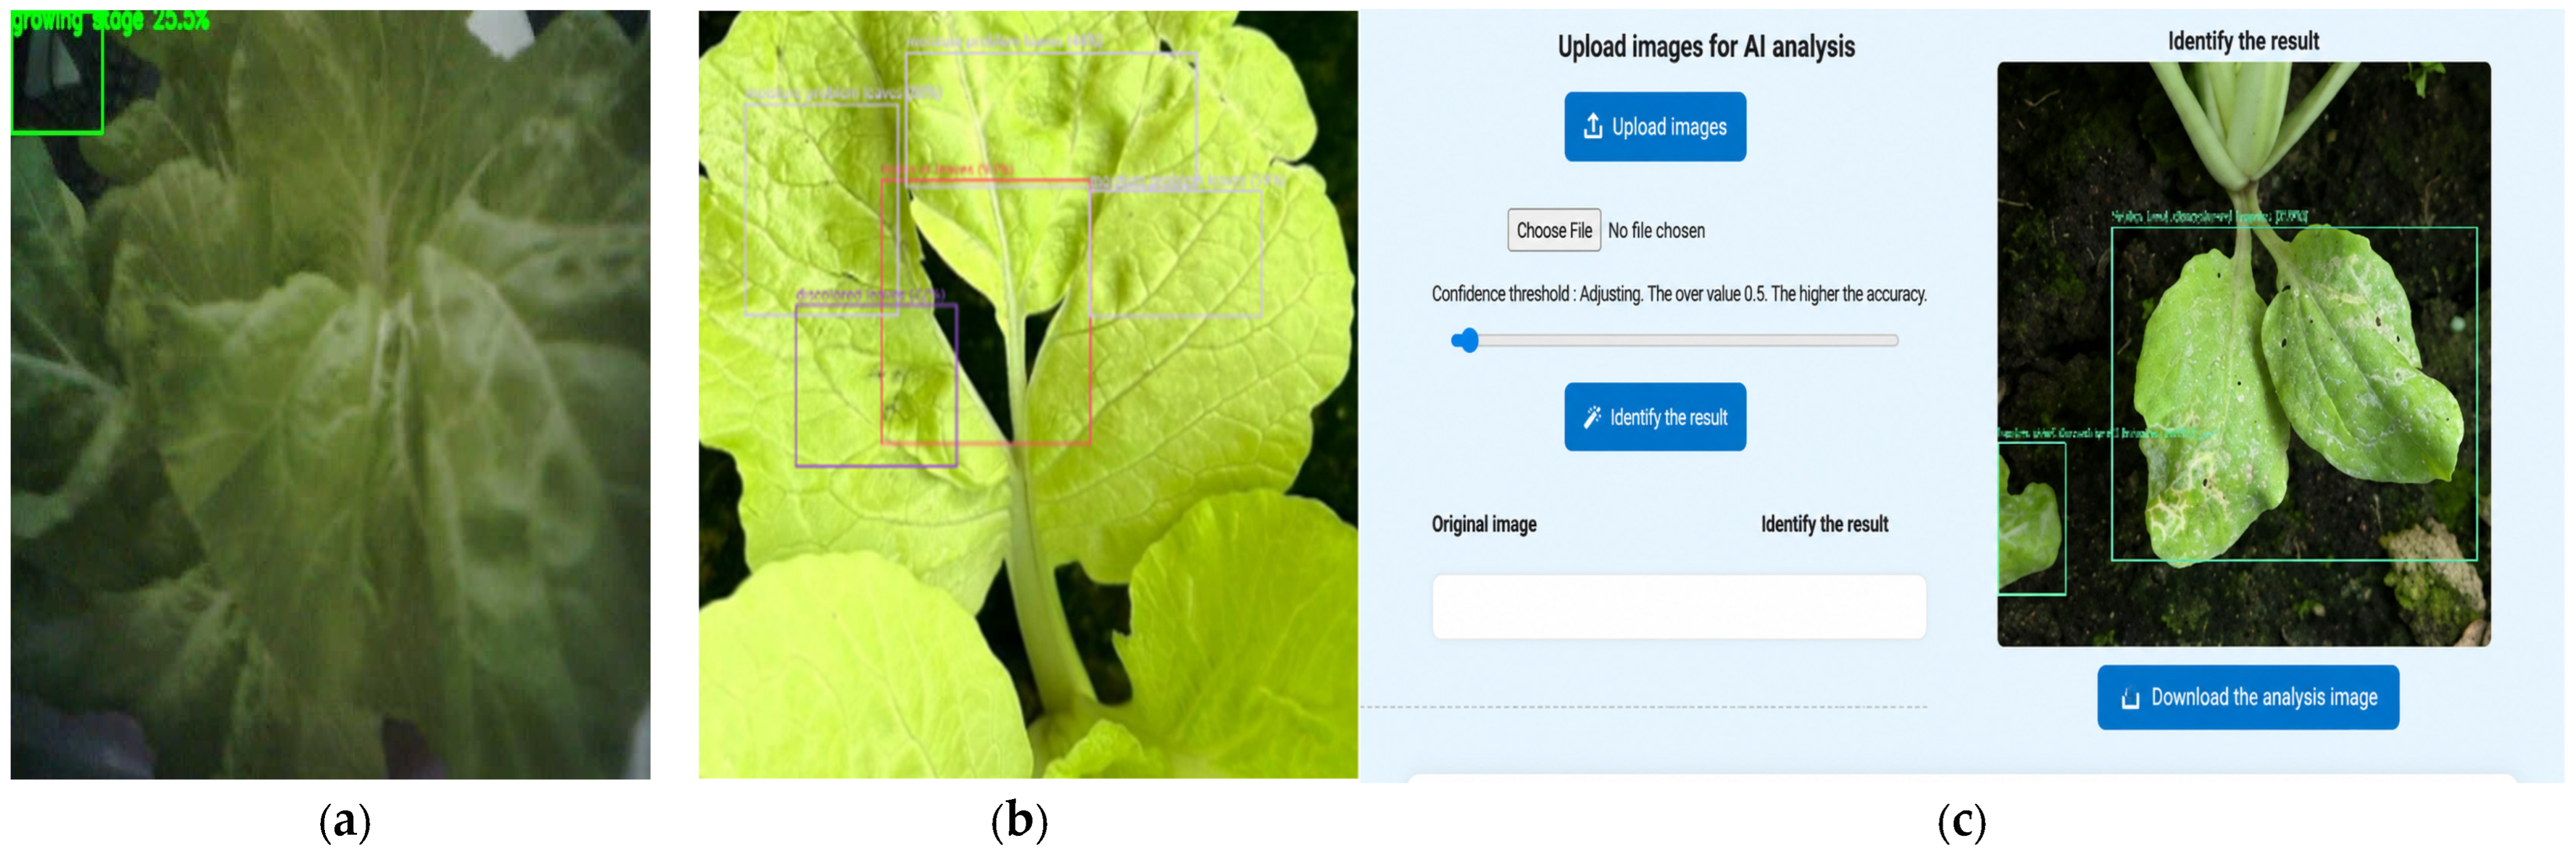
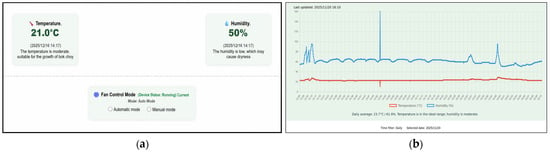
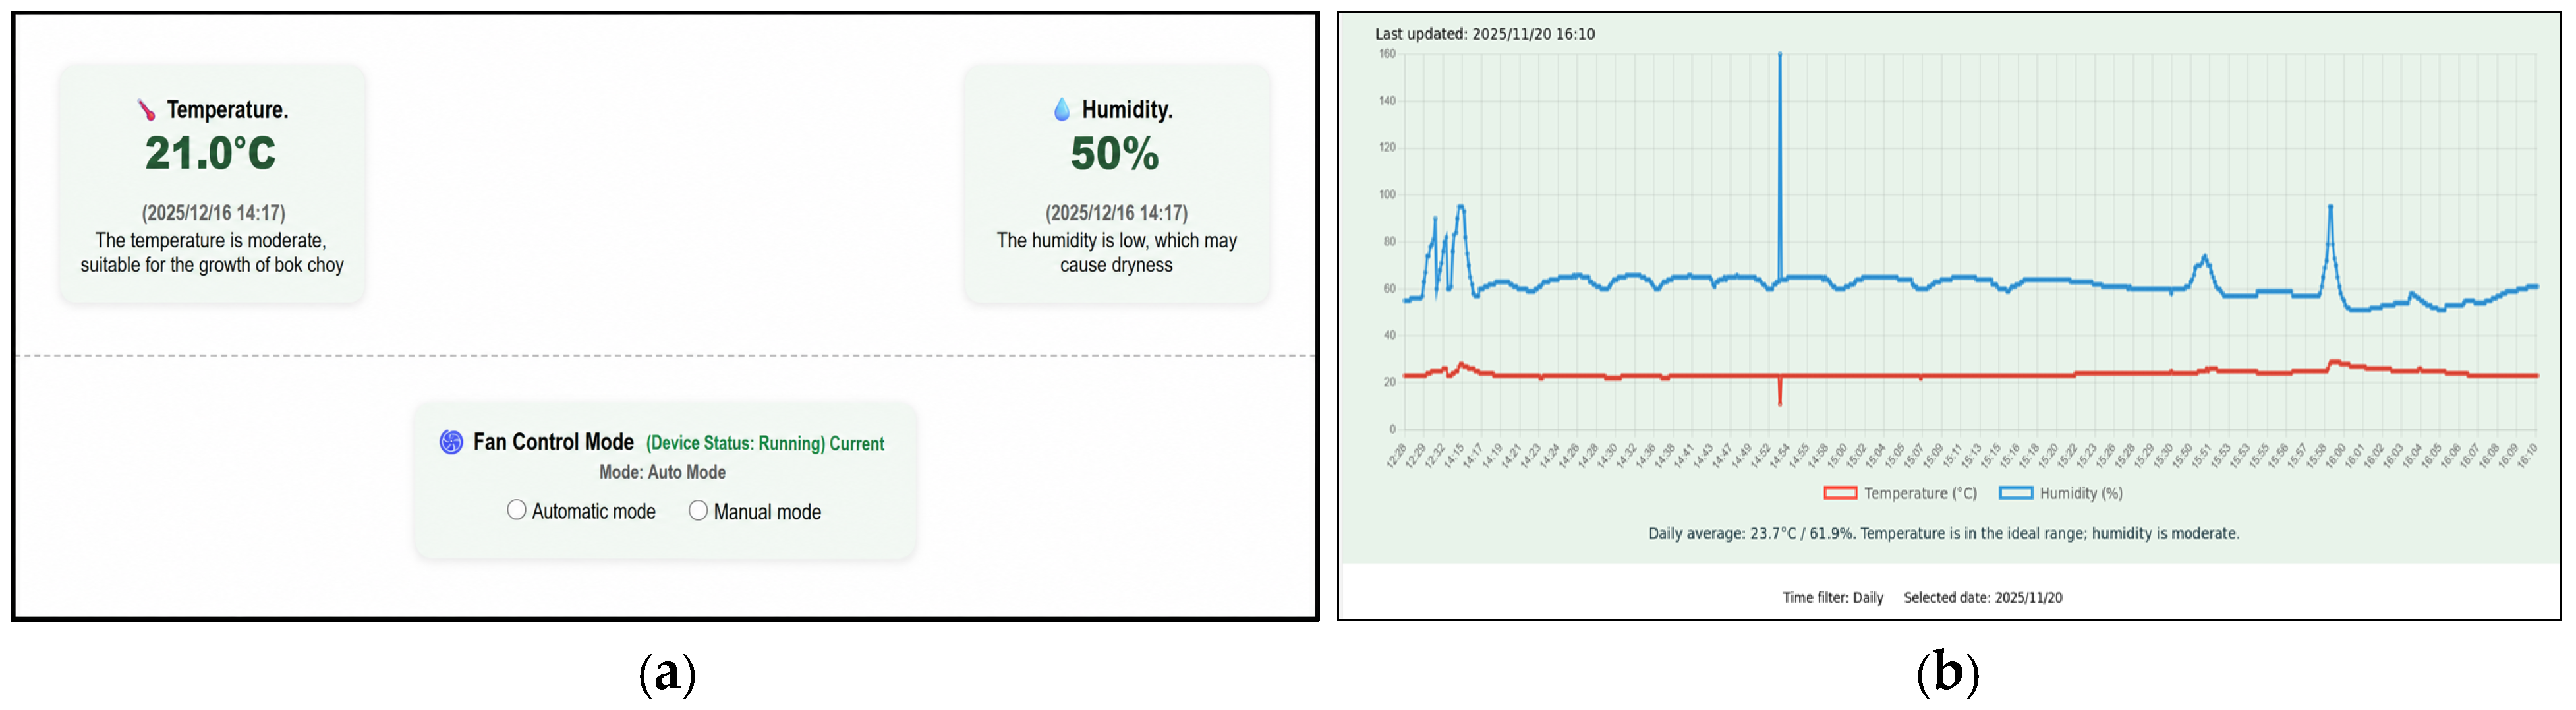

Disclaimer/Publisher’s Note: The statements, opinions and data contained in all publications are solely those of the individual author(s) and contributor(s) and not of MDPI and/or the editor(s). MDPI and/or the editor(s) disclaim responsibility for any injury to people or property resulting from any ideas, methods, instructions or products referred to in the content. |
© 2026 by the authors. Published by MDPI on behalf of the International Institute of Knowledge Innovation and Invention. Licensee MDPI, Basel, Switzerland. This article is an open access article distributed under the terms and conditions of the Creative Commons Attribution (CC BY) license.