


Abstract
Stalagmite growth rates record cave carbonate deposition and environmental change, but their climatic associations remain insufficiently tested at the global Holocene scale. We compiled 218 stalagmites from 139 caves in SISALv3, calculated mean Holocene growth rates, and matched their growth intervals to gridded paleoclimate variables. Spearman rank correlations, partial least-squares regression, and XGBoost classification were used to assess climatic associations. Growth rates ranged from 0.003 to 1.75 mm yr−1, with 75% of samples below 0.1248 mm yr−1. Annual precipitation showed a weak positive correlation with growth rate (ρ = 0.161), whereas wettest-quarter precipitation, precipitation seasonality, precipitation concentration, and wet-season precipitation ratio showed stronger correlations with growth rate (ρ = 0.288–0.306). Temperature associations were more consistent: mean annual, coldest-quarter, and wettest-quarter temperatures were positively correlated with growth rate (ρ = 0.356–0.422), while temperature seasonality was negatively correlated (ρ = −0.328). An XGBoost model using five climate variables achieved 69.32% accuracy in two-fold cross-validation. These results indicate that climate captures part of the spatial variability in stalagmite growth. Growth rates reflect the combined effects of effective recharge, thermal conditions, karst hydrology, and cave depositional environments, providing a global reference for interpreting Holocene stalagmite records.
Keywords:
Holocene; stalagmite growth rate; SISALv3; climatic associations; karst hydrology; XGBoost 1. Introduction
The Holocene is the most recent geological epoch [1]. During the Holocene, Earth’s climate experienced prolonged warm intervals, including the Holocene Thermal Maximum [2] as well as an abrupt cooling event with widespread climatic effects at 8.2 ka [3,4] and spatially and temporally heterogeneous hydroclimatic anomalies around 4.2 ka [5]. Understanding these events provides a reference for assessing future climate change. Resolving their development and regional responses requires geological records with reliable chronologies and high temporal resolution. Stalagmites are widespread in carbonate karst caves worldwide, can be dated accurately, and offer relatively continuous records with multiple hydroclimate proxies, making them important archives for paleoclimate and paleoenvironmental reconstruction [6].
Since the 1980s, advances in high-precision uranium–thorium (U–Th) dating of carbonates have established stalagmite growth rate as an important paleoclimate indicator [7,8,9]. Changes in growth rate commonly reflect changes in drip-water recharge, the supply of dissolved inorganic carbon and Ca2+, CO2 degassing, and conditions for calcite deposition [10,11,12,13]. Growth of stalagmite cessation or depositional hiatuses may indicate that the karst system could no longer sustain recharge or suitable depositional conditions [13,14,15,16]. Growth rates therefore contain substantial environmental information. In arid and semi-arid regions and at monsoon margins, growth-rate variations are closely associated with monsoon intensity and regional precipitation. Greater precipitation can increase effective surface-water infiltration and cave drip rates, thereby sustaining rapid stalagmite growth [15,17,18,19]. At high latitudes and in mountainous regions, stalagmite growth intervals correspond well to glacial–interglacial cycles: infiltration and stalagmite formation occur preferentially under relatively warm, wet conditions without permafrost [20,21,22].
The relationship between stalagmite growth rate and precipitation is not straightforward. A global comparison of 80 late Holocene stalagmites identified statistical associations with annual precipitation and temperature, but the precipitation relationship was non-monotonic. Growth rates were highest at annual precipitation of 700–2300 mm and decreased with further increases in precipitation [23]. Nicholson et al. [15] likewise found that greater annual precipitation generally increased the probability of modern speleothem deposition in Southwest Asia, while identifying no precipitation threshold that could be applied directly across the region. Stalagmite growth records a depositional response to external climate inputs filtered through the karst zone and cave system, rather than a linear substitute for a climate variable [16,24,25].
Most studies of stalagmite growth rate focus on individual caves [19], small regions [15], relatively limited compilations [23,26], or spatiotemporal variations in continental carbonate deposition [27,28], leaving global Holocene patterns insufficiently characterized. Using Holocene stalagmite records from SISALv3 and gridded paleoclimate data, we first applied Spearman rank correlation to identify associations between individual climate variables and growth rate. We then used partial least-squares regression to compare their combined contributions. Finally, we developed an XGBoost binary classifier based on climate variables and evaluated its ability to identify high-growth stalagmites using stratified two-fold cross-validation and a confusion matrix.
2. Materials and Methods
2.1. Data Collection
Stalagmite data were obtained from SISALv3 [29]. Records were selected using three criteria: (1) a stalagmite’s original growth history could extend beyond the lower boundary of the Holocene, but only valid dated horizons within 0–11.7 ka BP were retained; (2) each stalagmite had at least three valid dated horizons within the Holocene; and (3) stalagmites with excessive age reversals were excluded. Candidate dating records were sorted by increasing depth (depth_dating), and an age reversal was defined as a negative difference in uncorr_age between adjacent records. For N candidate records and k age reversals, samples were retained only if both k ≤ 1 and k/(N − 1) ≤ 0.20. The mean Holocene growth rate of each stalagmite was calculated as the ratio of cumulative depth increments to cumulative age increments across all valid intervals. This duration-weighted approach avoids giving disproportionate weight to short, densely dated intervals, as would occur with a simple arithmetic mean. It reduces biases arising from differences in sampling position and dating density, better represents overall mean growth during the study interval, and improves comparability among stalagmites. For records containing depositional hiatuses, growth rates were calculated separately for continuous growth segments and combined using segment-duration weights. Intervals spanning hiatuses were excluded; cumulative depth and time increments were derived only from valid dated intervals within continuous depositional segments.
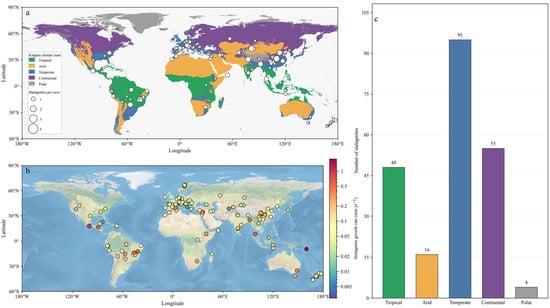
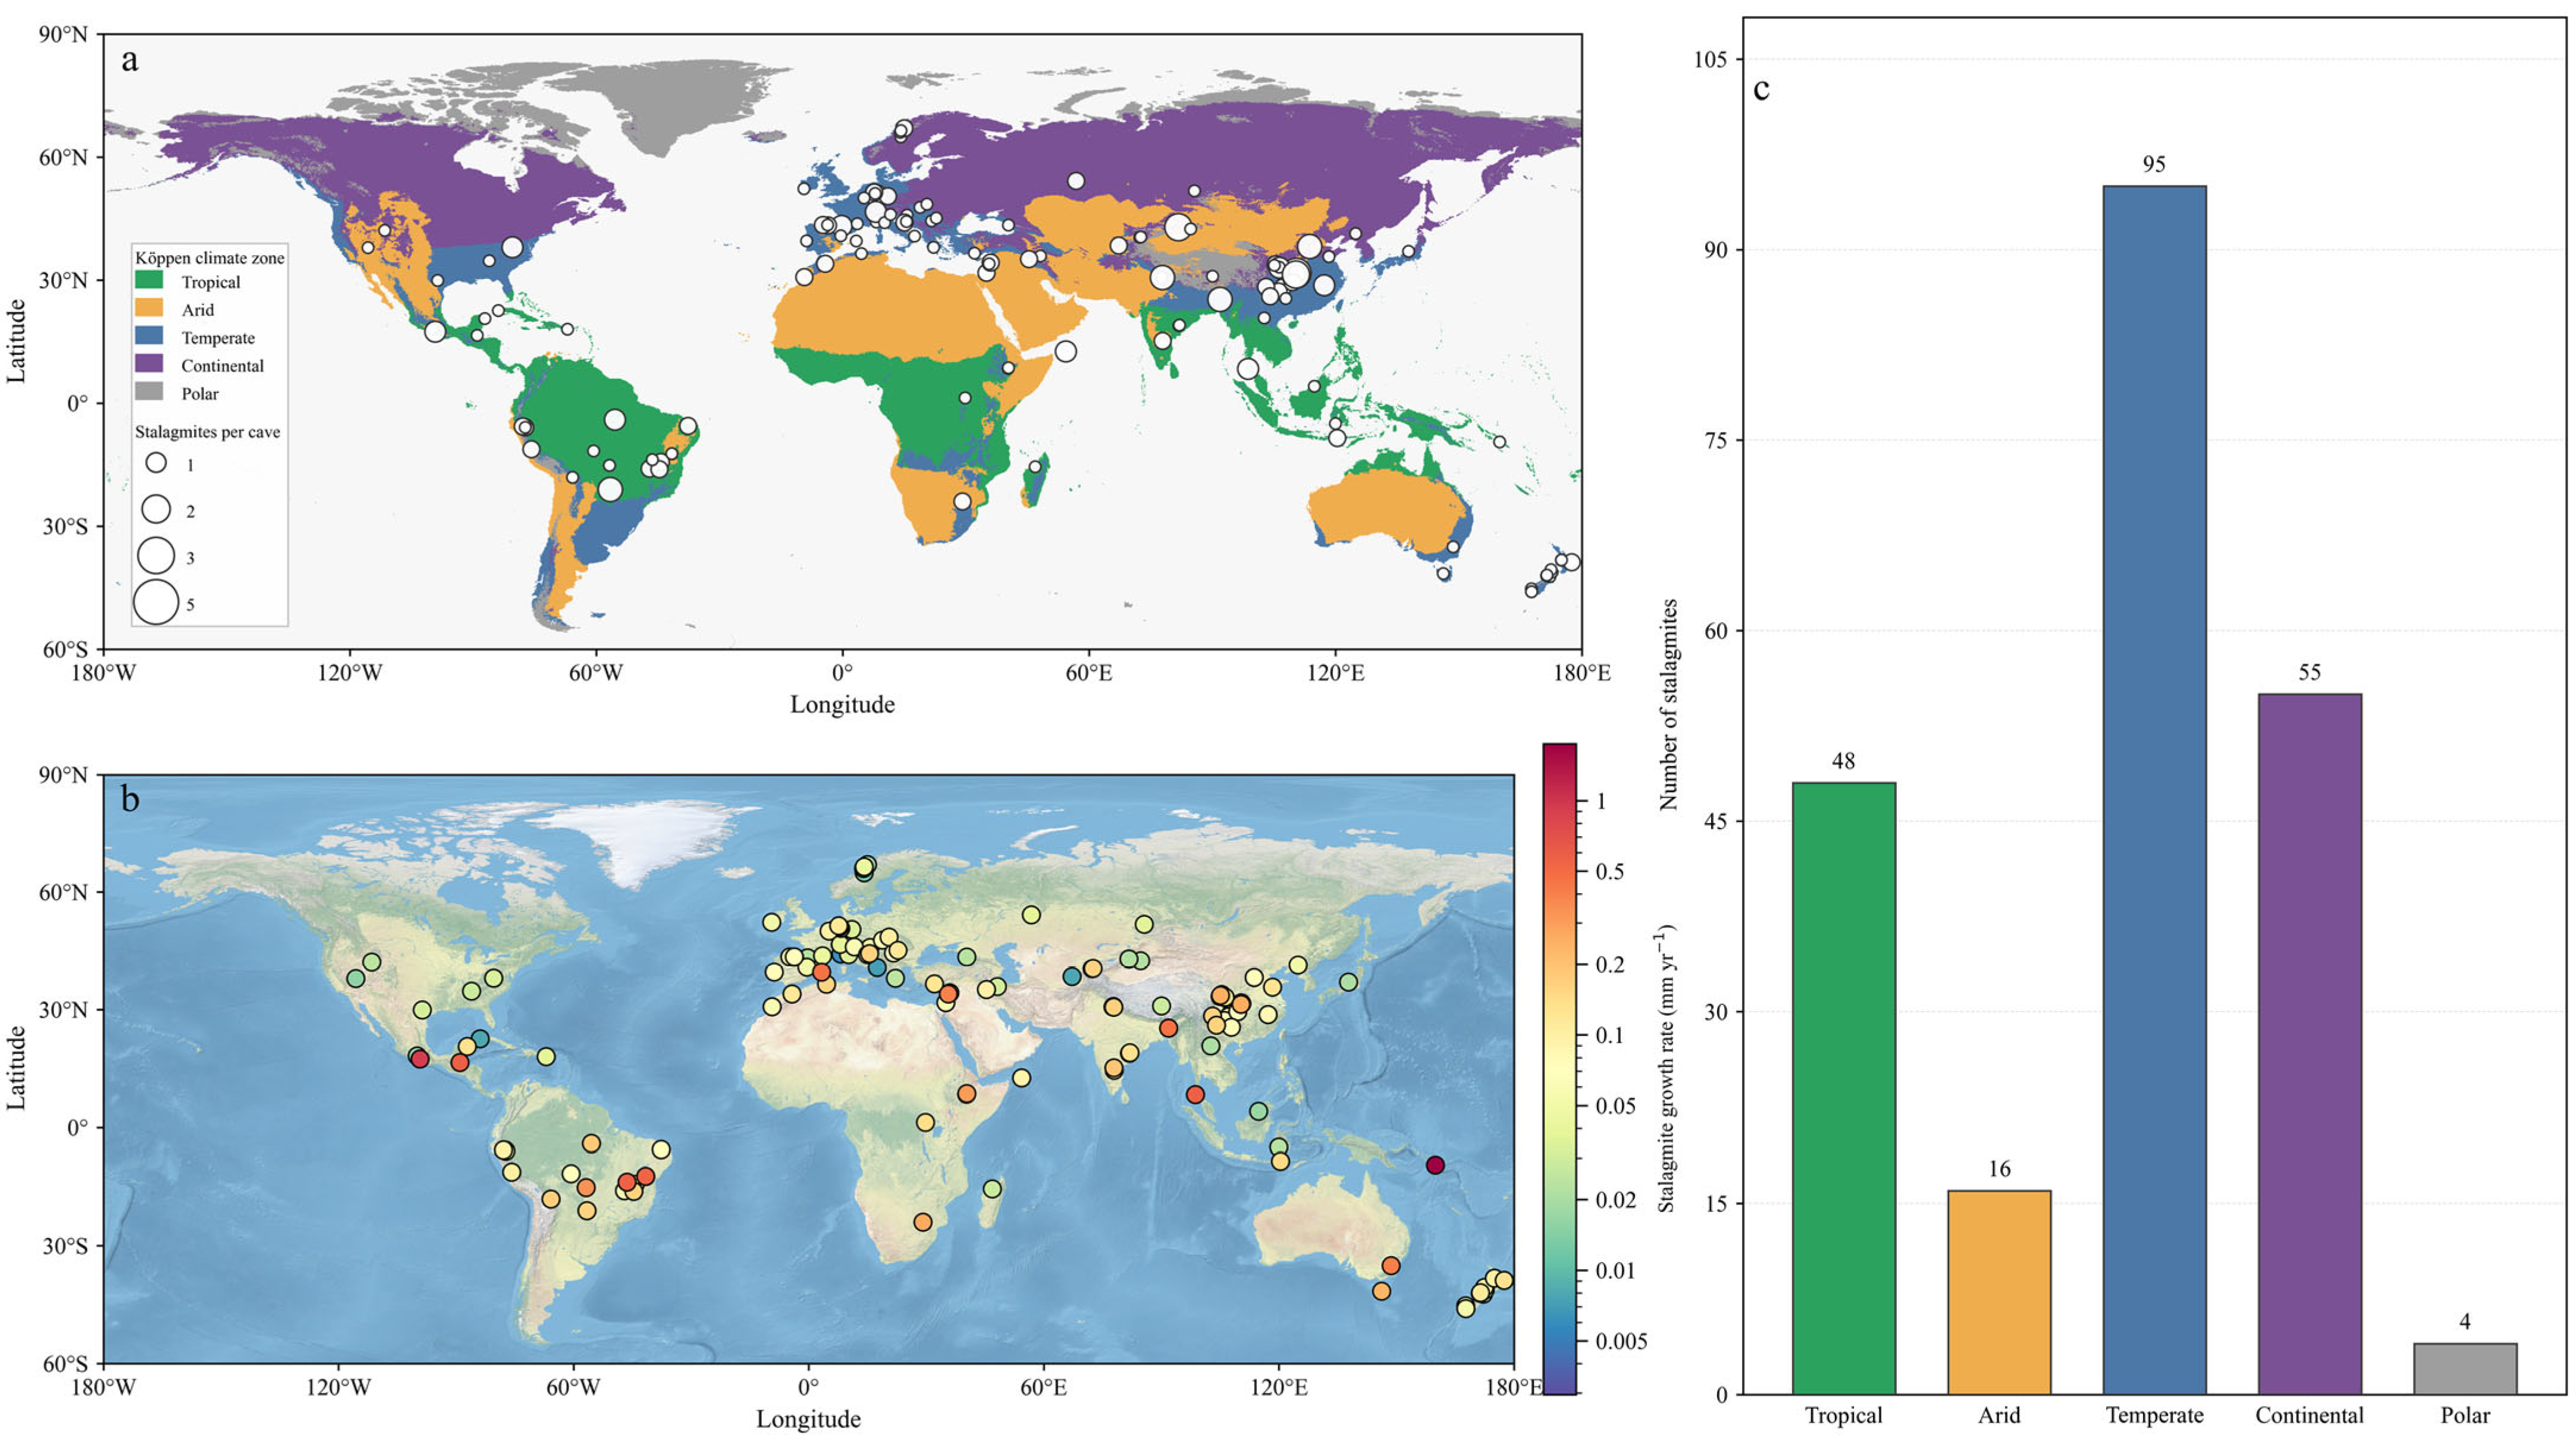
We used the global terrestrial paleoclimate dataset reconstructed by Beyer et al. [30]. This dataset combines climate-model simulations with modern observations through downscaling and bias correction to provide climate and vegetation reconstructions for the past 120 ka at 0.5° spatial resolution. It includes monthly temperature and precipitation and 17 derived bioclimatic variables [30]. Using cave coordinates from SISALv3, we extracted climate data at 1 kyr intervals and derived a total of 19 climate variables (Table 1). The compiled dataset was processed in Python 3.12.7 using NumPy 2.4.4 and pandas 3.0.0, with openpyxl 3.1.5 for reading Excel workbooks. For each stalagmite, the relevant time slices were matched to its growth interval and averaged to characterize climatic conditions during growth. The initial compilation included 219 stalagmites. PATA-1 lacked climate data and was excluded, leaving 218 stalagmites for the climate analyses. Their spatial distribution and climate-zone representation are shown in Figure 1.
Table 1.
Climate variables used in the analyses and their definitions.
Figure 1.
Spatial distribution of Holocene stalagmite growth rates and differences among climate zones. (a) Global climate zones and the number of stalagmite samples at each cave. (b) Spatial distribution of mean stalagmite growth rates. (c) Number of stalagmite samples in each climate zone. Colors in (a) denote climate zones, symbol size denotes sample count, and symbol color in (b) denotes growth rate.
2.2. Statistical Analyses
2.2.1. Spearman Rank Correlation and LOWESS
We used Spearman rank correlation to evaluate associations between stalagmite growth rate and climate variables. This method is suitable for data that may exhibit non-normal distributions, outliers, or nonlinear monotonic relationships. Spearman correlation coefficients were calculated separately for each climate variable, and significance tests were used to assess the statistical significance of the associations. Spearman coefficients were interpreted as measures of monotonic association, whereas LOWESS curves were used descriptively to explore response shapes; the reported p values apply only to the rank correlations. Spearman rank correlations and associated p values were computed using SciPy 1.15.3, and LOWESS curves were fitted using statsmodels 0.14.5. Figures were generated using Matplotlib 3.10.8.
2.2.2. Partial Least-Squares Regression
We used partial least-squares regression (PLSR) to assess the combined explanatory contributions of multiple climate variables under collinearity. PLSR and cross-validation were implemented using scikit-learn 1.7.0. Stalagmite growth rates were log-transformed, and the 19 climate variables were standardized before modeling. The number of latent components was selected by cross-validation. A variable importance in projection (VIP) score greater than 1 was used as a reference criterion for a relatively high contribution to the multivariate model.
2.3. XGBoost Classification
We used the XGBoost gradient-boosted tree algorithm [31] to evaluate relationships between climate variables and stalagmite growth rates. The classifier was fitted using the XGBoost Python package, version 3.0.5. XGBoost can represent potential nonlinear relationships and interactions among predictors, making it suitable for environmental responses influenced by multiple factors. We constructed a binary classifier to identify climatic conditions associated with high-growth stalagmites. The 80th percentile of growth rates across all samples was used as the classification threshold: samples at or above this threshold were assigned to the high-growth class, and the remainder to the non-high-growth class. Because climate variables were strongly collinear, variables with greater univariate discriminatory ability were preferentially retained. To reduce the effects of class imbalance, the non-high-growth class was randomly downsampled to match the number of high-growth samples during model training. XGBoost gain importance was used to assess the relative contribution of each climate variable to high-growth classification.
3. Results and Discussion
3.1. Overall Distribution of Stalagmite Growth Rates
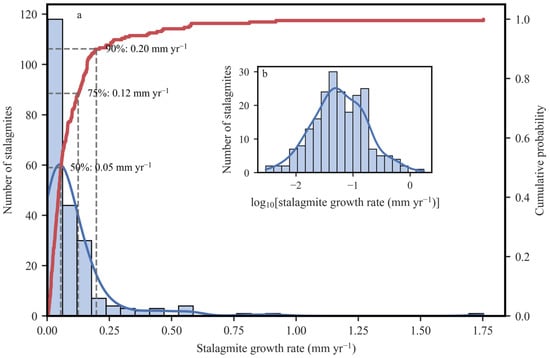
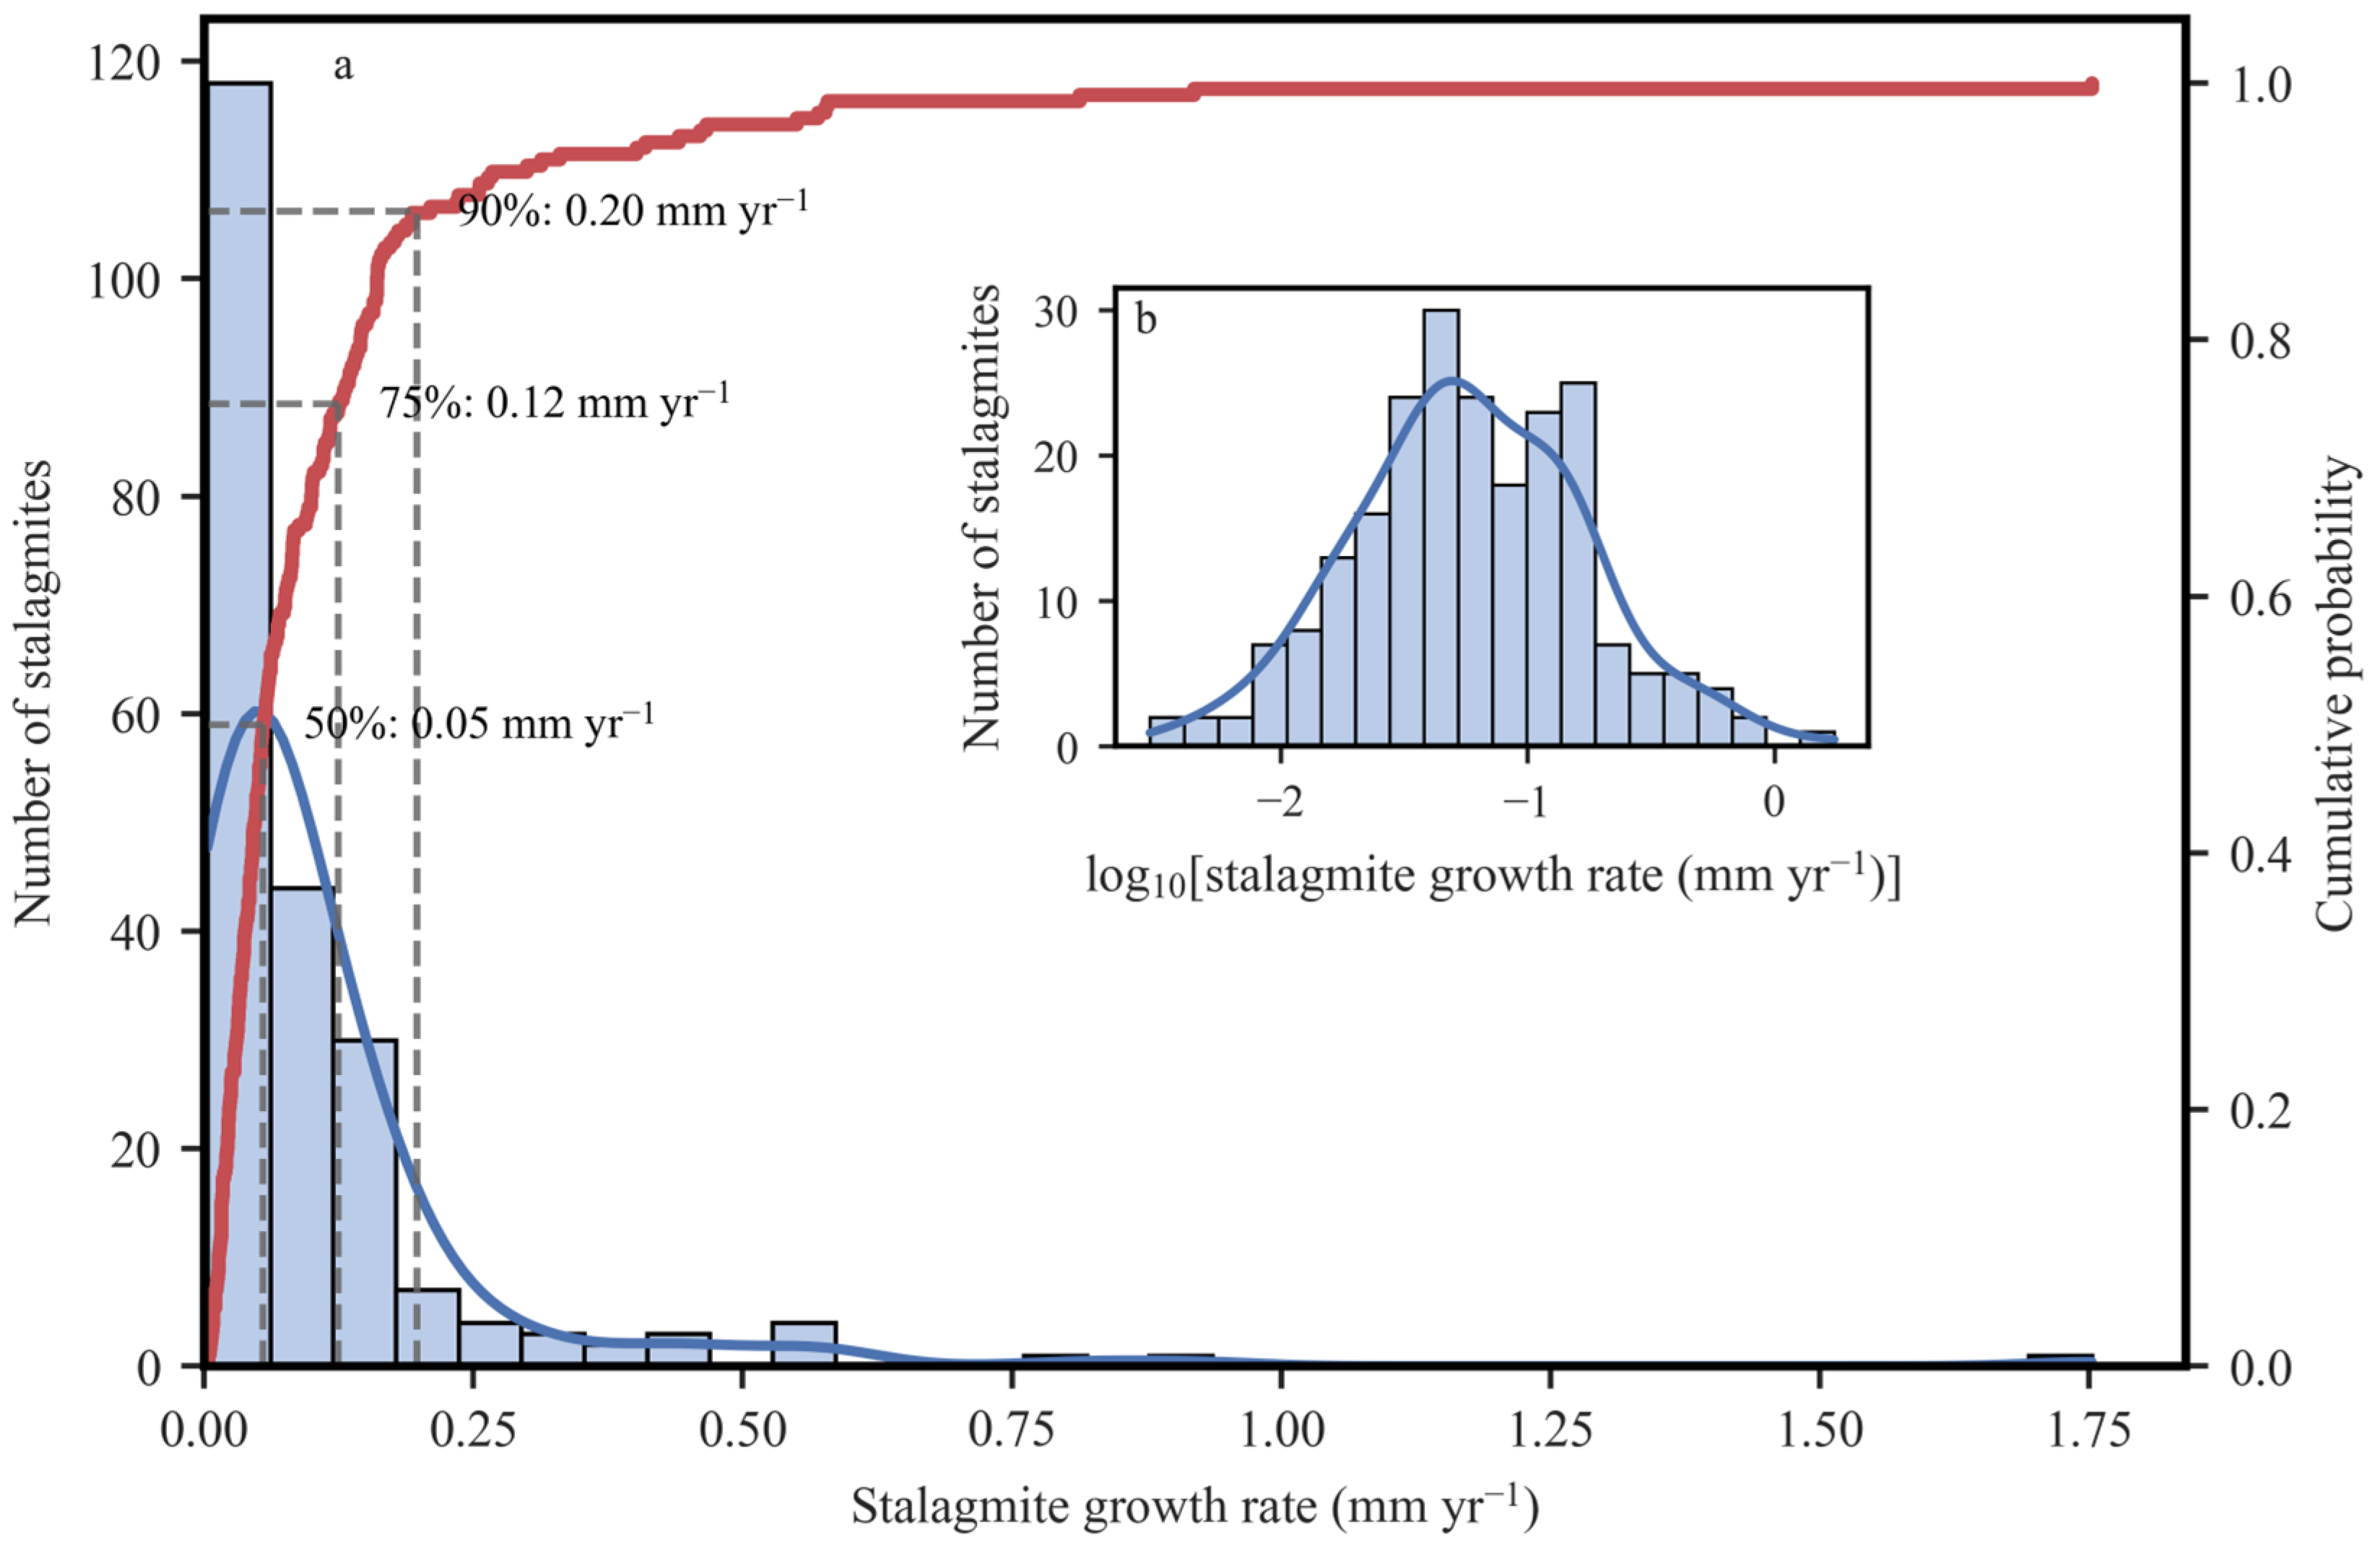
Stalagmite growth rates of the 218 Holocene stalagmites ranged from 0.003 to 1.75 mm yr−1, spanning nearly three orders of magnitude (Figure 2). The distribution was strongly concentrated at low values, with a median of 0.05 mm yr−1 and a mean of 0.11 mm yr−1. The cumulative probability curve showed that 75% of samples had growth rates below 0.1248 mm yr−1 and 90% below 0.20 mm yr−1. The Holocene stalagmite growth rates obtained in this study span a range broadly comparable to that of Railsback’s global compilation of late Holocene stalagmites (0.006–2.3 mm yr−1) [23], but most are lower than the minimum estimates of mean deposition rates for Late Pleistocene and Holocene fluvial tufas in the Mijares River valley, Spain (1–5 mm yr−1) [28]. The large dispersion highlights the complexity of stalagmite growth and warrants further analysis.
Figure 2.
Frequency distribution and cumulative probability of Holocene stalagmite growth rates. (a) Distribution of untransformed growth rates. Bars show the frequency distribution, the blue curve shows the kernel density estimate, and the red curve shows cumulative probability. Dashed lines indicate growth rates at the 50th, 75th, and 90th percentiles. (b) Inset showing the distribution of log10-transformed growth rates, with bars representing the frequency distribution and the blue curve representing the kernel density estimate.
3.2. Climatic Associations of Stalagmite Growth Rates
3.2.1. Precipitation and Stalagmite Growth Rate
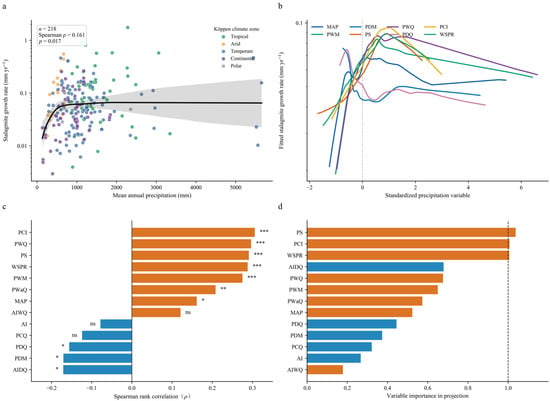
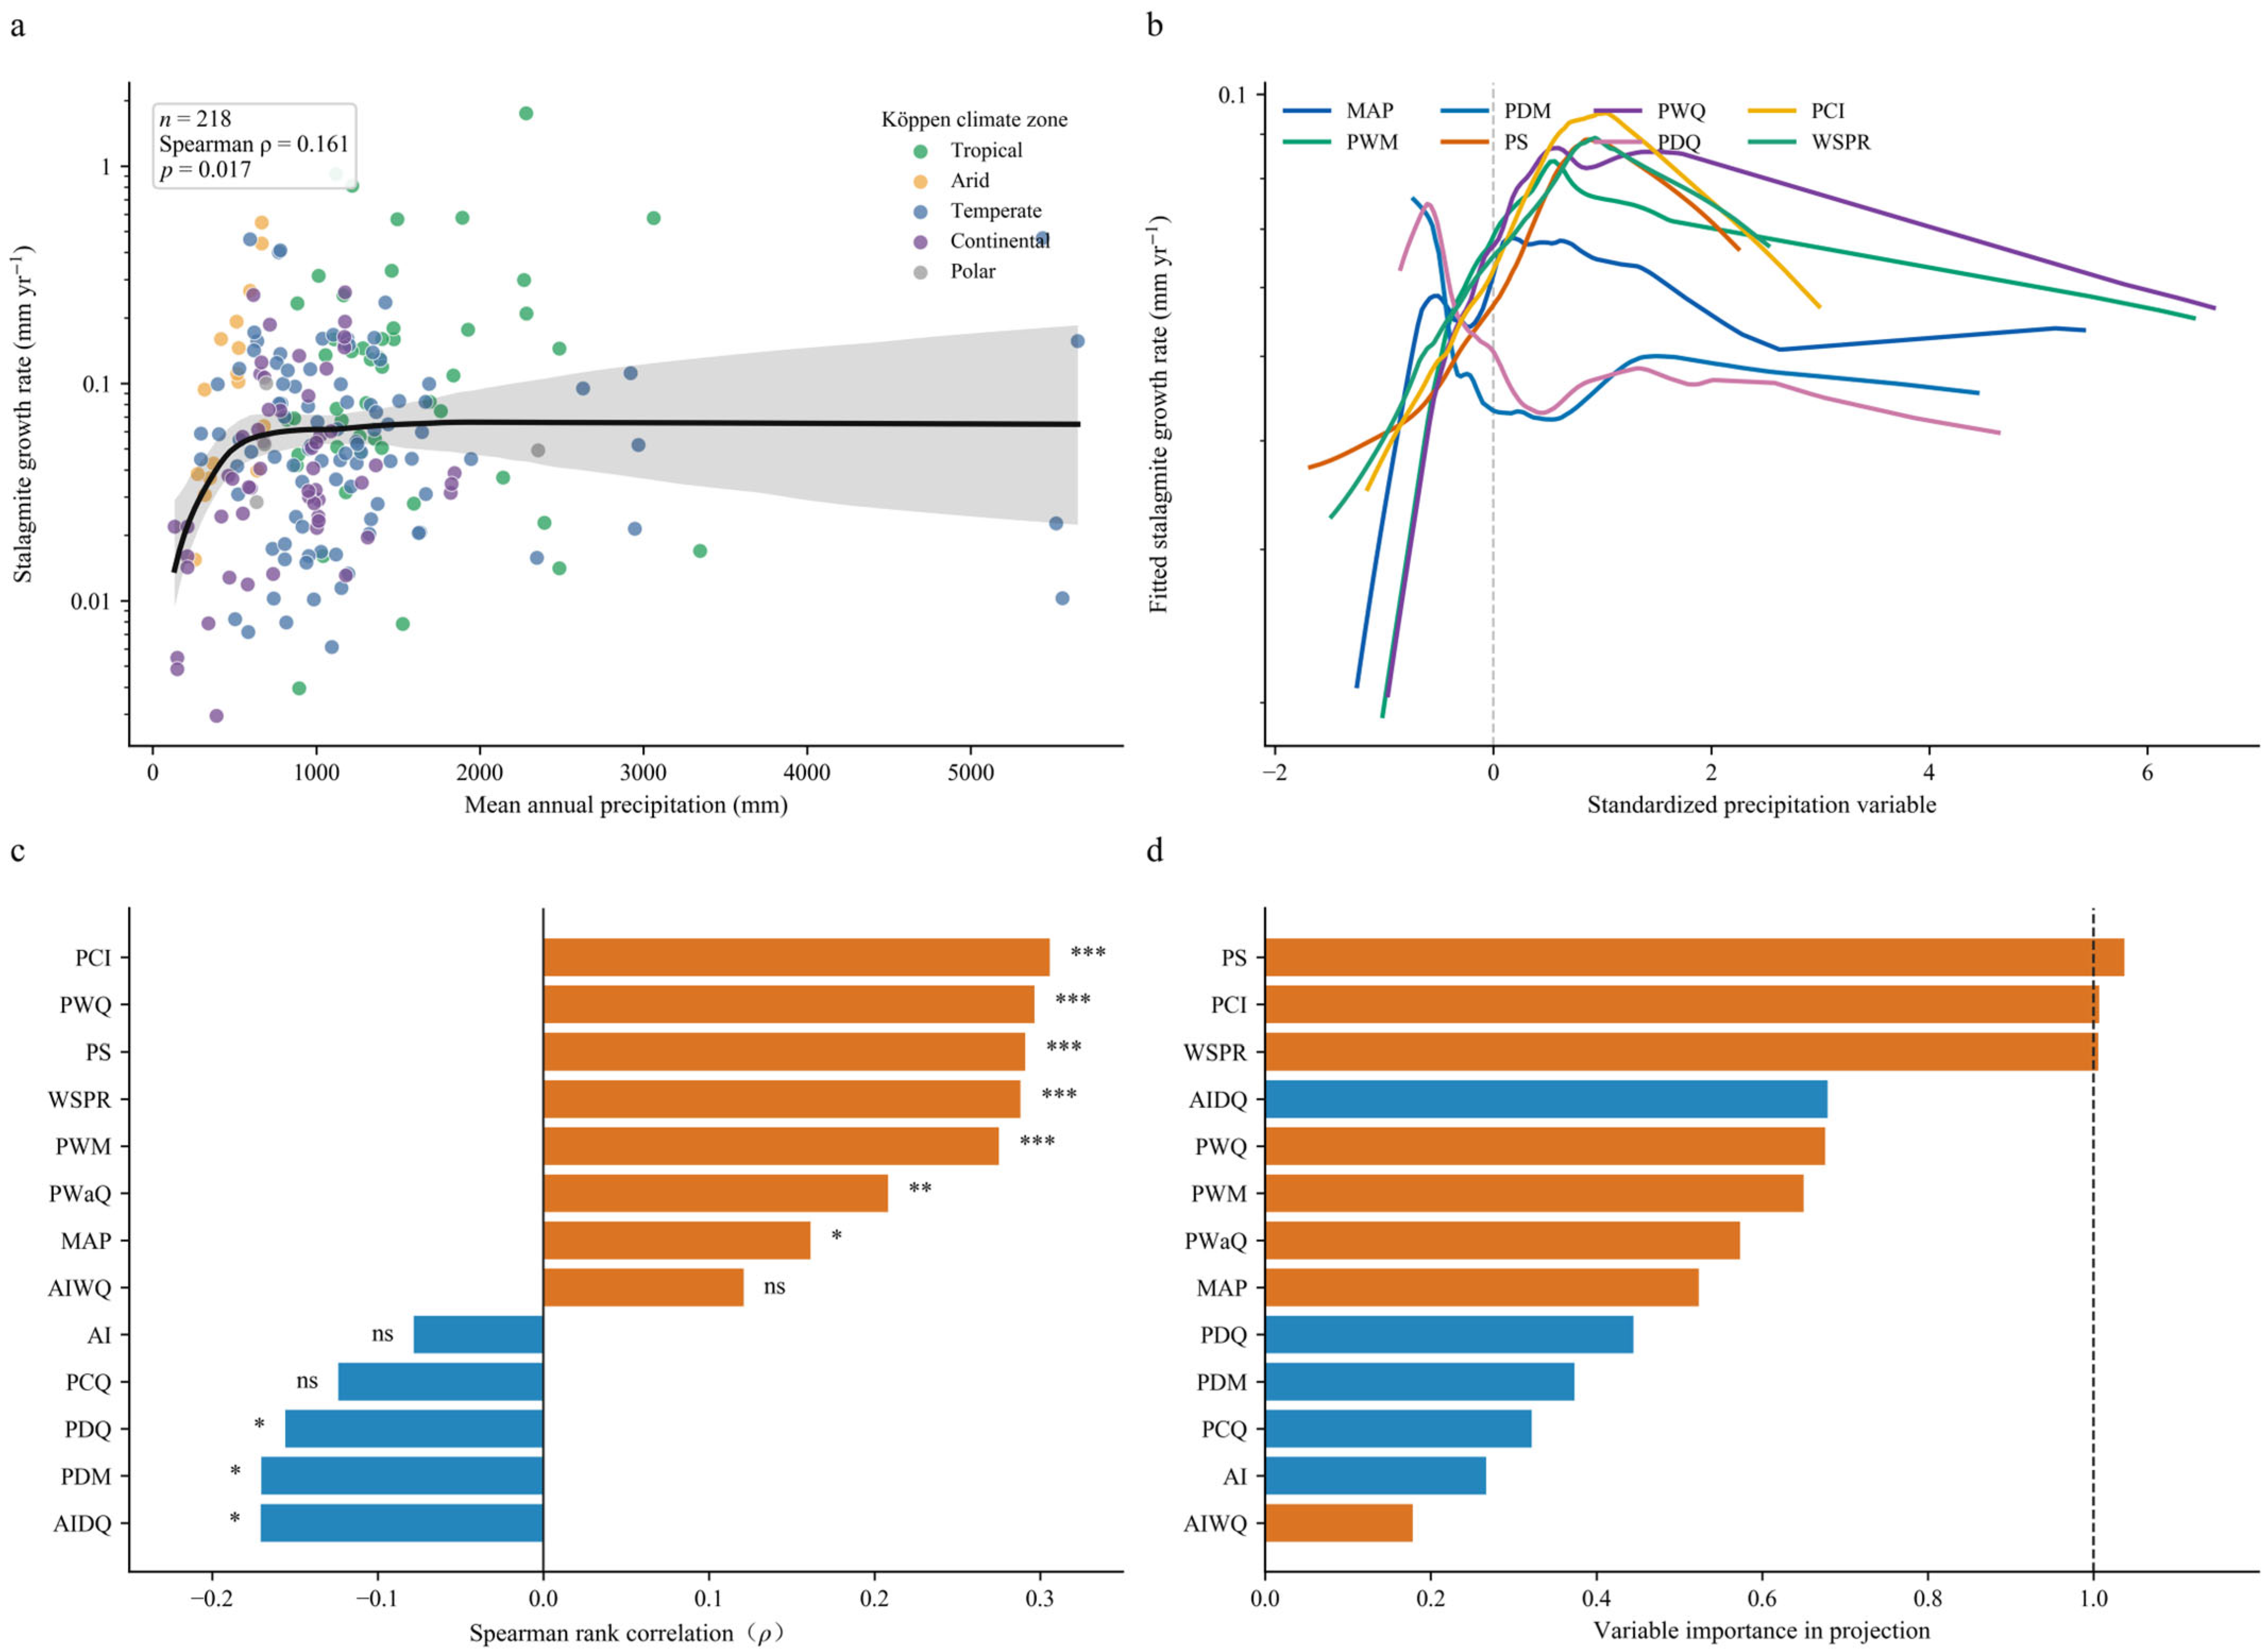
Figure 3 summarizes associations between precipitation-related variables and stalagmite growth rate. Annual precipitation showed a significant but weak positive correlation with growth rate (n = 218, ρ = 0.161, p < 0.05; Figure 3a), indicating that it provides information about moisture availability but has limited explanatory value. Growth rates were generally low where annual precipitation was below 500 mm. They increased as annual precipitation rose through approximately 500–1500 mm, then declined slightly at higher precipitation. Response curves for standardized precipitation variables supported this pattern (Figure 3b). Wettest-month precipitation, wettest-quarter precipitation, precipitation seasonality, precipitation concentration index, and wet-season precipitation ratio generally corresponded to higher fitted growth rates at moderate to relatively high standardized values, followed by plateaus or declines. Thus, seasonal precipitation distribution and concentration better characterized climates associated with high growth than annual precipitation totals. Spearman correlations (Figure 3c) were significantly positive for wettest-quarter precipitation (ρ = 0.297, p < 0.001), precipitation concentration index (ρ = 0.306, p < 0.001), precipitation seasonality (ρ = 0.291, p < 0.001), and wet-season precipitation ratio (ρ = 0.288, p < 0.001). The precipitation concentration index showed the strongest positive correlation with stalagmite growth rate among the precipitation variables (ρ = 0.306), followed by wettest-quarter precipitation (ρ = 0.297). By contrast, driest-month precipitation (ρ = −0.17, p < 0.05) and driest-quarter precipitation (ρ = −0.156, p < 0.05) were negatively correlated with growth rate. PLSR results (Figure 3d) identified precipitation seasonality (VIP = 1.037), the precipitation concentration index (VIP = 1.007) and wet-season precipitation ratio (VIP = 1.006) as the precipitation predictors with the greatest combined contributions. Overall, precipitation had a significant but limited association with growth rate, expressed primarily through wet-season inputs, seasonality, and concentration rather than annual totals.
Figure 3.
Associations between precipitation-related variables and Holocene stalagmite growth rates. (a) Annual precipitation versus growth rate; symbol colors denote climate zones, the black curve shows the LOWESS fit, and the gray shaded band shows its pointwise 95% bootstrap confidence interval. (b) Locally weighted scatterplot smoothing (LOWESS) response curves relating standardized precipitation variables to fitted growth rates. The vertical dashed line marks zero on the standardized scale. (c) Spearman rank correlation coefficients. (d) VIP scores in the PLSR model. Significance in (c): * p < 0.05; ** p < 0.01; *** p < 0.001; ns, not significant. The vertical dashed line marks the reference threshold of VIP = 1. Variable abbreviations are defined in Table 1.
Annual precipitation was significantly but weakly correlated with stalagmite growth rate (ρ = 0.161, p < 0.05), and its low PLSR importance (VIP = 0.523) indicated limited explanatory value for spatial differences in growth. Wettest-quarter precipitation, wettest-month precipitation, precipitation seasonality, precipitation concentration index, and wet-season precipitation ratio showed stronger correlations (ρ = 0.275–0.306, p < 0.001). VIP scores for precipitation seasonality, the precipitation concentration index, and the wet-season precipitation ratio were 1.037, 1.007, and 1.006, respectively, compared with 0.523 for annual precipitation (Figure 3d). These results indicate that indices describing within-year precipitation distribution contributed more to the PLSR model than annual precipitation totals. Annual precipitation can therefore be regarded as the basic moisture context for deposition, while wet-season recharge contribution and precipitation concentration provide more informative indicators of Holocene growth-rate differences.
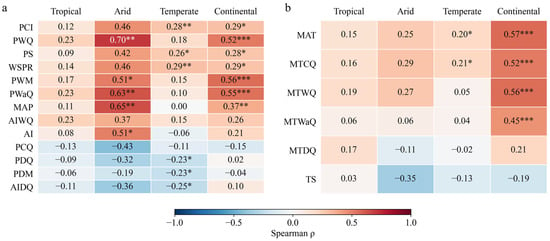
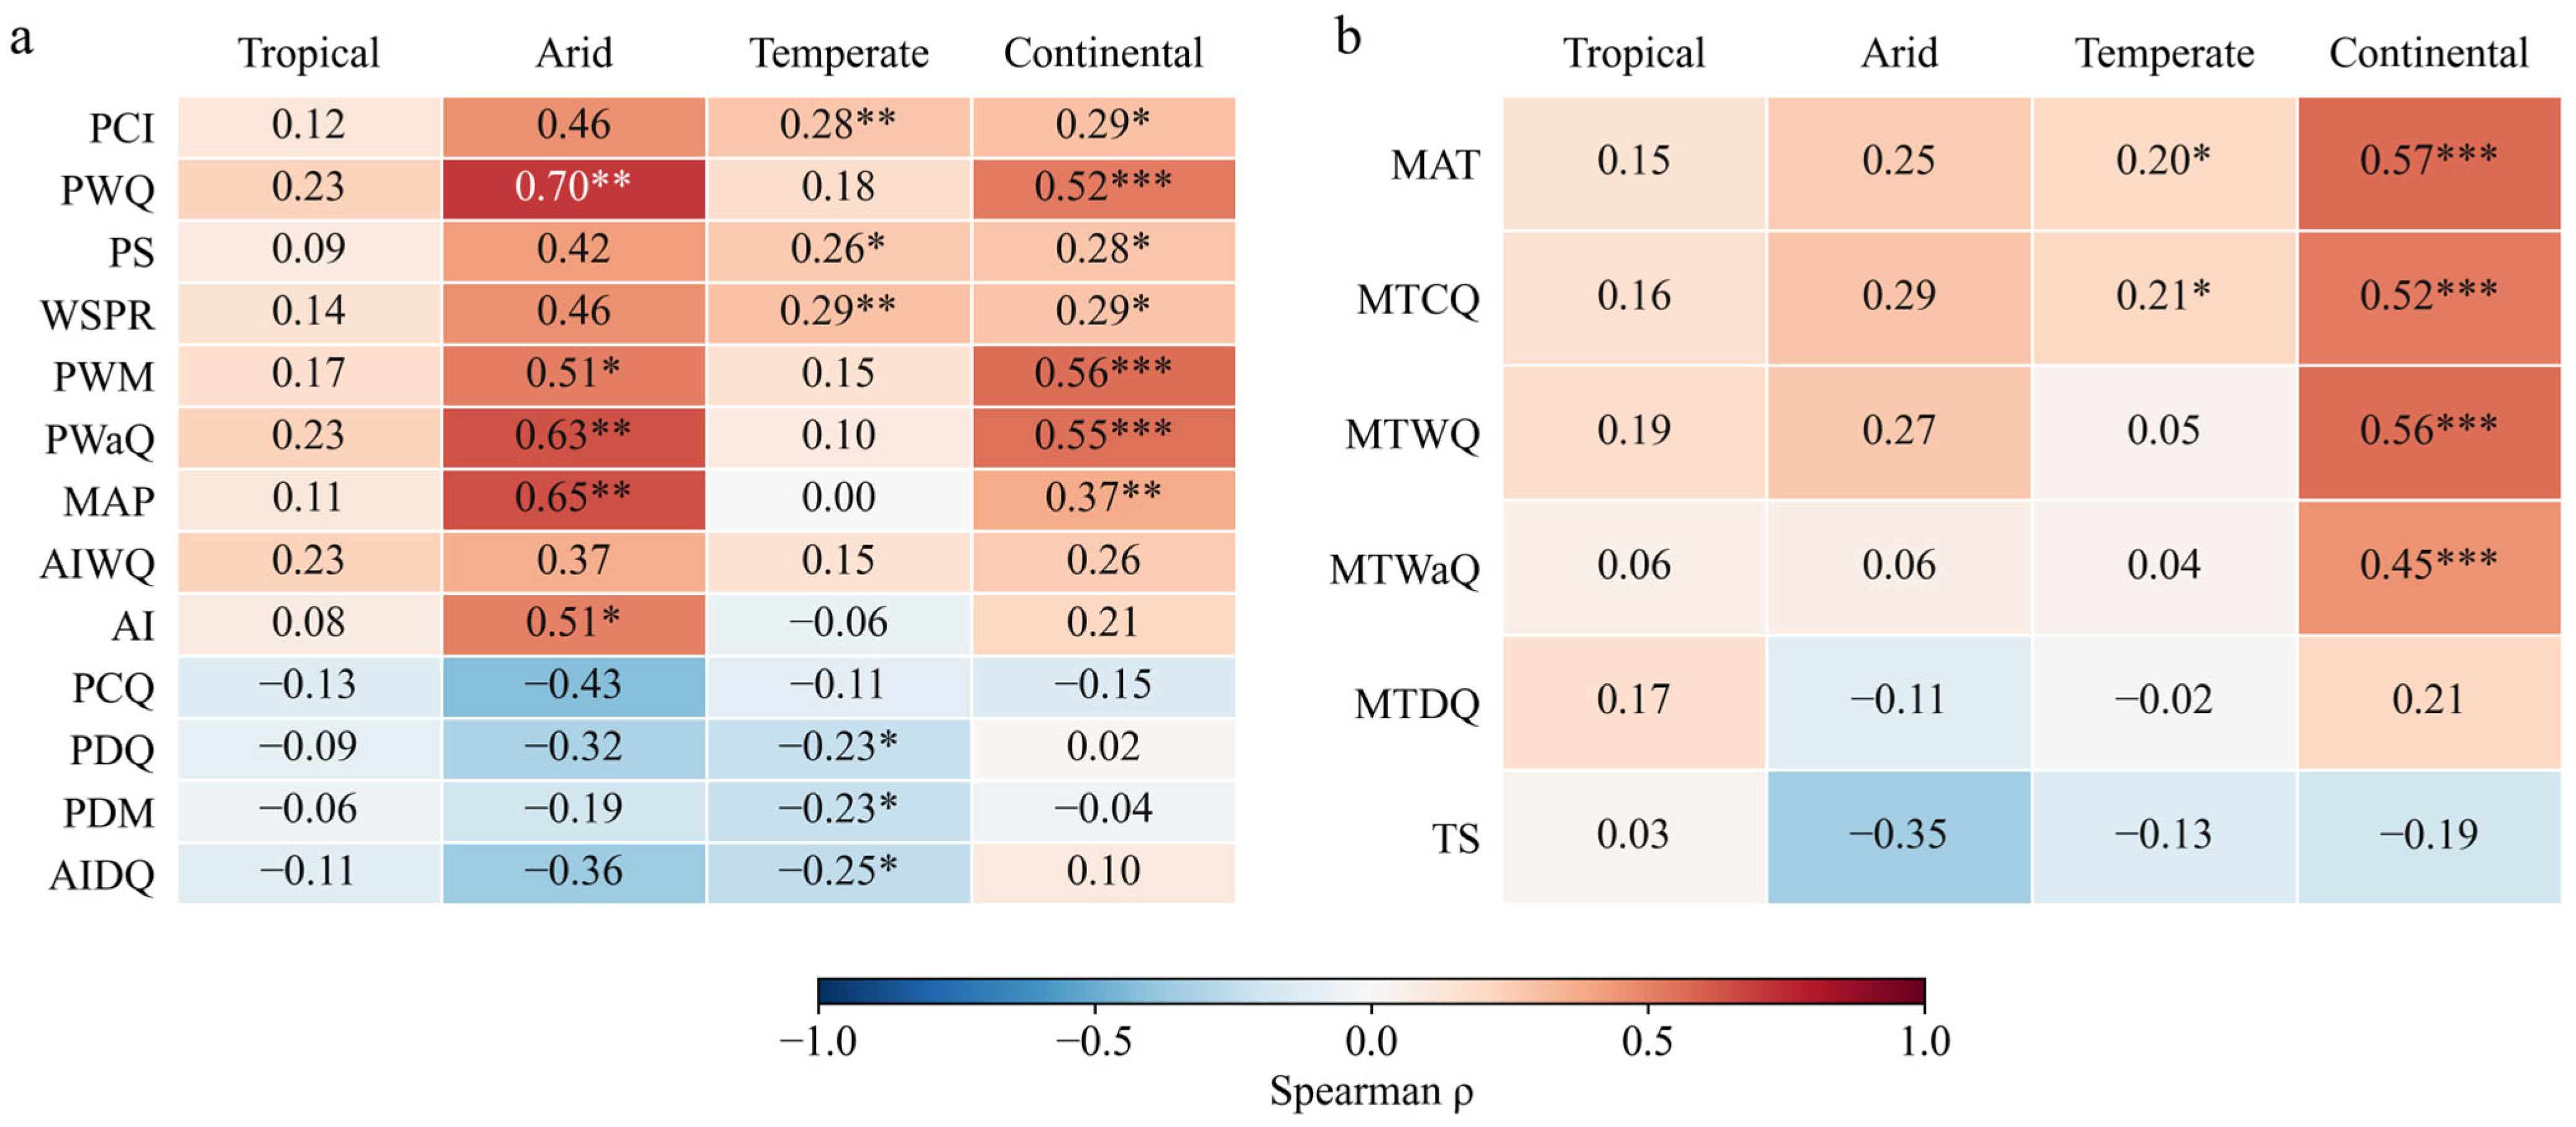
Comparisons among climate zones provide further context for the associations between stalagmite growth rates and precipitation variables (Figure 4a). In arid climates, annual, wettest-quarter and warmest-quarter precipitation showed relatively strong positive correlations with growth rates (ρ = 0.65, 0.70 and 0.63, respectively). In continental climates, positive correlations were more pronounced for wettest-month, wettest-quarter and warmest-quarter precipitation (ρ = 0.56, 0.52 and 0.55, respectively), whereas the association with annual precipitation was weaker (ρ = 0.37). In temperate climates, the correlation with annual precipitation was close to zero, while precipitation seasonality, precipitation concentration and the wet-season precipitation ratio showed weak positive correlations (ρ = 0.26–0.29). Driest-month and driest-quarter precipitation showed weak negative correlations (both ρ ≈ −0.23). By comparison, correlations with precipitation indicators in tropical climates were generally weak, and none reached statistical significance. These results indicate that associations between stalagmite growth rates and precipitation conditions vary with climatic background.
Figure 4.
Spearman correlations between Holocene stalagmite growth rates and climate variables across four Köppen climate zones. (a) Precipitation-related variables. (b) Temperature-related variables. From left to right, the columns represent tropical, arid, temperate, and continental climates. Cell values show Spearman’s ρ, with red indicating positive correlations and blue indicating negative correlations. Asterisks indicate significance levels (* p < 0.05, ** p < 0.01, *** p < 0.001). Variable abbreviations are defined in Table 1. The polar climate zone was excluded from this analysis because of its small sample size.
Precipitation affects stalagmite growth through infiltration recharge, water–rock interaction, and calcite precipitation within caves. Infiltrating water must acquire sufficient CO2, Ca2+, and HCO3− in the soil and overlying rock, then become supersaturated with carbonate through CO2 degassing after entering the cave before calcite can be deposited [32,33]. Under moisture limitation, increased precipitation generally promotes infiltration and faster dripping, favoring stalagmite growth. Consistent with this expectation, wettest-quarter precipitation and wet-season precipitation ratio showed stronger positive correlations with growth than annual precipitation. However, intense or prolonged precipitation may enter caves through rapid fracture or conduit flow, shortening contact with soil and carbonate bedrock and potentially lowering Ca2+ and HCO3− concentrations. This may weaken the growth-promoting effect of additional precipitation. The nonlinear precipitation responses, weak negative correlations with driest-month and driest-quarter precipitation, and low PLSR contribution of annual precipitation jointly suggest that rapid growth does not simply require year-round wetness or greater annual precipitation. It may depend more on seasonal precipitation distribution and the capacity of the soil–karst system to store and regulate water inputs.
Cave monitoring reveals storage, mixing, and lag effects as external precipitation becomes drip-water recharge. Precipitation and drip-water monitoring at multiple caves in China’s monsoon regions showed that seasonal rainfall signals are substantially modified by epikarst storage, mixing, and delayed transmission. Drip water does not always respond immediately or proportionally to external rainfall changes [34]. Similarly, three years of monitoring at Heshang Cave, Hubei, recorded rapid increases in drip rate during years of strong summer-monsoon rainfall, whereas these peaks were less evident in years with weaker summer rainfall. This indicates threshold behavior influenced particularly by concentrated rainfall early in the monsoon season and by antecedent karst storage [35]. Long-term monitoring at Río Secreto Cave on the Yucatán Peninsula likewise showed that some drips retained rainfall isotope signals well, while many exhibited substantially attenuated seasonal amplitudes, reflecting integration by karst reservoirs and complex flow path [24]. Together with our statistical results, these observations suggest that growth rates should be interpreted as depositional responses shaped by seasonal precipitation distribution, karst storage, and drip-water recharge rather than as linear records of annual precipitation.
Monitoring across different climates further shows that recharge pathways and internal cave processes modify drip-water chemistry and deposition efficiency. Long-term monitoring at Golgotha Cave, Australia, demonstrated that ventilation, drip rate, and prior calcite precipitation substantially altered drip-water Ca, alkalinity, and saturation state. Low-flow drips were more susceptible to prior calcite precipitation, whereas faster drips could retain weaker water–rock interaction signal [36,37]. Spatially dense monitoring at Wellington Caves in southeastern Australia identified rapid, delayed, and weak rainfall responses among drips within the same cave, demonstrating that fractures, pores, and storage units create substantial spatial differences in recharge [38]. At Père Noël Cave and Obir Caves in Europe, drip rates, cave-air pCO2, and ventilation were strongly seasonal and influenced electrical conductivity, calcite precipitation, and trace-element composition [39,40]. Because these karst processes are difficult to characterize directly, precipitation variables identify broad climatic associations but cannot fully explain differences caused by internal hydrological and depositional processes.
Global and regional studies also support the absence of a stable monotonic relationship between annual precipitation and stalagmite growth rate (Table 2). The comparison by Railsback [23] of late Holocene stalagmites found that higher growth rates occurred preferentially at intermediate precipitation levels rather than increasing continuously with annual precipitation. The study by Nicholson et al. [15] of active and inactive speleothem deposition in Southwest Asia similarly found that increased rainfall generally raised the probability of deposition, but no single annual precipitation threshold could be generalized across the region. Cave geology, karst structure, and local environments continued to modify the depositional response. Our Holocene compilation extends these comparisons by evaluating annual precipitation alongside its seasonal distribution. Precipitation seasonality, wet-season precipitation ratio, and precipitation concentration showed larger Spearman correlation coefficients than annual precipitation, while PLSR also highlighted seasonality-related variables. These results refine the climatic characterization of relatively rapid growth by distinguishing annual precipitation amount from its seasonal distribution and concentration.
Table 2.
Sites reporting inverse relationships between stalagmite growth or carbonate deposition and moisture conditions.
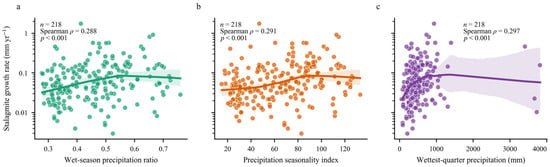
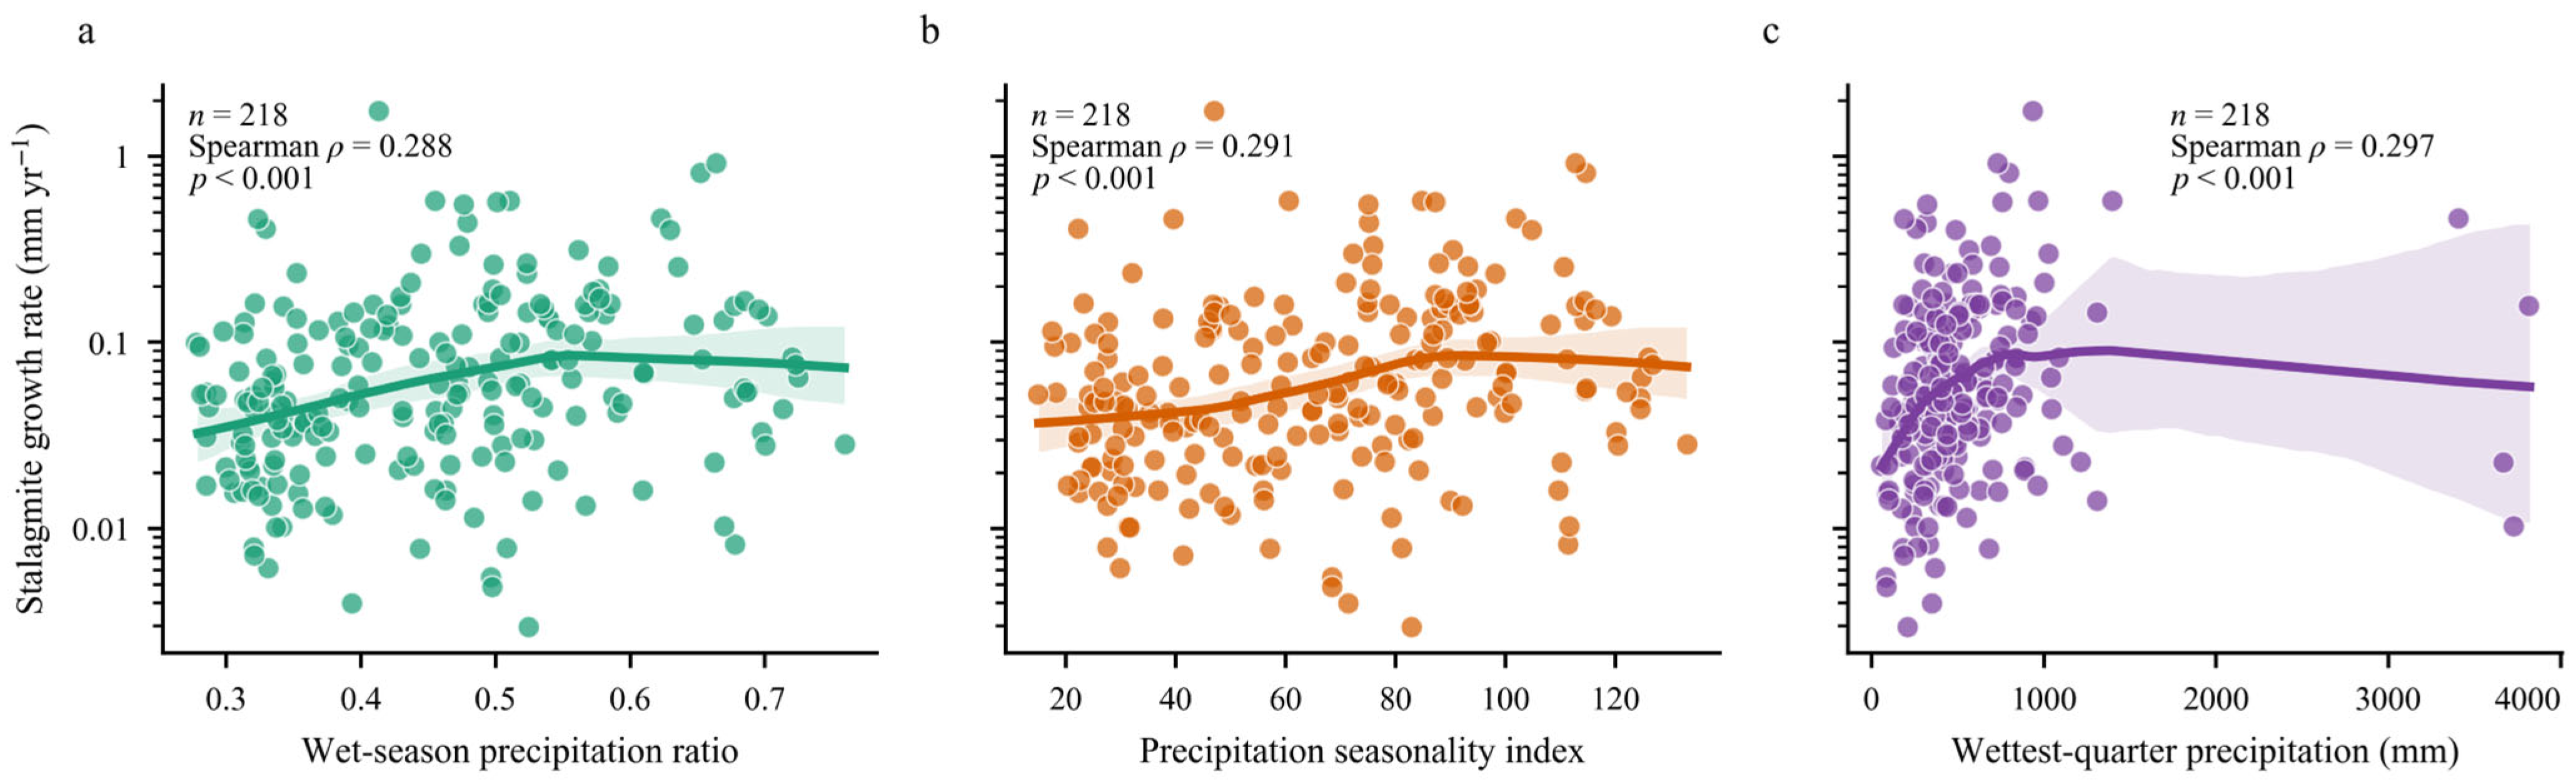
The hydrological significance of stalagmite growth rate should therefore not be reduced to annual precipitation changes. In the global Holocene compilation, higher growth rates were more commonly associated with greater wet-season precipitation contributions, stronger precipitation seasonality, and more concentrated rainfall. Lower growth rates may occur where annual precipitation is insufficient, seasonal precipitation distribution is unfavorable, or water inputs cannot be converted effectively into sustained deposition (Figure 5). Interpreting growth-rate differences should thus prioritize seasonal precipitation distribution and wet-season recharge structure alongside cave hydrological processes, rather than relying on annual precipitation alone.
Figure 5.
Holocene stalagmite growth rates in relation to (a) wet-season precipitation ratio, (b) precipitation seasonality, and (c) wettest-quarter precipitation. Symbols show individual samples, curves show the fitted relationships, and shaded bands show the uncertainty around those fits. Each panel reports the sample count and Spearman rank correlation statistics.
3.2.2. Temperature and Stalagmite Growth Rate
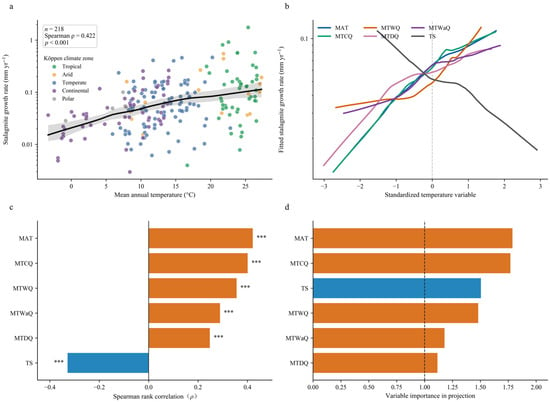
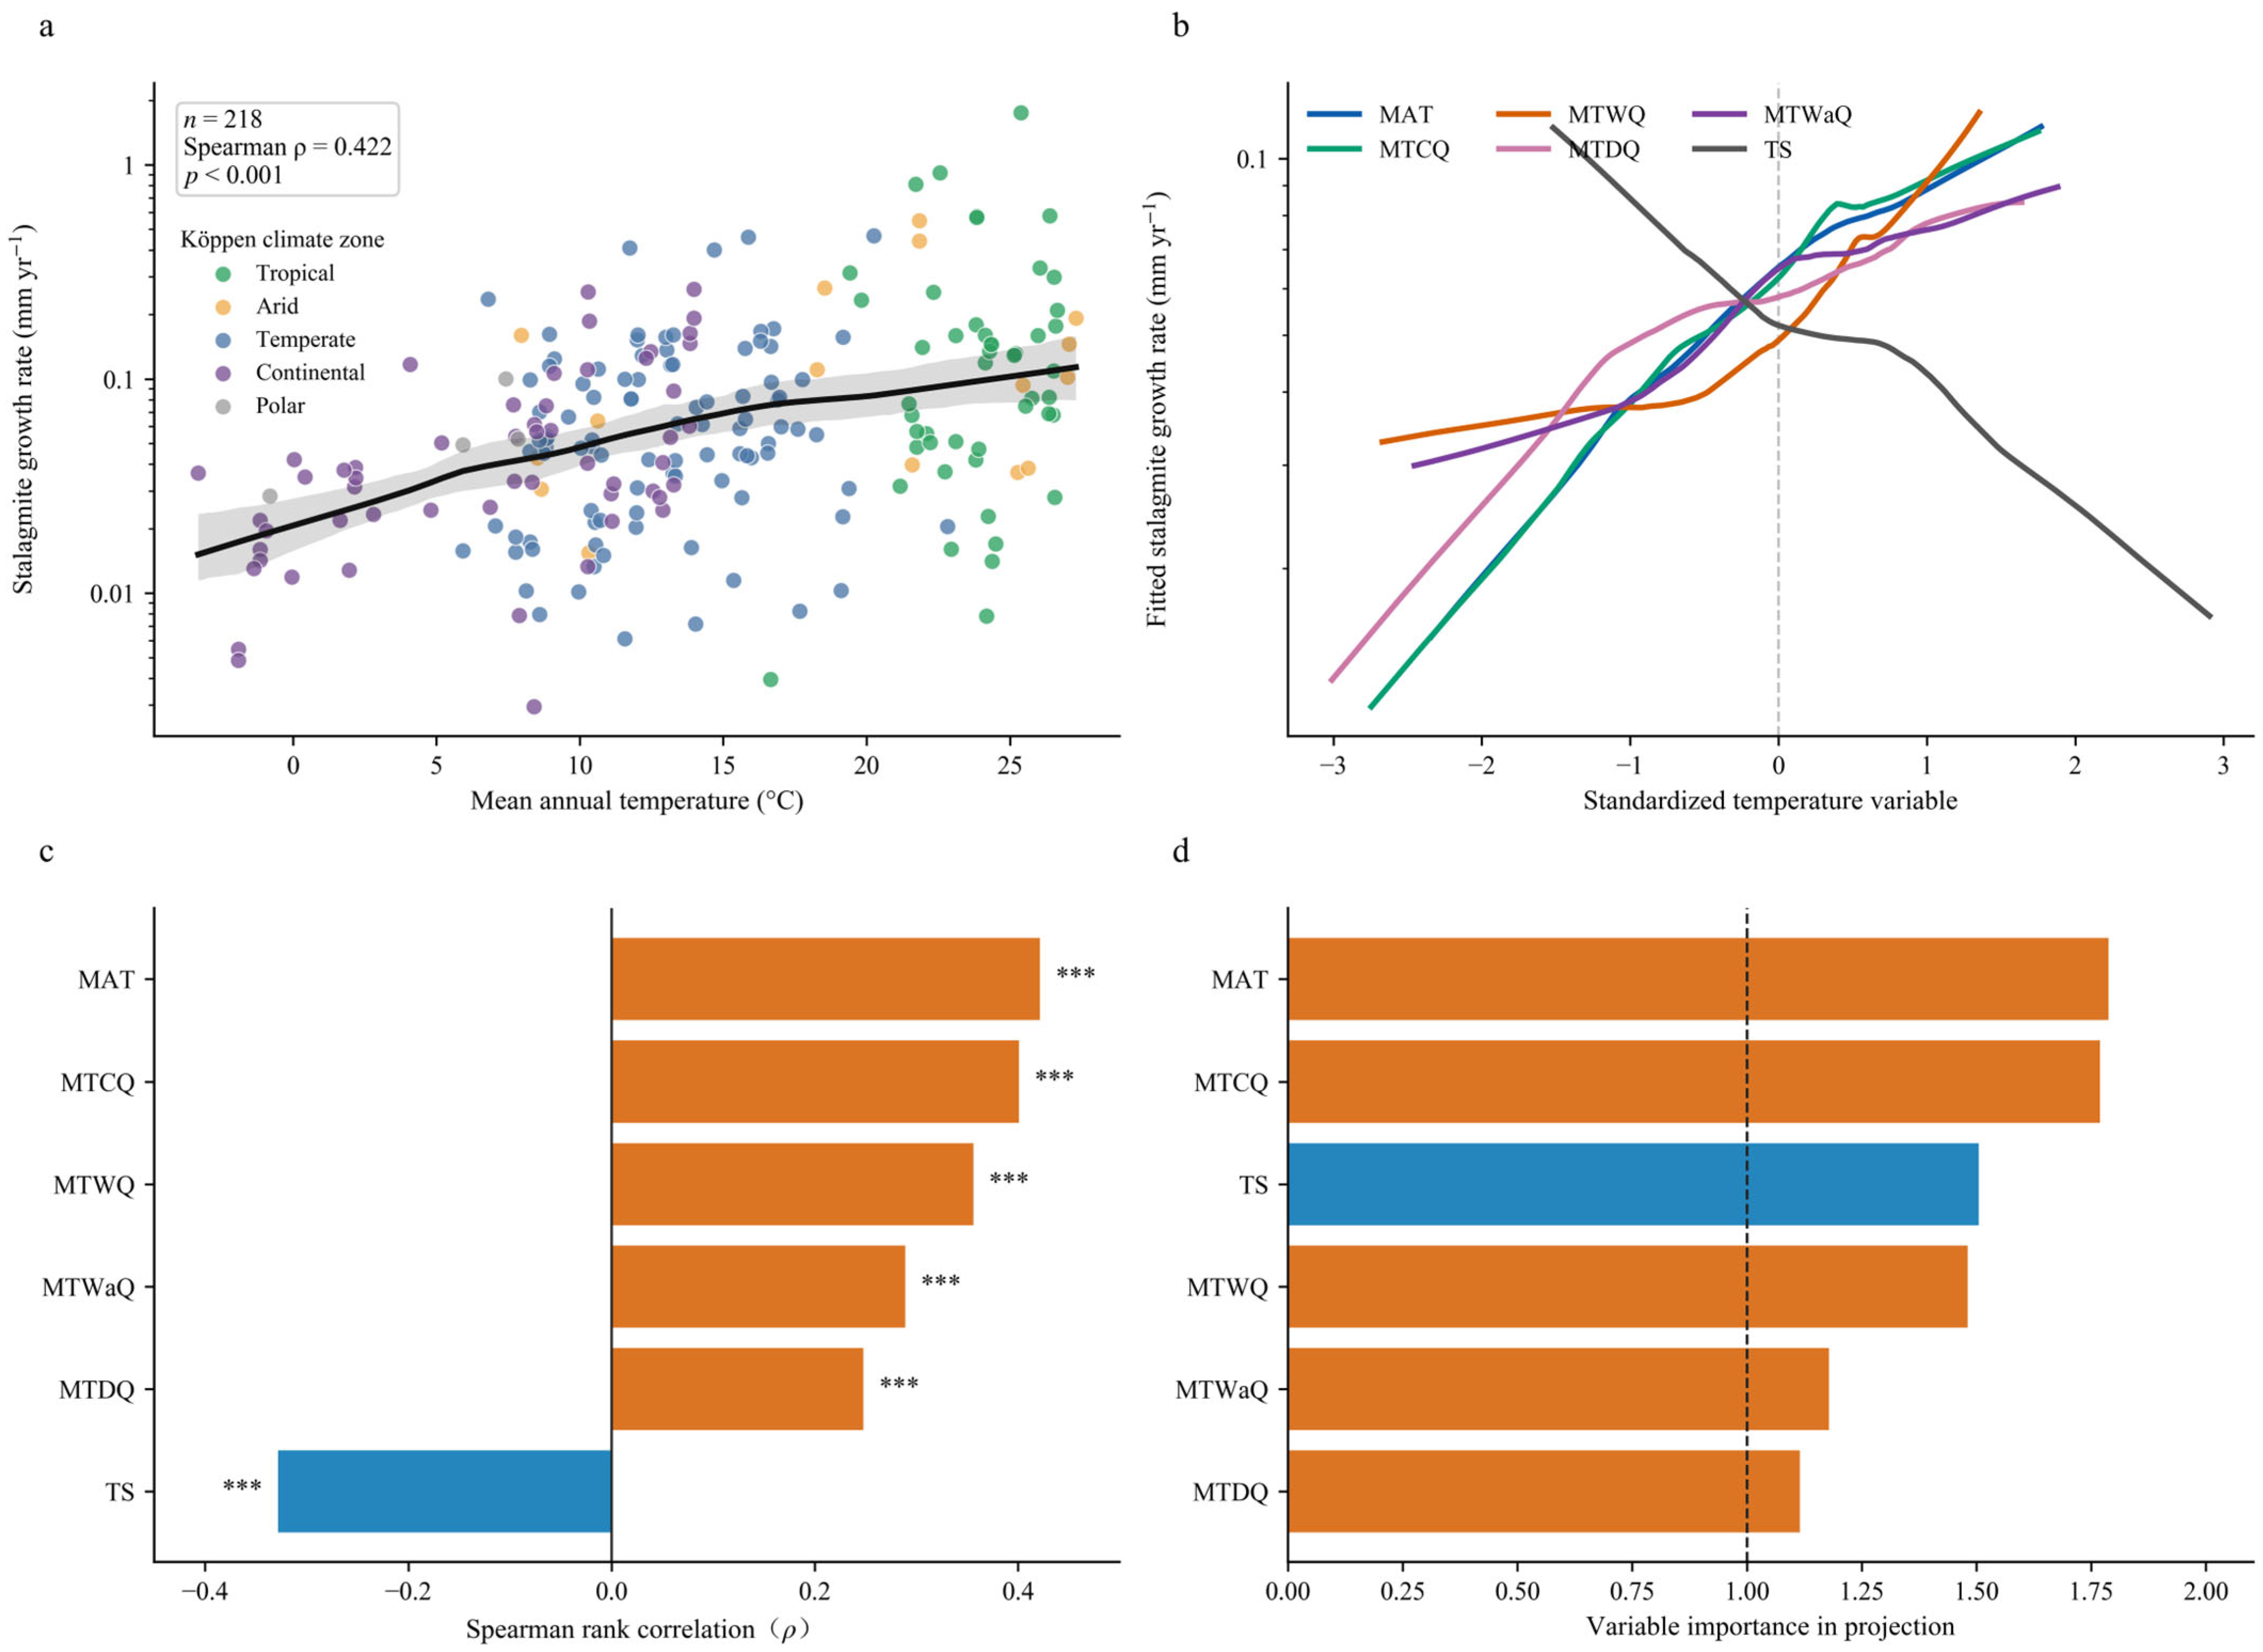
Figure 6 summarizes associations between temperature-related variables and stalagmite growth rate.
Figure 6.
Associations between temperature-related variables and Holocene stalagmite growth rates. (a) Mean annual temperature versus growth rate. Symbol colors denote climate zones, the black curve shows the LOWESS fit, and the gray shaded band shows its pointwise 95% bootstrap confidence interval. (b) LOWESS response curves relating standardized temperature variables to fitted growth rates. The vertical dashed line marks zero on the standardized scale. (c) Spearman rank correlation coefficients. (d) VIP scores in the PLSR model. Significance in (c): asterisks indicate statistical significance (*** p < 0.001). The vertical dashed line marks the reference threshold of VIP = 1. Variable abbreviations are defined in Table 1.
Temperature relationships were more consistent than precipitation relationships. Mean annual temperature was significantly positively correlated with growth rate (Figure 6a; n = 218, ρ = 0.422, p < 0.001), with growth generally increasing as mean annual temperature rose. Standardized response curves (Figure 6b) showed increasing fitted growth rates with mean annual temperature and mean temperatures of the coldest, wettest, and warmest quarters; mean temperature of the driest quarter also showed a positive response. Temperature seasonality displayed the opposite pattern, with fitted growth decreasing markedly as standardized seasonality increased. Spearman analysis (Figure 6c) identified mean annual temperature as the strongest temperature correlate (ρ = 0.422, p < 0.001). Mean temperatures of the coldest (ρ = 0.401), wettest (ρ = 0.356), warmest (ρ = 0.289), and driest quarters (ρ = 0.248) were also positively correlated with growth rate (all p < 0.001). Temperature seasonality was the only negatively correlated temperature variable (ρ = −0.328, p < 0.001). PLSR (Figure 6d) yielded VIP scores above 1 for mean annual temperature, coldest-quarter temperature, wettest-quarter temperature, and temperature seasonality (1.788, 1.769, 1.481, and 1.505, respectively). Warmest-quarter temperature had a VIP score of 1.179, while driest-quarter temperature had a score of 1.115. Overall, mean annual and coldest-quarter temperatures were the leading positive indicators, and temperature seasonality was the principal negative indicator.
Comparisons among climate zones further reveal differences in the associations between stalagmite growth rates and temperature variables (Figure 4b). Positive correlations were most pronounced in continental climates, where mean annual, wettest-quarter, coldest-quarter and warmest-quarter temperatures were significantly positively correlated with growth rates (ρ = 0.57, 0.56, 0.52 and 0.45, respectively), whereas the association with driest-quarter temperature was weaker (ρ = 0.21). In temperate climates, only mean annual and coldest-quarter temperatures showed significant weak positive correlations (ρ = 0.20 and 0.21, respectively); associations with the remaining temperature indicators were weak. In arid climates, correlation coefficients ranged from −0.35 to 0.29, and none reached statistical significance. Associations in tropical climates were also weak (ρ = 0.03–0.19) and non-significant. Temperature seasonality showed no significant association with growth rates in any of the four climate zones.
These results indicate that positive associations between temperature and stalagmite growth rates were most evident in continental climatic settings. Temperature associations with Holocene stalagmite growth were relatively consistent across statistical methods. Mean annual, coldest-quarter, and wettest-quarter temperatures showed positive relationships in LOWESS fits, Spearman correlations, and PLSR, suggesting that rapid growth generally occurred under warmer annual conditions and weaker cold-season limitations. Temperature seasonality showed a negative fitted response and correlation, together with high multivariate importance, indicating generally lower growth where within-year temperature variability was greater. Compared with precipitation, temperature variables had more consistent correlation directions and may therefore represent a more stable climatic background for global spatial differences in Holocene growth rates.
Temperature effects begin in the soil and overlying rock. Previous studies indicate that temperature influences growth at two stages: it modifies soil CO2 supply and carbonate dissolution by regulating vegetation growth, root respiration, and microbial activity, and it changes in-cave deposition efficiency through CO2 solubility, carbonate saturation, and calcite precipitation kinetics [32,51]. The relatively consistent positive relationship between mean annual temperature and growth therefore reflects the combined effects of greater soil productivity, carbonate dissolution, and cave deposition under warmer conditions, rather than a single process in which warming directly accelerates deposition.
Coldest-quarter temperature was a particularly strong correlate of growth rate. Its significant positive correlation and VIP score, second only to mean annual temperature, indicate that cold-season conditions provide important information about growth differences. Its higher correlation and PLSR contribution than warmest-quarter temperature suggest that rapid growth is associated with the cold-season thermal background as well as warm-season conditions. Together with the negative correlation for temperature seasonality, these results indicate that high-growth stalagmites occur more commonly in warmer climates with smaller within-year temperature fluctuations.
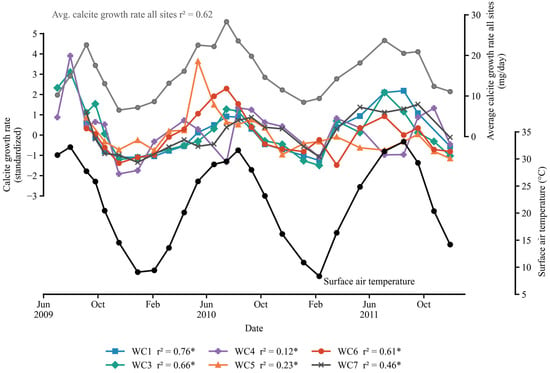
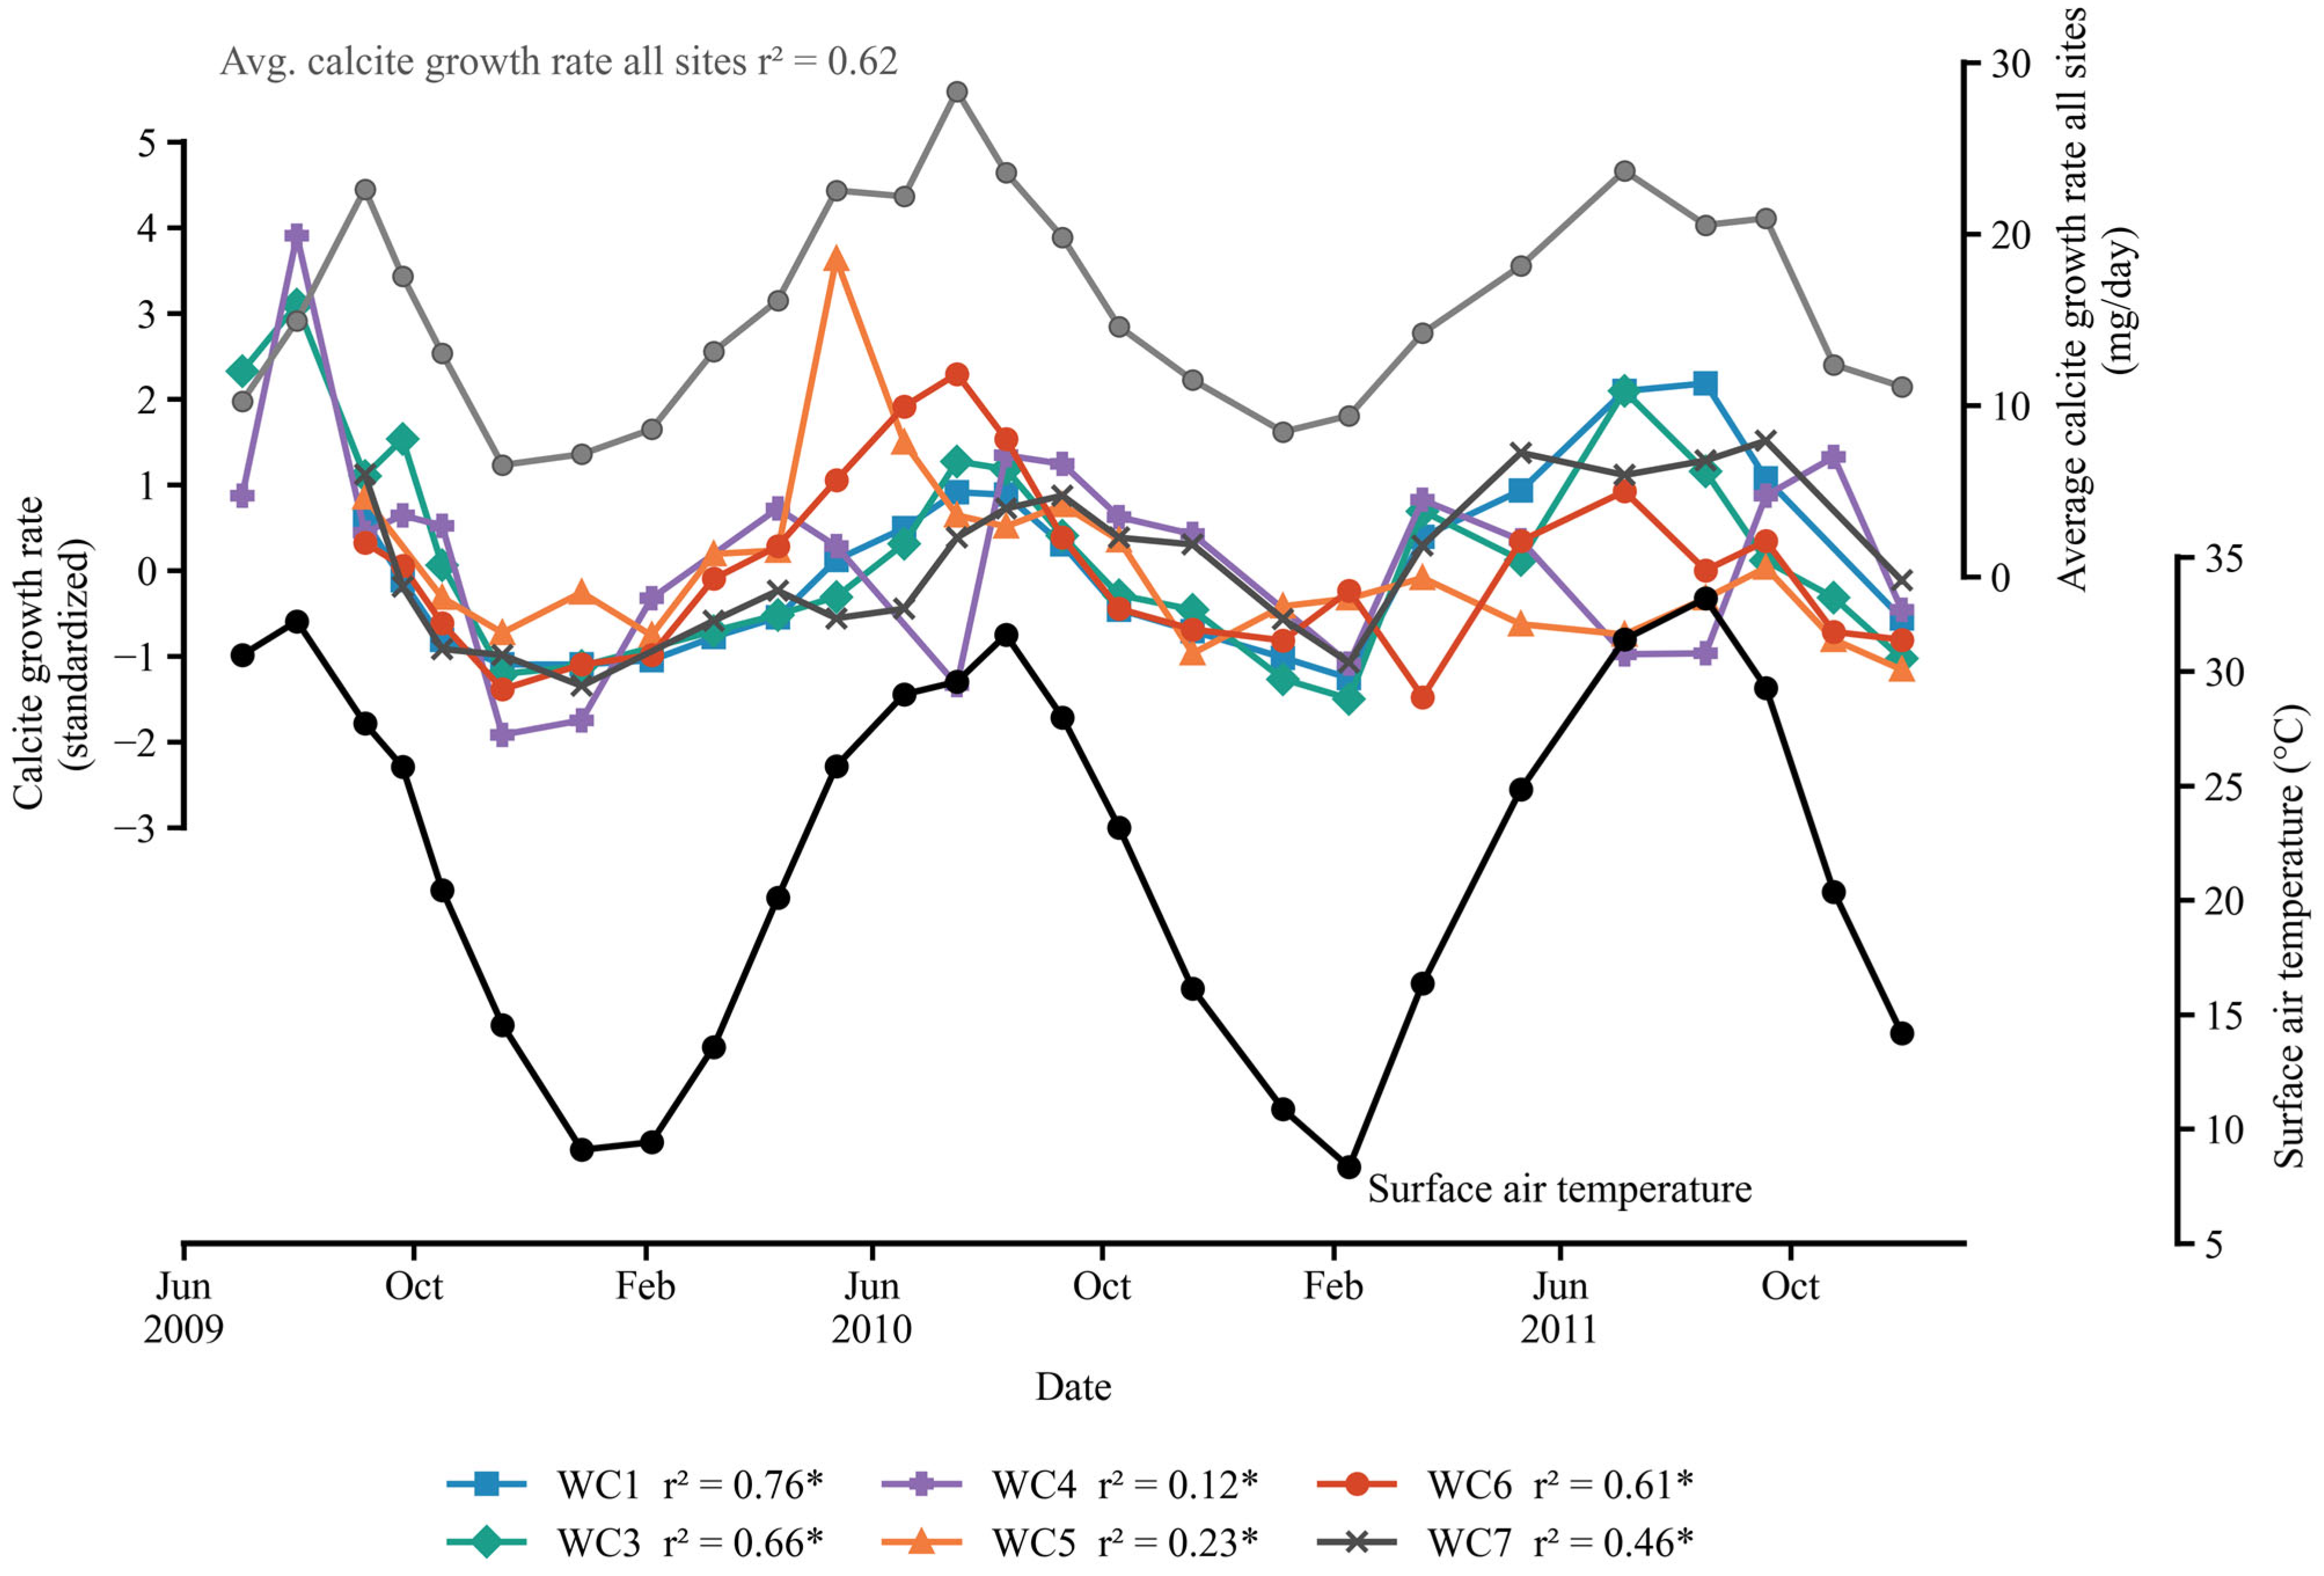
Cave observations further demonstrate that internal environments modify temperature signals before they are recorded by stalagmites. Monitoring at Cathedral Cave, Australia, showed that drip-water temperature is influenced regionally by surface temperature and subsurface heat conduction, with increasing depth attenuating the signal and introducing a lag. Locally, ventilation, evaporation, drip rate, and water pathways within the cave further modify drip-water temperature [52]. Monitoring of modern carbonate deposition in central Texas, USA, revealed strong seasonality. In deeper caves with seasonal ventilation, warm-season accumulation of cave-air pCO2 suppressed drip-water CO2 degassing and slowed or temporarily halted calcite deposition. Cold-season ventilation lowered cave-air pCO2 and promoted deposition [53,54]. Westcave is shallow and well-ventilated year-round, with cave-air pCO2 close to atmospheric levels. At six monitored drip sites, modern calcite deposition increased with mean surface temperature over the monitoring interval, although response strength differed substantially among sites [54] (Figure 7). These observations show that temperature affects growth through cave-air CO2, drip-water chemistry, and ventilation, rather than by direct transmission of surface temperature to growth rate. The consistency among our temperature predictors therefore characterizes an external climatic background favorable for deposition.
Figure 7.
Time series of modern calcite growth rates and surface air temperature at six drip sites in Westcave, Texas, USA. Colored curves represent standardized calcite growth rates at individual drip sites, the gray curve shows the mean calcite growth rate across all sites, and the black curve shows mean surface air temperature between sampling visits. Calcite growth rates and surface air temperature generally exhibit summer peaks and winter troughs. Adapted from Figure 2 and Table 2 of Ref. [54]. * denotes statistically significant relationship at least p < 0.05.
Temperature seasonality was the only temperature indicator significantly negatively correlated with growth rate (ρ = −0.328, p < 0.001) and had high PLSR importance (VIP = 1.505). Within-year temperature variability therefore provides important information about growth differences. Strong seasonality implies a large contrast between cold and warm seasons and, at high latitudes, high elevations, or in continental climates, may coincide with stronger cold-season limitations, shorter infiltration periods, and reduced continuity of drip-water recharge. Large seasonal temperature contrasts may also strengthen density differences between external and cave air, producing more pronounced seasonal ventilation and cave-air CO2 variability. Cold-season ventilation can lower cave-air pCO2, increase the CO2 pressure gradient between drip water and cave air, and promote degassing and calcite deposition. Warm-season air stagnation may increase cave-air pCO2 and suppress deposition, concentrating growth within a shorter favorable season [40,55]. Greater temperature seasonality therefore need not increase annual growth; it may instead restrict deposition to particular intervals or intensify seasonal variability in the depositional environment, reducing mean annual growth. This mechanism provides a possible explanation for the observed negative association.
The global synthesis by Baker et al. [56] of annually laminated stalagmites found that higher mean annual temperatures generally corresponded to faster growth. Our analysis of 218 Holocene stalagmites similarly identified significant positive correlations with mean annual and coldest-quarter temperatures and a significant negative correlation with temperature seasonality. Growth rate may thus be interpreted as an integrated response to annual thermal conditions, cold-season temperature, and temperature stability, rather than a direct response to warming in a single season.
Temperature variables showed relatively consistent statistical directions. Positive correlations and high VIP scores for mean annual, coldest-quarter, and wettest-quarter temperatures identify annual warmth and cold-season conditions as important climatic associations of Holocene growth-rate differences. The negative correlation with temperature seasonality indicates lower growth where within-year thermal fluctuations were greater. These results help distinguish annual warmth, cold-season conditions, and within-year thermal variability when interpreting spatial growth-rate differences. Future studies combining cave monitoring with measurements of soil CO2, drip-water chemistry, and calcite deposition could further clarify the processes underlying the positive correlations between temperature and growth rate identified in our dataset.
3.3. Classification Using Multiple Climate Variables
Spearman correlation and PLSR identified climatic associations of stalagmite growth but did not establish how predictors should be combined for classification. We therefore used XGBoost to formulate growth as a binary classification problem and assess the combined ability of climate variables to distinguish high-growth conditions. Stalagmites with growth rates of at least 0.145013 mm yr−1 were classified as high-growth, and the remaining samples as non-high-growth. To reduce class imbalance, 44 non-high-growth samples were randomly selected to match the number of high-growth samples. We also performed 1000 repeated downsampling runs with stratified cross-validation to evaluate sensitivity to random sample selection.
Because the climate variables were strongly correlated, we retained predictors with greater ability to distinguish the high-growth class to limit model complexity and overfitting. The selected predictors should not be equated with the only or necessarily most important physical controls on stalagmite growth. They are statistically linked to other correlated climate variables. We therefore interpret them as combined indicators of the climatic background associated with high growth and avoid assigning overly specific mechanisms to individual predictors. The five retained variables were wet-season precipitation ratio, driest-month precipitation, temperature seasonality, driest-quarter temperature, and wettest-month precipitation.
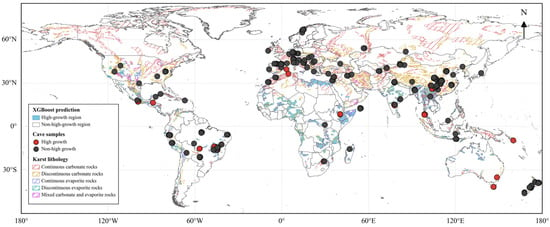
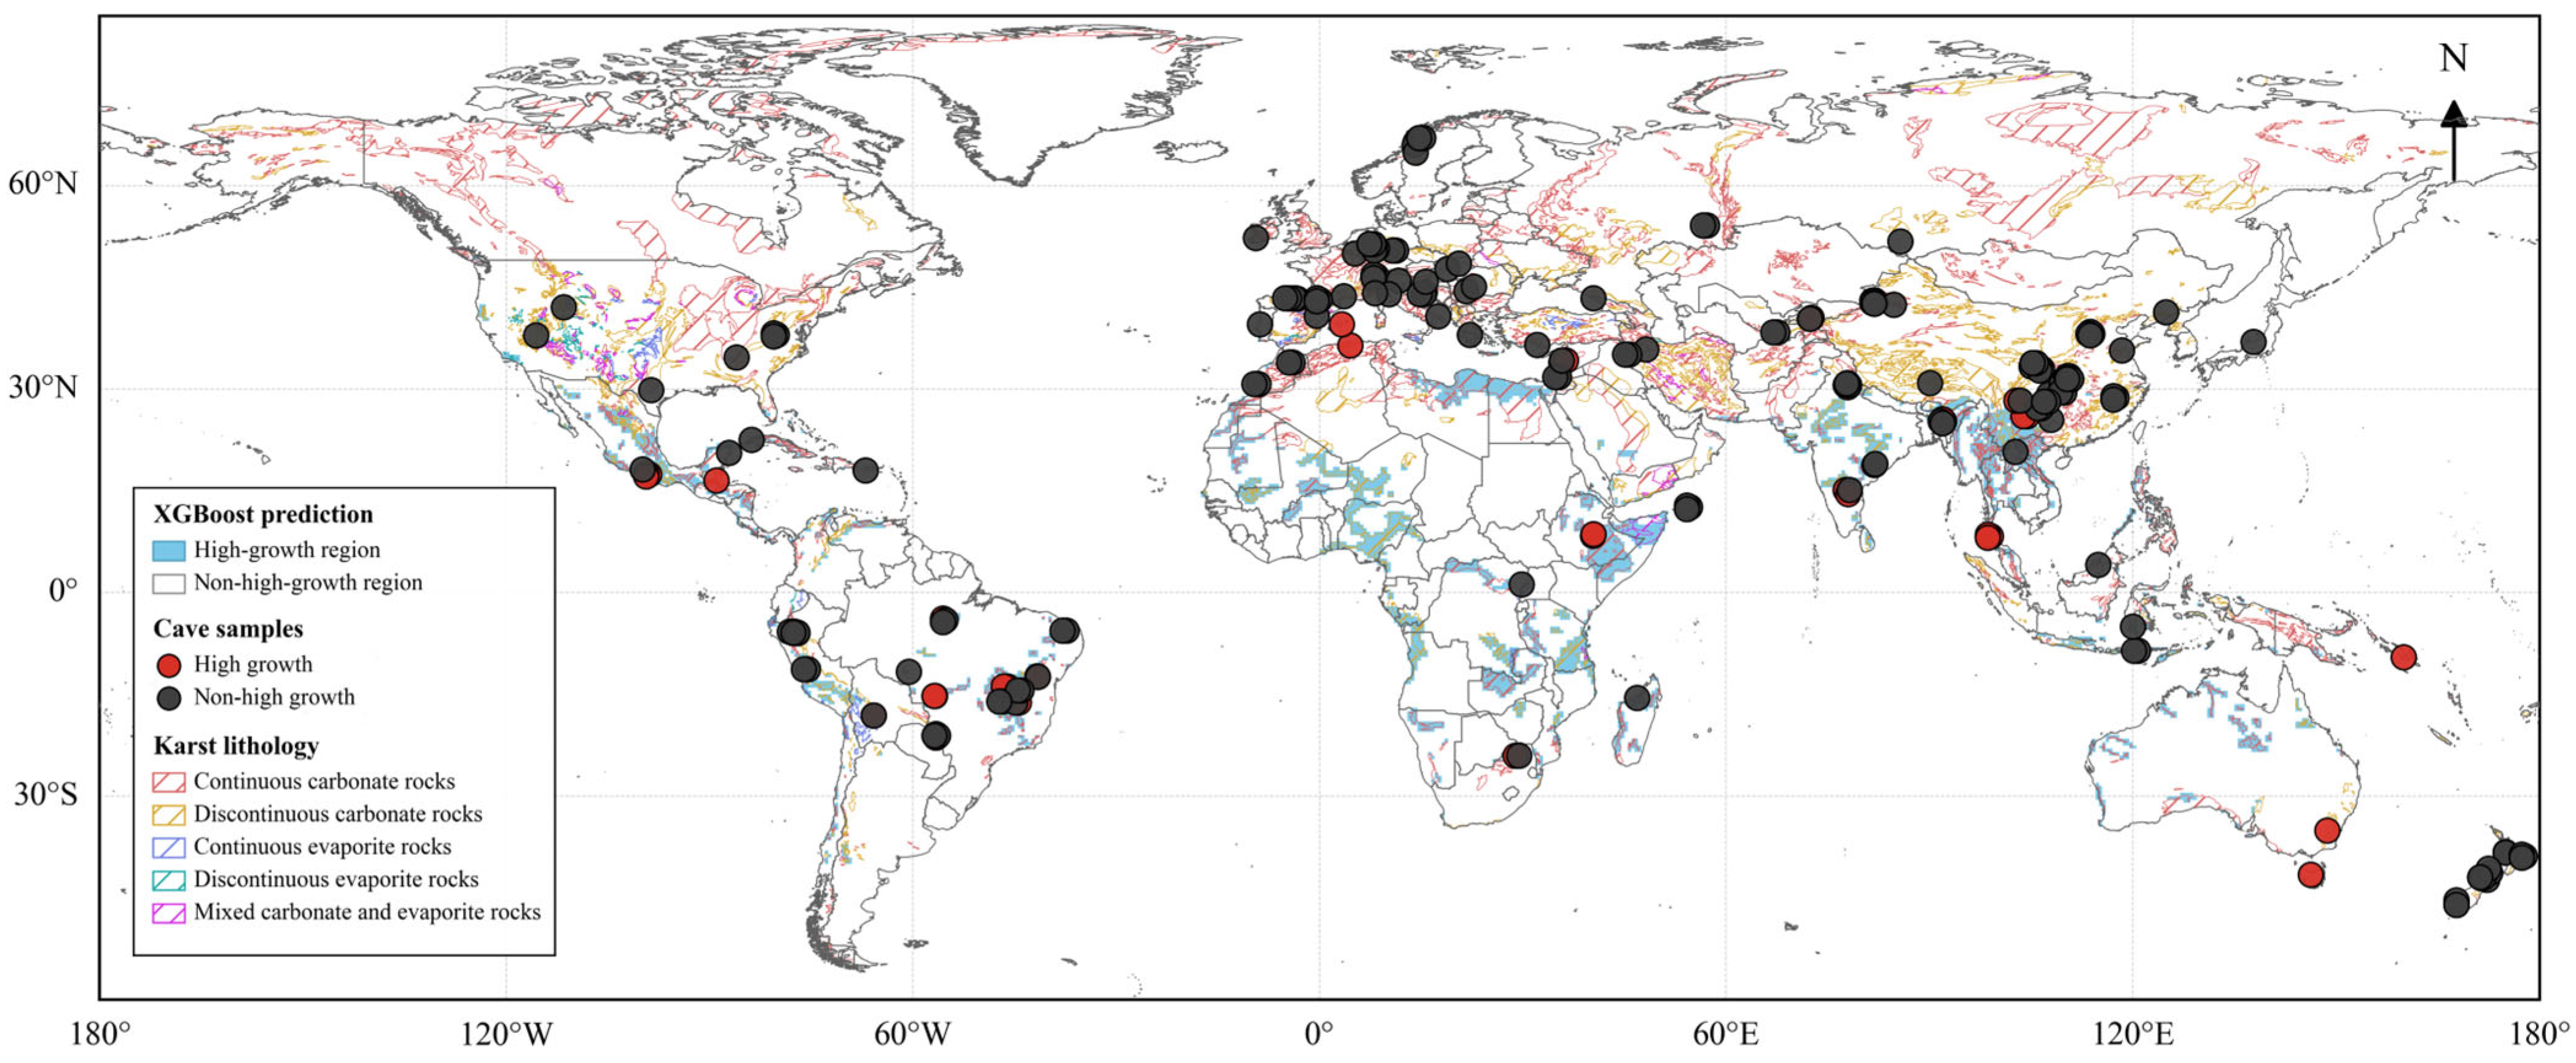
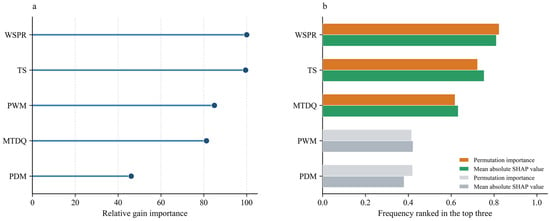
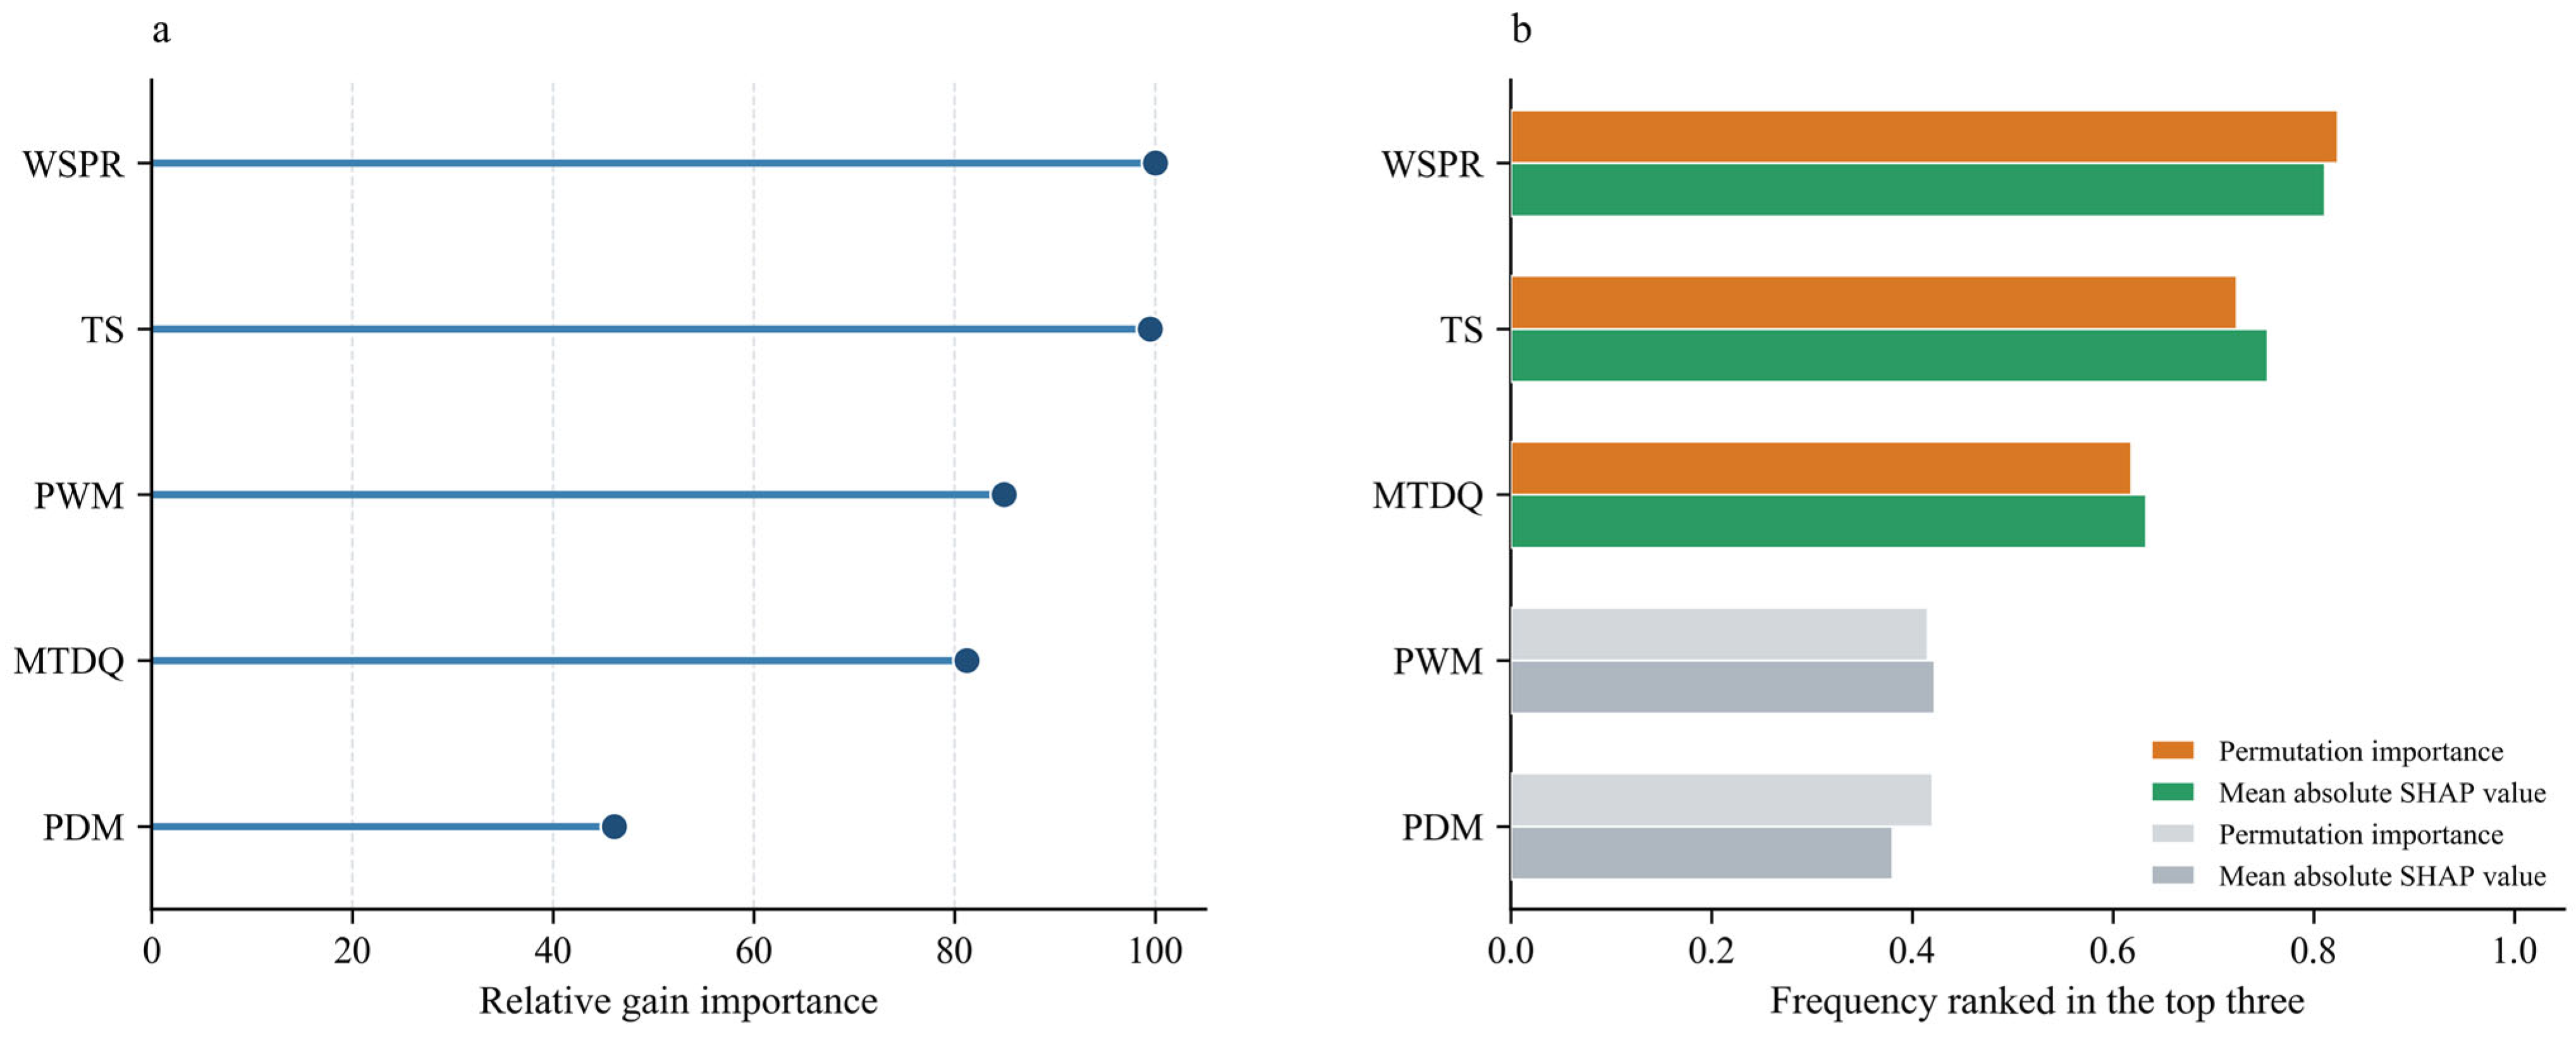
In stratified two-fold cross-validation (Figure 8 and Figure 9), the model achieved an overall accuracy of 69.32% and a sensitivity of 75.00% for the high-growth class. Across 1000 repeated downsampling runs with stratified five-fold cross-validation, balanced accuracy was 0.665 ± 0.047, area under the receiver operating characteristic curve (AUC) was 0.702 ± 0.053, sensitivity was 0.676 ± 0.054, and specificity was 0.654 ± 0.066. Permutation importance and mean absolute SHAP values were used to assess the stability of predictor importance. The wet-season precipitation ratio, temperature seasonality, and precipitation of the wettest month had the three highest relative gain importance (Figure 9a). Across the 1000 importance-stability runs, the wet-season precipitation ratio, temperature seasonality, and mean temperature of the driest quarter ranked among the top three most frequently, in that order, under both permutation importance and mean absolute SHAP values (Figure 9b). Differences between observations and predictions suggest that gridded climate variables alone cannot fully capture non-climatic influences such as cave geology, karst hydrological structure, and local depositional environments.
Figure 8.
Spatial distribution of climatic conditions classified by XGBoost as favorable for high-growth stalagmites, overlaid on the World Karst Aquifer Map [57]. Blue areas denote predicted high-growth conditions and white areas predicted non-high-growth conditions. Red and dark symbols denote observed high-growth and non-high-growth samples, respectively. Hatching distinguishes mapped karst lithologies.
Figure 9.
Relative gain importance and ranking stability of XGBoost predictors. (a) Relative gain importance of the five retained climate variables, scaled to a maximum of 100. (b) Frequency with which each variable ranked among the top three across repeated runs, assessed using permutation importance and mean absolute SHAP values. WSPR, TS, and MTDQ had the highest frequencies of ranking in the top three under both methods. For these predictors, orange bars show frequencies based on permutation importance, and green bars show frequencies based on mean absolute SHAP values. PWM and PDM ranked in the top three less frequently. For these two predictors, light gray bars represent permutation importance, and dark gray bars represent mean absolute SHAP values. Variable abbreviations are defined in Table 1.
Although the model distinguished high-growth from non-high-growth samples with moderate success, climate variables did not fully explain growth-rate differences. Further evaluation of climatic and non-climatic influences requires cave monitoring and information on karst hydrological structure, drip-water chemistry, ventilation, and depositional microenvironments. Nevertheless, the classification provides a useful reference for assessing the likelihood of rapid stalagmite growth under different climatic backgrounds.
3.4. Local Factors
Substantial growth-rate differences remained under similar climatic conditions, indicating an important role for local factors (Table 3). Among 51 caves containing at least two stalagmites, the median ratio of maximum to minimum growth rate within a cave was 2.3 and the largest ratio was 45.3. Ten caves contained both high-growth and non-high-growth samples. Four stalagmites from Mawmluh Cave shared broadly similar humid climatic conditions, with mean annual temperatures of approximately 19.1–20.2 °C, annual precipitation of approximately 5439–5654 mm, and wet-season precipitation ratios of 0.627–0.676, yet growth rates ranged from 0.010 to 0.466 mm yr−1, differing by more than 45-fold. Two stalagmites from Liang Luar Cave had identical climate variables but growth rates of 0.014 and 0.145 mm yr−1, yet their growth rates differed by approximately a factor of ten. Five stalagmites from Qingtian Cave showed limited differences in mean annual temperature and precipitation but growth rates ranging from 0.060 to 0.263 mm yr−1. Two stalagmites from Lapa Sem Fim Cave likewise shared similar temperature and precipitation backgrounds but grew at 0.051 and 0.16 mm yr−1. These examples show that stalagmite growth rates can vary substantially within a cave even when the associated regional climate conditions are similar.
Table 3.
Basic information on the caves discussed in Section 3.4.
First, overlying rock thickness, fracture development, and karst storage structure alter recharge pathways and residence times. Different drips may receive rapid, delayed, or mixed flow, modifying water flux and solute supply [16,32,38]. Second, ventilation and cave-air CO2 concentration regulate drip-water degassing and are important internal controls on prior calcite precipitation and stalagmite growth [13,36,40]. Monitoring at Golgotha Cave and Obir Caves demonstrated that ventilation, drip rates, and cave-air pCO2 substantially altered drip-water Ca, alkalinity, and carbonate saturation [36,40]. Cave entrance morphology, passage structure, soil thickness, vegetation cover, and local evaporation also influence recharge-water chemistry and the depositional phase [17]. Climate establishes the regional background and potential suitability for stalagmite deposition, whereas local karst hydrology and cave microenvironments determine how that potential translates into actual growth.
The gridded paleoclimate variables used here describe regional temperature and precipitation but do not directly represent overlying rock structure, drip-water recharge type, cave entrance morphology, or passage geometry. Misclassification therefore persists despite the model’s ability to distinguish growth classes. Predictor selection is also affected by collinearity: retained variables represent a set of associated climatic conditions and are not necessarily unique or direct depositional controls. The correlations identified through our statistical analyses do not necessarily imply direct causal relationships between climatic variables and stalagmite growth. Future studies integrating global climate data with cave environmental information could help distinguish the relative contributions of climatic conditions and local karst hydrological processes to stalagmite growth rates.
4. Conclusions
- (1)
- Combining SISALv3 with gridded Holocene paleoclimate data, we assessed climatic associations of growth rates for 218 stalagmites from 139 caves. Growth rates were generally low and highly dispersed. The median was 0.05 mm yr−1; 75% of samples were below 0.1248 mm yr−1 and 90% below 0.20 mm yr−1. Slow deposition therefore predominated in the global compilation, with high-growth samples forming a minority.
- (2)
- Precipitation provides the basic moisture supply for stalagmite growth, but annual totals alone do not adequately characterize growth-rate differences. Wet-season precipitation ratio, wettest-quarter precipitation, precipitation seasonality, and precipitation concentration better represent aspects of recharge. The pattern of these associations varied across climate zones. Growth rates therefore record effective recharge, and deposition after rainfall has been modified by soils, overlying rock, and cave systems, rather than simple increases or decreases in external precipitation.
- (3)
- Temperature associations were more consistent. Mean annual, coldest-quarter, and wettest-quarter temperatures were positively correlated with growth rate, while temperature seasonality was negatively correlated. Comparison across climate zones revealed differences in the patterns of correlation between temperature variables and stalagmite growth rates. Thermal conditions influence soil biological activity and carbonate dissolution and constrain growth through cold-season limitations, the duration of recharge seasons, and depositional stability.
- (4)
- Classification using multiple climate variables distinguished high-growth from non-high-growth samples with moderate success. Wet-season precipitation ratio, driest-month precipitation, temperature seasonality, driest-quarter temperature, and wettest-month precipitation provide useful indicators of climatic constraints. However, climate alone cannot fully explain growth-rate differences. Cave geology, karst hydrological structure, drip-water chemistry, ventilation, and local depositional environments remain important potential influences. Further cave monitoring and regional process studies are needed to constrain the climatic significance of growth rates and the limits of their paleoenvironmental interpretation.
Author Contributions
Conceptualization, H.T.; software, H.T.; methodology, H.T. and J.H.; formal analysis, H.T.; data curation, H.T. and J.H.; writing—original draft preparation, H.T.; writing—review and editing, G.L.; visualization, H.T., C.S., and H.F.; supervision, G.L.; funding acquisition, G.L. All authors have read and agreed to the published version of the manuscript.
Funding
This research was funded by the National Natural Science Foundation of China, grant number 41977390. The Fujian Provincial Public Welfare Research Project funded by the Fujian Provincial Department of Science and Technology, grant number 2024R1002005.
Data Availability Statement
The SISALv3 speleothem database is publicly available at https://doi.org/10.5287/ora-2nanwp4rk. The gridded paleoclimate dataset is publicly available at https://doi.org/10.6084/m9.figshare.12293345.v3. The pastclim v1.2.2 version used in this study is available from Zenodo at 10.5281/zenodo.7388091. The compiled dataset used in the statistical analyses is available from the corresponding author on request.
Acknowledgments
During the preparation of this manuscript, the authors used OpenAI Codex (codex-cli version 0.154.0-alpha.6.2; model: gpt-5.6-sol) for Chinese-to-English translation, language editing, and translation of figure labels. The authors have reviewed and edited the output and take full responsibility for the content of this publication. We sincerely thank the three anonymous reviewers for their constructive comments, which helped improve the manuscript.
Conflicts of Interest
The authors declare no conflicts of interest.
Abbreviations
The following abbreviations are used in this manuscript:
| SISALv3 | Speleothem Isotopes Synthesis and AnaLysis database, version 3 |
| PLSR | Partial least-squares regression |
| VIP | Variable importance in projection |
| XGBoost | Extreme Gradient Boosting |
| LOWESS | Locally weighted scatterplot smoothing |
| SHAP | SHapley Additive exPlanations |
| AUC | Area under the receiver operating characteristic curve |
| MAT | Mean annual temperature |
| TS | Temperature seasonality |
| MTWQ | Mean temperature of the wettest quarter |
| MTDQ | Mean temperature of the driest quarter |
| MTWaQ | Mean temperature of the warmest quarter |
| MTCQ | Mean temperature of the coldest quarter |
| MAP | Mean annual precipitation |
| PWM | Precipitation of the wettest month |
| PDM | Precipitation of the driest month |
| PS | Precipitation seasonality |
| PWQ | Precipitation of the wettest quarter |
| PDQ | Precipitation of the driest quarter |
| PWaQ | Precipitation of the warmest quarter |
| PCQ | Precipitation of the coldest quarter |
| AI | Annual aridity index |
| AIWQ | Wettest-quarter aridity index |
| AIDQ | Driest-quarter aridity index |
| PCI | Precipitation concentration index |
| WSPR | Wet-season precipitation ratio |
| pCO2 | Partial pressure of carbon dioxide |
References
- Walker, M.; Johnsen, S.; Rasmussen, S.O.; Popp, T.; Steffensen, J.-P.; Gibbard, P.; Hoek, W.; Lowe, J.; Andrews, J.; Björck, S.; et al. Formal definition and dating of the GSSP (Global Stratotype Section and Point) for the base of the Holocene using the Greenland NGRIP ice core, and selected auxiliary records. J. Quat. Sci. 2009, 24, 3–17. [Google Scholar] [CrossRef] [Scilit]
- Cartapanis, O.; Jonkers, L.; Moffa-Sanchez, P.; Jaccard, S.L.; de Vernal, A. Complex spatio-temporal structure of the Holocene Thermal Maximum. Nat. Commun. 2022, 13, 5662, Correction in Nat. Commun. 2022, 13, 6751. https://doi.org/10.1038/s41467-022-34499-9. [Google Scholar] [CrossRef] [Scilit] [PubMed]
- Alley, R.B.; Ágústsdóttir, A.M. The 8k event: Cause and consequences of a major Holocene abrupt climate change. Quat. Sci. Rev. 2005, 24, 1123–1149. [Google Scholar] [CrossRef] [Scilit]
- Parker, S.E.; Harrison, S.P. The timing, duration and magnitude of the 8.2 ka event in global speleothem records. Sci. Rep. 2022, 12, 10542. [Google Scholar] [CrossRef] [Scilit] [PubMed]
- McKay, N.P.; Kaufman, D.S.; Arcusa, S.H.; Kolus, H.R.; Edge, D.C.; Erb, M.P.; Hancock, C.L.; Routson, C.C.; Żarczyński, M.; Marshall, L.P.; et al. The 4.2 ka event is not remarkable in the context of Holocene climate variability. Nat. Commun. 2024, 15, 6555. [Google Scholar] [CrossRef] [Scilit] [PubMed]
- Cheng, H.; Zhang, H.; Zhao, J.; Li, H.; Ning, Y.; Kathayat, G. Chinese stalagmite paleoclimate researches: A review and perspective. Sci. Sin. Terrae 2019, 49, 1565–1589. (In Chinese) [Google Scholar] [CrossRef] [Scilit]
- Edwards, R.L.; Chen, J.H.; Wasserburg, G.J. 238U–234U–230Th–232Th systematics and the precise measurement of time over the past 500,000 years. Earth Planet. Sci. Lett. 1987, 81, 175–192. [Google Scholar] [CrossRef] [Scilit]
- Richards, D.A.; Dorale, J.A. Uranium-series Chronology and Environmental Applications of Speleothems. Rev. Mineral. Geochem. 2003, 52, 407–460. [Google Scholar] [CrossRef] [Scilit]
- Wendt, K.A.; Li, X.; Edwards, R.L. Uranium–Thorium Dating of Speleothems. Elements 2021, 17, 87–92. [Google Scholar] [CrossRef] [Scilit]
- Baker, A.; Genty, D.; Dreybrodt, W.; Barnes, W.L.; Mockler, N.J.; Grapes, J. Testing Theoretically Predicted Stalagmite Growth Rate with Recent Annually Laminated Samples: Implications for Past Stalagmite Deposition. Geochim. Cosmochim. Acta 1998, 62, 393–404. [Google Scholar] [CrossRef] [Scilit]
- Dreybrodt, W. Deposition of calcite from thin films of natural calcareous solutions and the growth of speleothems. Chem. Geol. 1980, 29, 89–105. [Google Scholar] [CrossRef] [Scilit]
- Mühlinghaus, C.; Scholz, D.; Mangini, A. Modelling stalagmite growth and δ13C as a function of drip interval and temperature. Geochim. Cosmochim. Acta 2007, 71, 2780–2790. [Google Scholar] [CrossRef] [Scilit]
- Sherwin, C.M.; Baldini, J.U.L. Cave air and hydrological controls on prior calcite precipitation and stalagmite growth rates: Implications for palaeoclimate reconstructions using speleothems. Geochim. Cosmochim. Acta 2011, 75, 3915–3929. [Google Scholar] [CrossRef] [Scilit]
- Vaks, A.; Gutareva, O.S.; Breitenbach, S.F.M.; Avirmed, E.; Mason, A.J.; Thomas, A.L.; Osinzev, A.V.; Kononov, A.M.; Henderson, G.M. Speleothems Reveal 500,000-Year History of Siberian Permafrost. Science 2013, 340, 183–186. [Google Scholar] [CrossRef] [Scilit] [PubMed]
- Nicholson, S.L.; Jacobson, M.J.; Markowska, M.; Schröder, J.; Vonhof, H.B.; Haug, G.H. The climatic constraints on speleothem deposition in SW Asia. Geology 2026, 54, 264–268. [Google Scholar] [CrossRef] [Scilit]
- Tooth, A.F.; Fairchild, I.J. Soil and karst aquifer hydrological controls on the geochemical evolution of speleothem-forming drip waters, Crag Cave, southwest Ireland. J. Hydrol. 2003, 273, 51–68. [Google Scholar] [CrossRef] [Scilit]
- Markowska, M.; Baker, A.; Andersen, M.S.; Jex, C.N.; Cuthbert, M.O.; Rau, G.C.; Graham, P.W.; Rutlidge, H.; Mariethoz, G.; Marjo, C.E.; et al. Semi-arid zone caves: Evaporation and hydrological controls on δ18O drip water composition and implications for speleothem paleoclimate reconstructions. Quat. Sci. Rev. 2016, 131, 285–301. [Google Scholar] [CrossRef] [Scilit]
- Fleitmann, D.; Burns, S.J.; Mudelsee, M.; Neff, U.; Kramers, J.; Mangini, A.; Matter, A. Holocene Forcing of the Indian Monsoon Recorded in a Stalagmite from Southern Oman. Science 2003, 300, 1737–1739. [Google Scholar] [CrossRef] [Scilit] [PubMed]
- Wei, Y.; Cai, Y.; Cheng, X.; Xue, G.; Lu, Y.; Ma, L.; Huang, S.; He, M.; Cheng, H.; Edwards, R.L. Holocene and deglaciation hydroclimate changes in northern China as inferred from stalagmite growth frequency. Glob. Planet. Change 2020, 195, 103360. [Google Scholar] [CrossRef] [Scilit]
- Spötl, C.; Mangini, A. Speleothems and paleoglaciers. Earth Planet. Sci. Lett. 2007, 254, 323–331. [Google Scholar] [CrossRef] [Scilit]
- Hellstrom, J.; Sniderman, K.; Drysdale, R.; Couchoud, I.; Hartland, A.; Pearson, A.; Bajo, P. Speleothem growth intervals reflect New Zealand montane vegetation response to temperature change over the last glacial cycle. Sci. Rep. 2020, 10, 2492. [Google Scholar] [CrossRef] [Scilit] [PubMed]
- Vaks, A.; Mason, A.; Breitenbach, S.F.M.; Giesche, A.; Osinzev, A.; Adrian, I.; Kononov, A.; Umbo, S.; Lechleitner, F.A.; Rosensaft, M.; et al. Arctic speleothems reveal nearly permafrost-free Northern Hemisphere in the late Miocene. Nat. Commun. 2025, 16, 5483. [Google Scholar] [CrossRef] [Scilit] [PubMed]
- Railsback, L.B. A comparison of growth rate of late Holocene stalagmites with atmospheric precipitation and temperature, and its implications for paleoclimatology. Quat. Sci. Rev. 2018, 187, 94–111. [Google Scholar] [CrossRef] [Scilit]
- Lases-Hernandez, F.; Medina-Elizalde, M.; Burns, S.; DeCesare, M. Long-term monitoring of drip water and groundwater stable isotopic variability in the Yucatán Peninsula: Implications for recharge and speleothem rainfall reconstruction. Geochim. Cosmochim. Acta 2019, 246, 41–59. [Google Scholar] [CrossRef] [Scilit]
- Merz, N.; Hubig, A.; Kleinen, T.; Therre, S.; Kaufmann, G.; Frank, N. How the climate shapes stalagmites—A comparative study of model and speleothem at the Sofular Cave, Northern Turkey. Front. Earth Sci. 2022, 10, 969211. [Google Scholar] [CrossRef] [Scilit]
- Tian, Y.; Li, Y.; Guang, K.; Li, J.; Zhu, S.; Gao, Y.; Rao, Z. Preliminary analysis of the spatial and temporal variation of stalagmite growth rates in China. Quat. Sci. 2023, 43, 20–32. (In Chinese) [Google Scholar] [CrossRef]
- Hennig, G.J.; Grün, R.; Brunnacker, K. Speleothems, Travertines, and Paleoclimates. Quat. Res. 1983, 20, 1–29. [Google Scholar] [CrossRef] [Scilit]
- Dabkowski, J.; Beaumont, L. Rise and decline of Holocene tufas across Europe: Exploring east/west and north/south similarities and differences in their development. J. Quat. Sci. 2024, 39, 960–971. [Google Scholar] [CrossRef] [Scilit]
- Kaushal, N.; Lechleitner, F.A.; Wilhelm, M.; Azennoud, K.; Bühler, J.C.; Braun, K.; Ait Brahim, Y.; Baker, A.; Burstyn, Y.; Comas-Bru, L.; et al. SISALv3: A global speleothem stable isotope and trace element database. Earth Syst. Sci. Data 2024, 16, 1933–1963. [Google Scholar] [CrossRef] [Scilit]
- Beyer, R.M.; Krapp, M.; Manica, A. High-resolution terrestrial climate, bioclimate and vegetation for the last 120,000 years. Sci. Data 2020, 7, 236. [Google Scholar] [CrossRef] [Scilit] [PubMed]
- Chen, T.; Guestrin, C. XGBoost: A Scalable Tree Boosting System. In Proceedings of the 22nd ACM SIGKDD International Conference on Knowledge Discovery and Data Mining, San Francisco, CA, USA, 13–17 August 2016; ACM: New York, NY, USA, 2016; pp. 785–794. [Google Scholar] [CrossRef] [Scilit]
- Fairchild, I.J.; Smith, C.L.; Baker, A.; Fuller, L.; Spötl, C.; Mattey, D.; McDermott, F.; E.I.M.F. Modification and preservation of environmental signals in speleothems. Earth-Sci. Rev. 2006, 75, 105–153. [Google Scholar] [CrossRef] [Scilit]
- Wong, C.I.; Breecker, D.O. Advancements in the use of speleothems as climate archives. Quat. Sci. Rev. 2015, 127, 1–18. [Google Scholar] [CrossRef] [Scilit]
- Duan, W.; Ruan, J.; Luo, W.; Li, T.; Tian, L.; Zeng, G.; Zhang, D.; Bai, Y.; Li, J.; Tao, T.; et al. The transfer of seasonal isotopic variability between precipitation and drip water at eight caves in the monsoon regions of China. Geochim. Cosmochim. Acta 2016, 183, 250–266. [Google Scholar] [CrossRef] [Scilit]
- Hu, C.; Henderson, G.M.; Huang, J.; Chen, Z.; Johnson, K.R. Report of a three-year monitoring programme at Heshang Cave, Central China. Int. J. Speleol. 2008, 37, 143–151. [Google Scholar] [CrossRef] [Scilit]
- Treble, P.C.; Fairchild, I.J.; Griffiths, A.; Baker, A.; Meredith, K.T.; Wood, A.; McGuire, E. Impacts of cave air ventilation and in-cave prior calcite precipitation on Golgotha Cave dripwater chemistry, southwest Australia. Quat. Sci. Rev. 2015, 127, 61–72. [Google Scholar] [CrossRef] [Scilit]
- Mahmud, K.; Mariethoz, G.; Baker, A.; Treble, P.C. Hydrological characterization of cave drip waters in a porous limestone: Golgotha Cave, Western Australia. Hydrol. Earth Syst. Sci. 2018, 22, 977–988. [Google Scholar] [CrossRef] [Scilit]
- Jex, C.N.; Mariethoz, G.; Baker, A.; Graham, P.; Andersen, M.S.; Acworth, I.; Edwards, N.; Azcurra, C. Spatially dense drip hydrological monitoring and infiltration behaviour at the Wellington Caves, South East Australia. Int. J. Speleol. 2012, 41, 283–296. [Google Scholar] [CrossRef] [Scilit]
- Genty, D.; Deflandre, G. Drip flow variations under a stalactite of the Père Noël cave (Belgium). Evidence of seasonal variations and air pressure constraints. J. Hydrol. 1998, 211, 208–232. [Google Scholar] [CrossRef] [Scilit]
- Spötl, C.; Fairchild, I.J.; Tooth, A.F. Cave air control on dripwater geochemistry, Obir Caves (Austria): Implications for speleothem deposition in dynamically ventilated caves. Geochim. Cosmochim. Acta 2005, 69, 2451–2468. [Google Scholar] [CrossRef] [Scilit]
- Proctor, C.J.; Baker, A.; Barnes, W.L.; Gilmour, M.A. A thousand year speleothem proxy record of North Atlantic climate from Scotland. Clim. Dyn. 2000, 16, 815–820. [Google Scholar] [CrossRef] [Scilit]
- Cai, B.; Pumijumnong, N.; Tan, M.; Muangsong, C.; Kong, X.; Jiang, X.; Nan, S. Effects of intraseasonal variation of summer monsoon rainfall on stable isotope and growth rate of a stalagmite from northwestern Thailand. J. Geophys. Res. Atmos. 2010, 115, D21104. [Google Scholar] [CrossRef] [Scilit]
- Cai, B.; Zhu, J.; Ban, F.; Tan, M. Intra-annual variation of the calcite deposition rate of drip water in Shihua Cave, Beijing, China and its implications for palaeoclimatic reconstructions. Boreas 2011, 40, 525–535. [Google Scholar] [CrossRef] [Scilit]
- Duan, W.; Cai, B.; Tan, M.; Liu, H.; Zhang, Y. The growth mechanism of the aragonitic stalagmite laminae from Yunnan Xianren Cave, SW China revealed by cave monitoring. Boreas 2012, 41, 113–123. [Google Scholar] [CrossRef] [Scilit]
- Kato, H.; Yamada, T. Controlling factors in stalagmite oxygen isotopic composition and the paleoprecipitation record for the last 1100 years in Northeast Japan. Geochem. J. 2016, 50, e1–e6. [Google Scholar] [CrossRef] [Scilit]
- Pu, J.; Wang, A.; Shen, L.; Yin, J.; Yuan, D.; Zhao, H. Factors controlling the growth rate, carbon and oxygen isotope variation in modern calcite precipitation in a subtropical cave, Southwest China. J. Asian Earth Sci. 2016, 119, 167–178. [Google Scholar] [CrossRef] [Scilit]
- Wang, Q.; Zhou, H.; Cheng, K.; Chi, H.; Shen, C.-C.; Wang, C.; Ma, Q. The climate reconstruction in Shandong Peninsula, northern China, during the last millennium based on stalagmite laminae together with a comparison to δ18O. Clim. Past. 2016, 12, 871–881. [Google Scholar] [CrossRef] [Scilit]
- Sang, W.; Zhang, D.; Wang, X.; Bai, Y.; Zhang, P.; Wu, X. Analysis of modern calcite deposition controlling factors in Wanxiang Cave from Wudu, Gansu. Quat. Sci. 2013, 33, 936–944. (In Chinese) [Google Scholar] [CrossRef]
- Hasegawa, W.; Watanabe, Y.; Matsuoka, H.; Ohsawa, S.; Brahmantyo, B.; Maryunani, K.A.; Tagami, T. Environmental parameters controlling stalagmite growth in tropical areas: New insights from cave monitoring at Petruk Cave, central Java, Indonesia. J. Cave Karst Stud. 2018, 80, 19–27. [Google Scholar] [CrossRef] [Scilit]
- Ronay, E.R.; Breitenbach, S.F.M.; Oster, J.L. Sensitivity of speleothem records in the Indian Summer Monsoon region to dry season infiltration. Sci. Rep. 2019, 9, 5091. [Google Scholar] [CrossRef] [Scilit] [PubMed]
- Kaufmann, G. Stalagmite growth and palaeo-climate: The numerical perspective. Earth Planet. Sci. Lett. 2003, 214, 251–266. [Google Scholar] [CrossRef] [Scilit]
- Rau, G.C.; Cuthbert, M.O.; Andersen, M.S.; Baker, A.; Rutlidge, H.; Markowska, M.; Roshan, H.; Marjo, C.E.; Graham, P.W.; Acworth, R.I. Controls on cave drip water temperature and implications for speleothem-based paleoclimate reconstructions. Quat. Sci. Rev. 2015, 127, 19–36. [Google Scholar] [CrossRef] [Scilit]
- Banner, J.L.; Guilfoyle, A.; James, E.W.; Stern, L.A.; Musgrove, M. Seasonal Variations in Modern Speleothem Calcite Growth in Central Texas, U.S.A. J. Sediment. Res. 2007, 77, 615–622. [Google Scholar] [CrossRef] [Scilit]
- Casteel, R.C.; Banner, J.L. Temperature-driven seasonal calcite growth and drip water trace element variations in a well-ventilated Texas cave: Implications for speleothem paleoclimate studies. Chem. Geol. 2015, 392, 43–58. [Google Scholar] [CrossRef] [Scilit]
- Baldini, J.U.L.; McDermott, F.; Hoffmann, D.L.; Richards, D.A.; Clipson, N. Very high-frequency and seasonal cave atmosphere pCO2 variability: Implications for stalagmite growth and oxygen isotope-based paleoclimate records. Earth Planet. Sci. Lett. 2008, 272, 118–129. [Google Scholar] [CrossRef] [Scilit]
- Baker, A.; Mariethoz, G.; Comas-Bru, L.; Hartmann, A.; Frisia, S.; Borsato, A.; Treble, P.C.; Asrat, A. The Properties of Annually Laminated Stalagmites—A Global Synthesis. Rev. Geophys. 2021, 59, e2020RG000722. [Google Scholar] [CrossRef] [Scilit]
- Chen, Z.; Auler, A.S.; Bakalowicz, M.; Drew, D.; Griger, F.; Hartmann, J.; Jiang, G.; Moosdorf, N.; Richts, A.; Stevanovic, Z.; et al. The World Karst Aquifer Mapping project: Concept, mapping procedure and map of Europe. Hydrogeol. J. 2017, 25, 771–785. [Google Scholar] [CrossRef] [Scilit]
- Ayliffe, L.K.; Gagan, M.K.; Zhao, J.-X.; Drysdale, R.N.; Hellstrom, J.C.; Hantoro, W.S.; Griffiths, M.L.; Scott-Gagan, H.; St Pierre, E.; Cowley, J.A.; et al. Rapid interhemispheric climate links via the Australasian monsoon during the last deglaciation. Nat. Commun. 2013, 4, 2908. [Google Scholar] [CrossRef] [Scilit] [PubMed]
- Liu, D.; Wang, Y.; Cheng, H.; Edwards, R.L.; Kong, X. Cyclic changes of Asian monsoon intensity during the early mid-Holocene from annually-laminated stalagmites, central China. Quat. Sci. Rev. 2015, 121, 1–10. [Google Scholar] [CrossRef] [Scilit]
- Azevedo, V.; Strikis, N.M.; Novello, V.F.; Roland, C.L.; Cruz, F.W.; Santos, R.V.; Vuille, M.; Utida, G.; De Andrade, F.R.D.; Cheng, H.; et al. Paleovegetation seesaw in Brazil since the Late Pleistocene: A multiproxy study of two biomes. Earth Planet. Sci. Lett. 2021, 563, 116880. [Google Scholar] [CrossRef] [Scilit]

Disclaimer/Publisher’s Note: The statements, opinions and data contained in all publications are solely those of the individual author(s) and contributor(s) and not of MDPI and/or the editor(s). MDPI and/or the editor(s) disclaim responsibility for any injury to people or property resulting from any ideas, methods, instructions or products referred to in the content. |
© 2026 by the authors. Licensee MDPI, Basel, Switzerland. This article is an open access article distributed under the terms and conditions of the Creative Commons Attribution (CC BY) license.