


Abstract
In the present study, sedimentation conditions and rates in Lake Pleshcheyevo (Yaroslavl region, Central part of the East European Plain) over the past 3600 years were reconstructed based on lithological, geochronological, isotopic, and paleobiological studies of bottom sediments from the deep part of the lake. C/N ratio analysis was used to identify the sources of organic carbon in the lake bottom sediments. Studies of anthropogenic indicators in pollen spectra provided a qualitative comparison of the two age–depth models. Deepwater mesotrophic to eutrophic sedimentation conditions were established during the epoch of cattle farming, 3600–2700 cal yr BP (1600–750 BCE), with relatively high (up to 0.04–0.05 g cm−2 year−1) mass accumulation rates (MAR) corresponding to period of high fluvial activity on the East European Plain. About 1900 cal yr BP (since the beginning of the 1st century CE), with the spread of slash-and-burn agriculture, lake eutrophication occurred, with an increase in sedimentation rates associated with deforestation and ploughing of territories. From 1300 to 200 cal yr BP (7th to the 19th century CE), sedimentation rates decreased. A sharp (up to 0.07 g cm−2 year−1) increase in MAR from the end of the 19th century to the middle of the 20th century was established. Similar trends are typical of lakes within the developed areas and are associated with expansion of cultivated agricultural land.
1. Introduction
Lake sediments are one of the most detailed sources of information about the landscapes and climate history [1,2,3,4]. Lake sediments have the potential for temporal resolution from years to decades, and studies of such sedimentary archives make it possible to detail existing ideas about natural environmental dynamics and identify short-period rhythms. This approach makes it possible to obtain detailed information about changes in sedimentation conditions and the natural and anthropogenic factors influencing them [5,6,7,8,9].
The sediments of Lake Pleshcheyevo, located in the northwestern part of the Volga River basin, are an informative paleoarchive for the central part of the East European Plain. It is believed that the lake basin was filled with water during the retreat of the Moscow (Saalian) glaciation during MIS 6 [10]. There are two hypotheses about the genesis of the basin: ice-sheet exaration or the melting of buried ice [11]. The relatively small catchment area, low hydrological openness, the duration of the lake’s existence, and its location south of the boundary of the last glaciation allow us to consider its deposits as a valuable source of paleogeographic information for the last 140 ka. Previous studies of magnetic minerals and organic matter distribution in the sediments of Lake Pleshcheyevo have established repeated changes in the bioproductivity of the reservoir during the last 10–12 ka, associated with climatic fluctuations and changes in water level [12]. Diatom data for bottom sediments of the last 5 ka indicate conditions of a deep reservoir in a humid, cool climate in the first half of the considered interval, and a rise in the water level synchronous with climate warming in the Late Holocene [13]. The location and structure of archaeological sites on the lake shores can be explained by lake-level fluctuations. Stratigraphic inversion of archaeological cultures may indicate possible erosion of the terraces, resulting in their redeposition [14].
However, the available data do not provide comprehensive information on the sedimentation rates in the lake, erosion processes in the catchment area, and the impact of human activity on them. The aim of this study is to reconstruct the conditions and rates of sedimentation in Lake Pleshcheyevo in the Late Holocene in terms of the intensification of economic development of adjacent territories. The sedimentation conditions were reconstructed using lithological analysises, diatom analysis, and stable oxygen- and carbon-isotope analyses. The age of the sediments was determined by radiocarbon dating and by the content of 137Cs. Since such reconstructions require high accuracy of depth-age models, the probable carbon sources in the sediments were analysed, and a spore-pollen analysis of the sediments was performed to provide an independent qualitative assessment of the chronological model using typical palynostratigraphic levels associated with palaeoenvironmental changes characteristic of Central European Russia.
2. Environmental Setting and the History of Human Exploration
2.1. Geomorphology
Lake Pleshcheyevo is in the Volga River basin. The catchment area of the lake includes the eastern edge of the Nerl lowland and a section of northern part of the Klinsko-Dmitrovskaya ridge. The Nerl lowland is a flat fluvioglacial plain formed during the Moscow deglaciation. It consists of alluvial and lacustrine deposits of Late and Middle Quaternary age, which range in thickness from 5 to 30 m. The Holocene deposits of the Nerl lowland are mainly represented by wetland deposits with a thickness of a few meters. The part of the basin belonging to the Klinsko-Dmitrovskaya ridge has a hilly moraine relief with traces of erosion processes. In some areas, the ridge is divided into separate massifs by river valleys and gullies. The Klinsko-Dmitrovskaya ridge is composed of loamy and clayey moraine deposits with a thickness reaching 120–160 m [15]. Quaternary sediments are underlain by Upper Jurassic and Cretaceous deposits.
2.2. Climate and Vegetation
The area is located in a moderately continental climate zone, with temperatures of −9.1 °C in January (the lowest) and +18.2 °C in July (the peak). The average annual precipitation is 590 mm, the maximum precipitation (60–70%) is observed in July–August, and the minimum is observed in February. Stable snow cover is usually established in the last ten days of November, and it becomes unstable by the end of the first ten days of April [16]. The main source of precipitation in the study area is the North Atlantic, from where moisture is transported by westerly winds. This determines the isotopic composition of precipitation in Lake Pleshcheyevo area; the average annual value of δ18O is about −11.5–−12‰ VSMOW, and the average annual summer value of δ18O is about −9‰ VSMOW [17].
The lake area is subject to intense wind effects; the average long-term wind speed is 3.8 m/s. South-westerly and north-westerly winds prevail. In a strong storm, the height of the waves on the lake can reach 1.6 m.
Sandy and sandy soddy-podzolic soils are common within the Nerl lowland. Several large wetlands with bog soils are located in the western part of the catchment area. Within the Klinsko-Dmitrovskaya ridge, the predominant soil type is represented by loamy soddy-podzolic soils [18]. This territory is in the subtaiga zone; the zonal vegetation is represented by hemiboreal broad-leaved-coniferous and small-leaved forests [19].
2.3. Hydrology
Lake Pleshcheyevo has an oval shape. The area of the lake with an average annual level of 137.31 m is 50.8 km2. The length of the lake is 9.55 km, its greatest width is 6.7 km, the greatest depth is 24.3 m, and the volume of water is 582.24 million m3. The catchment area of the lake is about 430 km2; four watercourses flow into it. The main tributary of the lake, the Trubezh River, originates in the Berendeyevo Bog on the watershed of the Oka and Upper Volga. The length of the river is about 30 km, its width is about 30 m, and the depth at the mouth is 2–3 m. Other tributaries of the lake are small rivers and streams. Only the Veksa River flows out of the lake; its length is about 8 km, the width at the source is about 20 m, and the average depth is 1.5 m [20].
There are clearly marked underwater ledges throughout the water area (Figure 1). There are no islands in the lake. The water temperature reaches its maximum in July and August, reaching 23–24 °C [21]. During the winter season and early spring (from December to April), most of the lake is covered with ice, with the exception of a small area that does not freeze due to bottom sources of groundwater. The presence of underground feeding causes a higher concentration of mineral salts (about 300 mg/L) in the lake compared to other lakes in the Yaroslavl region [11].
Figure 1.
Location of study area (a) and the bathymetric scheme of Lake Pleshcheyevo ((b), according to [11], with additions); the isobath section is 1 m. The red dot shows the drilling site, and the yellow dots show the points of water sampling for oxygen and carbon isotopes analysis in the lake area and in the tributaries and outflowing streams, sampled on 27 July 2025. Projection: WGS 84, UTM Zone 36N.
For the observation period from 1936 to 1963, it was found that the highest lake level was typically in May, and the lowest in November and December. The maximum oscillation amplitude for the observation period was 145 cm, the long–term average amplitude between the highest and lowest average monthly lake levels was 107 cm, and that between the long-term average monthly levels was 45 cm [22].
The input components of Lake Pleshcheyevo water balance consist of river discharge (Trubezh River accounting for 45%, other small rivers for 8%), groundwater discharge (~11%), and precipitation on the lake surface (~36%) [23]. The Trubezh River has a nivo-pluvial regime, which is dominated by the seasonal cycle of snowmelt and rainfall. The output components of the water balance are the Veksa River discharge (~61%), evaporation (~29%), and the water intake of the town of Pereyaslavl-Zalesskiy (~10%). Precipitation on the lake surface dominates over evaporation, at a ratio of approximately 1.2 [23].
2.4. The History of Human Development
The oldest archaeological objects in the study area belong to the Butovo Mesolithic culture, 10,000–8000 cal yr BP (8000–6000 BCE). They were discovered within an archaeological site in the Ivanovskoye Bog [24], located 20 km north of Lake Pleshcheyevo. Neolithic cultural strata have been reported in the Ivanovskoye and Berendeyevo Bogs [25,26,27], located 25 km south-east of the lake. Paleoanthropological material of the Berendeyevo Bog has an age about 6300–6000 cal yr BP (4200–4000 BCE) [28]. Objects from the Fatyanovo (Bronze Age) and Dyakovo (Early Iron Age) cultures on the lake terraces have been reported [29,30,31].
In the pre-Slavic period, there was a large enclave of agricultural Finno-Ugric tribes of the Merya [32,33]. Thirteen settlements dating 1300–1200 cal yr BP (700–800 CE) and the Alexandrova Gora settlement of this culture were discovered. These were located on gentle inter–riverine surfaces and slopes of the primary lake shores, and less often on lake terraces; some were situated in the valleys of nearby rivers. The total area of the developed territories was about 80–100 km2, and the distances between settlements did not exceed 1 km [33]. Around 1100–1000 cal yr BP (at the end of the 9–10th century CE), Old Russian colonization began in this area [34]. Despite the expansion of the settlement area, the immediate surroundings of the lake were most intensively developed [32]. In the 10–11th centuries CE [35] the Kleshchin hillfort appeared. In 1152, Yuri Dolgoruky founded the town of Pereslavl (later Pereslavl-Zalessky), the center of the Pereslavl Principality, at the mouth of the Trubezh River. During the Mongol–Tatar invasion, the town and its surroundings were repeatedly ravaged [36].
In the 16–17th centuries CE, new agricultural lands were actively developed in Yaroslavl Province and the number of villages grew. At that time, Pereslavl became a major trade and craft center. Industrial enterprises (metalworking, paper, textile and dyeing) appeared in the 18–19th centuries CE, and since the end of the 18 century CE [37], the number of rural settlements began to decrease [38]. After the Emancipation of the Serfs in 1861, the rural population of the district began to grow, and by the turn of the 19–20th centuries CE, its density reached 28 people per km2 [39]. In Soviet times, a collective farm (kolkhozes) system characterized by a constant increase in grain production was formed in the Yaroslavl Region. Since the 1930s CE, there has been a steady decrease in the rural population, and since the 1970s CE, a decrease in the area of agricultural land began [40]. In the post-Soviet period, individual small farms, mainly focused on dairy products, were common in the Pereslavl district [39].
3. Materials and Methods
3.1. Sampling
To obtain the most representative core for paleogeographic reconstructions, drilling operations were carried out in a deep hollow at the bottom of the lake (N 56.78338° E 38.7529°, depth at the drilling point 23.8 m) with calm sedimentation conditions, remote from the shores and inflowing rivers. Drilling of the PLESH-4 borehole was carried out in two stages, in February 2019 and in February 2023. During the first stage in 2019, two overlapping cores were taken using a Nesje corer [41] (the length of the upper core was 160 cm, the lower was 260 cm). For the second stage in 2023, a specially designed sampler was used to collect the upper part of the liquid bottom sediment, lowered on a cable and consisting of a transparent plastic pipe (d = 75 mm), a check valve, and a plug load. The extracted 90 cm column of surface bottom sediment was frozen on ice using the technology described by E.A. Konstantinov [42]. This technique was used to preserve the primary stratification of the highly water-saturated liquid sediment and to avoid the smearing and compaction typical of piston and gravity coring. The frozen core was transported to the laboratory and sliced into 5 cm samples. The cores selected with a Nesje corer were also divided into 5 cm samples.
3.2. Grain-Size Analysis
The volume-based grain-size analysis of the lake sediments was performed on a Malvern Mastersizer 3000 laser diffractometer with a Hydro EV disperser receiver (Malvern Panalytical Ltd., Malvern, UK). Samples were prepared according to a previously reported method [43,44,45].
The material was processed by 10% HCl to dissolve carbonates and 30% H2O2 to remove organic matter. It was then placed on a rotary shaker for 12 h with the preliminary addition of 4% Na4P2O7. Immediately before the measurement, the samples were treated in an ultrasonic bath in glass cups for 30 min. After ultrasonic treatment, seven repeated measurements were performed, the results of which were averaged using the Mastersizer v.3.62 software. The particle size distribution was calculated on the basis of Mie theory using the refractive index of particles n = 1.55 and the absorption coefficient k = 0.1 [46].
3.3. Loss on Ignition (LOI)
Loss on ignition (LOI) was determined according to [47] at two temperature regimes: 550 °C and 950 °C. The content of CaCO3 was calculated by dividing the LOI Δ950 (the difference between the LOI 950 °C and LOI 550 °C) by 0.44 [47,48].
3.4. Magnetic Susceptibility
The specific (mass) magnetic susceptibility (MS) was measured on a ZH Instruments 150L kappameter (ZH Instruments, Brno, Czech Republic) according to [49] at a frequency of 500 Hz and a magnetic field strength 320 A/m.
3.5. Measurement of Dry Bulk Density
Dry bulk density was calculated as follows. Samples of a fixed volume (2 cm3) were dried for 12 h at a temperature of 105 °C. After that, the weight of the dry sample was determined by weighing. The dry bulk density was determined as the ratio of the mass of the dry substance to the volume of the sample taken.
3.6. Core Correlation
To determine the overlap between the obtained cores, the changes in grain-size distribution, LOI, specific magnetic susceptibility, and dry bulk density were compared.
3.7. Radiocarbon Dating
Accelerator mass spectrometry (AMS) was used for 10 samples and liquid scintillation method (LSC) was used for 4 samples.
14C-AMS dating was performed at the Laboratory of Radiocarbon Dating and Electron Microscopy, Institute of Geography of the Russian Academy of Sciences. Total organic carbon (TOC) was isolated from the samples as the dating fraction. The test sample was processed in accordance with the standard procedure adopted in radiocarbon laboratories—treatment with 1 N HCl at t = 90 °C and washing to pH~6. The resulting preparation was dried at a t = 105 °C. The samples were graphitized using an automatic graphitization system AGE 3 (Ionplus AG, Dietikon, Switzerland), combined with a Vario Isotope Cub Elementar element analyser (Elementar Analysensysteme GmbH, Langenselbold, Germany) [50,51]. The graphite 14C/13C ratio was measured using a 0.5 MeV accelerator mass spectrometer (National Electrostatics Corp., Middleton, WI, USA) with the oxalic acid standard (NBS SRM 4990, National Institute of Standards and Technology, Gaithersburg, MD, USA) [52] at the Center for Applied Isotope Research at the University of Georgia (CAIS). The uncalibrated dates shown in Table 1 are indicated in radiocarbon years from 1950, calculated using a half-life of 14C equal to 5568 years. The error is indicated as a standard deviation and reflects both statistical and experimental errors. Results for all samples were adjusted for isotopic fractionation.
Table 1.
Results of radiocarbon dating of bottom sediments of Lake Pleshcheyevo (borehole PLESH-4).
14C-LSC dating was carried out at the Laboratory of Nuclear Geophysics and Radioecology of the National Research Center of Lithuania. Sample preparation was carried out in a similar way; TOC was isolated as the dating fraction. Benzene was obtained as a counting agent, and 14C activity was measured using a TriCarb 3170 TR/SL liquid scintillation meter (PerkinElmer, Waltham, MA, USA) [53].
Radiocarbon dates were calibrated using the IntCal20 curve [54]. The age-depth model was built using the Bayesian model in the Rbacon software package (version 3.1.1) [55]. The year 2023 (when the upper sediment core from Lake Pleshcheyevo was collected) was used as the fixed surface age.
3.8. Measurement of Radionuclide 137Cs
The content of 137Cs radionuclides was studied in the upper part of the sediment (0–90 cm of core), sampled using the Konstantinov methodology [42]. After measurement of dry bulk density, the samples were subsequently homogenized for radiochemical analysis. Slicing into 5 cm increments (Section 3.1) set the depth resolution of the 137Cs record at ±2.5 cm. The minimum detectable activity was 1 Bq kg−1. The 137Cs inventory was calculated as the sum over all layers of the product of specific activity, dry bulk density, and layer thickness.
The specific activity of radionuclides in sediment samples was determined at the Department of Radiochemistry of Lomonosov Moscow State University. The measurements were carried out using an ORTEC GEM-C5060P4-B gamma-ray spectrometer (ORTEC, Oak Ridge, TN, USA) equipped with a semiconductor detector made of extremely pure germanium (HPGe) with a beryllium window (same manufacturer). The relative detector efficiency was 20%, which provided the necessary sensitivity for detecting the technogenic radionuclide 137Cs (661 keV). A certified MAPEP 97 S4 (USDOE) intercalibration sample was used to ensure the accuracy of the measurements. To account for the effect of the composition and density of the sample on the counting efficiency (matrix effects), calibration curves were constructed for all the radionuclides being determined, reflecting the dependence of the recording efficiency on the mass of the sample. The measurement time of each sample was at least 24 h, to achieve an acceptable statistical error (<2%).
The peak of maximum specific activity of 137Cs in the profile was taken as the 1986 Chernobyl marker; the arguments supporting this attribution and its uncertainty are discussed in Section 5.1.
3.9. Calculation of Mass Accumulation Rates
Mass accumulation rate (MAR) defined as the product of dry bulk density and linear sedimentation rates was calculated using Formula (1) [7]:
MAR = LSR × DBD,
Where LSR is the linear sedimentation rate, directly calculated from the age-depth model, and DBD is dry bulk density.
Organic matter accumulation rate (OMAR), CaCO3 accumulation rate (CMAR), and clastic material accumulation rate (CLMAR) were calculated using Formulas (2)–(4):
OMAR = DBD × LSR × (LOI 550 °C/100),
CMAR = MAR × (CaCO3/100),
CLMAR = DBD × LSR × (100 − (LOI 550 °C + CaCO3))/100
3.10. Measurement of the Total Content of Organic Carbon and Nitrogen in Lake Sediments
The measurement of total organic carbon and total nitrogen contents was carried out via dry combustion using the CHNS-analyser Vario Isotope Cube Elementar element analyzer (Elementar Analysensysteme GmbH, Langenselbold, Germany) at the Laboratory of Radiocarbon Dating and Electron Microscopy, Institute of Geography of the Russian Academy of Sciences. High-purity reference samples (acetanilide with mass fraction of carbon 71.09%, nitrogen 10.36%, and sulfonamide with mass fraction of carbon 41.85%, nitrogen 16.27%) produced by Elemental Microanalysis Ltd. (Okehampton, Devon, UK) were used as standards. The standard samples were blind measured after every tenth sample in the series to monitor the stability of the device. The values of carbon (Corg) and nitrogen (N) were calculated in % by weight.
3.11. Carbonate Oxygen and Carbon Isotope Analyses
Because of the lack of abundant biogenic carbonate and the relatively high concentration of bulk carbonate (averaging 22%), we chose to analyse the bulk sediment for stable carbon and oxygen isotopes (δ13Cbulk and δ18Obulk). Seventy-nine samples of bulk sediment were taken from core PLESH-4 at intervals of 5 cm. Samples were dried, ground, and homogenized. For the stable isotope analysis, the samples were processed using 100% H3PO4 at t = 50 °C to dissolve the carbonates. The carbon and oxygen isotopic compositions were analysed using a Thermo Fisher Delta V Advantage mass spectrometer (Thermo Fisher Scientific, Bremen, Germany) with a Gas Bench II device in the Laboratory of Isotope Geochemistry and Geochronology at the Geological Institute of the Russian Academy of Sciences. The δ13Cbulk and δ18Obulk values are shown in per mil (‰) as deviations from the VPDB standard, as calibrated against laboratory standards. The analytical reproducibility for δ13Cbulk and δ18Obulk is better than ±0.1‰.
Modern water samples for isotope investigations were collected from the lake (one sample from the western part of the lake) and from the inflowing (one from the Trubezh River and one from the Gremyach Spring) and outflowing (one from the Veksa River) rivers in July 2025. The samples were filtered and stored in cool conditions until transport to the laboratory. The stable carbon isotope ratios of the dissolved inorganic carbon (δ13CDIC) and the stable oxygen isotope ratios (δ18Owater) of the modern water were measured using a Thermo Fisher Delta V Advantage isotope ratio mass spectrometer with a Gas Bench II device at the Laboratory of Isotope Geochemistry and Geochronology of the Geological Institute of the Russian Academy of Sciences. In this process, 2 mL of water were transferred from sampled 1 L bottles to vials with a rubber septum using a syringe. Then, 0.5 mL of 100% H3PO4 was added to the sample and dissolved CO2 was liberated by gently shaking the water. The δ13CDIC values are shown in per mil (‰) as deviations from the VPDB standard, and the δ18Owater values are shown in per mil as deviations from the VSMOW standard, both of which were calibrated against laboratory standards. Because only one lake-water sample was collected, in July 2025, the modern isotope measurements do not characterize seasonal or spatial variability in δ18Owater and δ13CDIC within the lake. Consequently, these measurements are used here as a qualitative reference for the present-day isotope system rather than as a quantitative calibration of the sedimentary isotope record.
The relationship between δ13Cbulk and δ18Obulk was examined as a complementary indicator of changes in lake-water balance and residence time, following Talbot’s conceptual framework [56]. To avoid selecting regression intervals on the basis of the isotope data themselves, δ13Cbulk–δ18Obulk relationships were calculated for independently defined stages of Lake Pleshcheyevo’s development. We calculated the Pearson correlation coefficient (r), coefficient of determination (R2), regression slope, p-value, and 95% confidence interval. Because isotope covariance may also be influenced by processes other than hydrological openness, it is interpreted together with sedimentological and paleobiological proxies rather than as a stand-alone indicator.
3.12. Scanning Electron Microscopy and EDS Analysis
To determine the origin of the carbonate phase and evaluate the possible contribution of detrital carbonate to the stable isotope signal, two representative carbonate-bearing sediment samples from different parts of core PLESH-4 (46 and 370 cm) were examined using scanning electron microscopy coupled with energy-dispersive X-ray spectroscopy (SEM–EDS) in the Laboratory of Physical Methods of Rock Studies, Geological Institute of the Russian Academy of Sciences. A natural chip was prepared by breaking off part of the core by hand. The samples were air-dried for two weeks, coated with gold, and analysed in BSE mode using a Tescan MV 2300 scanning electron microscope (TESCAN, Brno, Czech Republic) equipped with an Inca-200 EDS (Oxford Instruments, Abingdon, UK) at 20 kV and 120 µA for spectroscopy and 30 kVand 120 µA for imaging.
3.13. Diatom Analysis
Diatom analysis was performed for 40 samples. Slides were prepared according to the standard procedure [57]. Between 13 and 15 g of natural moisture samples was treated with 10% HCl and 30% H2O2 to remove carbonates and organic matter, then the clay fraction was removed by elutriation (6–8 times with an interval of 4 h). Next, the density separation of the samples was carried out using heavy liquid with a density of 2.3 g/cm3.
In each slide, between 500 and 1000 valves were identified. For the identification of taxa, we use [58,59,60,61]. The names of the identified diatom species were verified using the AlgaeBase resource [62].
A total of 116 species and subspecies of diatoms were identified. The diatom diagram was generated using the TILIA 2.6.1 software package [63]. The diatom diagram includes only taxa whose relative abundance reaches or exceeds 1% of the total identified valves in at least one sample. The division into local diatom assemblage zones (LDAZs) was performed based on the results of stratigraphically constrained cluster analysis (CONISS) [64]. Among the identified species of diatoms, ecological groups were distinguished according to their habitat and depending on the trophic status of the water body preferable for the species [65].
3.14. Pollen Analysis
The pollen analysis of 37 samples of clayey gyttja from the lower part of the PLESH-4 section (from a depth of 93–389 cm) at 4–10 cm intervals was carried out by Dr. Laura Gedimienė [66], who permitted us to use her data on the frequencies of selected taxa for this paper (personal communication, 31 December 2025); 19 samples from liquid clayey gyttja sediments of the upper part of the section (from a depth of 0–90 cm) at 5 cm interval were studied by O. Borisova and M. Nosova. The preparation of samples was performed according to standard procedures using heavy liquid [67]. For the entire section, the amount of pollen counted in each sample was at least 500 grains. Relative frequencies of arboreal pollen (AP), non-arboreal pollen (NAP), and spores were calculated based on the sum of total pollen and spores (AP + NAP + Spores = Σ). The contents of Pediastrum algae and microcharcoal particles >10 µm in pollen preparations were also calculated based on the sum of total pollen and spores. In addition, the contents of charcoal particles including finer fragments (>5 µm) were calculated for the upper layer of liquid clayey gyttja. The pollen diagram was constructed using the TILIA 2.6.1 software package [63].
4. Results
4.1. Core Correlation
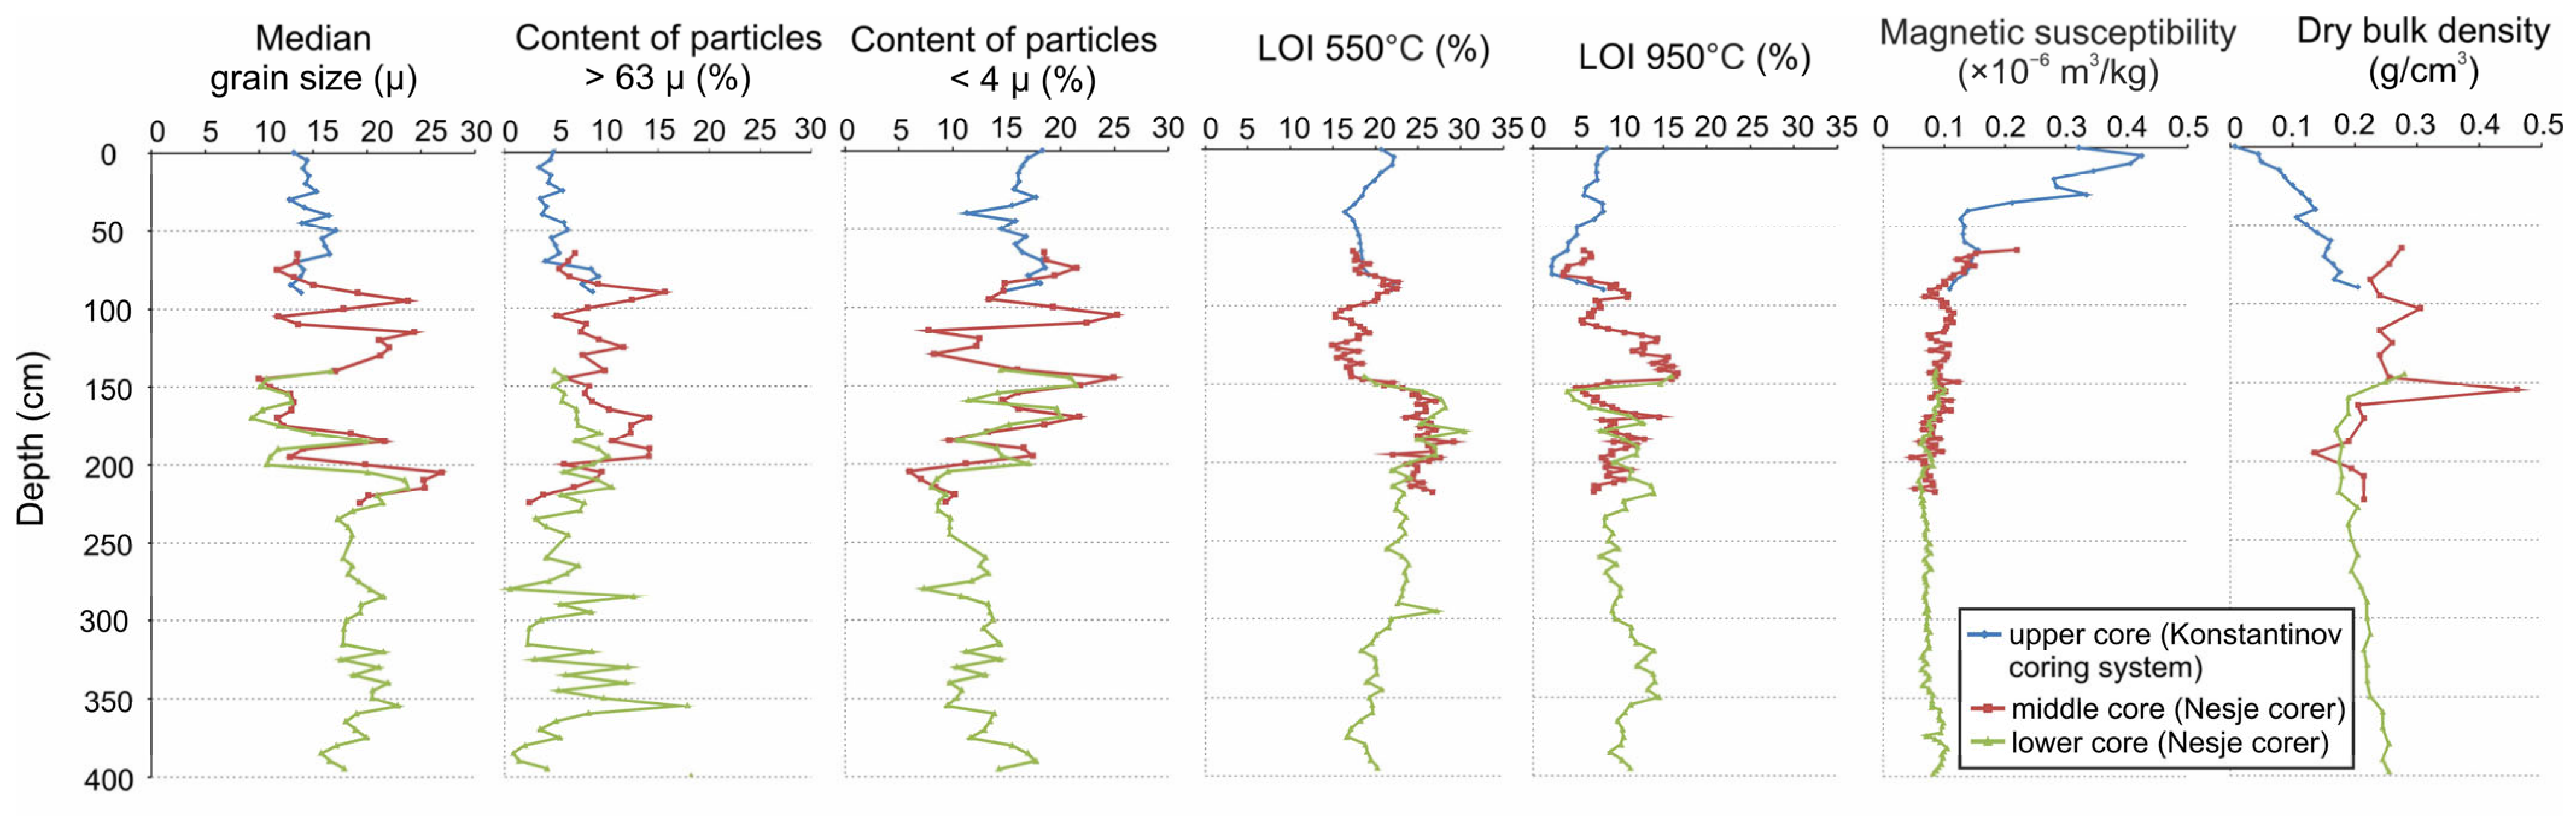
Matching of the curves of selected lithological and geochemical parameters showed that the overlap between the available cores corresponded to depths of 65–90 cm below the lake floor for the upper and middle cores, and 140–225 cm for the middle and lower cores (Appendix A, Figure A1). Thus, the total length of the sediment sequence recovered from borehole PLESH-4 was 400 cm.
4.2. Chronology
Radiocarbon dates obtained for the Lake Pleshcheyevo sediment core PLESH-4 are presented in Table 1.
137Cs was detected from the sediment surface down to 90 cm and was below the detection limit in deeper samples. 137Cs inventory reached a maximum of 0.61 kBq m−2 in the 25–30 cm sample and decreased gradually upward, reaching 0.04 kBq m−2 in the uppermost sample (Figure 2); the total inventory was 3.11 kBq m−2. No secondary maximum was resolved. We interpret the 25–30 cm maximum as the 1986 Chernobyl horizon.
Figure 2.
Vertical distributions of 137Cs in bottom sediments of Lake Pleshcheyevo.
The age-depth model was constructed using the Bayesian method based on 11 14C dates (Table 1) and one 137Cs date in the rbacon v package. 3.1.1. R programming environment. Four TOC dates obtained between 35 and 95 cm form a near-constant radiocarbon-age plateau of approximately 1350–1390 14C yr BP. The date IGANAMS 10757 at 35 cm clearly contradicts the 137Cs marker corresponding to 1986 CE at 25–30 cm, while the statistically indistinguishable dates IGANAMS 10753 (at 70 cm) and IGANAMS 10758 (at 75 cm) show no expected increase in age with depth. There are no lithological signs of landslides and turbidites in the column that could explain such an extremely intense sedimentation. Therefore, three dates obtained within 35–75 cm (IGANAMS 10757, IGANAMS 10753, IGANAMS 10758) were excluded from the generated age-depth model (see Figure 3 and Supplementary Materials).
Figure 3.
Age–depth model for bottom sediments of Lake Pleshcheyevo.
To transform depth into age, we tested two approaches: the median age and a composite model. The composite model used median values of the model age in the range from 396 to 96 cm, whereas in the upper 96 cm, the younger boundary of the 95% credible interval was adopted as the working chronology. The rationale for the second approach to constructing the depth–age model, along with a comparison of the two approaches, is given in Section 5.1.
4.3. Lithology and MAR
The median particle size varied from 9 to 24 µm (Figure 4). The lowest variability of this indicator (16–24 µ) was at a depth of 395–210 cm; the largest variation in values (from 9 to 24 µm) was observed at depths of 210–85 cm. In the upper layer of the sediments, the median particle size changed from 13 to 17 µ. The sand content varied from 0.5 to 17%, with maximum values observed in the ranges of 360–310 and 145–70 cm. The clay content varied from 7 to 25%; at depths of 395–205 cm, the clay content ranged from 7 to 18%. The maximum range of values was at a depth of 205–95 cm; at the 95–0 cm interval, the variation in the content of the clay fraction was minimal, ranging from 11 to 19%.
Figure 4.
Lithological features of bottom sediments of Lake Pleshcheyevo (1—liquid clayey gyttja, 2—clayey gyttja).
Organic matter content (LOI 550°C) at depths of 395–150 cm varied from 15 to 30%; at depths of 150–0 cm, it decreased slightly and varied from 15 to 23%. The CaCO3 content varied from 5 to 38%. The maximum values (26–39%) were observed in the depth range from 150 to 120 cm. The clastic part of the bottom sediment varied from 45 to 77%; its maxima corresponded to the 395–350 cm and 80–25 cm intervals.
Magnetic susceptibility of the sediment varied from 0.05 to 0.42 × 10⁻⁶ m3/kg. In the depth range of 395–90 cm, magnetic susceptibility ranged from 0.05 to 0.11 × 10⁻⁶ m3/kg. In the 90–40 cm interval, its values began to increase upward along the section from 0.09 to 0.13 × 10⁻⁶ m3/kg. In the upper 40 cm of the core, the values began to increase sharply upward along the section, from 0.21 to 0.42 ×10⁻⁶ m3/kg.
The dry bulk density in the depth range 395–160 cm was 0.17–0.19 g/cm3. At the depths of 160–80 cm, the dry bulk density increased to 0.22–0.30 g/cm3. In the upper 80 cm of sediment, the dry bulk density decreased significantly up the core from 0.18 g/cm3 to 0.01 g/cm3.
Figure 5 shows significant fluctuations in the MAR and its components calculated using the two age–depth models. In the period of about 3550–2700 cal yr BP (1600–750 BCE), MAR (ranging from 0.04 to 0.05 g cm−2 year−1) and all its components were relatively high according to both age–depth models, which showed similar magnitudes and trends. Between 2700–1300 cal yr BP (750 BCE–700 CE), MAR decreased to 0.02–0.03 g cm−2 year−1, and OMAR and CLMAR also decreased, whereas in the period of 1950–1450 cal yr BP (0–500 CE), CMAR increased to 0.004–0.011 g cm−2 year−1 according to both age–depth models. In the median age–depth model, the time interval from 1300 cal BP (700 CE) to the 1990s CE was characterized by the lowest sedimentation rates; from the 1990s onwards, MAR and all its components showed a sharp increase (MAR reached 0.05–0.06 g cm−2 year−1, CMAR and OMAR increased up to 0.009–0.010 g cm−2 year−1, CLMAR up to 0.035 g cm−2 year−1), with the highest values occurring in the early 2000s. For the composite age–depth model, the lowest sedimentation rates were recorded in the interval from 1300 to 150 cal yr BP (700–1800 CE), whereas sharp increases in MAR (with maximum values up to 0.06–0.07 g cm−2 year−1), OMAR, CMAR, and CLMAR (the latter were particularly high and reached 0.045 g cm−2 year−1) occurred around 50 cal yr BP (1900 CE).
Figure 5.
Common mass accumulation rate and accumulation rate of some Lake Pleshcheyevo sediment components for the past 3600 years (MAR—mass accumulation rate, CMAR—CaCO3 accumulation rate, OMAR—organic matter accumulation rate, CLMAR—clastic material accumulation rate).
4.4. C/N Ratio
The atomic C/N ratio (Figure 6) varied from 9.72 to 11.93. Values of ~10–12, such as these, are intermediate and do not allow an unambiguous discrimination between autochthonous and allochthonous sources; they may reflect a mixed contribution [68,69].
Figure 6.
C/N ratio in bottom sediments of Lake Pleshcheyevo.
4.5. Carbon and Oxygen Stable Isotopes Records in Lake Sediments and Modern Isotope Hydrology
The δ18Obulk values of Lake Pleshcheyevo fluctuated around −11‰ VPDB (Figure 7). There was a slight decrease from −10.5 to −11‰ VPDB at depths of 330–250 cm; the values dropped to −11.5‰ VPDB higher in the section, remaining relatively low (down to −12‰ VPDB) until a depth of 245 cm. At depths of 245–165 cm, the values increased to ~−10.5‰ VPDB; while their slight decrease was noted at a depth of 190 cm, the amplitude of δ18Obulk fluctuations increased. In the 165–150 cm interval, there was a decrease in δ18Obulk below −12.5‰ VPDB. δ18Obulk fluctuations of large amplitude were observed in sediments from depths of 150–90 cm. At depths from 90 to 40 cm, δ18Obulk decreased to ~−11.5‰ VPDB. In the upper samples, there was a sharp increase in δ18Obulk from −11 to −11.5‰ VPDB.
Figure 7.
Carbon and oxygen stable isotopes content in bottom sediments of Lake Pleshcheyevo.
At depths from 395 to 315 cm (3550–3150 cal yr BP, 1600–1200 BCE), δ13Cbulk values reached about −3‰ VPDB, with a slight decrease to −3.5‰ VPDB in the 310–245 cm interval. From a depth of 210 cm, changes in the content of δ13Cbulk were more noticeable. In the 210–170 cm interval (2550–2150 cal yr BP, 600–200 BCE), δ13Cbulk was about −2‰ VPDB. Higher along the section, at a depth range of 160–145 cm (2050–1900 cal yr BP, 100 BCE–50 CE), the values decreased sharply to −3.5‰ VPDB. These low values of δ13Cbulk coincided with a decrease in δ18Obulk at the same depths. In the 145–90 cm interval, the amplitude of fluctuations in δ13Cbulk values increased, while the average values reached −0.5‰ VPDB. At depths of 80–0 cm, there was a rapid decrease of δ13Cbulk from −0.6 to −2‰ VPDB.
δ18Owater and δ13CDIC values with an uncertainty of 0.1, for modern water in Lake Pleshcheyevo and its inflowing and outflowing rivers, are presented in Table 2.
Table 2.
Stable oxygen isotope composition of water and stable carbon isotope composition of dissolved inorganic carbon in Lake Pleshcheyevo and its inflowing and outflowing rivers.
4.6. SEM-EDS Characterization of the Carbonate Fraction
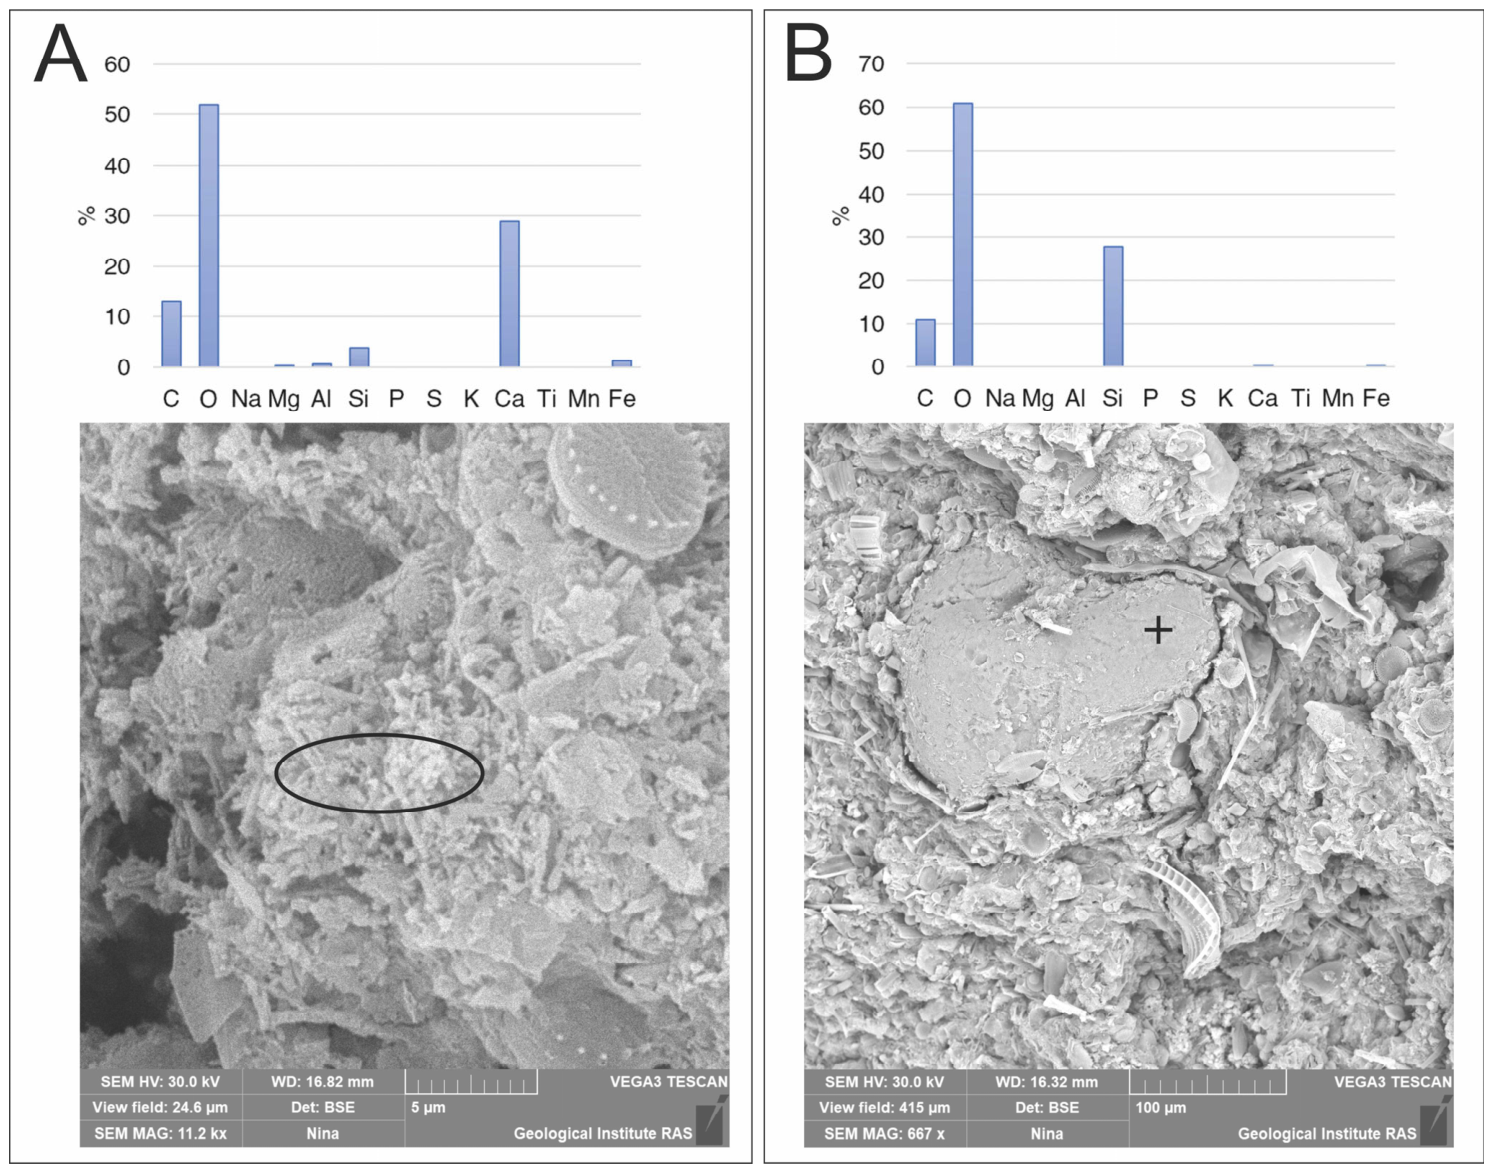
SEM-EDS observations showed that the carbonate occurring in the studied sediments was predominantly authigenic, represented by dendritic structures (Appendix B, Figure A2A). In contrast, the detrital component was represented mainly by silica-bearing minerals (Figure A2B). No population of detrital carbonate grains was identified in the examined samples. These observations indicate that the stable carbon- and oxygen-isotope composition measured on the bulk carbonate fraction was dominated by authigenic lacustrine carbonate rather than by transported carbonate material.
4.7. Diatom Analysis
Based on changes in the species composition of diatom associations, four local diatom assemblages zones (LDAZs) were identified (Figure 8).
Figure 8.
Percentage diatom diagram for the Lake Pleshcheyevo bottom sediments. The repeating curves were drawn with tenfold exaggeration.
Regarding LDAZ I (400–208 cm), the majority (from 80 to 92%) of the identified valves were from planktonic species, among which the most numerous were valves of the eutrophic Aulacoseira granulata (from 17 to 65%), A. ambigua (the content increases upward in the LDAZ I from 1–2 to 20%), and Stephanodiscus neoastraea (from 4 to 18%), the mesotrophic species S. alpinus (from 18 to 42%), and the oligotrophic species Pantocsekiella ocellata (up to 14%). The total content of epiphytic and benthic species was approximately equal and varied from 3 to 8%. Among the epiphytic diatoms, the maximum content was observed for Pseudostaurosira brevistriata, which is indifferent to trophic conditions, but this did not exceed 4%. The most numerous among the benthic species were mesotrophic Cavinula scutelloides (up to 5%); the content of mesotrophic Amphora spp. (A. affinis, A. ovalis, A. pediculus) reached a few percent. The total content of eutrophic diatoms varied widely and ranged from 30 to 70%, and that of mesotrophic diatoms ranged from 20 to 60%. From 2 to 15% of diatom valves were from oligotrophic species, and from 1 to 6% were indifferent to trophic status.
In LDAZ II (208–150 cm), the total content of planktonic species decreased to 40–80%. There was an almost synchronous decrease in the content of valves of all planktonic species, with the exception of Aulacoseira ambigua; its content increased to 30% compared with LDAZ I. Content of epiphytic diatoms increased to 12–30%. The increase in the content of Fragilareacea valves was especially noticeable, including Pseudostaurosira brevistriata (from 2 to 30%) and the mesotrophic species Staurosirella martyi (from 5 to 18%). Benthic species content changed from 5 to 20% of all valves; among these, Cavinula scutelloides was the most abundant (from 3 to 11%). The content of eutrophic diatoms was slightly reduced and reached 35 to 50%, and that of mesotrophic diatoms was reduced from 30 to 55%. Oligotrophic diatoms’ abundance was less than a few percent. Towards the top of LDAZ II, the content of valves of diatoms indifferent to trophic status decreased noticeably (from 20–30 to 5–10%).
In LDAZ III (150–65 cm), the content of planktonic diatoms increased to 80–90%, notably, Aulacoseira granulata (from 10 to 40%), A.ambigua (from 5 to 20%), Stephanodiscus neoastraea (from 20 to 35%), and S. alpinus (from 6 to 30%). The total epiphytic content decreased compared to LDAZ-II. In the lower part of the LDAZ-III, it reached 5–7% and gradually increased to 10–20% due to an increase in the content of Pseudostaurosira brevistriata (up to 4–7%), Staurosirella martyi (up to 5%), and the mesotrophic species Fragilaria crotonensis (up to 5%). The total content of benthic species was 2–7%, and valves of Cavinula scutelloides were the most abundant (up to 4%). The total content of eutrophic diatoms increased upward in the LDAZ-III from 60 to 70–80%. The content of mesotrophic diatoms decreased to 20–40%, oligotrophic diatoms content varied from 1 to 6% of all valves, and the content of diatoms indifferent to trophic status was from 2 to 10%.
In LDAZ IV (65–0 cm), the content of planktonic diatoms decreased from 70–80 to 40–50%. The most abundant were Aulacoseira granulata (from 15 to 40%), oligotrophic A. islandica, A. subarctica (up to 10%), and Pantoscekiella ocellata (up to 6%), mesotrophic Lindavia affinis (up to 10%), L. praetermissa (up to 6%), and Stephanodiscus alpinus (up to 5%), and eutrophic Cyclotella atomus (from 7 to 15%) and S. neoastraea (the content decreased in the upper LDAZ IV from 20 to 2%). The total epiphytic content increased upward in the LDAZ IV from 15–20 to 40–50%, primarily due to the species Pseudostaurosira brevistriata (from 10 to 25–30%), Fragilaria crotonensis (from 3 to 7%), and Staurosirella martyi (from 3 to 5%). The total content of benthic diatoms was 5–12%. The total content of eutrophic diatoms decreased in the upper LDAZ IV from 50 to 30%. The content of mesotrophic diatoms varied from 10 to 30%, that of oligotrophic diatoms from 2 to 25%, and the abundance of diatoms indifferent to trophic status varied from 15 to 30%.
4.8. Pollen Analysis
Changes in the content of selected taxa (the sum of AP; the sum of pollen from broadleaved trees Quercus, Ulmus, Tilia, Fraxinus—Quercetum mixtum (QM); the sum of NAP, including cultivated plants Cerealia, Fagopyrum, major ruderal and nitrophilous plants), as well as Pediastrum algae and microcharcoal particles, are shown in Figure 9.
Figure 9.
Contents of selected pollen taxa, Pediastrum, and microcharcoal particles (solid graph—fragments > 10 µm, hollow graph—>5 µm) in the bottom sediments of Lake Pleshcheyevo in % based on Σ = AP + NAP + Spores. The repeating curves were drawn with tenfold exaggeration. At a depth of more than 85 cm, charcoal particles smaller than 10 µm were not counted.
At the base of the section, from depths of 395–380 cm, corresponding to 3550–3500 cal yr BP (1600–1550 BCE) under both age–depth models, the composition of the pollen spectra already shows higher contents of NAP in general and indicators of grazing (Urtica, Rumex, etc.) than are typical for the coniferous–broadleaf forest zone of the European part of Russia in the absence of anthropogenic impact [70,71,72,73,74].
At depths of 220–150 cm (2650–1950 cal yr BP, 700–0 BCE under both age–depth models), the composition of pollen spectra reflects the widespread distribution of spruce forests with a small participation of broadleaved species, representing natural zonal vegetation of the Subatlantic Holocene interval (“upper spruce maximum” according to [75]). The Picea pollen content here was 30–35%. The NAP contents were minimal for the entire section; the contents of microcharcoal were stable, amounting to less than 10%.
From a depth of about 150 cm (1950 cal yr BP, the beginning of Common Era under both age–depth models), the amount of NAP increases, and Cerealia pollen appears in the spectra. At the same time, there is a steady presence of pollen from ruderal plants (Cichorioideae, Plantago major, etc.). In the depth range of 115–100 cm (1550–1350 cal yr BP, about 400–600 CE under both age–depth models), the content of NAP increases even more, reaching 30–35%. Fagopyrum and Cannabis pollen are present among the cultivated plants. The variety of ruderals also increases (Centaurea cyanus pollen is noted). Synchronously with the increase in the proportion of Cerealia in the spectra, the contents of microcharcoal and Pediastrum algae increase. Urtica pollen is constantly present.
In the 100–90 cm interval (1350–1200 cal yr BP, about 600–750 CE according to the median age–depth model or 1350–1050 cal yr BP, about 600–900 CE according to the composite age–depth model), there is a sharp increase in the AP content (mainly due to Betula pollen) with a decrease in the proportion of pollen from all anthropogenic indicators. Starting from a depth of 90 cm, dated to about 1200 cal BP (750 CE) or 1050 cal yr BP (900 CE) depending on whether the median or the composite age–depth model is used, the NAP increases significantly and stabilizes at 30–35%. The proportion of Cerealia reaches 7–10%, and the diversity of anthropogenic indicators increases again. Fagopyrum and Centaurea cyanus are constantly present. The content of Pediastrum also increases dramatically, reaching 150%. The contents of microcharcoal particles >10 µm are about 30%; the contents of charcoal including smaller particles (>5 µm) are much higher and amount to about 70%.
At depths of 80–70 cm (1050–950 cal yr BP, 900–1100 CE according to the median age-depth model or 750–550 cal yr BP, 1200–1400 CE according to the composite age-depth model), the content of microcharcoal particles >10 µm is quite stable and reaches 20–25%. The charcoal content, including fine particles (>5 µm), forms a sharp peak nearly three times the sum of pollen and spores; this peak occurs at approximately 950 cal BP (1000 CE) or 650 cal BP (1300 CE), depending on whether the median age–depth model or the composite model is used. Higher up the section, the content of charcoal particles >5 µm decreases to 110–130% and then drops sharply to 20% at a depth of 45 cm (300 cal yr BP, mid-17th century according to the median age-depth model or 100 cal yr BP, mid-19th century according to the composite age-depth model). In general, in the 45–0 cm interval, the contents of NAP and anthropogenic components in pollen spectra steadily decrease due to increased contents of Betula and Pinus pollen.
5. Discussion
5.1. Justification of the Composite Depth–Age Model
Changes in the composition of selected pollen taxa (AP, NAP, QM, and indicators of agriculture—Cerealia, Fagopyrum, Cannabaceae, Centaurea cyanus, Plantago major, P. lanceolata, Cichorioideae, Chenopodiaceae, Urtica) and microcharcoal made it possible to reconstruct the main stages of agricultural development in the area surrounding Lake Pleshcheyevo in the Late Holocene. Since the general patterns of changes in pollen indicators of agriculture in the sedimentary records of the temperate zone of European Russia have already been examined in considerable detail in recent studies [70,71,72,73,74], the corresponding stages, thresholds, and events such as the late phase of the Dyakovo culture, the “Dark Ages” (in the local sense), and the Old Russian period (all discussed below) can be used as an independent qualitative assessment of the proposed composite chronological model of sedimentation in Lake Pleshcheyevo.
It is known that a productive farming (cattle husbandry) could have emerged in the study area no earlier than 3600 cal yr BP (Late Bronze Age), whereas slash-and-burn agriculture appeared between 2800 and 2700 cal yr BP (Early Iron Age) [76]. In the lower part of the pollen diagram, anthropogenic impact on vegetation becomes apparent only with the appearance of isolated pollen grains of cultivated cereals around 2000 cal yr BP (at the beginning of the 1st century CE); however, the constant presence of nitrophilous plants in the pollen spectra, observed as early as 3500 cal yr BP (mid-2nd millennium BCE), supports the hypothesis regarding the existence of small-scale cattle breeding.
The distribution of pollen from cultivated cereals and other anthropogenic indicators in the sediments of Lake Pleshcheyevo reflects stepwise changes characteristic of the southern taiga zone of the European part of Russia as a whole [71,72]. The sharp drop in the proportion of Picea and Quercetum mixtum that began around 1900 cal yr BP (1st century CE) and an even more dramatic increase of Betula pollen, along with an increase in the content of microcharcoal to 20%, reflect the disturbance of primary forests and their replacement by secondary small-leaved forests during the spread of slash-and-burn agriculture. By the end of the Early Iron Age (1700–1500 cal yr BP, about 200–300 CE), the anthropogenic impact seems to be increasing. The contents of all indicators of agricultural activity decrease during the period 1400–1300 cal yr BP (6–7th centuries CE), which corresponds to the desolation of the “Dark Ages” [77].
The Old Russian period, which began 1100 calibrated years ago (9th century CE), is characterized by the onset of lake eutrophication (indicated by an increase in Pediastrum content) and an increase in the content of microcharcoal. After that time, Fagopyrum pollen typical of Old Russian times was frequently present. The maximum content of finer charcoal particles corresponds to the time of large fires in Pereslavl 700–500 cal yr BP. Historical sources report several large fires in Pereslavl during the period from 1238 (Batu Khan invasion) to 1294 when Pereslavl was burned by Prince Fyodor the Black of Yaroslavl; later, large fires occurred in the city in 1372, 1408, and 1419 [36]. However, given the resolution of our record, we do not attempt to attribute the charcoal peak to any individual fire event. From 600–500 cal yr BP (in the 14–15th centuries CE), slash-and-burn agriculture was replaced by arable farming, and the content of fine-grained charcoal decreased threefold.
The New Times peak of anthropogenic indicators of the Modern period that started at 400–300 cal yr BP (1500–1600 CE), characteristic of coniferous–broadleaf forests zone in European Russia [72], is weakly expressed in the pollen spectra of Lake Pleshcheyevo bottom sediments. Perhaps this is due to the peculiarities of farming in this region; a high content of NAP along with a low content of Cerealia may indicate a more significant role of cattle breeding.
The decline of anthropogenic activity in Modern times (depopulation of rural areas after World War II, which continued at the end of the Soviet period and ended with massive land abandonment in the 1990s) is reflected in the pollen data by a decrease in the contents of Cannabaceae, cultivated cereals, other anthropogenic indicators, microcharcoals, and Pediastrum, as well as by a sharp increase in the proportion of Betula pollen in the spectra, reflecting the processes of overgrowth of abandoned agricultural land with birch.
Thus, the obtained palynological data and the chronological correspondence of the identified ‘anthropogenic’ phases in Lake Pleshcheyevo to a wide range of pollen data from the coniferous–broadleaf forests of European Russia support the composite age–depth model rather than the median model.
The 1986 attribution yields a linear sedimentation rate of 0.74 cm yr−1 for 1986–2023; the corresponding mass accumulation rate is consistent with the 20th-century part of the record because dry bulk density decreases upward to 0.01 g cm−3. It is independently supported by the abrupt rise in magnetic susceptibility in the uppermost 40 cm. Under the adopted model, the 1963 weapons-fallout horizon lies at ~31 cm, i.e., in the sample immediately below the maximum, so the two are inseparable at the present resolution and the absence of a secondary peak carries no diagnostic weight; the Chernobyl attribution is supported by the 137Cs inventory of 3.11 kBq m−2 relative to the deposition expected from global fallout alone [78]. The low inventory values below the maximum indicate downward diffusion, which broadens the profile but does not systematically displace the peak [79], while sorption on illite is strong [80]. Together with the ±2.5 cm sampling resolution, this gives an uncertainty of about ±5 years. As 210Pb was not measured, the chronology of the uppermost sediments rests on this single marker.
Three 14C dates excluded from the final depth-age model (IGANAMS 10757, IGANAMS 10753, and IGANAMS 10758) appear to have an extended radiocarbon age, which may be due to the introduction of allochthonous organic matter into the lake’s water area. The C/N ratios in the sediments are intermediate and do not allow unambiguous discrimination between autochthonous and allochthonous sources; therefore, they are consistent with, but do not prove, such an input, and they cannot exclude it either. Such effects are not uncommon when total organic carbon in lake sediments is dated, owing to the possibility of older carbon entering the reservoir during the erosion of carbonate-containing rocks from the catchment area [81,82,83]. This pattern probably reflects a temporally variable contribution of reworked old organic matter from the catchment, possibly intensified by anthropogenic disturbance and soil erosion during the past 1000–1500 years, rather than a constant lake-wide reservoir offset. The date at 95 cm was retained because it is stratigraphically consistent with the deeper sequence. However, because all radiocarbon measurements were obtained from bulk TOC and no suitable terrestrial macrofossils or other independent chronological markers were available below the 137Cs horizon, an old-carbon effect in the lower part of the core cannot be excluded or quantified. Accordingly, the modelled ages may be systematically overestimated to an unknown degree. The agreement of the pollen-derived anthropogenic stages with regional archaeological and palynological evidence should therefore be regarded as a qualitative consistency check, rather than as independent validation of the age–depth model.
The posterior median in the age–depth model implies an abrupt, almost ninefold increase in the linear sedimentation rate (Figure 5), from approximately 0.65 mm yr−1 at 25–35 cm to 5.81 mm yr−1 at 0–25 cm. However, no erosional contact, turbidite, change in sediment type, or similarly abrupt shift in the lithological properties was observed at the 137Cs horizon. The adopted chronology of the composite age–depth model produced a more gradual upward increase in sedimentation rate, from approximately 0.40 mm yr−1 at 70–95 cm to 0.55 mm yr−1 at 45–70 cm, 1.06 mm yr−1 at 35–45 cm, 2.04 mm yr−1 at 25–35 cm, and 7.58 mm yr−1 at 0–25 cm. This pattern is more consistent with the progressive decrease in dry bulk density and sediment compaction towards the core surface.
Accordingly, based on the lithological and palynological markers described above, we adopted the composite age–depth model as the working chronology.
5.2. Factors Controlling Stable Oxygen and Carbon Isotope Composition of Lake Carbonate
In principle, the isotope composition of bulk sedimentary carbonate may be affected by mixing between authigenic carbonate and transported carbonate derived from the catchment. If the two components have different δ13C and δ18O values, changes in their relative abundance could produce apparent isotope shifts unrelated to climatic and hydrological changes. SEM-EDS observations demonstrated that the carbonate fraction of the studied Lake Pleshcheyevo sediments was predominantly authigenic, whereas the detrital mineral fraction was dominated by quartz. Therefore, δ13Cbulk and δ18Obulk are interpreted primarily as signals of authigenic lacustrine carbonate.
δ13Cbulk reflects the δ13CDIC from which it precipitates. δ13CDIC depends on the DIC source; C3-dominated catchments produce low δ13CDIC values ~−27‰ VPDB, whereas C4 or karstic inputs yield higher values up to −10‰ VPDB [84]. However, δ13Cbulk values in the Lake Pleshcheyevo record and modern δ13CDIC were both more enriched. In hydrologically open lakes, DIC tends to equilibrate with atmospheric CO2, resulting in enriched δ13CDIC values of up to +1‰ VPDB [85]. In addition to atmospheric exchange, variation in biological productivity may also have modified δ13CDIC in Lake Pleshcheyevo. Enhanced photosynthesis enriches δ13CDIC by preferential removal of the lighter carbon isotope [84]. This interpretation is supported by the micropaleontological record of Lake Pleshcheyevo bottom sediments, where increased algae (Pediastrum) content coincides with enriched δ13Cbulk. Thus, δ13Cbulk variability in Lake Pleshcheyevo is primarily controlled by relatively stable atmospheric CO2 exchange and secondarily influenced by changes in biological productivity of the reservoir.
Stable oxygen isotope composition of authigenic carbonate in lake sediments reflects variations in both temperature and δ18Owater [84]. In temperate latitudes, where kinetic effects related to precipitation amount are negligible, δ18Oprec shows a strong correlation with mean annual temperature [86]. In hydrologically open lakes with a nivo-pluvial regime (such as Lake Pleshcheyevo), the primary driver of δ18Obulk variability is change in δ18Oprec rather than local temperature alone. The residence time of ~10 yr [21] further smooths short-term variability in δ18Oprec.
The comparison between sediment carbonate and modern lake water must be treated cautiously because only one lake water sample was obtained during summer. The available data therefore do not constrain either seasonal variations in lake-water δ18O or the isotope composition of water specifically during the whole season of authigenic carbonate precipitation. Under isotopic equilibrium, uppermost δ18Obulk values of uppermost Lake Pleshcheyevo sediments (−11.7‰ VPDB) would correspond to a lake δ18Owater value of −9.7‰ VSMOW, based on the fractionation equation [87], whereas the measured δ18Owater from the western shore of Lake Pleshcheyevo was −7.7‰ VSMOW, showing a 2‰ offset. This offset prevents the direct application of paleotemperature equations to the δ18Obulk record of Lake Pleshcheyevo. Nevertheless, the calculated δ18Owater value (−9.7‰ VSMOW) is close to the modern mean summer δ18Oprec in the region (−9‰ VSMOW). This discrepancy may result from non-representative lake-water sampling affected by evaporative enrichment in the shallow near-shore zone during the warm summer season. In summary, the δ18Obulk in Lake Pleshcheyevo bottom sediments is controlled by multiple factors and better suited as a proxy for hydroclimatic variability reflecting changes in δ18Oprec, governed by moisture sources, air-mass trajectories, and condensation temperature of rain and snow [83]. Given the persistent dominance of westerly moisture transport over eastern Europe and the absence of evidence for a major reorganization of the major moisture-source regime during the past 3600 years [88], condensation temperature is likely to have been a major first-order control on δ18Oprec. Changes in moisture source and air-mass trajectories associated with atmospheric-circulation variability may nevertheless have modulated the isotopic signal on shorter timescales.
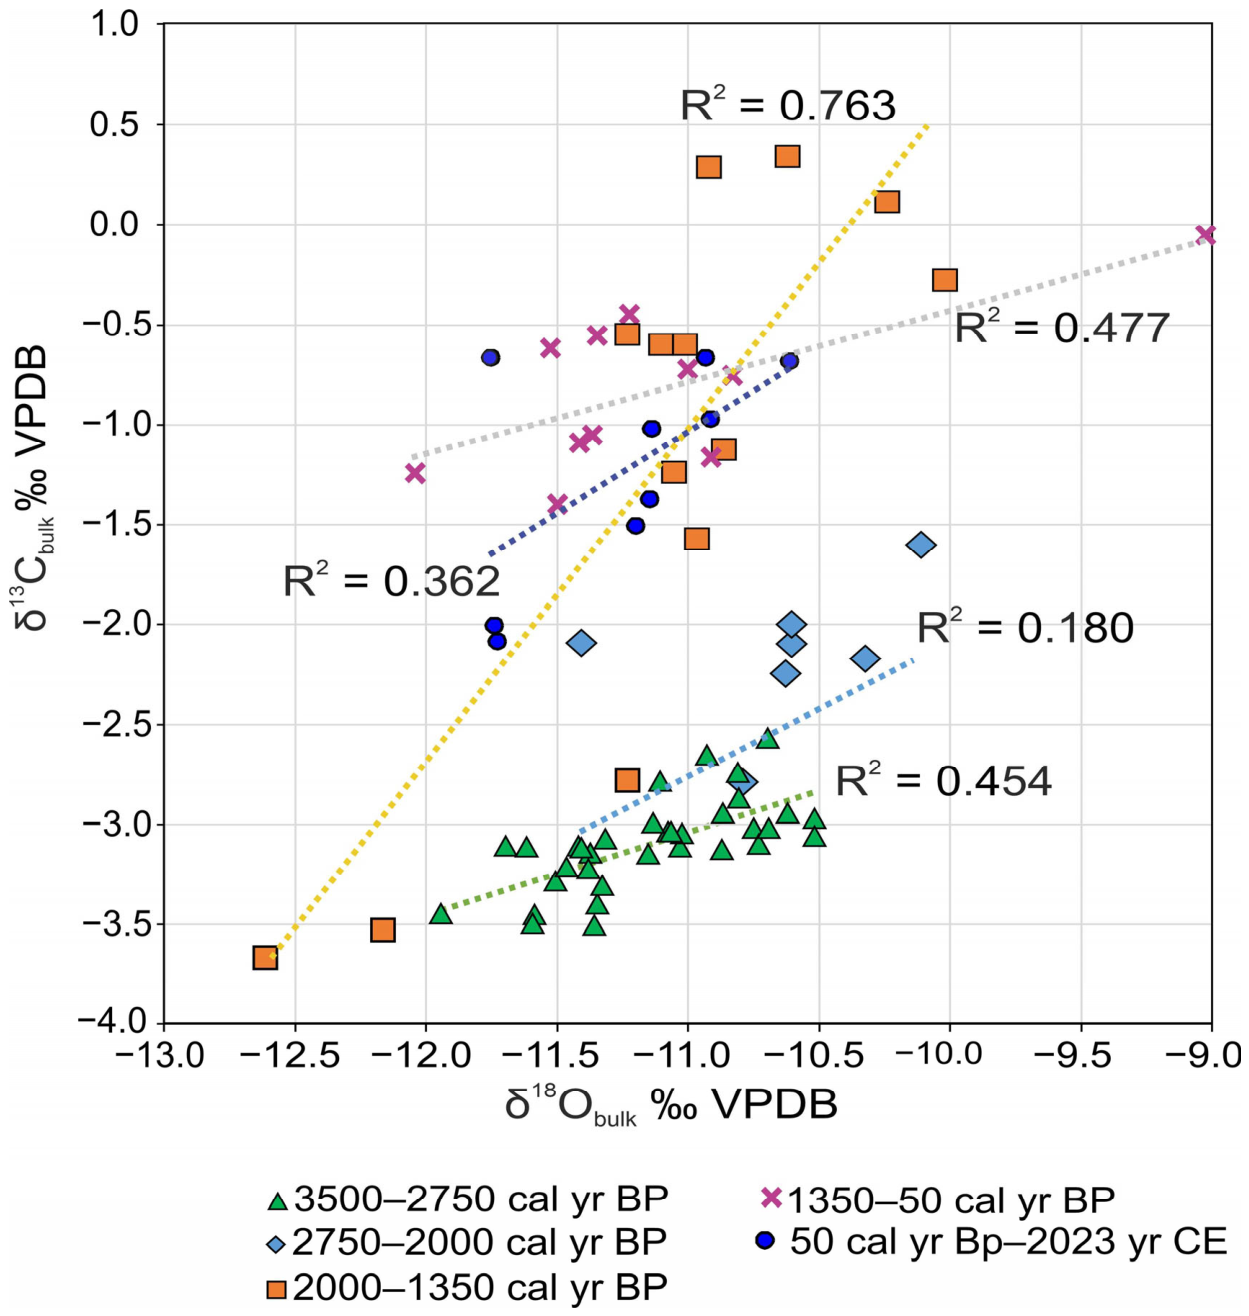
Covariance between δ13C and δ18O in authigenic lacustrine carbonates has commonly been related to lake-water balance and residence time [55], with weak covariance generally associated with hydrologically open systems and stronger covariance more frequently observed in relatively closed or long-residence-time lakes. However, this relationship could be influenced and modified by other factors such as changes in biological productivity and DIC cycling, evaporation, runoff, precipitation seasonality, carbonate precipitation temperature, and season. Accordingly, the δ13Cbulk–δ18Obulk relationship (Appendix C, Figure A3) is used here as supporting evidence for hydrological change rather than as an independent quantitative measure of lake openness (Table A1).
5.3. Dynamics of Sedimentation Conditions in Lake Pleshcheyevo over the Last 3600 Years
A comprehensive study of the bottom sediments of Lake Pleshcheyevo allowed us to reconstruct the following stages of change in sedimentation conditions:
- 1.
- 3550–2750 cal yr BP (1600–800 BCE). The species Aulacoseira granulata, Stephanodiscus alpinus, S. neoastrea were widely represented in diatom complexes. These planktonic widespread diatoms prefer pH close to neutral [89,90,91] and are indifferent to current. The high content of A. granulata may be associated with relatively large depths and active mixing of water in the lake [92,93]. A large content of S. alpinus may indicate sufficiently low water temperatures, since this species is considered an indicator of spring blooming in cold lakes [94,95]. According to the results of the diatom analysis, at this stage, Lake Pleshcheyevo was characterized by deep mesotrophic to eutrophic conditions and pH~7. Possibly, sufficiently low water temperatures in the lake could be associated with a prolonged and cold winter season. δ18Obulk decreases in this interval; its minimum at about 2900 yr BP (850 BCE) broadly corresponds to the short-term cooling associated with reduced solar activity during the Homeric Minimum [96], Figure 10. Previously, evidence of this cooling in Europe, mainly west of Poland, has been reported based on lacustrine temperature proxies [97], peat archives [98], multiproxy records [99], and Alpine glacial advance phases [100]. The high rate of terrigenous matter sedimentation (CLMAR) at this stage can be explained by the rather high fluvial activity [101] on the East European Plain. At the same time, this period was characterized by a moderate covariance of δ18O-δ13C (R2 = 0.454, p < 0.05 (Table A1)), which could indicate a relatively weak hydrological openness of the lake.Figure 10. Comparison of the main paleoecological proxy studied in the Lake Pleshcheyevo bottom sediments [96].
- 2.
- 2750–2000 cal yr BP (800–0 BCE). There was a noticeable increase in the content of benthic diatoms, which may have been associated with an increase in the area of shallow waters, i.e., the appearance of an additional substrate for colonization and/or improved lighting conditions. The development of epiphytic diatoms may indicate the development of higher aquatic vegetation, macrophytes, which served as a substrate for their attachment. The valves of “pioneer species” Pseudostaurosira brevistriata and Staurosirella martiy, which are known to be the first colonialists of accessible surfaces [102], were the most abundant epiphytic diatoms at this stage. Mesotrophic to eutrophic conditions persisted. There was an increase in the content of δ18Obulk to −10.5% VPDB, which probably indicates warmer conditions. Most of this phase coincided with the negative phases of the North Atlantic Oscillation (NAO). Modern observations in the area of Lake Pleshcheyevo associate the negative phases of the North Atlantic Oscillation with slightly higher air temperatures and increased precipitation during the warmer months [21], although the long-term relevance of this mechanism remains uncertain. The short-term decrease in δ18Obulk about 2300 years ago probably reflects the cooling in the Northern Hemisphere, recorded both in simulated temperatures [103] and in temperature reconstructions based on the Ca/Ti ratio in Lake Żabińskie archive in eastern Poland [97]. It is noteworthy that, in general, the East European Plain at this time was characterized by high fluvial activity, while the degree of possible hydrological openness of the lake (R2 = 0.18, p = 0.115 (Table A1)) could have increased, as suggested by the decrease in eutrophic diatoms against a decline in MAR.
- 3.
- 2000–1350 cal BP (0–600 CE). The most depleted δ18Obulk values (down to −12.5‰ VPDB) occurred between 2000 and 1900 yr BP and coincided with synchronous δ13Cbulk depletion. This pattern suggests that enhanced precipitation, rather than a temperature change, was the primary cause, since a change in temperature alone would not result in the simultaneous depletion of both isotopes occurring under a nivo-pluvial regime, and increased river runoff would have led to increased direct precipitation onto the lake surface. This would have diluted the isotopically enriched DIC and lake water, resulting in lower δ13C and δ18O values. Notably, the absence of a pronounced Northern Hemisphere cooling during this period [103] further supports the idea of a predominantly hydrological driver. However, model-based reconstructions may not fully capture regional variability. The enrichment of δ13C observed after 2000 cal yr BP may have been associated with increased biological productivity and the lowest hydrological openness of the lake during the entire study period (R2 = 0.763, p < 0.05 (Table A1)), leading to enhanced equilibration of DIC with atmospheric CO2. The composition of diatom complexes indicates deep conditions, and an increase in the content of eutrophic diatoms indicates eutrophication of the reservoir since 2000 cal yr BP. During this period, CLMAR was quite high (up to 0.010–0.015 g cm−2 year−1) and CMAR increased during 2000–1600 cal yr BP (50 BCE-350 CE), although OMAR was practically unchanged from the previous stage. Since low fluvial activity has been reconstructed for the East European Plain during this period, the increase in CLMAR at this stage is most likely to have been associated with increased deforestation and ploughing of territories during their agricultural development.
- 4.
- 1350–50 cal yr BP (600–1900 CE). In the 1350–1250 cal yr BP (600–700 CE) interval, the enrichment of δ18Obulk can be traced. This generally corresponds to the cooling of the Migration Period, reconstructed from integrated paleogeographic records of Europe and other regions of the Northern Hemisphere [96]. The enrichment level of δ18Obulk up to −9% VPDB exceeds the expected temperature signal and probably reflects increased aridity, which suggests a decrease in runoff and enrichment of lake water with heavy isotopes. The eutrophication of the lake, indicated by the Pediastrum content, continued. There was a gradual increase in the content of Fragilareaceae epiphytic diatoms, which may have been connected with the growth of macrophytes in the coastal part of Lake Pleshcheyevo, while deep-water mesotrophic–eutrophic conditions were maintained. The reduced sedimentation rates at this time, despite the high fluvial activity on the East European Plain during the period 1000–50 cal yr BP (from the 10th to the 20th century), according to [96], may be associated with a decrease in population and, consequently, in arable land due to the raids of the Mongol–Tatar invasion [104] in 700–600 cal yr BP (13–15th centuries CE) and the events of the Time of Troubles [105], followed by the reorientation of the Pereslavl economy from agricultural to industrial production in the 18–19th centuries CE. The δ18O–δ13C covariance (R2 = 0.477, p < 0.05 (Table A1)) is intermediate, which may indicate a slight increase in hydrological openness compared with the previous stage, although this remained relatively weak.
- 5.
- 50 cal yr BP–2023 CE. Since the turn of the 19th and 20th centuries CE, there has been a sharp increase in sedimentation rates in Lake Pleshcheyevo, which is most likely to have been associated with widespread ploughing of marginal lands after the Emancipation of the Serfs in 1861 [106] and collective farming during Soviet times. In general, the MAR increase in lakes, starting in the 1850s with a maximum in 1930–1980, reflects global trends [7] related to agricultural features. The decrease in MAR in Lake Pleshcheyevo in recent decades has been associated with a massive reduction in ploughing areas. Over the past 50 years, there has been a decrease in δ18Obulk by 0.5‰ VPDB, probably reflecting changes in hydrological rather than climatic conditions. The δ18O–δ13C covariance for this interval is moderate and not statistically significant (R2 = 0.362, p = 0.086 (Table A1)), which may indicate that evaporation and water residence time exerted only a weak control on the isotopic composition of the carbonate, consistent with a relatively open hydrological regime.
6. Conclusions
An age–depth model was constructed for the bottom sediments of Lake Pleshcheyevo. The resulting chronology (based on radiocarbon and caesium data) was qualitatively assessed using palynological data. The C/N ratio results indicate that the organic carbon in the lake sediments is of mixed origin. This carbon may include an ancient component delivered from the catchment area through the erosion of carbonate-bearing sediments. This possible input of ancient carbon should be taken into account when interpreting the results of radiocarbon dating of other lakes in the region.
Over the past 3600 years, Lake Pleshcheyevo has been characterized by deep mesotrophic to eutrophic conditions. During the interval of relatively low anthropogenic impact (3600–2000 cal yr BP), sedimentation rates were controlled mainly by climatic factors. Since 2000 cal yr BP (the beginning of the Common Era), against the background of increasing anthropogenic pressure (deforestation and ploughing), the lake has shown a tendency towards eutrophication. From that time onward, the rhythm of sedimentation rates reflects, to a greater extent, the changing character of farming in different historical periods rather than climatic fluctuations. Thus, over the past 2000 years, human economic activity has become the one of the leading factors controlling sedimentation conditions in Lake Pleshcheyevo. The identified patterns improve our understanding of possible scenarios of how such lake ecosystems respond to anthropogenic impact.
Supplementary Materials
The following supporting information can be downloaded at: https://www.mdpi.com/article/10.3390/quat9060073/s1, File S1: PLESH-4_all: an age–depth model including al the 14C dates); File S2: PLESH-4_all_del_top: an age–depth model with three 14C dates excluded, showing both median and composite age–depth models.
Author Contributions
Conceptualization, A.R. and E.K.; methodology, A.R., E.K., N.T., A.T., O.B., M.N., E.Z., A.D. and N.K.; software, A.R., E.K., N.T., A.T. and M.N.; validation, A.R., E.K., N.T., A.T., O.B., M.N., E.Z., A.D. and N.K.; formal analysis, A.R., E.K., N.T., A.T., O.B., M.N., E.Z., A.D. and N.K.; investigation, A.R., E.K., N.T., A.T., O.B., M.N., E.Z., A.D. and N.K.; resources, A.R., E.K., N.T., A.T., O.B., M.N. and E.Z.; data curation, A.R., E.K., N.T., A.T., O.B., M.N. and A.D.; writing—original draft preparation, A.R., N.T., A.T., M.N., O.B., E.Z., E.K., N.K. and E.K.; writing—review and editing, A.R., E.K., N.T., A.T., O.B., M.N., E.Z., A.D. and N.K.; visualization, A.R., E.K., N.T., A.T. and M.N.; supervision, A.R. and E.K.; project administration, A.R. and E.K.; funding acquisition, A.R. All authors have read and agreed to the published version of the manuscript.
Funding
The study was supported by the Russian Science Foundation (project No. 25-77-00115 “Paleoecological dynamics of Lake Plescheevo (Yaroslavl region) in the Late Glacial and Holocene” https://rscf.ru/project/25-77-00115/ (accessed on 10 April 2026)—lithological analysis, diatom analysis, analysis of stable oxygen and carbon isotopes, study of nitrogen and carbon content in bottom sediments) and the state assignment of the Laboratory of Paleoarchives of the Natural Environment of the Institute of Geography of the Russian Academy of Sciences FMWS-2024-0003: Reconstruction of natural events of the past in Russia based on the study of sedimentation paleoarchives (study of indicators of anthropogenic impact in spore-pollen spectra).
Data Availability Statement
The original contributions presented in this study are included in the article/Supplementary Materials. Further inquiries can be directed to the corresponding author.
Acknowledgments
We are grateful to Andrey Zakharov, Nikita Sychev, Vasiliy Shishkov, Dmitriy Baranov, Roman Shukhvostov, Lidia Shasherina, and Anna Utkina for their help at fieldwork, and Lyudmila Lazukova, Anastasiya Gerasimova, and Ekaterina Makarova for their help in the laboratory. We thank Nina Gorkova for help with SEM-EDS images.
Conflicts of Interest
The authors declare no conflicts of interest.
Abbreviations
The following abbreviations are used in this manuscript:
| MAR | Mass accumulation rate |
| OMAR | Organic matter accumulation rate |
| CMAR | CaCO3 accumulation rate |
| CLMAR | Clastic material accumulation rate |
| LSR | Linear sedimentation rate |
| DBD | Dry bulk density |
| DIC | Dissolved inorganic carbon |
| LDAZ | Local diatom assemblages zone |
| AP | Arboreal pollen |
| NAR | Non-arboreal pollen |
| QM | Quercetum mixtum |
| yr BP | Years before present |
| BCE | Before Common Era |
| CE | Common Era |
Appendix A
Figure A1.
Matching of selected lithological and geochemical records of the cores from borehole PLESH-4.
Appendix B
Figure A2.
Chemical composition and SEM image of (A) a carbonate (indicated by an oval) and (B) a detrital component (indicated by a cross) of Lake Pleshcheyevo bottom sediments.
Appendix C
Table A1.
δ13C and δ18O relationship during stages 1–5.
Figure A3.
The covariance of δ18O-δ13C during stages 1–5.
References
- Harrison, S.P.; Digerfeldt, G. European lakes as palaeohydrological and palaeoclimatic indicators. Quat. Sci. Rev. 1993, 12, 233–248. [Google Scholar] [CrossRef] [Scilit]
- Cohen, A.; Palacios-Fest, M.; Negrini, R.; Wigand, P.; Erbes, D. A paleoclimate record for the past 250,000 years from Summer Lake, Oregon, USA: II. Sedimentology, paleontology and geochemistry. J. Paleolimnol. 2000, 24, 151–182. [Google Scholar] [CrossRef] [Scilit]
- Velichko, A.A.; Kremenetski, K.V.; Negendank, J.; Mingram, J.; Borisova, O.K.; Gribchenko, Y.N.; Zelikson, E.M.; Klimanov, V.A.; Novenko, E.Y.; Pirumova, L.G.; et al. Late Quaternary paleogeography of the northeastern part of Europe (according to the data of the comprehensive study of the sediments of Lake Galichskoye). Izv. Akad. Nauk Ser. Geogr. 2001, 3, 42–54. (In Russian) [Google Scholar]
- Wohlfarth, B.; Lacourse, T.; Bennike, O.; Subetto, D.; Tarasov, P.; Demidov, I.; Filimonova, L.; Sapelko, T. Climatic and environmental changes in north-western Russia between 15,000 and 8000 cal yr BP: A review. Quat. Sci. Rev. 2007, 26, 1871–1883. [Google Scholar] [CrossRef] [Scilit]
- Talbot, M.R.; Allen, P.A. Lakes. In Sedimentary Environments: Processes, Facies and Stratigraphy, 3rd ed.; Reading, H.G., Ed.; Blackwell Science: Oxford, UK, 1996; pp. 5–36. [Google Scholar]
- Laug, A.; Haberzettl, T.; Pannes, A.; Schwarz, A.; Turner, F.; Wang, J.; Engels, S.; Rigterink, S.; Börner, N.; Ahlborn, M.; et al. Holocene paleoenvironmental change inferred from two sediment cores collected in the Tibetan lake Taro Co. J. Paleolimnol. 2021, 66, 171–186. [Google Scholar] [CrossRef] [Scilit]
- Baud, A.; Jenny, J.P.; Francus, P.; Gregory-Eaves, I. Global acceleration of lake sediment accumulation rates associated with recent human population growth and land-use changes. J. Paleolimnol. 2021, 66, 453–467. [Google Scholar] [CrossRef] [Scilit]
- Sabatier, P.; Moernaut, J.; Bertran, S.; Van Daele, M.; Kremer, K.; Chaumillon, E.; Arnaud, F. A Review of Event Deposits in Lake Sediments. Quaternary 2022, 5, 34. [Google Scholar] [CrossRef] [Scilit]
- Beg, R.-C.; Savin, C.-F.; Korponai, J.; Maguary, E.; Kovács, T. Investigation of the last two centuries sedimentation dynamics in high-altitude lakes of Southern Carpathians, Romania. Sci. Rep. 2024, 14, 1391. [Google Scholar] [CrossRef] [Scilit] [PubMed]
- Pisareva, V.V.; Gunova, V.S.; Shik, S.M. Ancient Lake Pleshcheyevo. In History of the Pleistocene Lakes of the East European Plane; Nauka: Saint-Petersburg, Russia, 1998; pp. 291–299. (In Russian) [Google Scholar]
- ozera Pleshcheyevo, E. The Ecosystem of Lake Pleshcheyevo; Nauka: Saint-Petersburg, Russia, 1989; 264p. (In Russian) [Google Scholar]
- Gapeeva, M.V.; Nurgaliev, D.K.; Sigareva, L.E.; Haides, I. Historical trends of biogenic elements in bottom sediments of Lake Pleshcheyevo in natural and antropogenic conditions. Ecol. Khim. 2005, 14, 55–62. [Google Scholar]
- Palagushkina, O.; Frolova, L.; Zinnatova, E.; Kosareva, L.; Nurgaliev, D. Diatoms of sediments of Plescheevo Lake (Russia) as indicators of environmental changes in Holocene. In Proceedings of the 18th International Multidisciplinary Scientific Geoconferense SGEM 2018, Albena, Bulgaria, 2–8 July 2018. [Google Scholar]
- Nikitin, A.L. Ancient settlements and rhythms of the hydrosphere. Priroda 1978, 1, 33–43. (In Russian) [Google Scholar]
- Main Department of Geology and Conservation of Mineral Resources Under the Council of Ministers of the USSR. Report of the Pereslavl Geological Survey Party on a Comprehensive Geological Survey on a Scale of 1:200,000 Within the Limits of Sheet O-37-XXVI, Conducted in 1963 (Yaroslavl, Kalinin and Moscow Regions); Main Department of Geology and Conservation of Mineral Resources under the Council of Ministers of the USSR: Moscow, Russia, 1964; Volume 1, 222p. (In Russian) [Google Scholar]
- Hydrological Observation Data. Russian Scientific Research Institute of Hydrometeorological Information—World Data Center (VNIIGMI-MCD). Available online: https://meteo.ru (accessed on 26 April 2026).
- IAEA/WMO. Global Network of Isotopes in Precipitation. The GNIP Database. International Atomic Energy Agency, Vienna. 2026. Available online: https://iaea.org (accessed on 16 March 2026).
- Moskovskiy, B.D. Landscapes of the Lakes of the Yaroslavl Volga Region. Ph.D. Thesis, Yaroslavl University, Yaroslavl, Russia, 1965. (In Russian) [Google Scholar]
- Ogureeva, G.N.; Leonova, N.B.; Emelyanova, L.G.; Buldakova, E.V.; Kadetov, N.G.; Arkhipova, M.V.; Miklyaeva, I.M.; Bocharnikov, M.V.; Dudov, S.V.; Ignatova, E.A.; et al. The Biomes of Russia (s. 1:7 500 000); WWF-RUSSIA: Moscow, Russia, 2018. [Google Scholar]
- Romanenko, A.V. The current structural and functional state of bacterioplankton in Lake Pleshcheyevo. Trans. IBIW 2019, 86, 7–22. (In Russian) [Google Scholar] [CrossRef]
- Poddubniy, S.A.; Tsvetkov, A.I.; Ivanova, I.N.; Budnikov, A.A.; Tsvetkova, M.V. Termal and dynamic processes in Lake Pleshcheevo. Trans. IBIW 2020, 90, 7–26. (In Russian) [Google Scholar] [CrossRef]
- Yaroslavl State Pedagogical University. Lakes of the Yaroslavl Region and Prospects for Their Economic Use; Yaroslavl State Pedagogical University: Yaroslavl, Russia, 1970; 388p. (In Russian) [Google Scholar]
- Cheremisina, N.A. Hydrological monitoring of Lake Pleshcheyevo and its tributaries in 1999-2007. In Actual Problems of Ecology of the Yaroslavl Region: Materials of the Fourth Scientific and Practical Conference; Verkhnevolzhsky Departement of the Russian Academy of Ecology: Yaroslavl, Russia, 2008; pp. 55–58. (In Russian) [Google Scholar]
- Koltsov, L.V.; Zhilin, M.G. The Mesolithic of the Volga-Oka Interfluve (Monuments of Butovo Culture); Nauka: Moscow, Russia, 1999; 157p. (In Russian) [Google Scholar]
- Nikitin, A.L. A pile settlement in the Berendeevo swamp of the Yaroslavl region. In The Importance of Palynological Analysis for Stratigraphy and Paleofloristics; Neishtadt, M.I., Ed.; Institute of Geography, Geological Institute AS SSSR: Moscow, Russia, 1966; pp. 2–7. (In Russian) [Google Scholar]
- Nikitin, A.L. The Neolithic settlement of Berendeevo I. Sov. Archeol. 1976, 3, 191–202. (In Russian) [Google Scholar]
- Utkin, A.V. Bone artefacts from V and IX Berendeevo sites. Sov. Archeol. 1985, 1, 143–150. (In Russian) [Google Scholar]
- Vasiliev, S.V.; Gerasimova, M.M.; Borutskaya, S.B.; Leibova, N.A.; Rasskazova, A.V.; Kuzmin, Y.V. New Data on the Ancient Man from the Neolithic Site of Berendeevo. Sib. Istor. Issled. 2025, 3, 196–225. (In Russian) [Google Scholar] [CrossRef] [PubMed]
- Kraynov, D.A. Research of the Upper Volga expedition in Yaroslavl, Ivanovo and Kalinin regions. In Archaeological Discoveries of 1971; Nauka: Moscow, Russia, 1972; pp. 48–50. (In Russian) [Google Scholar]
- Nikitin, A.L. The Bronze Age on Lake Pleshcheyevo. Sov. Archeol. 1976, 1, 69–86. (In Russian) [Google Scholar]
- Vishnevskii, V.I. The Early Iron Age settlement of Veskovo I. In Archaeological Sites of the Volga-Klyazma Interfluve; Ivanovskoye Upravleniye Kultury IVOOPIiK: Ivanovo, Russia, 1990; pp. 11–14. (In Russian) [Google Scholar]
- Leontiev, A.E. Archaeology of Merya. In The prehistory of Northeastern Russia; Geoeko: Moscow, Russia, 1996; p. 340. (In Russian) [Google Scholar]
- Leontiev, A.E. On the shores of lakes Nero and Pleshcheyevo. In Russia in the IX-X Centuries: An Archaeological Panorama; Drevnosty Severa: Vologda, Russia, 2012; pp. 163–177. (In Russian) [Google Scholar]
- Lapshin, V.A. Colonization of Northeastern Russia in the 9th–11th centuries in the context of new archaeological materials. In Staraya Ladoga and Problems of Archeology of Northern Russia; St. Hermitage Publ.: Saint-Petersburg, Russia, 2002; pp. 101–113. (In Russian) [Google Scholar]
- Makarov, N.A.; Nesmian, O.A.; Murentseva, T.Y. Kleshchin—The center of medieval settlement on Lake Pleshcheyevo. Archeol. Vesty 2016, 22, 140–154. (In Russian) [Google Scholar]
- Seleznev, Y.V. Military conflicts of Ancient and Medieval Russia: The experience of statistical analysis and mapping. Ist. Vest. 2023, 44, 40–75. (In Russian) [Google Scholar]
- Nefedova, T.G. (Ed.) Old-Developed Areas in Russia: History and Modernity; Association of Scientific Publications of the KMK: Moscow, Russia, 2021; p. 379. (In Russian) [Google Scholar]
- Central Statistical Committee of the Ministry of Internal Affairs. Yaroslavl Province: A List of Populated Places According to Information from 1859; Karl Wolf Printing House: Saint-Peterburg, Russia, 1865; p. 382. (In Russian) [Google Scholar]
- Averkieva, K.V.; Nefedova, T.G.; Kondakova, T.Y. Spatial Socio-economic Polarization in the Central Developed Regions 65 of Russia: The Case of Yaroslavl Oblast. Mir. Ros. 2021, 1, 49–66. (In Russian) [Google Scholar]
- Ioffe, G.V. Agriculture of the Non-Chernozem Region: Territorial Problems; Nauka: Moscow, Russia, 1990; p. 164. (In Russian) [Google Scholar]
- Nesje, A. A piston corer for lacustrine and marine sediments. Arc. Alp. Res. 1992, 24, 257–259. [Google Scholar] [CrossRef] [Scilit]
- Konstantinov, E.A. New technology for the sampling of weakly consolidated bottom sediment. Okeanologija 2019, 59, 791–796. [Google Scholar] [CrossRef] [Scilit]
- Konert, M.; Vandenberghe, J.E.F. Comparison of laser grain size analysis with pipette and sieve analysis: A solution for the underestimation of the clay fraction. Sedimentology 1997, 44, 523–535. [Google Scholar] [CrossRef] [Scilit]
- Varga, G.; Újvári, G.; Kovács, J. Interpretation of sedimentary (sub) populations extracted from grain size distributions of Central European loess-paleosol series. Quat. Int. 2019, 502, 60–70. [Google Scholar] [CrossRef] [Scilit]
- Blott, S.J.; Croft, D.J.; Pye, K.; Saye, S.E.; Wilson, H.E. Particle size analysis by laser diffraction. Geol. Soc. Spec. Publ. 2004, 232, 63–73. [Google Scholar] [CrossRef] [Scilit]
- Ozer, M.; Orhan, M.; Isik, N.S. Effect of particle optical properties on size distribution of soils obtained by laser diffraction. Environ. Eng. Geosci. 2010, 16, 163–173. [Google Scholar] [CrossRef] [Scilit]
- Heiri, O.; Lotter, A.F.; Lemcke, G. Loss on ignition as a method for estimating organic and carbonate content in sediments: Reproducibility and comparability of results. J. Paleolimnol. 2001, 25, 101–110. [Google Scholar] [CrossRef] [Scilit]
- Dean, W.E. Determination of carbonate and organic matter in calcareous sediments and sedimentary rocks by loss on ignition; comparison with other methods. J. Sediment. Petrol. 1974, 44, 242–248. [Google Scholar] [CrossRef] [Scilit]
- Maher, B.A. Magnetic properties of modern soils and Quaternary loessic paleosols: Paleoclimatic implications. Palaeogeogr. Palaeoclimatol. Palaeoecol. 1998, 137, 25–54. [Google Scholar] [CrossRef] [Scilit]
- Zazovskaya, E.; Mergelov, N.; Shishkov, V.; Dolgikh, A.; Miamin, V.; Cherkinsky, A.; Goryachkin, S. Radiocarbonage of soils in oases of East Antarctica. Radiocarbon 2017, 59, 489–503. [Google Scholar] [CrossRef] [Scilit]
- Wacker, L.; Němec, M.; Bourquin, J. A revolutionary graphitisation system: Fully automated, compact and simple. Nucl. Instrum. Methods Phys. Res. B 2010, 268, 931–934. [Google Scholar] [CrossRef] [Scilit]
- SRM 4990C; Oxalic Acid (Standard Reference Material). National Institute of Standards and Technology: Gaithersburg, MD, USA, 2007.
- Mažeika, J.; Jefanova, O.; Petrošius, R.; Lujanienė, G.; Skuratovič, Ž. 14C and other radionuclides in the environment in the border region of Lithuania before the start of the Belarusian nuclear power plant operation. Radiocarbon 2022, 64, 1309–1322. [Google Scholar] [CrossRef] [Scilit]
- Reimer, P.; Austin, W.E.N.; Bard, E.; Bayliss, A.; Blackwell, P.G.; Bronk Ramsey, C.; Butzin, M.; Edwards, R.L.; Friedrich, M.; Grootes, P.M.; et al. The IntCal20 Northern Hemisphere radiocarbon age calibration curve (0–55 cal kB). Radiocarbon 2020, 62, 725–757. [Google Scholar] [CrossRef] [Scilit]
- Blaauw, M.; Christen, J.A. Flexible paleoclimate age-depth models using an autoregressive gamma process. Bayesian Anal. 2011, 6, 457–474. [Google Scholar] [CrossRef] [Scilit]
- Talbot, M.R. A review of the palaeohydrological interpretation of carbon and oxygen isotopic ratios in primary lacustrine carbonates. Chem. Geol. Isot. Geosci. Sect. 1990, 80, 261–279. [Google Scholar] [CrossRef] [Scilit]
- Battarbee, R.W.; Jones, V.J.; Flower, R.J. Diatoms. In Tracking Environmental Change Using Lake Sediments. Terrestrial, Algaland Siliceous Indicators; Smol, J.P., Birks, H.J.-B., Last, W.M., Eds.; Springer: Berlin/Heidelberg, Germany, 2001; pp. 155–202. [Google Scholar]
- Krammer, K.; Lange-Bertalot, H. Bacillariophyceae. 1. Teil: Naviculaceae. In Süßwasserflora von Mitteleuropa; Springer: Berlin/Heidelberg, Germany, 2001; p. 876. (In German) [Google Scholar]
- Krammer, K.; Lange-Bertalot, H. Bacillariophyceae. 2. Teil: Bacillariaceae, Epithemiaceae, Surirellaceae. In Süßwasserflora von Mitteleuropa; Springer: Berlin/Heidelberg, Germany, 2001; p. 596. (In German) [Google Scholar]
- Krammer, K.; Lange-Bertalot, H. Bacillariophyceae. 3. Teil: Centrales, Fragilariaceae, Eunoticeae. In Süßwasserflora von Mitteleuropa; Springer: Berlin/Heidelberg, Germany, 2001; p. 640. (In German) [Google Scholar]
- Krammer, K.; Lange-Bertalot, H. Bacillariophyceae. 4. Teil: Achnantaceae. In Süßwasserflora von Mitteleuropa; Springer: Berlin/Heidelberg, Germany, 2001; p. 468. (In German) [Google Scholar]
- Guiry, M.D.; Guiry, G.M. AlgaeBase; World-Wide Electronic Publication, National University of Ireland: Galway, Ireland, 2020; Available online: https://www.algaebase.org (accessed on 26 April 2026).
- Grimm, E.C. Tilia Software, version 1.7.16; Illinois State Museum, Research and Collection Center: Springfield, IL, USA, 2011.
- Grimm, E.C. CONISS: A FORTRAN 77 program for stratigraphically constrained cluster analysis by the method of incrementalsum of squares. Comput. Geosci. 1987, 13, 13–35. [Google Scholar] [CrossRef] [Scilit]
- Denys, L. A Check-List of the Diatoms in the Holocene Deposits of the Western Belgian Coastal Plane with a Survey of Their Apparent Ecological Requirements. I. Intriduction, Ecological Code and Complete List; Ministere des Affairs Economiques, Service Geologique de Belgique: Antwerp, Belgium, 1991; p. 41. [Google Scholar]
- Gedminienė, L.; Konstantinov, E.; Rudinskaya, A.; Taraškevičius, R.; Suzdalev, S. Mid-to-Late Holocene (a)biotic environment dynamics and an establishment of agricultural plants: History of lake Plescheevo, Yaroslavl region, Russia. In Proceedings of the Quaternaire 13 “Palaeoclimate Changes, Landscape Evolution and Human Societies from Sedimentary Basins to Industrial Landscapes”, Strasbourg, France, 14–18 March 2022. [Google Scholar]
- Grichuk, V.P.; Zaklinskaya, E.D. Analysis of Fossil Pollen and Spores and Its Application in Paleogeography; Geografgiz: Moscow, Russia, 1948; p. 244. (In Russian) [Google Scholar]
- Mackie, E.A.V.; Leng, M.J.; Lloyd, J.M.; Arrowsmith, C. Bulk organic δ13C and C/N ratios as palaeosalinity indicators within a Scottish isolation basin. J. Quat. Sci. 2005, 20, 303–312. [Google Scholar] [CrossRef] [Scilit]
- Zong, Y.; Lloyd, J.M.; Leng, M.J.; Yim, W.W.-S.; Huang, G. Reconstruction of Holocene monsoon history from Pearl River Estuary, southern China, using diatoms and carbon isotope ratios. Holocene 2006, 16, 251–263. [Google Scholar] [CrossRef] [Scilit]
- Lavrenov, N.G. Late Holocene Dynamics of Vegetation in the Upper Reaches of the Dnieper Basin. Ph.D. Thesis, Moscow State University, Moscow, Russia, 1 April 2025. (In Russian) [Google Scholar]
- Ershova, E.G.; Krenke, A.N.; Nosova, M.B. History of the producing economy development in Moscow region and neighboring territories: Review of palaeobotanical and archaeological evidence (to the 50th anniversary of the book by Yu.A. Krasnov “Early farming and cattle breeding in the forest zone of Eastern Europe”). Ross. Arkheol. 2022, 2, 7–19. (In Russian) [Google Scholar]
- Nosova, M.B.; Ershova, E.G.; Krenke, N.A.; Lavrenov, N.G. Agricultural transformation of landscapes in the mixed forest zone of European Russia: Periods identified from pollen diagrams. New Bull. Main. Bot. Gard. 2025, 1, 33–51. [Google Scholar] [CrossRef] [Scilit]
- Nosova, M.B.; Zakharov, A.L.; Lavrenov, N.G.; Zaretskaya, N.E.; Mazei, N.G.; Kupriyanov, D.A.; Pastukhova, Y.A.; Bakumenko, V.O.; Severova, E.E.; Konstantinov, E.A. A multi-proxy centennial-resolution paleoecological record of Holocene lake sediments in the marginal zone of Last Scandinavian Glaciation (Tver Region, Russia). Quat. Int. 2025, 729, 109778. [Google Scholar] [CrossRef] [Scilit]
- Ponomarenko, E.; Ershova, E.; Viazov, L.; Gajewski, K.; Tomson, P.; Alexandrovskiy, A.; Stashenkov, D.; Lavrenov, N.; Krenke, N.; Kochkina, A.; et al. Societal and climatic controls on Swidden cultivation in the Eastern European Plain. Sci. Rep. 2026, 16, 10293. [Google Scholar] [CrossRef] [Scilit] [PubMed]
- Neishtadt, M.I. The Forests History and Paleogeography of the USSR in the Holocene; Izd-vo Akademii Nauk SSSR: Moscow, Russia, 1957; p. 404. [Google Scholar]
- Krasnov, Y.A. Early Agriculture and Livestock Breeding in the Forest Belt of Eastern Europe. 2nd Millennium BC—First Half of the 1st Millennium AD; Nauka: Moscow, Russia, 1971; p. 168. (In Russian) [Google Scholar]
- Krenke, N.A. “Dark Ages” in the History of Settlement of the Moscow River (VIII−IX Centuries). In The Culture of Medieval Moscow. Historical Landscapes; Krenke, N.A., Chernov, S.Z., Eds.; Institute of Archaeology of the Russian Academy of Sciences: Moscow, Russia, 2004; Volume 1, pp. 60–64. (In Russian) [Google Scholar]
- De Cort, M.; Dubois, G.; Fridman, S.D.; Germenchuk, M.G.; Izrael, Y.A.; Janssens, A.; Jones, A.R.; Kelly, G.N.; Kvasnikova, E.V.; Matveenko, I.I.; et al. Atlas of Caesium Deposition on Europe After the Chernobyl Accident; Report EUR 16733; Office for Official Publications of the European Communities: Luxembourg, 1998; 176p. [Google Scholar]
- Klaminder, J.; Appleby, P.; Crook, P.; Renberg, I. Post-deposition diffusion of 137Cs in lake sediment: Implications for radioceasium dating. Sedimentology 2012, 59, 2259–2267. [Google Scholar] [CrossRef] [Scilit]
- Comans, R.N.J.; Hockley, D.E. Kinetics of cesium sorption on illite. Geochim. Cosmochim. Acta 1992, 56, 1157–1164. [Google Scholar] [CrossRef] [Scilit]
- Grimm, E.C.; Maher, L.J.; Nelson, D.M. The magnitude of error in conventional bulk-sediment radiocarbon dates from central North America. Quat. Res. 2009, 72, 301–308. [Google Scholar] [CrossRef] [Scilit]
- Andree, M.; Oeschger, H.; Siegenthaler, U.; Riesen, T.; Moell, M.; Ammann, B.; Tobolski, K. 14C dating of plant macrofossils in lake sediments. Radiocarbon 1986, 28, 411–416. [Google Scholar] [CrossRef] [Scilit]
- Rudaya, N.; Nazarova, L.; Novenko, E.; Andreev, A.; Kalugin, I.; Daryin, A.; Babich, V.; Li, H.-C.; Shilov, P. Quantitative reconstructions of mid-late Holocene climate and vegetationin the north-eastern Altai Mountains recorded in Lake Teletskoye. Glob. Planet Change 2016, 141, 12–24. [Google Scholar] [CrossRef] [Scilit]
- Leng, M.J.; Marshall, J.D. Palaeoclimate interpretation of stable isotope data from lake sediment archives. Quat. Sci. Rev. 2004, 23, 811–831. [Google Scholar] [CrossRef] [Scilit]
- Usdowski, E.; Hoefs, J. Kinetic 13C12C and 18O16O effects upon dissolution and outgassing of CO2 in the system CO2 H2O. Chem. Geol. Isot. Geosci. Sect. 1990, 80, 109–118. [Google Scholar] [CrossRef] [Scilit]
- Clark, I.; Fritz, P. Environmental Isotopes in Hydrogeology; CRC Press: New York, NY, USA, 1997; p. 328. [Google Scholar]
- Kim, S.-T.; O’Neil, J.R. Equilibrium and nonequilibrium oxygen isotope effects in synthetic carbonates. Geochim. Cosmochim. Acta 1997, 61, 3461–3475. [Google Scholar] [CrossRef] [Scilit]
- Perșoiu, A.; Onac, B.P.; Wynn, J.G.; Blaaw, M.; Ionita, M.; Hansson, M. Holocene winter climate variability in Central and Eastern Europe. Sci. Rep. 2017, 7, 1196. [Google Scholar] [CrossRef] [Scilit] [PubMed]
- Kulikovskiy, M.S.; Gluschenko, A.M.; Genkal, S.I.; Kuznetchova, I.V. Identification Book for Diatoms of Russia; Filigran: Yaroslavl, Russia, 2015; p. 804. (In Russian) [Google Scholar]
- Kulikovskiy, M.S.; Shkurina, N.A. Species composition and flora features of centric diatoms (Bacilloriophyta) of reservoirs and watercourses of Kamchatka. Povolzhskiy J. Ecol. 2009, 4, 305–318. (In Russian) [Google Scholar]
- van Dam, H.; Mertens, A.; Sinkeldam, J. A coded checklist and ecological indicator values of freshwater diatoms from the Netherlands. Neth. J. Aquat. Ecol. 1994, 28, 117–133. [Google Scholar] [CrossRef] [Scilit]
- Pilskaln, C.H.; Johnson, T.C. Seasonal signals in Lake Malawi sediments. Limnol. Oceanogr. 1991, 36, 544–557. [Google Scholar] [CrossRef] [Scilit]
- Wang, L.; Lu, H.; Liu, J.; Gu, Z.; Mingram, J.; Chu, G.; Li, J.; Rioual, P.; Negendank, J.F.V.; Han, J.; et al. Diatom based inference of variations in the strength of Asian winter monsoon wind between 17500 and 6000 calendar years BP. J. Geophys. Res. 2008, 113, 1–9. [Google Scholar] [CrossRef] [Scilit]
- Hickel, B. Stephanodiscus alpinus in Plubsee, Germany. Ecology, morphology and taxonomy in combination with initial cells. Diatom Res. 1993, 8, 89–98. [Google Scholar] [CrossRef] [Scilit]
- Genkal, S.I.; Lepskaya, E.V. Morphology, ecology, and distribution of Stephanodiscus alpinus (Bacillariophyta). Nov. Sist. Nizsh. Rast. 2013, 47, 28–36. (In Russian) [Google Scholar] [CrossRef] [Scilit]
- van Dijk, E.J.; Jungclaus, J.; Sigl, M.; Timmreck, C.; Krüger, K. High-frequency climate forcing causes prolonged cold periods in the Holocene. Commun. Earth Environ. 2024, 5, 242. [Google Scholar] [CrossRef] [Scilit]
- Zander, P.D.; Żarczyński, M.; Tylmann, W.; Vogel, H.; Grosjean, M. Subdecadal Holocene warm-season temperature variability in central Europe recorded by biochemical varves. Geophys. Res. Lett. 2024, 51, e2024GL110871. [Google Scholar] [CrossRef] [Scilit]
- van Geel, B.; Buurman, J.; Waterbolk, H.T. Archaeological and palaeoecological indications for an abrupt climate change in the Netherlands, and evidence for climatological teleconnections around 2650 BP. J. Quat. Sci. 1996, 11, 451–460. [Google Scholar] [CrossRef] [Scilit]
- Martin-Puertas, C.; Brauer, A.; Dulski, P.; Brademann, B. Testing climate–proxy stationarity throughout the Holocene: An example from the varved sediments of Lake Meerfelder Maar (Germany). Quat. Sci. Rev. 2012, 58, 56–65. [Google Scholar] [CrossRef] [Scilit]
- Schimmelpfennig, I.; Schaefer, J.M.; Lamp, J.; Godard, V.; Schwartz, R.; Bard, E.; Tuna, T.; Akçar, N.; Schlüchter, C.; Zimmerman, S.; et al. Glacier response to Holocene warmth inferred from In Situ 10Be and 14C bedrock analyses in Steingletscher’s forefield (central Swiss Alps). Clim. Past 2022, 18, 23–44. [Google Scholar] [CrossRef] [Scilit]
- Panin, A.; Matlakhova, E. Fluvial chronology in the East European Plain over the last 20 ka and its palaeohydrological implications. Catena 2015, 130, 46–61. [Google Scholar] [CrossRef] [Scilit]
- Lange-Bertalot, H.; Hoffman, G.; Werum, M.; Cantonati, M. Freshwater Benthic Diatoms of Central Europe: Over 800 Common Species Used in Ecological Assessement; Koeltz Botanical Book: Oberreifenberg, Germany, 2017; p. 908. [Google Scholar]
- Kobashi, T.; Goto-Azuma, K.; Box, J.E.; Gao, C.-C.; Nakaegawa, T. Causes of Greenland temperature variability over the past 4000yr: Implications for Northern hemispheric temperature changes. Clim. Past 2013, 9, 2299–2317. [Google Scholar] [CrossRef] [Scilit]
- Goehrke, C. Der Mongolensturm von 1237 bis 1241 und seine Folgen für die Bevölkerung der Rus’. Jahrb. Gesch. Osteur. 2024, 72, 352–395. [Google Scholar] [CrossRef] [Scilit]
- Dunning, C.S. Russia’s First Civil War: The Time of Troubles and the Founding of the Romanov Dynasty; Pennsylvania State University Press: University Park, TX, USA, 2010; p. 528. [Google Scholar]
- Shcherbakova, I.K. Russian agrarian reforms of Russia at the turn of the 19th-20th centuries in the coverage of economists of the 20th century. Vestn. Univ. 2021, 5, 141–144. (In Russian) [Google Scholar] [CrossRef] [Scilit]
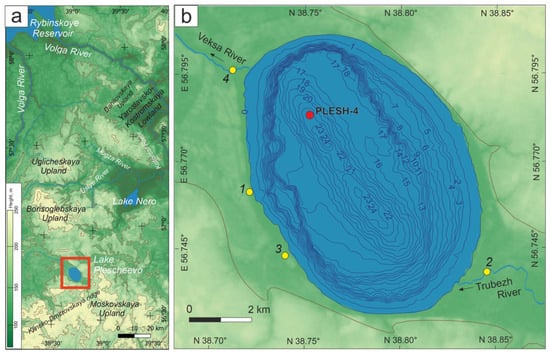
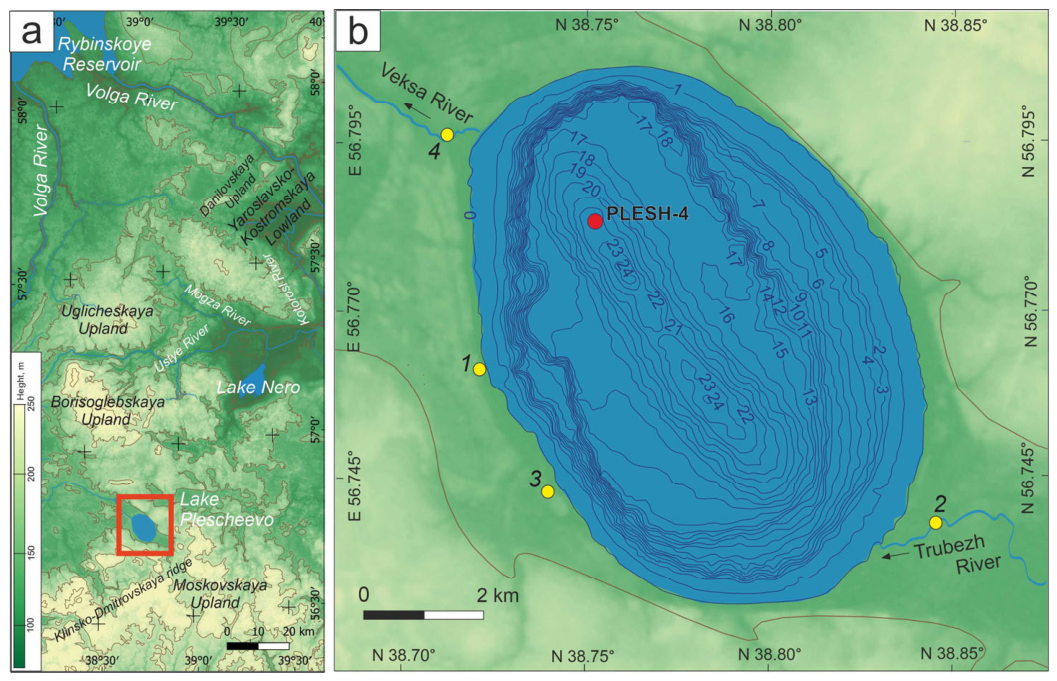
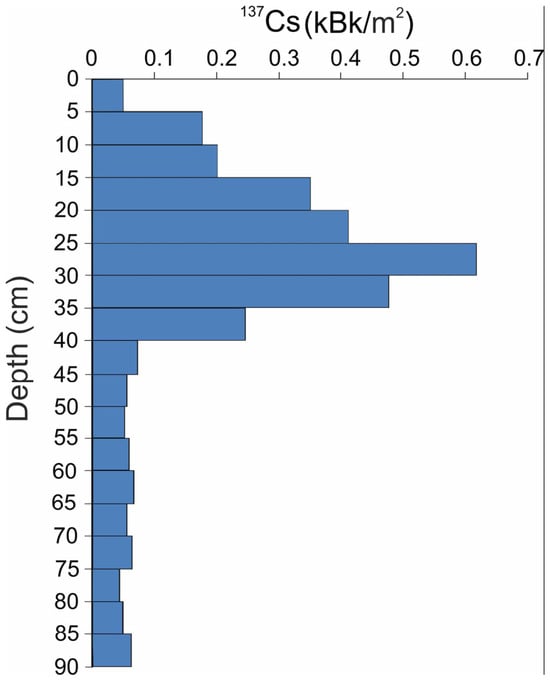
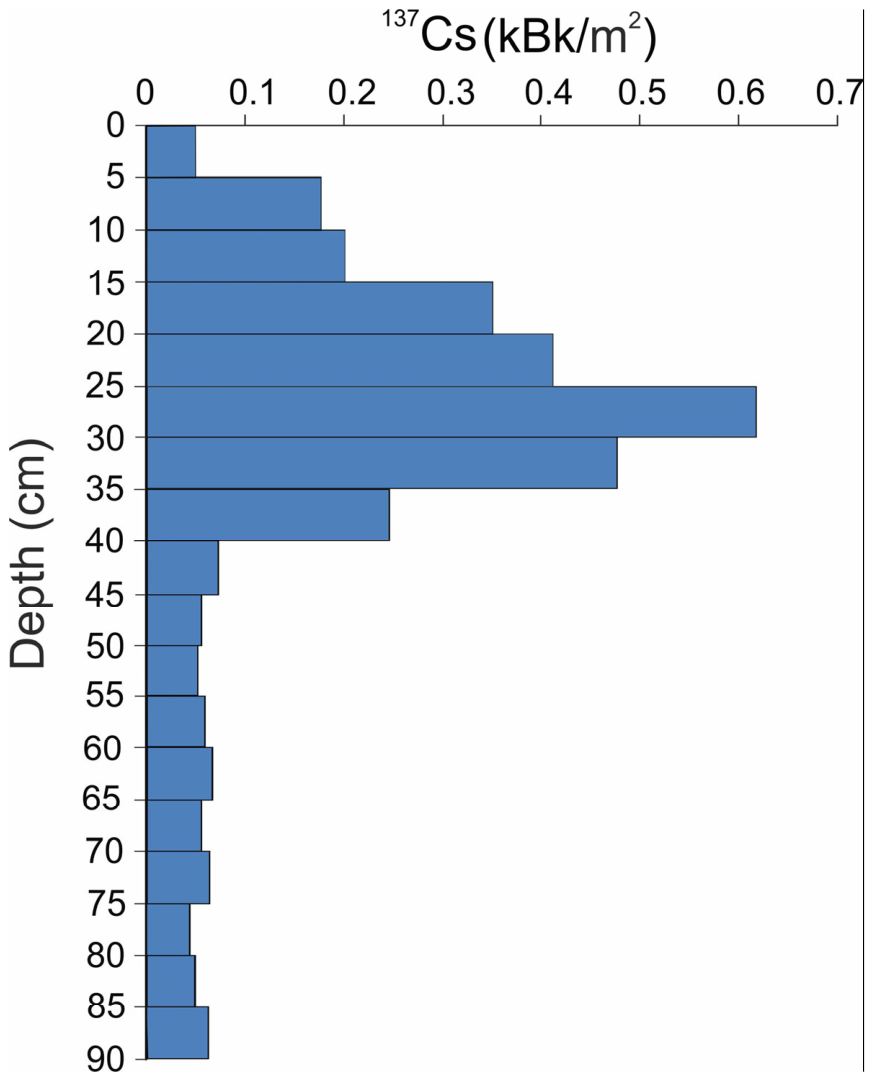
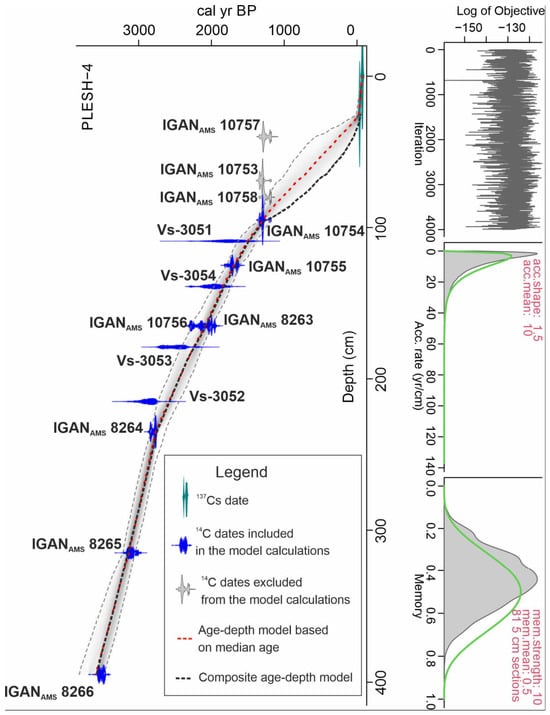
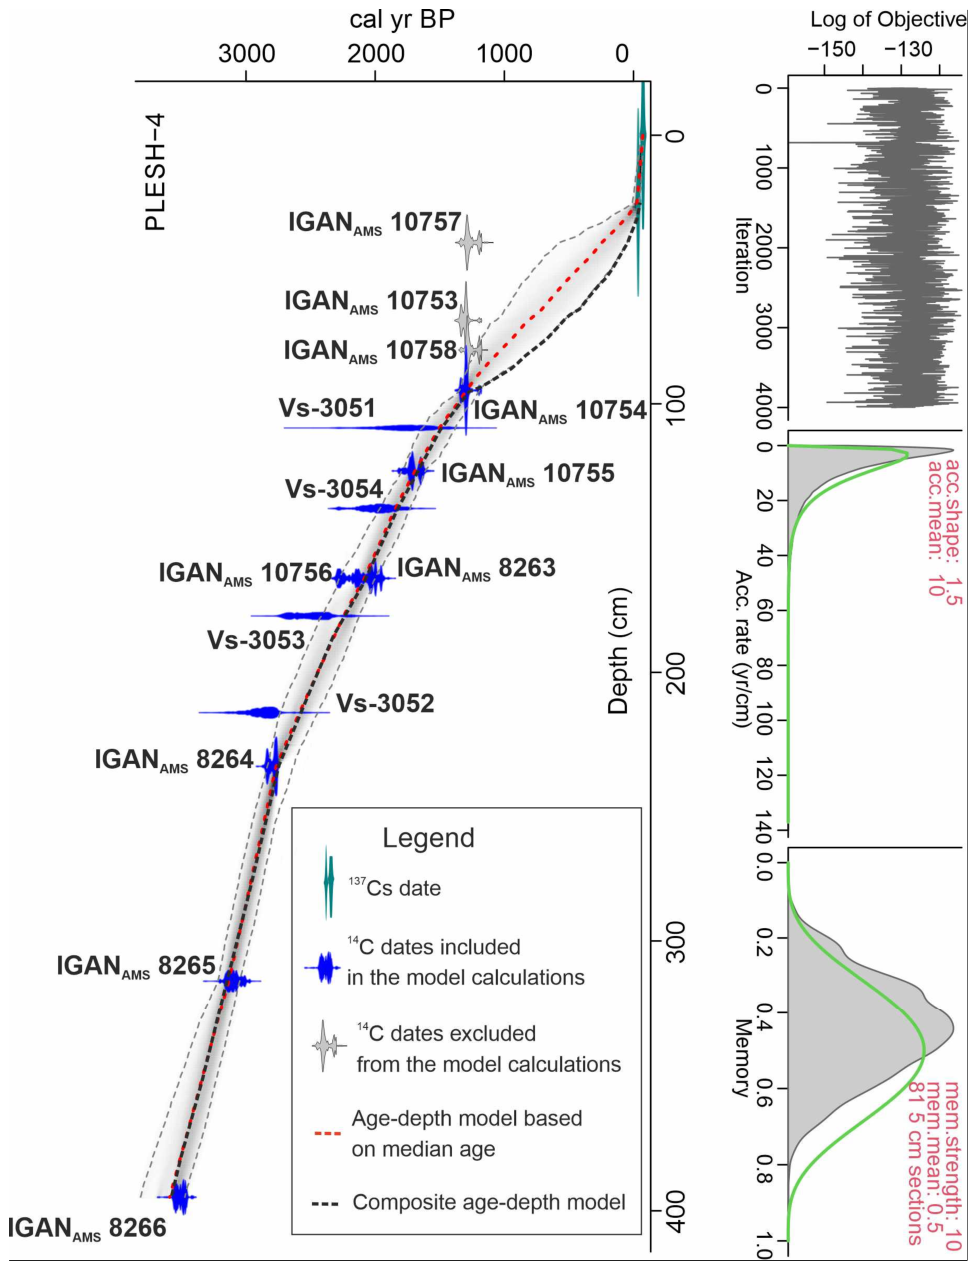
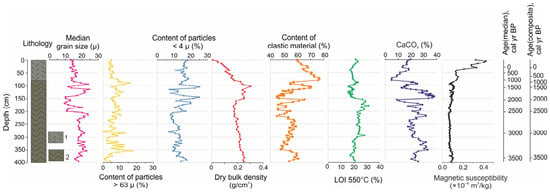
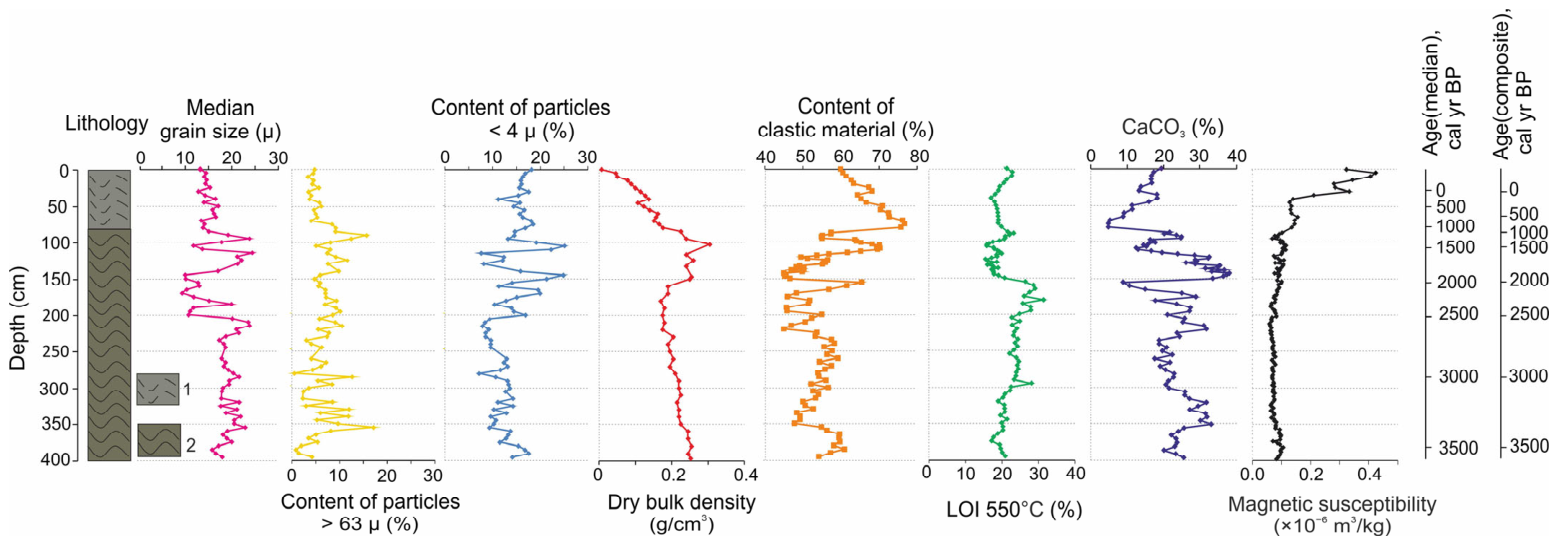
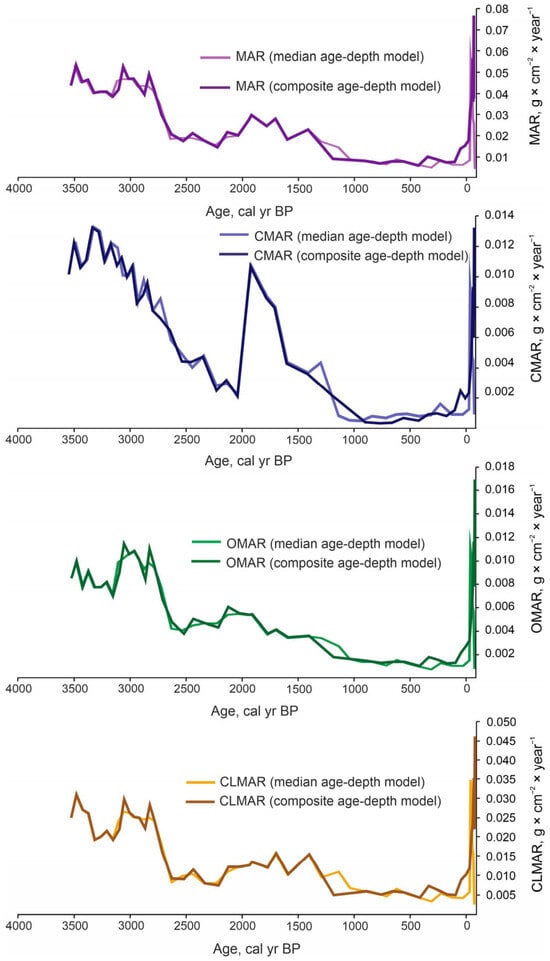
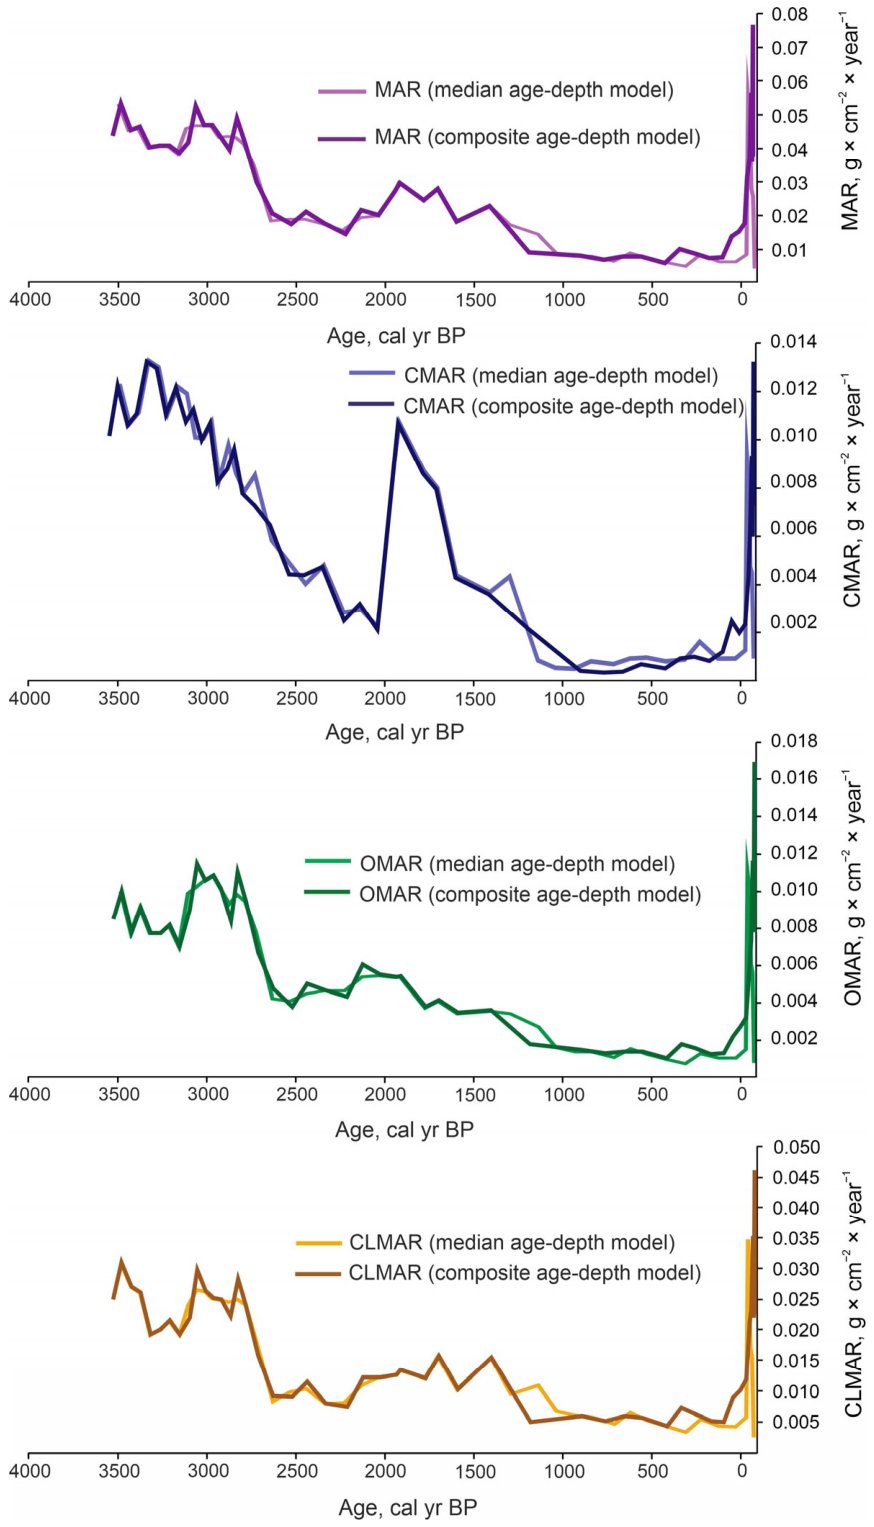
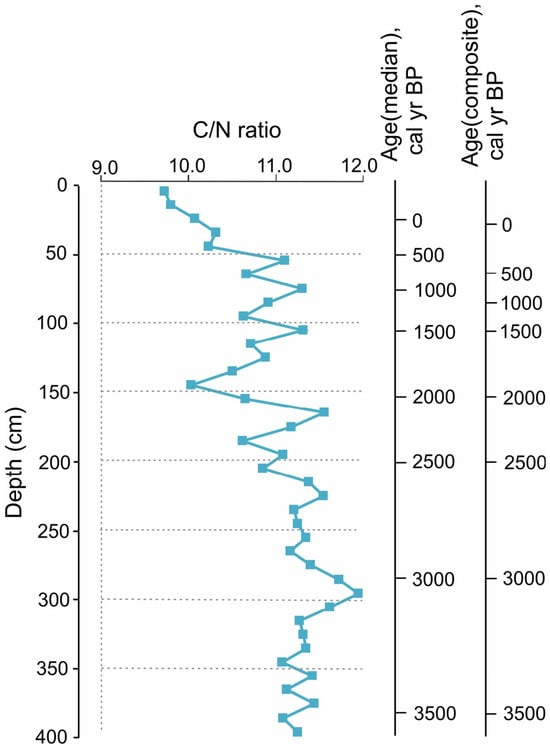
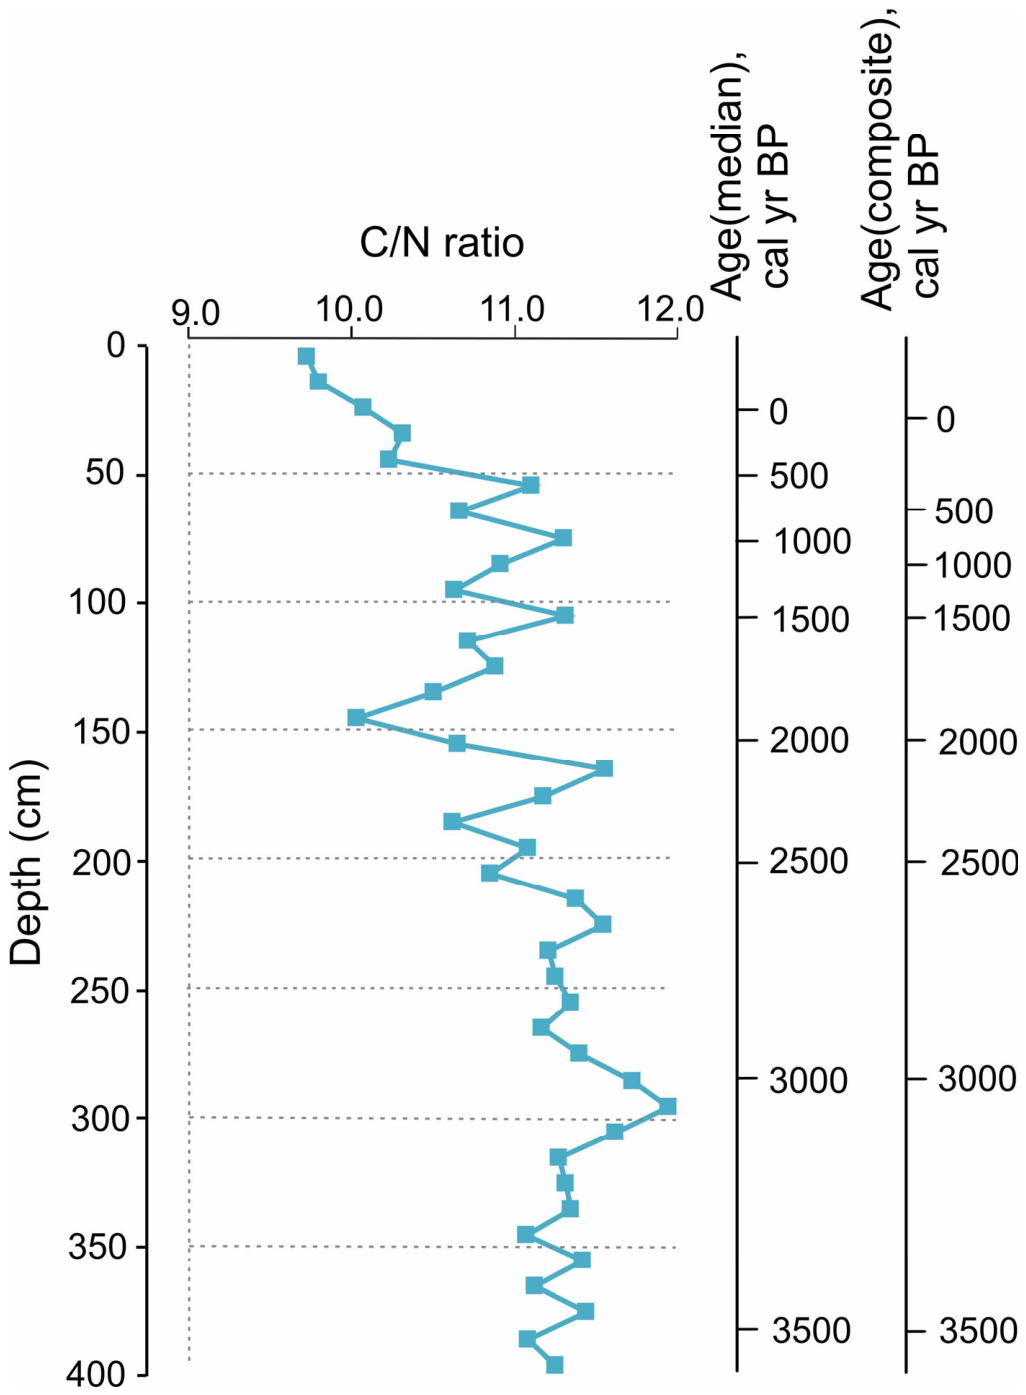
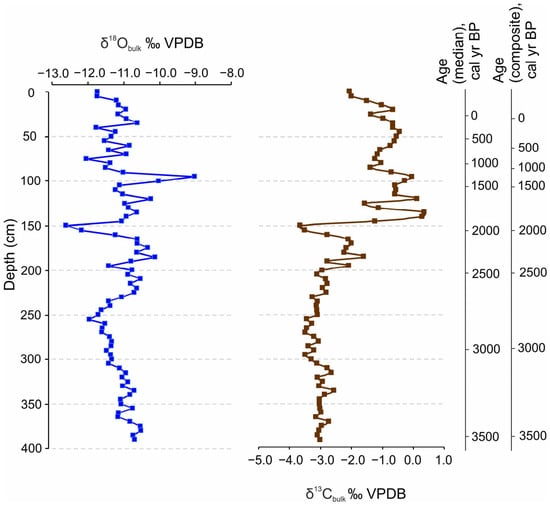
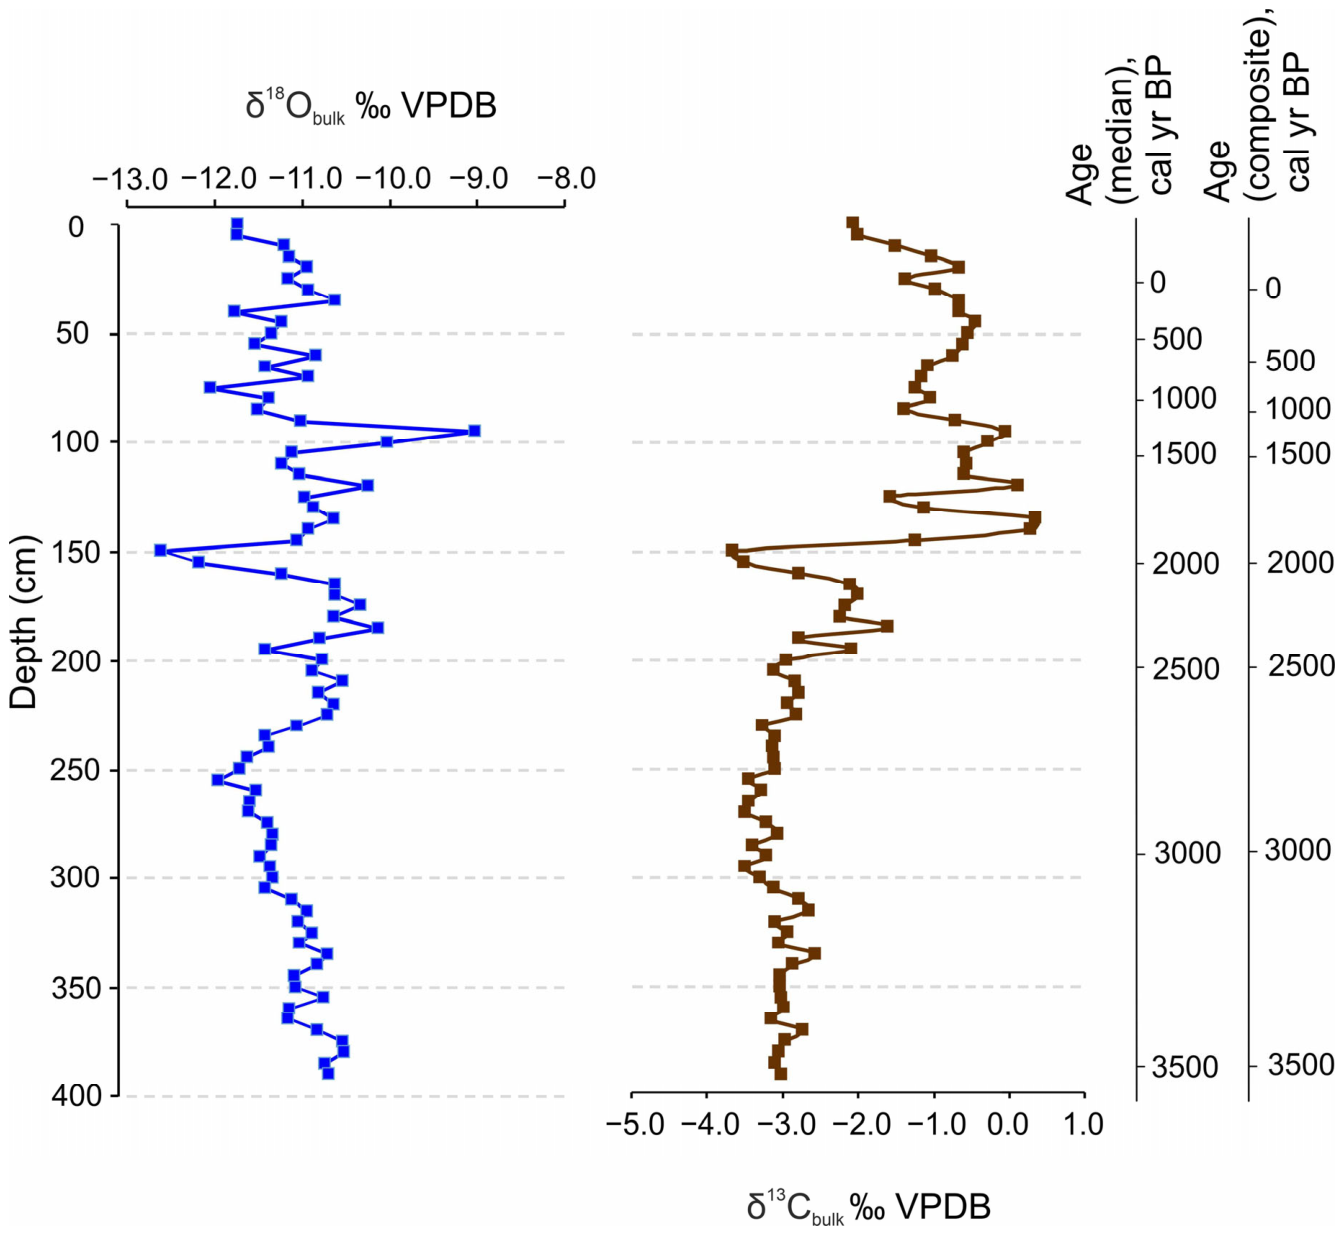
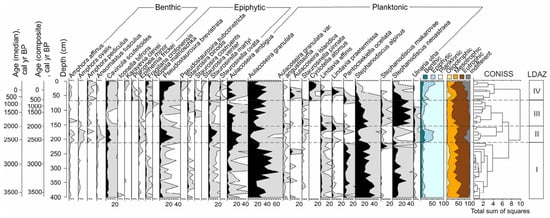
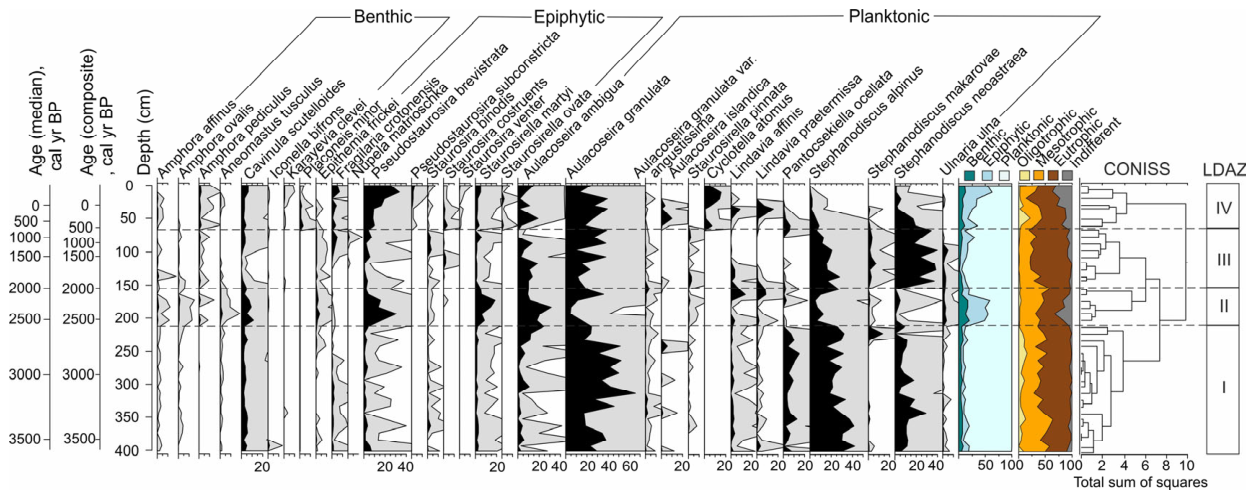
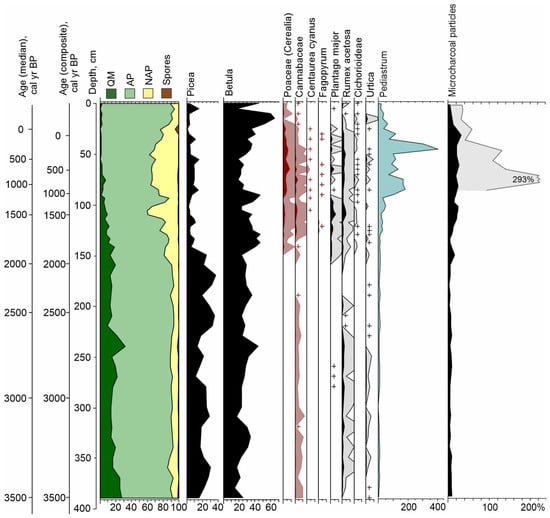
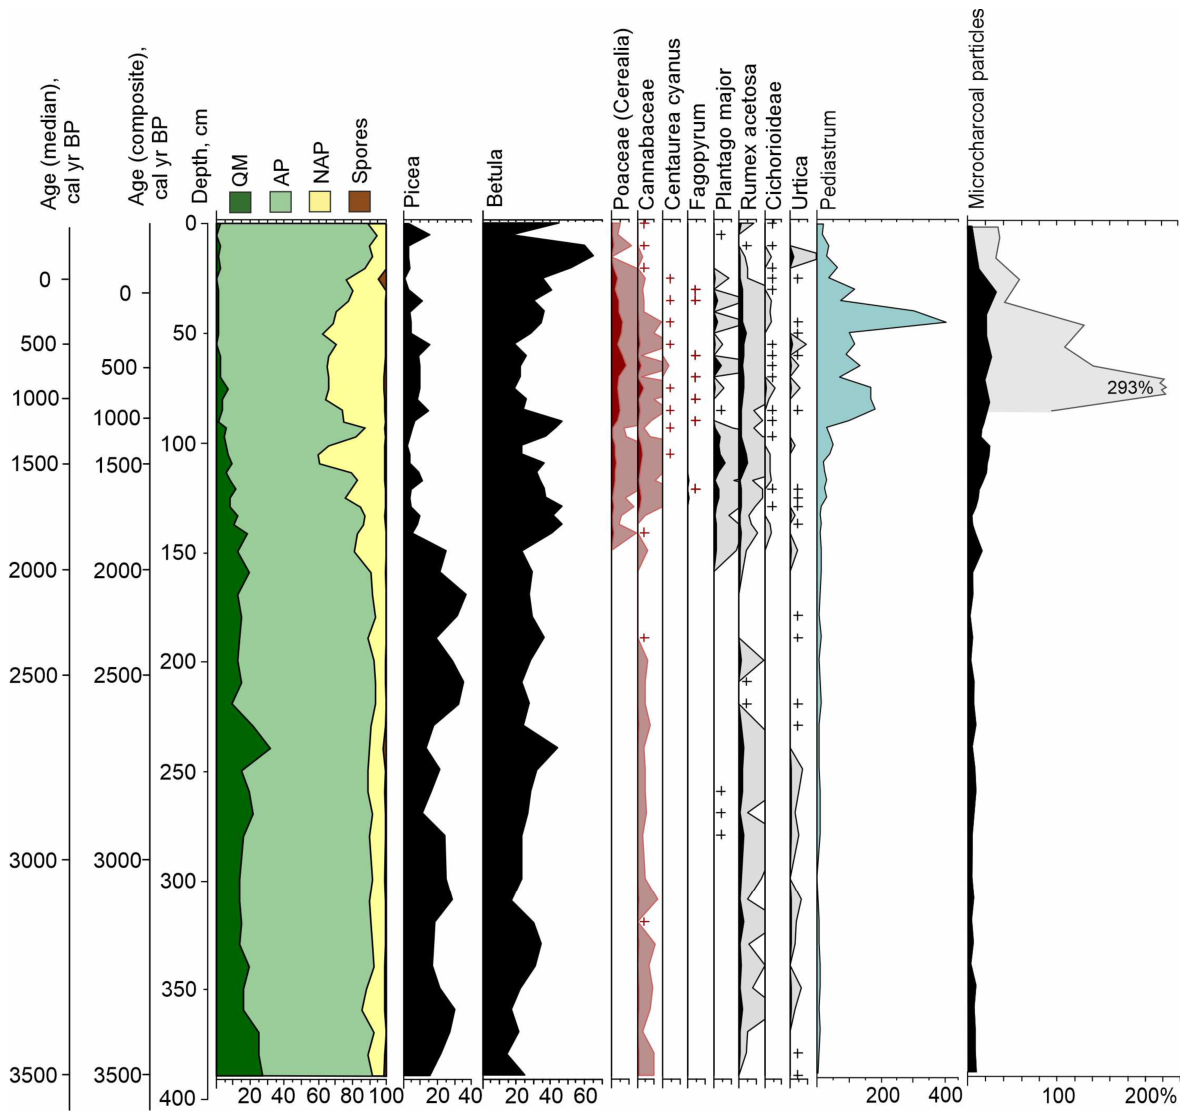
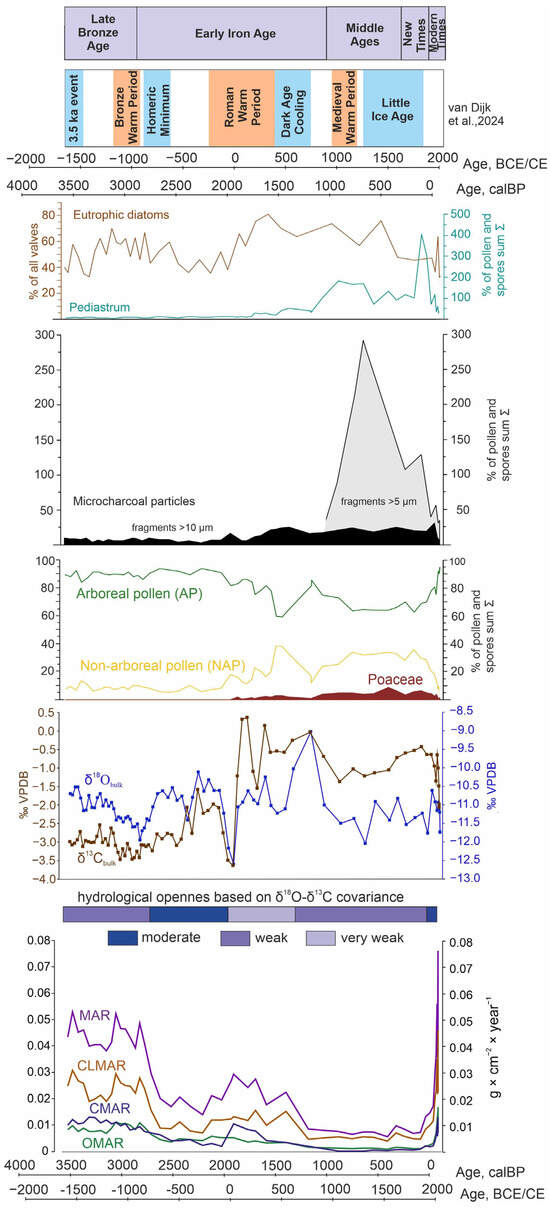
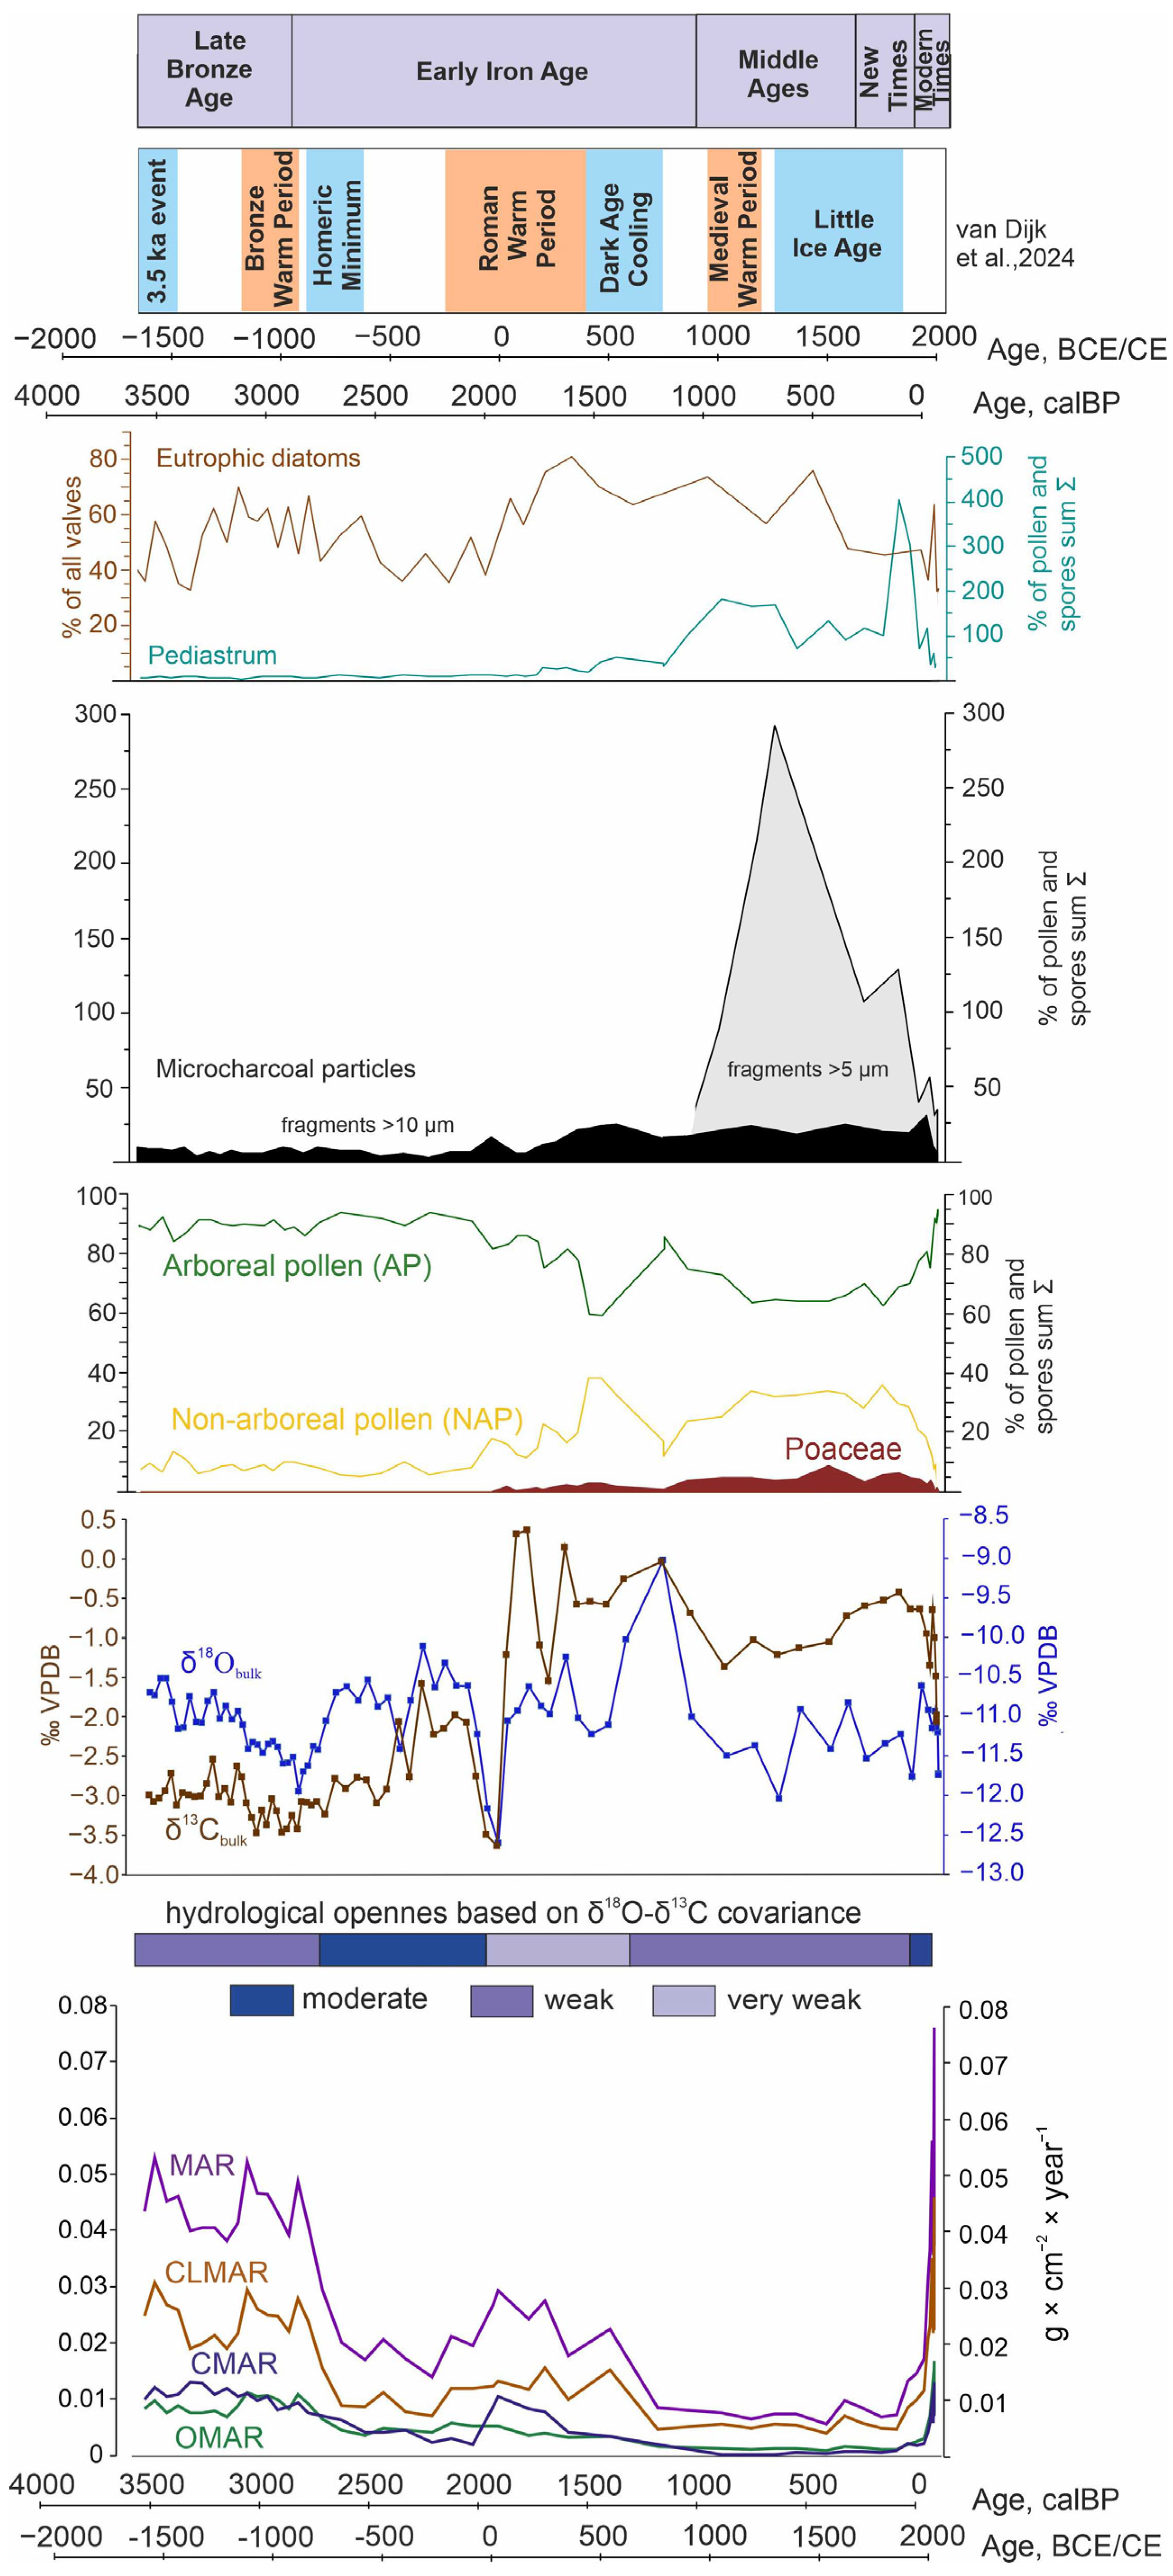

Disclaimer/Publisher’s Note: The statements, opinions and data contained in all publications are solely those of the individual author(s) and contributor(s) and not of MDPI and/or the editor(s). MDPI and/or the editor(s) disclaim responsibility for any injury to people or property resulting from any ideas, methods, instructions or products referred to in the content. |
© 2026 by the authors. Licensee MDPI, Basel, Switzerland. This article is an open access article distributed under the terms and conditions of the Creative Commons Attribution (CC BY) license.