


Abstract
Polymer flooding is a well-established chemical enhanced oil recovery (EOR) method, primarily aimed at improving sweep efficiency. However, the interplay between polymer properties and porous media, particularly the influence on permeability reduction, remains poorly understood. In this study, we investigate how polymer molecular weight, chemistry, and mechanical pre-shearing influence residual resistance factor (RRF) and in situ rheology in Berea sandstone core floods. Post-polymer brine flow exhibits clear non-Darcy behavior, indicating that permeability becomes rate-dependent after polymer adsorption. Application of a Forchheimer-based approach demonstrates that inertial contributions become significant at reservoir-relevant velocities, suggesting enhanced microscopic inertia dissipation associated with interaction between flowing brine and the stationary adsorbed polymer layer. Applying conventional Darcy-based interpretation systematically overestimates RRF under these conditions. RRF increases with polymer molecular weight for polymers with similar bulk viscosities, suggesting that permeability reduction is primarily controlled by effective hydrodynamic size and pore-scale interactions rather than polymer concentration. Mechanical pre-shearing substantially reduces RRF and the non-linear flow contribution, suggesting that laboratory measurements performed on unsheared solutions may overestimate field-scale injectivity impairment. In contrast, an ATBS-containing polymer exhibits relatively low RRF but high apparent viscosity, indicating that alterations in polymer chemistry may override molecular weight as the main factor. The results demonstrate that polymer–surface interactions can induce rate-dependent permeability at reservoir-relevant velocities, and highlight the need for non-Darcy analysis when interpreting polymer core flood experiments for field application.
1. Introduction
Polymers are widely applied in oil recovery to reduce energy consumption and improve process efficiency. Within enhanced oil recovery (EOR), polymers are mainly applied in well operations to alter injection profiles, and in polymer flooding to improve sweep efficiency. In many oil fields, water is injected into the reservoir to maintain pressure as oil is produced. However, due to local variations in rock permeability, the presence of fractures, clay content, and other heterogeneities, the injected water may sweep only a limited area of the reservoir before breaking through to the production wells [1]. A common remediation is to add water-soluble polymers to the injection water. This increases the viscosity of the injected fluid, creating greater resistance to flow along high permeable flow paths and thereby diverting the fluid behind into previously unswept regions of the reservoir. Another application that has gained a great deal of attention in recent years is polymer injection into heavy oil reservoirs [2,3,4].
The injected polymers must meet specific requirements. They must be sufficiently stable under high salinity, temperature, and pressure conditions, while also being able to propagate deep into complex porous media without excessive retention or injectivity loss. Although these aspects have been studied over decades, there are still several questions that require further investigation to improve polymer performance and process efficiency. In this study, we focus on a polymer type commonly applied in petroleum engineering, polyacrylamides (HPAMs). In particular, we investigate the influence of polymer molecular weight on flow resistance (resistance factor, RF) and on polymer retention during transport in porous media.
A central aspect in understanding polymer flooding is the distinction between bulk rheology, as measured in laboratory rheometers, and in situ rheology, which describes the effective flow behavior of polymer solutions within porous rocks. Bulk rheology tests typically expose polymer solutions to well-defined shear rates in simple geometries (such as concentric cylinders, cone-and-plate, or capillary viscometers). Polymers such as HPAMs exhibit shear thinning behavior in this type of flow, i.e., viscosity decreases as shear rate increases. At low shear rates, there is a Newtonian plateau, i.e., constant viscosity independent of shear rate. However, flow through porous rock in a reservoir is far more complex than flow in pipes or rheometer geometries. Reservoir rock consists of tortuous pore networks where passage through pore bodies and pore throats lead to a repeated, but varying, contraction–expansion flow. In addition, pore size distribution, pore structure and pore surfaces increase the complexity of flow description [5,6,7]. As a result, polymer solutions are exposed not only to shear stresses but also to extensional and elongational flow components that cannot be captured in bulk tests [8]. This leads to an in situ rheology within the porous media that deviates strongly from bulk rheology predictions [8,9,10].
At low flow rates, polymers display Newtonian or shear thinning behavior which is consistent with rheometer data. At higher velocities, however, HPAM solutions show increasing viscosity, often referred to as shear-thickening or extensional viscosity. The research community is not in complete agreement on the main mechanism for this behavior (see [8,11,12]), but it is related to the stresses imposed on the polymer during contraction–expansion flow and is proportional to elastic properties of the polymer solution. The viscoelastic effects are sensitive to polymer molecular weight, brine salinity, and rock pore size distribution [5].
A further factor influencing both fluid flow and retention is pre-shearing. Pre-shearing exposes polymer solutions to high-strain or extensional flow conditions prior to injection. This breaks high-end molecular weight fractions and alters the molecular weight distribution. The effect is to mainly reduce viscoelasticity and only have a minor influence on the shear viscosity. This treatment improves injectivity through a lower resistance factor (RF) and reduces the residual resistance factor (RRF) while largely preserving low-shear viscosity, essential for deep reservoir displacement [13,14]. On the other hand, high molecular weight fractions contribute to sweep improvement by increased viscoelasticity. A balance between the beneficial factors must be made for each specific case. Despite growing interest, the influence of pre-shearing on both in situ rheology and adsorption/retention across different molecular weights requires more research [14].
The residual resistance factor (RRF) is an important parameter in polymer flooding. It is used in simulations to calculate flow resistance for post-polymer water flood or flow properties for water cross-flow into polymer-swept areas. It is determined by comparing water permeability before and after polymer flood, usually from core flood experiments in the laboratory. In the experiments reported here, the post-polymer water flood showed non-linear pressure response to injected flow rate, resulting in a rate-dependent RRF. Although it is not an uncommon observation, and has been observed in the literature since the 1970s [15,16,17,18,19,20,21], this is often ignored in the discussions. Rate-dependent permeability may still have large consequences for the interpretation and derivation of parameters such as apparent viscosity. When given attention, the focus has primarily been on the hypothesis of hydrodynamic retention. We approach the non-linear pressure response from the context of induced inertia and apply the Forchheimer relation to describe the fluid flow following the lines of Ma and Ruth [22].
Our study aims to elucidate the interplay between polymer molecular weight and pre-shearing on in situ rheology and residual resistance in sandstone outcrop rock. In addition, we investigate the influence of non-linear permeability to brine after polymer injection and discuss the consequences. This work may improve polymer flooding design and simulation input.
2. Materials and Methods
2.1. Fluids
In all flooding experiments, synthetic sea water (SSW) was used as the reference brine. The composition of SSW is provided in Table 1. During core preparation, a simple 5 wt% NaCl brine and a 0.1 M hydrochloric acid (HCl) solution were used for saturation and cleaning, respectively. Fluid preparation involved the dissolution of laboratory-grade salts in deionized water followed by filtration through a 0.45 µm filter. The viscosity of SSW was 1.02 mPas and the density 1025 kg/m3 at 22 °C.
Table 1.
Synthetic brine composition.
2.2. Polymer
Four commercial polymers were used in this study. Three of these were partially hydrolyzed polyacrylamides (HPAMs): Flopaam (FP) 3230, 3430 and 3630 with average molecular weights (Mws) of approximately 6, 12, and 18 MDa, respectively. All had a 30% degree of hydrolysis. The fourth polymer was an acrylamide polymer with a high content of acrylamide tertiary butyl sulfonic acid (ATBS) monomers: SAV10. Its average Mw was 6 MDa [23]. All polymers were supplied by SNF Floerger, Andrézieux, France, in powder form with an activity of 90%. Polymer solutions were prepared according to the API procedure RP 63 [24]. A stock solution of 5000 ppm polymer concentration in SSW was prepared and mixed overnight at very low speed. The stock solution was subsequently diluted with SSW to obtain different polymer concentrations. Some polymer solutions were pre-sheared with a Silverson high-shear mixer at 2000 rpm for 3 min to induce 30% viscosity reduction. All polymer solutions were filtered through 5 µm polycarbonate membrane filter under 1 barg nitrogen pressure. The viscosity of the polymer solutions as a function of shear rate was measured by the cone–plate geometry (CP 2/50 Titanium spindle) in a rotational rheometer (Malvern Kinexus Pro equipped with rSpace v1.8 software (Malvern Instruments Ltd., Malvern, UK)) at 22 ± 0.01 °C. The measurement uncertainty was 2%. The target viscosity of all solutions was 10 ± 0.5 mPas at 10 s−1 after pre-shearing (when required) and after filtration. Table 2 provides a summary of the polymer solutions.
Table 2.
Summary of the polymer solutions’ concentration and viscosity.
2.3. Porous Medium
Outcrop Berea sandstone was used as the porous medium in this study. It is a homogeneous rock type that consists of 87–88% quartz, 4% feldspar, 2% dolomite 5–6% kaolinite and 1% illite [25]. The core samples were cut and then dried in a heating cabinet overnight at 100 °C. The cores were then vacuumed and saturated with NaCl brine, and the pore volume (PV) was calculated by mass balance. The cores were then mounted in a core holder and the permeability was measured. To clean the cores from potential organic material, the cores were flooded with 1.0 PV HCl followed by 0.5 PV NaCl brine, repeatedly, until the effluent was clear. A final 2 PV of NaCl brine was injected into the core and then displaced by 3 PV of SSW. The differential pressure was continuously monitored to check for plugging or precipitation. After cleaning, the permeability was measured again. The permeability was not significantly altered by the cleaning process. As standard, the permeability after cleaning was reported as absolute permeability (). The instrumental uncertainty of core permeability measurements was 0.2%. However, the experimental error was in the order of 5%. The petrophysical properties of the core samples are listed in Table 3. Pore size distribution of neighboring outcrop Beara samples is given in Figure 1.
Table 3.
Petrophysical properties of the core material.
Figure 1.
Pore size distribution of neighboring Beara sandstone core samples from mercury injection capillary pressure (MICP).
2.4. Experimental Setup
The core flooding apparatus consisted of a Quizix precision pump (AMETEK, Inc., Brockon-arrow, OK, USA), a floating-piston cylinder, a core holder with internal pressure port, two FUJI FCX Series differential pressure transmitters (Fuji Electric Co., Ltd., Tokyo, Japan) and a fraction collector. The floating-piston cylinder functioned as the injection fluid reservoir and was operated by the pump. The internal pressure port was positioned 1.50 cm from the core inlet. The differential pressures across the core and across the pressure port were continuously recorded by a computer. Figure 2 illustrates the experimental setup.
Figure 2.
Schematic of the core flooding apparatus (∆P: differential pressure).
2.5. Procedure
All the experiments were conducted at ambient conditions (22 ± 0.5 °C) and the room temperature was continuously monitored for significant fluctuations during the experiments. The resulting uncertainty in pressure data is less than 0.2%. The experimental procedure was as follows:
- Injected 2 PV of polymer solution at a flow rate of 0.5 mL/min.
- Injected polymer solution at flow rates of 2.0, 1.0, 0.3, 0.1, and 0.05 mL/min until differential pressure was stable at each flowrate.
- Tapered the polymer solution by injecting 2 slugs of 50% and 25% of original polymer concentration at a flow rate of 1 mL/min, 0.5 PV each.
- Flushed the core with 10 PV of SSW at a flow rate of 5.0 mL/min.
- Measured the core permeability after polymer flood with SSW ().
- Flushed the core with 90 PV of SSW.
- Re-measured the core permeability with SSW .
2.6. Method
This section clarifies how the key parameters from the core flood experiments are determined and discusses practical issues in the measurement and utilization of some of the parameters.
2.6.1. In Situ Rheology
In situ rheology is measured by flooding polymer through porous media. The porous media can be a rock sample such as outcrop or reservoir rock, or models such as sandpacks or micromodels. Here it is determined from core flooding experiments, in which a polymer solution is injected through a cylindrical rock sample at controlled rates and the resulting pressure drop is measured. Applying Darcy’s law for a non-Newtonian fluid, the apparent viscosity, µapp, can be calculated as follows:
where ΔPp is the measured pressure drop for the polymer, kw,e is permeability to brine after polymer injection, L is the core length, Q is the injection rate and A is the surface area of the injection face of the core. It is important to note that apparent viscosity is the average macroscopic property for polymer flow in porous media, unlike that of polymer flow in a rheometer or a capillary. The differential pressure during polymer flow is related to that of the brine after polymer flood, i.e., using kw,e, the permeability to brine. Thus, any “permanent” change in rock permeability due to polymer adsorption and retention in the porous media is accounted for in the brine permeability parameter. Consequently, apparent viscosity is the effective viscosity of the flowing polymer solution. In some reports, the permeability of brine prior to polymer flood is used for calculating apparent viscosity. However, this leads to a viscosity parameter that incorporates both the flowing part, i.e., the rheology of the polymer, and the “permanent” part, i.e., the adsorption and retention effects. Apparent viscosity is used mostly to compare the rheology in situ with ex situ, i.e., in the rheometer. As such, separating out the permanent change is most appropriate.
The discussion above relates to a comparison of polymer rheology in the porous media with that measured in the rheometer. In the application of polymer flooding, it is of high interest to determine the total resistance to flow in the reservoir where polymer is applied. This is characterized by the resistance factor, RF, which is defined as follows:
where ΔPp is the measured pressure drop for the polymer, kw,i is permeability to brine prior to polymer injection, L is the core length, Q is the injection rate and u is the Darcy velocity of the fluid. As discussed above, this parameter relates to the flow resistance occurring from both the viscosity of the polymer in the porous media and the residual permeability reduction due to adsorption and retention of polymer. It is this total resistance that determines the diversion of flow in the porous media.
2.6.2. Effective Shear Rate
The concept of an effective shear rate γ̇eff is often introduced to compare core flood data of different permeabilities [26]:
where n is the shear thinning exponent from the Carreau–Yashuda or the power law equation, ϕ is porosity, k is permeability to brine after the polymer injection, and C is a dimensionless correction factor that accounts for pore geometry. The empirical correction factor, C, varies considerably between studies and no universally accepted correlation between the polymer and the porous media exists. This reflects the limitations of treating porous media as a bundle of capillaries (see further discussion in [12]). There is also no definition of the permeability, k, in the equation. Due to polymer adsorption and retention, the effective pore size is reduced after polymer injection and some pores may be blocked [5]. This alters the flow conditions and is the justification for applying the brine permeability after polymer injection, kw,e, for the “k” in the effective shear calculation (Equation (3)). Although the kw,e has rather large uncertainty, it is still preferred as it contains important impact of the polymer on fluid flow. Some may argue for the use of the brine permeability prior to polymer injection, in which case the permeability reduction should be incorporated into the α value. Due to the already large variations for the value if α, we recommend the choice of kw,e in the effective shear rate equation. In the presence of oil, it was reported [27] that the parameter u′ given by Equation (4) gave a good correlation with the bulk rheology data. We have no oil present in our study and therefore applied the version where residual oil saturation (Sor) is zero and relative permeability (krw) is 1. Similarities in porosity and permeability within the cores used here resulted in no significant difference between Equations (3) and (4), recognizing that they are both essentially a function of the Darcy velocity, u, and the square-root of permeability and porosity.
2.6.3. Residual Resistance Factor
In the reservoir, water can enter areas previously flooded by polymer, for example by being diverged from an adjacent layer or by being injected as chase water following the polymer slug. In order to determine the flow properties of the water phase, the permanent permeability reduction caused by the polymer is of most interest. This is characterized by the residual resistance factor, RRF, which is the mobility reduction in water after polymer flood:
where w stands for water, i for initial, e for end, λ is the mobility, k is permeability, and ΔP is the measured pressure drop. The last step is achieved by applying Darcy’s law (see Equation (1)) and recognizing that the other parameters are identical before and after polymer flood and thus are canceled. In reservoir simulation of polymer flooding, RRF is one of the input parameters. Typically, it is multiplied by the brine or polymer relative viscosity to achieve the resistance to flow (RF).
Although the concept of RRF is widely applied, it is still not clear which processes are involved, nor the relative importance of each process. There seems to be consensus on a few processes in the literature [5,9,28,29,30,31]:
- Adsorption: Polymer molecules adsorb on the surface of the pores and reduce the effective pore size, generating resistance to flow. It is regarded as the main mechanism by many and leads to the concept of adsorbed layer thickness, εh, which is proposed to be a function of the permeability reduction [16]: εh = Rp(1 − RRF−1/4) where Rp is the effective pore radius. It assumes that the adsorbed polymer generates a permanent, impenetrable layer and that there are no contributions to RRF other than adsorption.
- Desorption: Absorbed polymer may desorb from the rock surface as it is exposed to large volumes of brine and/or high injection rates. Desorption is regarded only to occur at a very low rate and is not expected to be a major contributor to RRF after large PV of brine post-flush. It can, however, be of larger importance when low amount of PV of brine has been applied in the post-flush.
- Mechanical entrapment: Polymer coils and aggregates get physically trapped in pore throats smaller than approximately 3 times their hydrodynamic size. The hydrodynamic diameter of dilute solutions of HPAM-type polymers in sea water is in the order of 50 to 300 nm [5]. It is a function of molecular weight, type of polymer, brine salinity and temperature. The blocking of pores may lead to higher inaccessible pore volume (IPV) and increased tortuosity and resistance to flow.
- Unstable displacement: A polymer slug is followed by brine injection in the field and in core flood experiments. This process is unstable because of the difference in mobility between brine and polymer. Injected brine may finger or channel through the remaining polymer in the porous media, leading to bypassed polymer. This may lead to restriction of flow by reduction in the effective pore volume.
- Sweep: Poor sweep by brine may leave sections of the porous media containing polymer. In the porous media, narrow pore throats filled with polymer may effectively seal off downstream areas for the brine flow, normally determined as inaccessible pore volume (IPV) in laboratory experiments. This may reduce the effective pore volume leading to higher resistance to flow.
The upscaling of laboratory-measured RRF to field scale has long been debated in the literature—see, e.g., Sorbie [5], Dean et al. [28], and Sagyndikov et al. [29]. Not only is the debate about what the RRF should represent and how it is to be utilized in simulations, but it is also about the method of laboratory measurements. In the laboratory, RRF is measured in core flood experiments by comparing the permeability to brine before and after polymer flood. Measuring the permeability after polymer flood requires displacement of the polymer from the core. The process is an unstable displacement as the viscosity of the injected water is much lower than that of the displaced polymer. Consequently, the water fingers through the polymer and, depending on the mobility ratio of the two phases and the heterogeneity of the rock, the efficiency of the displacement may vary greatly. Seright [31] showed that the measured RRF is a function of PV of water injected and varies with permeability. He suggested to inject at least 100 PV of water to achieve a good estimate of RRF primarily to compensate for the unstable displacement. High RRF values, i.e., larger than 2, were to be critically evaluated for rock with permeability > 200 mD. It is difficult to compare RRF values from the literature. The flow rates applied to measure RRF and the extent of post-flush are rarely reported. Both are essential for the result of the displacement process and differences may lead to erroneous results, primarily overestimation of RRF.
In our own experience with laboratory core floods, the criteria for “good estimate of RRF” is stable differential pressure for the brine post-flush. The slope of dP vs. PV injected may be very low and requires a long time to measure, especially at low flow rates. The procedure starts with the main flow rate of the polymer flood, then the flow rate is increased step-wise to 10 or 20 times the polymer flow rate, matching the differential pressure of the polymer flood. This ensures a high dP gradient comparable to that of the polymer flood to flush polymer from smaller pores. Then the brine injection rate is reduced and allowed to continue until pressure stabilizes. This step allows for the slow process of convective dilution of polymer in isolated sections of the core. This process can require anything from less than 10 PV to more than 100 PV.
3. Results and Discussion
3.1. Bulk Rheology
Partially hydrolyzed polyacrylamide (HPAM)-type polymers were chosen for this study. Three different molecular weights were selected to represent the typical range used in polymer flood applications within enhanced oil recovery (EOR); see Table 4. Each was pre-sheared to represent the polymer state after passing through the topside choke valves, well screen and the entrance into the porous media at high velocity. In addition, the SAV10 polymer, which contains a different side group, ATBS, was added to represent a polymer used at challenging conditions of high temperature and salinity.
Table 4.
Fitted polymer Carreau model parameters.
In the EOR literature, it is most common to compare polymers at the same concentration to evaluate their performance. Good reasons for this approach are that price is usually directly proportional to concentration and, within a similar type of polymer, so is the viscosity gain. In this study, we want to compare the influence of polymer rheology on in situ viscosity and permeability reduction after polymer. This is best achieved by adjusting polymer concentrations to match the same shear viscosity at a given shear rate. We chose a viscosity of 10 mPas at a reference shear rate of 10 s−1. This shear rate is representative of polymer flow velocities in the field. Shear viscosity data obtained from rheometer measurements was modeled using the Carreau–Yashuda equation (Equation (6)):
where µ∞ is infinite shear viscosity, µ0 is zero-shear viscosity, is shear rate, λ is a time constant, a is an empirical parameter here equal to 2, and n is the shear thinning exponent. The model parameters are given in Table 4 and shear curves are shown in Figure 3.
Figure 3.
Bulk rheology of polymer solutions calculated Carreau model (PS stands for pre-sheared).
All solutions show Newtonian or near-Newtonian behavior at low shear rates, followed by shear thinning at moderate to high shear rates. As expected, zero-shear viscosity and degree of shear thinning increases with molecular weight. Pre-shearing the polymer solutions reduces zero-shear viscosity and shear thinning behavior. The polymer with the lowest molecular weight shows the most “Newtonian-like” behavior, i.e., longer Newtonian plateau and less shear thinning than the other polymers. A previous study reports that 1200 ppm of pre-sheared FP3630 in SSW behaves as in the semi-dilute entangled regime [32]. It can be assumed that the pre-sheared FP3630, whose concentration is 1450 ppm, is in the same regime, and indirectly the other solutions, based on their matching rheology target of 10 mPas. Note that the pre-sheared solutions were compensated with higher polymer concentration to match the viscosity of the non-sheared polymers.
The SAV10 polymer is included in the study because of its high ATBS content. The ATBS side groups lead to better stability in high temperature and saline brines [11]. This is important for the application in oil reservoirs where temperatures may reach 120 °C and the salt concentration of formation waters may reach 0.3 wt%. The molecular weight of SAV10 is similar to that of FP3230, but because of the difference in composition, its shear viscosity behavior is closer to that of FP3430, which has higher molecular weight (see Table 4). The difference in shear viscosity behavior is important because of the broad variation in effective shear rates experienced by the polymer in the porous media. A recent review [33] reports a reservoir in-depth effective shear rate of 1 s−1 and a near-well shear rate of 100 s−1. The two values are each an average effective shear rate. However, the pore size distribution of the porous media is such that the radius of small pores may be 2–3 orders of magnitude smaller than the large pores for common reservoir rock [5]. Indeed, a simulation study by Berg and van Wunnik [12] shows that pore-scale resolved shear rates that are directly computed from the flow field range from 0.01 to 10 s−1 for a flow velocity of 1 ft/day (0.3048 m/day), a typical value used in field applications. In this case, the average shear rate was 6 s−1. As can be seen in Figure 2, the shear viscosity at a shear rate of 1 s−1 is in some cases up to double that of 100 s−1. Both zero-shear viscosity and shear thinning properties of the polymer are therefore important: polymer solutions that exhibit stronger shear thinning may give higher contrast between the effective viscosity in small pores compared to larger pores where the shear rate is lower. This is experimentally observed from the differential pressure of the polymer flow through the rock core and is discussed in the following sections.
3.2. In Situ Rheology
As aforementioned, there is a clear distinction between bulk and in situ rheology. In situ rheology is of the greatest importance for flow in the reservoir. The resistance factor (RF, see Equation (2)) is measured to characterize the resistance to flow experienced by the polymer. Sweep improvement is a direct function of the RF which contains the contributions from polymer viscosity, retention and adsorption in flow restriction.
Resistance factor is a function of polymer flow velocity as it is primarily dependent on the non-Newtonian rheology of the polymer. The literature agrees on a rule of thumb of 1 ft/day [5,34]; however, this is a typical rate for vertical wells. With the advent of horizontal wells for polymer injection and an expansion of the range of conditions in which polymer flooding is being employed [35], the in-depth reservoir flow velocities may vary greatly depending on the well configuration, i.e., vertical or horizontal wells, heterogeneity of the rock, and the polymer–oil mobility ratio. For homogeneous cases, it could be as low as 0.01 m/day, whereas strong heterogeneity and viscous fingering can lead to advance rates of 10 m/day. However, most applications are assumed to be around 0.1 m/day [35].
3.2.1. Effect of Molecular Weight
Three HPAM polymer solutions were flooded through individual outcrop cores (see Table 2 and Table 3) and the resistance factor was measured as a function of flow velocity. The rheograms are shown in Figure 4. All polymers show Newtonian behavior at low velocities and an increase in RF at higher velocities. The increase at high velocities is referred to as shear-thickening [5] or elastic turbulence [8]. This is attributed to the viscoelastic nature of HPAM and the elongational flow field in the porous medium at high flow velocities.
Figure 4.
Resistance factor as a function of flow velocity for HPAM solutions with molecular weights 8, 12 and 18 MDa for FP3230, FP3430 and FP3630, respectively. Polymers were prepared to have the same bulk viscosity at 10 s−1 (Table 2).
The highest Mw polymer, FP3630, will exhibit the highest elongational stress going through contraction–expansion cycles from pore throat to pore body [5]. This is reflected in Figure 4: where FP3630 shows the highest increase in RF value. It is important to remind the reader that the three polymer solutions have the same shear viscosity (at 10 s−1 bulk shear rate), and similar shear viscosity profiles (see Figure 3). The differences observed in Figure 4 are therefore ascribed to the interaction between the polymer solutions and the porous media. The FP3430 solution has a lower Mw than FP3630 and is therefore expected to have lower degree of elastic turbulence, which is observed as a lower RF value at high flow velocities. However, the onset of elastic turbulence is similar for these two polymers. On the other hand, the lowest-Mw solution, FP3230, behaves notably differently. Although the onset of elastic turbulence occurs around 0.3 m/day for FP3430 and FP3630, it initiates at around 1.2 m/day for FP3230 making the polymer solution exhibit shear thinning behavior at all lower flow velocities. Flow rates above 1 m/day are most relevant for the near-well region and high degree of elastic turbulence may cause injectivity restrictions (see further discussion in Sagyndikov et al. [29] and Dean et al. [28]). Our data suggests that, when injectivity restrictions are an issue, injecting a higher concentration of low-Mw polymer may reduce risk while maintaining in-depth reservoir viscosity.
3.2.2. Effect of Pre-Shearing
Pre-shearing of polymer was previously performed to homogenize solutions and break microgels [5]. As the quality of polymers for EOR has improved, it is no longer necessary. Currently, pre-shearing is performed in the laboratory to represent the mechanical shear degradation the polymer undergoes while passing choke valves, well screens or entering the porous media at high velocities from the injection well. In the field, pre-shearing may be used to reduce high-resistance factors that occur at high flow rates, as experienced in the near-well region [13]. Pre-shearing reduces the elasticity of the solution by breaking the high molecular weight fractions of the polydisperse polymer solution. In this work, the polymers are exposed to shear forces representative of that experienced topside and in the near-well region prior to injection in individual cores. The main purpose is to evaluate what influence pre-shearing may have on the in situ rheology in rock formations represented by the outcrop samples.
Figure 5 compares the resistance factors of the native with the pre-sheared polymer solutions as a function of the flow velocity. All pre-sheared (PS) solutions show similar rheological behavior as in the native state. The exception is the polymer with the lowest molecular weight, FP3230 PS, which shows stronger shear thinning than in the native state. For this polymer, the onset of elastic turbulence is outside the range of measured flow velocities, showing a significant shift relative to the native state.
Figure 5.
Resistance factor as a function of flow velocity for polymer solutions in native and pre-sheared (PS) conditions. Polymers were prepared to have the same bulk viscosity at 10 s−1 (Table 2).
All pre-sheared solutions show reduced RF at high shear rates, i.e., a reduction in the elastic turbulence. This may lead to better injectivity under conditions of high effective flow velocities in the near-well region. For the FP3430PS and FP3630PS solutions, the onset of elastic turbulence is shifted from approximately 0.3 m/day to approximately 0.9 m/day. It is well-known that the onset of elastic turbulence is inversely proportional to the average molecular weight [5]. Using FP3230 as a reference, the onset suggests that the effective molecular weight of the pre-sheared polymers are between 6 and 12 Mda, i.e., between the Mw of the native FP3430 and FP3220.
It is important to emphasize that all polymer solutions were matched to have the same bulk shear viscosity of 10 mPas at 10 s−1 (Table 2). The observed differences in flow behavior are therefore attributed solely to differences in rheological properties arising from the flow in porous media. From a technical perspective, it seems appealing to inject a pre-sheared polymer to reduce the risk of high flow resistance in the near-well region while still matching a good in situ viscosity at lower flow velocities deeper in the reservoir. This is shown by the overlapping Newtonian plateau for most of the polymer solutions.
3.2.3. Effect of Polymer Chemistry
The SAV10 and Flopaam 3230 polymers have similar molecular weights (~6 MDa) but differ structurally. SAV10 incorporates ATBS side groups, offering enhanced salt and temperature tolerance, whereas FP3230 has simpler acrylamide side groups and is significantly more cost-effective. Thus, selection between the two depends on reservoir conditions and economic constraints. To match a shear viscosity of 10 mPas at 10 s−1, both solutions required a concentration of 2500 ppm. The resistance factor of SAV10 is compared with the other native polymers in Figure 6. At low velocities, the Newtonian behavior plateau of SAV10 overlaps with FP3630, and it is slightly higher than FP3430 and FP3230. Although the molecular weight is similar to FP3230, SAV10 exhibits an onset of elastic turbulence at nearly an order of magnitude lower velocity, in line with FP3430 and FP3630. The degree of elastic turbulence is stronger at higher velocities, suggesting better injectivity for FP3230 than for SAV10. Although SAV10 and FP3230 have similar Mw, both bulk and in situ rheology (Figure 3) are notably different and SAV10 is more similar in behavior to FP3430.
Figure 6.
Resistance factor of SAV10 compared to the HPAM-type polymer solutions. Polymers were prepared to have the same bulk viscosity at 10 s−1 (Table 2).
3.3. Permeability Reduction and Apparent Viscosity
Because of polymer adsorption and retention, the permeability of the rock is reduced after polymer flooding [5], which leads to an increase in resistance to flow. The increase in flow resistance during a polymer flood, compared with a water flood, can be ascribed in part to this reduction in permeability and partly to the rheological properties of the polymer. In the following sections, the permeability reduction will be determined and the in situ rheological properties of the polymer, the apparent viscosity, will be calculated. Furthermore, the influence of polymer molecular weight, pre-shearing of polymer and polymer chemistry on these parameters will be discussed.
In the literature, permeability reduction is measured by different procedures and we will show that, in some cases, these procedures can give very different results. For example, the extent of polymer tapering and post-polymer brine flushing may influence the measured permeability reduction. A more fundamental issue is the observation of non-linear pressure increase with flow rate that implies non-Darcy flow conditions during post-polymer brine permeability measurements. A critical evaluation of the current methodology is therefore required, as neglecting rate-dependent permeability may lead to significant overestimation of the residual resistance factor.
3.3.1. Experimental Determination of Residual Resistance Factor
Permeability is measured by flowing brine through a porous medium, e.g., a rock core, at varying rates and measuring the stabilized differential pressure at each rate step. Applying Darcy’s law (Equation (1)), the permeability to brine can be calculated. This process is performed prior to polymer injection and repeated after a polymer flood. The reduction in permeability is the ratio of the permeability prior to that after, and it is referred to as the residual resistance factor, RRF (Equation (5)).
The first key point is to measure a representative RRF. At the end of a polymer flood, the core is filled with polymer which has to be exchanged with brine in order to measure the permeability after. The displacement is inherently an unstable displacement, as the viscosity of the polymer solution is always equal to or higher than that of the brine. The heterogeneity of the porous medium further reduces the displacement efficiency of the brine. In addition, polymer adsorption and desorption kinetics require time to reach equilibrium, kinetics which seem to be rate-dependent [5,10,36]. The permeability after should be measured at “stabilized differential pressure” and the combination of unstable displacement and heterogeneity makes it difficult to define exactly what “stable pressure” for brine flood is. In practice, the pressure apparently “stabilizes” after a few pore volumes, but there is still a pressure gradient continuing for 100s of pore volumes injected. A number of literature reports were reviewed by Seright [31] and the majority of the reports applied only 1–10 PV of brine flush post-polymer. It partly explains the large scatter in RRF values measured. In a long-core experiment, Seright showed that the differential pressure continued to drop even after 100 PV of brine. The gradient Δ(dP)/ΔPV was about 6% after 10 PV and about 0.6% after 100 PV. No conclusions were made with regard to what would constitute a “sufficient” brine flood, and the pressure gradient would have been lower at lower PV injected if tapering had been performed. Tapering is a gradual reduction in polymer concentration prior to the injection of brine. It reduces the mobility contrast between the injected brine and the displaced polymer solution. Nonetheless, it shows that brine displacements of polymer with less than 10 PV of brine and performed without tapering may lead to severe overestimation of RRF.
To address this issue, all of the experiments reported herein applied tapering with 0.5 PV of ½ concentration polymer and 0.5 PV of ¼ polymer concentration prior to brine flush. Brine flush was performed at an injection rate of 5 mL/min. To document the influence on dP and RRF, permeability measurements were performed after 10 and 100 PV, respectively. The results are illustrated in Figure 7, which shows that, for all but two of the polymer floods, significant reduction in differential pressure was observed from an increase in the volume of injected brine post-polymer flood. Higher molecular weight polymers seem to require larger post-flush, as suggested by the relatively lower reductions from 10 to 100 PV for pre-sheared polymer.
Figure 7.
Differential pressure to brine measured a single point (Q = 0.5 mL/min) prior to polymer flood, and post-polymer flood with 10 and 100 PV brine flush.
The common practice in lab experiments and in the literature is to report RRF as a single value. It is seldom reported as a function of flow rate/shear rate. Nevertheless, a few researchers, and as early as 1970, have reported RRF as a function of share rate [15,16,37]. Chauveteau [16] showed that RRF was linear at low shear rates and at a critical shear rate it started to increase. The increase in RRF was initially attributed to elongational effects, whereas in later work it was attributed to bridging adsorption and coil stretching [37] and it was attributed to an increase in adsorbed layer thickness [17]. Recently, ref. [18] reported similar results to [16] and provided a similar explanation. Ref. [37] reported that RRF decreased with shear rate for sandpacks but increased with shear rate for Berea sandstone. They too attributed the phenomenon to coil stretching (elongational effects).
The phenomenon was reported in sandstone reservoir samples by [20]. They used 18 mDa HPAM polymer (not specified) in 2, 1 and 0% KCl brine. In three experiments the polymer concentration was 850 ppm. In another three experiments, the concentration/salinity were varied to achieve/match bulk viscosity of 10 mPas at s−1. In all six experiments, the RRF increased with flow rate.
On the other hand, some report that RRF is either constant with shear rate [38] or it decreases with shear rate [39,40,41]. However, the extent of post-flush may explain such observation. Ref. [40] reports less than 15 PV, whereas [38,39,41] seem to omit post-flush. They start measuring permeability directly after polymer flooding.
Some researchers used multiple flow rates of brine injection during permeability measurement after polymer flooding. They determined RRF by dividing pressure drop prior to polymer flooding by the pressure drop after at the same flow rate [20,38,41]. Because RRF is commonly accepted as a single average value, the phenomenon is not widely discussed or understood. Moreover, there is ambiguity regarding the procedure of determining RRF.
3.3.2. Determination of Permeability Reduction Under Non-Darcy Conditions
The typical method of determining RRF (Equation (5)) is either to compare the differential pressure to brine after polymer flood with that prior at a given flow rate or to compare the permeability post-polymer with that prior. The latter has the advantage of being based on several data points which are used to determine the slope of dP/dQ (Equation (1)). It is our opinion that single pressure point measurements should never be used to determine RRF. Single point measurements result in great uncertainty and, as in the case below, may generate wrong values. It is concerning that most polymer flooding articles do not report on the method of calculating kw after polymer flooding. Differential pressure as a function of injected flow rate for the polymer FP3630, and a close-up of the low flow rate region, are presented in Figure 8 and Figure 9, respectively. Calculated pressure correlations based on single-rate measurement (Q = 0.5 mL/min) and a linear correlation, i.e., based on brine permeability using Darcy’s equation (Equation (1)), are shown as dashed and solid lines, respectively. Neither pressure curve gives a good match of the measured data. The single-rate correlation underestimates pressure at high rates, whereas the linear correlation underestimates pressure at lower rates. The relative error introduced by assuming Darcy flow is largest at low pressure gradients, which corresponds to field-relevant reservoir flow velocities. This implies that Darcy-based RRF estimates may be most misleading, specifically under the conditions that core flood measurements are performed to describe reservoir-scale behavior. It is therefore necessary to address this issue.
Figure 8.
Rate-dependent permeability illustrated by measured differential pressure data for the FP3630 flood. Graph shows permeability defined from single point measurement and linear correlation.
Figure 9.
Close-up of the low flow rate region in Figure 8 showing how the three approaches lead to large differences in the estimated differential pressure.
This procedure assumes that the measured differential pressure is linearly proportional to the applied flow rate as determined from Darcy’s law (Equation (1)). Indeed, it is true for most porous media flooded at reservoir flow rates prior to polymer flooding. However, polymer flooding changes the porous media. The primary changes are a reduction in the pore diameter due to a layer of adsorbed polymer and a reduction in the accessible pore volume due to the plugging of smaller pore throats by polymer spherical coils. The two effects are illustrated in Figure 10 below. Here the adsorbed layer with a thickness εh effectively reduces the available flowing area so that the effective radius is Rp′ = Rp − εh. The adsorbed layer thickness is reported to be in the order of the hydrodynamic radius of the polymer, i.e., around 200 nm [5]. Although it may result in only a small reduction in the effective area of a larger pore throat, it may lead to the plugging of narrower pore throats with diameters in the order of 1 um. This again may render substantial areas inaccessible to flow downstream of such plugged pore throats. The impact of plugging can, in this instance, be more severe than the reduction in cross-sectional flow area. It should also be noted that a reduction in pore radius will increase the local shear rate. This may result in the local pore shear rate transcending the onset of elastic turbulence, resulting in an increase in polymer viscosity. These changes may alter the local flow field and restrict entrance to small pores, effectively changing the accessible pore volume to polymer [42]. This change is reversible with flow velocity and unlike permanent pore clogging.
Figure 10.
Schematic representation of polymer adsorbed layer in a pore throat (left) and plugged pore throats by polymer coils (right). Polymer is represented by orange as adsorbed layer (left) and flowing coiled particles (right). Brine is blue and rock is black.
Another implication of the adsorbed layer is the interaction between the flowing phase and the adsorbed polymer. In the capillary bundle approach, wall slip may occur near the rock surface as the pores are treated as pipes. If this occurred, the result could be a flattening of the viscosity front which may lead to a more plug-like flow. However, as the polymer adsorbs to the surface and the pores are highly irregular, zero concentration at the surface is unlikely to occur in the porous media [43]. Due to steric hinderances, a depleted layer effect has been proposed to occur in porous media, resulting in a wall slip effect at the intersection with the adsorbed polymer layer [5,44]. Far less described is the interaction between the adsorbed polymer layer and the flowing phase. Fang et al. [45] showed that the adsorbed layer increased the overall resistance to flow for polymer flowing near a surface and that the magnitude of the added resistance varied with the adsorbed layer thickness. Dupuis and Metidji [18] suggest elongation of the adsorbed polymer layer as the reason for rate-dependent RRF. They also suggest a model in which the interactions between flowing fluid and the stationary adsorbed layer are modeled into an effective concentration of the adsorbed layer, which contributes to the apparent viscosity, in line with the findings of Fang et al. [45].
Our interpretation is that the adsorbed polymer layer contributes to an increased apparent viscosity of the brine–polymer system, consistent with the findings of Fang et al. [45] and Dupuis and Metidji [18]. However, we attribute the observed rate dependency of RRF primarily to enhanced microscopic inertial effects arising from increased interaction between the flowing brine and the stationary adsorbed polymer layer, essentially the opposite result of the depleted layer effect. Inertial dissipation here refers to persistent pore-scale acceleration and flow reorganization rather than the onset of turbulence. No rate dependency is observed prior to polymer flooding at the same flow velocities, indicating that inertial contributions associated with pore geometry and tortuosity are negligible in the rock prior to polymer flood. The emergence of rate-dependent behavior after polymer flooding, therefore, reflects a change in boundary conditions, rather than a change in bulk flow regime.
The adsorbed polymer layer introduces an additional friction factor between flowing brine and stationary polymer, which leads to increased flow resistance compared with brine–rock interactions. Reduction in the effective pore radius and increase in tortuosity due to inaccessible pore volume lead to increased velocity gradients near the pore walls and in junctions, which can promote local accelerations and flow reorganization even at low Reynolds number. Although some studies suggest elongation or deformation of the adsorbed layer with flow rate, this mechanism cannot account for the magnitude of change in RRF as the adsorbed layer thickness, εh, becomes too large. Instead, the increased resistance to flow is interpreted as a manifestation of enhanced microscopic inertial dissipation, analogous to the increased inertial effects observed in porous media with higher tortuosity or more complex pore geometries [46,47].
The observed non-linear increase in differential pressure with brine flow rate (Figure 8 and Figure 9) indicates that permeability after polymer flooding cannot be described by Darcy’s law. Applying Darcy’s law under these conditions forces a linear approximation onto inherently non-linear data, leading to systematic errors in permeability and RRF estimation. To account for this behavior, an extension to Darcy’s law is required. Forchheimer derived an extension to Darcy’s equation in 1901 called the Forchheimer equation [48], which addresses these issues:
where dP is differential pressure, dx is length, α and β are experimentally derived parameters, ρ is the fluid density and u the flow velocity. Setting α = µ/k (viscosity/permeability) and β = 0 will return Darcy’s equation (Equation (1)). The Forchheimer equation was originally linked to high Reynolds number flow and provided an extension of Darcy’s law into non-linear flow. However, it has been recognized through experimental and theoretical work that inertia effects may also occur in flows at low Reynolds number and well below classical turbulence [22,49,50,51]. There seems to be agreement that the cause is microscopic inertial forces, but a debate remains about how it manifests on the macroscopic level and how these effects should be upscaled. Ruth and Ma suggested that permeability may be velocity-dependent and proposed and alternative form for the Forchheimer equation [47]:
and
The dimensionless Forchheimer number, Fo, describes the ratio of inertial to viscous forces. It allows inertial effects to be quantified at laminar flow, well below the pore-scale Reynold’s numbers associated with turbulence. Generally, the critical Fo has been set between 0.01 and 0.1 in the literature. The empirical Forchheimer coefficient β quantifies the deviation from Darcy flow and captures additional dissipation arising from pore-scale acceleration, flow reorganization, and fluid–solid interactions. Numerous correlations for β exist, reflecting its dependence on pore geometry, permeability, porosity, and tortuosity [46,49,50,51,52], all of which have the following general form:
where a is a constant, τ is tortuosity, k is inherent permeability, ϕ is porosity and ni are exponents. In many cases, such as Geertsma [46], tortuosity is omitted (nτ is zero), and nk is ½. In the present work, β is treated as an apparent parameter that characterizes the altered flow conditions created by polymer adsorption and retention, rather than a purely geometric property of the rock. In the next section, the Forchheimer approach will be compared with the standard approach in which non-linear flow is ignored.
3.3.3. Effect of Molecular Weight on RRF
The effect of the permeability-determination method on the residual resistance factor (RRF) was evaluated for core floods performed with polymers of molecular weight (Mw) 8, 12, and 18 MDa (FP3230, FP3430, and FP3630, respectively). RRF was calculated using three approaches:
- Single-rate estimation: RRF = dPw,e/dPw,i at a given flow rate, here Q = 0.5 mL/min.
- Darcy-based permeability from a linear fit over the full rate range, RRF = kw,i/kw,e.
- A non-Darcy approach in which dPw,e is calculated from the Ma–Ruth Forchheimer formulation (Equation (8)) where RRF = dPw,e(u)/dPw,i(u) and dPw,i is calculated from kw,i.
Permeability after polymer flood was obtained by a least-squares fit of the Forchheimer equation (Equation (8)) to the differential pressure data recorded over a flow rate interval of 0.1 to 10 mL/min (Table 5). Table 5 reports the fitted parameters, k = kw,e and β, together with the root mean square error (RMSE). To compare with published β correlations, the factor a in Equation (10) is calculated by applying the exponents from Ergun and Orning [52], (na = 1, nτ = 0, nk = 0.5, nϕ = 1.5). These exponents are selected because they are widely used and because tortuosity is not independently characterized in our experiments. Setting the tortuosity exponent to zero consolidates velocity-dependent factors related to effective length, fluid rock interactions, microporous inertia, etc. into the parameter a, while isolating the dependence of β on permeability and porosity.
Table 5.
Brine differential pressure measurement [mbar] and corresponding Forchheimer parameters after polymer flood for 3 core floods performed.
Residual resistance factors obtained by the three approaches—single-rate measurements, Darcy-based permeability, and the Forchheimer formulation—are presented in Figure 11. A strong correlation between RRF and polymer molecular weight is observed for the three methods. The highest-molecular weight polymer exhibits approximately twice the RRF of the lowest-Mw polymer. This trend may be explained by the larger hydrodynamic radius of higher-Mw polymers, which leads to a thicker adsorbed polymer layer and an increased probability of blocking narrow pore throats. The two effects in combination reduce the accessible pore volume to a greater extent than for lower-Mw polymers, resulting in higher permeability reduction.
Figure 11.
Residual resistance factor for polymers with Mw 8, 12, 18 MDa (FP3230, FP3430, FP3630) measured by single-rate measurement at Q = 0.5 mL/min (dotted line), Darcy-based permeability calculated from a range of rates (dashed line) and the non-Darcy-based permeability Forchheimer equation (solid line).
Darcy-based permeability determined from a linear fit systematically overestimates RRF for all three polymers (Figure 11), because it imposes a first-order pressure–rate relationship on data that exhibits non-linear behavior. Single-rate RRF estimates produce smaller errors at the selected reference condition, but when RRF is rate-dependent, agreement at a single rate is incidental and depends on the chosen reference velocity (here u = 0.63 m/day). At higher refence flow rates, the single-rate approach strongly underestimates RRF, which may have severe implications for near-well and fracture flow conditions. The Forchheimer number (Equation (8)) describes the ratio of inertial to viscous forces and a common interpretation is that Fo > 0.01 indicates a non-negligible inertial contribution. This corresponds to flow velocities of 0.32–0.37 m/day for the three polymer floods (Table 5) and suggests that inertial effects may be significant at typical reservoir flow rates (0.05–0.5 m/day).
Apparent viscosity, µapp, is calculated from Darcy’s equation (Equation (1)) by rearranging to solve for viscosity as a function of flow velocity, enabling comparison between bulk and in situ rheology. Application of the Forchheimer equation allows the post-polymer brine pressure response to be decomposed into a viscous (Darcy) contribution and a non-linear inertia contribution:
In the case of no significant non-Darcy flow, the β factor is zero and Equation (11) reduces to the conventional Darcy expression. For the core floods reported here, in which non-Darcy flow is significant, neglecting the non-Darcy contribution would result in significantly lower apparent viscosity, particularly at low velocities at which dP is underestimated. This may contribute to reports of in situ apparent viscosities that are lower than expected from bulk rheological measurements (see, e.g., [18]). Apparent viscosities for the three polymer floods in native state calculated using the non-Darcy approach are shown in Figure 12 along with those calculated using the Darcy approach.
Figure 12.
Apparent viscosity for polymers FP3230, FP3430 and FP3630 in native state calculated from non-Darcy (lines) and Darcy (dash–dot lines) approaches.
The two higher molecular weight polymers, FP3430 and FP3630, show similar behavior with a Newtonian plateau up to u ≈ 0.3 m/day, followed by a marked increase in apparent viscosity consistent with the onset of elastic turbulence. In contrast, the lowest molecular weight polymer, FP3230, exhibits shear thinning over the lower-velocity range and a delayed onset of elastic effects (≈2 m/day). This suggests that the permeability and pore size of this type of rock (~300 mD outcrop Berea sandstone) allows low-Mw polymer to pass through at reservoir flow rates with low degree of elastic turbulence, whereas the higher-Mw polymers are more constrained. This is supported by the observation that FP3430 and FP3630 exhibit higher apparent viscosity at high flow velocities. It is important to note that the solutions were formulated to match the same bulk viscosity of 10 mPas at 10 s−1 and this was achieved by adjusting the concentration. This is reflected in the resistance factor (RF) which was similar for all three polymers solutions at reservoir flow rates (see Figure 4). However, when the RRF contribution to RF is separated, i.e., when evaluating apparent viscosity, the low-Mw polymer shows significantly higher apparent viscosity than FP3430 and FP3630.
Figure 13 compares bulk and in situ viscosities using the effective shear rate equation (Equation (3)). Using a shift factor C = 6 does not align the two sets of curves. Alignment would require C ≈ 200, which is significantly greater than commonly reported values of C = 1–6 [26]. This highlights the limitations of the capillary bundle model in characterizing complex porous media flow from relatively simple bulk measurements, particularly in the case when post-polymer brine flow is non-Darcy. This topic has been elaborated by Berg and van Wunnik (2017) [12].
Figure 13.
Apparent or shear viscosity for the polymers FP3230, FP3430 and FP3630 as a function of effective shear rate.
It can be argued that the fundamental properties of the polymers extracted from bulk rheology are relevant for analyzing the flow properties in porous media. The zero-shear viscosity and relaxation time are calculated from the Carreau–Yashuda equation (Equation (6)) and represent the viscosity of the polymer solution at rest and the time scale of the polymer solution to alter conformation, respectively. The relaxation time is determined from the shear rate at which the behavior transforms from Newtonian to shear thinning. At higher shear rates, the fluid cannot fully relax after deformation and thus its viscosity decreases. Of the three polymers shown in Figure 13, FP3230 has the shortest relaxation time and FP3430 and FP3630 are similar (see Table 4). The polymers are matched to have the same shear viscosity at 10 s−1, and above this shear rate, the lower-Mw polymer FP3230 has higher viscosity than the higher-Mw polymers. This is the consequence of having a similar shear thinning slope, but shorter relaxation time, which offsets the difference in zero-shear viscosity. The effective shear rate range inferred for porous media flow therefore provides a plausible explanation for the higher in situ apparent viscosity of FP3230 relative to FP3430 and FP3630 in Figure 13.
The aforementioned rate-dependent permeability arises from microscopic inertial effects introduced by polymer–rock interactions. These effects are closely related to the onset of elastic turbulence observed during polymer flow. The connection can be examined using the Deborah number, which is a dimensionless group that characterizes the ratio of the characteristic time of the fluid to the characteristic time of the porous media:
The characteristic time of the fluid, θf, is often represented by the relaxation time determined from bulk rheology, λ (Equation (6)). Marshall and Metzner (1967) [53] derived a representation for the characteristic time of the porous media:
where Dp is the grain diameter, ϕ the porosity and u the average velocity. Combining this with the Kozeny–Carman equation (Equation (14) gives an expression for θp as a function of permeability:
and
The critical Deborah number, De*, which marks the onset of elastic turbulence, can be determined from the critical flow velocity, u*, since all other parameters are given. From Figure 12, u* ≈ 0.4 m/day for FP3630, yielding De* = 0.18 from Equation (16). This value is lower than the De* for bead packs of 0.5 [54], but within the range of De* = 0.1–1.0 suggested by Marshall and Metzner [53]. Reaching De* is a necessary but not sufficient criterion [55], and predictions of the onset of elastic turbulence from Deborah number alone are limited, as discussed in a review by Azad and Trivedi [56]. Nonetheless, for polymers of a similar type flowing in comparable porous media, the onset is reasonably captured by scaling with relaxation time, as illustrated in Figure 14.
Figure 14.
Predicted onset of elastic turbulence, i.e., critical Deborah number (vertical lines), and observed in situ rheograms (straight lines between measured points) for the polymers. For clarity, the polymers FP3230, FP3430 and FP3630 are shown in the top graph (a) and SAV10 and the pre-sheared polymers in the bottom graph (b).
3.3.4. Effect of Pre-Shearing on RRF
Pre-shearing is applied in laboratory studies primarily to replicate mechanical degradation occurring during injection, such as passage through chokes, well screens, and high-velocity near-wellbore flow. In field applications, pre-shearing may also be applied to mitigate elevated pressure at high injection rates. In this study, polymers were pre-sheared under conditions representative of topside and near-wellbore environments to evaluate how shear-induced reduction in elasticity influences in situ rheology in the tested rock formations.
Figure 15 shows the residual resistance factor (RRF) as a function of flow velocity for polymers in both native and pre-sheared states. All core floods exhibit non-Darcy behavior for brine flow after polymer flooding, and the Forchheimer equation is applied to determine RRF, as described in Section 3.3.3. Pre-shearing results in significantly lower RRF for all the polymers, with reductions by factors of 2.3, 1.3 and 2.0 for FP3230, FP3430 and FP3630, respectively, evaluated at u = 0.3 m/day.
Figure 15.
Residual resistance factor of pre-sheared (PS) and native polymer solutions.
Pre-shearing reduces polymer molecular weight and, consequently, the effective hydrodynamic radius. The observed reduction in RRF may therefore be attributed to a combination of thinner adsorbed polymer layers on pore walls and a reduced degree of pore blocking (straining). The β factor (Table A1, Appendix A), which indicates the non-Darcy contribution to resistance, is significantly lower for the pre-sheared solutions (with the exception of FP3430 PS, see below). This suggests a lower degree of interaction between brine and the adsorbed polymer layer, in agreement with an interpretation of a thinner adsorbed layer. Lower RRF for pre-sheared solutions is particularly relevant for applications with injectivity constraints where wellbore pressure must remain below fracturing pressure, or for water-alternating polymer (WAP) injection schemes.
For the pre-sheared solutions, FP3430 exhibits a higher RRF than FP3630, despite its lower molecular weight. A similar trend is observed for the resistance factor (RF) (Figure 5). The non-Darcy contribution, as measured by the β factor, shows a higher value for the pre-sheared than the native solution (see Table A1, Appendix A). This suggests that the pre-sheared FP3430 solution (FP3430 PS) deviates from the expected trend, as observed for the other native-state solutions and from FP320 PS and FP3630 PS. The reasons behind this are not clear but could indicate a higher degree of pore blocking, as this may have a disproportional effect in core floods with finite pore volume. Further experiments are required to investigate this.
Apparent viscosity for the pre-sheared and native-state polymers is shown in Figure 16. The most striking observation is that FP3230 PS exhibits a strongly shear thinning behavior similar to that in bulk flow over the whole range of flow rates without any sign of elastic turbulence. This implies that the porous media has little or no impact on the rheology of the polymer solution and can be rationalized by the pre-shearing and the low molecular weight of the polymer, leading to a very low degree of elasticity. This is in contrast to FP3430 PS and FP3630 PS that show clear onset of elastic turbulence at about 0.8 and 1.5 m/day, respectively. At lower rates, they exhibit near-Newtonian behavior. These observations suggest that the overall effect of the porous media is to dampen shear thinning behavior at lower flow rates and promote elastic behavior at higher flow rates. Pre-shearing the polymer increases the apparent viscosity at lower rates and reduces the degree of elastic turbulence.
Figure 16.
Apparent viscosity of pre-sheared and native polymer solutions.
3.3.5. Effect of Polymer Chemistry on RRF
The SAV10 polymer was included in this study because it exhibits significantly higher tolerance to salinity and temperature compared to the HPAM series FP3X30 and is therefore frequently considered in EOR screening processes, particularly for harsh reservoir conditions. The main disadvantages of SAV10 relative to HPAM are lower viscosity yield and higher cost. In our study, FP3230 was selected as a reference to SAV10 for comparison because of the similar molecular weight, the main difference being the ATBS side groups of SAV10.
As shown in Figure 6, SAV10 has a resistance factor (RF) comparable to FP3430 and FP3630. In contrast, the residual resistance factor (RRF) is lower than for all the FP3X30 polymers, as seen in Table A1 (Appendix A). From the perspective of molecular weight only, the SAV10 polymer exhibits higher RF values and lower RRF values than the comparable FP3230. This is interesting, as both features are attractive for field application and polymer performance. Although the reasons for this difference in behavior cannot directly be deduced from the core flood experiments, it is known from the literature that the adsorption of ATBS polymers (like SAV10) is lower than for HPAM polymers in Berea outcrop cores and sandpacks [57,58,59]. Atomic Force Microscopy show that this is due to larger steric repulsion and reduced electrostatic interaction for ATBS compared to HPAM [60].
The apparent viscosity is higher for SAV10 than for all the FP3X30 polymers, as shown in Figure 17. This observation is consistent with the expansion of the polymer due to the hydration of the sulfonate groups, leading to higher viscosity. In comparison to HPAM, the combination of relatively high apparent viscosity and comparatively low RRF suggests that SAV10 achieves mobility control through bulk rheological effects rather than through permeability reduction.
Figure 17.
Apparent viscosity of SAV10 and the other native polymer solutions.
4. Conclusions
Polymer flooding is a mature enhanced oil recovery (EOR) method that has been implemented world-wide. However, the flow properties of polymer in the porous media are still not well-described. One important aspect in field-scale polymer flooding design is the permeability reduction that occurs because of polymer retention and adsorption in reservoir rock. This study demonstrates that, in some cases, permeability reduction following polymer flooding cannot be adequately described using conventional Darcy-based approaches because of rate-dependent behavior.
Rate-dependent permeability is often ignored or neglected in the literature. Here we show that applying Darcy’s law to determine post-polymer permeability under non-Darcy conditions leads to systematic overestimation of RRF. This may in part explain numerous literature reports of high RRF values. Application of the Forchheimer equation to describe differential pressure allows for a more correct description of the observed behavior, resulting in a rate-dependent RRF. The rate dependence is interpreted as enhanced microscopic inertial dissipation arising from interaction between the flowing brine and the stationary adsorbed polymer layer, rather than from changes in adsorbed layer thickness or the onset of classical turbulence. The corresponding Forchheimer number indicates that inertial contributions become significant at flow velocities well within typical reservoir conditions (Fo ≈ 0.01 at ~0.3–0.4 m/day).
In situ rheology analysis, based on the non-Darcy approach, shows that apparent viscosity is higher than that of the Darcy approach and closer to the injected viscosity. Rheology derived from porous media flow deviates markedly from bulk rheometer predictions, and effective shear rate models fail to reconcile the two using realistic shift factors. However, scaling with relaxation time through the Deborah number provides a reasonable estimate of the onset of elastic turbulence for polymers of similar chemistry and porous media characteristics.
Core flood experiments performed with HPAM polymers of varying molecular weight, but the same bulk viscosities, revealed a clear proportional relationship between residual resistance factor (RRF) and molecular weight. This suggests that permeability reduction is governed by polymer size when brine composition and rock type is kept constant. Mechanical pre-shearing significantly reduces RRF by lowering effective molecular weight and elasticity, thereby decreasing adsorbed layer thickness and pore blocking. In most cases, pre-shearing also reduces the non-Darcy contribution quantified by the β parameter. This suggests that unsheared laboratory experiments may overestimate reservoir permeability reduction and injectivity constraints as the polymer will always experience some degree of shear degradation during injection in the field. Comparison with the ATBS polymer SAV10 demonstrates that the ATBS polymer exhibits higher resistance factor (RF) and lower RRF at similar molecular weight, making it an interesting candidate for sea water brine conditions.
The study further highlights the importance of experimental methodology. The volume of post-polymer brine flushing strongly influences measured RRF, and insufficient flushing may lead to severe overestimation. Higher-molecular weight polymers may require larger post-flush volumes to approach stable permeability conditions. These findings support the need for tapering and extended brine injection when determining representative RRF values. The complications that follow non-Darcy flow and insufficient brine flush warrant a more detailed description of the conditions at which RRF has been determined in the literature reports of core flood experiments.
This study provides new insight into the interpretation of polymer core flood experiments and emphasizes the necessity of non-Darcy analysis when rate-dependent permeability is observed. Incorporating these considerations into laboratory practice and reservoir simulation may reduce the risk of overestimating permeability reduction and improve polymer flood design.
Author Contributions
Conceptualization, T.S. and A.S.; methodology, A.M., A.S. and T.S.; laboratory work, A.M.; formal analysis, A.M., A.S. and T.S.; writing, A.M., A.S. and T.S. All authors have read and agreed to the published version of the manuscript.
Funding
This research received no external funding.
Data Availability Statement
The data presented in this study are available on request from the corresponding author due to legal reasons.
Conflicts of Interest
Authors Arne Skauge and Tormod Skauge were employed by Energy Research Norway. The remaining author declares that the research was conducted in the absence of any commercial or financial relationships that could be construed as a potential conflict of interest.
Abbreviations
The following abbreviations are used in this manuscript:
| ATBS | Acrylamido Tertiary Butyl Sulfonate |
| EOR | Enhanced Oil Recovery |
| FP | Flopaam |
| HPAM | Hydrolyzed Polyacrylamide |
| IPV | Inaccessible Pore Volume |
| PS | Pre-sheared |
| PV | Pore Volume |
| RMSE | Root Mean Square Error |
| SSW | Synthetic Sea Water |
Appendix A
Table A1.
Brine differential pressure measurement [mbar] and corresponding Forchheimer parameters after polymer flood for the 7 core floods performed.
Table A2.
Resistance factor (RF) as a function of flow velocity for the 7 core floods performed.
Table A3.
Apparent viscosity (µapp, mPas) as a function of flow velocity for the 7 core floods performed calculated by applying the Forchheimer equation (Equation (8)).
References
- Lake, L.; Johns, R.T.; Rossen, W.R.; Pope, G.A. Fundamentals of Enhanced Oil Recovery; Society of Petroleum Engineers: Richardson, TX, USA, 2014. [Google Scholar]
- Skauge, A.; Ormehaug, P.A.; Gurholt, T.; Vik, B.; Bondino, I.; Hamon, G. 2-D Visualisation of Unstable Waterflood and Polymer Flood for Displacement of Heavy Oil. In Proceedings of the SPE Improved Oil Recovery Symposium, Tulsa, OK, USA, 14–18 April 2012. [Google Scholar] [CrossRef] [Scilit]
- Delamaide, E. Selecting Injected Viscosity in Polymer Flood Projects: A Controversial and Critical Question. In Proceedings of the ADIPEC, Abu Dhabi, United Arab Emirates, 4–7 November 2014. [Google Scholar] [CrossRef] [Scilit]
- Beteta, A.; Sorbie, K.; Skauge, A.; Skauge, T. Viscous Crossflow as the Mechanism for Polymer Enhanced Oil Recovery in Viscous Oils: Evidence of Crossflow between Bypassed Oil and Viscous Fingers. Geoenergy Sci. Eng. 2025, 253, 213968. [Google Scholar] [CrossRef] [Scilit]
- Sorbie, K.S. Polymer-Improved Oil Recovery; Springer: Dordrecht, The Netherlands, 1991. [Google Scholar]
- Zamani, N.; Bondino, I.; Kaufmann, R.; Skauge, A. Effect of Porous Media Properties on the Onset of Polymer Extensional Viscosity. J. Pet. Sci. Eng. 2015, 133, 483–495. [Google Scholar] [CrossRef] [Scilit]
- Li, W.; Liao, J. Microscopic Analysis of Flow Resistance of Oil Displacement Fluid in Reservoir Fractures. Reserv. Sci. 2026, 2, 16–33. [Google Scholar] [CrossRef] [Scilit]
- Howe, A.M.; Clarke, A.; Giernalczyk, D. Flow of Concentrated Viscoelastic Polymer Solutions in Porous Media: Effect of MW and Concentration on Elastic Turbulence Onset in Various Geometries. Soft Matter 2015, 11, 6419–6431. [Google Scholar] [CrossRef] [Scilit]
- Skauge, A.; Zamani, N.; Gausdal Jacobsen, J.; Shaker Shiran, B.; Al-Shakry, B.; Skauge, T. Polymer Flow in Porous Media: Relevance to Enhanced Oil Recovery. Colloids Interfaces 2018, 2, 27. [Google Scholar] [CrossRef] [Scilit]
- Chauveteau, G. Fundamental Criteria in Polymer Flow Through Porous Media. In Water-Soluble Polymers; Advances in Chemistry; American Chemical Society: Washington, DC, USA, 1986; Volume 213, pp. 227–267. [Google Scholar]
- Jouenne, S. Polymer Flooding in High Temperature, High Salinity Conditions: Selection of Polymer Type and Polymer Chemistry, Thermal Stability. J. Pet. Sci. Eng. 2020, 195, 107545. [Google Scholar] [CrossRef] [Scilit]
- Berg, S.; Van Wunnik, J. Shear Rate Determination from Pore-Scale Flow Fields. Transp. Porous Media 2017, 117, 229–246. [Google Scholar] [CrossRef] [Scilit]
- Al-Shakry, B.; Skauge, T.; Shaker Shiran, B.; Skauge, A. Polymer Injectivity: Investigation of Mechanical Degradation of Enhanced Oil Recovery Polymers Using In-Situ Rheology. Energies 2018, 12, 49. [Google Scholar] [CrossRef] [Scilit]
- Glasbergen, G.; Wever, D.; Keijzer, E.; Farajzadeh, R. Injectivity Loss in Polymer Floods: Causes, Preventions and Mitigations. In Proceedings of the SPE Kuwait Oil and Gas Show and Conference, Mishref, Kuwait, 11–14 October 2015. [Google Scholar] [CrossRef] [Scilit]
- Smith, F.W. The Behavior of Partially Hydrolyzed Polyacrylamide Solutions in Porous Media. J. Pet. Technol. 1970, 22, 148–156. [Google Scholar] [CrossRef] [Scilit]
- Chauveteau, G. Molecular Interpretation of Several Different Properties of Flow of Coiled Polymer Solutions Through Porous Media in Oil Recovery Conditions. In Proceedings of the SPE Annual Technical Conference and Exhibition, San Antonio, TX, USA, 4–7 October 1981. [Google Scholar] [CrossRef]
- Chauveteau, G.; Denys, K.; Zaitoun, A. New Insight on Polymer Adsorption Under High Flow Rates. In Proceedings of the SPE/DOE Improved Oil Recovery Symposium, Tulsa, OK, USA, 13–17 April 2002. [Google Scholar] [CrossRef]
- Dupuis, G.; Metidji, M.O. Better Understanding of Polymer Behaviour in Porous Media Allowing Reducing OPEX of EOR Projects; European Association of Geoscientists & Engineers: Utrecht, The Netherlands, 2023; Volume 2023, pp. 1–22. [Google Scholar]
- Zaitoun, A.; Kohler, N. Two-Phase Flow Through Porous Media: Effect of an Adsorbed Polymer Layer. In Proceedings of the SPE Annual Technical Conference and Exhibition, Houston, TX, USA, 2–5 October 1988. [Google Scholar] [CrossRef]
- Mansour, A.M.; Al-Maamari, R.S.; Al-Hashmi, A.S.; Zaitoun, A.; Al-Sharji, H. In-Situ Rheology and Mechanical Degradation of EOR Polyacrylamide Solutions Under Moderate Shear Rates. J. Pet. Sci. Eng. 2014, 115, 57–65. [Google Scholar] [CrossRef] [Scilit]
- Idahosa, P.E.G.; Oluyemi, G.F.; Oyeneyin, M.B.; Prabhu, R. Rate-Dependent Polymer Adsorption in Porous Media. J. Pet. Sci. Eng. 2016, 143, 65–71. [Google Scholar] [CrossRef] [Scilit]
- Ma, H.; Ruth, D. Physical Explanations of Non-Darcy Effects for Fluid Flow in Porous Media. SPE Form. Eval. 1997, 12, 13–18. [Google Scholar] [CrossRef] [Scilit]
- Sebastian, A.; Mushtaq, M.; Al-Shalabi, E.W.; AlAmeri, W.; Mohanty, K.; Masalmeh, S.; AlSumaiti, A.M. Investigating the Effects of Make-Up Water Dilution and Oil Presence on Polymer Retention in Carbonate Reservoirs. Sci. Rep. 2024, 14, 27924. [Google Scholar] [CrossRef] [Scilit]
- American Petroleum Institute. Recommended Practices for Evaluation of Polymers Used in Enhanced Oil Recovery Operations; API RP 63; American Petroleum Institute: Washington, DC, USA, 1990. [Google Scholar]
- Churcher, P.L.; French, P.R.; Shaw, J.C.; Schramm, L.L. Rock Properties of Berea Sandstone, Baker Dolomite, and Indiana Limestone. In Proceedings of the SPE International Symposium on Oilfield Chemistry, Anaheim, CA, USA, 20–22 February 1991. [Google Scholar] [CrossRef]
- Cannella, W.J.; Huh, C.; Seright, R.S. Prediction of Xanthan Rheology in Porous Media. In Proceedings of the SPE Annual Technical Conference and Exhibition, Houston, TX, USA, 2–5 October 1988. [Google Scholar] [CrossRef]
- Seright, R.S.; Jouenne, S.; Aften, C. Effect of Salinity and Hardness on Hydrolyzed Polyacrylamide Rheology in Sandstone. SPE J. 2025, 30, 4908–4926. [Google Scholar] [CrossRef] [Scilit]
- Dean, R.M.; Britton, C.J.; Driver, J.W.; Pope, G.A. State-of-the-Art Laboratory Methods for Chemical EOR. In Proceedings of the SPE Improved Oil Recovery Conference, Virtual, 25–29 April 2022. [Google Scholar] [CrossRef] [Scilit]
- Sagyndikov, M.; Dupuis, G.; Seright, R.; Thomas, A.; Wilton, R. Revisiting Water Injection Post-Polymer Flooding: A Global Perspective on Project Performance. In Proceedings of the IOR+ 2025—23rd European Symposium on IOR, Edinburgh, Scotland, UK, 2–4 April 2025; European Association of Geoscientists & Engineers: Utrecht, The Netherlands, 2025; pp. 1–25. [Google Scholar]
- Thomas, A. Polymer Flooding. In Essentials of Polymer Flooding Technique; John Wiley & Sons, Ltd.: Hoboken, NJ, USA, 2019; pp. 64–88. [Google Scholar]
- Seright, R.S. How Much Polymer Should Be Injected During a Polymer Flood? Review of Previous and Current Practices. SPE J. 2017, 22, 1–18. [Google Scholar] [CrossRef] [Scilit]
- Skauge, T.; Kvilhaug, O.A.; Skauge, A. Influence of Polymer Structural Conformation and Phase Behaviour on In-Situ Viscosity. In Proceedings of the IOR 2015-18th European Symposium on Improved Oil Recovery, Dresden, Germany, 14–16 April 2015. [Google Scholar]
- Rock, A.; Hincapie, R.E.; Tahir, M.; Langanke, N.; Ganzer, L. On the Role of Polymer Viscoelasticity in Enhanced Oil Recovery: Extensive Laboratory Data and Review. Polymers 2020, 12, 2276. [Google Scholar] [CrossRef] [Scilit]
- Zeynalli, M.; Mushtaq, M.; Al-Shalabi, E.W.; Alfazazi, U.; Hassan, A.M.; AlAmeri, W. A Comprehensive Review of Viscoelastic Polymer Flooding in Sandstone and Carbonate Rocks. Sci. Rep. 2023, 13, 17679. [Google Scholar] [CrossRef] [Scilit]
- Azad, M.S.; Seright, R.S. Are Field Polymer Enhanced Oil Recovery Projects Reaping the Benefits of Residual Oil Saturation Reduction Due to Polymer Viscoelasticity? SPE J. 2025, 30, 3792–3809. [Google Scholar] [CrossRef] [Scilit]
- Sugar, A.; Serag, M.; Buttner, U.; Habuchi, S.; Hoteit, H. A Single-Molecule Study on Polymer Fluid Dynamics in Porous Media. Lab Chip 2023, 23, 4104–4116. [Google Scholar] [CrossRef] [Scilit] [PubMed]
- Zaitoun, A.; Chauveteau, G. Effect of Pore Structure and Residual Oil on Polymer Bridging Adsorption. In Proceedings of the SPE/DOE Improved Oil Recovery Symposium, Tulsa, OK, USA, 19–22 April 1998. [Google Scholar] [CrossRef]
- Alfazazi, U.; Thomas, N.C.; AlAmeri, W.; Al-Shalabi, E.W.; Shaik, A.R. An Experimental Investigation of Polymer Performance in Harsh Carbonate Reservoir Conditions. In Proceedings of the SPE Gas & Oil Technology Showcase and Conference, Dubai, United Arab Emirates, 21 October 2019. [Google Scholar] [CrossRef] [Scilit]
- Han, M.; Zhou, X.; Alhasan, F.B.; Zahrani, B.; AlSofi, A.M. Laboratory Investigation of the Injectivity of Sulfonated Polymer Solutions into Carbonate Reservoir Rocks. In Proceedings of the SPE EOR Conference at Oil and Gas West Asia, Muscat, Oman, 16–18 April 2012. [Google Scholar] [CrossRef] [Scilit]
- AlSofi, A.M.; Wang, J.; Kaidar, Z.F. SmartWater Synergy with Chemical EOR: Effects on Polymer Injectivity, Retention and Acceleration. J. Pet. Sci. Eng. 2018, 166, 274–282. [Google Scholar] [CrossRef] [Scilit]
- Alfazazi, U.; Thomas, N.C.; Alameri, W.; Al-Shalabi, E.W. Experimental Investigation of Polymer Injectivity and Retention under Harsh Carbonate Reservoir Conditions. J. Pet. Sci. Eng. 2020, 192, 107262. [Google Scholar] [CrossRef] [Scilit]
- Jones, D.M.; Walters, K. The Behaviour of Polymer Solutions in Extension-Dominated Flows, with Applications to Enhanced Oil Recovery. Rheol. Acta 1989, 28, 482–498. [Google Scholar] [CrossRef] [Scilit]
- Seright, R.S.; Wang, D. Polymer Flooding: Current Status and Future Directions. Pet. Sci. 2023, 20, 910–921. [Google Scholar] [CrossRef] [Scilit]
- De Gennes, P.G. Polymer Solutions near an Interface. Adsorption and Depletion Layers. Macromolecules 1981, 14, 1637–1644. [Google Scholar] [CrossRef] [Scilit]
- Fang, J.; Zhu, T.; Sheng, J.; Jiang, Z.; Ma, Y. Thickness Dependent Effective Viscosity of a Polymer Solution near an Interface Probed by a Quartz Crystal Microbalance with Dissipation Method. Sci. Rep. 2015, 5, 8491. [Google Scholar] [CrossRef] [Scilit] [PubMed]
- Geertsma, J. Estimating the Coefficient of Inertial Resistance in Fluid Flow Through Porous Media. SPE J. 1974, 14, 445–450. [Google Scholar] [CrossRef] [Scilit]
- Ruth, D.; Ma, H. On the Derivation of the Forchheimer Equation by Means of the Averaging Theorem. Transp. Porous Media 1992, 7, 255–264. [Google Scholar] [CrossRef] [Scilit]
- Forchheimer, P. Wasserbewegung Durch Boden. Z. Des Vereines Dtsch. Ingenieure 1901, 45, 1731. [Google Scholar]
- Muljadi, B.P.; Blunt, M.J.; Raeini, A.Q.; Bijeljic, B. The Impact of Porous Media Heterogeneity on Non-Darcy Flow Behaviour from Pore-Scale Simulation. Adv. Water Resour. 2016, 95, 329–340. [Google Scholar] [CrossRef] [Scilit]
- Thauvin, F.; Mohanty, K.K. Network Modeling of Non-Darcy Flow Through Porous Media. Transp. Porous Media 1998, 31, 19–37. [Google Scholar] [CrossRef] [Scilit]
- Elsanoose, A.; Abobaker, E.; Khan, F.; Rahman, M.A.; Aborig, A.; Butt, S.D. Characterization of a Non-Darcy Flow and Development of New Correlation of NON-Darcy Coefficient. Energies 2022, 15, 7616. [Google Scholar] [CrossRef] [Scilit]
- Ergun, S.; Orning, A.A. Fluid Flow through Randomly Packed Columns and Fluidized Beds. Ind. Eng. Chem. 1949, 41, 1179–1184. [Google Scholar] [CrossRef] [Scilit]
- Marshall, R.J.; Metzner, A.B. Flow of Viscoelastic Fluids through Porous Media. Ind. Eng. Chem. Fund. 1967, 6, 393–400. [Google Scholar] [CrossRef] [Scilit]
- Durst, F.; Haas, R.; Interthal, W. The Nature of Flows Through Porous Media. J. Non-Newton. Fluid Mech. 1987, 22, 169–189. [Google Scholar] [CrossRef] [Scilit]
- Heemskerk, J.; Janssen-van Rosmalen, R.; Holtslag, R.J.; Teeuw, D. Quantification of Viscoelastic Effects of Polyacrylamide Solutions. In Proceedings of the SPE Enhanced Oil Recovery Symposium, Tulsa, OK, USA, 15–18 April 1984. [Google Scholar] [CrossRef]
- Azad, M.S.; Trivedi, J.J. Quantification of the Viscoelastic Effects During Polymer Flooding: A Critical Review. SPE J. 2019, 24, 2731–2757. [Google Scholar] [CrossRef] [Scilit]
- Rashidi, M.; Sandvik, S.; Blokhus, A.M.; Skauge, A. Static and Dynamic Adsorption of Salt Tolerant Polymers. In Proceedings of the IOR 2009—15th European Symposium on Improved Oil Recovery, Apr 2009; European Association of Geoscientists & Engineers: Utrecht, The Netherlands, 2009; p. cp-124. [Google Scholar]
- Rashidi, M.; Blokhus, A.M.; Skauge, A. Viscosity and Retention of Sulfonated Polyacrylamide Polymers at High Temperature. J. Appl. Polym. Sci. 2011, 119, 3623–3629. [Google Scholar] [CrossRef] [Scilit]
- Seright, R.S.; Wang, D. Impact of Salinity, Hardness, Lithology, and ATBS Content on HPAM Polymer Retention for the Milne Point Polymer Flood. In Proceedings of the SPE Western Regional Meeting, Anchorage, AK, USA, 22–25 May 2023. [Google Scholar] [CrossRef] [Scilit]
- Lew, J.H.; Hue, K.Y.; Matar, O.K.; Müller, E.A.; Luckham, P.F.; Santos, A.S.; Myo Thant, M.M. Atomic Force Microscopy and Molecular Dynamic Simulation of Adsorption of Polyacrylamide with Different Chemistries onto Calcium Carbonate. Polymers 2024, 16, 494. [Google Scholar] [CrossRef] [Scilit] [PubMed]
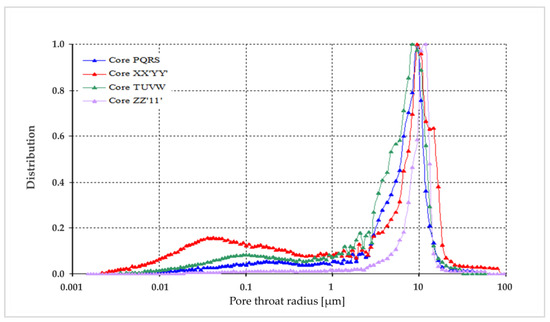
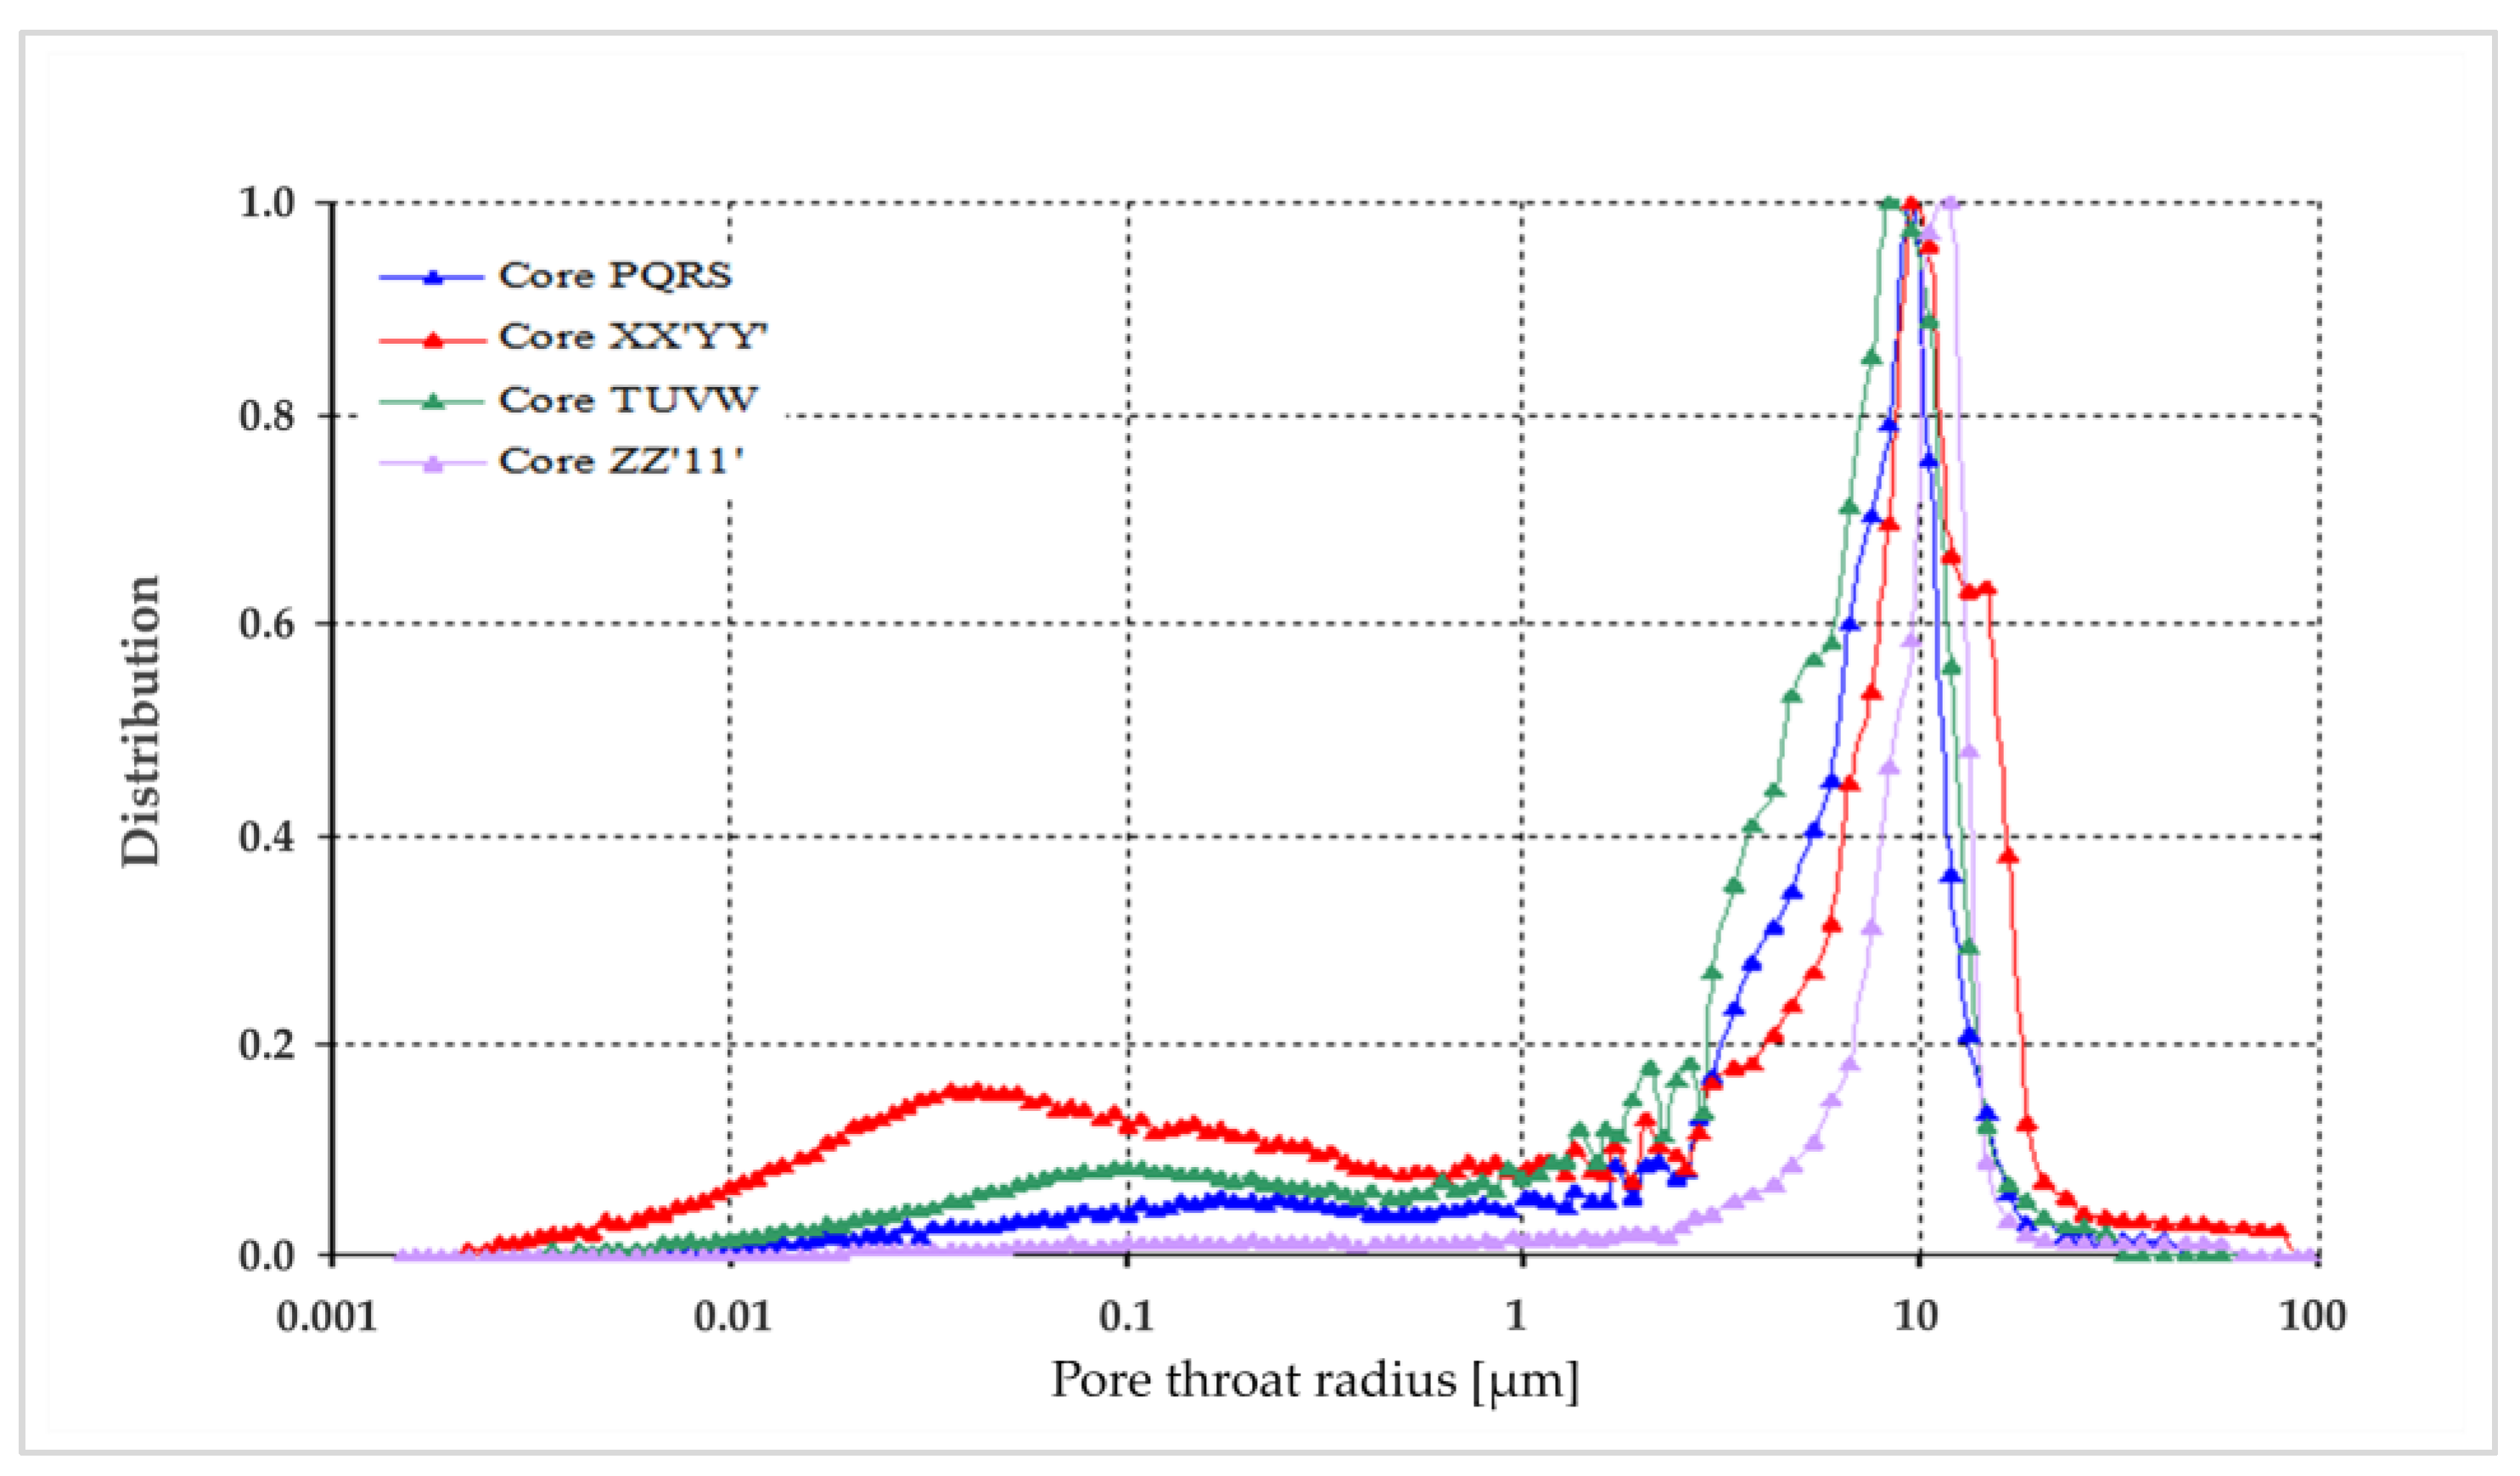
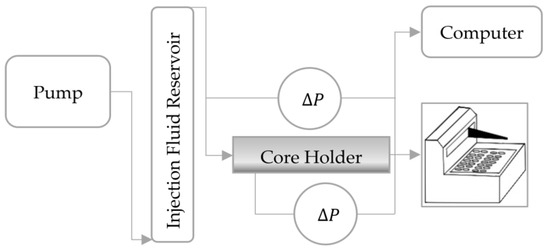
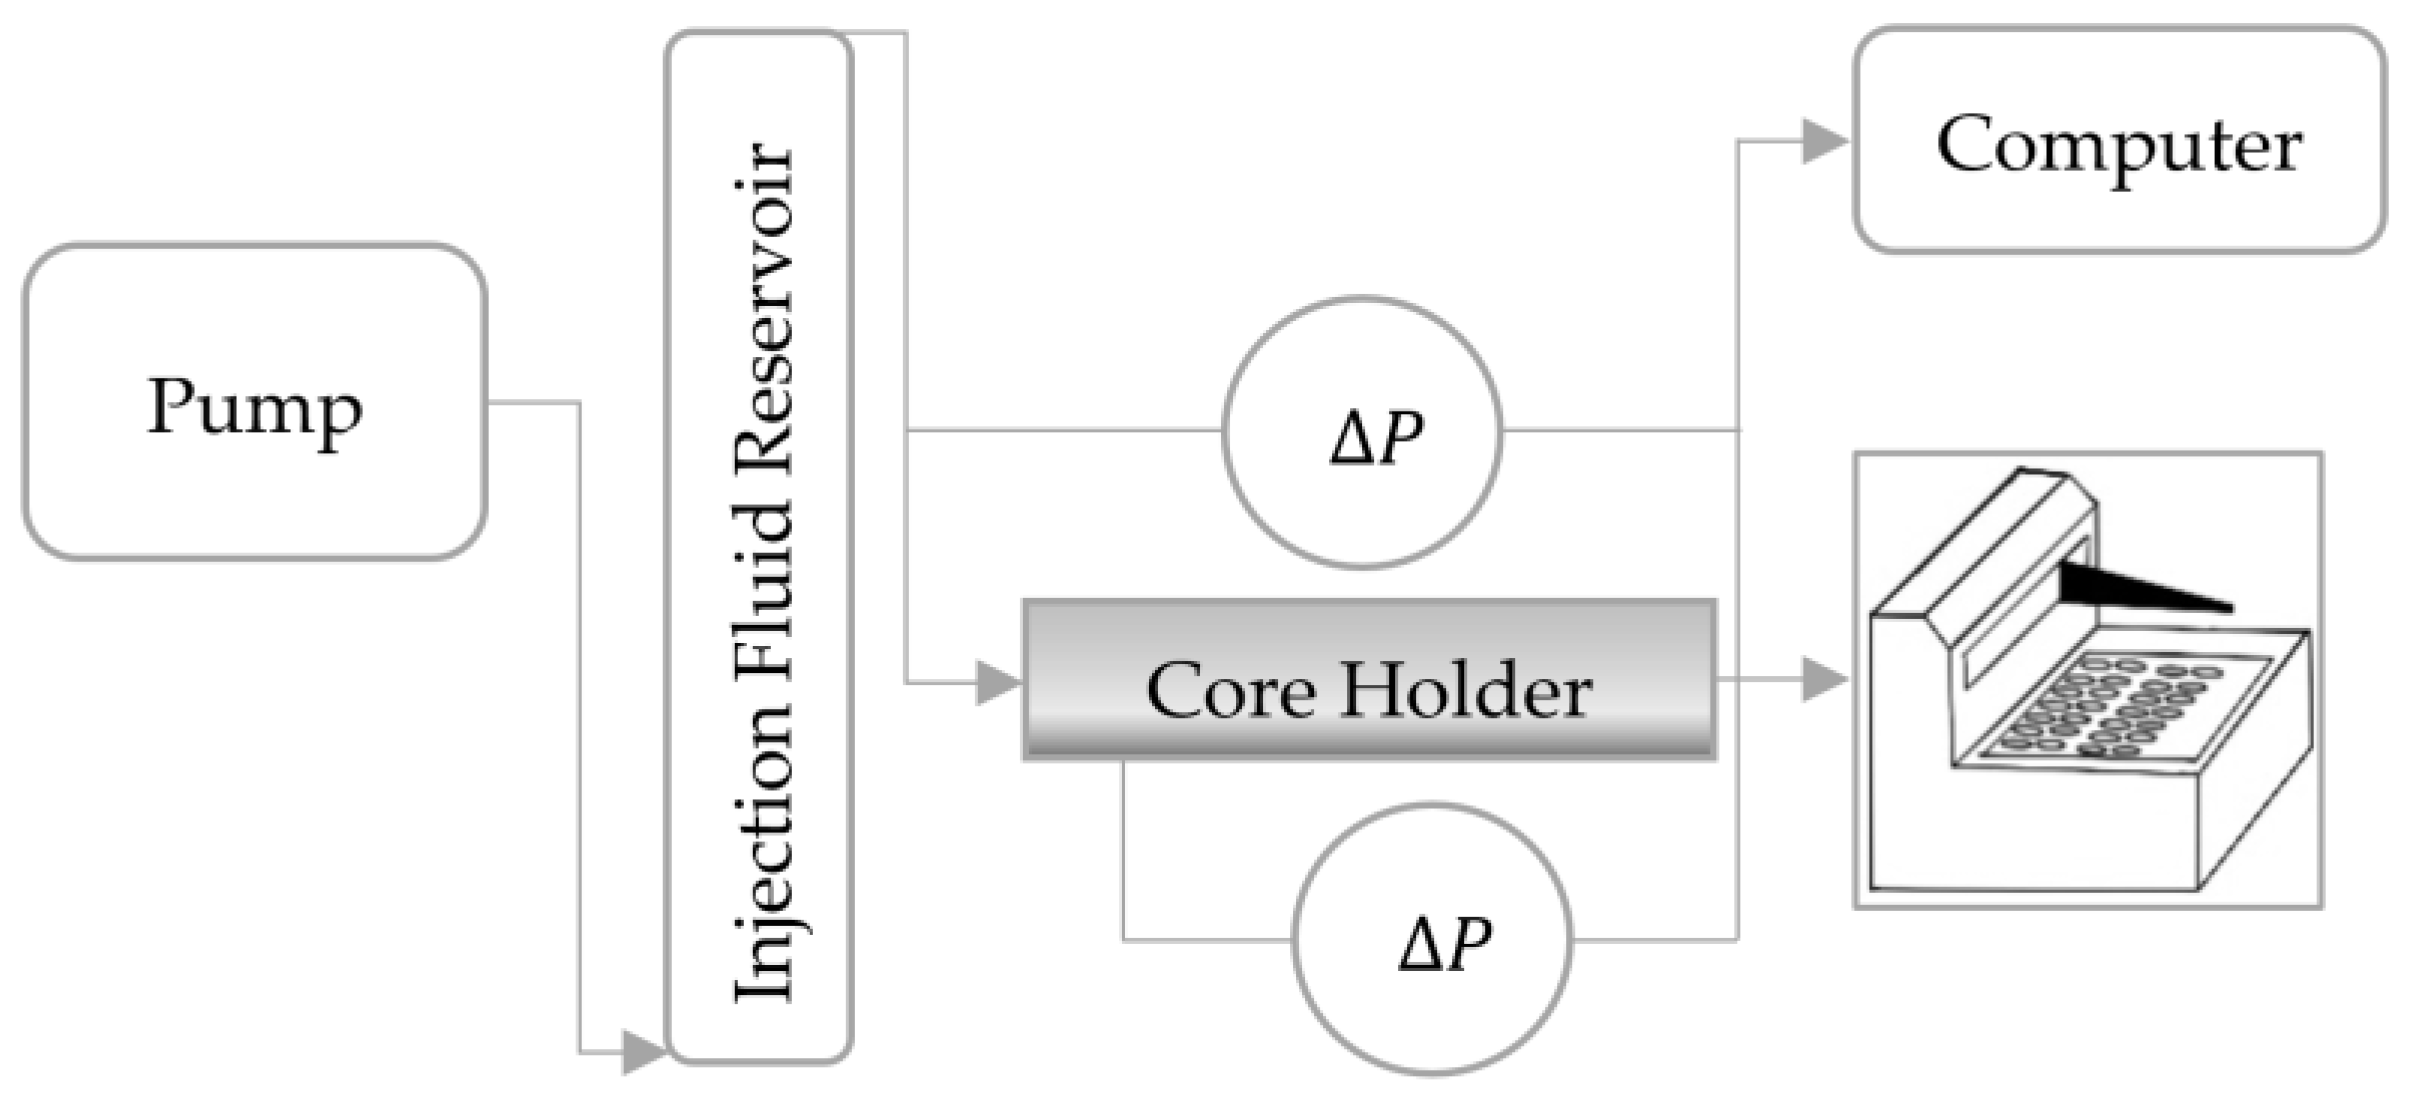
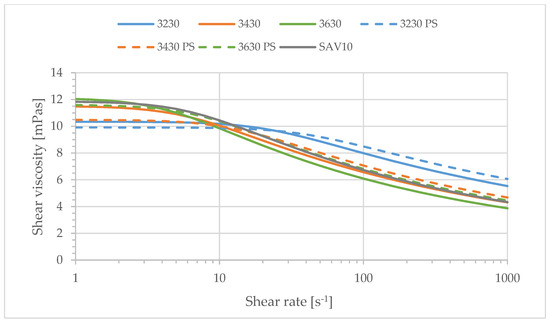
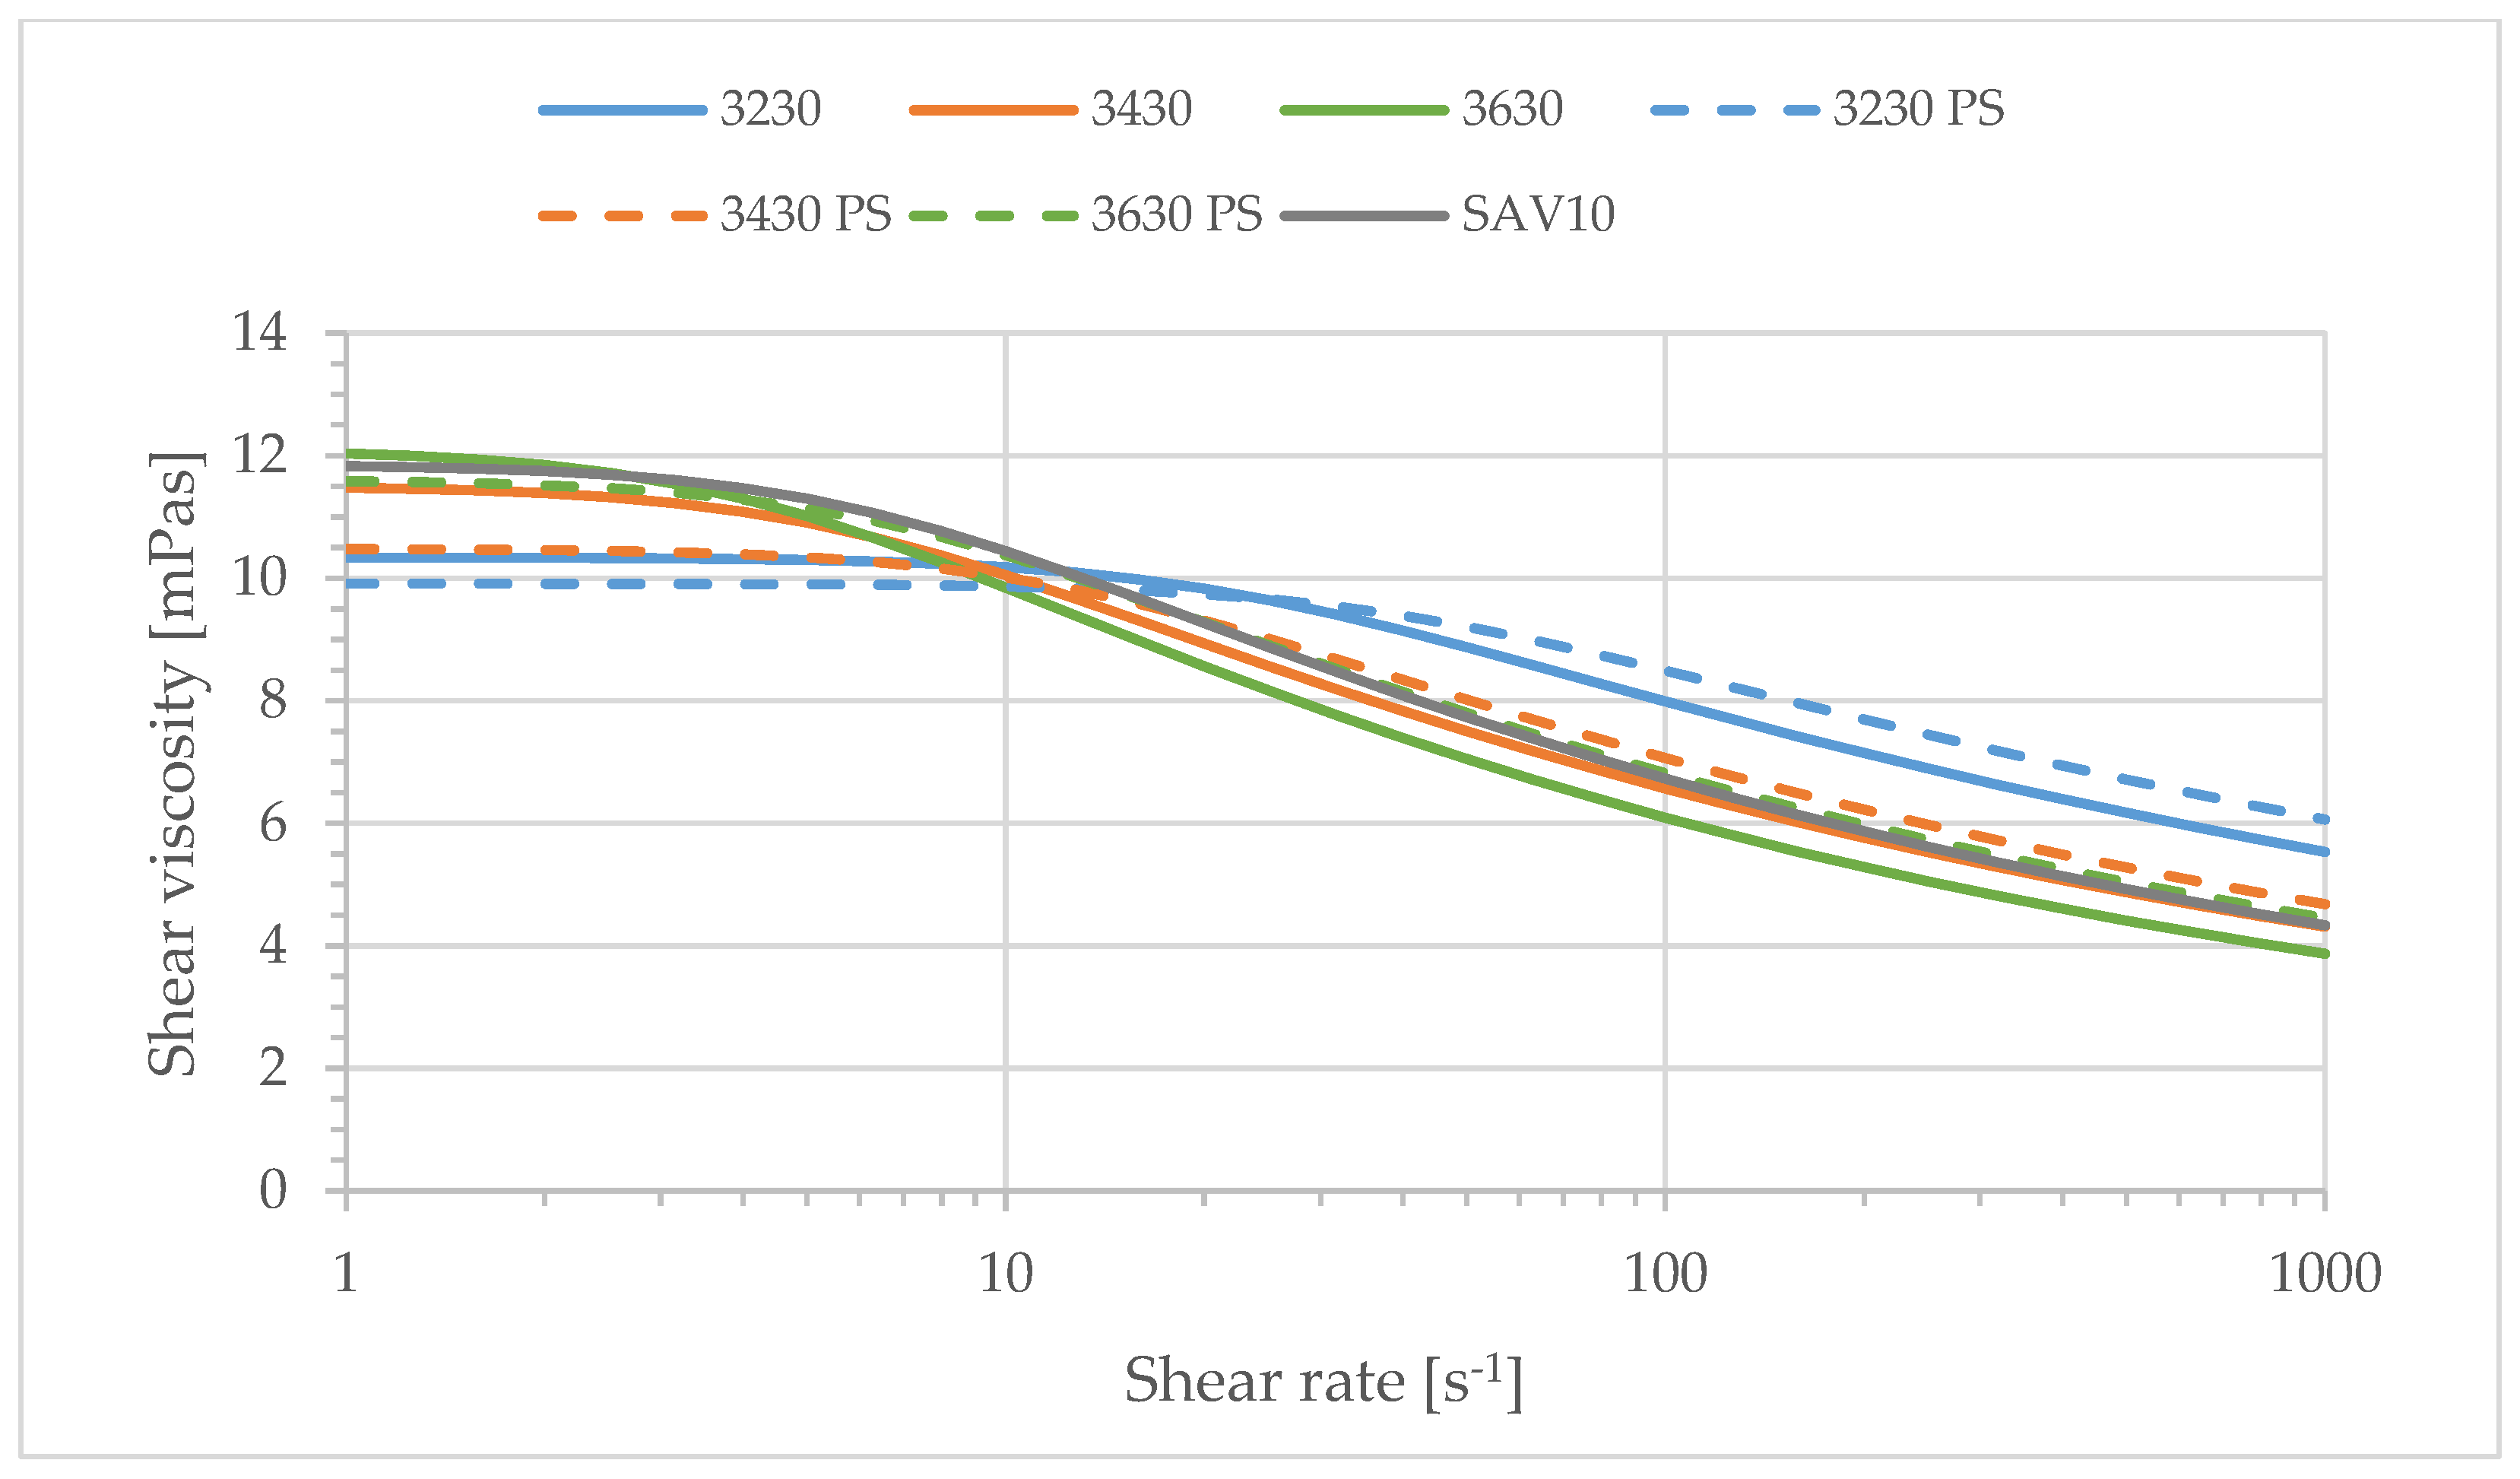
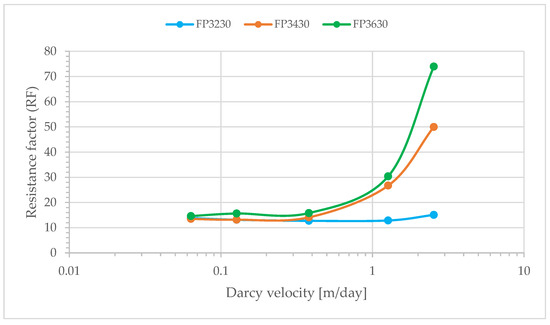
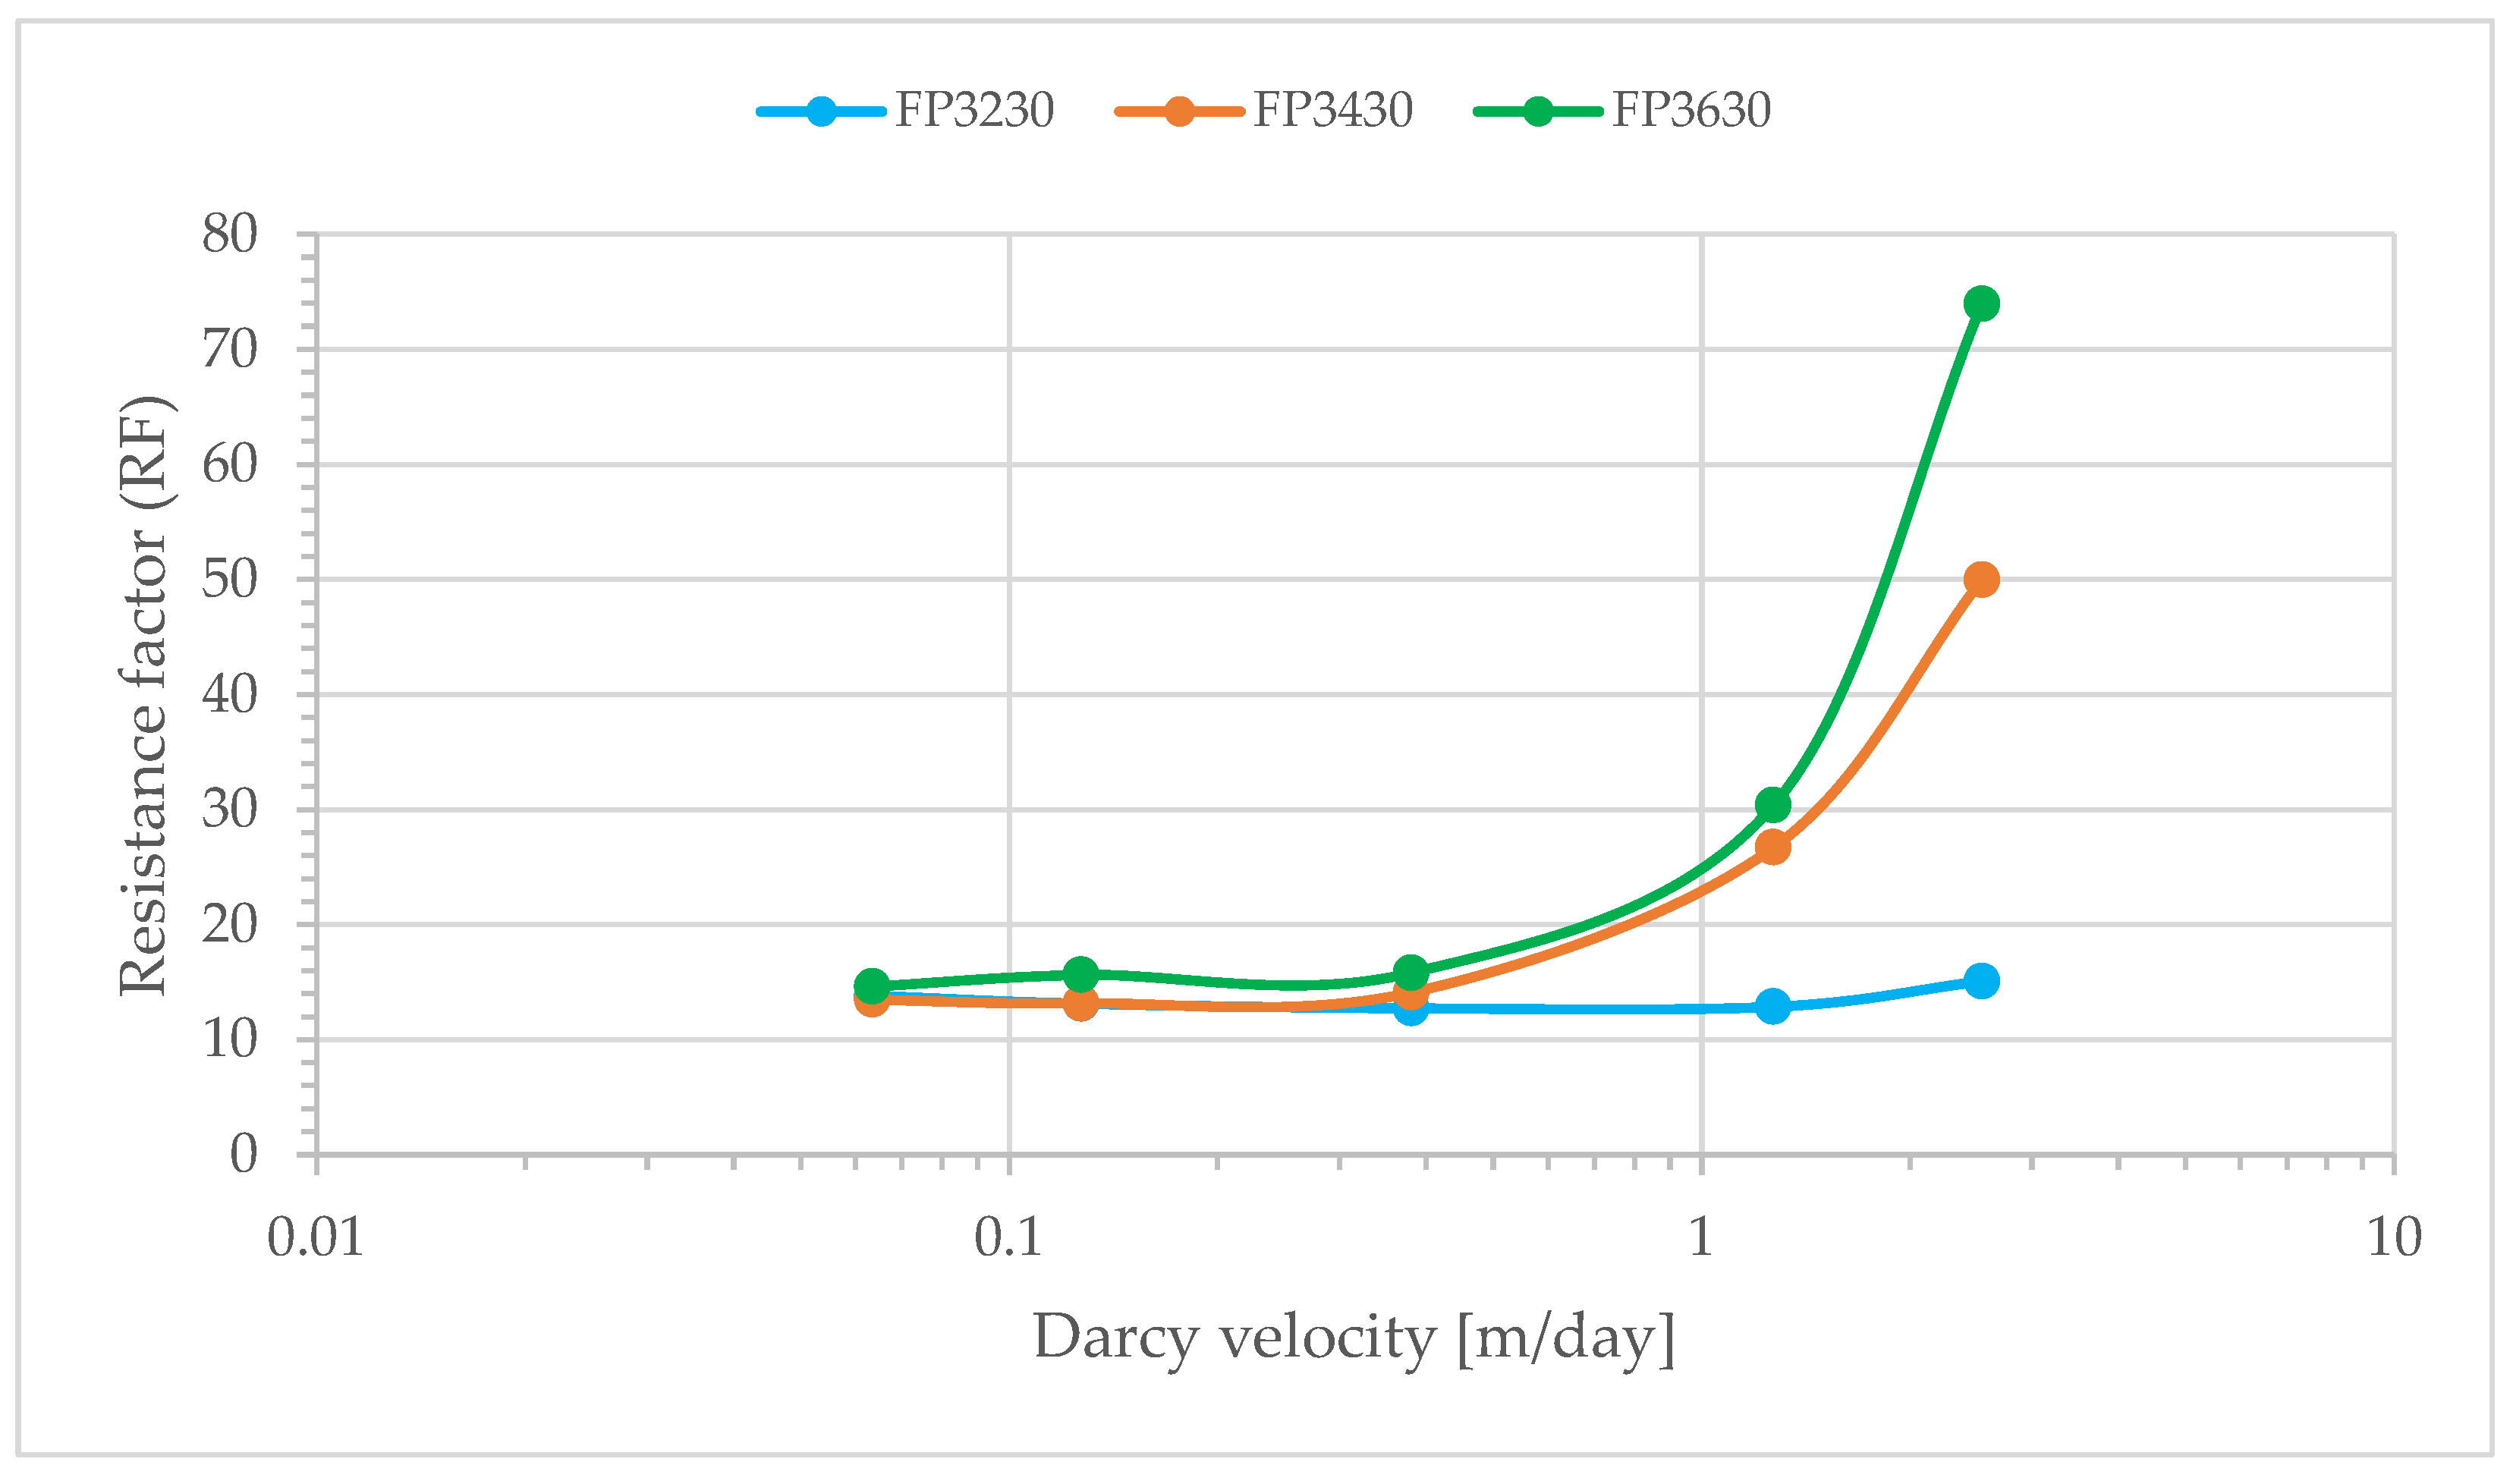
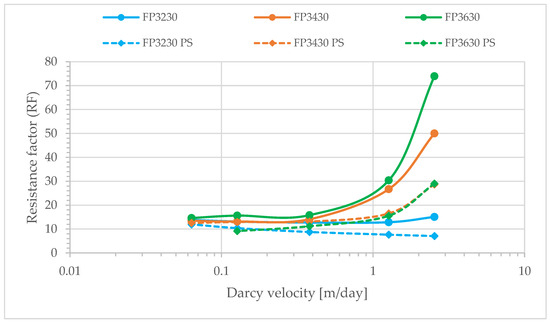
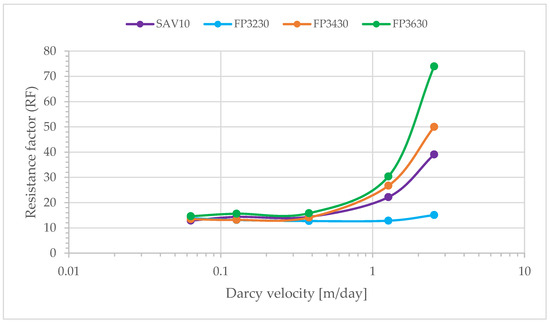
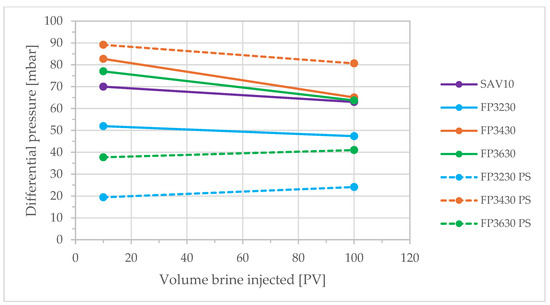
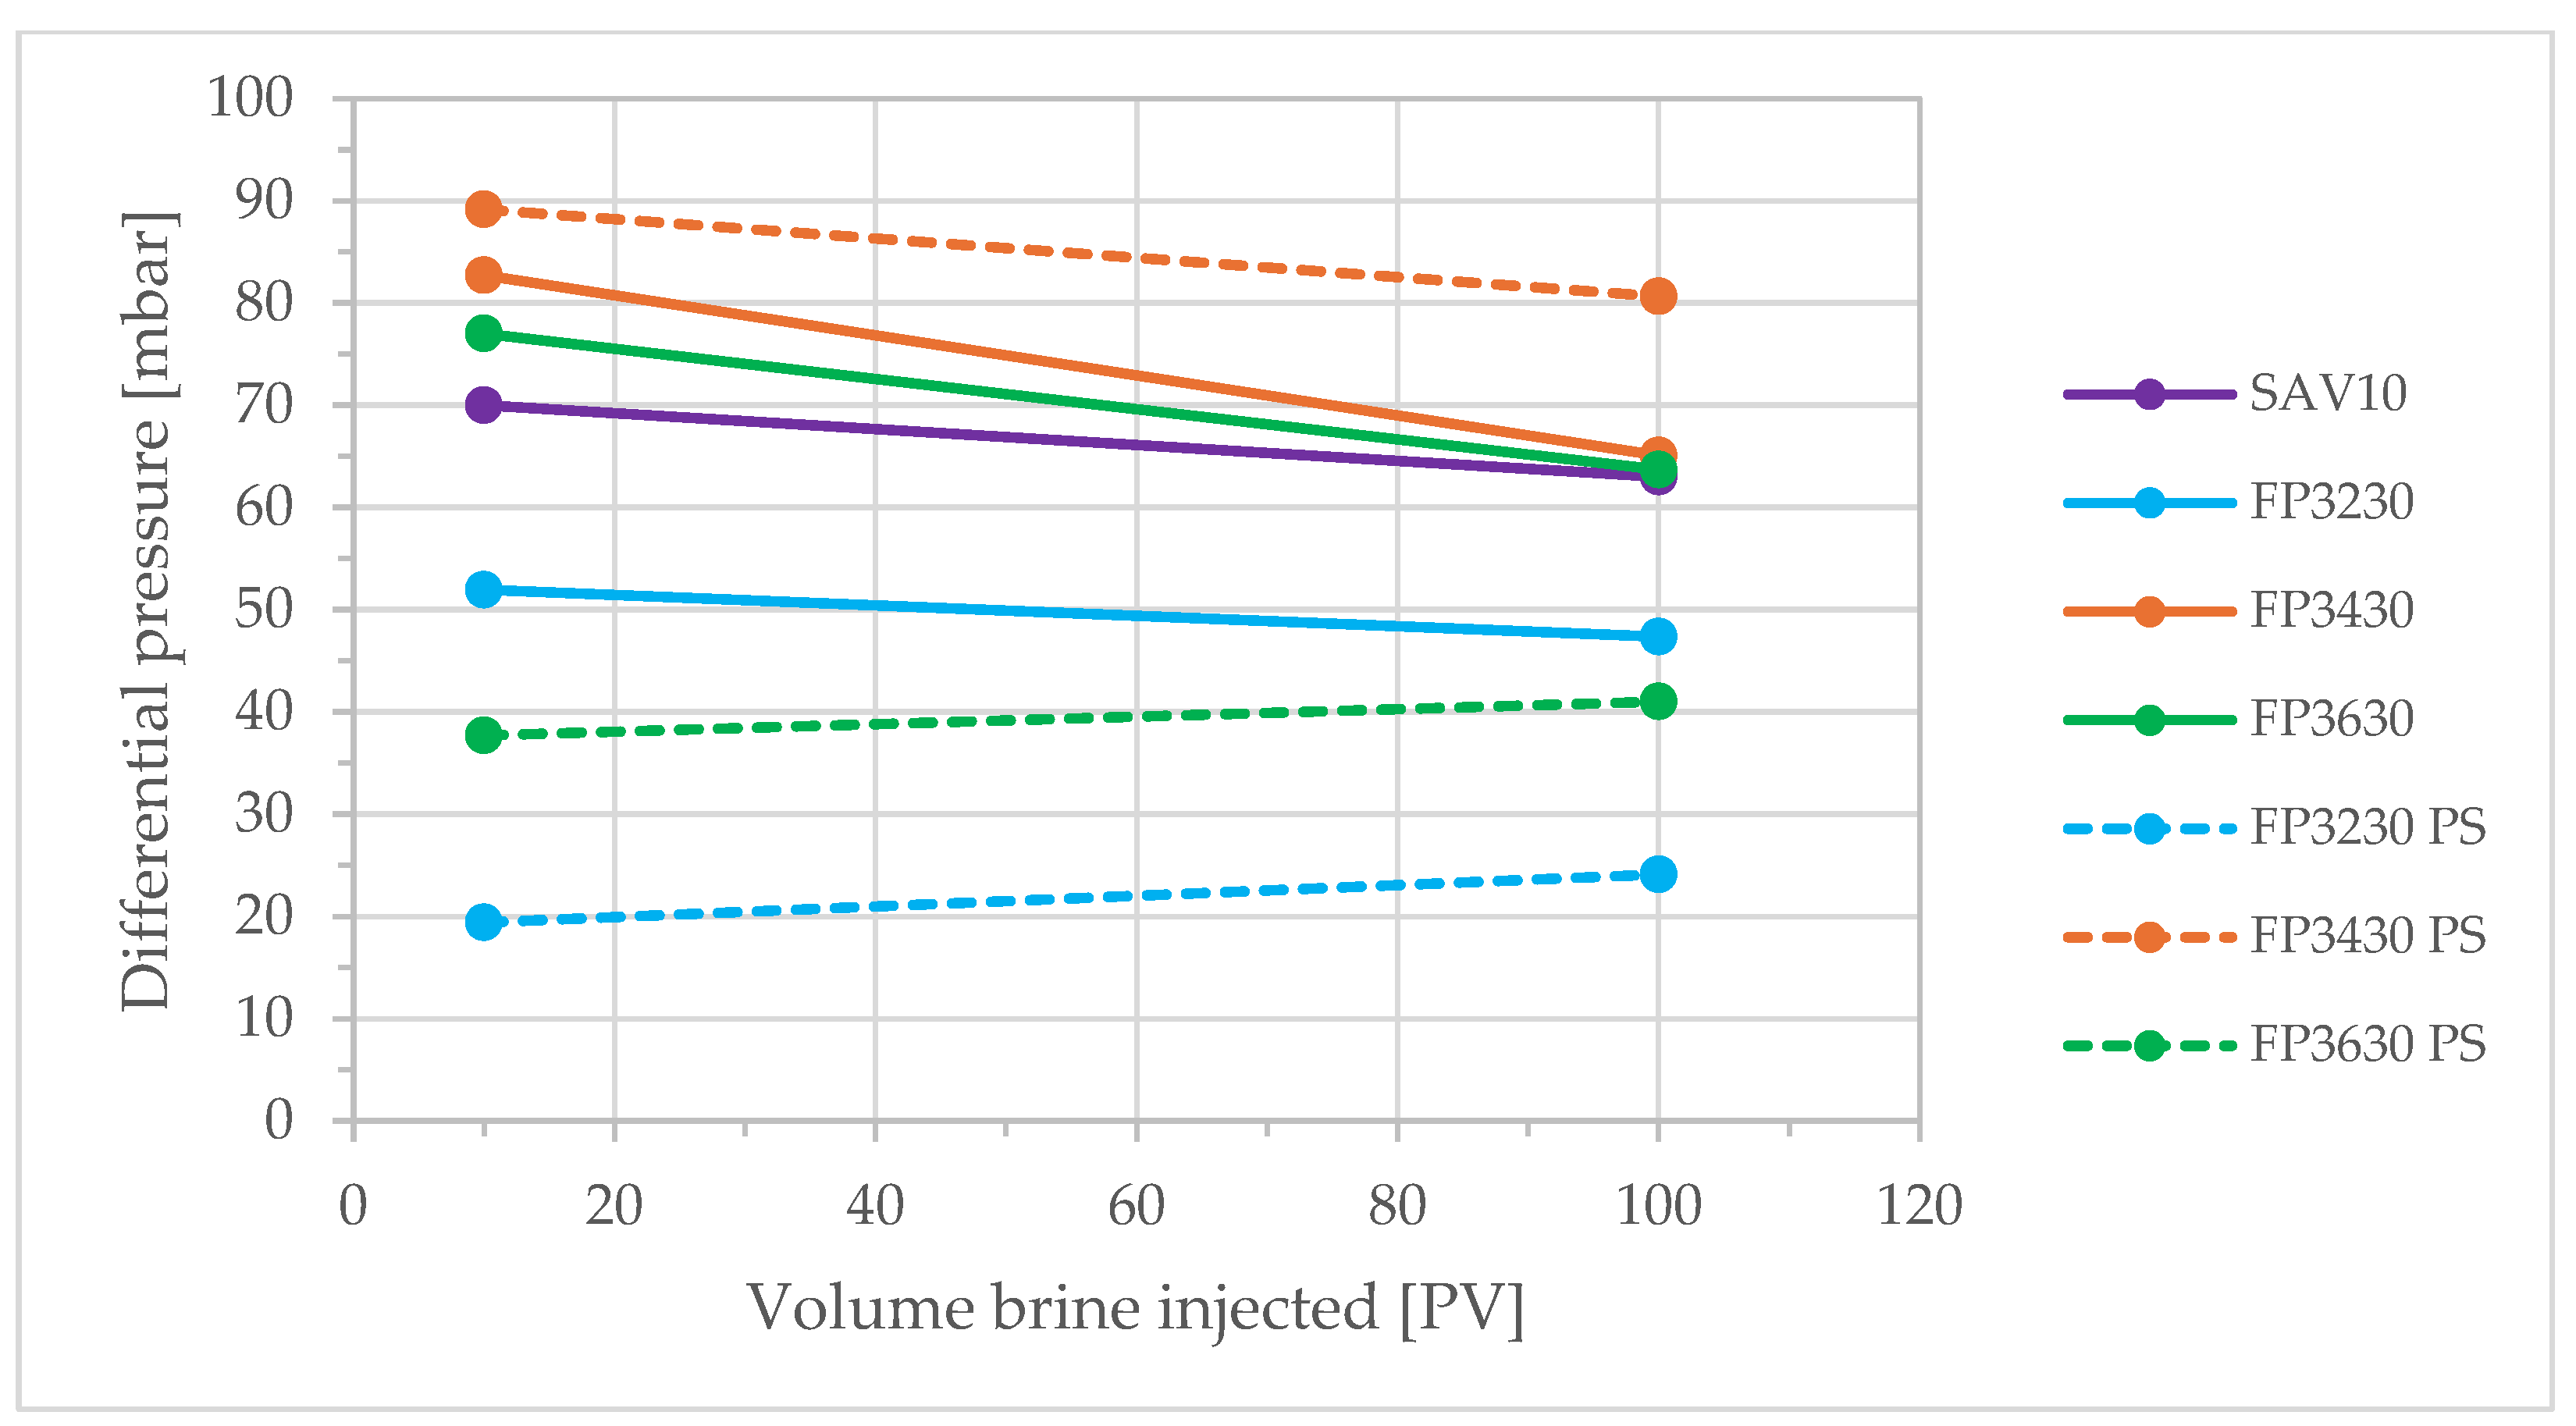
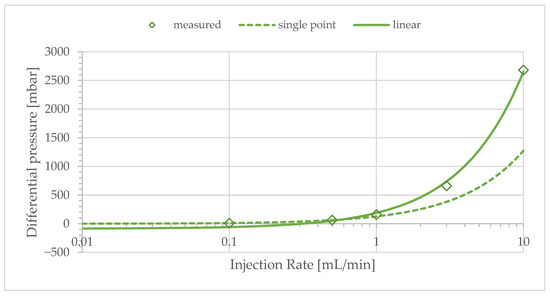
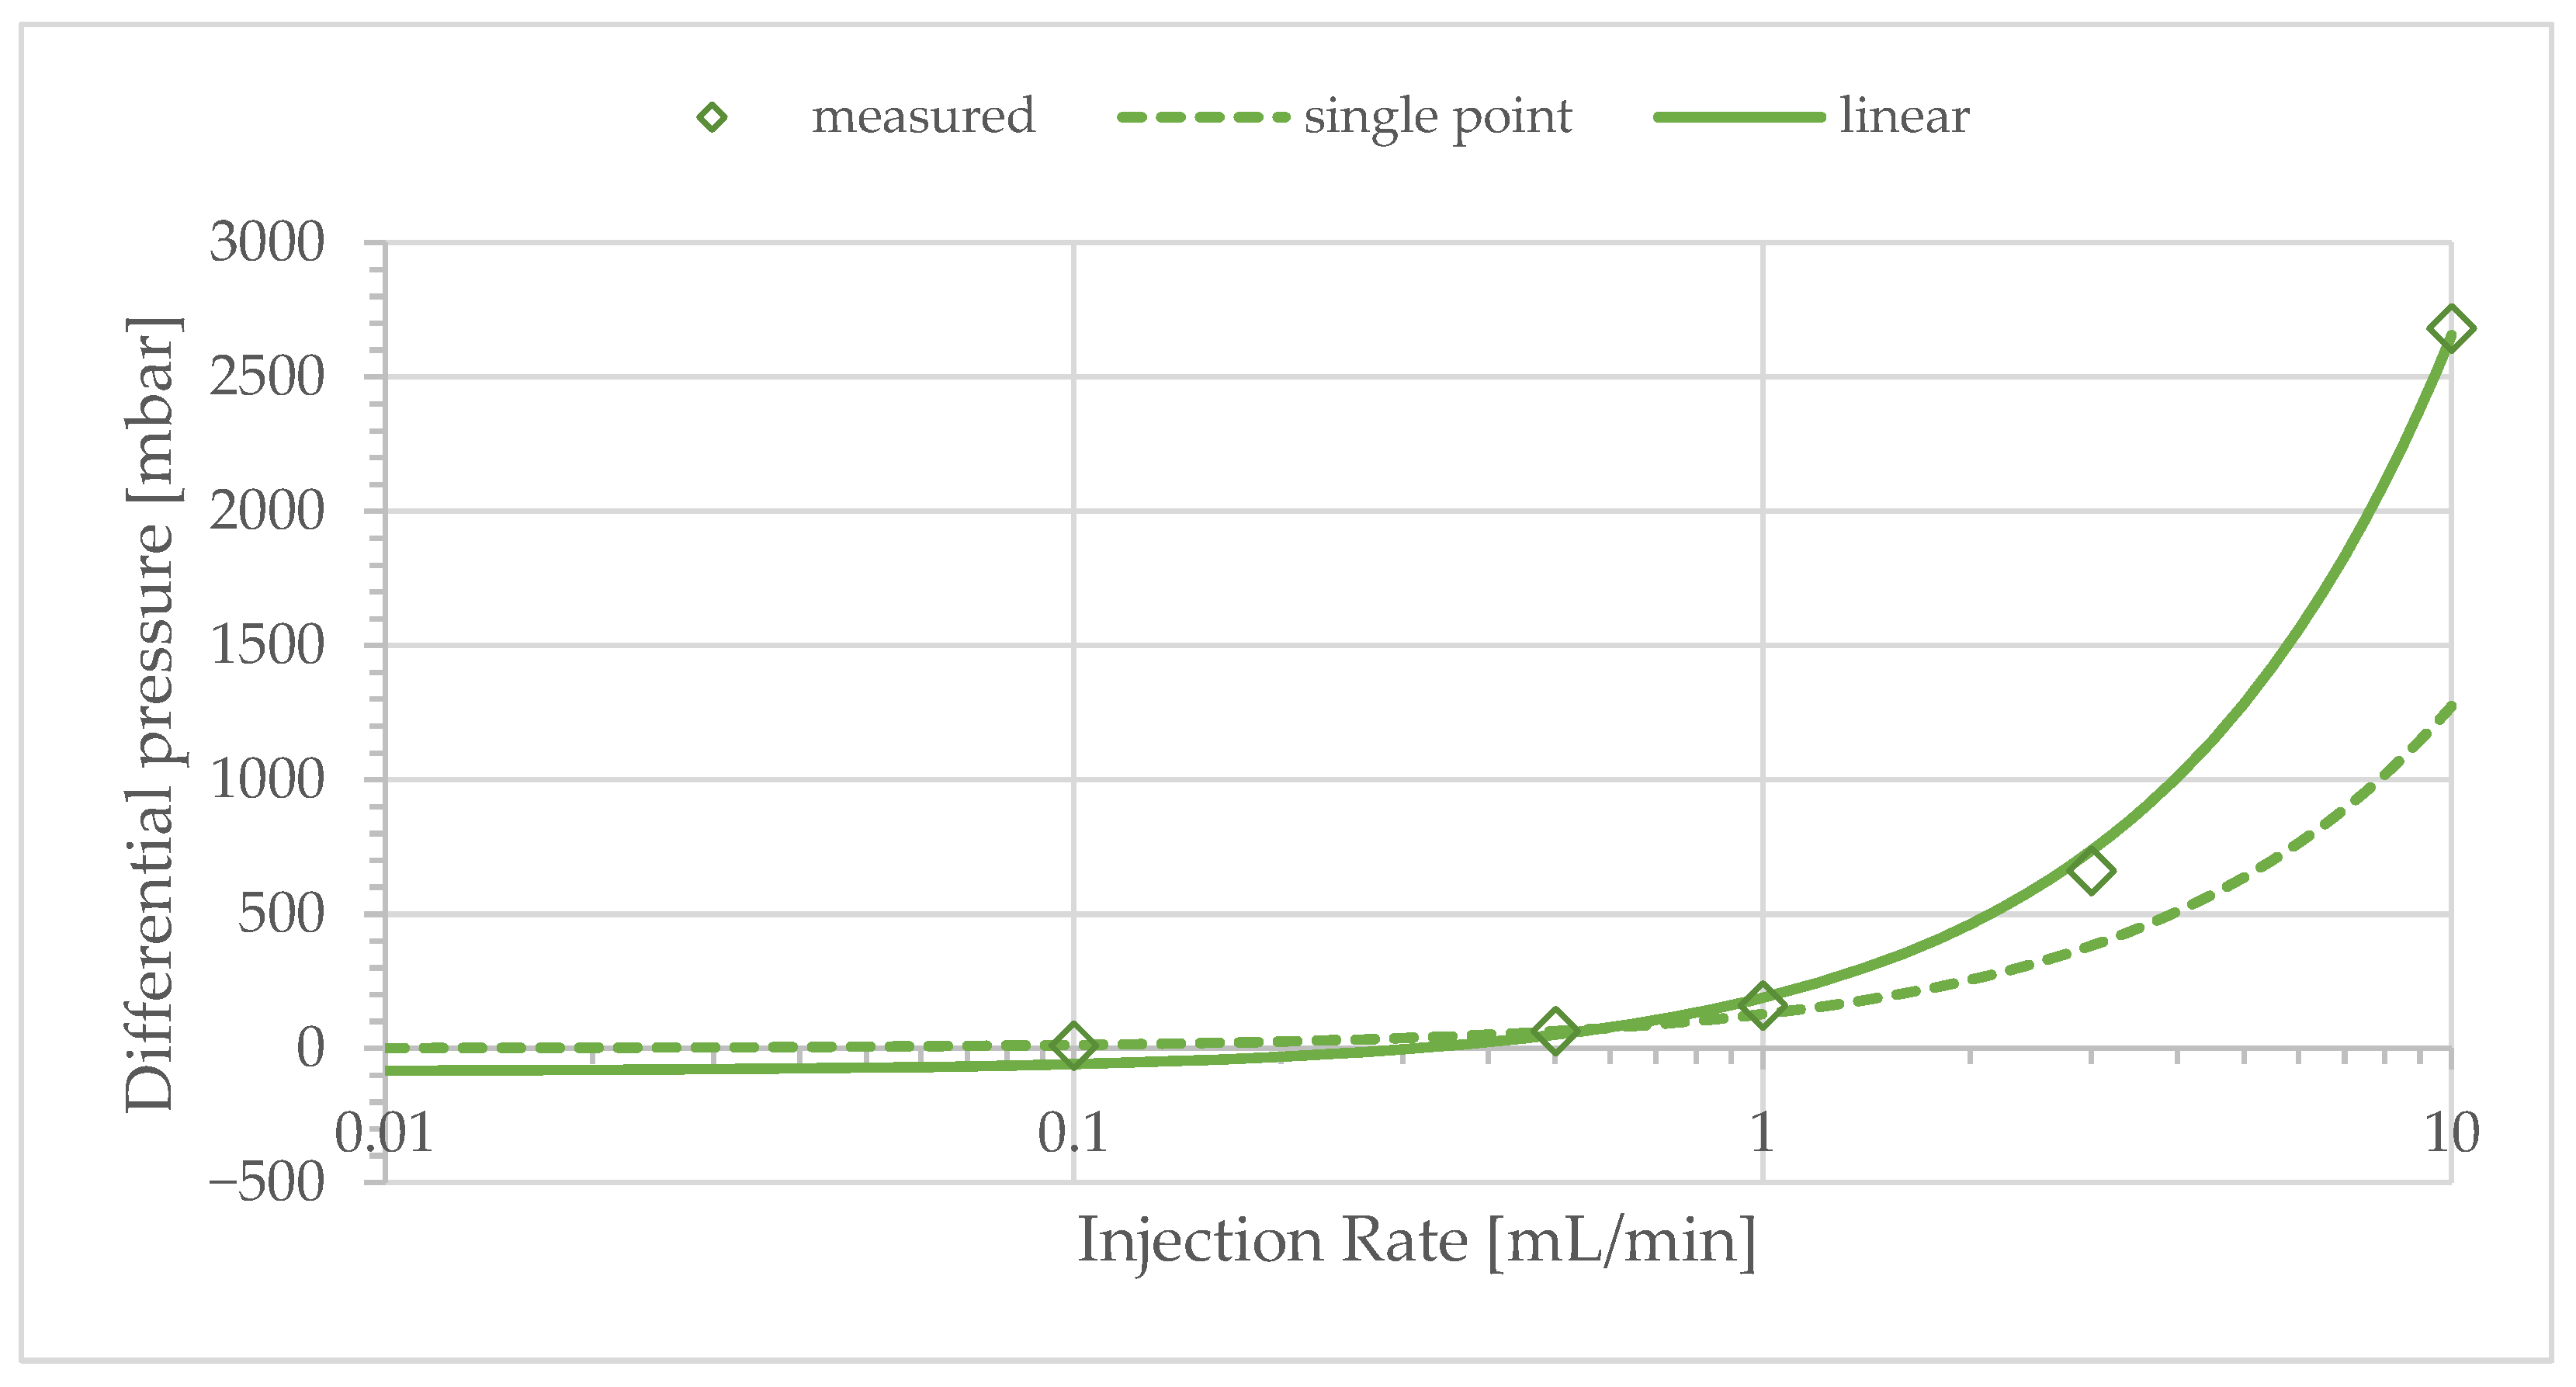
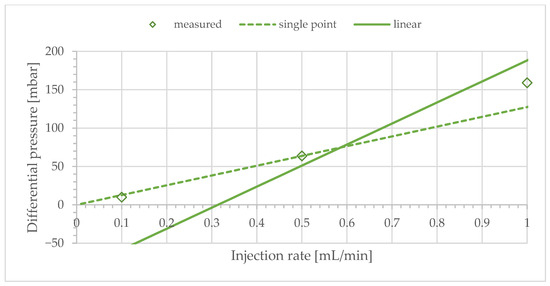
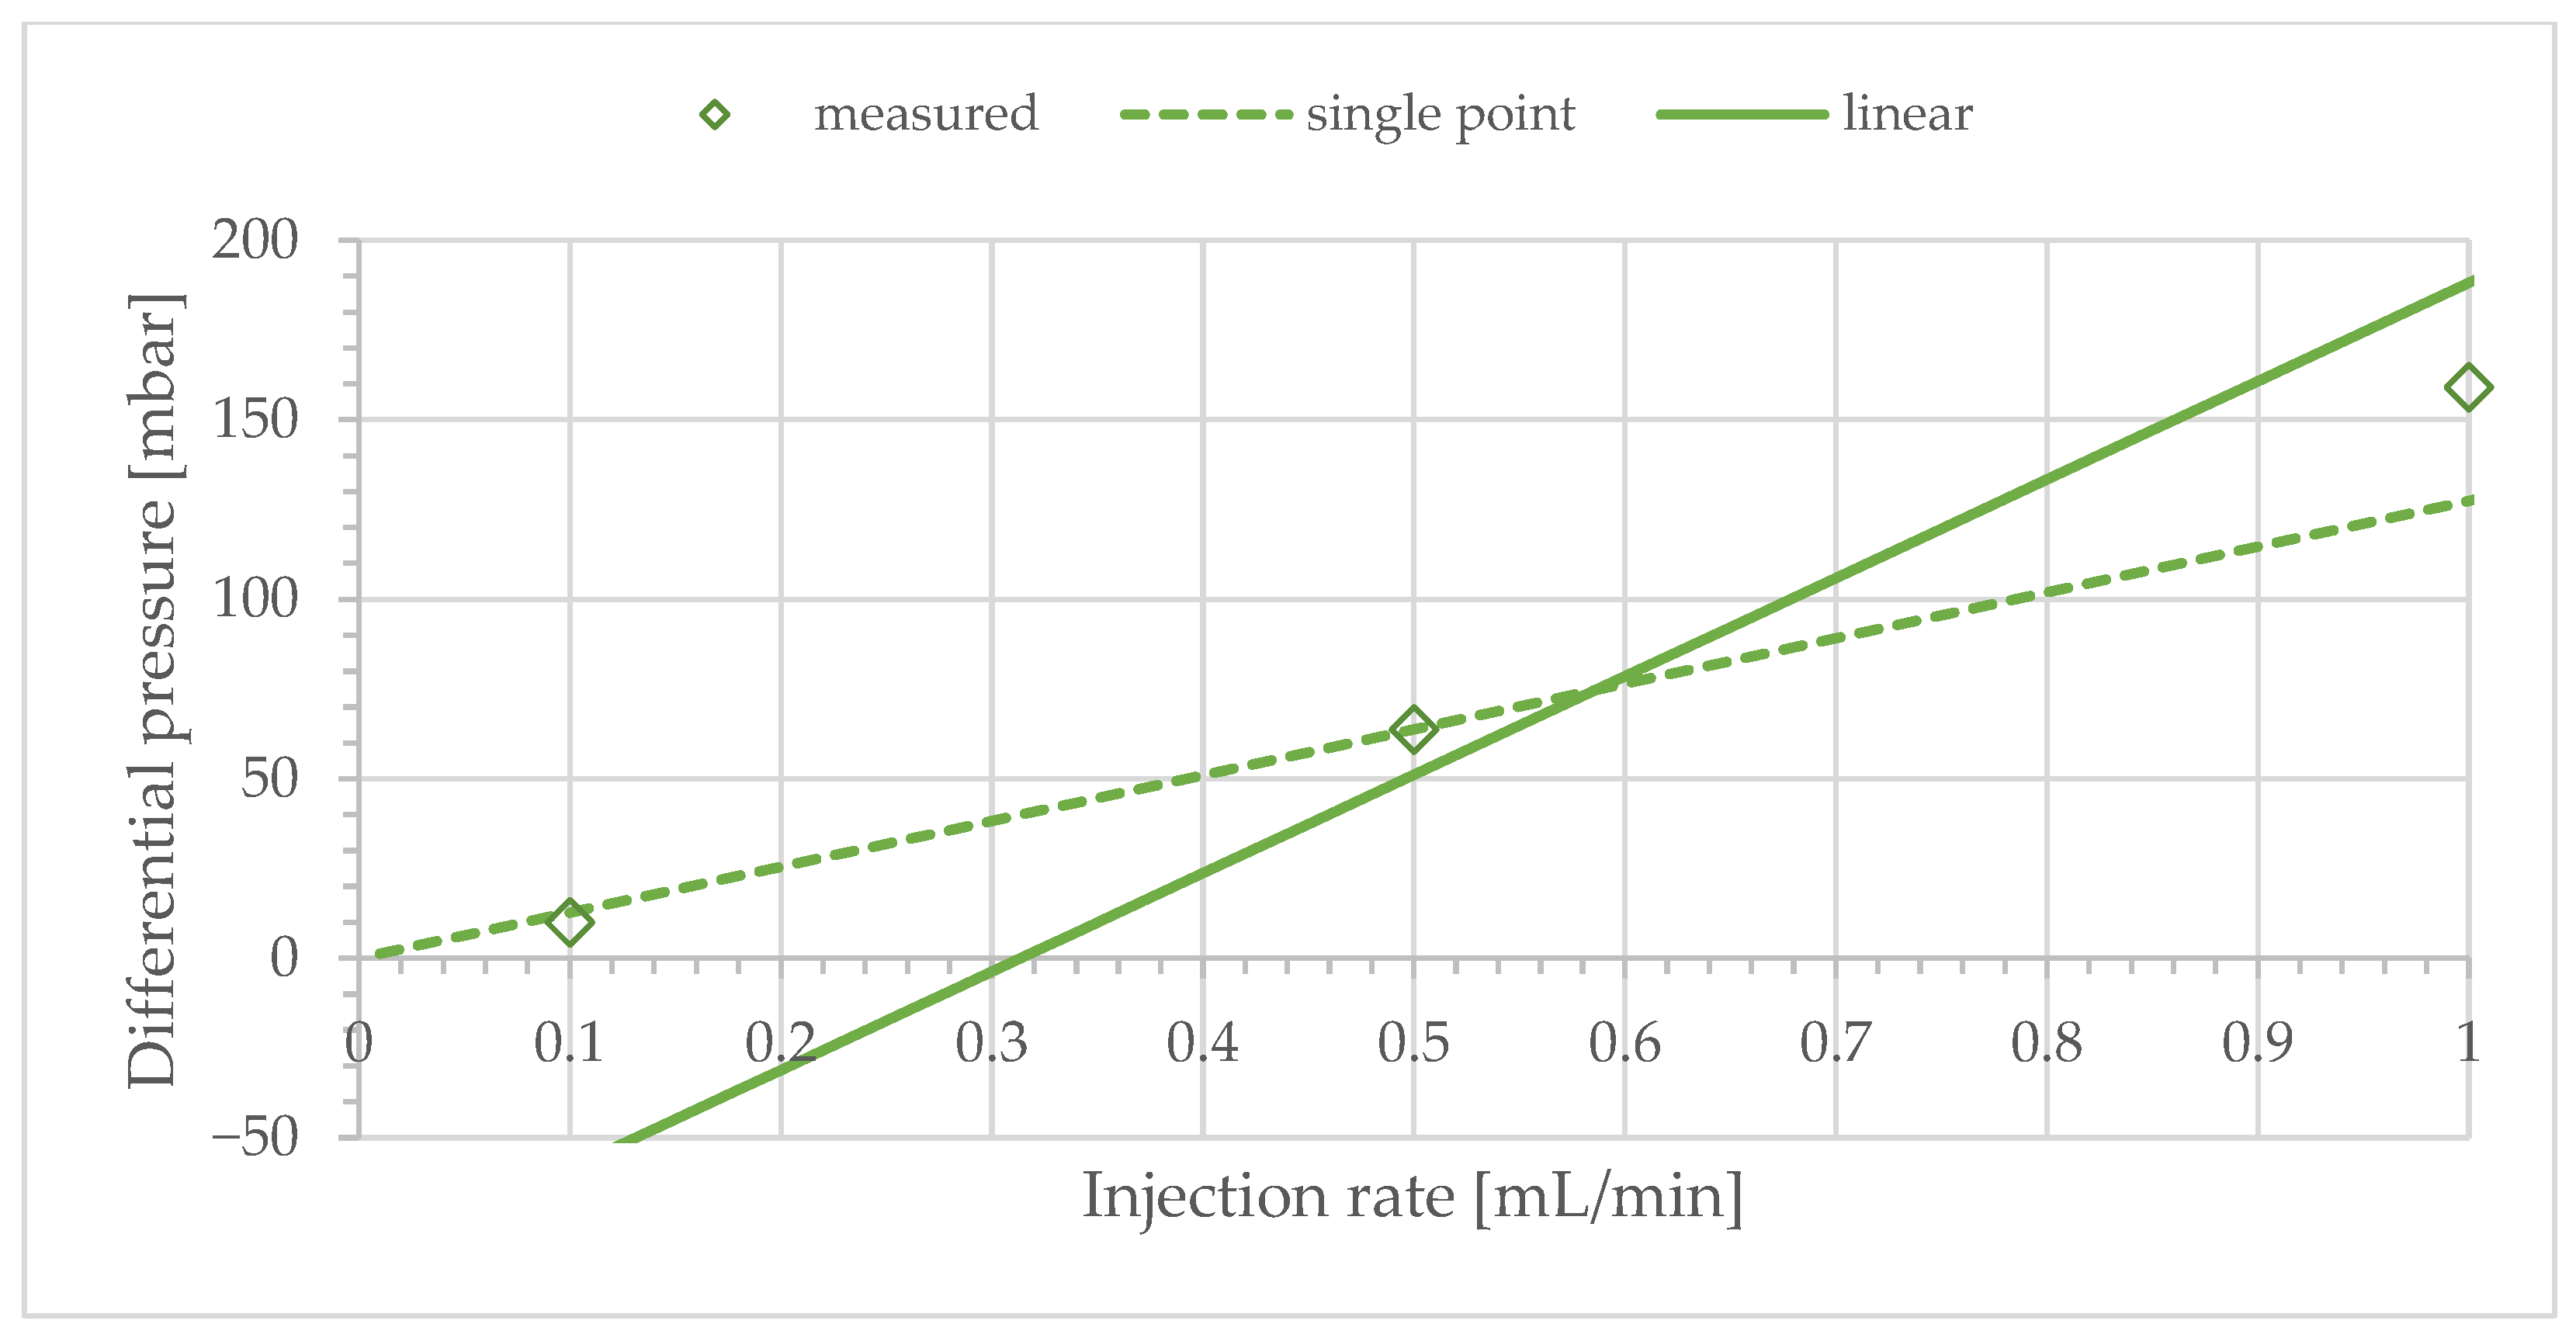
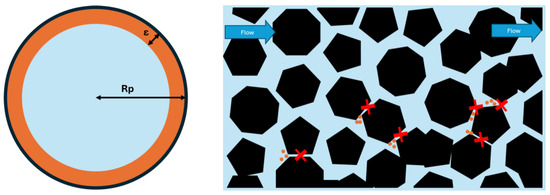
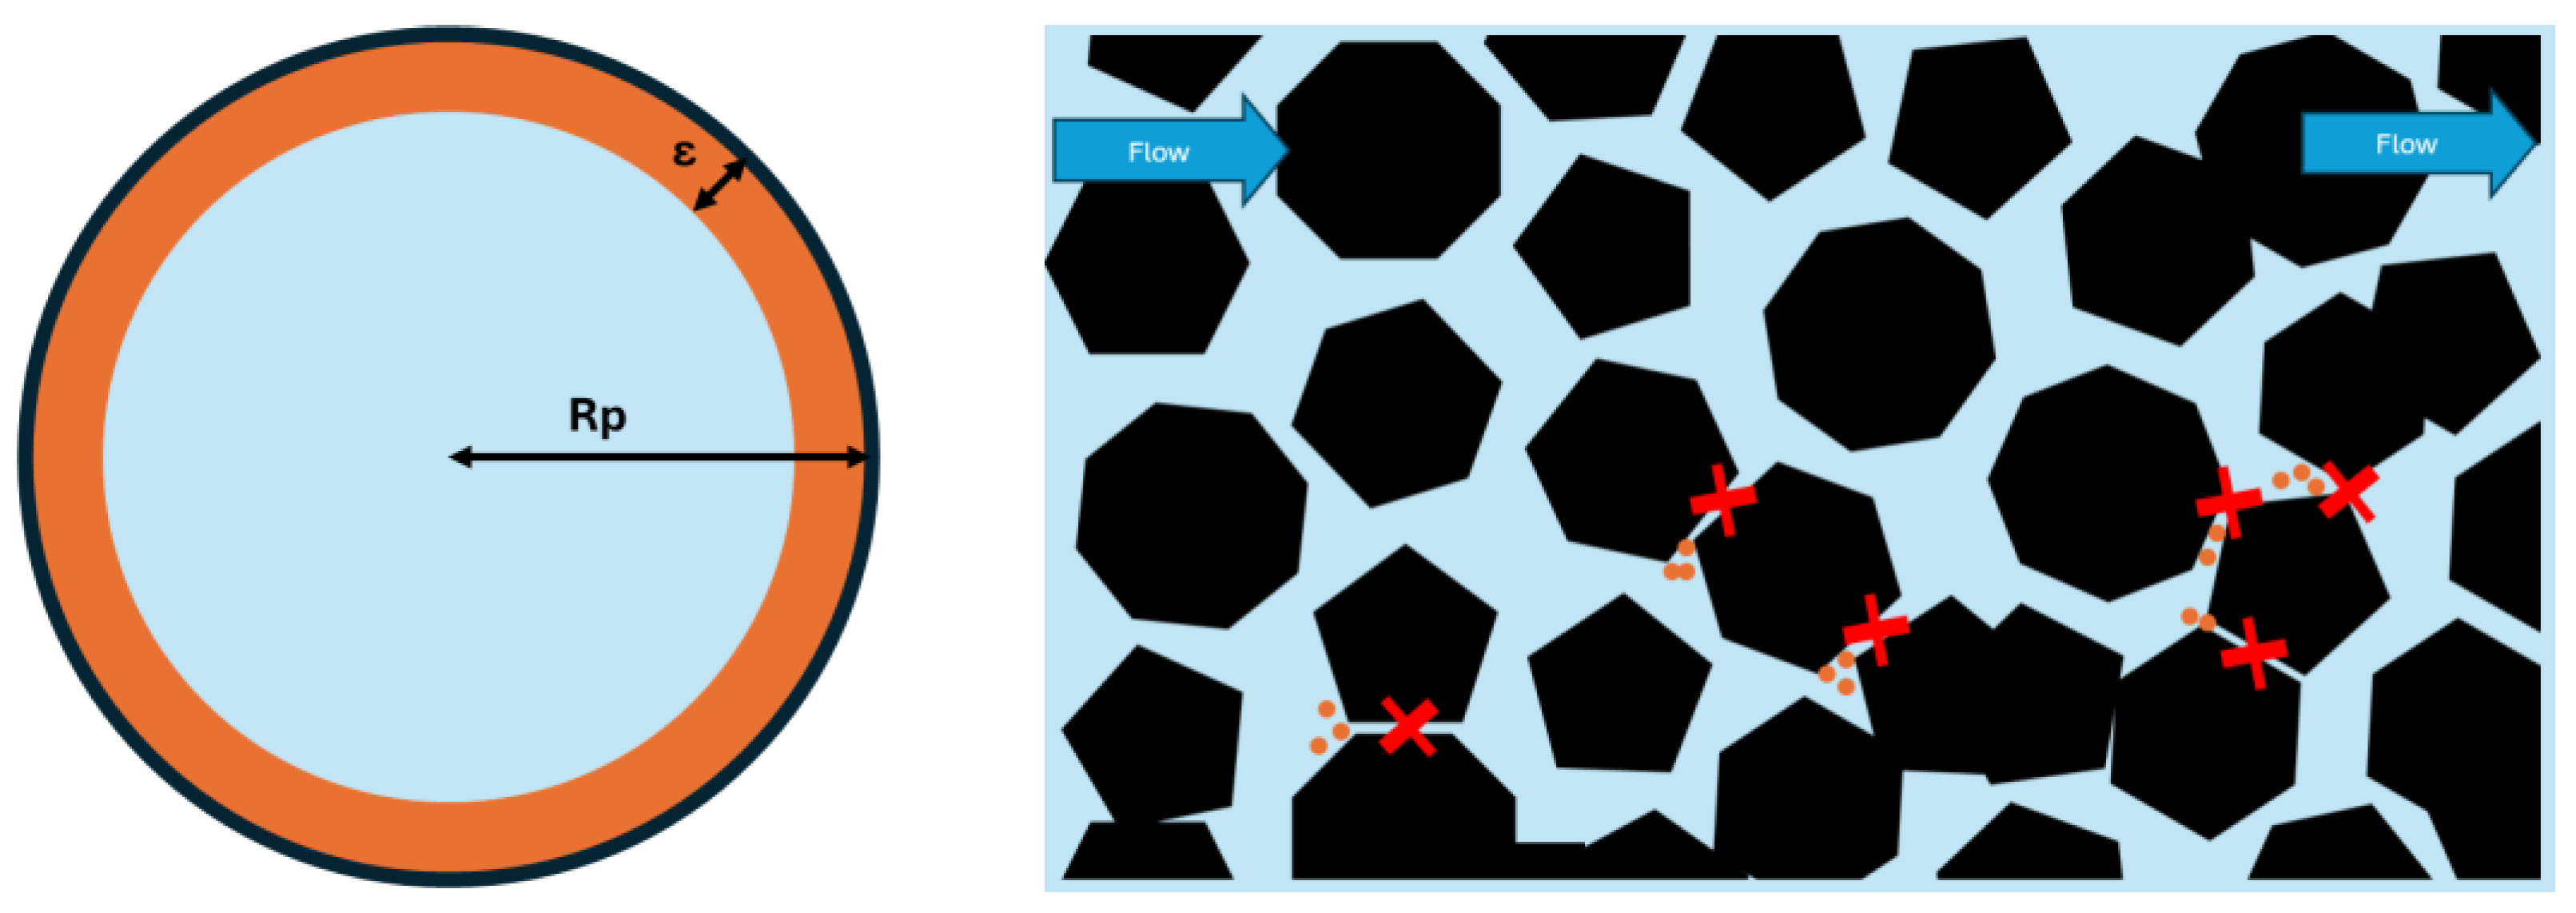
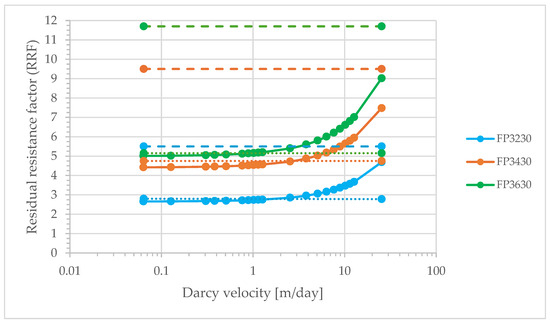
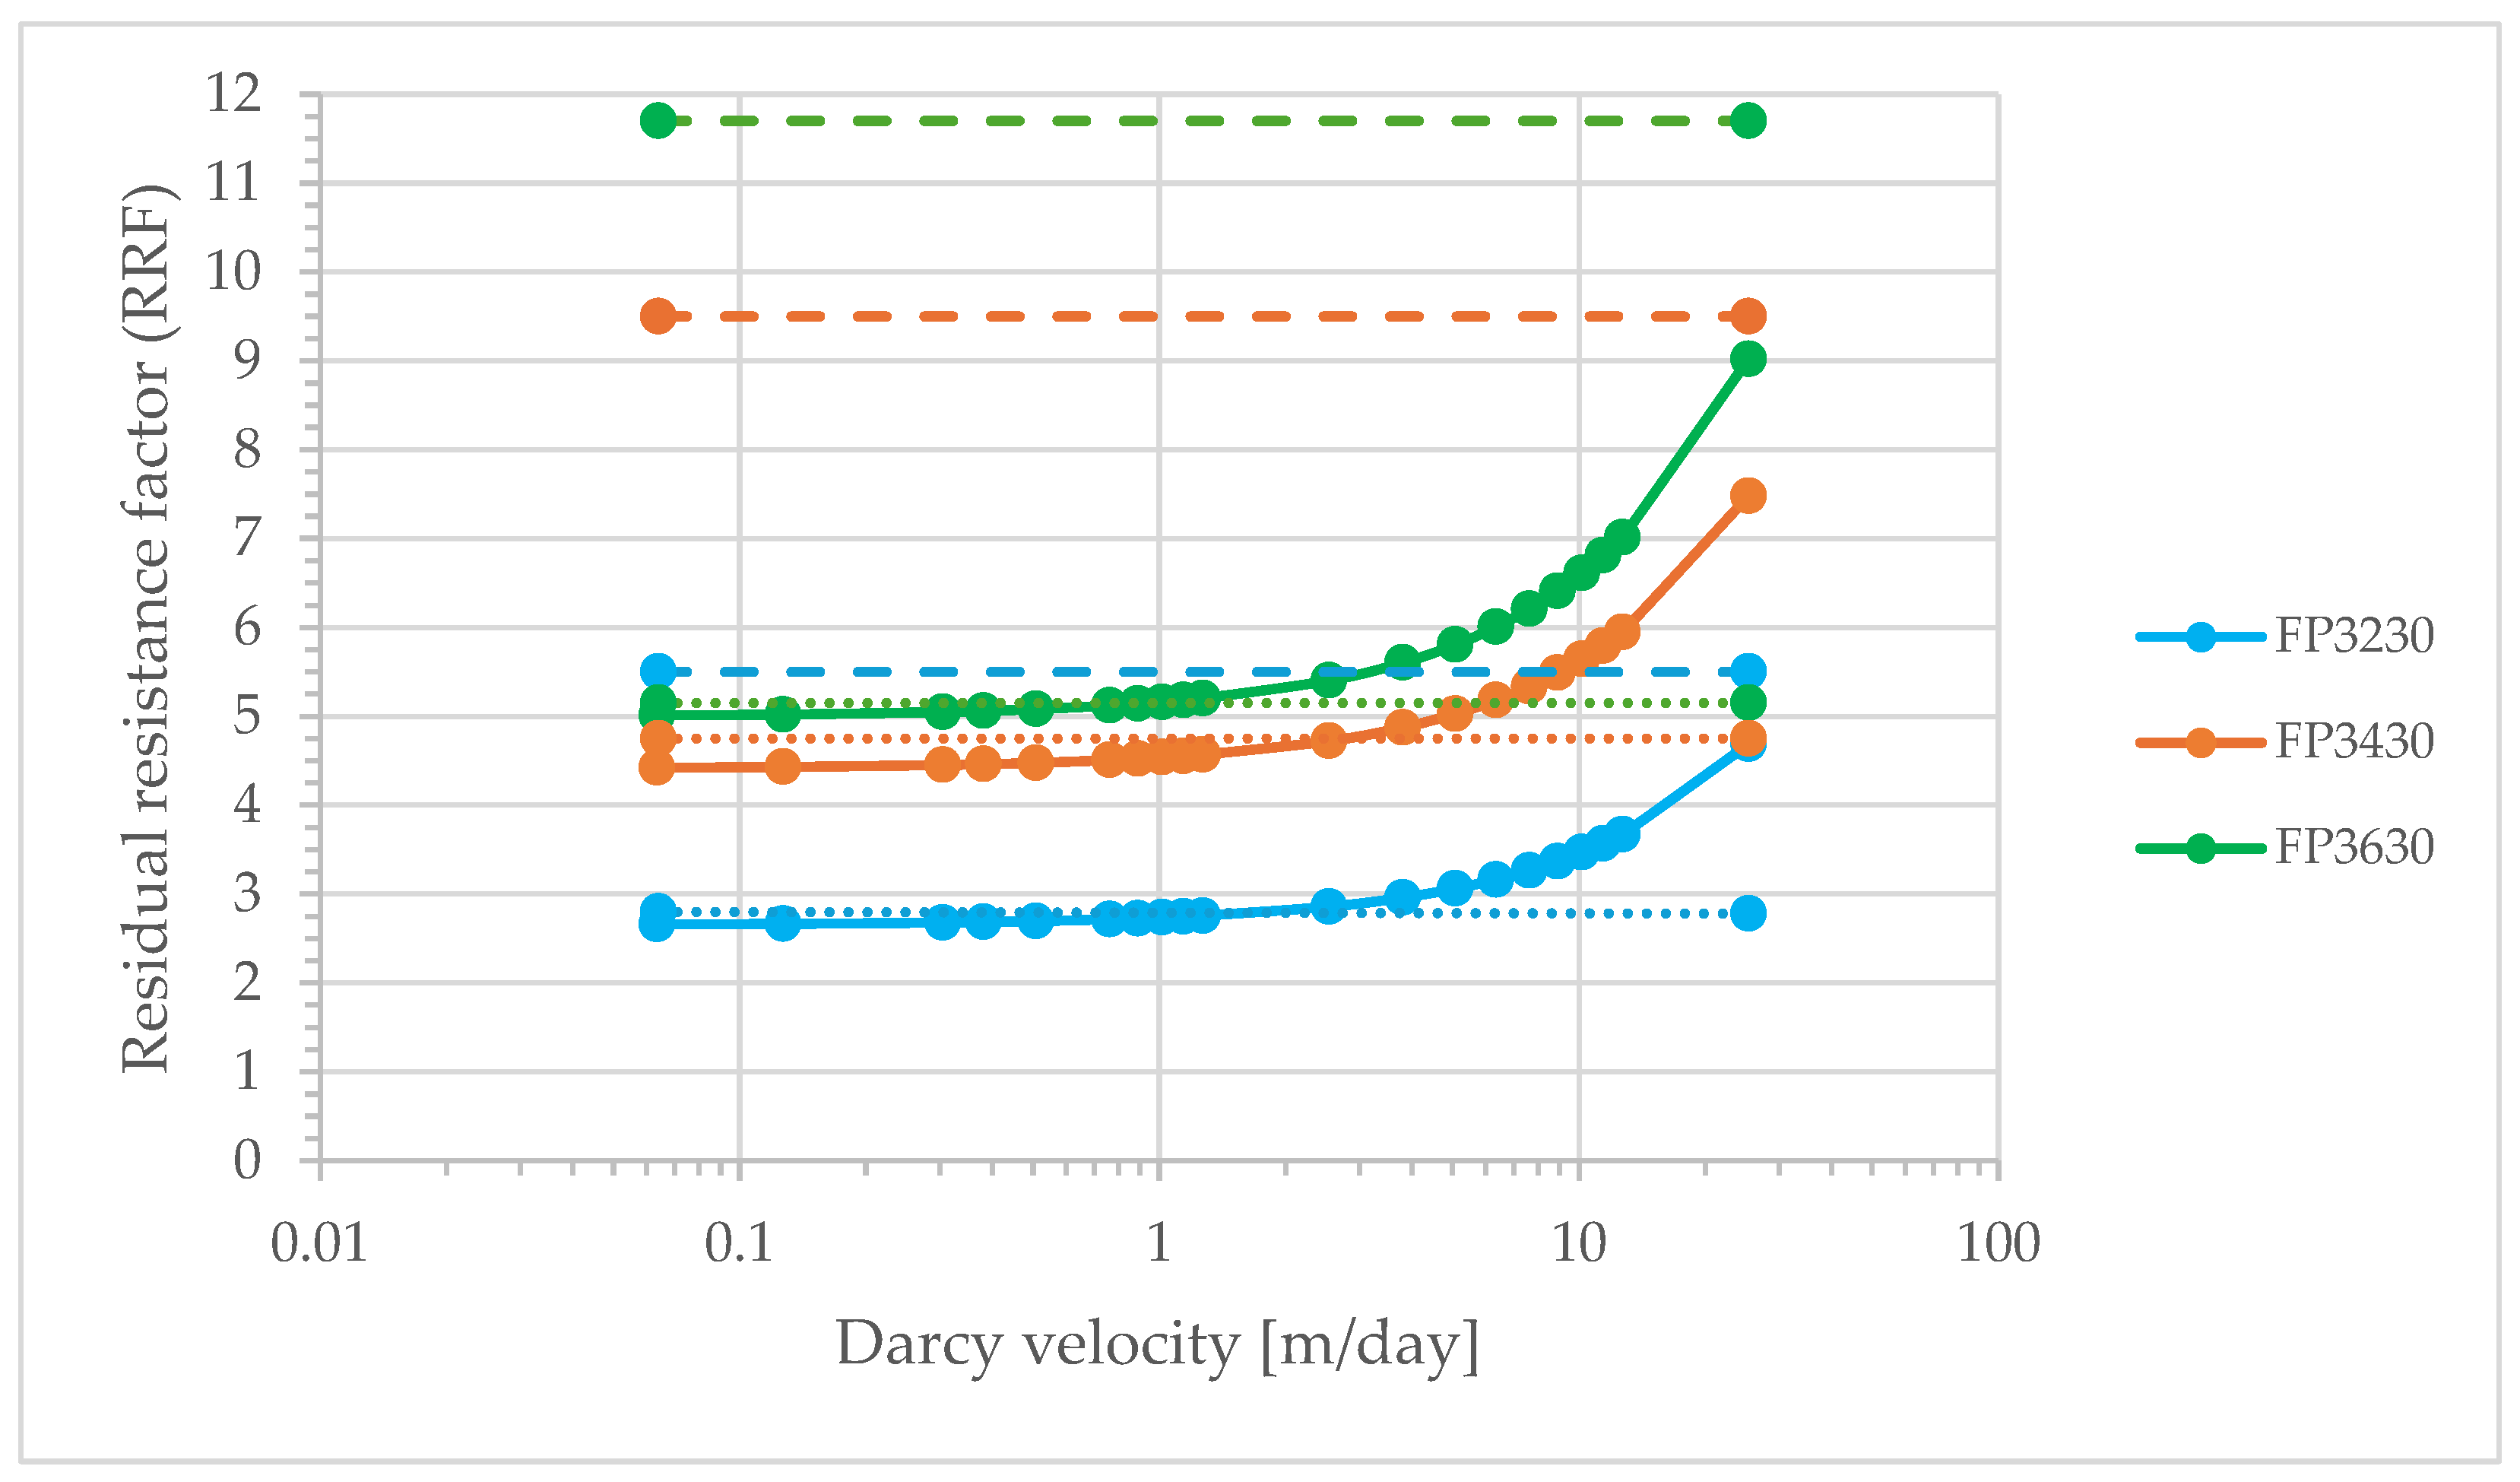
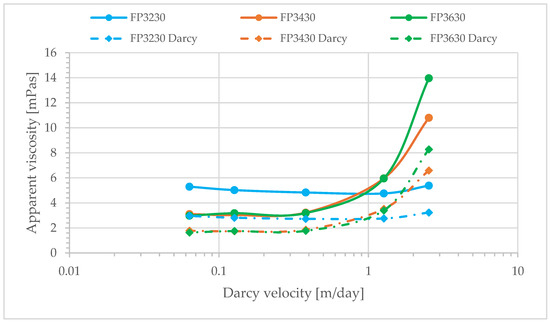
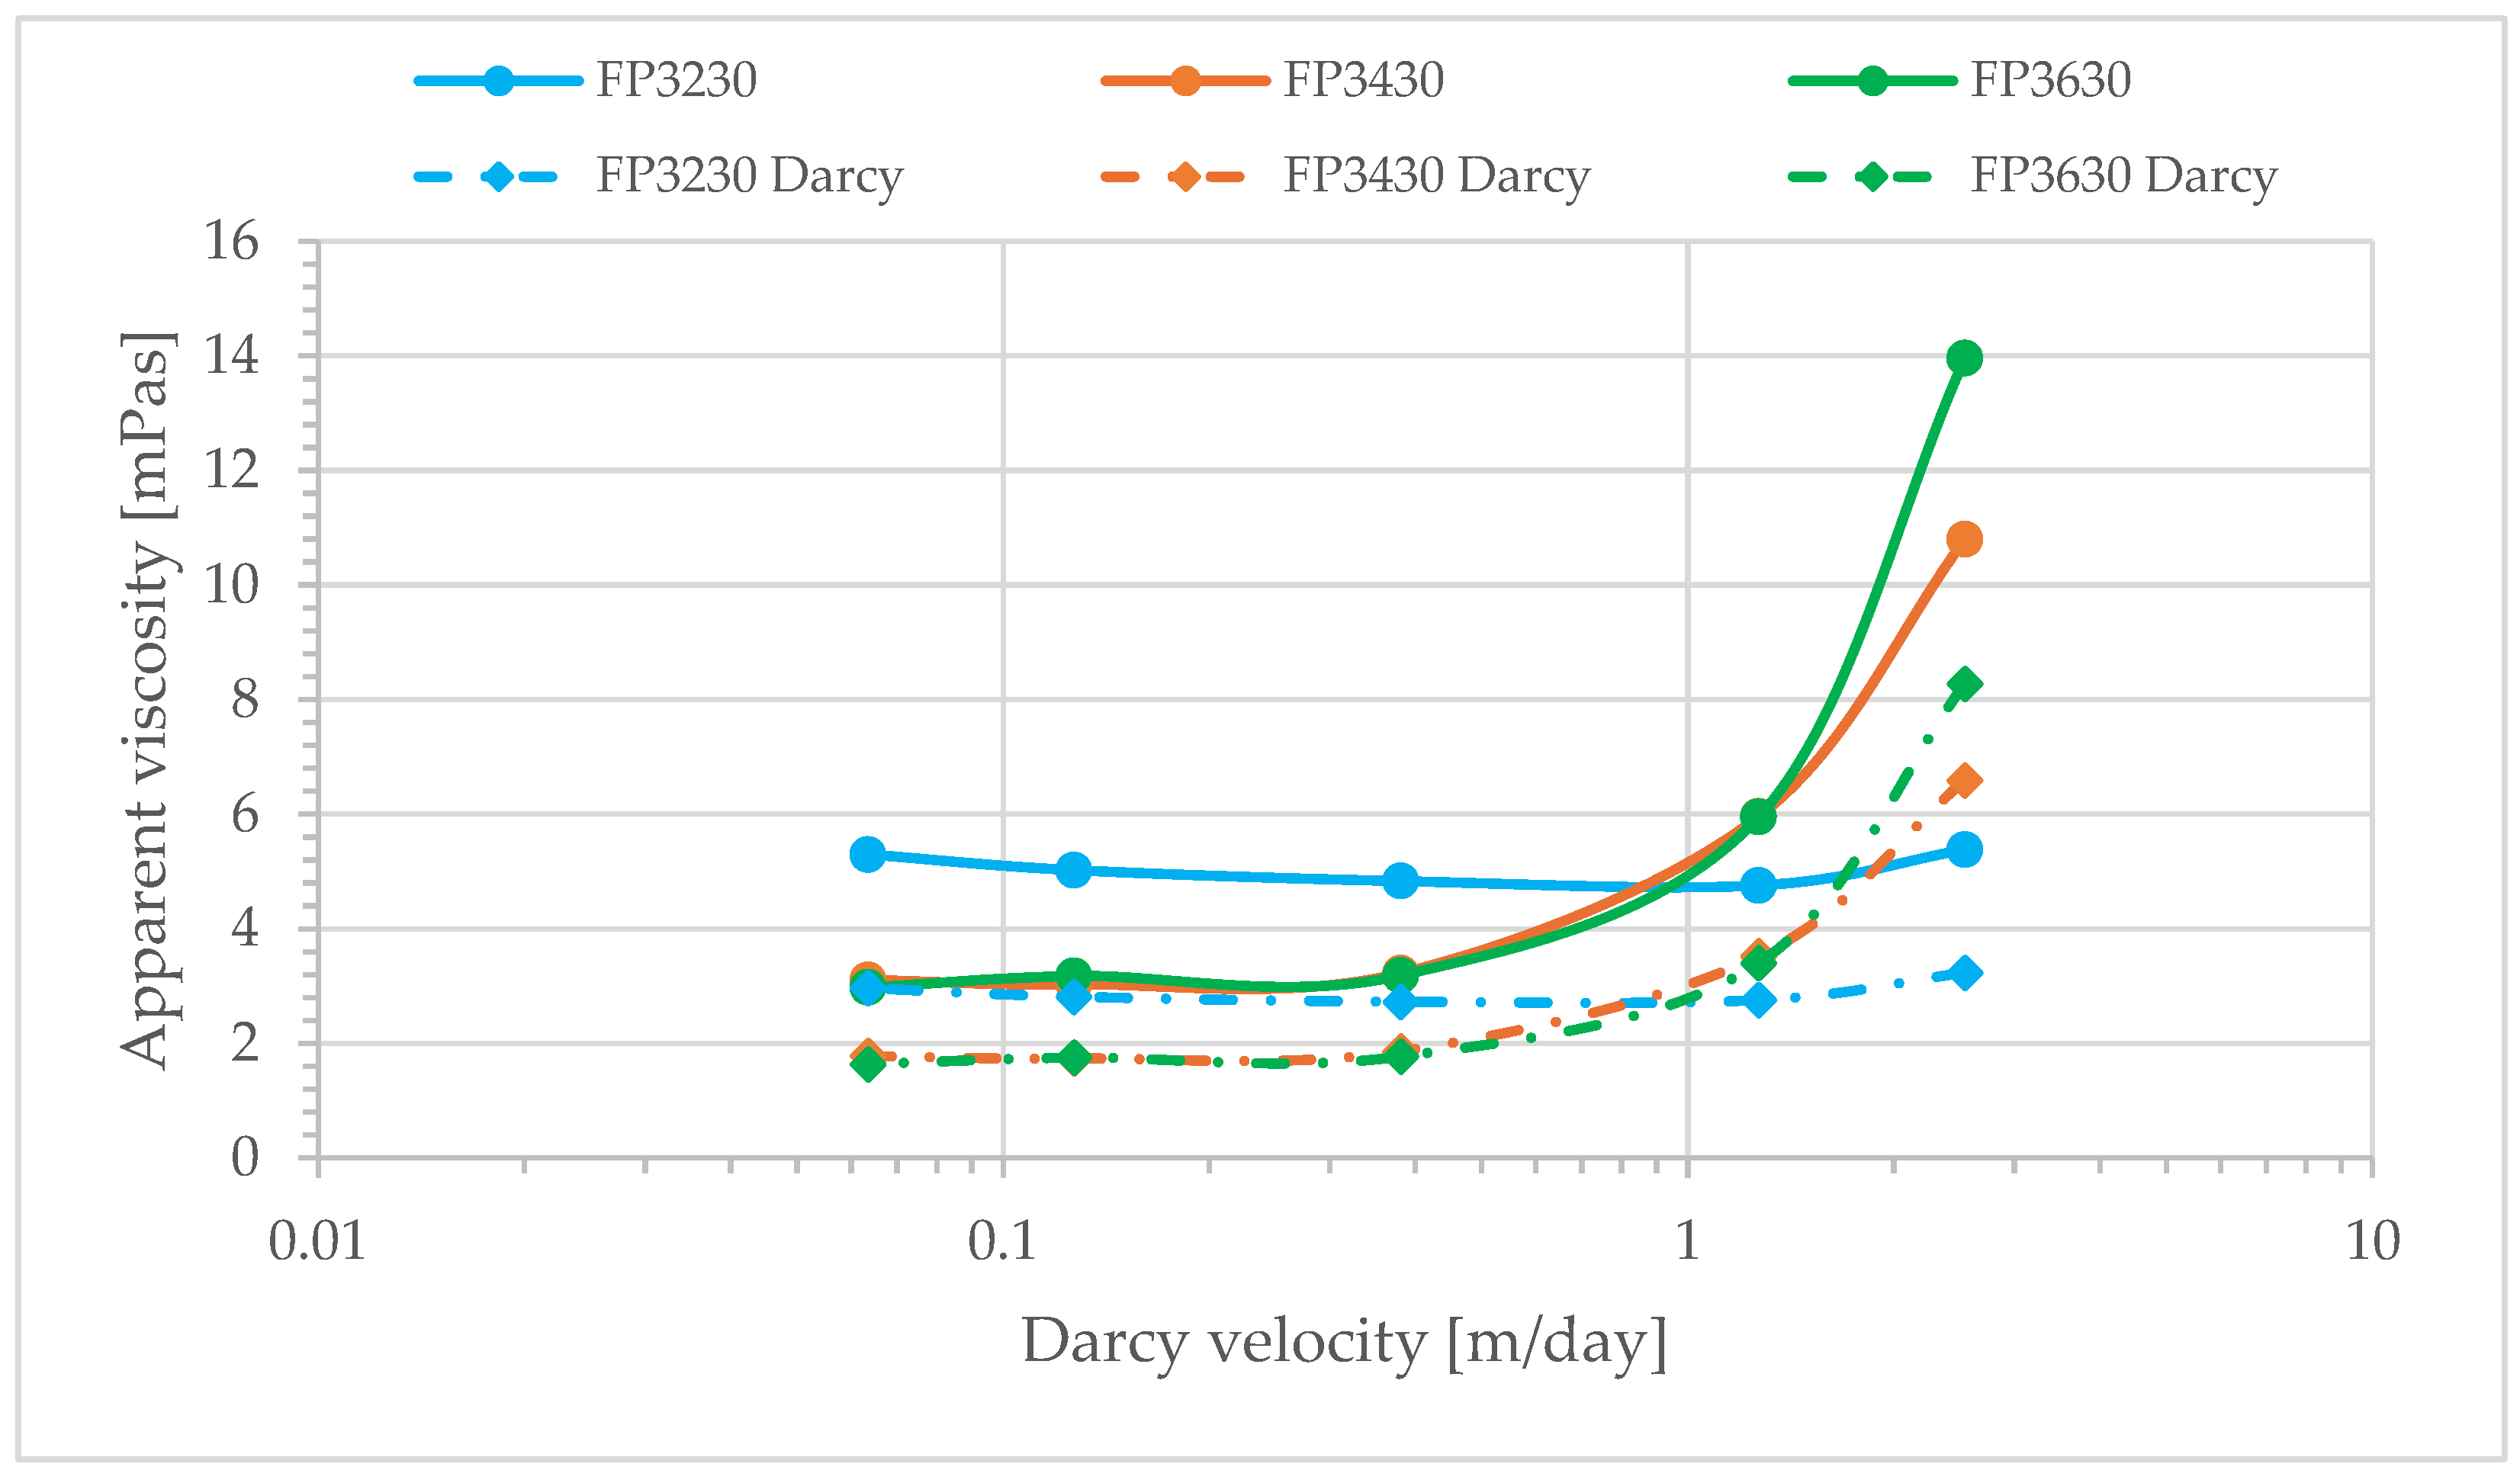
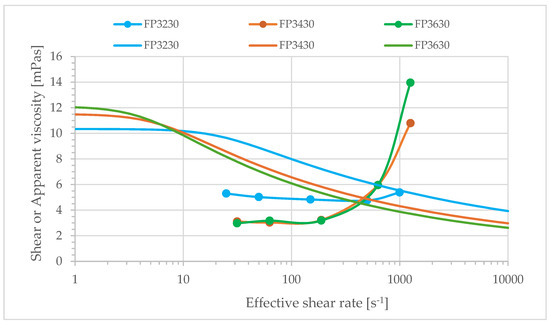
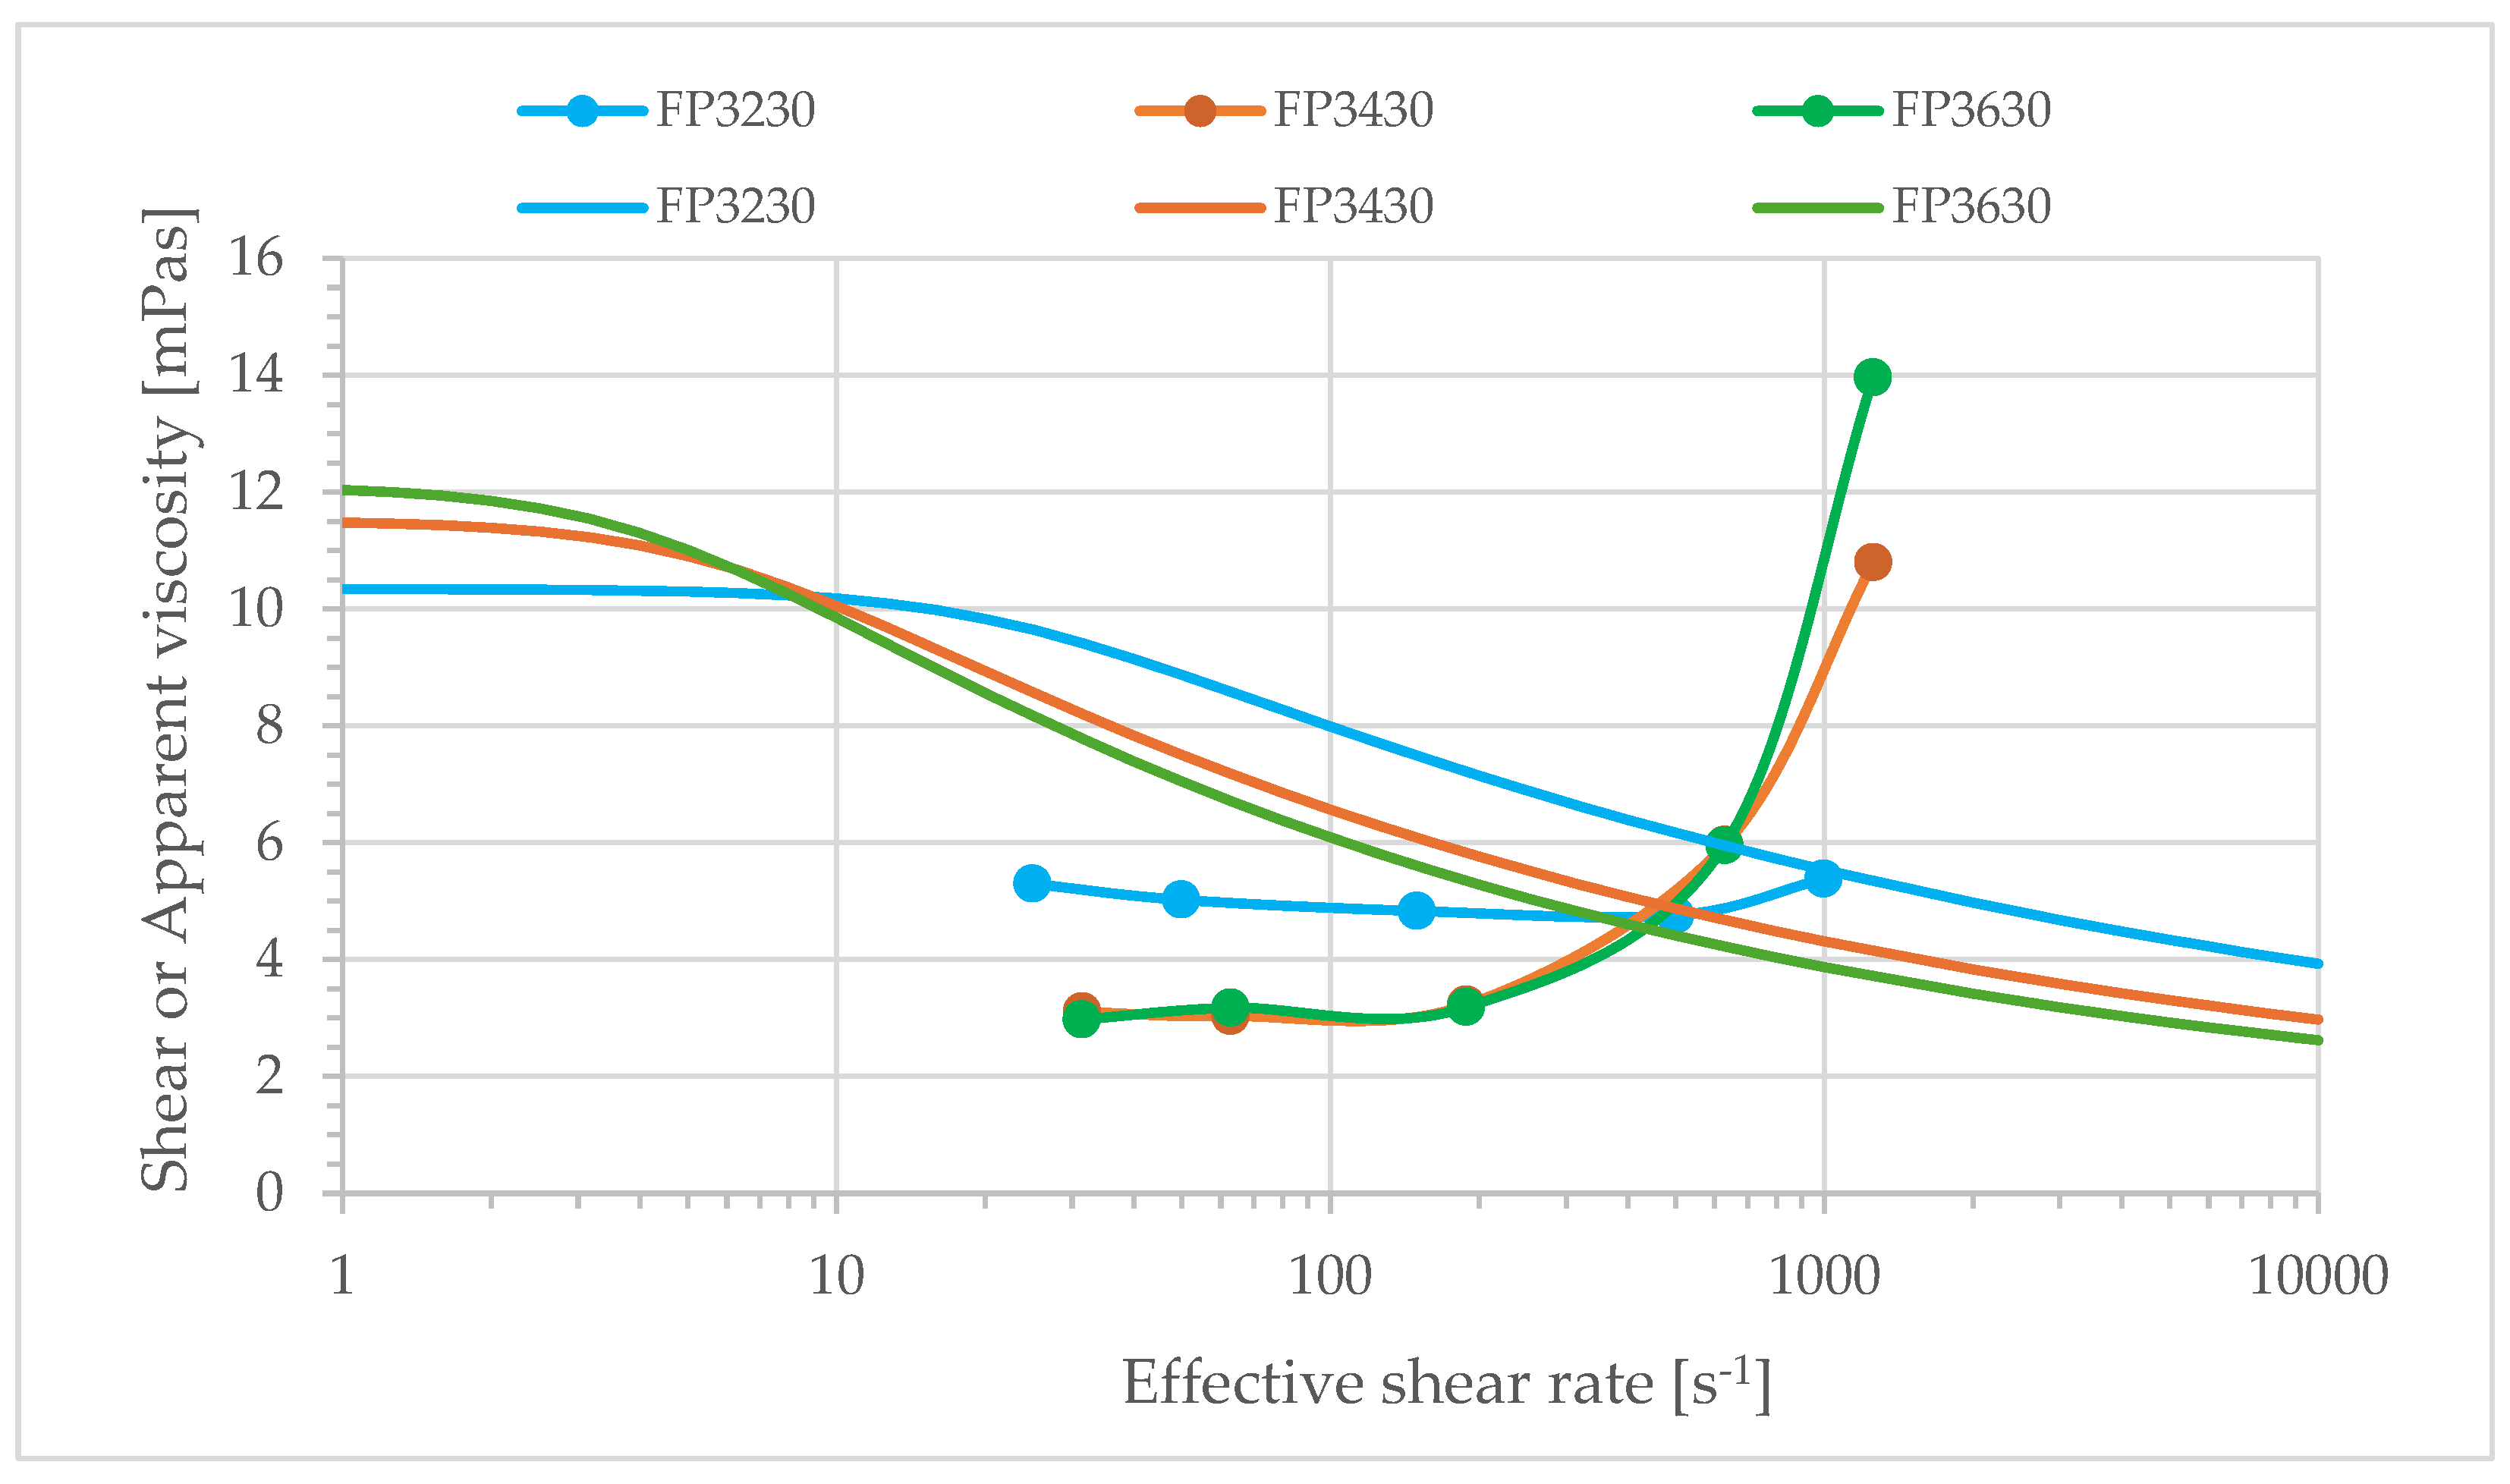
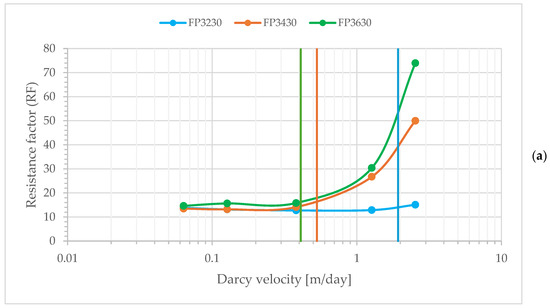
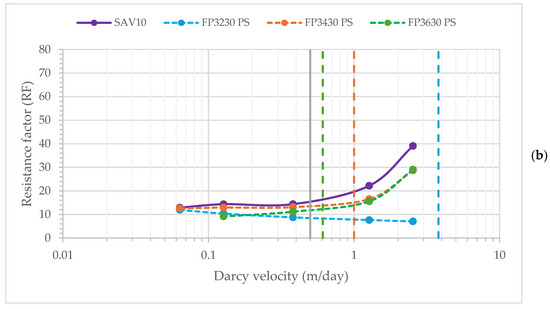
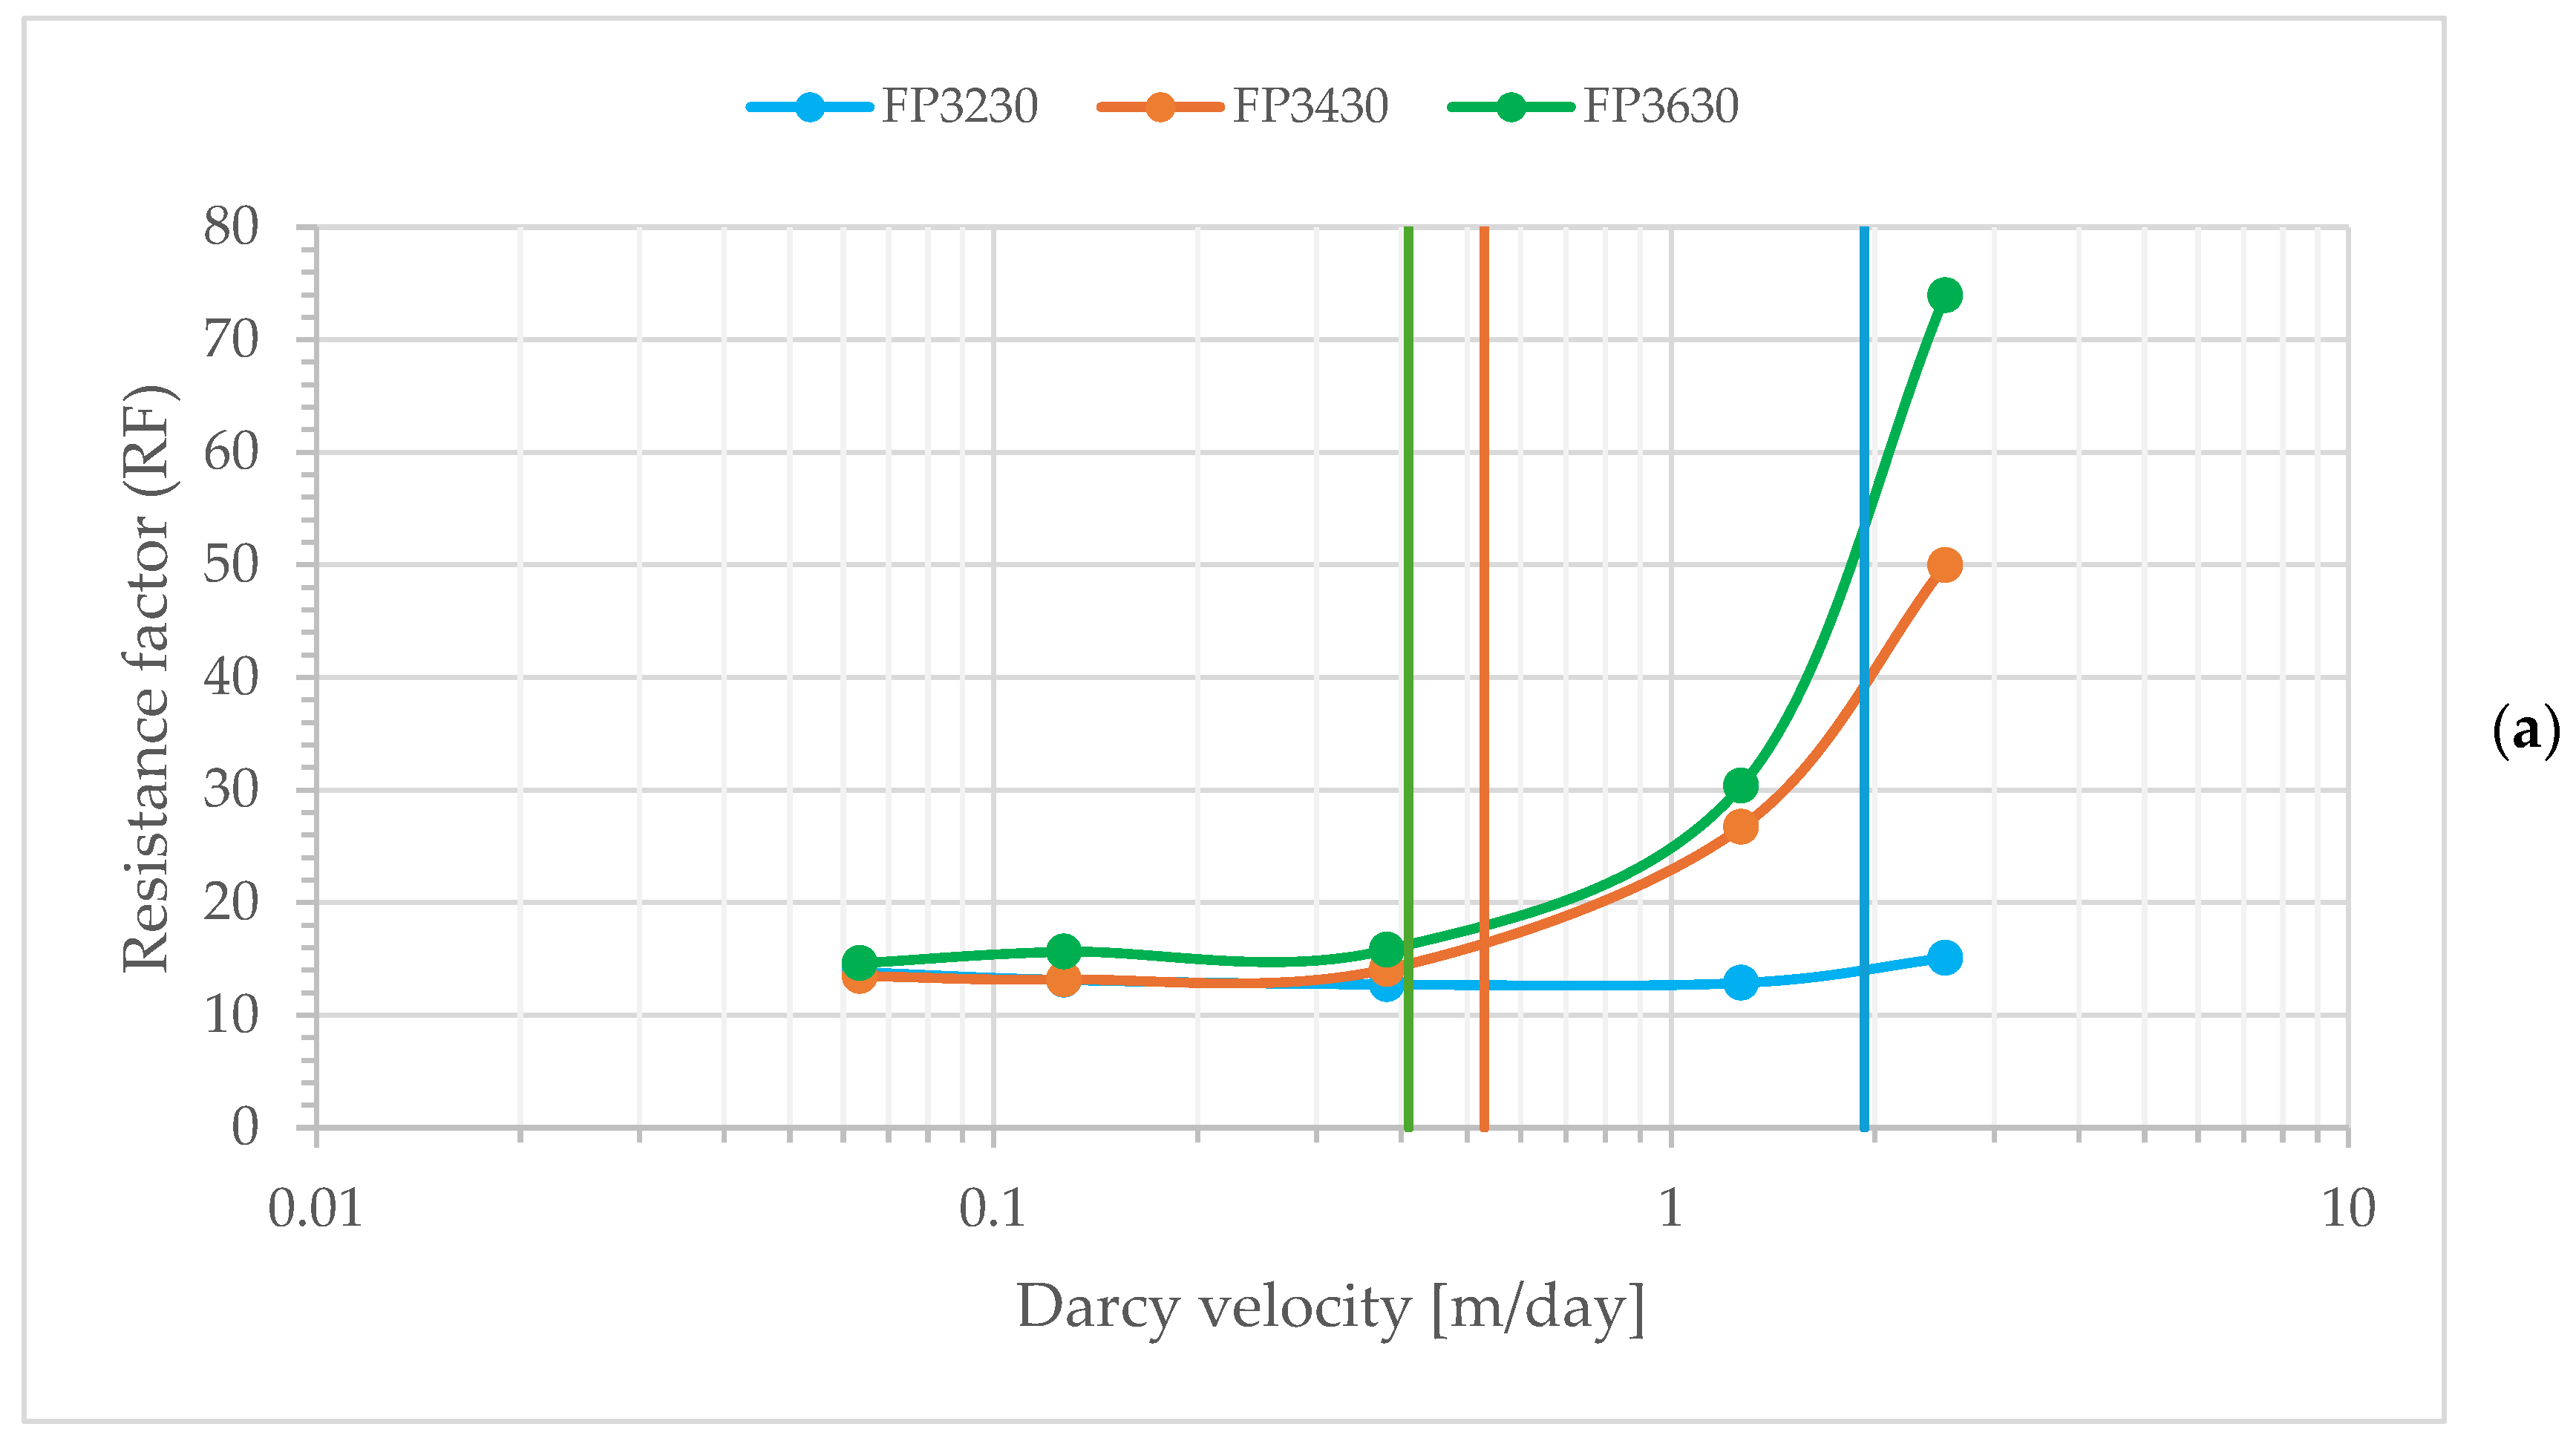
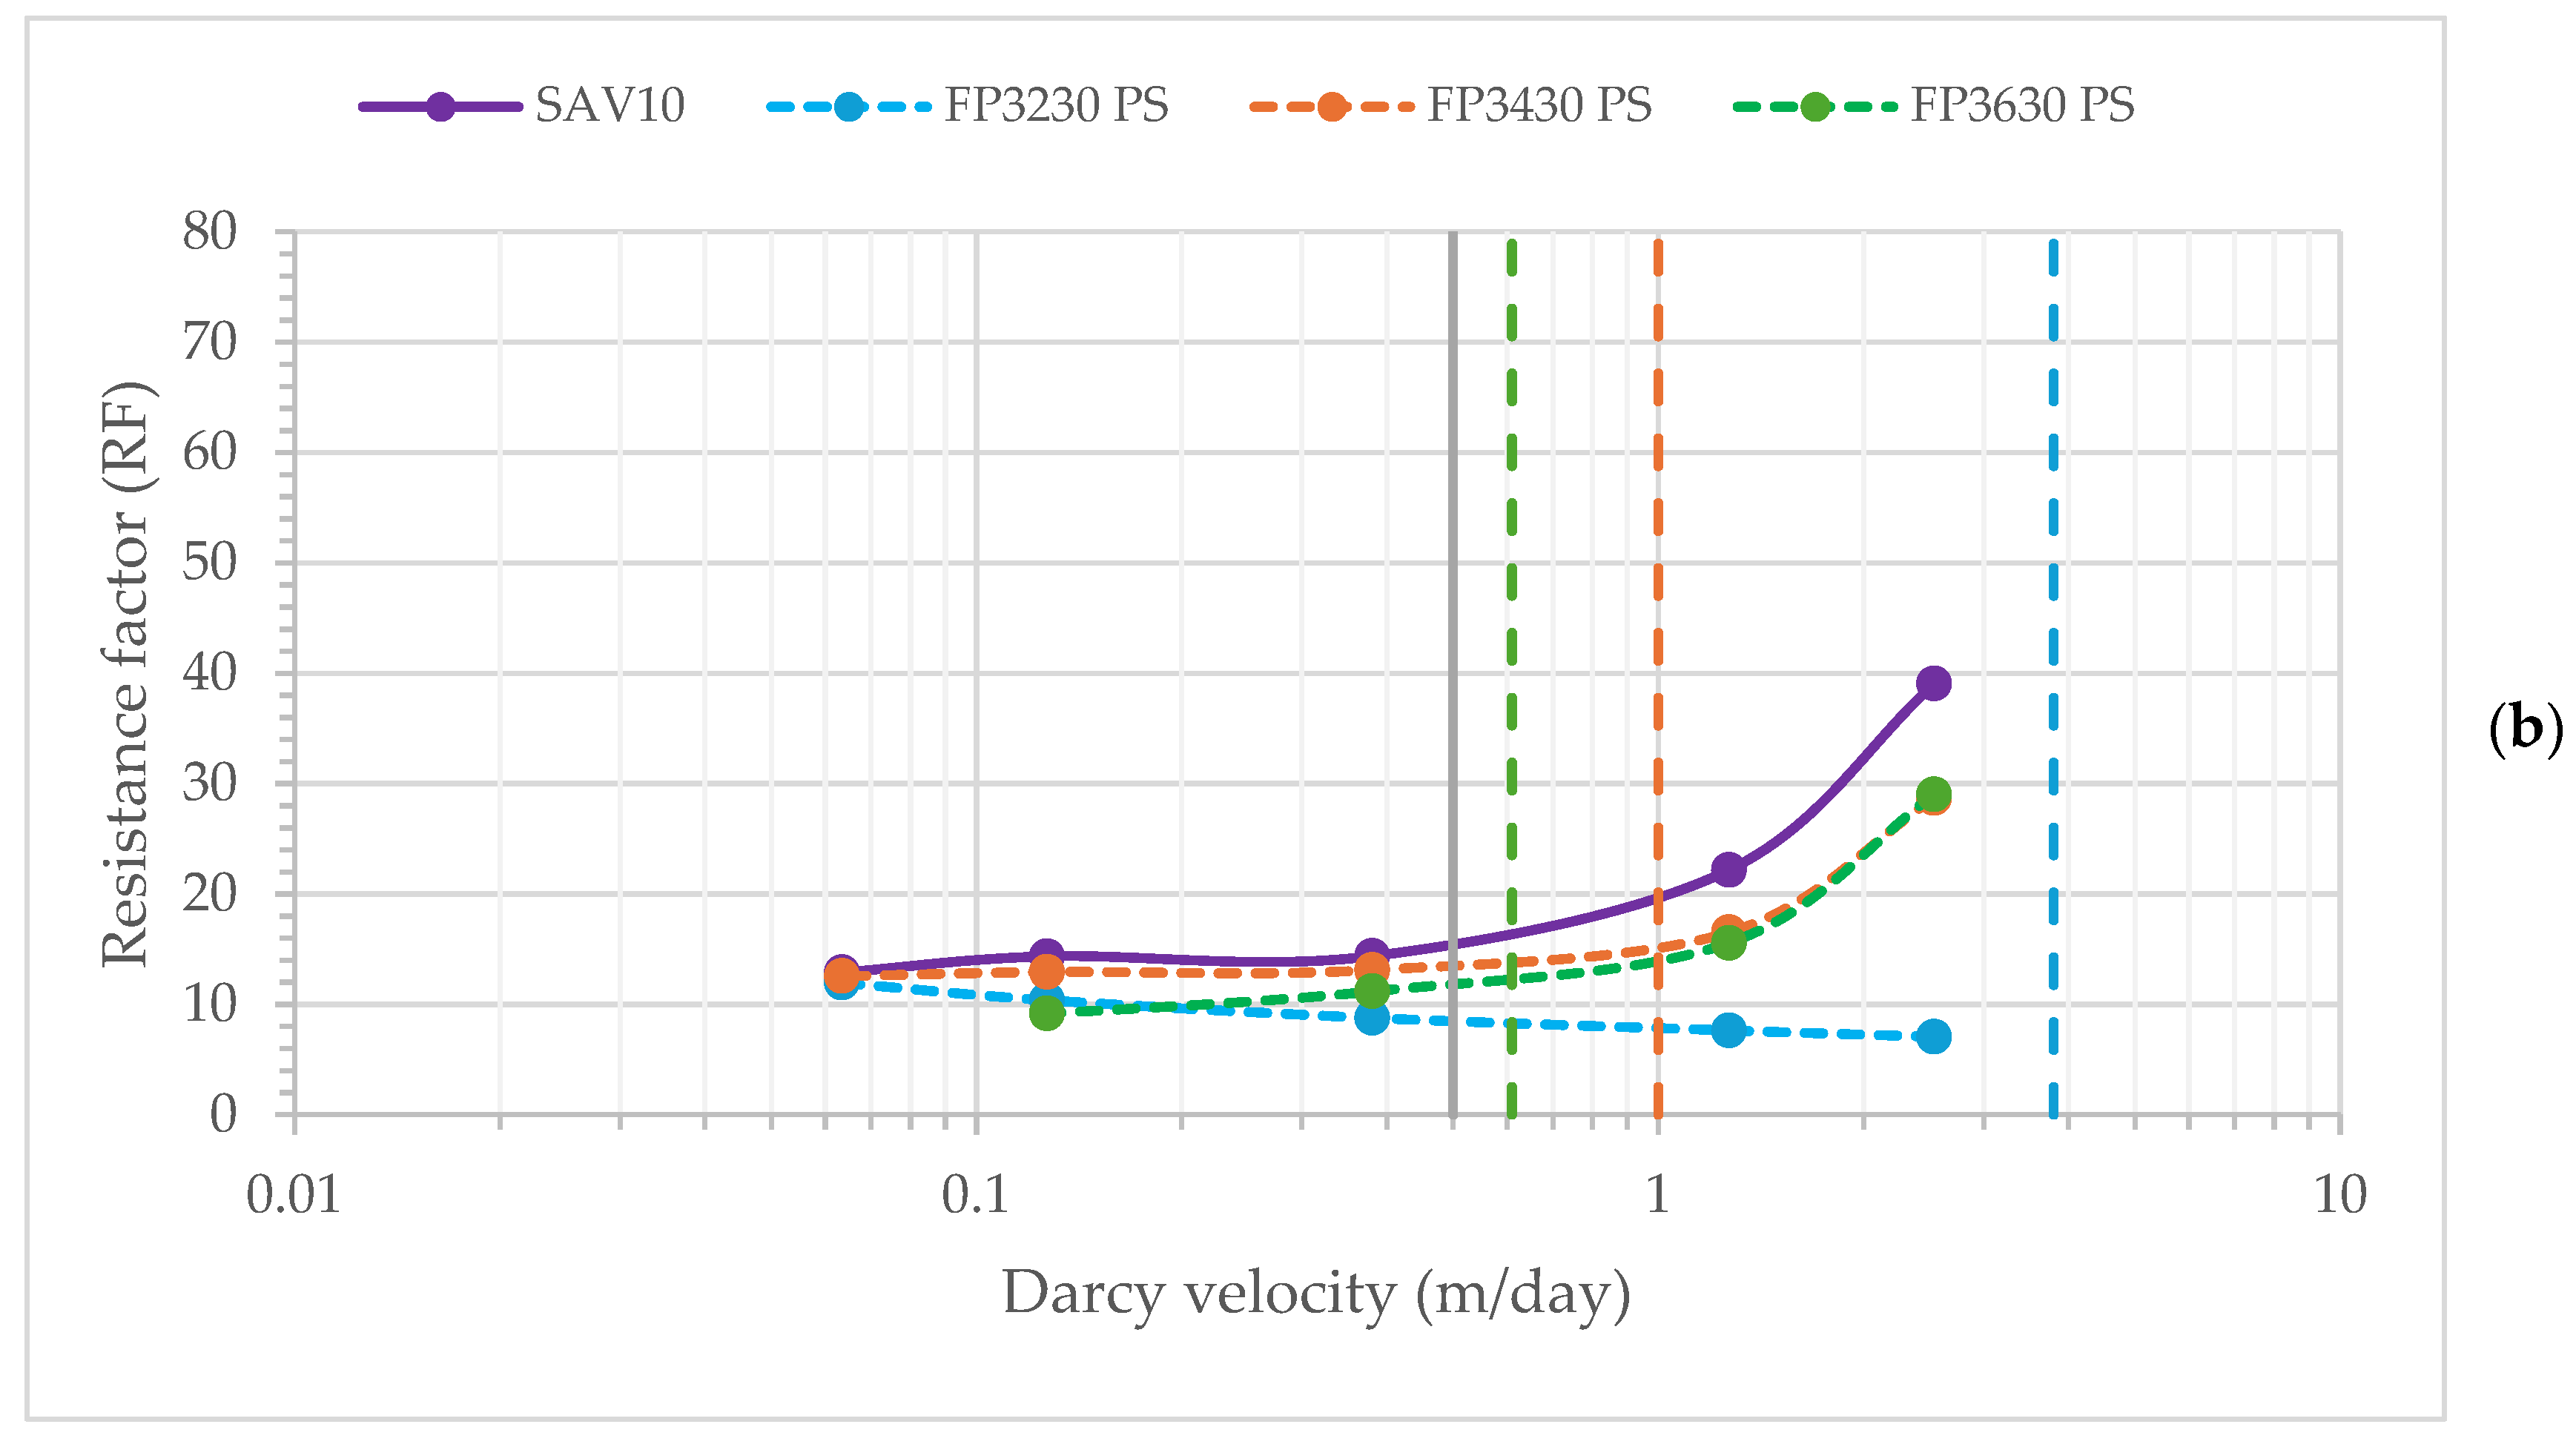
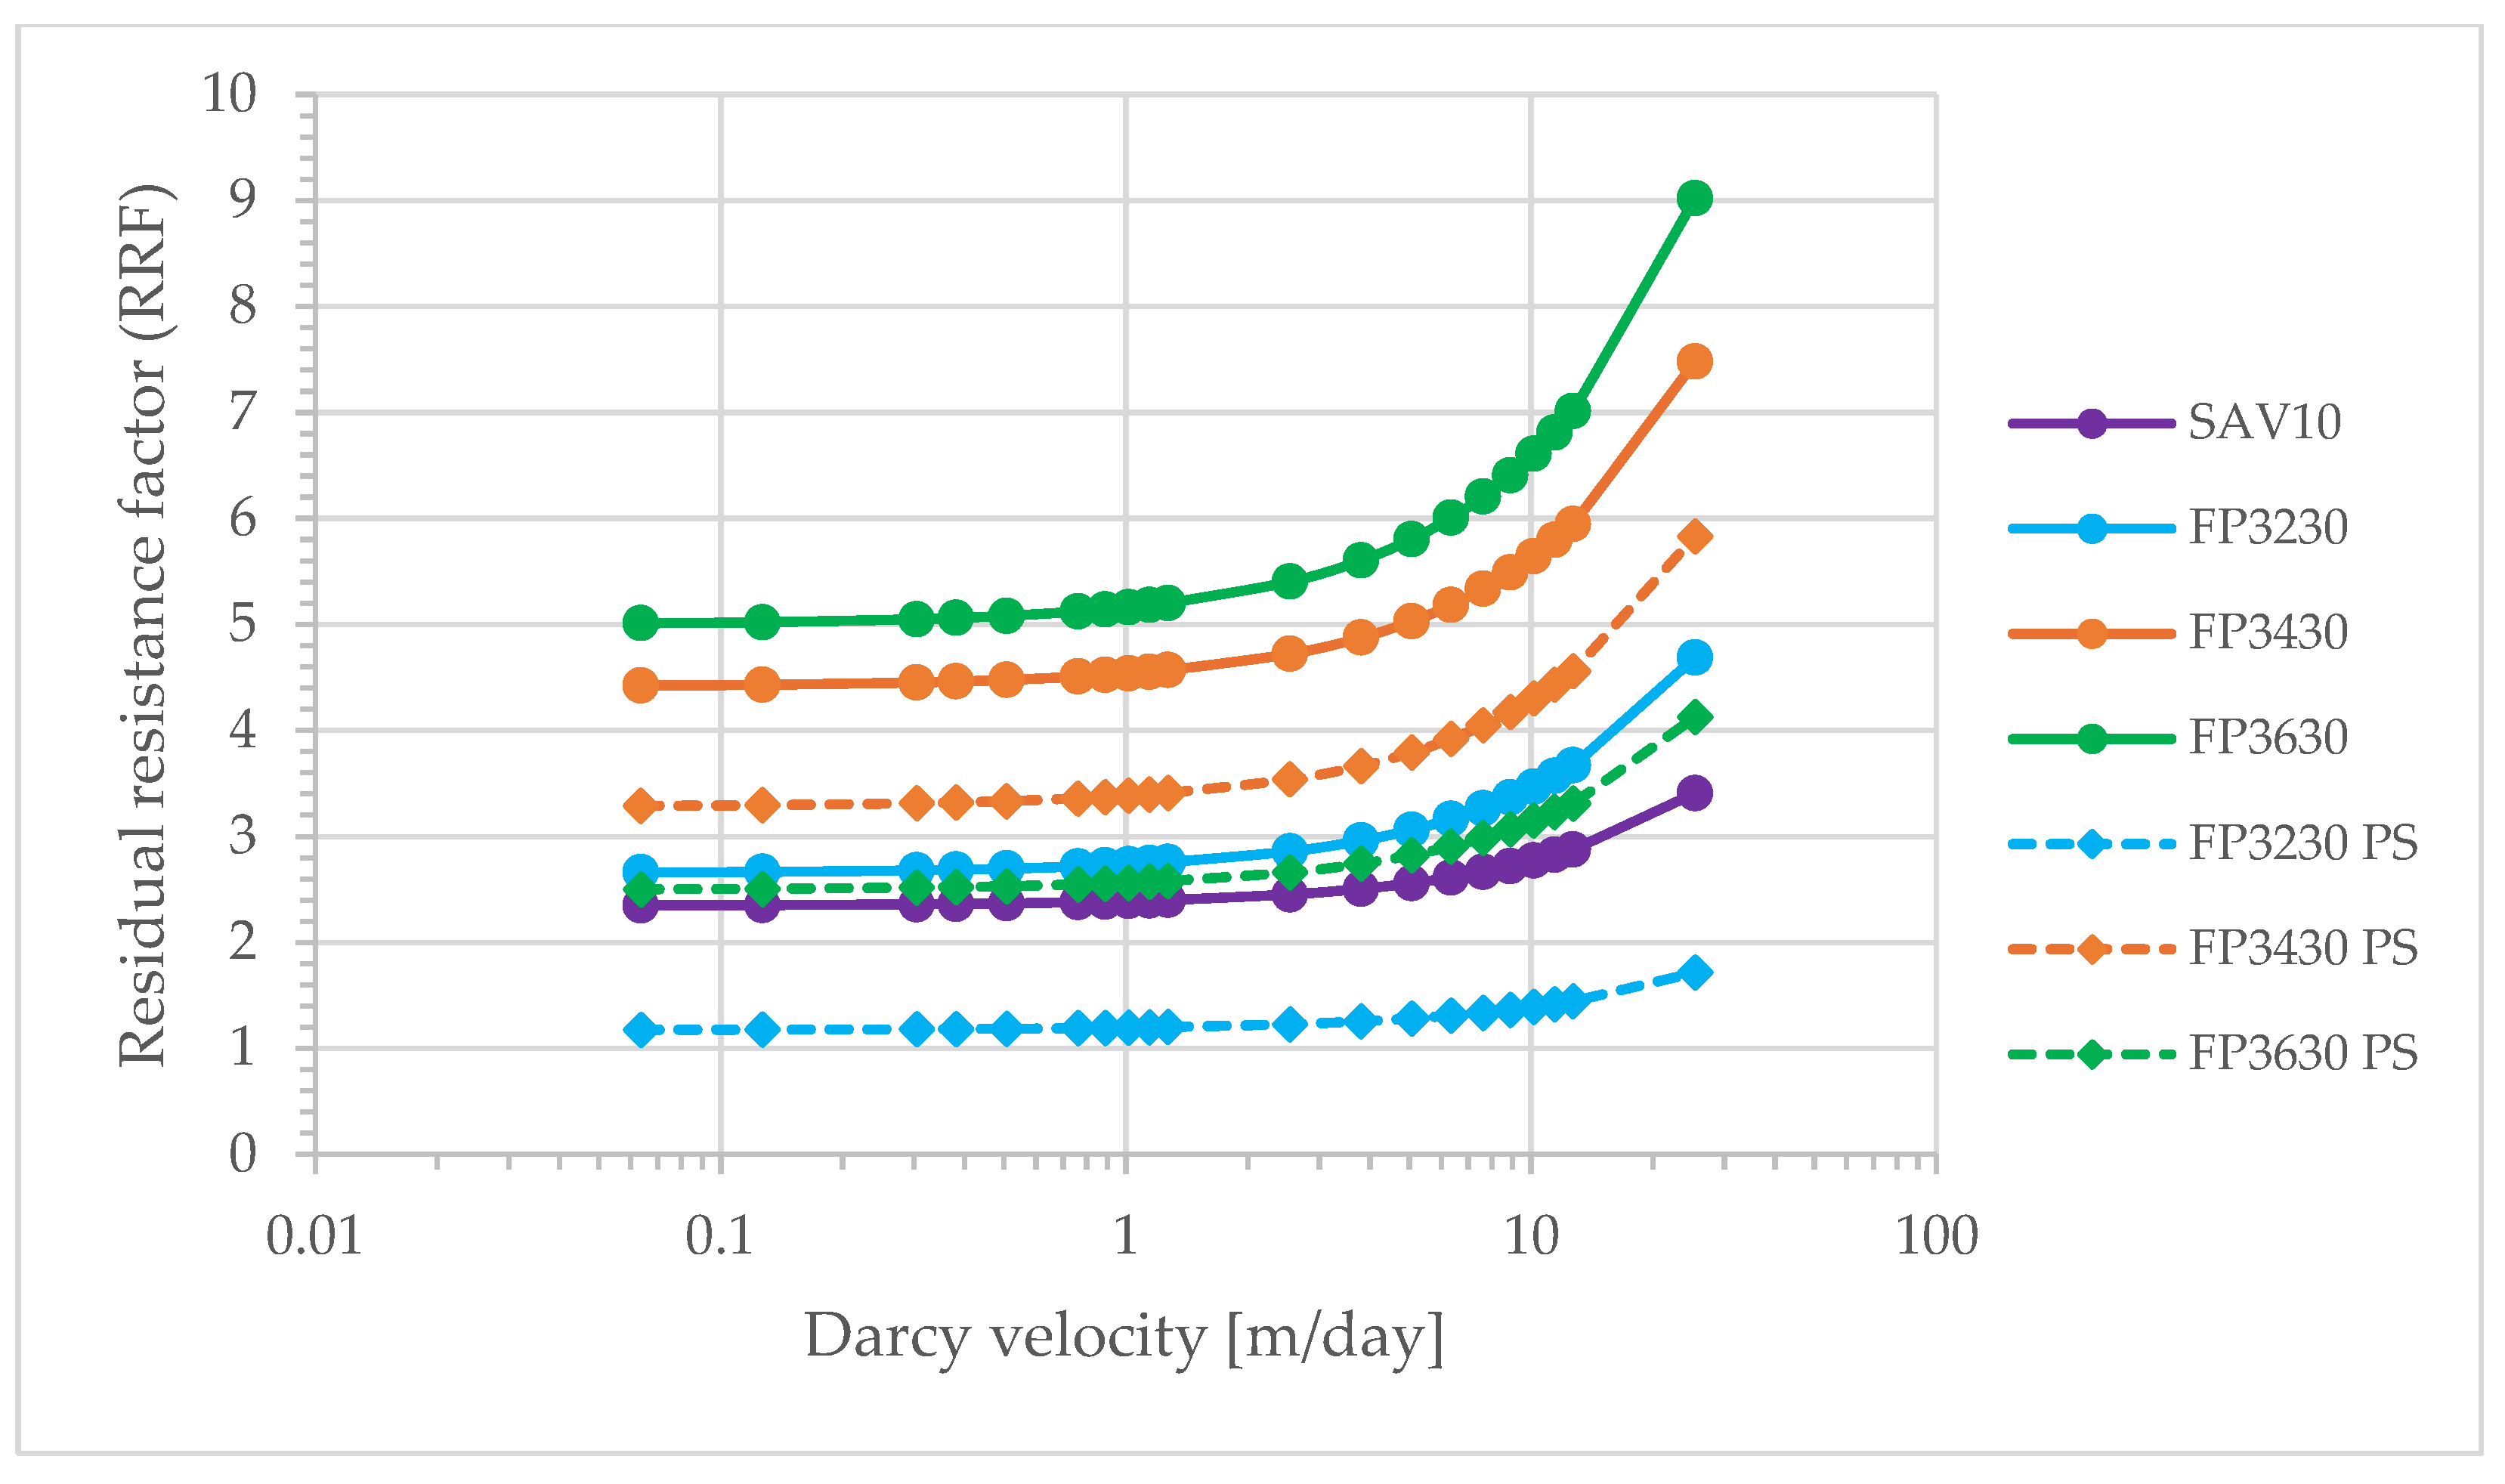
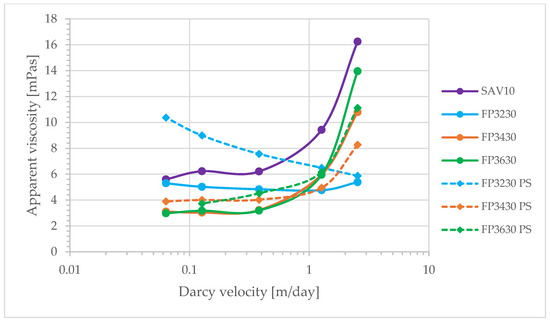
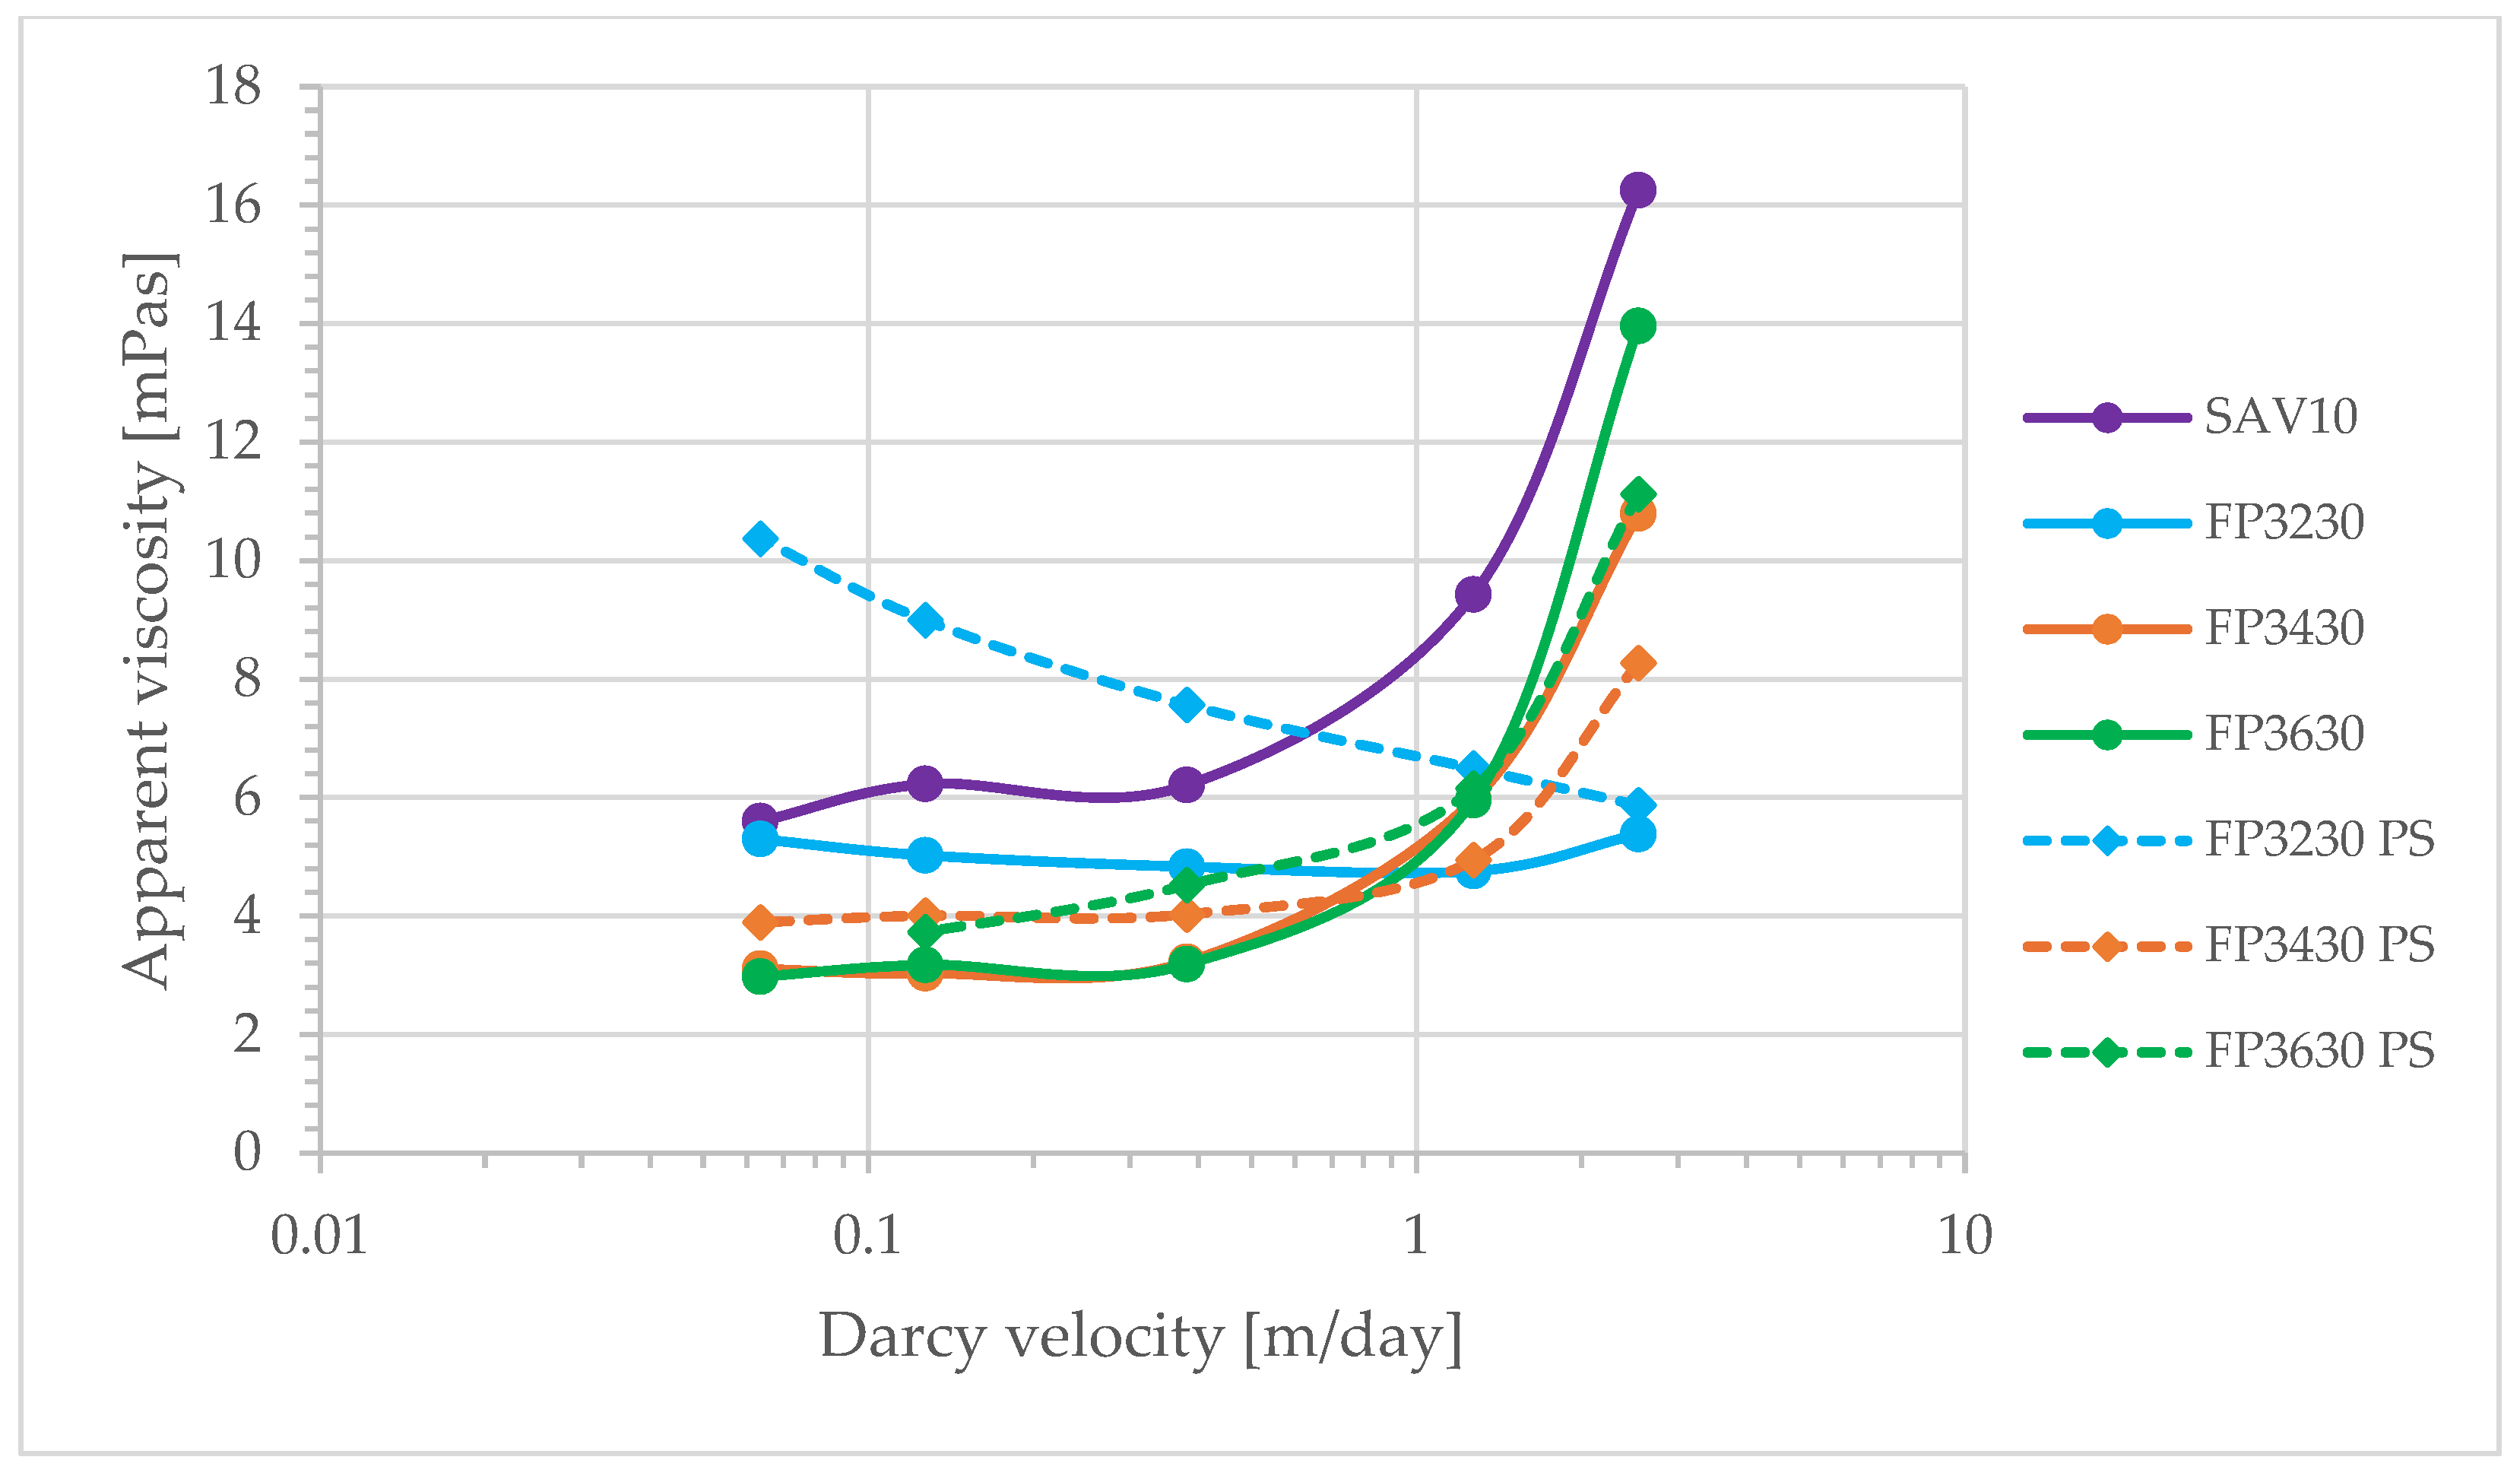
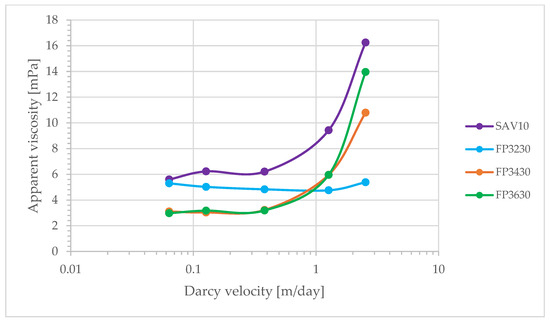
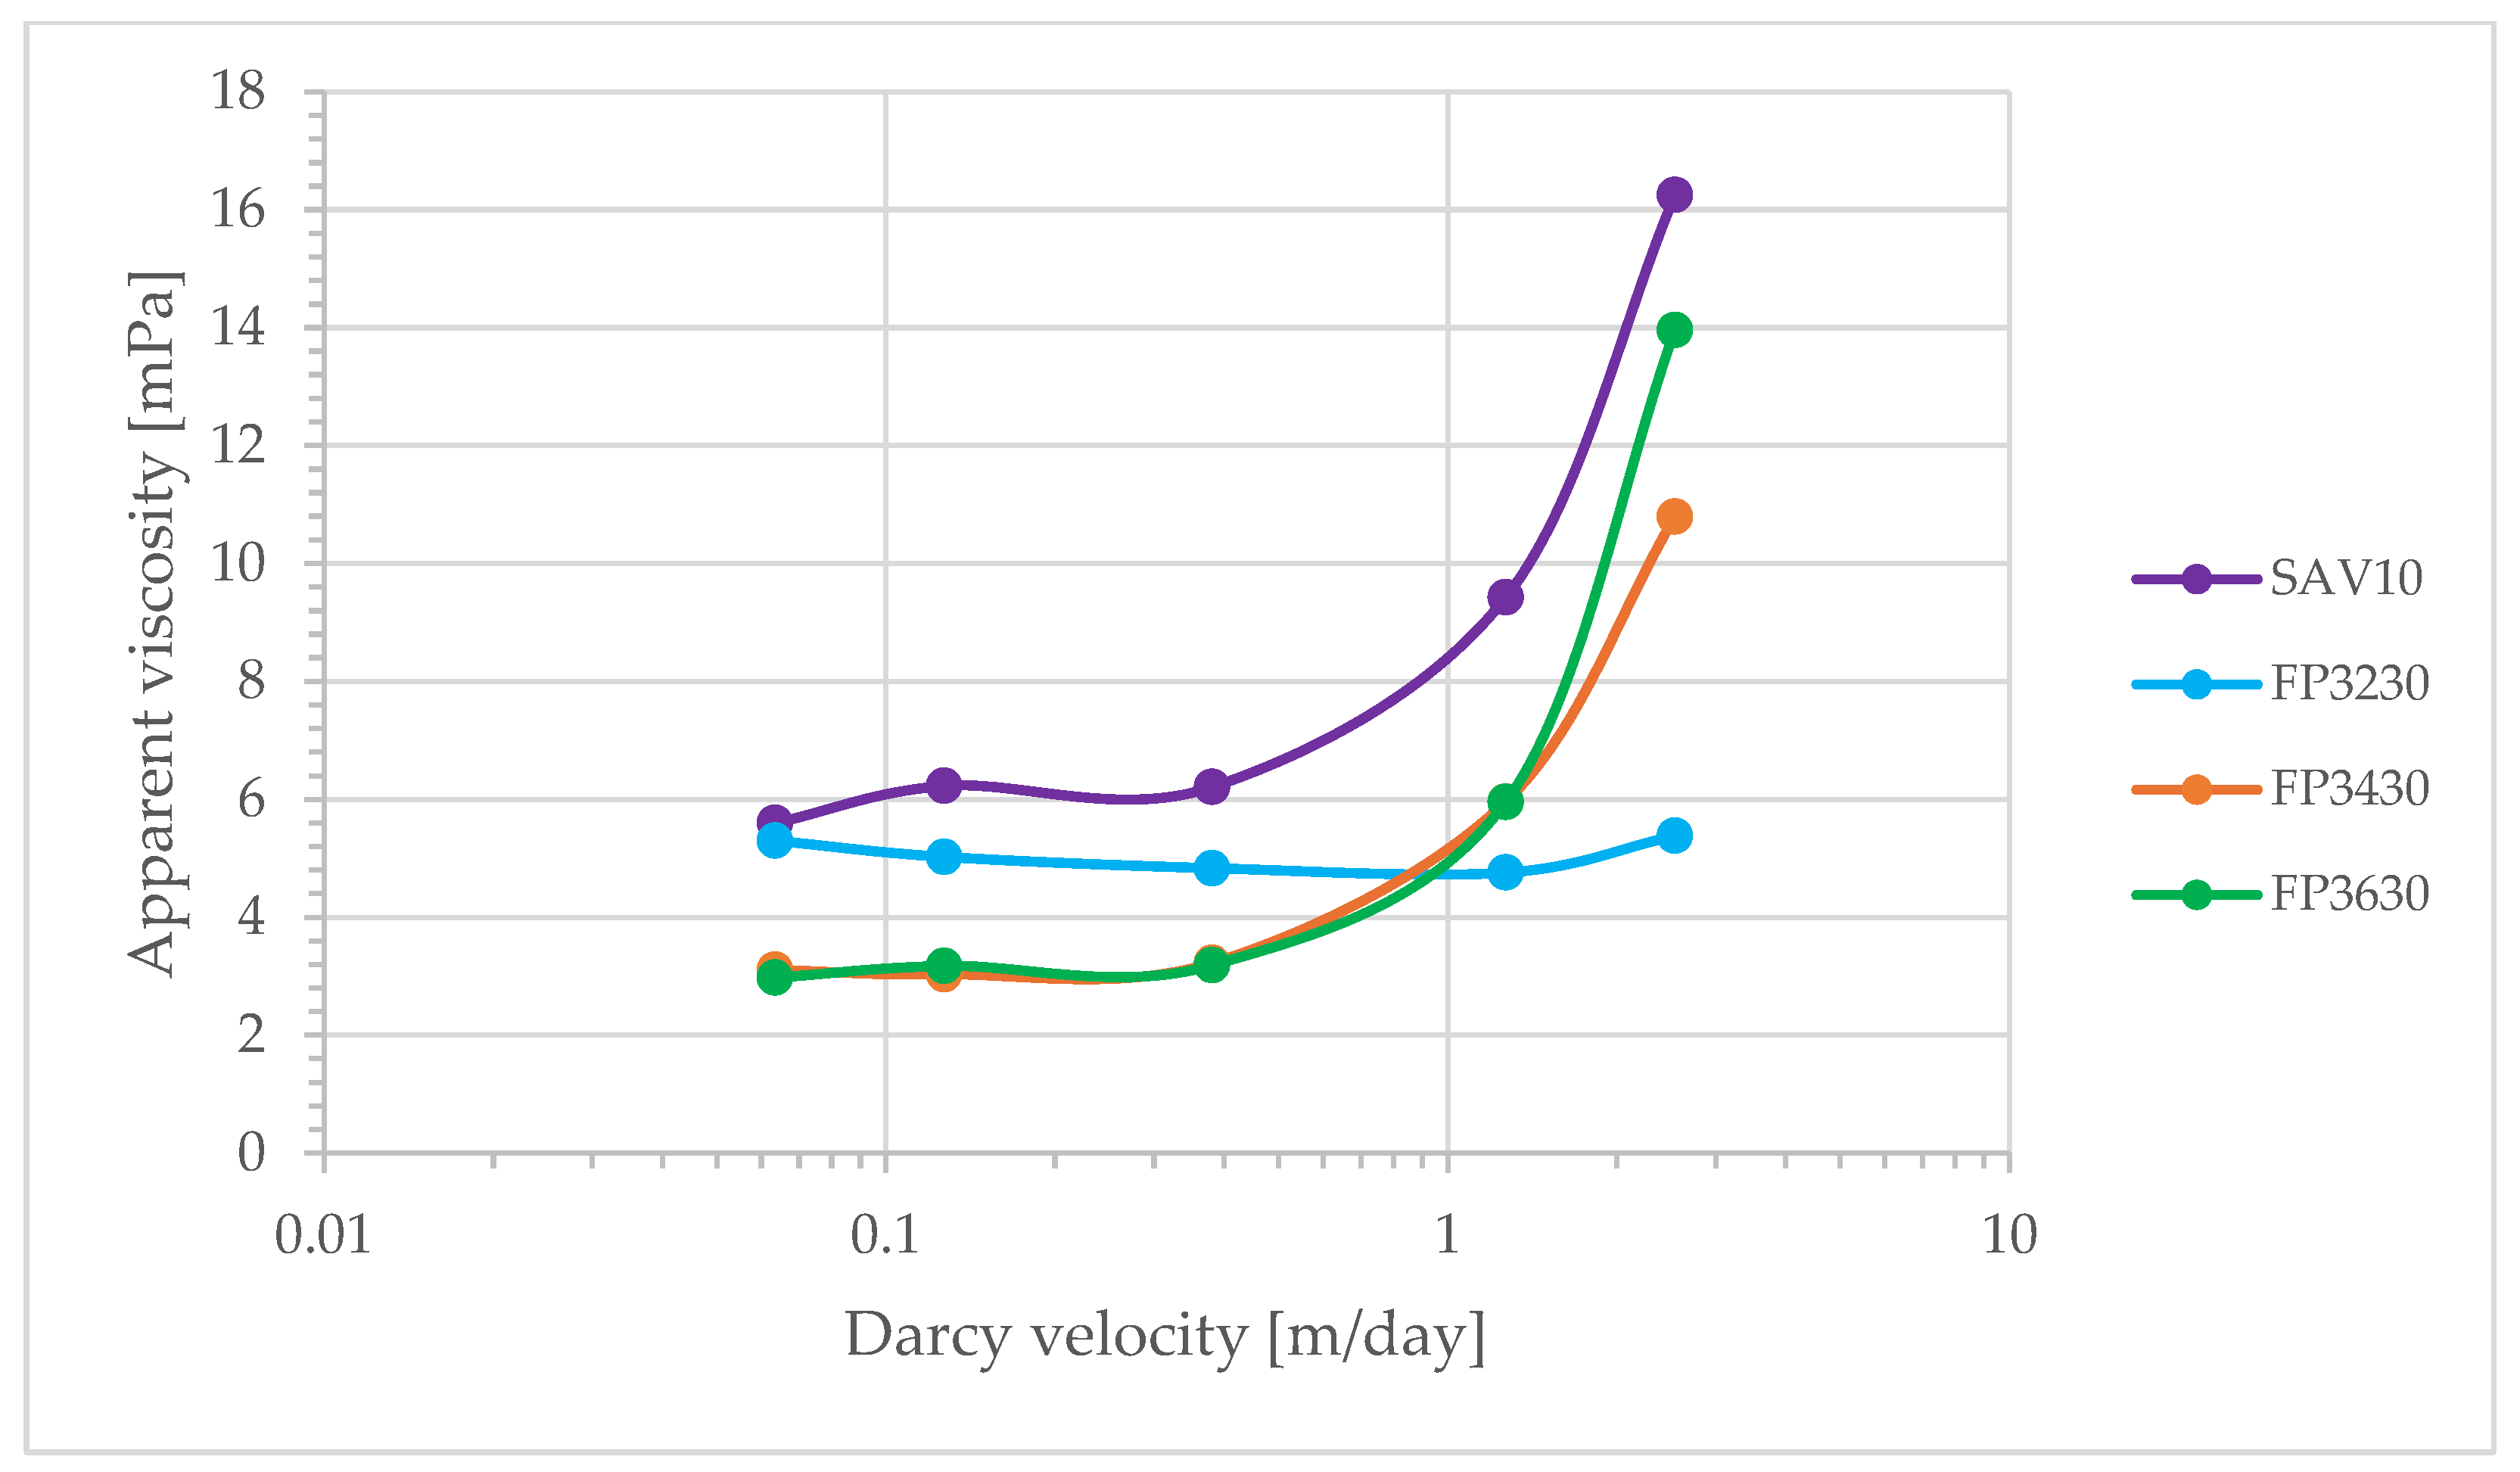

Disclaimer/Publisher’s Note: The statements, opinions and data contained in all publications are solely those of the individual author(s) and contributor(s) and not of MDPI and/or the editor(s). MDPI and/or the editor(s) disclaim responsibility for any injury to people or property resulting from any ideas, methods, instructions or products referred to in the content. |
© 2026 by the authors. Licensee MDPI, Basel, Switzerland. This article is an open access article distributed under the terms and conditions of the Creative Commons Attribution (CC BY) license.