Article

The Influence of Al2O3 on the Migration Behavior of Montmorillonite Colloids in Soil: Effects of pH, Ionic Strength, and Surfactants


1
School of Environment and Energy, South China University of Technology, Guangzhou 510006, China
2
The Key Lab of Pollution Control and Ecosystem Restoration in Industry Clusters, South China University of Technology, Ministry of Education, Guangzhou 510006, China
*
Author to whom correspondence should be addressed.
Colloids Interfaces 2026, 10(2), 31; https://doi.org/10.3390/colloids10020031

Submission received: 2 February 2026 / Revised: 28 March 2026 / Accepted: 2 April 2026 / Published: 20 April 2026

Abstract

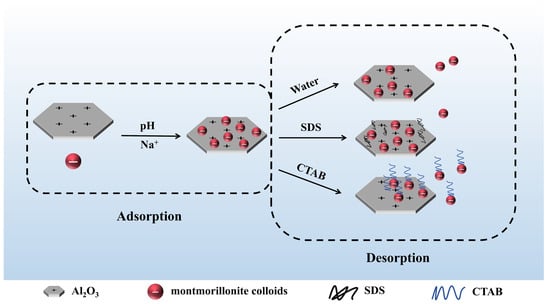
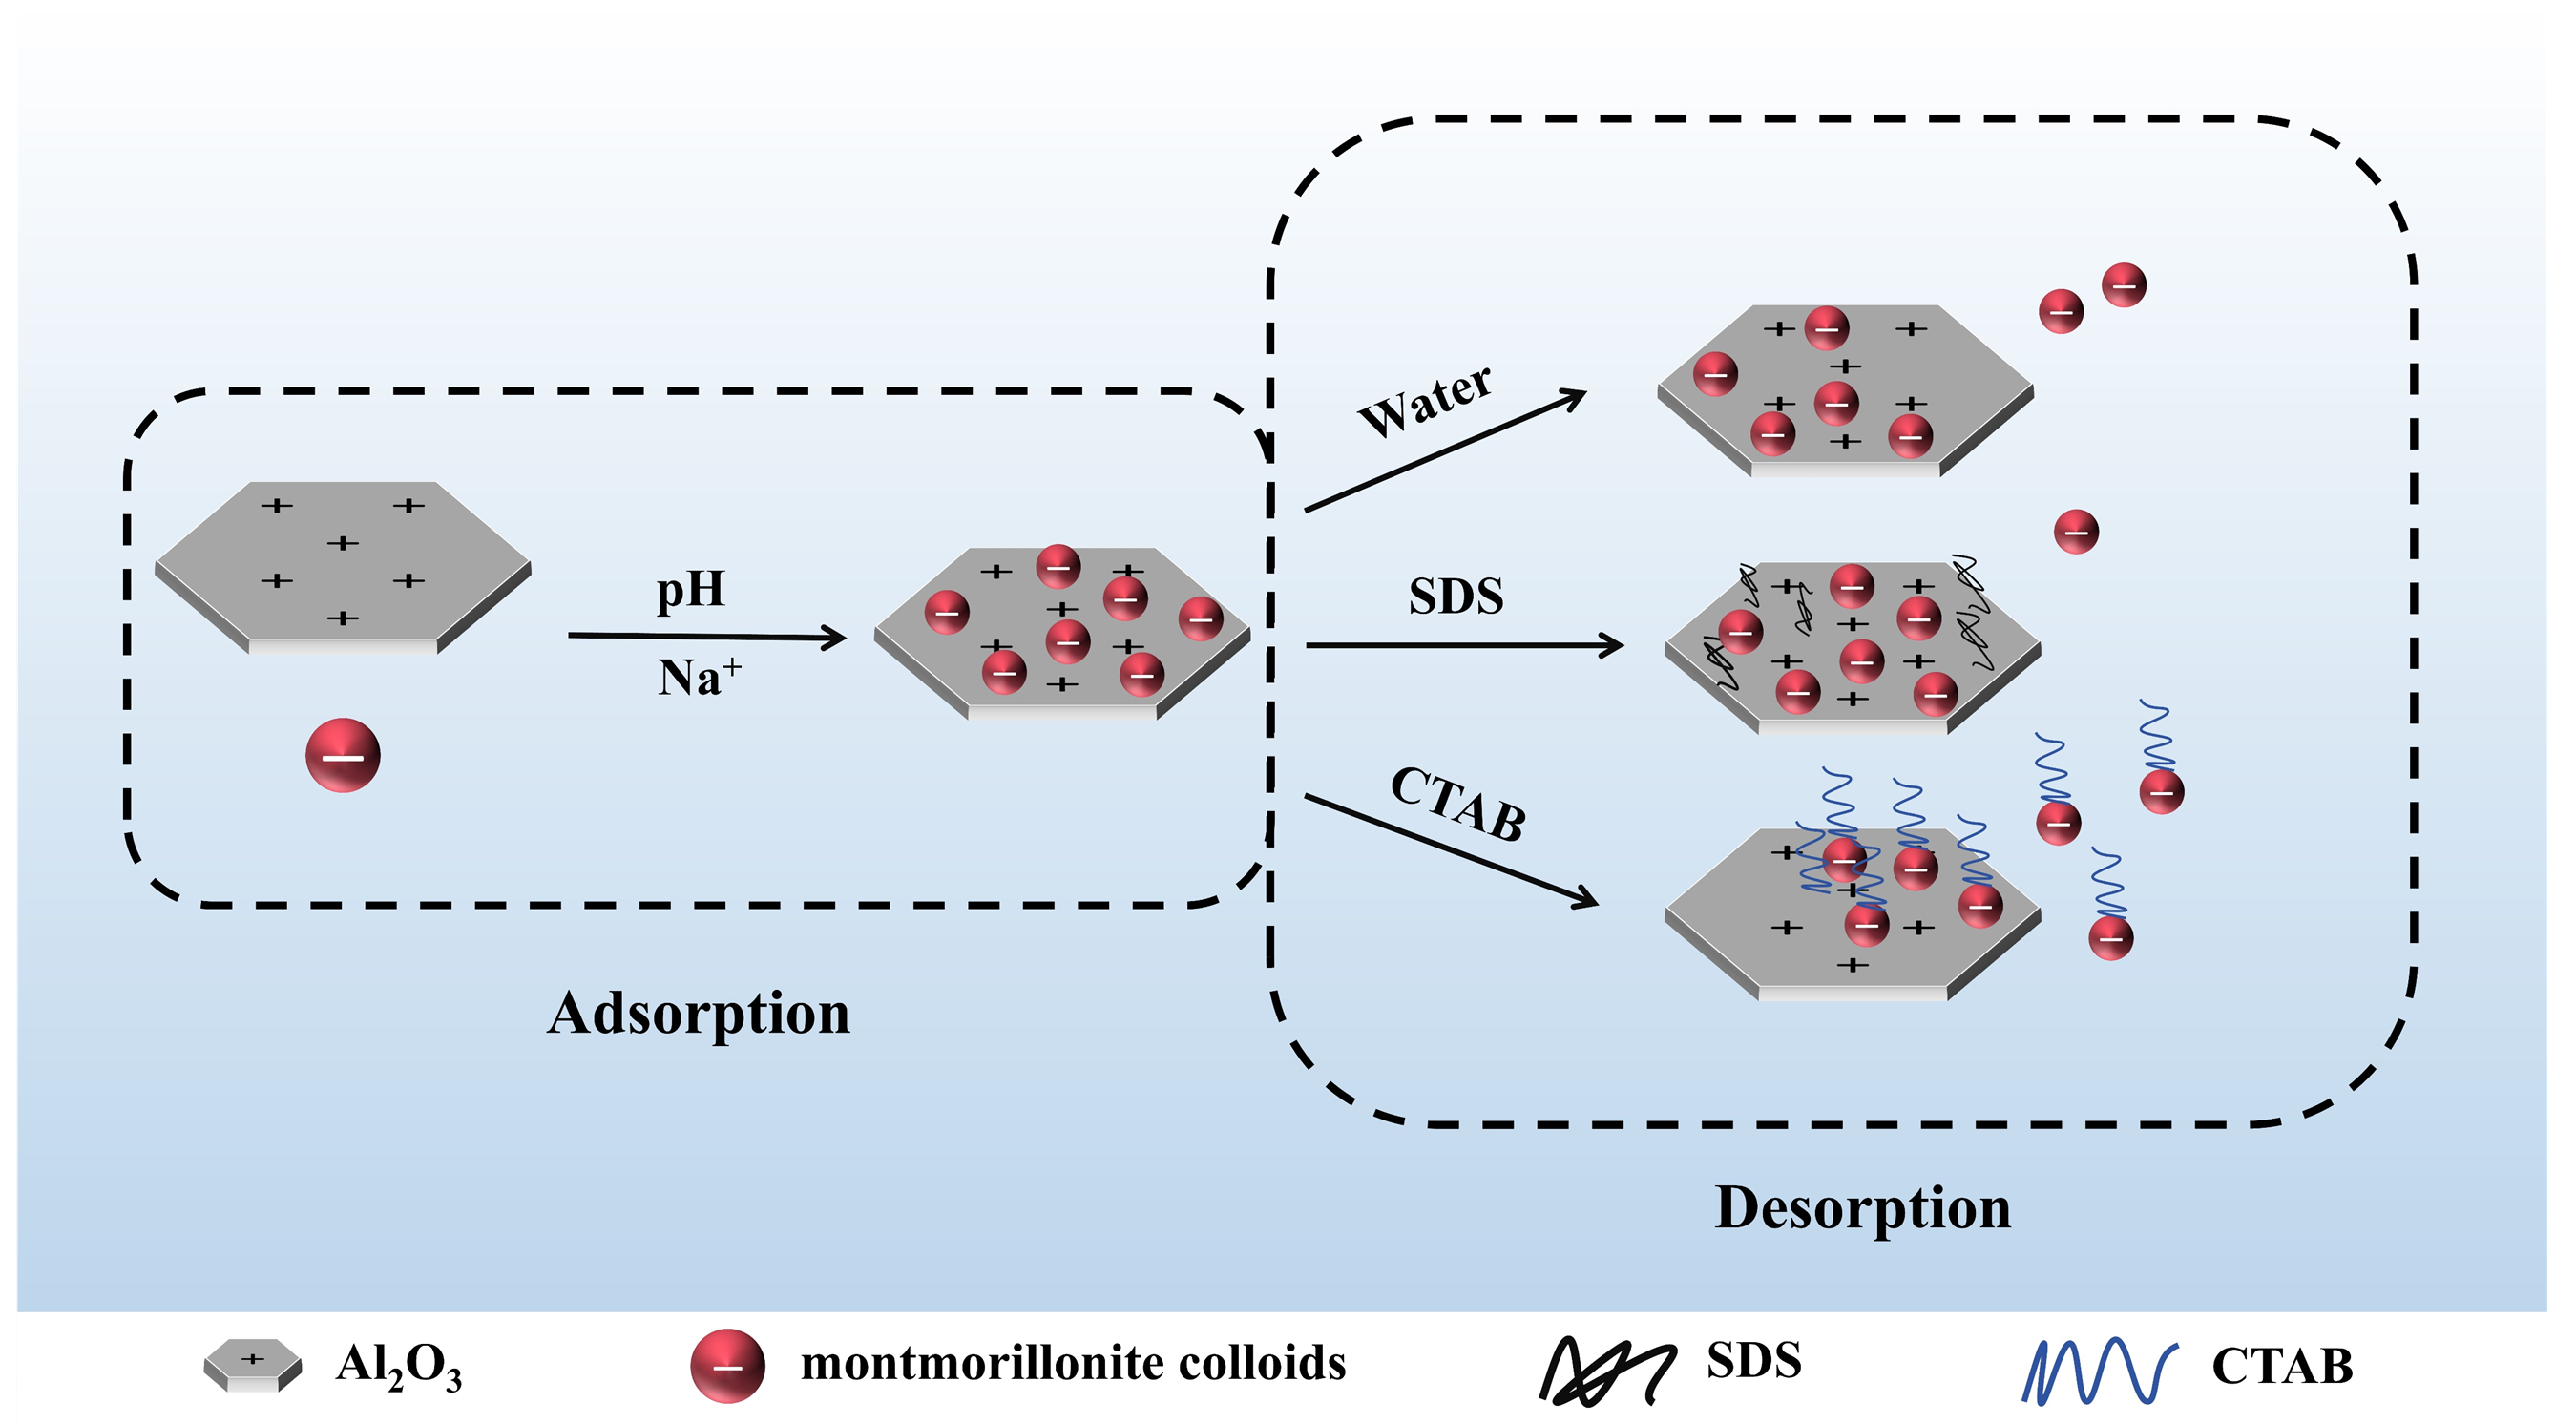
The colloidal particles present in natural soil and groundwater systems possess distinctive properties that enable them to migrate across solid surfaces, thereby exerting a significant influence on the distribution of pollutants. While the attachment of colloidal particles to solid surfaces has been extensively investigated, the mechanisms governing their detachment under varying hydrochemical conditions remain largely unexplored. The common interaction between montmorillonite colloids and solid medium (Al2O3) in soil affects the fate of pollutants such as heavy metals. In our study, Al2O3 was used as solid medium to observe the adsorption and desorption behavior of montmorillonite colloids. It was found that the adsorption capacity of Al2O3 to montmorillonite colloids could reach 4.71 mg g−1 (pH 5.0 and 10 mM NaCl concentration). X-ray photoelectron spectroscopy analysis shows that montmorillonite colloids react with the Al2O3 surface mainly through chemical groups with –O–Si bonds. Desorption experiments show that SDS drives desorption by neutralizing and reversing the surface charge of Al2O3, while CTAB directly modifies montmorillonite colloids and introduces steric hindrance to achieve desorption. These research data contribute to a comprehensive understanding of the migration behavior of montmorillonite colloids on solid phases.

Graphical Abstract

1. Introduction

Colloidal particles, including clay colloids, metal oxides, microplastics, bacteria and viruses, exist in large quantities in soil and groundwater systems. Most of these substances are attached to the surface of soil particles or suspended in pore water [1]. Due to their unique properties, such as small particles, large specific surface area and high reactivity, colloidal particles can effectively adsorb pollutants. Therefore, they become important carriers for the migration of heavy metals and organic pollutants in water and soil environments [2,3,4,5,6]. Many laboratory and field studies show that colloidal particles, as carriers of pollutant migration, can significantly promote or enhance the transport process, and increase the potential risk of pollutant diffusion to deeper soil layers and groundwater [7,8].
The movement of colloidal particles in the soil determines how pollutants diffuse underground. The adhesion and release of these particles play a super-critical role in their dispersion throughout the material. The adsorption phenomenon of colloids on solid surfaces has been recognized for decades [5,9,10,11,12,13,14,15,16,17,18,19,20,21]. Adsorption forces between colloids and the medium include electrostatic interactions [19,21,22,23,24] and coordination forces [21,22,25]. The adsorption of colloids onto solid-phase media is significantly influenced by environmental conditions such as ionic strength, pH, coexisting ions, and dissolved organic matter (DOM): ionic strength alters colloidal size, surface charge distribution between colloids and media, and surface functional groups [19,23,26]; pH modulates charge exchange between colloids and surfaces, ionization states of functional groups (e.g., carboxyl, hydroxyl), and dissolved organic matter alters the surface properties of both medium and colloids [18,20,27]; coexisting ions influence colloidal surface charge, functional group coordination bridging, and colloidal aggregation states [19,26,28]; DOM modulates colloidal adsorption behavior on medium surfaces by altering surface charge states, functional group bridging capacity, and steric hindrance effects [23,26,28], thereby influencing colloidal adsorption processes and subsequently affecting colloidal migration within the medium. However, quantitative characterization of colloidal adsorption remains limited, with adsorption capacities on solid surfaces measured only in a handful of systems, such as ferrihydrite colloids and graphene oxide nanoparticles [21,29,30].
There is not much research on the separation of colloidal particles from solid surfaces. Some researchers have found that the release of colloids may occur at the same time as their attachment. If factors such as ionic strength and fluid flow change, or other ions are added to the system, the colloids may desorb [31,32,33]. This may be because the electrostatic force between colloids and solid surface changes when the environmental conditions alter [32,34,35]. In addition, there is little quantitative analysis on desorption process.
Those small particles in the soil that are not from living things are mainly composed of aluminosilicate clay minerals. Montmorillonite is a very important example of these soil colloids, and its surface is always negatively charged. This feature plays a key role in the movement, chemical changes and reactivity of heavy metal cations and radioisotopes [36,37]. Aluminum oxide is another important mineral component in soil [38,39], and its isoelectric point (pHPZC) is generally around 9.0 [40,41]. Therefore, under the common soil pH conditions from acidic to neutral, the surface of aluminum oxide will be positively charged, which makes it a good adsorbent to catch those negatively charged nanoparticles.
Previous studies on the migration of montmorillonite colloids have primarily focused on column experiments to investigate migration behavior in porous media. However, data on adsorption and desorption resulting from interactions between the colloids and solid surfaces under various conditions remain limited. In this investigation, montmorillonite colloid is the adsorbed substance, and Al2O3 is the material responsible for adsorbing it. Through batch adsorption and colloidal desorption experiments, we quantitatively investigate the adsorption behavior of montmorillonite colloids on the Al2O3 solid phase under varying pH and ionic strength (IS) conditions. as well as the desorption behavior of montmorillonite colloids from the solid phase under varying hydrodynamic conditions using deionized water and common surfactants (SDS, CTAB). This aims to elucidate the patterns and mechanisms governing the migration behavior of positively charged soil mineral Al2O3 on negatively charged montmorillonite colloids, thereby supplementing quantitative data and theoretical foundations for studying colloid migration in soil.

2. Materials and Methods

2.1. Preparation of Colloidal Stock Suspension

Montmorillonite colloids (Montmorillonite K-10, sodium-based, Shanghai Maclin Biochemical Co., Ltd., Shanghai, China) were prepared according to the method of Chotpantarat and Kiatvarangkul [42], with modifications based on the treatment of montmorillonite colloids suspension described by Zhang et al. [43]. Specifically, 10.0 g of montmorillonite K-10 powder was accurately weighed and dissolved in 1000 mL of deionized water (conductivity 10~13 MΩ cm). The mixture was thoroughly stirred for dispersion and subjected to ultrasonication in an ultrasonic water bath for 1 h. Subsequently, montmorillonite colloids with a particle size ≤1 μm were separated via a 24 h gravitational settling method (pH = 9.50). The concentration of the montmorillonite colloids suspension, quantified by freeze-drying followed by mass difference analysis, was 2.35 g L−1. To isolate montmorillonite colloids particles that remained stable under centrifugation, the prepared suspension was subjected to centrifugation at 10,000 rpm for 30 min. The stable particles residing in the supernatant were then collected. To avoid the influence of conductivity on montmorillonite colloids stability, the stock suspension was dialyzed against ultrapure water (conductivity 18.2 MΩ cm) using a 3500 Da molecular weight cut-off dialysis bag at room temperature (25 ± 1 °C) for 2 days. This ensured the dialysate conductivity approached that of pure water (<5 μS cm−1). It was verified that dialysis did not alter the particle size or surface charge (zeta potential) of montmorillonite colloids. The dialyzed suspension was collected as the montmorillonite colloids stock suspension and stored at 4 °C for later use.

2.2. Concentration Analysis

In this paper, the concentration of montmorillonite colloids was determined using two methods. The original method is called the dry weight technique. When using this method, we dry a certain amount (50 to 100 mL) of colloidal suspension using an oven or vacuum freezer. The increase in weight corresponds to the dry quality of montmorillonite colloids in the suspension, meaning that we can calculate their concentration. This method is effective for colloidal suspensions with a concentration of 100 mg L−1 or more. However, when dealing with colloids with low concentration, it produces significant errors. Therefore, in this study, we adopted the method used by Zhang and Li [43,44] to measure the concentration of montmorillonite colloids. We used ICP−OES instrument (ICAP 7200 Duo, Thermo Fisher Scientific, Waltham, MA, USA) to analyze content of aluminum (Al), which is a key element, in montmorillonite colloids with different concentrations (1, 5, 10, 20, 40, 60, 100 mg L−1), so as to establish the relationship between them. Before analysis, we acidified the sample with 2% nitric acid (HNO3) and treated it with a microwave digester for 1 h, then measured the aluminum concentration in the sample (Figure S1). The real concentration was calculated according to the aluminum concentration detected in the dialysate of montmorillonite colloids.
The linear relationship between montmorillonite colloids concentration (Cmontmorillonite colloids) and Al concentration (CAl) is expressed as
C m o n t m o r i l l o n i t e   c o l l o i d s = 12.40773 C A l + 0.62818   R 2 = 0.99943
By measuring the aluminum concentration in the montmorillonite colloids dialysate, its concentration was calculated to be approximately 30 mg L−1. The dialysate was diluted to 25 mg L−1 for use in subsequent experiments.

2.3. Characterization of Montmorillonite Colloids, Al2O3 and Montmorillonite Colloids Absorbed on Al2O3

2.3.1. XRD, TEM, FTIR, SEM-EDS

The solid montmorillonite colloids samples were characterized by X-ray diffraction (XRD; Bruker D8 Advance, Bruker AXS GmbH, Karlsruhe, Germany) for the composition of mineral phases, a Transmission Electron Microscope (TEM; JEM-2100F, JEOL, Tokyo, Japan) for morphological characterization of montmorillonite colloids, Fourier-transform infrared spectroscopy (FTIR; Nicolet iS10, Thermo Fisher Scientific, Waltham, MA, USA) for surface functional groups, and scanning electron microscopy with energy-dispersive X-ray spectroscopy (SEM-EDS; SEM4000, Guoyi Quantum Technology Co., Ltd., Hefei, China) for morphology and elemental analysis before and after Al2O3 adsorption. Detailed operational procedures are provided below.
XRD: We ground the purchased montmorillonite sample powder thoroughly and sieved it through a 100-mesh sieve. The resulting fine powder was then subjected to X-ray diffraction (XRD) analysis to evaluate its crystal structure and mineralogical composition. Test scanning parameters: a copper (Cu) radiation source with operational parameters set at 40 kV voltage and 40 mA current. The scanning range was between 5 and 90°, employing continuous scanning with incremental steps of 0.02° and a scan rate of 0.1 s per step. The scanned results were compared using MDI Jade 6.0 software and the imported ICCD PDF#13-0135 card to identify whether the mineral phase composition was montmorillonite.
TEM: The appropriately prepared montmorillonite colloids solution was freeze-dried. The resulting sample was then dispersed in anhydrous ethanol via ultrasonication. A small amount of this suspension was dropped onto a copper grid and dried under an infrared lamp. Subsequently, transmission electron microscopy (TEM) was acquired to observe the microstructure of the montmorillonite colloids.
FTIR: Fourier-transform infrared spectroscopy was utilized to delve into the vibrational nuances of surface functional groups present on montmorillonite colloids. The specific procedure is as follows: First, 20 mL of the prepared initial montmorillonite colloidal suspension was centrifuged at 8000 rpm for 30 min. The centrifuged sample was washed and freeze-dried. Then, the freeze-dried solid sample was mixed with KBr in a 1:100 ratio and ground uniformly in a mortar. The mixture was then pressed into KBr pellets using a tablet press (10 MPa). Finally, the prepared samples were placed in an infrared spectrometer and scanned repeatedly 64 times in transmission mode. The resolution was set to 2 cm−1, with a scanning range of 400–4000 cm−1.
SEM-EDS: (1) The SEM characterization procedure for montmorillonite colloids is as follows: Take 20 mL of the prepared montmorillonite colloids suspension, freeze-dry it, then add an appropriate amount of alcohol before placing it in an ultrasonic disperser for 10 min. Subsequently, the suspension is spotted onto a conductive silica gel sheet and dried under an infrared lamp. The sample is then placed under vacuum conditions for platinum (Pt) sputtering to enhance conductivity, facilitating morphological observation. Scanning observation of the montmorillonite colloids morphology is performed by adjusting parameters such as current, voltage, focal length, brightness, and magnification, with corresponding images captured and saved.
(2) The SEM testing procedure for the morphology of montmorillonite colloids deposited on an aluminum oxide surface is as follows: Following adsorption experiments, the adsorbed aluminum oxide is dried under ambient conditions. The sample base is then adhered to a conductive silicone sheet. Subsequently, the morphology of the silica solid-phase surface is scanned and observed by adjusting parameters including current, voltage, focal length, brightness, and magnification, with corresponding images captured and stored.

2.3.2. Size and Zeta Potential Measurement

The mean hydrodynamic diameter and zeta potential of montmorillonite colloids are determined by dynamic light scattering (DLS; Zetasizer Nano ZS90, Malvern Panalytical Ltd., Malvern, UK) under varying pH levels and ionic strength (IS). The detailed operational procedure is as follows:
Particle Size Determination: Transfer 1~2 mL of montmorillonite colloids suspension under different pH conditions (with IS fixed at 10 mM NaCl) and different IS conditions (with pH fixed at 5.0) into a cuvette. Vortex for 5 s to ensure uniform dispersion of the colloidal particles, then measure the average hydrodynamic diameter (test each sample 10 times and take the average).
Zeta Potential Measurement: Transfer 0.775 mL of uniformly dispersed montmorillonite colloids suspension under different pH conditions (with IS fixed at 10 mM NaCl) and different IS conditions (with pH fixed at 5.0) into capillary zeta potential measurement cells. Measure the zeta potential of the montmorillonite colloids suspension at an ambient temperature of 25 °C (each sample tested five times, with each test result being the average of 10 data points).

2.3.3. ATR-FTIR

Attenuated Total Reflection Fourier-Transform Infrared Spectroscopy (ATR-FTIR; Thermo Fisher Scientific, Waltham, MA, USA) is used to characterize surface functional groups and interaction mechanisms in samples. Testing was performed using a Thermo Fisher iS50R infrared spectrometer equipped with a SMART iTX Attenuated Total Reflection (ATR) accessory (Thermo Fisher Scientific, Waltham, MA, USA). Test conditions were as follows: wavenumber range 4000~500 cm−1, resolution 4 cm−1, and a total of eight scans. All spectral data were acquired at room temperature. Prior to testing, the crystal was wiped with anhydrous ethanol, and a background spectrum was acquired. Appropriate amounts of the montmorillonite colloids–Al2O3 complexes (control sample) that had not undergone desorption treatment and the composite sample eluted with SDS and CTAB were respectively applied to uniformly cover the surface of the ATR crystal; after compaction, measurements were performed. After baseline correction, the obtained spectra were analyzed using OMNIC v8.2 software for peak identification and peak area integration. The analysis focused on changes in the peak intensity and position of the characteristic peaks of montmorillonite and surfactants to semi-quantitatively evaluate the degree of montmorillonite colloids desorption and the adsorption behavior of the surfactants.

2.4. Batch Sorption Experiments of Montmorillonite Colloids

To evaluate the adsorption capacity of Al2O3 toward montmorillonite colloids, batch adsorption experiments were conducted at ambient temperature (25 ± 2 °C). In the experiments, 25 mg of Al2O3 (99.9% α-Al2O3, 80 mesh, Zhu Yu New Materials Technology (Yangzhou) Co., Ltd., Yangzhou, China) was placed into a 15 mL centrifuge tube. Then, 10 mL of montmorillonite colloids colloidal suspension (25 mg L−1) was transferred into the tube. NaCl solutions of different concentrations (5, 10, 20 mM) were added, and the solution pH was titrated to target values of 4.0, 5.0, and 6.0 using 0.01 M HCl or NaOH for acidification or basification, respectively. Colloidal suspensions with the desired ionic strength were first prepared by adding appropriate amounts of NaCl. Immediately prior to the adsorption experiments, the pH of the suspensions was adjusted to the target value using HCl or NaOH. For adsorption kinetics experiments, tubes were shaken at 25 °C and 150 rpm for 1, 5, 10, 15, 20, 25, 30, 40, 50, 60 min, followed by centrifugation (4000 rpm, 10 min). After 1 h of shaking at 25 °C and 150 rpm, tubes were centrifuged. Experiments revealed that after centrifugation, Al2O3 was completely separated from the solution (blank tubes without added montmorillonite colloids showed zero absorbance in the supernatant), while the montmorillonite colloids colloid remained stable (no significant precipitation at the tube bottom or colloid adsorption on the tube walls). Thus, centrifugation effectively separated Al2O3 from the montmorillonite colloids. Upon completion of the centrifugation process, the absorbance of montmorillonite colloids in the supernatant obtained from the separation reaction was determined at a wavelength of 243 nm. This measurement was carried out using a UV-visible spectrophotometer (UV-2550, Shimadzu Corporation, Kyoto, Japan). Absorbance values were converted to concentrations based on the montmorillonite colloids standard curve (Figure S2), and the adsorption amount of Al2O3 onto montmorillonite colloids was calculated by mass difference.

2.5. Desorption of Montmorillonite Colloids from Al2O3 Surface

To investigate whether water and surfactants can desorb montmorillonite colloids adsorbed onto Al2O3 surfaces under different conditions, in the desorption experiments, after removing all supernatant, centrifuge tubes were sequentially loaded with 10 mL of deionized water containing specified concentrations of NaCl and pH buffers, followed by 0.14 mM SDS (sodium dodecyl sulfate, Guangzhou Ruishu Biotechnology Co., Ltd., Guangzhou, China) and 0.14 mM CTAB (cetyltrimethylammonium bromide, Shanghai Aladdin Biochemical Technology Co., Ltd., Shanghai, China) solutions. The desorption procedure was performed under conditions identical to the adsorption step: tubes were centrifuged at 25 °C and 150 rpm for one hour prior to re-centrifugation. The mass concentration of desorbed colloids in the supernatant was measured as described in Section 2.4.

2.6. DLVO Calculation

Based on the DLVO theory, we calculated the total interaction energy of montmorillonite colloids when they approach an alumina surface under various environmental conditions, as well as the Hamaker constant between montmorillonite colloids and aluminum oxide. The total interaction energy between montmorillonite colloids and the aluminum oxide surface can be calculated as the sum of the van der Waals forces and the electrostatic interactions between the two surfaces. The calculation formula is as follows [45,46,47]:
V T o t a l ( h ) = V V D W ( h ) + V E D L ( h )
V V D W ( h ) = A m w a r 6 h ( 1 + 14 h λ )
V E D L ( h ) = π r ε 0 ε r { 2 φ 1 φ 2 ln [ 1 + e x p ( κ h ) 1 e x p ( κ h ) ] + ( φ 1 2 + φ 2 2 ) ln [ 1 e x p ( 2 κ h ) ] }
In the formula, VTotal(h) is the total interaction energy, VVDW(h) is the van der Waals attractive energy, and VEDL(h) is the electric double-layer repulsive energy. Amwa is the Hamaker constant for materials “m” and “a” interacting across medium “w”, which can be determined from the Hamaker constants of each individual material; r is the initial radius of the montmorillonite colloids; λ is the characteristic wavelength associated with the interaction, assumed to be approximately 100 nm; h is the separation distance between the montmorillonite colloids and the mineral surface; φ1 and φ2 are the surface potentials of the montmorillonite colloids and aluminum oxide, respectively; κ is the reciprocal Debye–Hückel length.
The Hamaker constant for the interaction between montmorillonite colloids (Amm) and aluminum oxide (Aaa) in water (Aww) is calculated using the following formula [48]:
A m w a = ( A m m A w w ) ( A a a A w w )
Amwa is the Hamaker constant of montmorillonite colloids, where the subscript “m” represents the montmorillonite colloids, “a” represents aluminum oxide, and “w” represents water. According to references, Amm (the Hamaker constant of montmorillonite colloids) is 2.20 × 10⁻²⁰ J/m2, Aaa (the Hamaker constant of aluminum oxide) is 1.52 × 10⁻¹⁹ J/m2, and Aww (the Hamaker constant of water) is 3.70 × 10⁻²⁰ J/m2 [49,50]. Based on the calculation using the given parameters, it can be concluded that Amwa = 8.70 × 10⁻²¹ J/m2.

2.7. Analytical Methods

The interaction between montmorillonite colloids and Al2O3 surfaces follows kinetic patterns that can be explained through pseudo-first-order and pseudo-second-order models.
The pseudo-first-order [51] and the pseudo-second-order [52] kinetic model are mathematically expressed as
Q t = Q e ( 1 exp ( k 1 t ) )
Q t = Q e 2 k 2 t 1 + Q e k 2 t
where Qt and Qe represent the adsorption capacity of montmorillonite colloids at time t and equilibrium state (mg g−1), with k1 (min−1), k2 (g mg−1 min−1) denoting the pseudo-first-order and pseudo-second-order rate constant, respectively.

3. Results and Discussion

3.1. Characterization of Montmorillonite Colloids

The crystal structure of the montmorillonite colloids was analyzed using X-ray diffraction (XRD) (Figure S3). The XRD pattern matched the standard card (JCPDS No. 13-0135) [53]. Diffraction peaks at 2θ ≈ 5.887°, 19.712°, and 34.742° respectively correspond to the (001), (100), and (110) crystal planes of montmorillonite. The FTIR spectrum of montmorillonite colloids is as shown in Figure S4. It can be seen that there are relatively prominent absorption bands. The appearance of these absorption bands can be attributed to the functional groups existing in montmorillonite, which includes the tensile vibration of the O−H bond in the octahedral sheet. This tensile vibration occurs at the position of 3614 cm−1. The band at 3384 cm−1 corresponds to O–H stretching of water molecules, while the band at 1630 cm−1 corresponds to H–O–H bending. At 987 cm−1, the asymmetric stretching of the Si−O bond is relatively obvious. In addition, the bending vibrations of several other groups have also been detected. For instance, the bending vibration of Al−OH is at 912 cm−1, Al−Mg−OH at 838 cm−1, Al−O−Al at 620 cm−1, Si−O−Al at 511 cm−1, and Si−O−Si at 430 cm−1 [54,55].
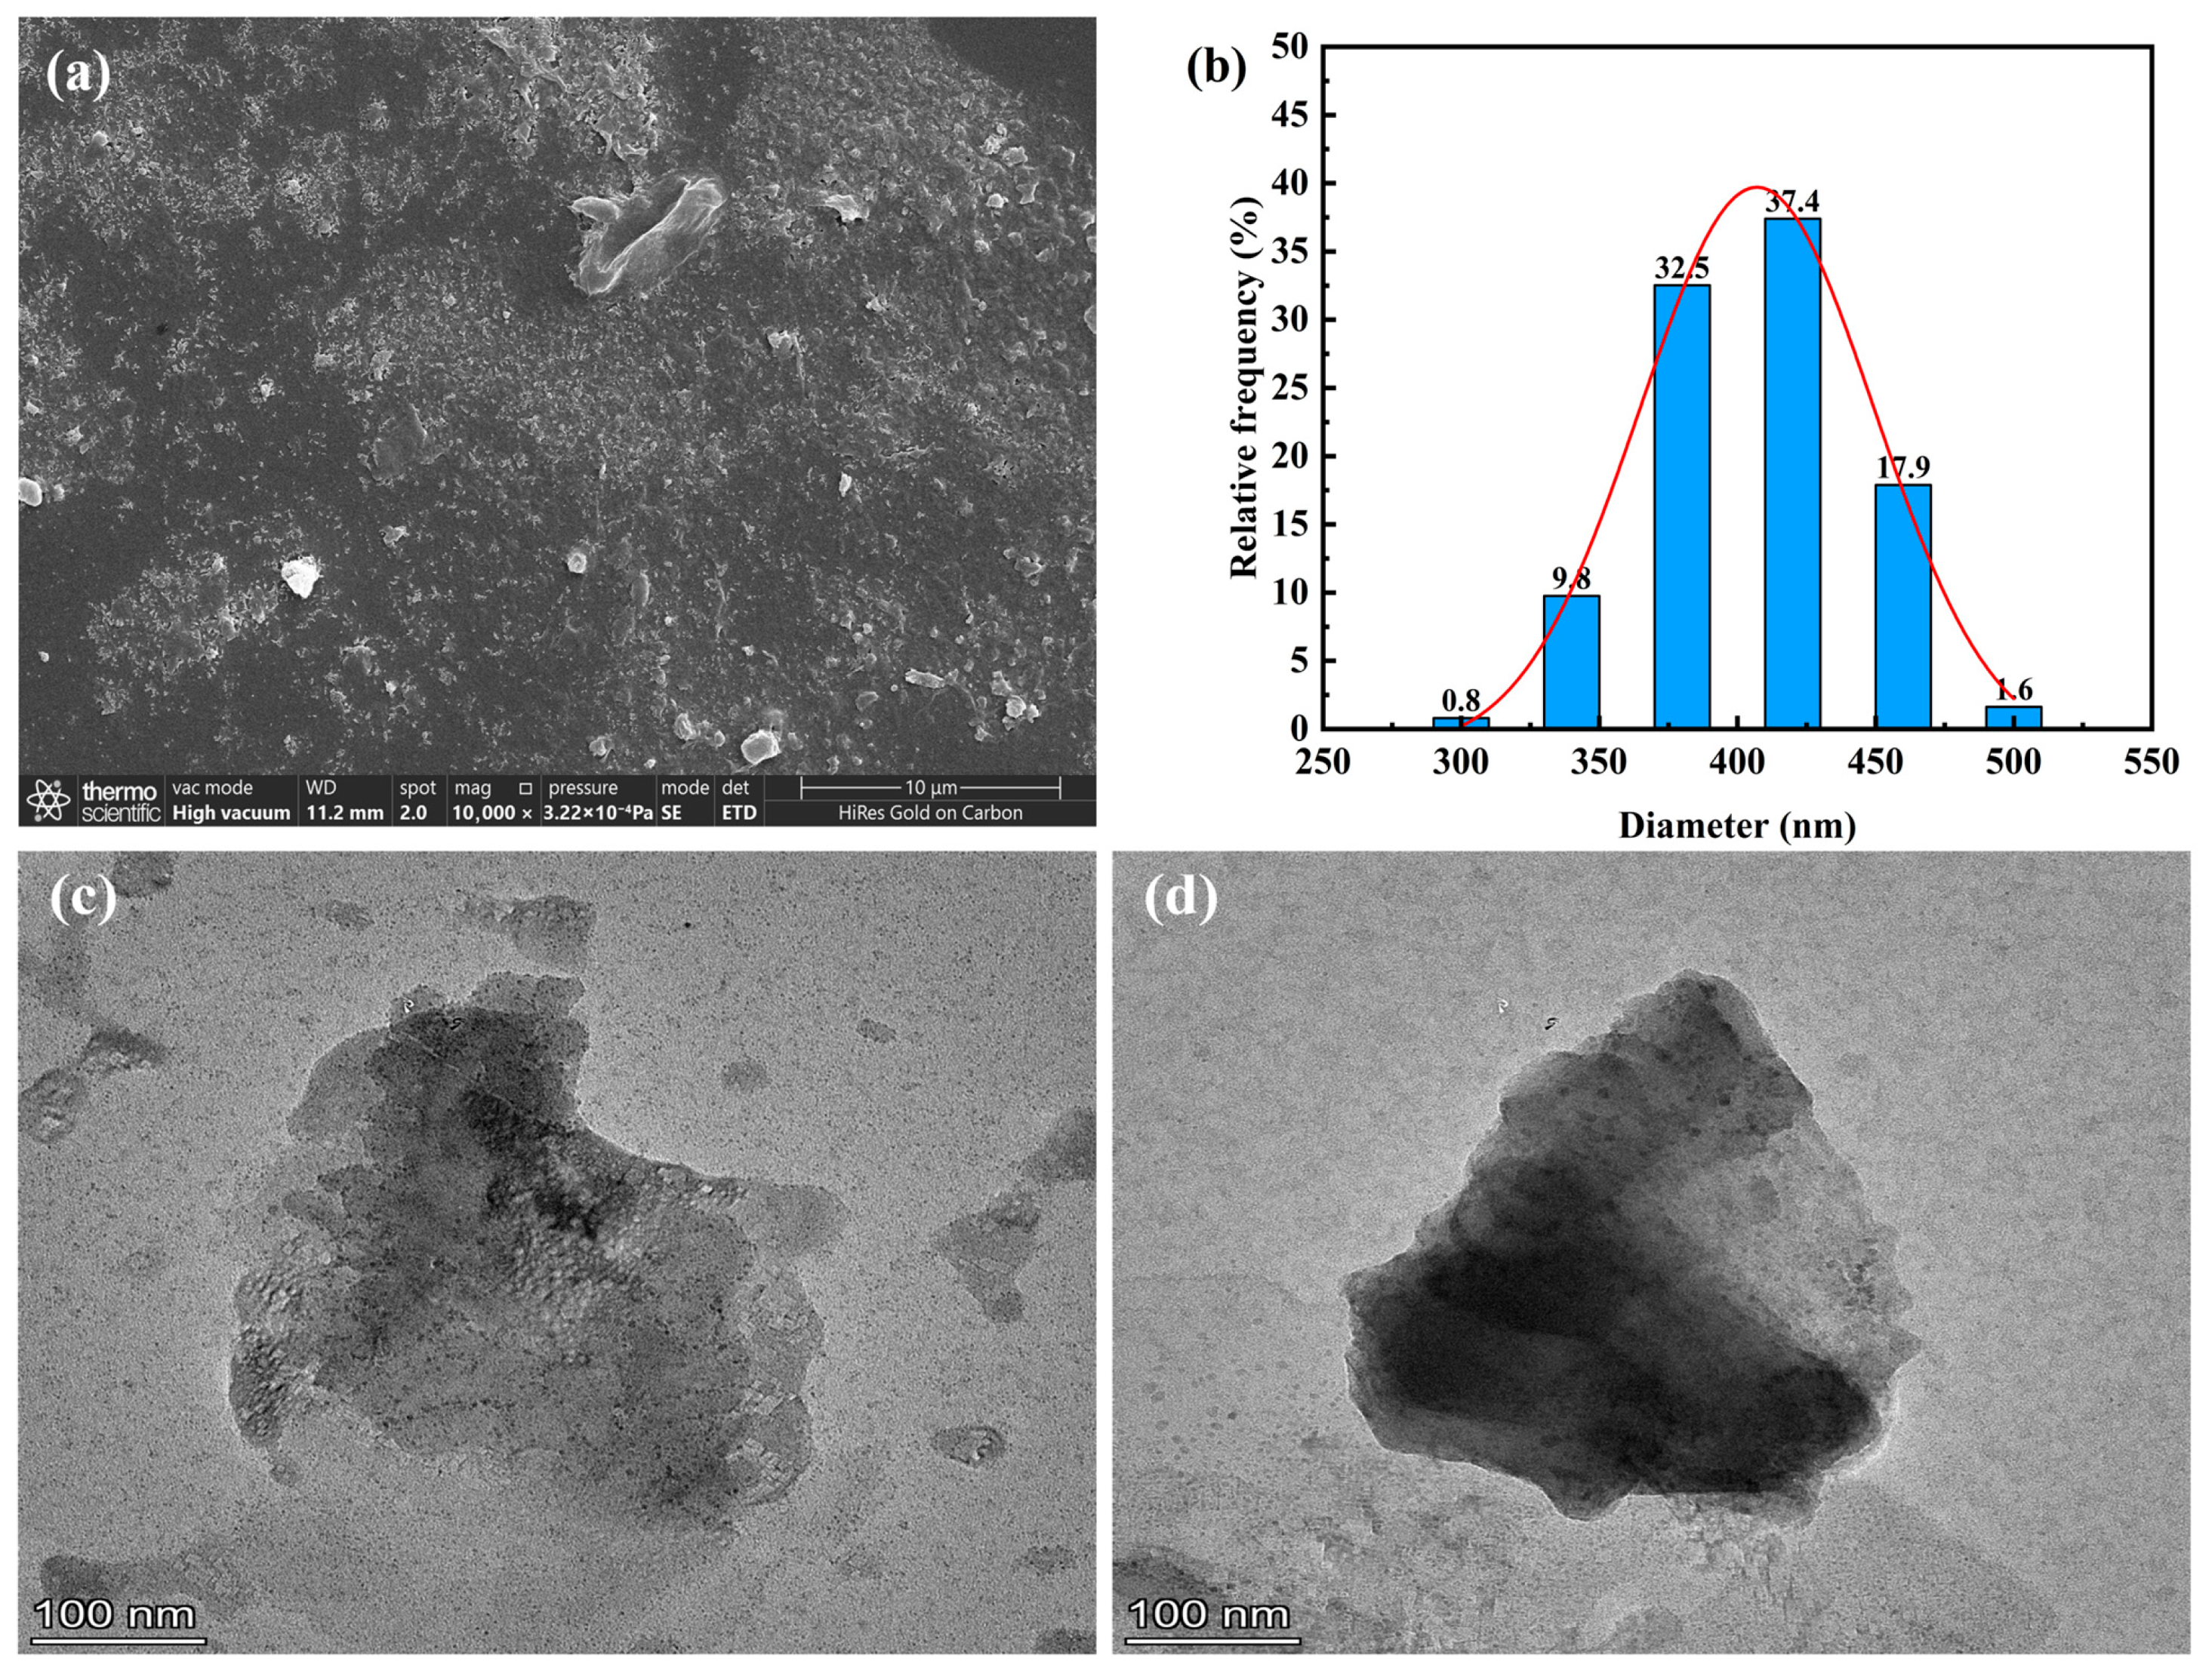
The morphological traits of the synthesized montmorillonite colloids were examined through scanning electron microscopy (SEM) (Figure 1a). The SEM images showed that the montmorillonite colloids mainly presented an amorphous nanoparticle form, and there were occasional aggregations of nanoparticles that resulted in irregular spherical colloidal particles. Dynamic light scattering (DLS) was employed to measure the average hydrodynamic diameter (Figure 1b) and zeta potential of the prepared montmorillonite colloidal stock suspension. The results indicate that the particle size distribution of the montmorillonite colloids suspension is around 400.4 nm, and the measured zeta potential is roughly −34.7 mV. This implies that the synthesized montmorillonite colloidal suspension retains a certain level of stability within the system. High-resolution transmission electron microscopy (TEM) revealed that the montmorillonite colloids exhibit an irregular structure with a size of approximately 400 ± 100 nm (Figure 1c,d), which aligns closely with the DLS measurements.

3.2. Adsorption Behaviors of Montmorillonite Colloids on Al2O3

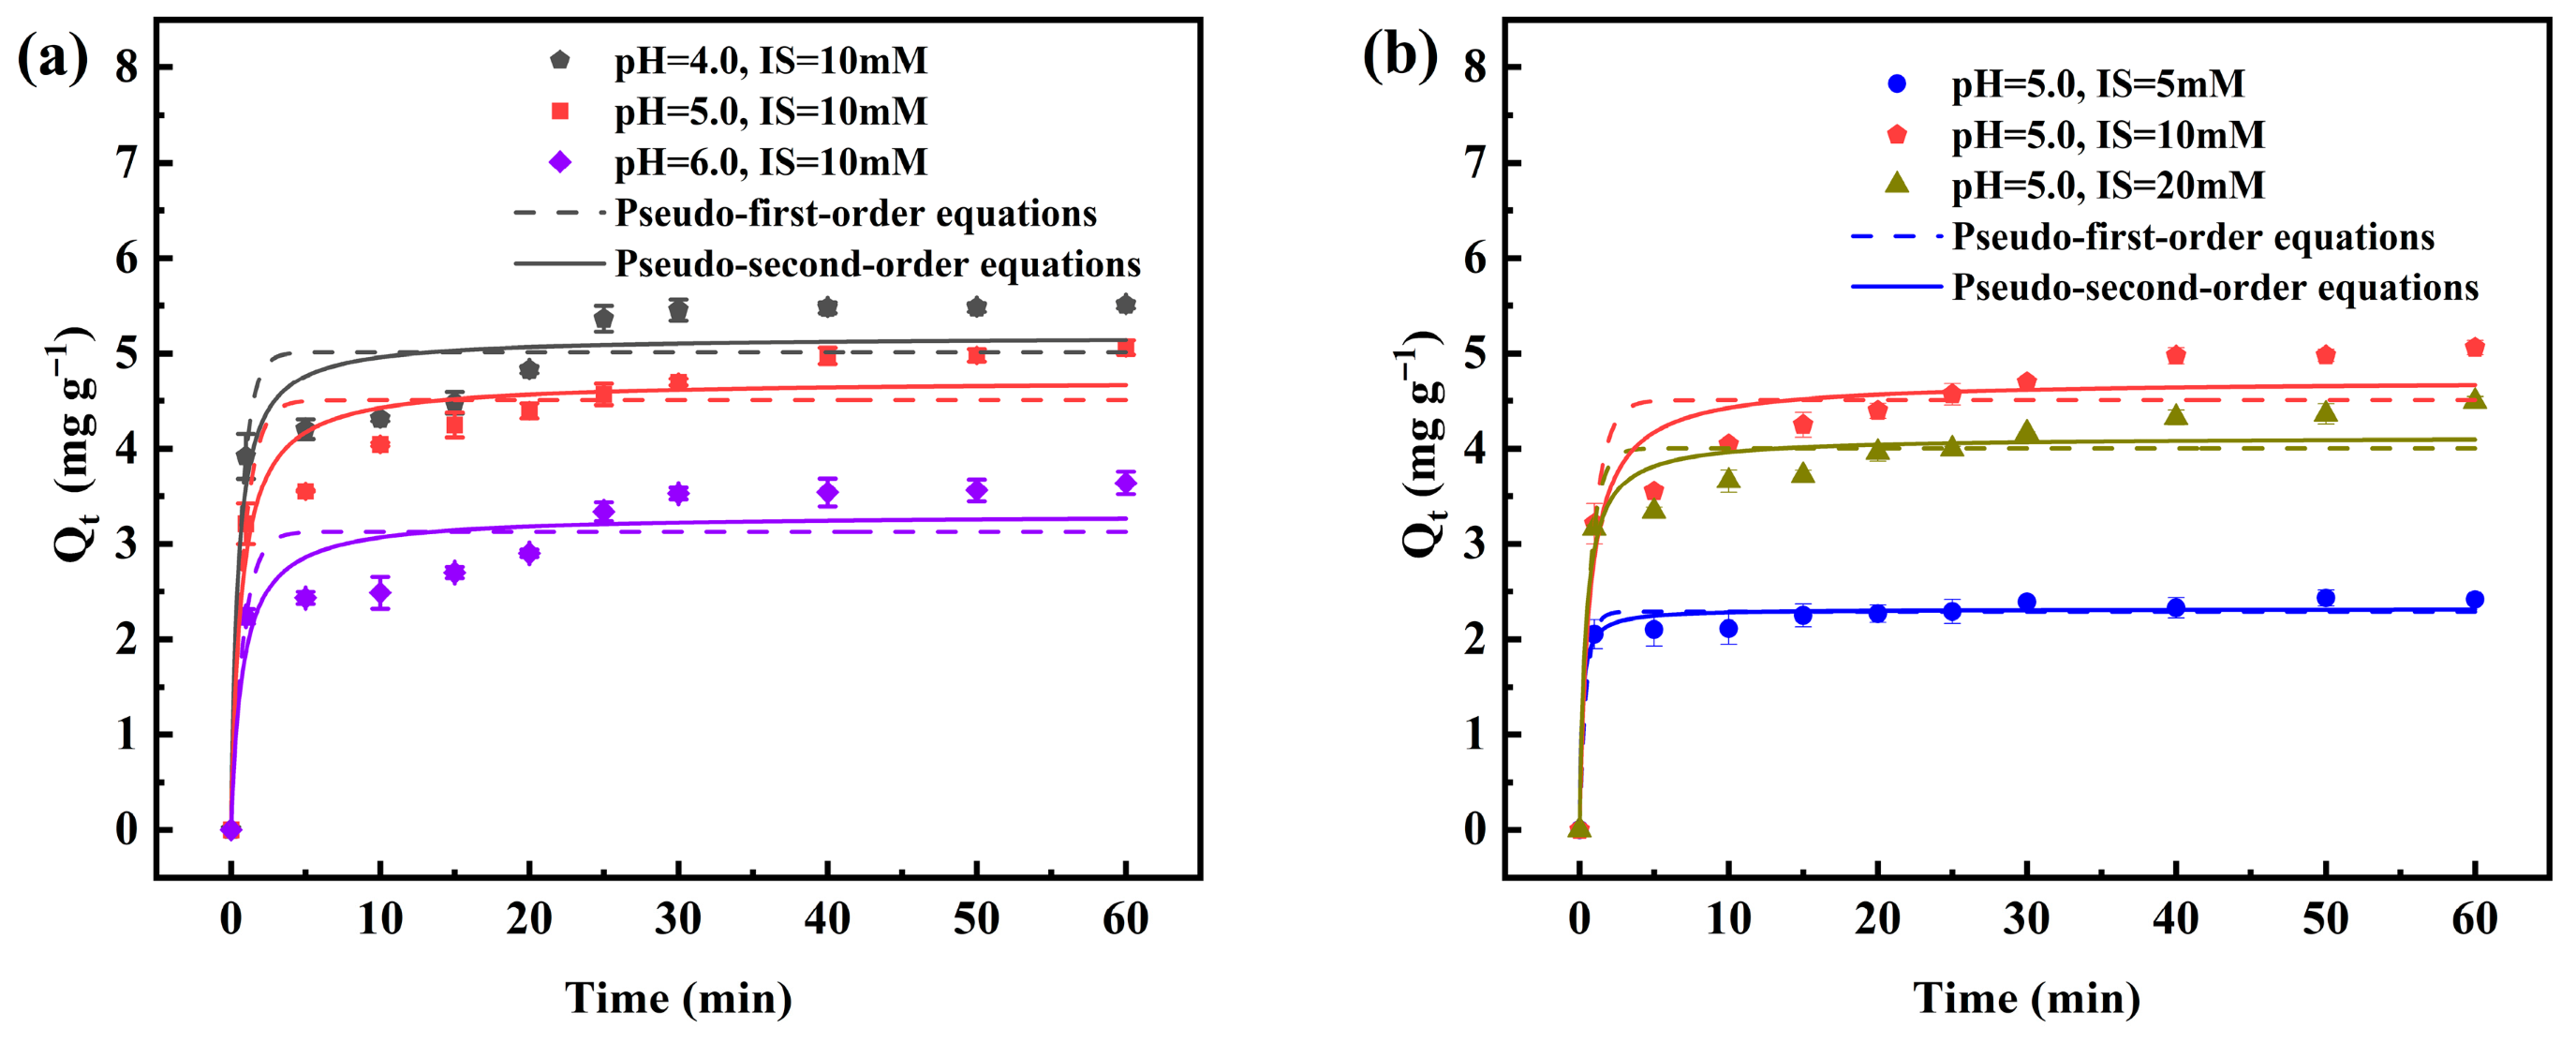
To evaluate the adsorption capacity of Al2O3 (adsorbent) toward montmorillonite colloids (adsorbate), the adsorption behavior of montmorillonite colloids on the Al2O3 surface was analyzed under varying pH and ionic strength conditions. The experimental data of adsorption capacity versus time were analyzed by applying pseudo-first-order and pseudo-second-order kinetic models [51,56]. Figure 2 show the adsorption curves of montmorillonite colloids on Al2O3 over time at different pH values (fixed at 10 mM NaCl) and NaCl concentrations (fixed at pH = 5.0), respectively. Results indicate that montmorillonite colloids are rapidly adsorbed onto the Al2O3 surface within 1–30 min, followed by a slow adsorption phase from 30 to 60 min until approaching equilibrium (Figure 2a,b). Fitting the obtained adsorption kinetic data revealed that the pseudo-second-order kinetic model better described the adsorption process of montmorillonite colloids on Al2O3, indicating that the adsorption on the Al2O3 surface primarily involved chemisorption [57]. Under conditions of pH = 5.0 and 10 mM NaCl, the adsorption capacity of Al2O3 for montmorillonite colloids reached 4.71 mg g−1, with an adsorption rate constant of k2 = 0.325 g mg−1 min−1.
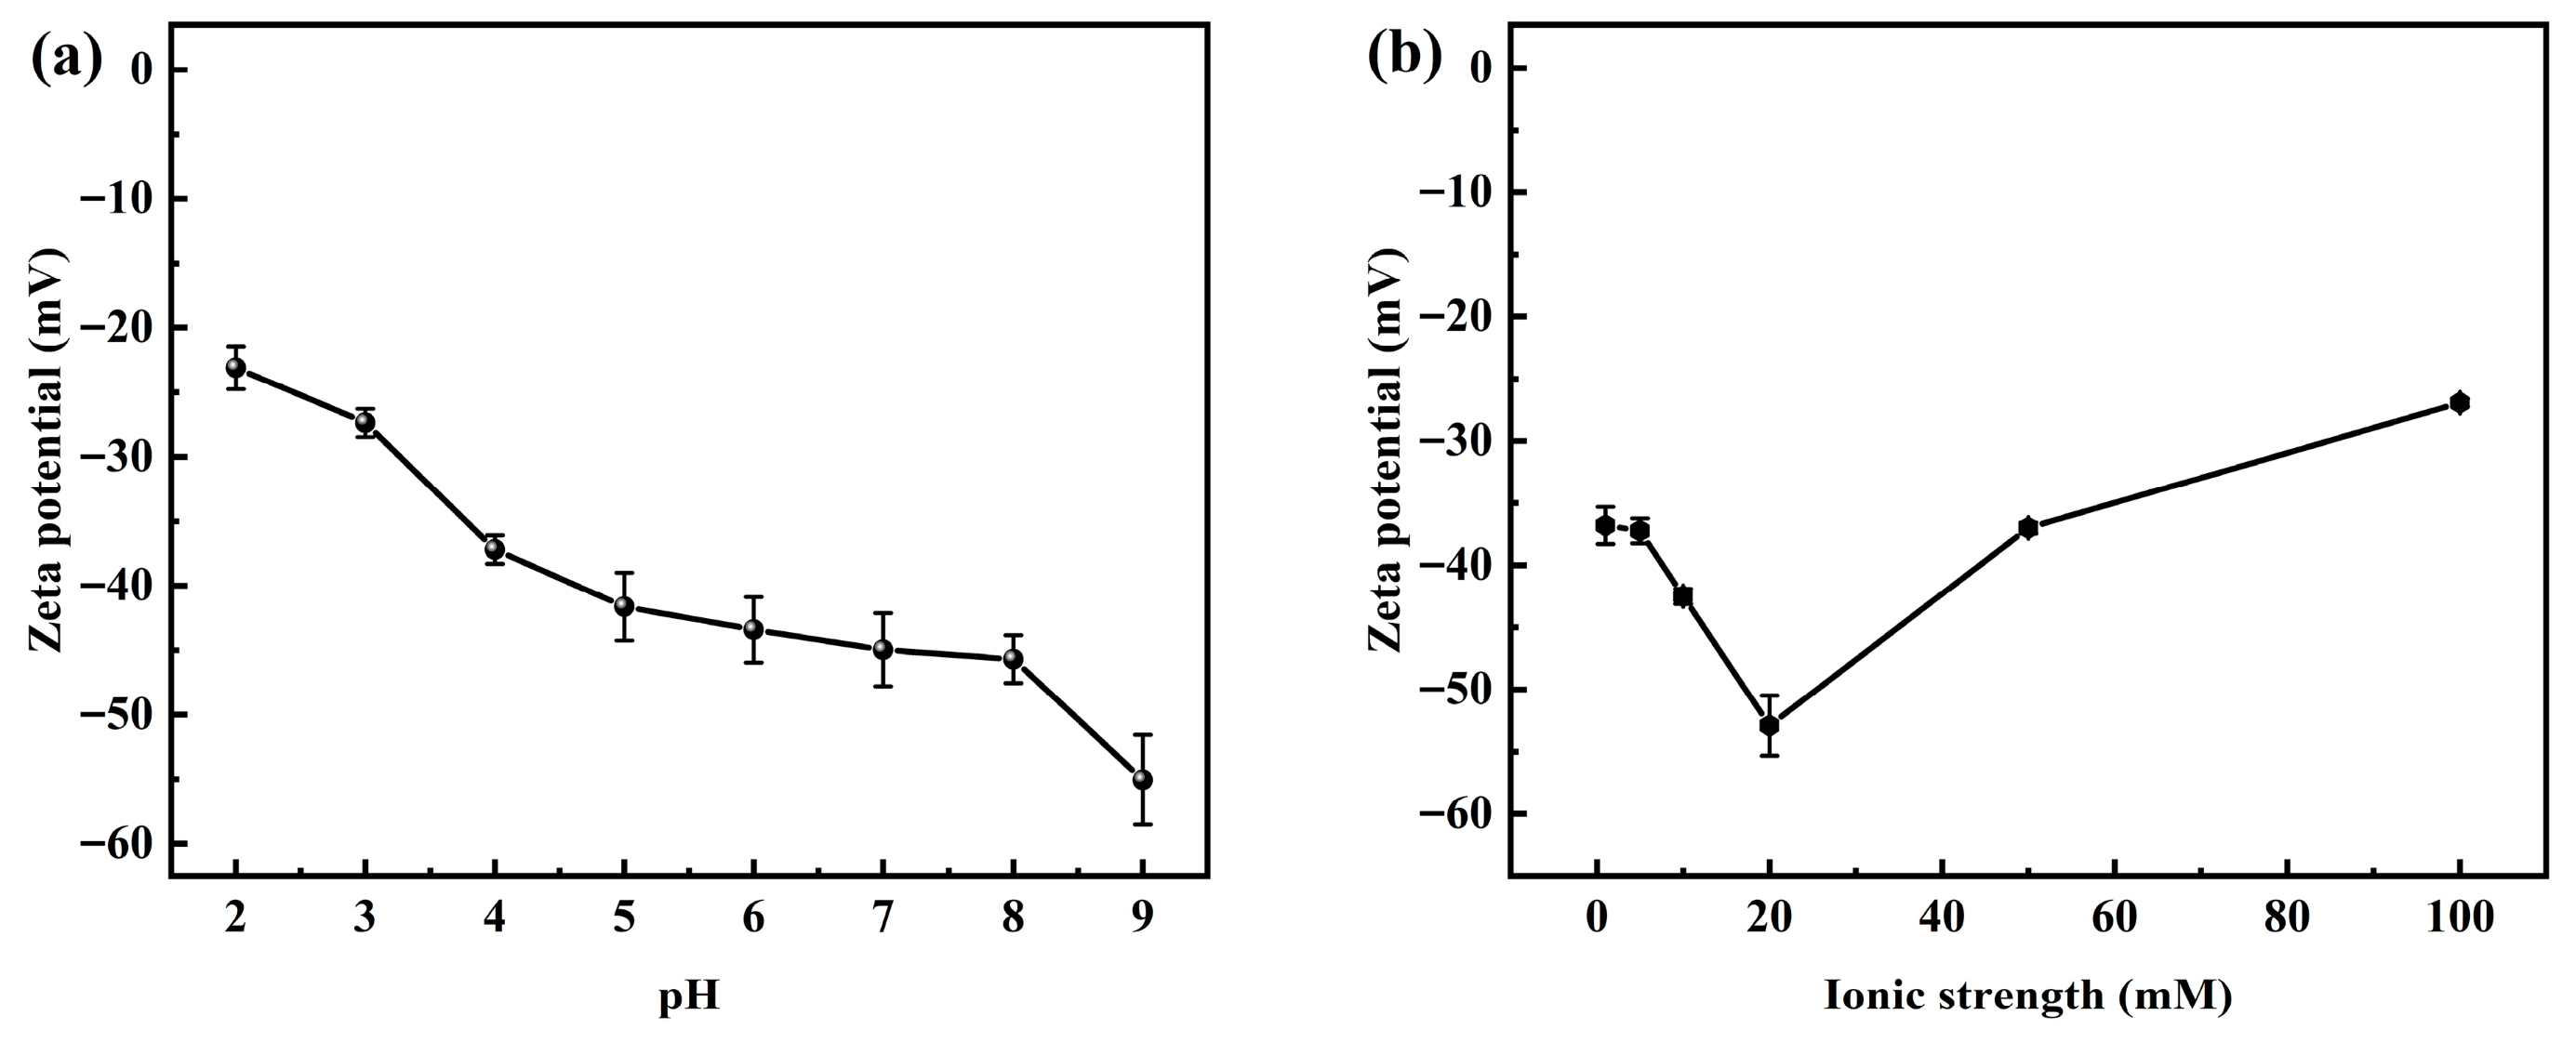
Table S1 shows that when the NaCl concentration is fixed at 10 mM, the adsorption amount of montmorillonite colloids on Al2O3 increases from 3.31 mg g−1 to 5.18 mg g−1 as the pH decreases from 6.0 to 4.0. At pH values below 7.0, the Al2O3 surface becomes protonated and carries a certain amount of positive charge [41]. As pH increases, the positive charge density decreases. Conversely, montmorillonite colloids carry varying degrees of negative charge across the pH range of 3.0−9.0 (Figure 3a). At pH = 6.0, the positive charge density on the Al2O3 surface decreases (Figure S6). The 10 mM NaCl solution exerts a certain degree of double-layer compression on the montmorillonite colloids, leading to pronounced charge shielding. and the synergistic effect of these two factors leads to weakened adsorption forces [58]. However, at lower pH values, the high positive charge density on Al2O3 ensures that even with a compressed double layer, the residual positive charge density remains sufficient to maintain attraction with negatively charged montmorillonite colloids, thereby increasing the adsorption capacity. At pH = 5.0, as NaCl concentration increased from 5 mM to 20 mM, the adsorption amount of montmorillonite colloids on Al2O3 rose from 2.32 mg g−1 to 4.71 mg g−1, then decreased to 4.12 mg g−1. At NaCl concentrations between 1 and 20 mM, the zeta potential of the montmorillonite colloid decreased from approximately −36.8 mV to −52.9 mV (Figure 3b). Nevertheless, when the NaCl concentrations ranged from 20 to 100 mM, the zeta potential showed an upward trend as the Na+ concentration increased. Although the zeta potential of the montmorillonite colloid reached its minimum value of −52.9 mV at 20 mM NaCl (Figure 3b), theoretically suggesting further adsorption enhancement, the compression of the double electric layer caused by high Na+ ion concentration [59] weakened the electrostatic interactions between montmorillonite colloids and Al2O3 [60], resulting in a slight decrease in adsorption capacity compared to 10 mM NaCl.
Based on DLVO theory calculations, the total interaction energy between the montmorillonite colloids and the Al2O3 surface increases as the pH value rises (Figure S7a), which is consistent with the experimental trends described above. In contrast, at the NaCl concentration of 5 mM, a deep potential well is present, which facilitates the rapid deposition of montmorillonite colloids onto Al2O3, resulting in a high deposition rate. However, the amount of deposited colloids under this condition is the smallest. As the NaCl concentration increases from 10 mM to 20 mM, the total interaction energy increases (Figure S7b). At this point, the montmorillonite colloids agglomerate and deposit on Al2O3. The deposition amount is greater than that observed under 5 mM NaCl conditions, but the deposition rate slows down.

3.3. Morphological Analysis of Al2O3 and Montmorillonite Colloids Composites

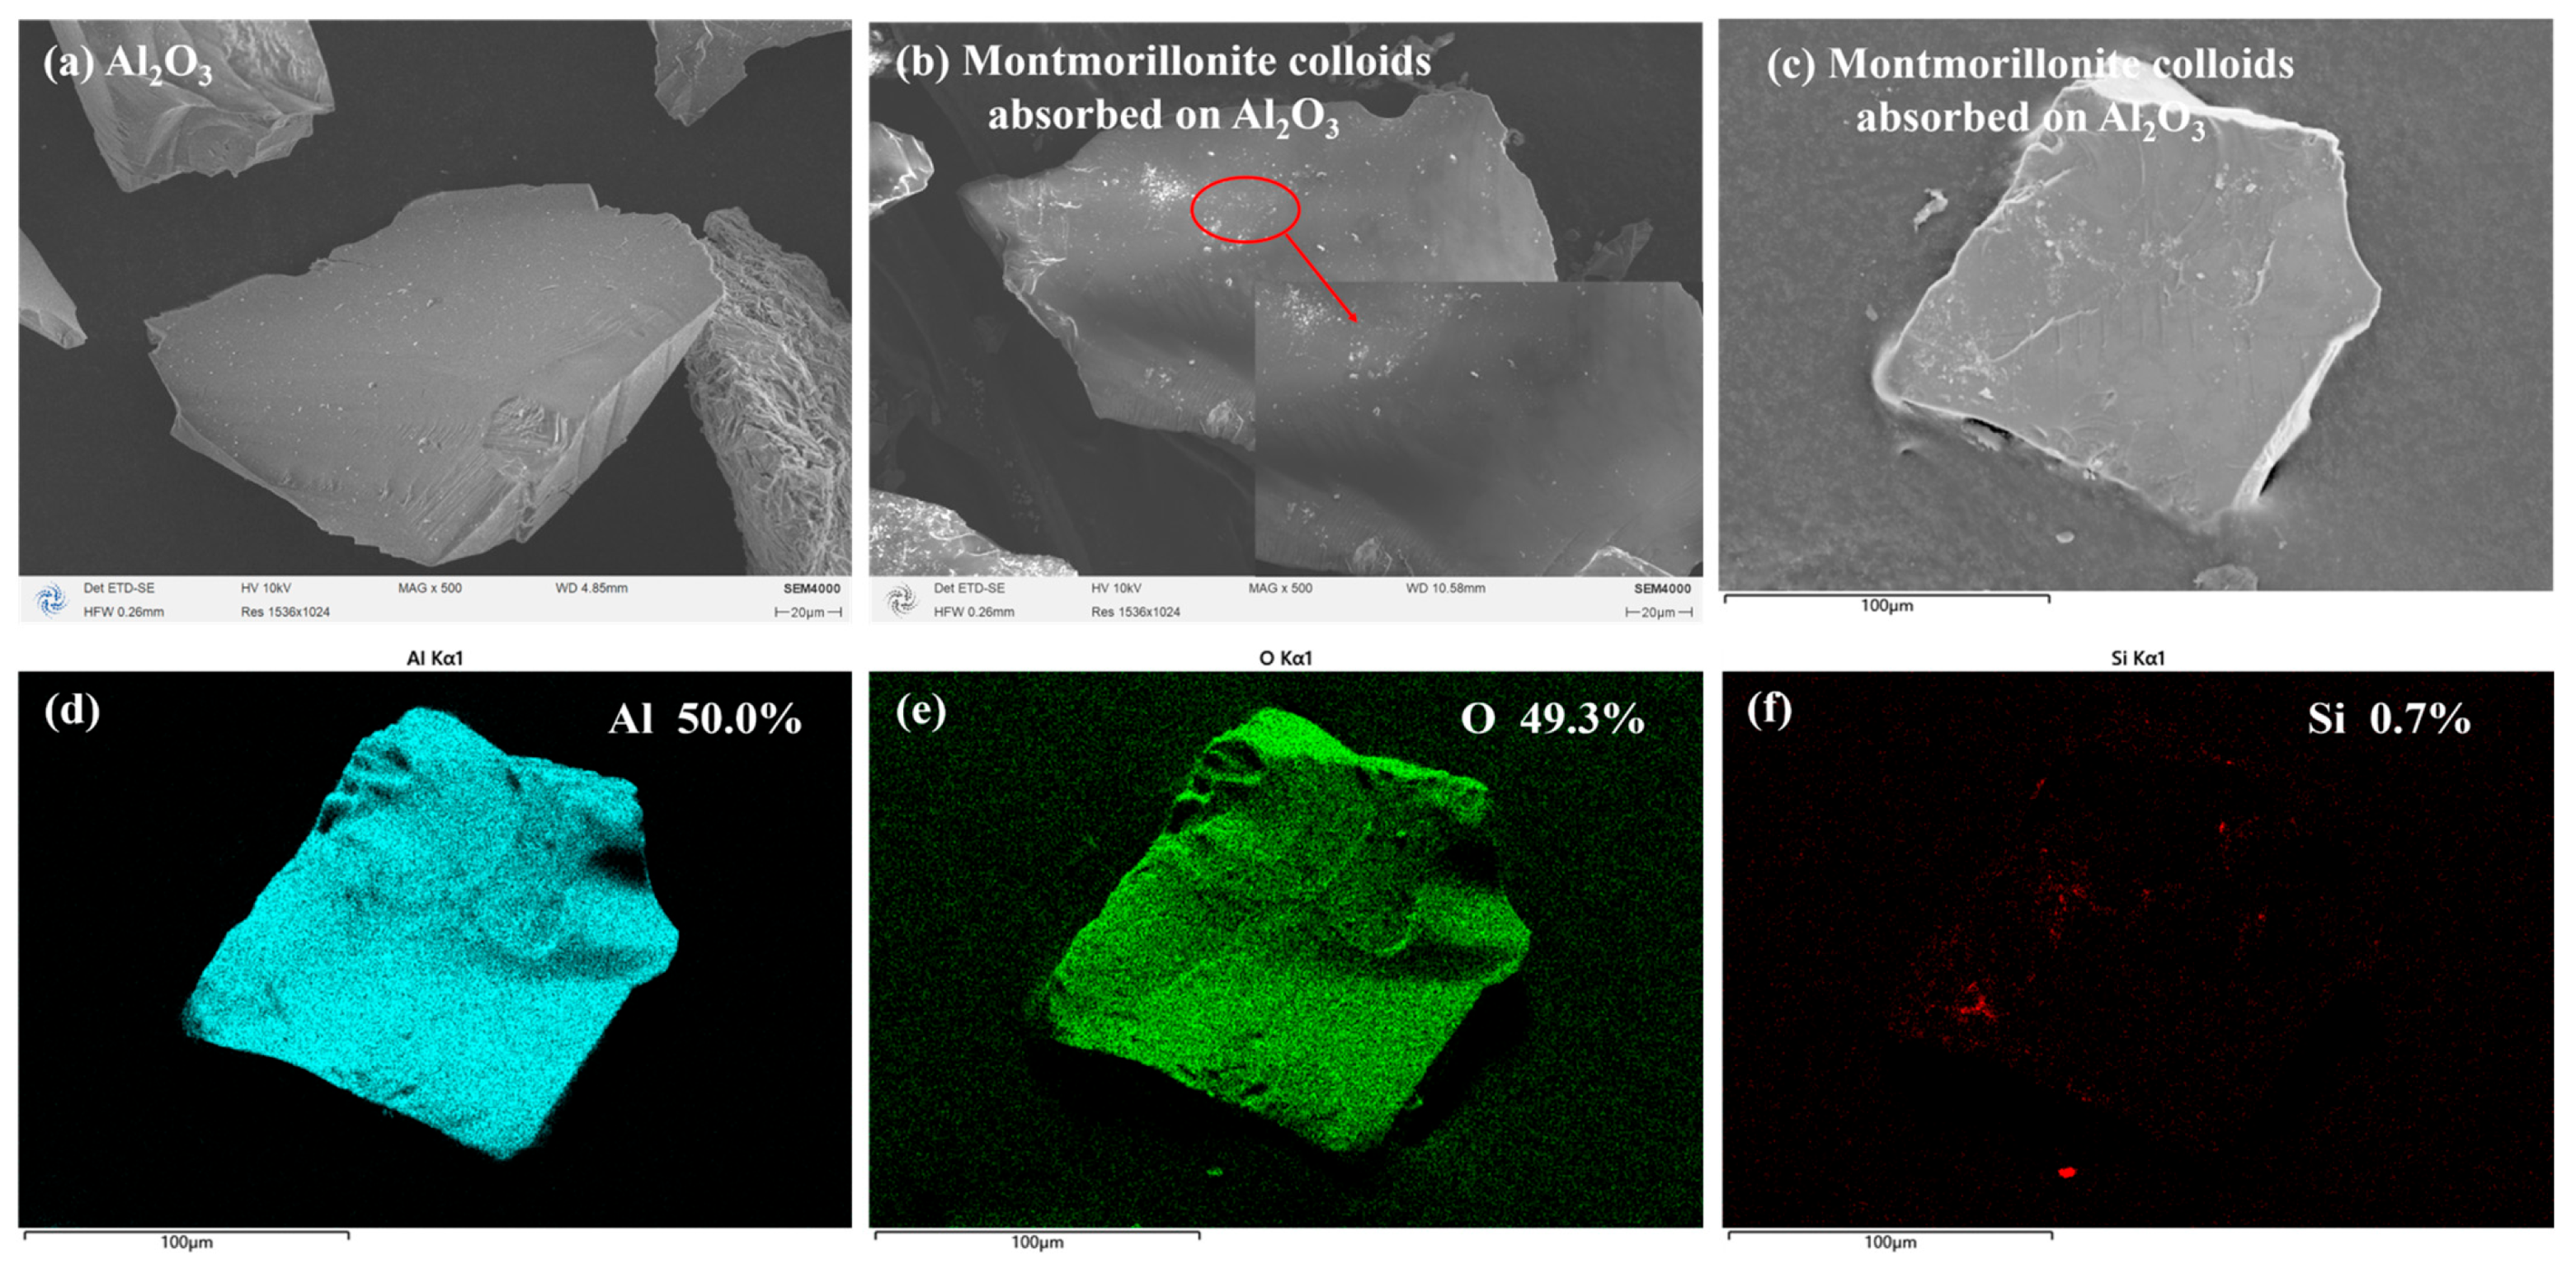
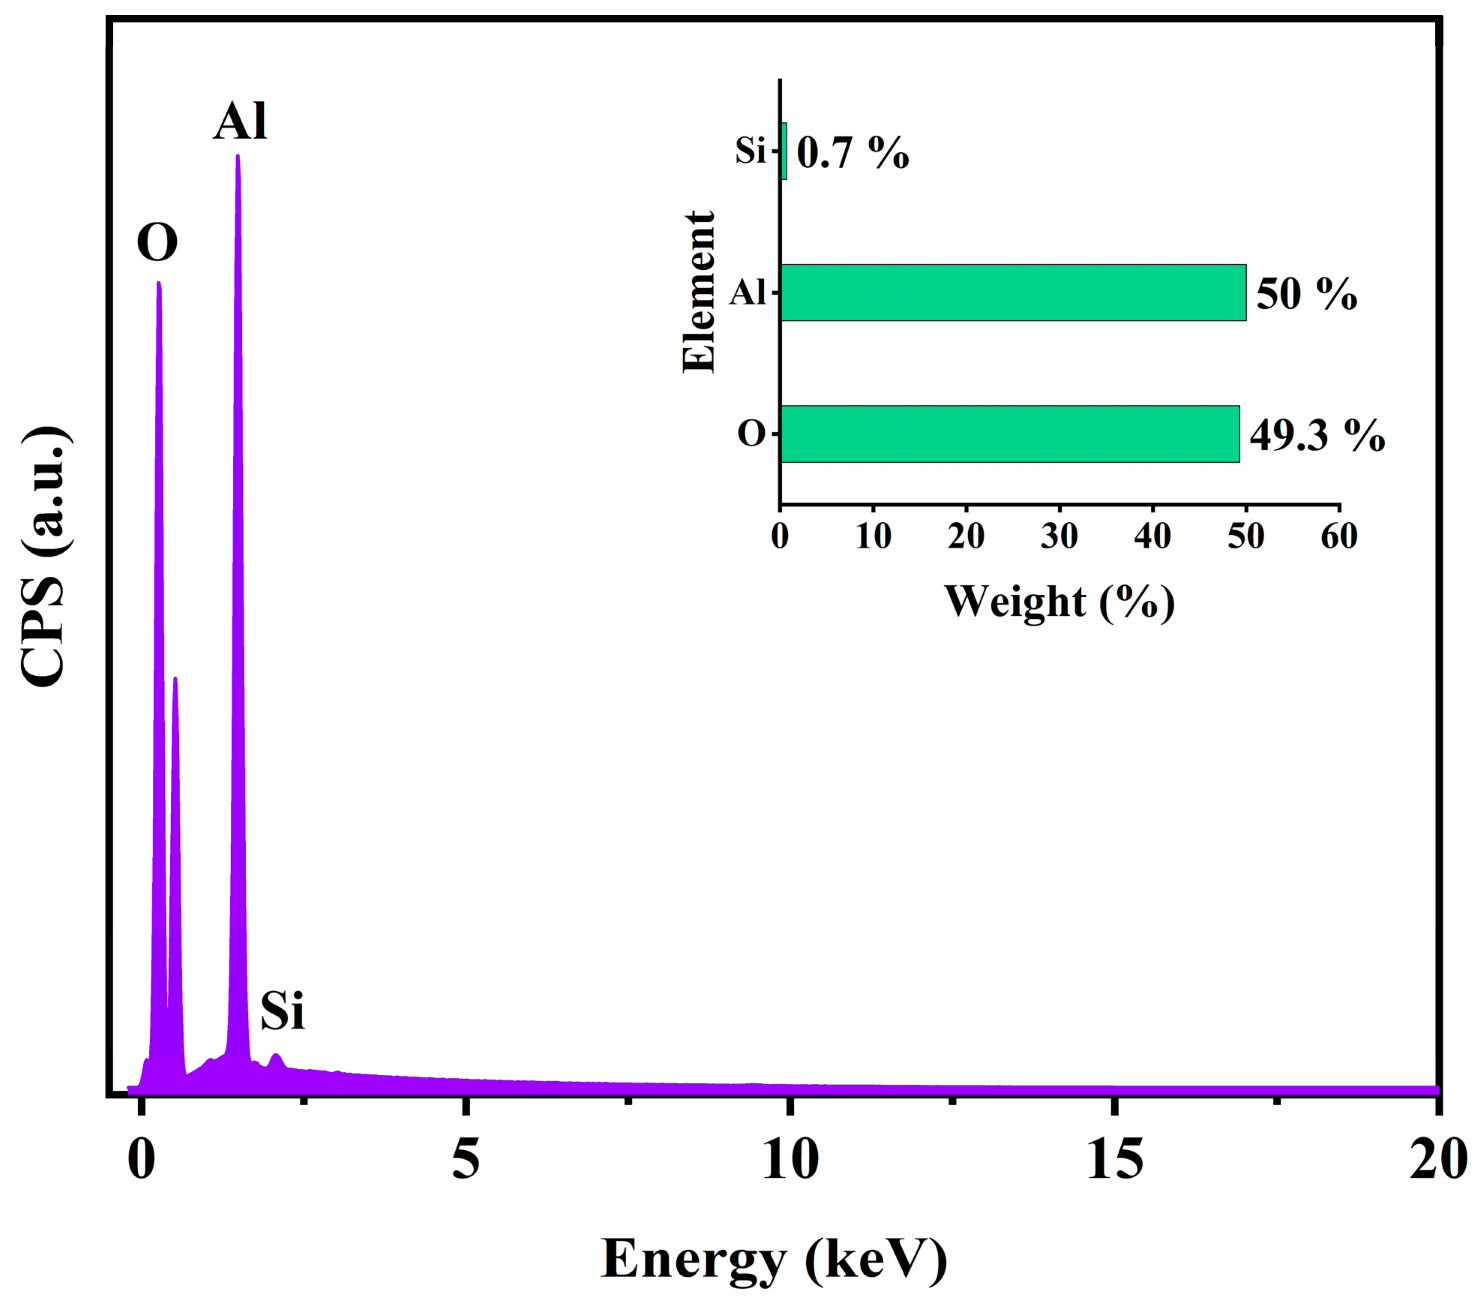
Scanning electron microscope (SEM) images reveal that the Al2O3 surface is relatively smooth, predominantly exhibiting a thick plate-like structure (Figure 4a), consistent with previous reports [61]. After montmorillonite colloids adsorption onto the Al2O3 surface, numerous fine nanoparticles appeared on the Al2O3 surface (Figure 4b,c), suggesting that part of the montmorillonite colloids were adsorbed onto the Al2O3 surface. Furthermore, EDS analysis (Figure 4d–f) revealed that prior to adsorption, Al2O3 primarily contained O (50.7%), Al (49.2%), and trace amounts of Si (0.1%) (Figure S5). The presence of Si stems from the impurity of the Al2O3 sample, which contained minimal silicon. Following montmorillonite colloids adsorption, the Si peak intensity increased to 0.7% (Figure 5), indicating partial coverage of the Al2O3 surface by montmorillonite colloids.

3.4. XPS Analysis of Al2O3 Before and After Adsorption

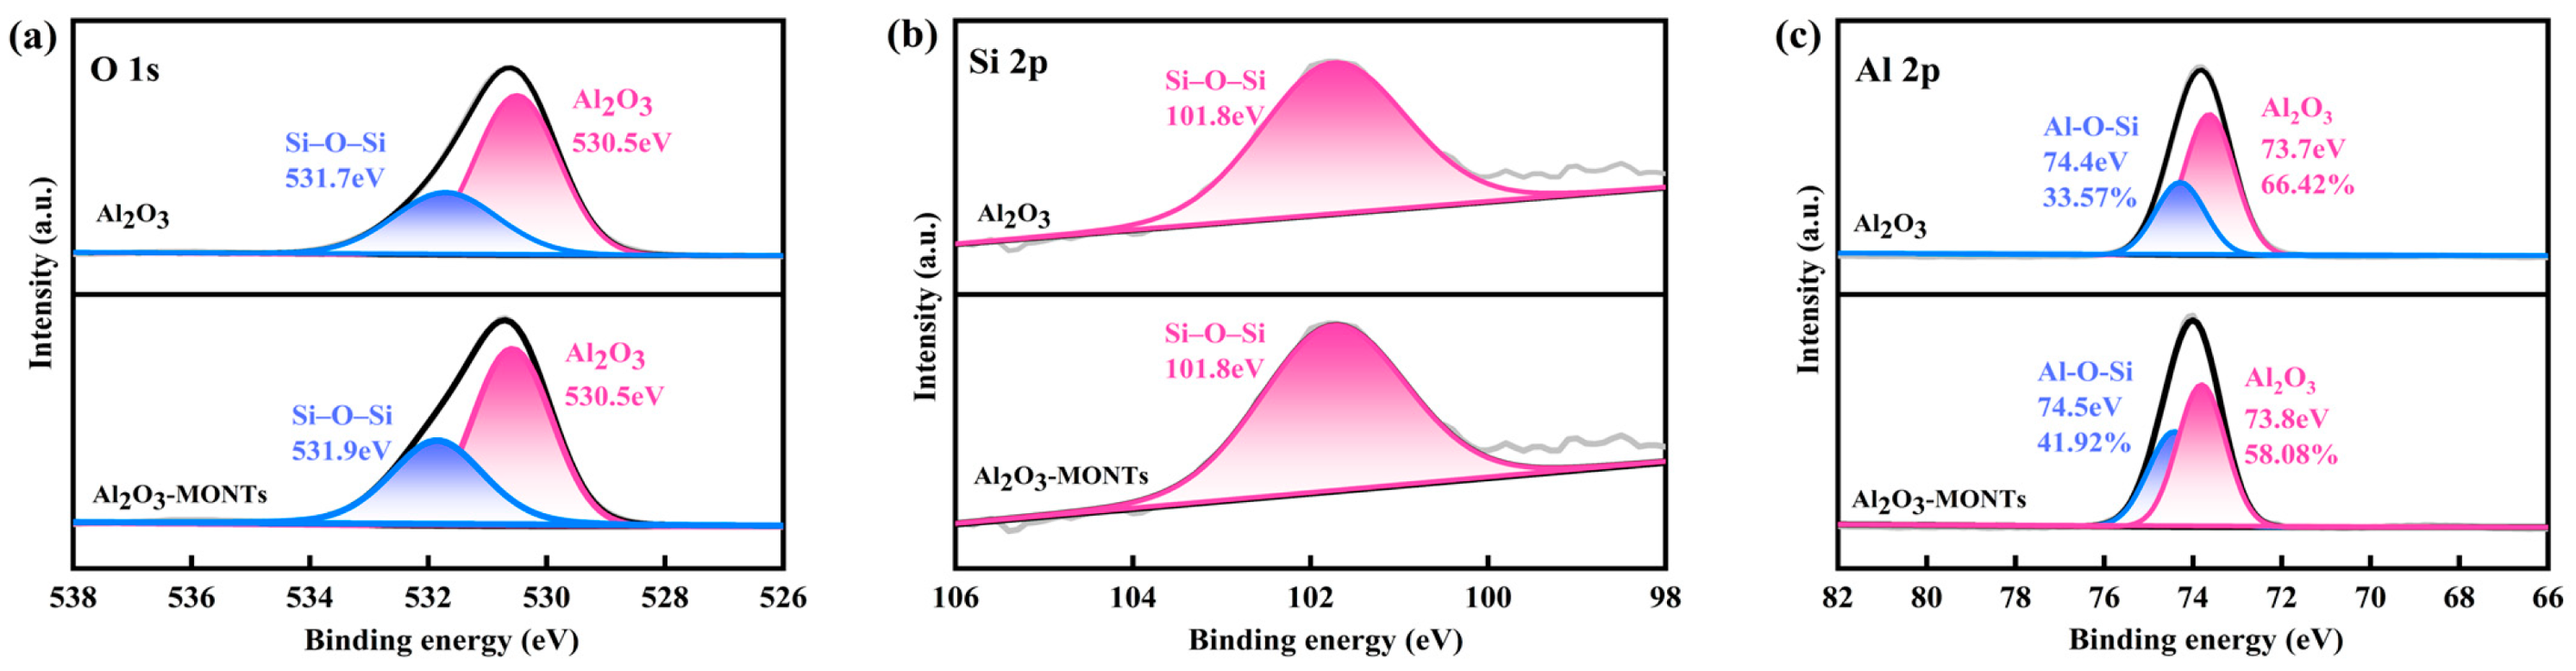
To identify the chemical groups formed on Al2O3 before and after adsorbing montmorillonite colloids, Figure 6 presents the XPS O 1s, Al 2p, and Si 2p spectra of Al2O3. Specifically, prior to adsorption (Figure 6a), the characteristic peaks of O 1s (530.5 eV and 531.7 eV) are attributed to Al2O3 and Si–O–Si, respectively [62,63], while the Si 2p characteristic peak (101.8 eV) is primarily attributed to SiO2 (Figure 6b) [64]. After the adsorption reaction (Figure 6a), the O 1s characteristic peak position of Si–O–Si shifts slightly (531.9 eV) with a slight increase in intensity. The XPS Al 2p spectrum of Al2O3 is shown in Figure 6c. Before adsorption (Figure 6c), two characteristic peaks were observed, corresponding to Al2O3 (73.7 eV) and Al–O–Si (74.4 eV) [62,65,66,67,68]. After montmorillonite colloids adsorption (Figure 6c), the intensity of the Al–O–Si characteristic peak increased, shifting to 74.5 eV. Concurrently, the peak area percentage of the Al–O–Si peak rose from 33.57% to 41.92%. This indicates that the chemical group (–O–Si) participated in the adsorption process, confirming that the chemical groups of the montmorillonite colloids reacted chemically with Al2O3 and adsorbed onto its surface.
Judging from the experimental process mentioned above, the adsorption process of montmorillonite colloids on the Al2O3 surface can be divided into several stages. At the beginning, it was mainly electrostatic interaction; the negatively charged montmorillonite colloid was attracted by the positively charged Al2O3 surface. This non-specific force enabled the colloidal particles to overcome the energy barrier, migrate toward the adsorbent surface, and initially approach it. When the distance between them was shortened to the atomic scale, the specific chemical interactions existing on the surface took the dominant position. The oxygen atoms in the Si–O bonds of montmorillonite colloids could act as electron donors and undergo surface coordination reactions with the exposed aluminum atoms on the surface of Al2O3, ultimately forming Si–O–Al bonds. This situation marks a fundamental shift from physical adsorption to chemical adsorption [69].

3.5. Desorption Behaviors of Montmorillonite Colloids on Al2O3

The release (desorption) of colloids in soil is influenced by hydrodynamic conditions such as pH, ionic strength, and other coexisting ions, or by the introduction of surfactants. Among these, the distribution and adsorption of surfactants in liquid–solid systems are affected by surfactant properties, pH, background ions, and mineral composition [70,71]. Within mineral media, surfactants may undergo both monolayer and multilayer adsorption [72]. When surfactants are adsorbed onto particles, they can initiate certain interfacial processes, which can alter the stability of colloids and modify numerous physicochemical properties of the soil [73,74].
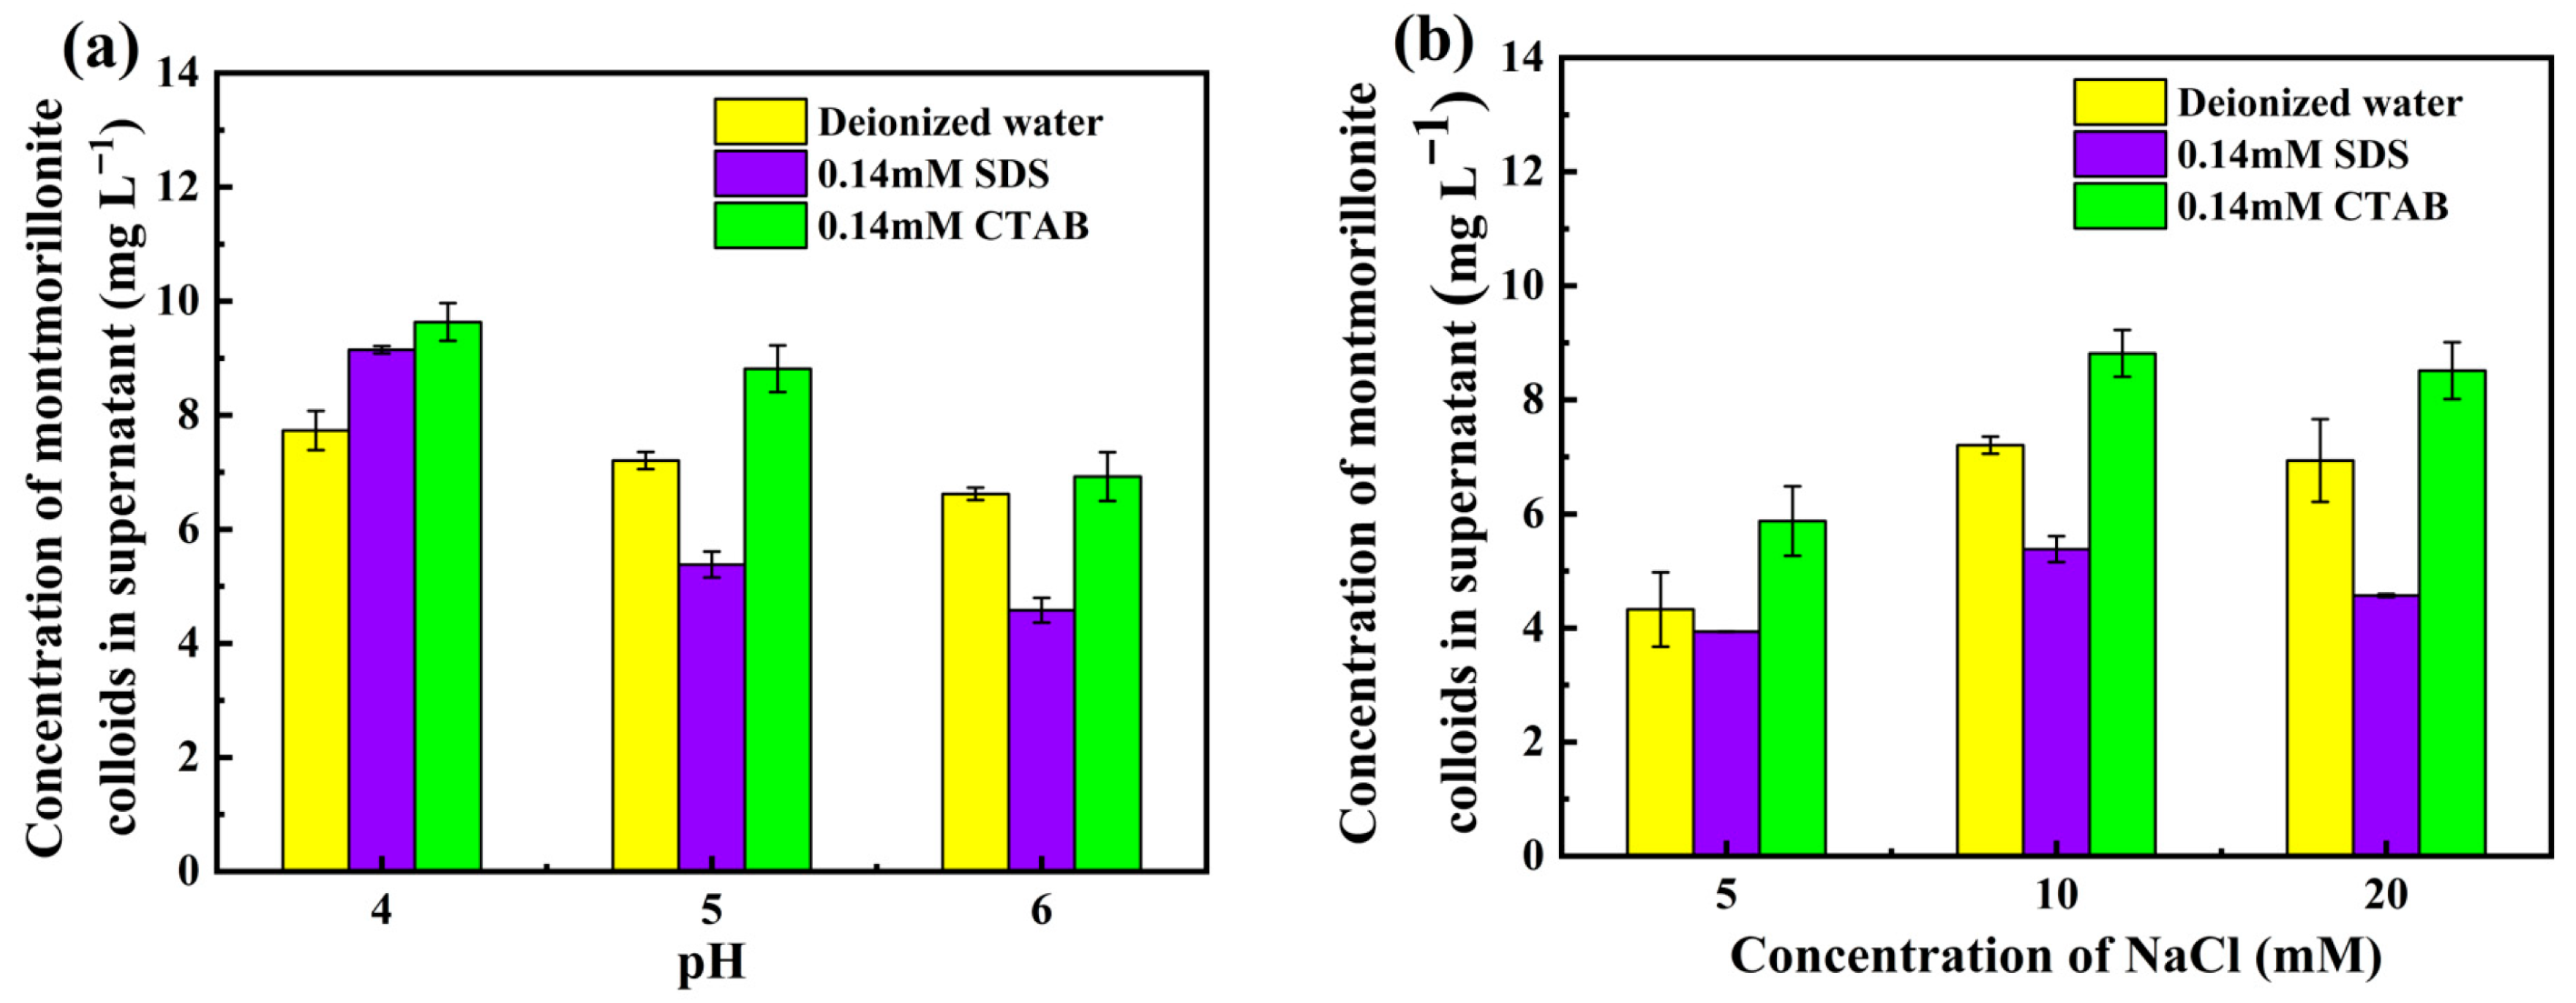
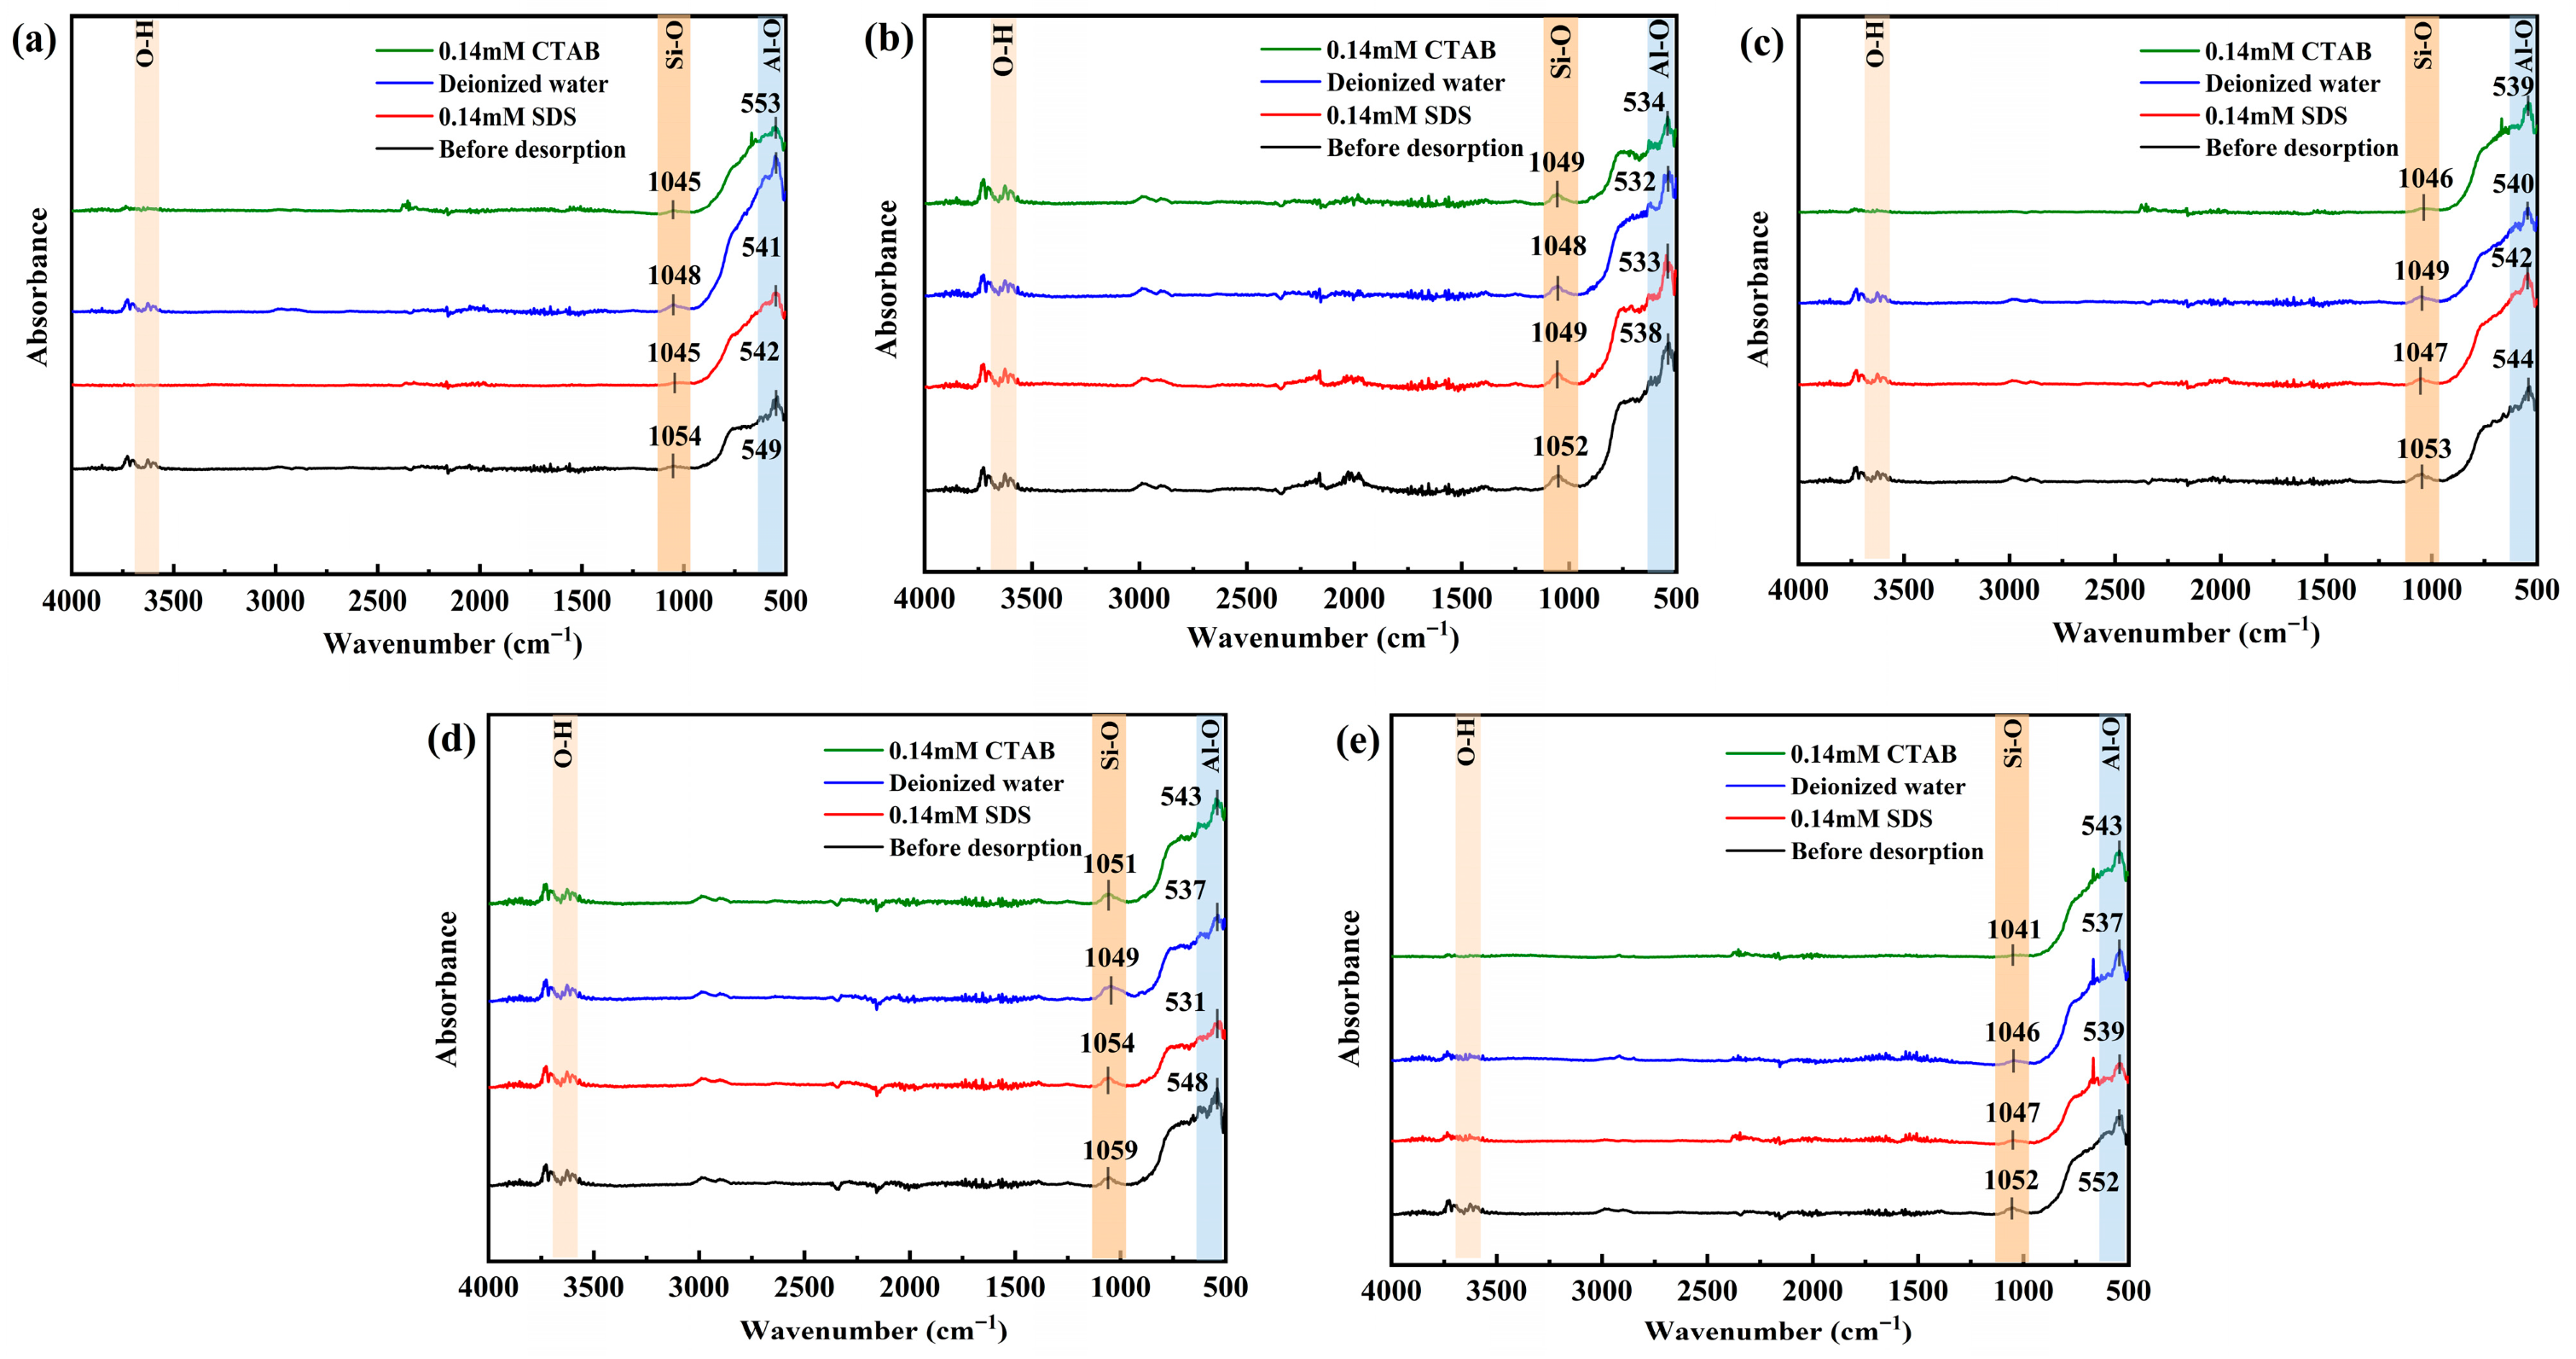
To investigate whether montmorillonite colloids adsorbed onto Al2O3 could be desorbed from the Al2O3 surface by adding deionized water and introducing surfactants (SDS, CTAB), desorption experiments were conducted. Results show that under conditions of pH = 5.0 and 10 mM NaCl, water, SDS, and CTAB caused montmorillonite colloids to desorb from the Al2O3 surface at rates of 7.20 mg L−1, 5.38 mg L−1, and 8.81 mg L−1, respectively (Figure 7a,b). Adjusting conditions for different pH and ionic strengths, montmorillonite colloids exhibited varying degrees of desorption when using water, SDS, or CTAB as desorption media. To elucidate the mechanisms of interaction between different eluents and composite materials, ATR-FTIR was employed to analyze the interfacial interaction mechanisms within the system by comparing the positions, shapes, and relative intensities of characteristic absorption peaks in different samples (Figure 8a–e).
When using deionized water as the elution medium, the montmorillonite colloids adsorbed onto Al2O3 are released into the aqueous solution; however, the desorption efficiency is often reduced. Furthermore, the spectra exhibit only slight peak shape changes, with minimal shifts in peak positions. This is due to the fact that such moderate physicochemical perturbations largely overcome low-energy adsorption forces and can only remove colloidal particles with weak connections, as seen in experiments on the deposition and release of graphene oxide nanoparticles on an aluminum oxide surface [75]. As a result, its overall desorption performance is lower than that of CTAB but somewhat higher than that of SDS (except at pH 4.0).
When SDS is used as the desorption medium, studies indicate that at pH < IEPAl2O3, the sulfate head group (–SO4) of SDS adsorbs onto the Al2O3 surface via strong electrostatic attraction. This arrangement forms a single-layer structure, with the hydrophilic groups oriented inward and the hydrophobic chains facing outward. As the concentration increases, hemi-micelle or bilayer structures may form on the surface, transforming it from hydrophilic to hydrophobic, and potentially inducing charge reversal [76,77]. When the pH value exceeds the isoelectric point of Al2O3, the number of SDS molecules fixed on the substrate surface will be greatly reduced, leaving only weak adhesion, which is mainly due to van der Waals force or hydrophobic effects. The experimental data indicate that the desorption efficiency of SDS from montmorillonite colloids is higher than that in deionized water at pH = 4.0. Previous studies have shown that when Al2O3 adsorbs negatively charged nanoparticles, the surface charge reverses, thereby hindering deposition [78]. At this point, SDS undergoes electrostatic adsorption with residual positive charge sites on the edges or surface protrusions of Al2O3, exposing its alkyl chains. The remaining SDS molecules then associate via hydrophobic interactions, further reversing the surface charge of Al2O3 and thereby promoting the desorption of the montmorillonite colloids. At the same time, it introduces steric hindrance, which generates electrostatic repulsion with montmorillonite colloids [77]. This promotes desorption. However, at other pH values, the ability of SDS to neutralize interface charges is significantly reduced. The SDS molecules adsorbed on the surface of alumina orient their hydrophobic tails outward. When these hydrophobic parts approach the negatively charged montmorillonite colloids, hydrophobic interactions occur, and they are connected together through a “bridge” mechanism. This bridging effect enables the colloids to have a stronger adhesion to Al2O3 [79], thereby reducing the desorption efficiency. As an anionic surfactant, the binding sites of SDS in the composite system can be identified by changes in the characteristic peaks associated with Al2O3 and surface hydroxyl groups. In the montmorillonite–Al2O3 composites system, the strong absorption peak observed near 550 cm−1 can be attributed to the characteristic Al–O stretching vibration peak of Al2O3 [80]. Compared to the montmorillonite colloids–Al2O3 system, after SDS elution treatment, the Al–O characteristic peaks of the samples at pH = 4.0, 5.0, and 6.0 shifted from 549 cm−1, 544 cm−1, and 552 cm−1 to 542 cm−1, 542 cm−1, and 539 cm−1, respectively, exhibiting a distinct low-wavenumber red shift. The corresponding peak areas changed from 22.865, 40.643, and 28.415 to 22.702, 25.745, and 14.840. Under NaCl concentrations of 5 and 20 mM, the characteristic Al–O peaks shifted from 538 cm−1 and 548 cm−1 to 533 cm−1 and 531 cm−1, similarly exhibiting a red-shift trend, with peak areas decreasing from 45.697 and 31.140 to 30.750 and 29.112. Concurrently, the intensity of the surface hydroxyl (–OH) absorption peak near ~3600 cm−1 also exhibited a systematic change, indicating that SDS can interact with surface hydroxyl groups or coordinately unsaturated sites on the alumina surface. These changes are consistent with previous research findings, collectively suggesting that the primary site of action for SDS is Al2O3, rather than the montmorillonite colloids.
In contrast to SDS, CTAB can function as an efficient desorbent solely when the pH surpasses the isoelectric point of Al2O3. Under such conditions, the quaternary ammonium head group of CTAB, specifically (–N+(CH3)3), is capable of establishing a comparatively strong electrostatic interaction with the surface of Al2O3. Concurrently, its hydrophobic chain will project outward [81,82]. Conversely, when the pH value is lower than the IEP of Al2O3, electrostatic repulsion prevents CTAB from directly adsorbing onto the material surface. Adsorption only occurs at relatively high concentrations and is mediated by the interaction between hydrophobic chains. The results obtained from the experiment show that regardless of the changes in pH and ionic strength, CTAB is more effective than SDS or deionized water in eluting montmorillonite colloids from the surface of Al2O3. CTAB exhibits a strong adsorption affinity on the surface of montmorillonite by relying on the quaternary ammonium group (–N+(CH3)3). This effective adsorption neutralizes the negative charge carried by montmorillonite colloids themselves, directly suppressing the electrostatic attraction between montmorillonite colloids and Al2O3 [83]. When the long alkyl chains of CTA+ cations come into contact with the surface of montmorillonite colloids, they protrude, which makes the surface hydrophobic and reduces its affinity for water, hindering the approach of water molecules [84]. The combination of these two processes significantly enhances the desorption efficiency of montmorillonite colloids. In addition, the positively charged CTAB head groups are electrostatically attracted to the negatively charged surface of the Al2O3–montmorillonite colloids complexes, leading to extensive adsorption of CTAB; this process may neutralize or even reverse the surface charge of the complexes. At the same time, the CTAB head groups penetrate the interlayers of the montmorillonite colloids via electrostatic interactions [85], weakening the interaction between the montmorillonite colloids and Al2O3, thereby facilitating the desorption of the montmorillonite colloids. Analysis of the ATR-FTIR results reveals that the montmorillonite colloids exhibit an absorption peak at ~1030 cm−1 corresponding to the Si–O–Si stretching vibration [86] and a peak at ~3665 cm−1 corresponding to the Al–OH hydroxyl bending vibration [87]; both of these peaks serve as characteristic indicators of changes in the interlayer and surface structures of the montmorillonite colloids. Compared to the montmorillonite–Al2O3 system, in samples treated with CTAB elution under pH conditions of 4.0, 5.0, and 6.0, the characteristic peaks corresponding to the montmorillonite colloid shifted from 1054 cm−1, 1053 cm−1, and 1052 cm−1 to 1045 cm−1, 1046 cm−1, and 1045 cm−1, respectively, all exhibiting a red shift toward lower wavenumbers; the corresponding peak areas decreased from 22.865, 40.643, and 28.415 to 13.597, 7.397, and 1.526. Under NaCl concentrations of 5 and 20 mM, the characteristic peaks of the montmorillonite colloid shifted from 1052 cm−1 and 1059 cm−1 to 1049 cm−1 and 1051 cm−1, similarly exhibiting a red shift toward lower wavenumbers; the peak areas decreased from 45.697 and 31.140 to 27.837 and 24.805. These results are consistent with those of related studies, indicating that CTA+ cations can enter the interlayer space of montmorillonite or adsorb onto its surface through electrostatic interactions, altering the interlayer polar environment and local chemical bond constants, thereby causing shifts in the positions and changes in the intensities of the characteristic peaks.
Based on the patterns of shifts in infrared characteristic peaks and changes in peak intensity, the mechanisms of interaction between different eluents and the composite material can be summarized as follows: SDS primarily interacts with hydroxyl groups and active sites on the aluminum oxide surface, causing significant changes in the Al–O characteristic peak and the hydroxyl peak, while having a relatively minor effect on the structural characteristics of the montmorillonite colloids. In contrast, CTAB primarily binds to the montmorillonite colloids through electrostatic interactions. The cation CTA+ exhibits strong electrostatic attraction with the negatively charged montmorillonite colloids surface, leading to a noticeable shift in the infrared characteristic peaks of the montmorillonite colloids. In contrast to the lack of significant changes in infrared spectra observed during elution with deionized water, this indicates that the interaction between the surfactant and the solid interface is not a simple physical adsorption, but rather a stable bond primarily driven by electrostatic and interfacial chemical interactions.

4. Conclusions

The interaction mechanism controlling the adsorption and desorption of montmorillonite colloids on Al2O3 is mainly influenced by factors such as pH value, IS, and whether there are positively or negatively charged surfactants. The experimental results show that under different pH and ionic strength conditions, the adsorption capacity of montmorillonite colloids on the surface of Al2O3 is different. The main reason for this situation is related to the dispersion characteristics and electrostatic interaction of montmorillonite colloids. By X-ray photoelectron spectroscopy analysis, it can be observed that montmorillonite colloids are connected to the surface of Al2O3 through the –O–Si chemical functional group, which causes their deposition. The desorption experiments carried out later show that when SDS/CTAB is present, montmorillonite colloids will separate from the surface of Al2O3. This process mainly relies on charge neutralization or inversion as well as steric hindrance. The results of these experiments provide us with valuable insights into the environmental fate and interaction mechanisms of montmorillonite colloids in soil matrices. They also offer a very crucial basis for evaluating the transport dynamics of montmorillonite colloids and the pollutants they adsorb in terrestrial and aquatic environment.

Supplementary Materials

The following supporting information can be downloaded at https://www.mdpi.com/article/10.3390/colloids10020031/s1, Figure S1. Linear relationship chart between montmorillonite colloids concentration and Al concentration; Figure S2. The standard curve of montmorillonite colloids at an absorbance of 243 nm; Figure S3. XRD patterns of as-prepared montmorillonite colloids; Figure S4. FTIR patterns of montmorillonite colloids; Figure S5. EDS spectrum of Al2O3; Figure S6. Variations in the zeta potential of Al2O3 under different pH (a) and ionic strength (b) conditions; Figure S7. Total interaction energy between Al2O3 and montmorillonite colloids at different pH (a) and NaCl concentrations (b); Table S1. The kinetics parameters of montmorillonite colloids adsorption onto Al2O3.

Author Contributions

Conceptualization, X.Y. and Z.D.; Methodology, L.Y.; Formal analysis, L.Y., J.L. and H.W.; Investigation, L.Y., J.L., H.W., X.Y. and Z.D.; Data curation, L.Y., J.L. and H.W.; Writing—original draft, L.Y.; Writing—review and editing, X.Y.; Funding acquisition, X.Y. and Z.D. All authors have read and agreed to the published version of the manuscript.

Funding

This research was supported by the National Natural Science Foundation of China (No. 42277238), the Local Innovation and Entrepreneurship Team Project of Guangdong Special Support Program (No. 2019BT02L218) and the Guangdong Natural Science Foundation (2023A1515012128).

Data Availability Statement

The raw data supporting the conclusions of this article will be made available by the authors on request.

Conflicts of Interest

The authors declare no conflicts of interest.

Abbreviations

The following abbreviations are used in this manuscript:
SDSSodium dodecyl sulfate
CTABCetyltrimethylammonium Bromide
ISIonic strength

References

  1. Posadas, A.N.; Giménez, D.; Bittelli, M.; Vaz, M.C.M. Flury, Multifractal characterization of soil particle-size distributions. Soil Sci. Soc. Am. J. 2001, 65, 1361–1367. [Google Scholar] [CrossRef]
  2. Zheng, R.; Zhu, J.; Liao, P.; Wang, D.; Wu, P.; Mao, W.; Zhang, Y.; Wang, W. Environmental colloid behaviors of humic acid-Cadmium nanoparticles in aquatic environments. J. Environ. Sci. 2025, 149, 663–675. [Google Scholar] [CrossRef] [PubMed]
  3. Tang, L.; Gao, W.; Lu, Y.; Tabelin, C.B.; Liu, J.; Li, H.; Yang, W.; Tang, C.; Feng, X.; Xue, S. The formation of multi-metal(loid)s contaminated groundwater at smelting site: Critical role of natural colloids. J. Hazard. Mater. 2024, 471, 134408. [Google Scholar] [CrossRef] [PubMed]
  4. Li, X.; Cao, Z.; Du, Y.; Zhang, Y.; Wang, J.; Ma, X.; Hu, P.; Luo, Y.; Wu, L. Multi-metal contaminant mobilizations by natural colloids and nanoparticles in paddy soils during reduction and reoxidation. J. Hazard. Mater. 2024, 461, 132684. [Google Scholar] [CrossRef]
  5. Movahedi, H.; Shaygan, K.; Bovet, N.; Schiefler, A.A.; Jamshidi, S. Fate and cotransport of Pb(II) and Cd(II) heavy ions with bentonite colloidal flow in saturated porous media: The role of filter cake, counter ions, colloid concentration, and fluid velocity. J. Hazard. Mater. 2024, 466, 133546. [Google Scholar] [CrossRef]
  6. Shuhua, J.I.; Xiaowen, L.I.U.; Xiu, M.E.N.G.; Shaohui, X.U.; Qing, L.I.N. Coupled effects of pH and kaolinite colloids on antibiotic transport in porous media. Pedosphere 2023, 33, 788–799. [Google Scholar] [CrossRef]
  7. Deb, D.; Chakma, S. Colloid and colloid-facilitated contaminant transport in subsurface ecosystem—A concise review. Int. J. Environ. Sci. Technol. 2023, 20, 6955–6988. [Google Scholar] [CrossRef]
  8. Paswan, A.; Sharma, P.K. Three-dimensional modeling for colloid-facilitated contaminant transport with the effect of mobile and immobile sorbents. J. Contam. Hydrol. 2024, 264, 104369. [Google Scholar] [CrossRef]
  9. Clint, G.E.; Clint, J.H.; Corkill, J.M.; Walker, T. Deposition of latex particles on to a planar surface. J. Colloid Interface Sci. 1973, 44, 121–132. [Google Scholar] [CrossRef]
  10. Adamczyk, Z.; Siwek, B.; Musiał, E. Kinetics of colloid particle adsorption at heterogeneous surfaces. Langmuir 2001, 17, 4529–4533. [Google Scholar] [CrossRef]
  11. Yuan, Y.; Oberholzer, M.R.; Lenhoff, A.M. Size does matter: Electrostatically determined surface coverage trends in protein and colloid adsorption. Colloids Surf. A. 2000, 165, 125–141. [Google Scholar] [CrossRef]
  12. Senger, B.; Voegel, J.C.; Schaaf, P. Irreversible adsorption of colloidal particles on solid substrates. Colloids Surf. A 2000, 165, 255–285. [Google Scholar] [CrossRef]
  13. Adamczyk, Z.; Weroński, P.; Musiał, E. Particle adsorption under irreversible conditions: Kinetics and jamming coverage. Colloids Surf. A 2002, 208, 29–40. [Google Scholar] [CrossRef]
  14. Adamczyk, Z. Particle adsorption and deposition: Role of electrostatic interactions. Adv. Colloid Interface Sci. 2003, 100, 267–347. [Google Scholar] [CrossRef]
  15. Cieśla, M.; Adamczyk, Z.; Barbasz, J.; Wasilewska, M. Mechanisms of fibrinogen adsorption at solid substrates at lower pH. Langmuir 2013, 29, 7005–7016. [Google Scholar] [CrossRef]
  16. Adamczyk, Z.; Nattich-Rak, M.; Dąbkowska, M.; Kujda-Kruk, M. Albumin adsorption at solid substrates: A quest for a unified approach. J. Colloid Interface Sci. 2018, 514, 769–790. [Google Scholar] [CrossRef]
  17. Żeliszewska, P.; Wasilewska, M.; Cieśla, M.; Adamczyk, Z. Deposition of polymer particles with fibrinogen corona at abiotic surfaces under flow conditions. Molecules 2021, 26, 6299. [Google Scholar] [CrossRef]
  18. Tan, Q.; Tang, Q.; Shi, X.; Zhao, H.; Li, S.; Chen, Y.; Wei, X.; Xu, Z.; Pan, D.; Wu, W. Mechanistic model for the cotransport of colloids and radionuclides in saturated porous systems based on the interaction forces between colloids. Appl. Geochem. 2025, 184, 106381. [Google Scholar] [CrossRef]
  19. Wang, D.; Shen, C.; Jin, Y.; Su, C.; Chu, L.; Zhou, D. Role of solution chemistry in the retention and release of graphene oxide nanomaterials in uncoated and iron oxide-coated sand. Sci. Total Environ. 2017, 579, 776–785. [Google Scholar] [CrossRef]
  20. Zhang, R.; Tu, C.; Zhang, H.; Luo, Y. Enhancing effects of dissolved and media surface-bound organic matter on titanium dioxide nanoparticles transport in iron oxide-coated porous media under acidic conditions. J. Hazard. Mater. 2022, 438, 129421. [Google Scholar] [CrossRef]
  21. Zeng, L.; Li, X.; Jiang, F.; Yin, M.; Dang, Z.; Zhang, L.; Huang, W.; Yi, X. The effect of kaolinite on ferrihydrite colloid migration in soil: Molecular-scale mechanism study. Environ. Sci. Nano 2023, 10, 2754–2766. [Google Scholar] [CrossRef]
  22. Abudalo, R.A.; Bogatsu, Y.G.; Ryan, J.N.; Harvey, R.W.; Metge, D.W.; Elimelech, M. Effect of ferric oxyhydroxide grain coatings on the transport of bacteriophage PRD1 and Cryptosporidium parvum oocysts in saturated porous media. Environ. Sci. Technol. 2005, 39, 6412–6419. [Google Scholar] [CrossRef] [PubMed]
  23. Zhang, M.; Bradford, S.A.; Šimůnek, J.; Vereecken, H.; Klumpp, E. Do goethite surfaces really control the transport and retention of multi-walled carbon nanotubes in chemically heterogeneous porous media? Environ. Sci. Technol. 2016, 50, 12713–12721. [Google Scholar] [CrossRef] [PubMed]
  24. Rastghalam, Z.S.; Yan, C.; Shang, J.; Cheng, T. The role of Fe oxyhydroxide coating, illite clay, and peat moss in nanoscale titanium dioxide (nTiO2) retention and transport in geochemically heterogeneous media. Environ. Pollut. 2020, 257, 113625. [Google Scholar] [CrossRef] [PubMed]
  25. El Badawy, A.M.; Aly Hassan, A.; Scheckel, K.G.; Suidan, M.T.; Tolaymat, T.M. Key factors controlling the transport of silver nanoparticles in porous media. Environ. Sci. Technol. 2013, 47, 4039–4045. [Google Scholar] [CrossRef]
  26. Chowdhury, I.; Mansukhani, N.D.; Guiney, L.M.; Hersam, M.C.; Bouchard, D. Aggregation and stability of reduced graphene oxide: Complex roles of divalent cations, pH, and natural organic matter. Environ. Sci. Technol. 2015, 49, 10886–10893. [Google Scholar] [CrossRef]
  27. Liang, Y.; Luo, Y.; Shen, C.; Bradford, S.A. Micro-and nanoplastics retention in porous media exhibits different dependence on grain surface roughness and clay coating with particle size. Water Res. 2022, 221, 118717. [Google Scholar] [CrossRef]
  28. Liu, X.; Chen, G.; Su, C. Influence of collector surface composition and water chemistry on the deposition of cerium dioxide nanoparticles: QCM-D and column experiment approaches. Environ. Sci. Technol. 2012, 46, 6681–6688. [Google Scholar] [CrossRef]
  29. Zhao, J.; Liu, F.; Wang, Z.; Cao, X.; Xing, B. Heteroaggregation of graphene oxide with minerals in aqueous phase. Environ. Sci. Technol. 2015, 49, 2849–2857. [Google Scholar] [CrossRef]
  30. Zeng, L.; Lu, G.; Jiang, F.; Zhang, Y.J.; Jin, X.; Huang, W.; Lin, Y.J.; Lee, J.F.; Yi, X.; Dang, Z. Quantitative prediction and mechanistic insights into Cu(II) transport in kaolinite-coated sand columns affected by ferrihydrite nanoparticles. J. Hazard. Mater. 2025, 495, 139036. [Google Scholar] [CrossRef]
  31. Bradford, S.A.; Kim, H. Causes and implications of colloid and microorganism retention hysteresis. J. Contam. Hydrol. 2012, 138, 83–92. [Google Scholar] [CrossRef]
  32. Krishna, Y.S.R.; Seetha, N.; Hassanizadeh, S.M. Synergistic effects of temporal variations in flow and chemistry on colloid retention and remobilization in saturated porous media. J. Hydrol. 2024, 645, 132144. [Google Scholar] [CrossRef]
  33. Tang, Q.; Xu, Z.; Tan, Q.; Shi, X.; Wu, W.; Pan, D. Insight into impact of phosphate on the cotransport and corelease of Eu(III) with bentonite colloids in saturated quartz columns. J. Hazard. Mater. 2024, 461, 132572. [Google Scholar] [CrossRef] [PubMed]
  34. Zhou, D.; Wang, D.; Cang, L.; Hao, X.; Chu, L. Transport and re-entrainment of soil colloids in saturated packed column: Effects of pH and ionic strength. J. Soils Sediments 2011, 11, 491–503. [Google Scholar] [CrossRef]
  35. Torkzaban, S.; Bradford, S.A.; Vanderzalm, J.L.; Patterson, B.M.; Harris, B.; Prommer, H. Colloid release and clogging in porous media: Effects of solution ionic strength and flow velocity. J. Contam. Hydrol. 2015, 181, 161–171. [Google Scholar] [CrossRef]
  36. Liu, C.; Xu, Q.; Xu, Y.; Wang, B.; Long, H.; Fang, S.; Zhou, D. Characterization of adsorption behaviors of U (VI) on bentonite colloids: Batch experiments, kinetic evaluation and thermodynamic analysis. J. Radioanal. Nucl. Chem. 2022, 331, 597–607. [Google Scholar] [CrossRef]
  37. Lu, L.; Peng, X.; Chen, Z.; Wen, K.; Farooq, U.; Lu, T.; Qi, Z.; Chen, W. Size fractionation of montmorillonite colloids through saturated porous media and their heterogeneous contribution to the transport of Pb2+. Appl. Clay Sci. 2025, 271, 107808. [Google Scholar] [CrossRef]
  38. Emeh, C.; Igwe, O.; Onwo, E.S. Potential effect of environmental pollution on the degree of dissolution of iron and aluminium oxides in lateritic soils. Environ. Earth Sci. 2019, 78, 256. [Google Scholar] [CrossRef]
  39. Amenkhienan, B.E.; Dijkstra, F.; Warren, C.; Singh, B. Understanding extractable metal species relationships with phosphorus sorption and organic carbon in soils. Soil Res. 2024, 62, SR24118. [Google Scholar] [CrossRef]
  40. Valdivieso, A.L.; Bahena, J.R.; Song, S.; Urbina, R.H. Temperature effect on the zeta potential and fluoride adsorption at the α-Al2O3/aqueous solution interface. J. Colloid Interface Sci. 2006, 298, 1–5. [Google Scholar] [CrossRef]
  41. Man, J.; Zhang, S.; Li, J.; Zhao, B.; Chen, Y. Effects of electrolyte pH on morphologies and mechanical properties of α-Al2O3/Ni composite coatings and role of zeta potentials in co-deposition process. Surf. Coat. Technol. 2014, 249, 118–124. [Google Scholar] [CrossRef]
  42. Chotpantarat, S.; Kiatvarangkul, N. Facilitated transport of cadmium with montmorillonite KSF colloids under different pH conditions in water-saturated sand columns: Experiment and transport modeling. Water Res. 2018, 146, 216–231. [Google Scholar] [CrossRef] [PubMed]
  43. Zhang, X.; Cai, F.; Ma, F.; Reimus, P.; Qi, L.; Lu, D.; Soltanian, M.R.; Dai, Z. Investigating the role of Na-bentonite colloids in facilitating Sr transport in granite minerals through column experiments and modeling. J. Hazard. Mater. 2024, 463, 132851. [Google Scholar] [CrossRef] [PubMed]
  44. Li, Y.; Guo, N.; Xian, D.; Zhou, W.; Shi, Y.; Wang, J.; Chen, Y.; Liu, C. Bentonite colloids immobilization and release in quartz column and its influence on selenite migration. Sci. Total Environ. 2022, 820, 152833. [Google Scholar] [CrossRef]
  45. Fatisson, J.; Domingos, R.F.; Wilkinson, K.J.; Tufenkji, N. Deposition of TiO2 nanoparticles onto silica measured using a quartz crystal microbalance with dissipation monitoring. Langmuir 2009, 25, 6062–6069. [Google Scholar] [CrossRef]
  46. Vincent, B. The van der Waals attraction between colloid particles having adsorbed layers. II. Calculation of interaction curves. J. Colloid Interface Sci. 1973, 42, 270–285. [Google Scholar] [CrossRef]
  47. Ohshima, H.; Healy, T.W.; White, L.R. Accurate analytic expressions for the surface charge density/surface potential relationship and double-layer potential distribution for a spherical colloidal particle. J. Colloid Interface Sci. 1982, 90, 17–26. [Google Scholar] [CrossRef]
  48. Liu, X.; Sheng, G.; Yu, H. DLVO Approach to the Flocculability of a Photosynthetic H2-Producing Bacterium, Rhodopseudomonas acidophila. Environ. Sci. Technol. 2007, 41, 4620–4625. [Google Scholar] [CrossRef]
  49. Novich, B.E.; Ring, T.A. Colloid stability of clays using photon correlation spectroscopy. Clay. Clay Miner. 1984, 32, 400–406. [Google Scholar] [CrossRef]
  50. Bergström, L. Hamaker constants of inorganic materials. Adv. Colloid Interface Sci. 1997, 70, 125–169. [Google Scholar] [CrossRef]
  51. Ezzati, R.; Azizi, M.; Ezzati, S. A theoretical approach for evaluating the contributions of pseudo-first-order and pseudo-second-order kinetics models in the Langmuir rate equation. Vacuum 2024, 222, 113018. [Google Scholar] [CrossRef]
  52. Wang, H.; Zhao, L.; Hou, W. Pseudo-second-order kinetic equation for describing the effect of sorbent and sorbate concentrations. Langmuir 2024, 40, 3559–3568. [Google Scholar] [CrossRef] [PubMed]
  53. Liu, J.H.; Gates, W.P.; Yang, H.M.; Kurniawan, A.; Zhou, C.H. Tunable Colloidal Properties of Lauramidopropyl Betaine and Li Co-modified Montmorillonite in Ethanol/Water. Langmuir 2024, 40, 5378–5390. [Google Scholar] [CrossRef] [PubMed]
  54. Sarier, N.; Onder, E.; Ersoy, S. The modification of Na-montmorillonite by salts of fatty acids: An easy intercalation process. Colloid Surface A 2010, 371, 40–49. [Google Scholar] [CrossRef]
  55. Qian, Y.; Huang, Z.; Zhou, G.; Chen, C.; Sang, Y.; Yu, Z.; Jiang, L.; Mei, Y.; Wei, Y. Preparation and properties of organically modified Na-montmorillonite. Materials 2023, 16, 3184. [Google Scholar] [CrossRef]
  56. Jiang, S.; Lan, H.; Wu, Z.; Pan, D.; Wu, Y. Adsorption of alkylphenols by post-modified UiO-66: Adsorption characteristics and mechanism. J. Mol. Struct. 2025, 1322, 140422. [Google Scholar] [CrossRef]
  57. Li, X.; Guo, C.; Jin, X.; Yao, Q.; Liu, Q.; Zhang, L.; Lu, G.; Reinfelder, J.R.; Huang, W.; Dang, Z. Molecular-scale study of Cr (VI) adsorption onto lepidocrocite facets by EXAFS, in situ ATR-FTIR, theoretical frequency calculations and DFT+ U techniques. Environ. Sci. Nano 2022, 9, 568–581. [Google Scholar] [CrossRef]
  58. Wu, J. Understanding the electric double-layer structure, capacitance, and charging dynamics. Chem. Rev. 2022, 122, 10821–10859. [Google Scholar] [CrossRef]
  59. Plecis, A.; Schoch, R.B.; Renaud, P. Ionic transport phenomena in nanofluidics: Experimental and theoretical study of the exclusion-enrichment effect on a chip. Nano Lett. 2005, 5, 1147–1155. [Google Scholar] [CrossRef]
  60. Wu, J.; Liu, J.; Wu, P.; Sun, L.; Chen, M.; Shang, Z.; Ye, Q.; Zhu, N. The heteroaggregation and deposition behavior of nanoplastics on Al2O3 in aquatic environments. J. Hazard. Mater. 2022, 435, 128964. [Google Scholar] [CrossRef]
  61. Lee, H.Y.; Jung, S.H.; Lee, S.Y.; You, Y.H.; Ko, K.H. Correlation between Al2O3 particles and interface of Al-Al2O3 coatings by cold spray. Appl. Surf. Sci. 2005, 252, 1891–1898. [Google Scholar] [CrossRef]
  62. Niu, Y.; Ma, X.; Lu, G.; Zhao, D.; Ma, Z. Efficient Toluene Decontamination and Resource Utilization through Ni/Al2O3 Catalytic Cracking. Molecules 2024, 29, 4868. [Google Scholar] [CrossRef]
  63. Xu, H.; Chen, G.; Du, F.; Wang, X.; Dall’Agnese, Y.; Gao, Y. Electrospun Ti3C2Tx MXene and silicon embedded in carbon nanofibers for lithium-ion batteries. J. Phys. D Appl. Phys. 2022, 55, 204002. [Google Scholar] [CrossRef]
  64. Wang, A.; Zhao, C.; Wu, Z.; Yuan, W.; Yin, H. Anticorrosive and floating waterborne aluminum flake composite pigments prepared by encapsulation of SiO2/KH550 hybrid nanolayers and stearic acid molecules. Compos. Interfaces 2025, 32, 1369–1388. [Google Scholar] [CrossRef]
  65. Yang, Y.; Koeck, F.A.; Dutta, M.; Wang, X.; Chowdhury, S.; Nemanich, R.J. Al2O3 dielectric layers on H-terminated diamond: Controlling surface conductivity. J. Appl. Phys. 2017, 122, 155304. [Google Scholar] [CrossRef]
  66. Shen, Y.; Luo, C.; Chen, C.; Zhang, X.; Shi, M.; Gu, Z.; Su, R.; Wang, Y.; Li, L.; Wang, L.; et al. High-Temperature Resistance Photoluminescence Carbonized Polymer Dots Through Equilibrium Bi-Confinement Effects. Adv. Mater. 2025, 37, 2407811. [Google Scholar] [CrossRef]
  67. Kim, E.J.; Herrera, J.E. Characteristics of lead corrosion scales formed during drinking water distribution and their potential influence on the release of lead and other contaminants. Environ. Sci. Technol. 2010, 44, 6054–6061. [Google Scholar] [CrossRef]
  68. Wang, C.; Liu, S.; Luo, Y.; Liu, L.; Gao, Y. Xanthan gum-coordinated aluminum coagulation: Low-temperature performance and floc analysis under Aulacoseira granulata-polluted water. J. Water Process Eng. 2025, 75, 108069. [Google Scholar] [CrossRef]
  69. Cai, L.T.; Wu, D.Y.; Qin, Z.P.; Zuo, S.Y. Elucidation of interaction mechanisms between amorphous alumina and montmorillonite in laterite. Clay Miner. 2025, 60, 42–52. [Google Scholar] [CrossRef]
  70. Wang, P.; Keller, A.A. Partitioning of hydrophobic organic compounds within soil–water–surfactant systems. Water Res. 2008, 42, 2093–2101. [Google Scholar] [CrossRef]
  71. Liu, Z.; Zhao, G.; Brewer, M.; Lv, Q.; Sudhölter, E.J. Comprehensive review on surfactant adsorption on mineral surfaces in chemical enhanced oil recovery. Adv. Colloid Interface Sci. 2021, 294, 102467. [Google Scholar] [CrossRef]
  72. Belhaj, A.F.; Elraies, K.A.; Alnarabiji, M.S.; Kareem, F.A.A.; Shuhli, J.A.; Mahmood, S.M.; Belhaj, H. Experimental investigation, binary modelling and artificial neural network prediction of surfactant adsorption for enhanced oil recovery application. Chem. Eng. J. 2021, 406, 127081. [Google Scholar] [CrossRef]
  73. Ishiguro, M.; Koopal, L.K. Surfactant adsorption to soil components and soils. Adv. Colloid Interface Sci. 2016, 231, 59–102. [Google Scholar] [CrossRef]
  74. Mejia-Avendaño, S.; Zhi, Y.; Yan, B.; Liu, J. Sorption of polyfluoroalkyl surfactants on surface soils: Effect of molecular structures, soil properties, and solution chemistry. Environ. Sci. Technol. 2020, 54, 1513–1521. [Google Scholar] [CrossRef] [PubMed]
  75. Chowdhury, I.; Duch, M.C.; Mansukhani, N.D.; Hersam, M.C.; Bouchard, D. Interactions of graphene oxide nanomaterials with natural organic matter and metal oxide surfaces. Environ. Sci. Technol. 2014, 48, 9382–9390. [Google Scholar] [CrossRef] [PubMed]
  76. Førland, G.M.; Rahman, T.; Høiland, H.; Børve, K.J. Adsorption of sodium dodecyl sulfate and butanol onto acidic and basic alumina. J. Colloid Interface Sci. 1996, 182, 348–355. [Google Scholar] [CrossRef]
  77. Nguyen, T.M.T.; Do, T.P.T.; Hoang, T.S.; Nguyen, N.V.; Pham, H.D.; Nguyen, T.D.; Pham, T.N.M.; Le, T.S.; Pham, T.D. Adsorption of anionic surfactants onto alumina: Characteristics, mechanisms, and application for heavy metal removal. Int. J. Polym. Sci. 2018, 2018, 2830286. [Google Scholar] [CrossRef]
  78. Quevedo, I.R.; Olsson, A.L.; Tufenkji, N. Deposition kinetics of quantum dots and polystyrene latex nanoparticles onto alumina: Role of water chemistry and particle coating. Environ. Sci. Technol. 2013, 47, 2212–2220. [Google Scholar] [CrossRef]
  79. Güngör, N.; Alemdar, A.; Atici, O.; Ece, I.O. The effect of SDS surfactant on the flow and zeta potential of bentonite suspensions. Mater. Lett. 2001, 51, 250–254. [Google Scholar] [CrossRef]
  80. Djebaili, K.; Mekhalif, Z.; Boumaza, A.; Djelloul, A.X.P.S. XPS, FTIR, EDX, and XRD analysis of Al2O3 scales grown on PM2000 alloy. J. Spectro. 2015, 2015, 868109. [Google Scholar] [CrossRef]
  81. Moslemizadeh, A.; Aghdam, S.K.Y.; Shahbazi, K.; Aghdam, H.K.Y.; Alboghobeish, F. Assessment of swelling inhibitive effect of CTAB adsorption on montmorillonite in aqueous phase. Appl. Clay Sci. 2016, 127, 111–122. [Google Scholar] [CrossRef]
  82. Bahari, N.M.; Che Mohamed Hussein, S.N.; Othman, N.H. Synthesis of Al2O3–SiO2/water hybrid nanofluids and effects of surfactant toward dispersion and stability. Part. Sci. Technol. 2021, 39, 844–858. [Google Scholar] [CrossRef]
  83. Tahani, A.; Karroua, M.; Van Damme, H.; Levitz, P.; Bergaya, F. Adsorption of a cationic surfactant on Na–montmorillonite: Inspection of adsorption layer by X-ray and fluorescence spectroscopies. J. Colloid Interface Sci. 1999, 216, 242–249. [Google Scholar] [CrossRef]
  84. Shi, Z.; Li, P.; Liu, L. Interactions between CTAB and montmorillonite by atomic force microscopy and molecular dynamics simulation. Colloid Surface A 2023, 657, 130656. [Google Scholar] [CrossRef]
  85. Xue, W.; He, H.; Zhu, J.; Yuan, P. FTIR investigation of CTAB-Al-montmorillonite complexes. Spectrochim. Acta Part A Mol. Biomol. Spectrosc. 2007, 67, 1030–1036. [Google Scholar] [CrossRef]
  86. Zhang, X.; Bhuvana, S.; Loo, L.S. Characterization of layered silicate dispersion in polymer nanocomposites using Fourier transform infrared spectroscopy. J. Appl. Polym. Sci. 2012, 125, E175–E180. [Google Scholar] [CrossRef]
  87. Madejova, J.; Komadel, P. Baseline studies of the clay minerals society source clays: Infrared methods. Clays Clay Miner. 2001, 49, 410–432. [Google Scholar] [CrossRef]
Figure 1. SEM image of montmorillonite colloids (a), the particle size distribution histogram of montmorillonite colloids (b) and TEM micrograph of montmorillonite colloids (c,d).
Colloids 10 00031 g001
Figure 2. Adsorption of montmorillonite colloids on Al2O3 under different pH conditions (IS = 10 mM) (a) and different IS conditions (pH = 5.0) (b), and the pseudo first-order model (represented by dotted line) and pseudo second-order model (represented by solid line).
Colloids 10 00031 g002
Figure 3. The zeta potential of montmorillonite colloids at different pH values (a) and NaCl concentrations (b).
Colloids 10 00031 g003
Figure 4. SEM image of the Al2O3 surface (a), the Al2O3 surface with adsorbed montmorillonite colloids (b,c), and EDS images of Al, O, and Si (df).
Colloids 10 00031 g004
Figure 5. Elemental analysis of the EDS spectrum for Al2O3–montmorillonite colloids complexes.
Colloids 10 00031 g005
Figure 6. Comparison of XPS spectra for the Al2O3 surface before and after montmorillonite colloids adsorption: (a) O 1s, (b) Si 2p, and (c) Al 2p.
Colloids 10 00031 g006
Figure 7. Desorption of montmorillonite colloids adsorbed on Al2O3 at different pH values (a) and different concentration of NaCl (b).
Colloids 10 00031 g007
Figure 8. ATR-FTIR spectra of montmorillonite colloids–Al2O3 complexes before and after treatment with deionized water and different surfactants. (a) pH 4.0, 10 mM NaCl; (b) pH 5.0, 5 mM NaCl; (c) pH 5.0, 10 mM NaCl; (d) pH 5.0, 20 mM NaCl; (e) pH 6.0, 10 mM NaCl.
Colloids 10 00031 g008
Disclaimer/Publisher’s Note: The statements, opinions and data contained in all publications are solely those of the individual author(s) and contributor(s) and not of MDPI and/or the editor(s). MDPI and/or the editor(s) disclaim responsibility for any injury to people or property resulting from any ideas, methods, instructions or products referred to in the content.