


Abstract
Memory-bank methods such as PatchCore are widely used in industrial quality control for visual anomaly detection since they require no training, are fast to deploy and achieve strong accuracy. However, they are memory-intensive. Furthermore, a single production line typically involves different products or cameras, so using a single anomaly detection method with a shared nearest-neighbor memory bank is attractive since it simplifies deployment and makes new products easy to add. Nevertheless, embeddings from different products/cameras can interfere during retrieval, causing what we call “memory pollution”. In this work, we study this effect through a new diagnostic framework, which involves: (1) a new metric, the wrong-neighbor rate (WNR), which measures how often a query’s nearest neighbor belongs to a different product; (2) an empirically validated phenomenon, “oracle inversion”, where querying only the product’s own data can underperform the shared bank under a fixed memory budget; (3) a first-order analytical model of the WNR, which predicts how pollution grows with product count and memory budget; and (4) a minimal training-free router that removes the effect of memory pollution. Our results show that our system performs robustly across different datasets and backbones, with up to 25× memory reduction, which makes our framework attractive for industrial applications.
1. Introduction
Memory-bank methods [1,2,3] are widely used for visual anomaly detection: they store patch-level features extracted from a small set of normal images and flag test patches whose nearest-neighbor distance exceeds a threshold. Because the feature extractor (backbone) remains frozen, these methods do not require gradient-based training and can operate from only a small reference set (e.g., ten normal images) per product. Recent self-supervised backbones such as DINOv2 [4] and DINOv3 [5] further improve feature quality, yielding strong detection and localization on standard benchmarks [6,7,8]. Yet modern inspection systems rarely handle a single product variant, and deploying these methods across multiple product types typically requires a separate bank per product, duplicating retrieval infrastructure.
An automotive body-in-white line, for example, may acquire images of doors, hoods, and fenders in the same station; a consumer-electronics line may inspect multiple board variants on the same conveyor. Each product contributes its own set of normal embeddings, and the total memory footprint grows linearly with the number of products. Maintaining a separate bank per product also requires operational reconfiguration when adding or removing products. A less explored alternative is a shared memory bank with a fixed total budget: embeddings from all products coexist in a single index, and the budget is divided among them. This design simplifies deployment and supports incremental growth, yet it raises a practical question: how do products interact when their embeddings share the same nearest-neighbor search? [9,10]. The naive shared design does not use product identity to restrict retrieval, so every query searches the whole bank. In principle, one could exclude the embeddings of other products, but that requires knowing the product before retrieval, which is not always available from the production line. The routing mechanism we introduce below instead recovers this identity from the image itself.
Compression can partly alleviate the scaling problem. Coreset selection, as used in PatchCore [1], retains only a representative subset of the stored features. Other strategies include prototype clustering (replacing groups of similar patches with their centroid) and spatial pooling (reducing the spatial resolution of feature maps before storage). Compression alone, however, does not address the fundamental question of how to distribute a fixed budget across products that differ in visual complexity.
One strategy is adaptive allocation: estimate how each product’s detection performance varies with its memory budget, and then assign more memory to products that benefit most. We construct a diagnostic per-product oracle allocation by selecting, for each product independently, the budget that maximizes its AUROC on an isolated per-product bank using test-set labels. This oracle is not a deployable method; it reflects the optimum under an implicit no-interference assumption and serves to reveal the gap between isolated and shared performance. When applied to a shared bank, however, the per-product oracle consistently underperforms a uniform baseline. The gap reaches up to 1.7 percentage points (at 12 MB) and persists across all tested budgets. We call this effect memory pollution: products that receive a disproportionate share of the budget create dense regions in the embedding space that attract nearest-neighbor queries from other products. For example, if two products share a bank of 200 embeddings and an adaptive allocator assigns 150 to Product A and only 50 to Product B, Product A forms a dense cluster; when a test image of Product B is scored, its nearest-neighbor queries may be drawn toward Product A’s cluster, retrieving foreign embeddings and distorting Product B’s anomaly scores. To quantify pollution, we introduce the wrong-neighbor rate (WNR), defined as the fraction of retrieved neighbors that belong to a different product than the query; since anomalous patches may legitimately lack same-product neighbors, WNR provides an upper bound on cross-product interference. At low budgets, the average WNR across 15 MVTec AD products reaches 38%, and at the aggregate level, higher mean WNR coincides with larger AUROC degradation under oracle allocation. While inter-class interference has been studied in reconstruction-based multi-class models [11,12,13] and addressed through per-product routing in continual settings [14,15], no prior work quantifies the interference that arises specifically when multiple products share a single k-nearest-neighbor (KNN) index under a fixed memory budget or studies how budget allocation interacts with this interference.
As a minimal intervention to remove this interference, we evaluate a routing mechanism that identifies the product before the nearest-neighbor search. For each product, we compute a single prototype vector (the mean of its full, uncompressed training patch embeddings) in a one-time pass; the prototype is, therefore, independent of the compression method and of the per-product memory budget. At test time, the query image is compared to all prototypes, and retrieval is restricted to the sub-bank of the closest product. This router adds 0.06 MB of storage for 15 products (0.12 MB for the 30-product mega-bank) and achieves 100% top-1 accuracy across all 30 product types on the evaluated benchmarks (15 from MVTec AD, 12 from VisA, 3 from BTAD), including four visually similar PCB variants in VisA. With routing in place, the per-product oracle recovers its expected advantage over uniform allocation, supporting the interpretation that interference in shared retrieval is the driver of the oracle failure. Once routing is active, the performance gap across five allocation strategies (uniform, complexity-based, overlap-based, inverse-overlap, and the per-product oracle) shrinks to at most 1 percentage point. Routing, therefore, reduces sensitivity to the choice of allocator, and uniform allocation performs on par with more complex alternatives. At an 18 MB budget, top-1 routing with uniform allocation improves image-level AUROC from 90.8% to 91.1% (91.4% when combined with oracle allocation).
Overall, we find that inter-product interference (memory pollution) drives the degradation observed in shared memory banks for multi-product anomaly detection, and that a minimal prototype router mitigates this interference on the evaluated benchmarks; we validate the findings across 30 product types from three public benchmarks. The contribution is, therefore, diagnostic rather than architectural: instead of proposing a new detector, we contribute a diagnostic framework for shared-bank retrieval, comprising a metric (the WNR), a phenomenon (the oracle inversion), an analytical model of the wrong-neighbor rate that approximates the pollution from the number of products and the per-product budget, and a minimal training-free intervention that removes it. We further show that the diagnosis and the remedy generalize across four feature backbones spanning two families (self-supervised DINO and vision–language encoders) on all three benchmarks and persist under input corruptions, and that the practical benefit of routing is larger in the high-product-count regime. The router itself is not the contribution; it is the intervention that confirms the diagnosis.
Our main contributions are:
- Diagnosis of memory pollution. We introduce the wrong-neighbor rate (WNR), a metric that quantifies cross-product contamination in shared KNN banks as an upper bound on inter-product interference. Using WNR and a diagnostic per-product oracle (computed with test-set labels on isolated banks), we identify an oracle inversion: the allocation that maximizes per-product performance in isolation consistently degrades detection when retrieval is shared. The effect appears across two benchmarks (up to 1.7 pp on MVTec AD and up to 2.21 pp on VisA) and is absent on BTAD, which has only three products and, therefore, a much larger per-product memory at the same total budget. A controlled experiment that fixes the per-product budget and varies only the number of products confirms that the wrong-neighbor rate and the resulting degradation grow with the number of co-stored products (Section 3, Section 4.6.1, and Section 4.6.2).
- Mitigation and practical implications. We show that a minimal prototype router (one mean embedding per product, 0.06 MB for 15 products, computed in closed form, without gradient-based training) mitigates the diagnosed interference on the evaluated benchmarks. While prototype-based routing has been explored in continual anomaly detection [14,15], we demonstrate that this minimal variant suffices to match, on MVTec AD, fully isolated per-product banks (459 MB) at 25× lower memory. We also evaluate two natural extensions of the router: increasing the number of prototypes per product does not yield a reliable improvement in the few-shot regime and reduces routing separability (Section 4.7.6), and a margin-based fallback restores the original AUROC under forced misrouting (Section 4.7.7); the latter validates the recovery mechanism and not the detection of natural misroutings, which we leave as future work. Under routing, all five tested allocation strategies converge to within 1 pp, so that uniform allocation requires no per-product tuning (Section 4).
The study includes a compression evaluation across five families in the shared multi-product setting, which establishes the operating regime for the pollution analysis. The evaluation spans 30 product types across MVTec AD, VisA, and BTAD, with the central diagnosis further tested across backbones and datasets.
2. Related Work
2.1. Memory-Bank Anomaly Detection
Storing reference features and detecting anomalies through distance-based retrieval is a standard paradigm in industrial anomaly detection. SPADE [2] compares test patches against a bank of pretrained features using k-nearest neighbors. PatchCore [1] adds a greedy coreset selection step that reduces the bank size while maintaining coverage of the normal feature distribution. PaDiM [3] takes a different route by fitting per-position Gaussian distributions instead of storing raw features. Reconstruction-based alternatives, such as Reverse Distillation [16], detect anomalies from discrepancies between a teacher and a student network. EfficientAD [17] combines a lightweight student–teacher model with an autoencoder to target millisecond-level latency.
These methods are typically designed and evaluated in single-product settings. When extended to multi-class anomaly detection, reconstruction-based models suffer from inter-class interference: the network generalizes its reconstructive capacity across classes, reducing sensitivity to per-class anomalies. UniAD [11] identifies this as the “identical shortcut” and proposes layer-wise query embeddings to break it. MINT-AD [12] generates class-aware queries via implicit neural representations, and ROADS [13] injects class-specific prompts into a teacher–student decoder. Dinomaly [18] trains a single reconstruction model across product types. These approaches all operate on reconstruction architectures and require gradient-based optimization. The interference they address arises in the decoder, not in a shared nearest-neighbor index. By contrast, our focus is on shared KNN retrieval under fixed memory budgets, where embeddings from multiple products coexist in a single bank and may interfere through nearest-neighbor search.
2.2. Continual and Multi-Product Anomaly Detection
Continual learning [19] addresses the problem of adding new tasks without forgetting previous ones. In the anomaly detection context, several recent works adapt this setting. PatchCoreCL [10] extends PatchCore with per-class sub-banks that are updated incrementally as new product types arrive. CADIC [9] uses an incremental coreset strategy to manage memory under a continual stream of product classes. MECAD [20] adopts a multi-expert architecture that assigns each product to one of a limited set of expert modules by feature similarity, trained with coreset replay. UCAD [14] learns contrastive key–prompt pairs per task and routes test images via key matching, requiring gradient-based prompt optimization and the Segment Anything Model. GCR [15] constructs per-category prototype banks from frozen ViT features and routes test images by accumulated nearest-prototype distance, achieving near-zero forgetting on MVTec AD.
Most of these methods rely on per-product storage separation, either explicitly through expert modules or implicitly through class-indexed sub-banks. GCR is closest in spirit to the routing step we evaluate, since both compute per-product prototypes from frozen features and route queries by prototype distance. The contribution we make is not the routing mechanism itself but, rather, the identification, quantification, and characterization of a failure mode that arises specifically when a single KNN index is shared across products under a fixed memory budget: the wrong-neighbor rate (WNR) as a quantitative measure of cross-product contamination, and the oracle inversion as an empirical phenomenon that shows when adaptive allocation fails. GCR and most of the methods above assume per-product storage separation by design and, therefore, avoid the regime in which pollution emerges; they do not measure interference in shared retrieval, do not study the interaction between budget allocation and retrieval, and report no quantity analogous to WNR. We treat the prototype router as a minimal intervention used to test whether the diagnosed interference is responsible for the observed degradation, not as a new algorithmic proposal.
2.3. Feature Backbones for Anomaly Detection
The quality of stored features directly affects memory-bank methods. Vision Transformers [21] provided a general-purpose architecture, and self-supervised objectives progressively improved the features available for downstream tasks. DINO [22] showed that self-supervised ViTs learn features with strong local structure. DINOv2 [4] scaled this approach to larger datasets and model sizes, and DINOv3 [5] further advances it with larger-scale training and architectural refinements, reporting improved representations that are well suited to patch-level retrieval. Recent work has begun to exploit these backbones specifically for anomaly detection: AD-DINOv3 [23] calibrates DINOv3 features for zero-shot anomaly detection, and a recent survey [24] provides a broader overview of foundation models applied to this task.
In our work, we extract patch features from a frozen DINOv3-ViT-L/16 backbone at an intermediate layer, where representations retain mid-level visual patterns that are useful for defect localization. Our conclusions regarding memory pollution and routing are not specific to DINOv3; they apply to any feature extractor that produces patch-level embeddings for nearest-neighbor retrieval.
3. Materials and Methods
Figure 1 provides an overview of the pipeline used in our experiments.
Figure 1.
Overview of the experimental pipeline. Training images from P products are processed by a frozen DINOv3-ViT-L/16 backbone, producing patch embeddings per image. The embeddings are compressed (coreset, k-means, or density-aware residuals) and stored in a shared memory bank partitioned into per-product sub-banks . A mean-embedding prototype (the average of the product’s patch embeddings, not of its pixels) is computed per product. At test time, the query image is routed to the closest prototype by comparing the mean of its own patch embeddings, restricting k-nearest-neighbor retrieval to the matched sub-bank. Anomaly scores are derived from the 95th percentile of patch-level distances.
3.1. Problem Formulation
We consider a multi-product inspection scenario with P product types . For each product, p, a small set of N normal training images is available. A frozen feature extractor maps each image x to a set of patch-level embeddings , where is the number of spatial patches, and D is the feature dimension. The normal embeddings for product p are stored in a sub-bank , and the full memory bank is the union . A fixed total memory budget, B (in megabytes) constrains the bank size. The system must detect and localize anomalies in test images that may belong to any of the P products, without knowing the product identity in advance.
3.2. Feature Extraction
We use DINOv3-ViT-L/16 [5] as the feature extractor. Input images are resized to pixels and processed by the frozen backbone. With a patch size of 16, the model yields patch tokens, each of dimension . We extract features from the sixth-to-last hidden state of the frozen backbone (the tensor hidden_states[-6]; for this 24-block model, it is the output of transformer block 18 under zero-based indexing, which we refer to as layer 18 for brevity), where representations retain mid-level visual patterns that are useful for defect detection; final-layer representations tend to be more semantic and less sensitive to local structural anomalies. We retain only the patch tokens and discard any non-patch tokens (e.g., the class token, and register tokens when present), so that per image.
3.3. Anomaly Scoring
Given a test image, x, and the memory bank, , we compute anomaly scores at both the image and pixel level using k-nearest neighbor (KNN) retrieval with and Euclidean distance.
3.3.1. Image-Level Score
For each test patch, , we retrieve its k nearest neighbors in and compute the mean distance, . The image-level anomaly score is the 95th percentile of the patch scores: .
3.3.2. Pixel-Level Score Map
The same patch scores are reshaped into a spatial grid and upsampled to via bilinear interpolation, producing a dense anomaly map aligned with the input image.
3.4. Memory Bank Compression
Storing all patch embeddings per product at full resolution requires bytes per product (float32). For products, this exceeds 450 MB. We evaluate five compression families that reduce the bank size while preserving detection accuracy:
- Coreset selection (greedy k-center): iteratively select the patch farthest from the current set, retaining a representative subset [1].
- Prototype clustering (k-means): partition patches into clusters and store only cluster centroids [25].
- Density-aware residuals: combine k-means centroids with a set of residual patches sampled near cluster boundaries, capturing fine-grained variation that centroids miss.
- Spatial pooling: apply or average pooling to the feature map before storage, reducing the number of patches by or while preserving spatial structure [1,2].
- Combinations: e.g., 100 k-means centroids plus 400 residual patches per product (km100_res400), yielding compression.
These strategies reduce the number of stored embeddings. An orthogonal approach is to reduce their numerical precision (e.g., float16 or int8 quantization), which could be combined with any of the above methods for further compression; we do not evaluate precision reduction in this work.
3.5. Memory Pollution
When the bank is shared across products, the k-nearest neighbors of a test patch from product may include patches from other products . We call this memory pollution and quantify it with the wrong-neighbor rate:
where is the set of all test patches from product p (both normal and anomalous images), denotes the j-th nearest neighbor of q in the full shared bank , is the union of the sub-banks of all other products, and (the same as the anomaly scorer). A WNR of zero means that all retrieved neighbors belong to the correct product; higher values indicate cross-product contamination. Since the memory bank contains only normal embeddings, a truly anomalous patch may legitimately have no close neighbor in its own product’s sub-bank; however, such patches constitute a small fraction of the total (most patches in an anomalous image are structurally normal), and they would increase WNR, regardless of interference, making our reported values a conservative upper bound on the pollution attributable to cross-product interference; in Section 4.3, we verify empirically that restricting the WNR to normal test images leaves it almost unchanged, confirming that it is not an artifact of anomaly-related mismatch.
Memory pollution distorts budget allocation. Consider a per-product oracle that, for each product in isolation, evaluates its AUROC at a discrete set of budget levels embeddings using test-set labels. Given a total budget, B, the oracle distributes it via greedy marginal gain: all products start at the minimum allocation (25 embeddings) and, at each step, the next budget increment is assigned to the product with the highest AUROC gain per additional embedding, until the budget is exhausted. This oracle is not a deployable method; it serves as a diagnostic tool to reveal the upper bound of isolated per-product optimization. When these per-product-optimal budgets are applied to a shared bank, products that receive extra memory create dense clusters in the embedding space. These clusters attract nearest-neighbor queries from other products, degrading their scores. The result is an oracle inversion: the allocation that is optimal for each product in isolation performs worse than uniform allocation. This inversion is not a failure of the oracle construction; it is a direct consequence of the interference introduced by shared retrieval.
3.6. Latent Routing
We address memory pollution by identifying the product before the nearest-neighbor search. For each product p, we compute a prototype
where denotes the full (uncompressed) set of training patch embeddings for product p, so that is the average of these D-dimensional latent vectors (not an average over raw pixels). The prototype is thus independent of the compression method and budget applied to the sub-bank . Given a test image x, we compute the mean of its patch embeddings, , that is, the average over the DINOv3 patch tokens rather than over the input image itself, and measure its Euclidean distance to each prototype: . The top-M products with the smallest distances constitute the candidate set, and the nearest-neighbor search is restricted to .
Two operational modes follow from this design:
- Known-ID. When the product identity is available (e.g., from a PLC signal or barcode), and routing is exact with no computation.
- Unknown-ID. When the product is unknown, the router selects the top-M candidates. In our experiments, top-1 achieves 100% accuracy across all 30 evaluated product types; top-3 provides an additional margin.
The storage overhead is bytes for the prototype vectors (e.g., 0.06 MB for and 0.12 MB for with ). Prototype computation requires a single non-iterative pass over the stored embeddings and involves no gradient-based optimization, keeping the entire pipeline training-free.
4. Results
4.1. Experimental Setup
Our evaluation uses three public benchmarks. MVTec AD [6] contains 15 product categories spanning textures (carpet, leather, wood) and objects (bottle, screw, transistor), with 1725 test images. VisA [7] provides 12 categories of real-world industrial components, including four printed circuit board variants (pcb1–pcb4) that share similar visual structure. BTAD [8] contributes three additional product types. MVTec AD serves as the primary evaluation set; VisA and BTAD are used for cross-benchmark validation in Section 4.6. For each product, normal training images are sampled randomly per seed.
All experiments follow a continual evaluation protocol. Products are added to the shared memory bank in alphabetical order. When a new product arrives, its N training images are extracted once and its sub-bank is compressed to the allocated budget (e.g., via coreset selection). Existing sub-banks are not modified: each product’s compressed bank is computed independently from its own training embeddings and remains fixed once created. The per-product budget is determined by the final number of products P: under uniform allocation, each product receives of the total budget, regardless of when it is added. The total bank size, therefore, grows from (one product) to B (all P products). After each addition, all previously registered products are evaluated. For products, this yields 120 (product, step) evaluation pairs per seed. Unless stated otherwise, tables report results at the final step (all P products registered). Unless otherwise noted, the results are averaged over three random seeds (0, 1, 2) and reported as means ± standard deviations.
The feature extractor and scorer are as described in Section 3.2 and Section 3.3: a frozen DINOv3-ViT-L/16 backbone producing 784 patch embeddings of dimension 1024 from layer 18, scored via 5-nearest-neighbor retrieval with Euclidean distance and 95th-percentile image aggregation. Score smoothing is disabled (); a smoothing ablation is provided in Section 4.7. We note three design choices that remain fixed throughout our experiments: (i) layer 18 was selected following preliminary experiments showing that mid-depth layers retain local structure better suited for defect detection than the final semantic layer; (ii) neighbors balances robustness against noise with spatial precision; (iii) the 95th percentile suppresses outlier patch scores while remaining sensitive to localized anomalies. Our conclusions about memory pollution and routing are not specific to these choices; they depend only on the shared-bank retrieval mechanism.
The primary detection metric is image-level AUROC, averaged first across products and then across seeds. We also report image-level AUPR (area under the precision–recall curve), which is more sensitive than AUROC when the class distribution is imbalanced [26]. Pixel-level AUROC measures localization quality. For the smoothing ablation in Section 4.7, we additionally report AuSPRO, the area under the per-region overlap curve [27], which evaluates localization on a per-connected-component basis. We also report total memory (MB) and query time (ms per image). Query time measures the scoring pipeline only: prototype comparison (when routing), KNN retrieval, and score aggregation over all patches; it excludes backbone feature extraction, which is a fixed one-time cost per image ( ms on our GPU), regardless of the number of products. Memory budgets are expressed as total bank size across all P products; under uniform allocation, each product receives budget/P. The DINOv3-ViT-L/16 backbone occupies GB in FP32 ( GB in FP16), a fixed cost independent of the number of products; the 18 MB bank adds less than 2% to this footprint. Our compression ratios refer to the bank component, which is the part that scales with P. All timing measurements were obtained on a single Intel Core i9 CPU using scikit-learn NearestNeighbors with brute-force Euclidean search, batch size 1, averaged over all test images and seeds.
Reproducibility
Features are extracted once with the public facebook/dinov3-vitl16-pretrain-lvd1689m checkpoint, loaded through the Hugging Face transformers library and kept frozen, and are cached; all experiments operate on these cached features. Input images are resized to and normalized with standard ImageNet statistics (mean , standard deviation ) before extraction. We do not normalize the extracted patch embeddings (no normalization or whitening): they are stored and compared in raw form under Euclidean distance. Coreset selection is k-center greedy applied to a 64-dimensional PCA projection of each product’s embeddings, with the first center drawn at random under a fixed per-seed random state and the remaining centers added by farthest-point traversal. The k-means compression variants use scikit-learn MiniBatchKMeans (n_init, max_iter, random_state), and the multi-prototype routing study (Section 4.7.6) uses KMeans (n_init, with random_state set to the run seed). Training-image sampling, the PCA projection, and coreset initialization are all seeded; unless stated otherwise, results are averaged over seeds 0, 1, and 2. Code and configuration files are released in the repository linked under Data Availability.
4.2. Memory Compression
Table 1 compares seven compression configurations on MVTec AD, evaluated after all 15 products have been added to the shared bank. For reference, evaluating each product against its own isolated bank (no shared retrieval) yields 91.2 ± 0.7% at the same 459 MB total, confirming that interference is negligible without compression; the 91.2% AUROC ceiling is determined by the few-shot regime (), not by sharing. The density-aware residual configuration (km100_res400: 100 k-means centroids plus 400 boundary residuals per product) matches this ceiling (91.3% vs. 91.2%) while using 16× less memory and reducing query time from 783 ms to 41 ms.
Table 1.
Compression benchmark on MVTec AD (15 products, 3 seeds). “Baseline (all)” = uncompressed shared bank (all 7840 embeddings per product in a single index); memory is the total across all 15 products. Configurations are sorted by image-level AUROC. Query time is measured per image including KNN retrieval. Pixel AUROC is omitted for k50 because 50 embeddings per product provide insufficient spatial coverage for reliable localization evaluation.
Three configurations at 16× compression (km100_res400, coreset_500, and k500) fall within 1 pp of the baseline. Among these, density-aware residuals achieve the highest image AUROC because the boundary patches capture fine-grained variation that pure k-means centroids discard. Greedy coreset selection (coreset_500) provides a comparable result without requiring a clustering step. The query time drops by 13–19× because the bank shrinks from approximately 118K to 7.5K embeddings.
At 16× compression, pixel-level AUROC drops by at most 0.8 pp (97.5% to 96.7%). Spatial average pooling (), not shown in the table, achieves a pixel AUROC of 97.8%, above the uncompressed baseline (97.5%), because pooling suppresses patch-level noise; this effect is analyzed in Section 4.7. The Pareto front of image AUROC versus memory (Figure 2) confirms that the 16× compression point lies near the efficiency knee. For the remainder of this section, compressed banks use coreset selection and budgets are expressed in MB.
Figure 2.
Image AUROC vs. total memory on MVTec AD (15 products, 3 seeds). Each point is a compression configuration (14 variants plus the uncompressed baseline); Table 1 lists the seven representative configurations. The shaded region marks 16× compression, where three configurations match the baseline within 1 pp while reducing memory to ≈29 MB.
4.3. Memory Pollution Analysis
We next test whether a product-aware budget allocation can improve on a uniform distribution. We construct a per-product oracle from isolated single-product evaluations: for each product, we sweep the number of stored embeddings and compute its AUROC on the test set (with ground-truth labels), then derive the allocation that maximizes mean AUROC under a fixed total memory constraint. This oracle is a diagnostic ceiling, not a deployable method: it uses test labels and assumes no inter-product interference.
Table 2 shows the result. The per-product oracle underperforms uniform allocation at every budget level, with the largest gap of −1.7 pp at 12 MB. The gap narrows as the total budget grows and disappears at 30 MB, where the per-product budgets approach the uniform allocation. We also tested an adaptive allocator based on feature complexity, which offered no clear advantage over uniform allocation.
Table 2.
Budget allocation under global (shared) retrieval on MVTec AD (15 products, 3 seeds). The per-product oracle selects each product’s budget by maximizing AUROC on an isolated single-product bank. is oracle minus uniform AUROC in percentage points, computed from the unrounded means; small mismatches with the displayed AUROC columns reflect rounding to one decimal.
This inversion is driven by the interference described in Section 3.5. The oracle shifts a disproportionate share of embeddings toward products whose isolated AUROC-vs-budget curves appear steep. In the shared bank, these products can form dense regions in the embedding space that attract nearest-neighbor queries from other products, degrading anomaly scores through cross-product contamination.
The wrong-neighbor rate (WNR, Equation (1)) quantifies this interference directly. At 50 embeddings per product (2.9 MB total), the mean WNR across the 15 MVTec AD products is 0.38: more than one in three retrieved neighbors belongs to a foreign product. At 500 embeddings per product (29.3 MB), the WNR drops to 0.15 but does not vanish. The most contaminated products at the 29.3 MB budget are hazelnut (0.42), metal_nut (0.31), and screw (0.30); the least contaminated are leather (0.03) and carpet (0.03). High WNR indicates that a product’s queries frequently retrieve foreign neighbors, but the per-product correlation between WNR and the routing benefit is weak (Figure 3). For example, hazelnut has the highest WNR at every budget level yet does not degrade under routing. This suggests that the aggregate effect of pollution (measured across the entire product mix) drives the oracle inversion, rather than a simple per-product relationship between contamination and degradation.
Figure 3.
Per-product wrong-neighbor rate vs. the AUROC change from global to top-1 routed retrieval (routed minus global), shown separately for MVTec AD (15 products), VisA (12), and BTAD (3) at a fixed budget of 200 embeddings per product and with shared axes (mean over 3 seeds). Top-1 routing reaches 100% accuracy on these benchmarks, so routed retrieval is equivalent to restricting the search to each product’s own sub-bank. The weak per-dataset correlation (annotated r) shows that routing helps in aggregate but is not predicted by a product’s WNR. The dashed line in each panel is the least-squares linear fit corresponding to the annotated Pearson correlation r.
Image-level AUPR (Table 2) confirms the same pattern: uniform consistently exceeds oracle, though the absolute differences are smaller because AUPR values are compressed toward the top of their range. These results show that, under global retrieval, adaptive allocations derived from isolated per-product curves can be brittle: redistributing embeddings across products may increase inter-product interference and reduce mean detection performance.
Figure 3 visualizes this per-product relationship for each benchmark. In all three, the correlation between WNR and the per-product routing benefit is weak (Pearson , , and on MVTec AD, VisA, and BTAD): while routing reduces the aggregate pollution effect (the mean AUROC increases), it does not uniformly benefit the highest-WNR products. This is consistent with the observation that the harm caused by wrong neighbors depends not only on their frequency but also on their distance from the true distribution, which WNR does not capture. The WNR, therefore, serves as a diagnostic indicator of interference at the aggregate level rather than as a per-product predictor of performance impact.
To confirm that the WNR reflects cross-product interference rather than the mismatch of genuinely anomalous patches, we recompute it using only normal test images, where no anomaly is present by construction. Table 3 compares the two. Across budgets, the normal-only WNR stays within about 3 percentage points of the full WNR (for example, 25.5% vs. 28.5% at 100 embeddings per product) and the two are almost perfectly correlated across products (). The small gap is the expected contribution of anomalous patches, which legitimately lack same-product neighbors; the bulk of the WNR is, therefore, driven by cross-product retrieval on normal content, supporting its interpretation as a measure of pollution rather than of anomaly-related mismatch.
Table 3.
Wrong-neighbor rate computed over all test images versus over normal test images only, on MVTec AD (mean over 15 products and 3 seeds). The normal-only WNR, where no anomaly is present, stays close to the full WNR at every budget, indicating that the WNR measures cross-product pollution rather than anomaly-related mismatch.
4.4. Routing Mitigates Pollution
Before examining detection scores, we report routing accuracy. The prototype router (Equation (2)) achieves 100% top-1 accuracy across all 30 product types from three benchmarks (15 from MVTec AD, 12 from VisA, 3 from BTAD) and all three seeds. We also evaluate relaxed routing settings (top-2, top-3, and top-5); all achieve 100% accuracy as well. Overall, this yields 360 (product, seed, routing mode) measurements, every one of them correct. The VisA benchmark includes four PCB variants (pcb1–pcb4) that share similar board layouts, yet the mean-embedding prototypes separate them without error. These four products have the lowest mean margin ratios among VisA categories (3.25 vs. 3.97 for non-PCB products), confirming that they are the hardest routing cases; still, the minimum margin ratio across all PCB test images is 1.19. The storage overhead is 0.06 MB for 15 prototypes and 0.12 MB for 30.
To quantify the confidence of the router beyond binary accuracy, we measure the margin ratio for each test image, where and are the Euclidean distances to the closest and second-closest prototypes, respectively. A ratio well above 1 indicates that the correct product is separated from the runner-up by a wide gap. Across all three benchmarks and seeds, the mean margin ratio is 3.84 (i.e., the second prototype is on average nearly four times farther than the first) and the 5th-percentile ratio is 2.47, meaning that 95% of test images have a margin of at least . The global minimum ratio is 1.14 (product screw, seed 2), confirming that even the hardest routing case retains a 14% distance gap. Figure 4 shows the distribution of mean margin ratios across all products and seeds.
Figure 4.
Distribution of mean margin ratios () per product across all three benchmarks and seeds. Points show product-seed mean margin ratios, and boxes summarize their distribution within each benchmark. All values exceed 1, confirming consistent routing separability. The dashed red line marks the worst individual test image across all products and seeds (1.14).
Table 4 and Figure 5 compare global and top-1 routed retrieval at the 18 MB budget. Under global retrieval, the oracle scores 1.6 pp below uniform (89.2% vs. 90.8%; Wilcoxon signed-rank over 15 products, ). Under top-1 routing, this relationship reverses: the oracle scores 0.3 pp above uniform (91.4% vs. 91.1%). When routing is correct, KNN search is restricted to the query product’s sub-bank, so wrong-neighbor retrieval is effectively removed and the oracle behaves as intended.
Table 4.
Global vs. top-1 routed retrieval on MVTec AD (15 products, 3 seeds, 18 MB budget). Top-1 routing restricts KNN search to the single closest product’s sub-bank.
Figure 5.
Oracle inversion and its reversal at 18 MB. Under global retrieval (left), the per-product oracle underperforms uniform allocation by 1.6 pp. Under top-1 routing (right), the oracle recovers and scores 0.3 pp above uniform, consistent with inter-product interference in the shared bank as the driver of the inversion.
In absolute terms, top-1 routing with uniform allocation reaches 91.1%, a gain of 0.3 pp over global uniform (90.8%). Although 0.3 pp is modest in absolute magnitude, the improvement is consistent across all three seeds and statistically significant: a Wilcoxon signed-rank test over 15 paired per-product AUROCs (each averaged across 3 seeds to avoid pseudo-replication) yields . Moreover, 0.3 pp is the gain at the most favorable operating point—the strongest backbone (DINOv3) at a generous budget; the gain grows where pollution is stronger, ranging on MVTec AD from 0.3 pp for DINOv3 to 1.8 pp for the weaker DINOv2 (with CLIP and SigLIP at 0.8 and 0.9 pp; Section 4.7.8), and the degradation that routing recovers reaches 0.66 pp at 30 products (Section 4.6.3). The absolute headroom is itself small in this few-shot regime: the no-interference isolated upper bound reaches only 91.2%, so routing’s 91.1% is essentially at that ceiling. The combination of routing and oracle allocation yields 91.4%, the highest result in this evaluation. Pixel AUROC follows the same trend: 97.0% for top-1 uniform versus 96.5% for global uniform. Query time is comparable at (both near 25 ms): routing adds a lightweight prototype comparison, but searches only one sub-bank (approximately of the embeddings under uniform allocation). In terms of computational complexity under exact search (flat index), global retrieval requires distance computations, while routed retrieval requires for the prototype comparison plus for the single sub-bank, yielding instead of . As P grows, this reduction becomes increasingly significant.
The oracle inversion reversal is consistent across budgets. At 6 MB, the delta shifts from −1.4 pp (global) to +0.6 pp (top-1); at 12 MB from −1.7 to ; at 18 MB from −1.6 to +0.3; at 30 MB both modes converge near zero. The reversal is strongest at low budgets, where pollution is most severe, and it vanishes at high budgets, where all products have sufficient representation and interference is already minimal.
4.5. Allocation Sensitivity Under Routing
With routing reducing cross-product contamination, we ask whether a more sophisticated allocation strategy can still provide a measurable advantage. Table 5 reports five allocators under top-3 routing across four budgets. The allocators distribute the total budget B as follows. Uniform: each product receives MB. Complexity: the complexity score of product p is the 95th percentile of its intra-product 5 NN distances (computed on training embeddings only); the budget share is proportional to this score, so that products with a more spread-out normal distribution receive more memory. Overlap: for each product, we compute the fifth percentile of the Euclidean distances from its training embeddings to the nearest other-product centroid; products with lower values (closer to other products) receive more memory. Inverse overlap: the reverse of overlap, favoring products that are well separated. The per-product oracle is as defined in Section 4.3. All allocators use only normal training embeddings except the oracle, which requires test labels.
Table 5.
Five budget allocation strategies under top-3 routed retrieval on MVTec AD (15 products, 3 seeds). Values are image-level AUROC (%). We use top-3 routing (rather than top-1) to stress-test allocator robustness: top-3 retrieves from the three closest sub-banks, partially reintroducing cross-product neighbors. If allocators converge even under this relaxed routing, they converge a fortiori under top-1.
The three data-driven allocators and uniform allocation stay within 0.3 pp of each other at every budget. The per-product oracle remains the worst allocator throughout, trailing uniform by up to 1.0 pp at 18 MB. Two factors contribute to this underperformance. First, with only training images, the per-product AUROC-vs-budget curves are inherently noisy, and the greedy marginal gain algorithm may amplify estimation errors; uniform allocation acts as a strong uninformative prior that is difficult to outperform with data-driven strategies that lack sufficient statistics. Second, Table 5 uses top-3 routing, which partially reintroduces cross-product interference by searching three sub-banks; under strict top-1 routing (Table 4), the oracle recovers and outperforms uniform (91.4% vs. 91.1%), confirming that the severe inversion under global retrieval (−1.7 pp) is primarily driven by memory pollution. The N = 50 experiment (Appendix B) further supports this: the oracle inversion persists under global retrieval even with five times more training data, isolating pollution as the dominant factor. Including the oracle, the maximum spread across all five strategies is 1.0 pp and shrinks to 0.2 pp at 30 MB.
Consequently, routing largely decouples detection performance from the budget allocation policy. Uniform allocation, the simplest strategy requiring no per-product analysis, is a safe default for deployment and reduces the need for allocator tuning.
4.6. Cross-Benchmark Validation
We validate the compression findings on two additional benchmarks using the same continual protocol (, 3 seeds). Table 6 reports results for BTAD (3 products) and VisA (12 products).
Table 6.
Compression validation on VisA (12 products) and BTAD (3 products), using the same protocol as Table 1 (continual evaluation, , 3 seeds).
On BTAD, coreset_500 retains 95.9% out of 96.0% baseline AUROC at 16× compression, a loss of only 0.1 pp. On VisA, the loss is 0.5 pp for coreset_500 (82.8% vs. 83.3%) and 0.8 pp for km100_res400 (82.5% vs. 83.3%), both at 16× compression. Pixel-level AUROC drops by at most 0.6 pp across both benchmarks. The 16× compression claim established on MVTec AD holds on VisA and BTAD as well.
On these benchmarks, the prototype router also maintains 100% top-1 accuracy on VisA and BTAD; a detailed scalability analysis across all 30 products is provided in Section 4.7.4.
4.6.1. Cross-Benchmark Memory Pollution
We extend the pollution analysis of Section 4.3 to VisA and BTAD to test whether the oracle inversion is specific to MVTec AD or a general property of shared retrieval. Table 7 reports uniform and per-product oracle allocations on both benchmarks under global retrieval (, 3 seeds).
Table 7.
Memory pollution analysis on VisA (12 products) and BTAD (3 products) under global retrieval, , 3 seeds. is oracle minus uniform AUROC in percentage points; mean WNR is computed across products.
The results in Table 7 confirm and extend the findings on MVTec AD. On VisA, the oracle inversion is more severe than on MVTec AD: the largest gap reaches −2.21 pp at 12 MB, with 11 of 12 products showing a negative delta (Wilcoxon signed-rank, one-sided test of oracle below uniform: ; two-sided: ). The mean WNR peaks at 53.8% at the smallest budget. This is consistent with the structure of VisA, which contains four visually similar PCB variants (pcb1–pcb4) that produce dense, overlapping regions in the embedding space. On BTAD, by contrast, no oracle inversion is observed, and the mean WNR stays around 9% across all budgets. With only three products, the shared bank has little opportunity for cross-product retrieval, so the conditions that drive pollution do not arise.
Taken together, these results suggest that memory pollution is not specific to MVTec AD: it appears under the same protocol on VisA, where the inversion is even more severe, and is essentially absent on BTAD. We do not interpret BTAD as a controlled scaling experiment: with only three products, the same total budget translates into several times more memory per product than on VisA or MVTec AD, so the absence of inversion on BTAD could reflect either lower crowding or a different operating regime; we, therefore, complement this observational comparison with a controlled experiment that fixes the per-product budget and varies only the number of products (Section 4.6.2). Within each dataset, however, the inversion appears precisely at the budgets where per-product memory is most constrained. Figure 6 summarizes the oracle inversion across the three benchmarks.
Figure 6.
Oracle inversion delta (oracle − uniform image AUROC, percentage points) across MVTec AD (15 products), VisA (12 products), and BTAD (3 products) at five memory budgets, under global retrieval and . The effect is largest on VisA and present on MVTec AD, and absent on BTAD. We note that BTAD allocates several times more memory per product at the same total budget (since grows with smaller P), so the comparison is observational rather than a controlled scaling experiment.
4.6.2. Controlled Scaling of Memory Pollution
The cross-benchmark comparison above is observational: BTAD, VisA, and MVTec AD differ not only in the number of products but also in the per-product memory each receives at a fixed total budget. To isolate the number of products as the sole variable, we run a controlled experiment on MVTec AD in which the per-product budget is held fixed at 100 embeddings and only the number of products sharing the global bank varies, from to . For each N, we draw six random product subsets (fixed across seeds) and report the mean over subsets and three seeds. For every product in a subset, we measure its wrong-neighbor rate and the AUROC degradation caused by sharing, defined as the difference between scoring the product against its own isolated sub-bank and against the full shared bank.
Table 8 and Figure 7 report the result. With the per-product budget being held constant, the mean WNR increases overall from 0% at (no sharing) to 28.5% at , with small subset-dependent fluctuations along the way, and the mean AUROC degradation from sharing grows from 0 to 0.62 pp. Because per-product memory does not change, this trend cannot be attributed to reduced per-product memory; it is consistent with increased opportunity for cross-product retrieval as more products are co-stored. This provides controlled evidence supporting the mechanism that the cross-dataset comparison could only suggest: cross-product interference is shaped by how many products share the bank, and it is consistent with the degradation that the per-product oracle suffers under shared retrieval. The spread across subsets also indicates that pollution depends not only on how many products share the bank but on which ones, since subsets containing visually similar products interfere more.
Table 8.
Controlled scaling on MVTec AD at a fixed per-product budget of 100 embeddings. As the number of products sharing the global bank grows, the mean WNR and the mean AUROC degradation from sharing (isolated minus shared) both increase. Values are mean ± standard deviation across three seeds, each averaged over six random product subsets.
Figure 7.
Controlled scaling of memory pollution on MVTec AD at a fixed per-product budget (100 embeddings per product). (a) Mean wrong-neighbor rate and (b) mean AUROC degradation from sharing (isolated minus shared), as a function of the number of products sharing the global bank. Error bars are the standard deviation across three seeds (each averaged over six random product subsets). With per-product memory being fixed, both quantities increase with the number of co-stored products, isolating product count from per-product memory as a driver of pollution.
4.6.3. Scaling to Thirty Products
To probe larger deployments, we repeat the controlled experiment on the full pool of 30 products from all three benchmarks (MVTec AD, VisA, and BTAD), again holding the per-product budget fixed at 100 embeddings and varying the number of co-stored products from 2 to 30 (random product subsets where applicable—the full pool at —with three seeds). Table 9 reports the result. The wrong-neighbor rate climbs from 8.3% at to 42.6% at , and the degradation from sharing, which is the amount recoverable by correct top-1 routing, grows from near zero to 0.66 pp, with the expected subset-dependent fluctuations. Pooling heterogeneous benchmarks raises the WNR above the MVTec-only values of Table 8, because the pool contains visually similar products (for example the VisA PCB variants) that crowd the shared neighborhood. The practical message for larger catalogues is, therefore, that the routing benefit remains measurable and is largest at the highest product count tested.
Table 9.
Controlled scaling to 30 products pooled across MVTec AD, VisA, and BTAD, at a fixed per-product budget of 100 embeddings (three seeds, random product subsets). Both the wrong-neighbor rate and the degradation from sharing (the amount recoverable by correct top-1 routing) are substantially larger at high product counts, with subset-dependent fluctuations.
4.6.4. An Analytical Model of the Wrong-Neighbor Rate
The experiments above measure memory pollution; here we model it, linking the empirical diagnosis to a simple quantitative relationship. Consider a query patch from product p in a shared bank holding b embeddings for each of P products. Its k nearest neighbors are drawn from b own-product embeddings and foreign ones. If a foreign embedding is, on average, a factor as likely as an own embedding to fall inside the query’s neighborhood ( because same-product embeddings are typically closer), the expected fraction of foreign neighbors is
a saturating function of P governed by a single crowding parameter c. At fixed P, increasing b densifies own-product coverage faster than foreign coverage, so c decreases with b; empirically (Figure 8b). The model captures the overall trend we observe: the WNR increasing with P and decreasing with b, while the residual scatter reflects subset composition. The crowding parameter is moreover consistent across the two independent sweeps: the value recovered from the budget sweep is close to the fitted independently on the product sweep, within about 15%. The residual scatter on the product axis (, Figure 8a) reflects the dependence on which products share the bank, consistent with the subset variability noted above. It is not intended as a high-fidelity predictor for each product subset but as a first-order analytical approximation: its value is that it links the wrong-neighbor rate to the two quantities the paper varies—the number of products and the per-product budget—and helps explain why the oracle inversion concentrates in the crowded, low-budget regime.
Figure 8.
Analytical model of the wrong-neighbor rate (Equation (3)). (a) Mean WNR versus the number of products at a fixed per-product budget; the curve is the model with crowding parameter c fitted on this sweep. (b) Mean WNR versus the per-product budget at ; the curve uses . The crowding parameter recovered from the two independent sweeps agrees within about 15%, and the model captures the overall increasing and decreasing trends.
4.7. Ablation Studies
4.7.1. Routing Mode Comparison
Table 10 compares the three retrieval modes under uniform allocation. Top-1 routing outperforms global retrieval by 0.3–0.6 pp at every budget level. Top-3 falls between both: it retrieves from the three closest sub-banks, which reintroduces some cross-product neighbors. Since the router achieves 100% accuracy, the extra candidates in top-3 add only noise. Top-1 is also faster (25 ms vs. 53 ms at 18 MB) because it searches a single sub-bank instead of three.
Table 10.
Routing mode comparison on MVTec AD (15 products, 3 seeds, uniform allocation). Image-level AUROC at four memory budgets. Query time measured at 18 MB.
The advantage of top-1 over top-3 becomes more pronounced under oracle allocation. At 18 MB, top-1 with oracle reaches 91.4%, while top-3 with oracle drops to 90.0% (below the uniform global baseline of 90.8%). Under oracle allocation, products receive uneven memory budgets; exposing a query to additional sub-banks (top-3) increases the chance of retrieving neighbors from over-allocated products, partially reintroducing inter-product interference. Restricting retrieval to the routed sub-bank (top-1) largely avoids this effect.
4.7.2. Per-Product Routing Benefit
At 18 MB with uniform allocation, routing improves the mean AUROC from 90.8% (global) to 91.1% (top-1), but the benefit varies across products (per-category values in Appendix A). The largest gains come from wood (+1.4 pp), grid (+1.0 pp), screw (+1.0 pp), and transistor (+0.9 pp), suggesting these categories are more sensitive to cross-product neighbors under global retrieval.
Products already near saturation show little change. Tile and leather, both above 99% AUROC under global retrieval, change by less than 0.1 pp. Two products, toothbrush (−0.1 pp) and hazelnut (−0.4 pp), show small decreases under routing, which are modest relative to typical seed-to-seed variability.
The relationship between WNR and routing benefit is not strictly monotonic. For example, hazelnut has the highest WNR (0.42 at 29.3 MB, mean over seeds) yet does not benefit from routing, while screw (WNR ≈ 0.30) gains 1.0 pp. This suggests that the net effect of routing depends not only on how often wrong neighbors appear but also on how harmful those neighbors are for a given product.
4.7.3. Compression Details
Spatial Pooling
Average pooling over patches reduces the feature grid from to , cutting memory to ≈120 MB (4× compression) and query time to ≈42 ms. Its image AUROC (91.1%) matches the uncompressed baseline (91.2%), while its pixel AUROC (97.8%) exceeds it (97.5%). This localization gain likely reflects the enforcement of spatial coherence: single-patch anomalies ( pixels) are often sensor noise, while anomalies spanning patches are structurally meaningful, aligning the effective receptive field with typical defect sizes. The variant compresses more aggressively (≈30 MB, ≈5 ms) but loses 1.8 pp in image AUROC (89.4%) and 1.8 pp in pixel AUROC (95.7%), suggesting that a grid can be too coarse for reliable anomaly detection.
Score Smoothing
Gaussian smoothing of the pixel score map () has a marginal effect. On the uncompressed baseline, pixel AUROC increases by 0.2 pp from (97.5%) to (97.7%). On coreset_500, the gain is similar (96.9% to 97.2%). AuSPRO shows mixed behavior: on coreset_500 it increases from 90.0% () to 91.8% (), while on the baseline it stays near 92.7% across all sigma values. Since the effect is small and inconsistent across metrics, we use as the default throughout the paper, avoiding the additional hyperparameter.
Residual Selection Policy
For the density-aware residual compression (Section 3.4), we compare four policies for selecting which patches to retain alongside the k-means centroids: farthest (patches most distant from their centroid), farthest-diverse (farthest with diversity constraint), knn-density (patches in low-density regions), and random. At 100 centroids plus 100 residuals per product, the farthest achieves 90.3% image AUROC, followed by farthest-diverse (90.2%), knn-density (89.8%), and random (89.7%). The difference between the best and worst policy is 0.6 pp, a modest gap that confirms boundary-aware selection helps but is not critical to the compression performance. Unless stated otherwise, all density-aware residual configurations in this paper use the farthest policy.
4.7.4. Scalability to 30 Products
To test whether routing scales beyond a single benchmark, we construct a mega-bank combining all 30 products from MVTec AD (15), VisA (12), and BTAD (3) in a single shared index. Table 11 reports the results. Router accuracy remains 100% across all 30 products, all 3 seeds, and all budget levels. The routing gain is largest at 18 MB (+0.8 pp), where each product receives only 150 embeddings and pollution is most severe. As the budget increases to 60 MB, the gain shrinks to 0.2 pp, consistent with the pattern observed on MVTec AD alone: routing is most valuable when per-product budgets are tight.
Table 11.
Mega-bank experiment: 30 products (MVTec AD + VisA + BTAD) sharing a single memory bank with uniform allocation and 3 seeds. Router accuracy is 100% in all conditions.
4.7.5. Effect of Training Set Size
The main experiments use training images per product, reflecting a few-shot constraint common in industrial deployment. To verify robustness, we evaluate on MVTec AD at 18 MB with uniform allocation (Table 12). Under top-1 routing, image AUROC increases monotonically from 90.0% () to 91.8% (), but with strongly diminishing returns: the gain from 5 to 10 images (+1.1 pp) is an order of magnitude larger than the gain from 20 to 50 (+0.1 pp). Routing consistently improves over global retrieval at every N, with the largest benefit at (+0.4 pp) where prototype estimates are noisiest yet still sufficient for 100% routing accuracy. These results confirm that is a reasonable operating point: it captures most of the available AUROC while keeping data requirements minimal. A supplementary experiment with also confirms that the oracle inversion persists: under global retrieval, the oracle underperforms uniform by 1.2–1.9 pp at 5–12 MB, with magnitudes comparable to the setting (Appendix B).
Table 12.
Effect of training set size N on MVTec AD (15 products, 18 MB, uniform allocation, coreset compression, 3 seeds). AUROC improves with N but saturates near .
4.7.6. Multi-Prototype Routing
The router stores one mean-embedding prototype per product. A natural extension is to use multiple prototypes per product, for example by replacing the mean with the k centroids returned by k-means clustering (). This could in principle capture multimodal appearance distributions within a product. To test this, we evaluate on MVTec AD at 18 MB with uniform allocation (15 products, 3 seeds). Routing is performed by nearest-centroid assignment over all centroids from all products. The sub-banks themselves are unchanged across variants.
The results in Table 13 show that increasing k does not improve detection on this benchmark and can hurt it. With , image AUROC is essentially unchanged (+0.2 pp) but routing accuracy drops from 100% to 98.1%. With , AUROC falls to 89.8% and accuracy to 94.1%. With , AUROC drops by 3.7 pp and accuracy by almost 10 pp. The mean margin ratio also decreases monotonically (from 3.98 at to 1.43 at ), indicating that the additional centroids reduce the separation between products in the prototype space.
Table 13.
Effect of the number of prototypes per product on MVTec AD (18 MB, uniform allocation, 3 seeds). Image AUROC is reported as the mean over products under top-1 routing, with the standard deviation taken across the three seeds (consistent with the rest of the paper). The routing accuracy and mean margin ratio are averaged across products and seeds. corresponds to the mean-embedding prototype used throughout the paper.
The reason is that, with only training images per product, k-means produces noisy centroids that overlap with centroids from other products. The effect is not uniform across categories. At , eleven of fifteen products keep 100% routing accuracy, but four collapse: metal_nut falls to 0%, bottle to 61%, hazelnut to 85%, and screw to 98%. The collapse happens when at least one k-means centroid of a product ends up closer to a centroid of a different product than to its own, which is more likely when the training set is small. We note that yields a marginal improvement in mean AUROC (+0.2 pp) but at the cost of routing accuracy ( vs. ) and a substantially lower inter-prototype margin. Beyond , both AUROC and routing degrade. We, therefore, do not claim that is optimal in detection terms; rather, does not yield a reliable AUROC improvement in our few-shot setting and reduces routing reliability, so is the most conservative and simplest default. A larger k may be useful when more training data are available or when products have strongly multimodal appearance, but neither condition holds in our setting.
4.7.7. Routing Fallback Under Misrouting
In our experiments, top-1 routing achieves 100% accuracy on the evaluated benchmarks. In a deployment with new product types, more visually similar categories, or domain shift, this may not hold. We, therefore, evaluate how the system behaves when the router occasionally fails and whether a simple confidence-based fallback recovers performance.
We simulate misrouting by, for each test image, forcing the router to choose a uniformly random wrong product with probability . We then compare three policies: top-1 routing without fallback (thr = 1.0); margin-based fallback with threshold 1.5 (use top-3 retrieval when the margin ratio ); and margin-based fallback with threshold 2.0. The forced misrouting is also assigned a low artificial margin so that the fallback can react to it.
Table 14 shows that, without fallback, AUROC degrades rapidly with misrouting: from 91.0% at down to 60.8% at . With a margin-based fallback at threshold 1.5, AUROC stays essentially flat at 91.0% across all misrouting levels. The fallback fires only when the routing margin is low: at , it triggers on 47.4% of test images, which closely matches the forced misrouting rate. This experiment shows that, once unsure decisions are flagged, top-3 retrieval over the closest sub-banks restores the performance of correct routing. The setup is intentionally favorable to the fallback: by attaching a low artificial margin to the forced misroutes, we simulate the situation in which the router is itself uncertain. The experiment therefore validates the recovery side of the mechanism. Section 4.7.9 provides a weaker check on the detection side: the margin signal responds to input degradation, although the router does not actually misroute in that experiment. A full study under domain shift and unseen products is left as future work. In our benchmarks, the router is already correct, so the fallback adds no benefit in the unperturbed setting; its value appears precisely when the routing assumption breaks down.
Table 14.
Routing fallback under forced misrouting on MVTec AD (18 MB, uniform allocation, single seed for illustration). thr = 1.0 disables the fallback. thr = 1.5 and thr = 2.0 trigger top-3 retrieval when the routing margin falls below the threshold. Mean AUROC across the 15 products. This is an illustrative experiment, not a fully replicated one; see the discussion below for its limitations.
4.7.8. Generality Across Feature Extractors
The diagnosis and the remedy are not specific to DINOv3, to the self-supervised family, to a single dataset, or to a single seed. We repeat the shared/global/routed/isolated comparison with four backbones spanning two model families—the self-supervised DINOv3-ViT-L/16 [5] and DINOv2-ViT-B/14 [4], and the vision–language encoders CLIP-ViT-L/14 [28] and SigLIP-ViT-L/16 [29]—on all three benchmarks (MVTec AD, VisA, BTAD) with three seeds, at a fixed 300 embeddings per product. Table 15 reports the result. Two properties hold across every one of the twelve backbone–dataset combinations: a shared bank incurs substantial cross-product retrieval (mean WNR between 9% and 39%), and top-1 prototype routing reaches at least 99.96% accuracy (exactly 100% in all but the SigLIP–MVTec combination), so routed retrieval matches the isolated per-product performance. This indicates that memory pollution and its routing remedy are properties of shared k-nearest-neighbor retrieval rather than specific to one feature extractor, model family, dataset, or seed. The effect of routing on AUROC is, as elsewhere in the paper, regime-dependent (cf. the weak per-product WNR–benefit correlation in Figure 3): it helps most where pollution is harmful—on MVTec AD it improves all four backbones, by up to +1.8 pp for the weaker DINOv2—and is smaller, neutral, or in one case negative on VisA and BTAD, where retrieving from a larger pool can aid recall even when some neighbors are foreign (for CLIP on VisA the shared bank is in fact 0.8 pp better despite a high WNR). We note that Table 15 uses a generous 300 embeddings per product; as established in Section 4.6.1 and Section 4.6.2, the AUROC impact of pollution is largest at tight budgets, so the high WNR here confirms that pollution is present even where its effect on AUROC is muted at this budget. Routing reproduces the isolated-subbank behavior in all these configurations, and the size of its AUROC benefit tracks how harmful the pollution is in each regime.
Table 15.
Generality of memory pollution and routing across four feature extractors spanning two model families (self-supervised DINOv3/DINOv2 and vision–language CLIP/SigLIP), the three benchmarks, and three seeds, at a fixed 300 embeddings per product. For every backbone–dataset pair the shared bank shows cross-product pollution (high WNR) and top-1 routing reaches essentially 100% accuracy, so routed retrieval matches the isolated per-product AUROC; this is not always an improvement over the shared bank, since shared retrieval can occasionally aid recall at this high budget. Values are the mean over three seeds (standard deviations are small: WNR ≤ 1.5, routed−global ≤ 0.7 pp).
4.7.9. Robustness Under Input Corruptions
The benchmark images are clean and well centered. To stress-test the router under synthetic input corruptions, we corrupt the MVTec AD test images with four common perturbations (brightness reduction, Gaussian blur, Gaussian noise, and JPEG compression; Figure 9 shows examples), re-extract their features, and re-evaluate against the clean 15-product shared bank (200 embeddings per product, three seeds). Prototypes and sub-banks are built from clean training data, reflecting the realistic case in which the model is fixed and only the inputs drift. Table 16 reports routing accuracy, detection AUROC under global versus top-1 routed retrieval, and the fraction of images for which the margin-based fallback fires.
Figure 9.
Illustration of the four input corruptions on defective test images, one product per row (three from MVTec AD and one from BTAD). Columns show the clean image and each corruption (brightness, Gaussian blur, Gaussian noise, JPEG compression). Stronger perturbations blur out the visual evidence of the defect—for instance, the small leather mark or the bottle chip—which is consistent with the graceful decline in detection AUROC while routing stays reliable (Table 16).
Table 16.
Routing and detection under input corruptions on MVTec AD (15 products, 200 embeddings per product, three seeds). Prototypes and banks are built from clean data; values are means ± standard deviations over three seeds. Routing accuracy stays at 100% under all corruptions; the fallback trigger rate (margin ) increases with severity.
Routing accuracy remains at 100% under every corruption and severity: the mean-embedding prototypes are robust to these input shifts, consistent with the interpretation that these corruptions move a test image’s average embedding less than the inter-prototype gaps. Top-1 routing continues to match or exceed global retrieval throughout. As expected, detection becomes harder under stronger corruptions (routed AUROC falls from about 91% to 84% under aggressive JPEG), but this affects global and routed retrieval alike. Notably, the fallback trigger rate is higher for harsher perturbations, reaching 38.5% under aggressive JPEG (versus 2.7% under mild brightness change), showing that the margin ratio does react to genuine input degradation and could gate a fallback or a human-in-the-loop check in deployment.
5. Discussion
The prototype router achieves 100% accuracy across all 30 tested products on the evaluated benchmarks (Section 4.7.4), suggesting that a single mean-embedding prototype per product is sufficient to separate product types in the DINOv3 feature space under the controlled conditions of these datasets. This may not hold universally: if product identities differ only by subtle markings, or if viewpoint and domain shift are substantial, the separation between prototypes may shrink and routing errors may become non-negligible. In such cases, a confidence threshold (or a fallback to top-M retrieval) becomes important.
Beyond reducing inter-product interference, routing also reduces sensitivity to how the total memory budget is divided across products. Without routing, the spread across five allocation strategies reaches 1.7 pp, and the per-product oracle is consistently the worst. Under routing, the spread shrinks to 1 pp or less and uniform allocation is competitive with more complex heuristics in our experiments. Practically, this makes top-1 routing with uniform allocation a strong baseline: it avoids per-product analysis and does not introduce allocator-specific hyperparameters beyond the total memory budget. The practical significance extends beyond the modest +0.3 pp AUROC gain: routing at 18 MB matches the detection performance of fully isolated per-product banks at 459 MB (91.1% vs. 91.2%), achieving a 25× memory reduction with negligible loss. This improvement is consistent across all three seeds and statistically significant (Wilcoxon signed-rank over 15 products, ). In practical terms, these properties translate into three concrete deployment benefits: a 25× smaller memory footprint at equal accuracy, which becomes decisive as the number of products grows; the elimination of per-product budget tuning, since uniform allocation under routing stays within 1 pp of any heuristic; and constant-cost product onboarding, since adding a product requires only storing its normal embeddings and computing one prototype vector, with no retraining. These benefits matter most in industrial deployment, where the number of co-stored products is large, memory is constrained, and maintaining or retraining a separate model per product is costly.
In multi-camera inspection, a single object may be observed from multiple viewpoints (e.g., top, side, bottom), with each producing a distinct feature distribution. In principle, a shared memory bank with routing could support a single pipeline across views and product types, provided that the routing prototypes remain stable across the operational conditions and camera domains. In this setting, adding a new product requires only storing its normal embeddings and computing one prototype vector, with no retraining. Although top-1 routing with full accuracy is mathematically equivalent to maintaining P separate indices, a single shared index with logical partitioning simplifies deployment: it avoids managing P independent retrieval structures, reduces memory fragmentation, and keeps the query interface uniform regardless of the number of products.
5.1. Sensitivity Analysis Scope
The ablation studies in Section 4.7 vary by routing mode (global, top-1, top-3, known-ID), budget allocation (five strategies), memory budget (6–30 MB), training set size (), compression method (seven configurations), spatial pooling resolution, and score smoothing. The main experiments fix the backbone (DINOv3-ViT-L/16), feature layer (18), and distance metric (Euclidean), because these are standard components shared with PatchCore-style methods, and our claims concern the shared-bank retrieval mechanism.
To verify that memory pollution is not an artifact of these specific choices, we repeated the pollution analysis on MVTec AD (seed 0, 300 embeddings per product, uniform allocation) under three alternative configurations. Table 17 reports the results. Changing the feature layer from 18 to 12 reduces the mean AUROC (88.6% vs. 90.7%) but preserves comparable WNR (17.5% vs. 18.4%). Switching from Euclidean to cosine distance slightly improves AUROC (91.4% vs. 90.7%) while WNR remains similar (19.8% vs. 18.4%). Replacing the DINOv3-ViT-L/16 backbone with the smaller DINOv2-ViT-B/14 lowers AUROC to 85.9% (weaker features) and raises WNR to 21.9% (greater inter-product overlap). In all conditions, the mean WNR exceeds 17%, confirming that cross-product contamination is a structural property of shared KNN retrieval, independent of the specific feature extractor, layer depth, or distance metric.
Table 17.
Sensitivity of memory pollution to backbone, layer, and distance metric on MVTec AD (15 products, seed 0, 300 embeddings per product, uniform allocation). The default configuration is DINOv3-ViT-L/16, layer 18, Euclidean distance.
The oracle inversion is additionally confirmed at two training set sizes ( and , Appendix B) and all budgets, further supporting that it is a property of the retrieval mechanism rather than an artifact of a particular configuration.
5.2. Positioning Relative to Existing Methods
Direct AUROC comparison with recent continual and multi-class anomaly detection methods is complicated by differences in training protocol (few-shot vs. full-set), backbone choice, and whether methods are training-free. Table 18 provides an indicative overview. Methods such as Dinomaly [18] and UniAD [11] achieve higher raw AUROC but train on all available images (typically 200–400 per product) and require gradient-based optimization. MECAD [20], the closest continual baseline, reaches 82.6% image AUROC on MVTec AD using all training images. CADIC [9] reports 97.2% but also uses the full training set.
Table 18.
Contextual comparison with recent multi-class and continual methods that use product-specific normal images on MVTec AD (image AUROC). “N/prod” indicates training images per product; “TF” = training-free (no gradient updates); “Add product” indicates the cost of incorporating a new product type at deployment time. Zero-shot methods (e.g., MuSc, PA-CLIP) are excluded because they do not use per-product normal data.
Zero-shot methods that leverage vision–language models also surpass our raw AUROC (e.g., MuSc [30] achieves 97.8% and PA-CLIP [31] 98.4%), but they require no per-product training images and rely on large-scale multimodal pretraining, making them orthogonal to the memory-bank setting studied here. A direct AUROC ranking across these rows would be misleading, because the methods differ in at least three axes: training data ( vs. all vs. zero), training cost (zero vs. GPU-hours), and the cost of adding a new product (one prototype vs. full retraining). Table 18 is, therefore, included for context, not competition. Our contribution is not to maximize absolute AUROC; instead, we diagnose and mitigate a specific failure mode (memory pollution) that arises when multiple products share a single KNN index under budget constraints. The minimal routing mechanism we evaluate is orthogonal to the choice of backbone or compression algorithm and could be applied to any memory-bank method that supports multi-product operation.
5.3. Same-Protocol Comparison
Because the methods in Table 18 differ in training data and training cost, a direct AUROC ranking against them is not meaningful. Under our own protocol (, frozen DINOv3, KNN scoring), however, the relevant baselines are the two extremes of memory sharing: a single shared bank with no routing (the polluted setting), and one fully isolated bank per product, which is the memory-bank analogue of an expert (class-specific) baseline and the no-interference upper bound. Table 19 reports all three at the same operating point on MVTec AD. Routing matches the isolated per-product memory-bank baseline (91.1% vs. 91.2%) while using 25× less memory (18 MB vs. 459 MB), and improves on the shared bank without routing (90.8%). This is the comparison that isolates the effect of the intervention: under an identical few-shot protocol, routing recovers the accuracy of per-product isolated storage at a fraction of its memory, which is the regime in which maintaining a separate expert or class-specific model per product becomes expensive. We do not compare numerically against expert or learned routing methods (Table 18) because their protocols differ; Table 18 is contextual, while Table 19 is the controlled same-protocol comparison. Beyond this controlled comparison, the cross-backbone study (Section 4.7.8, Table 15) serves as a methodological comparison in its own right: both the diagnosis and the routing remedy hold across two model families and four feature extractors, so the conclusions are not tied to a single representation or to the specific baselines available under our protocol.
Table 19.
Same-protocol comparison on MVTec AD (, 15 products, image AUROC). All rows use the same frozen DINOv3 features and the same KNN scorer and differ only in how products share memory. The isolated per-product banks are the memory-bank analogue of an expert (class-specific) baseline, one per product, and form the no-interference upper bound.
5.4. Limitations
Our findings hold under the conditions of the evaluated benchmarks, and we expect reduced performance in four situations, which we discuss in turn below: (i) products whose normal appearance is near-identical, so that their prototypes become hard to separate and routing errors grow; (ii) strong domain shift between training and deployment (lighting, viewpoint, occlusion, motion blur), which can move test embeddings away from the stored prototypes; (iii) open-set operation, where an unseen product type is silently routed to the nearest known prototype; and (iv) substantially larger training sets, where the per-product oracle and the compression curves may behave differently than in the few-shot regime studied here.
The routing mechanism assumes a closed set of known products. If a previously unseen product type appears at test time, the router assigns it to the nearest prototype, which may lead to incorrect sub-bank retrieval and degraded detection. We partially address this limitation in Section 4.7.7 by evaluating a margin-based fallback under forced misrouting: when the routing margin falls below a threshold, the system falls back to top-3 retrieval, recovering full performance even under 50% misrouting. A complete open-set extension that thresholds the absolute prototype distance to reject unknown products before routing is left for future work.
Our evaluation covers three public benchmarks (MVTec AD, VisA, BTAD) totaling 30 product categories. While these include textures, objects, and electronic components, images are generally well centered and captured under controlled conditions. In production environments with stronger nuisance factors (variable lighting, partial occlusions, motion blur, or deformable products), routing accuracy and retrieval behavior may change. As an initial probe, Section 4.7.9 shows that routing accuracy remains at 100% under brightness, blur, noise, and JPEG corruptions, and that the confidence signal reacts to severity; a full study under real domain shift and deformable products is left for future work.
The main experiments use training images per product. An ablation over (Table 12) shows that AUROC saturates near , confirming that 10 images capture most of the available performance. However, with substantially larger training sets, compression curves, prototype estimates, and the stability of AUROC-vs-budget curves may change. In particular, the per-product oracle derived from isolated evaluations may become less noisy with more data, potentially altering its relative behavior.
The mean-embedding prototype averages over all spatial positions and training images, which makes it robust to local variations but potentially sensitive to systematic shifts in viewpoint or background. For the evaluated benchmarks, images are generally well centered and captured under controlled conditions, and the minimum margin ratio ( for screw) indicates clear separability. We tested multiple prototypes per product (k-means centroids with ) in Section 4.7.6 and found that increasing k does not improve detection in our few-shot regime and can hurt it because the centroids become noisy with only training images. For products with strongly multimodal appearance or in settings with substantially more training data, the trade-off may favor ; we leave this regime for future work.
Finally, the DINOv3-ViT-L/16 backbone has approximately 300M parameters and requires a GPU for feature extraction. In latency- or power-constrained edge deployments, smaller backbones (e.g., ViT-S or ViT-B) may be necessary, which may reduce both detection performance and routing separability.
5.5. Future Work
Four extensions are worth investigating. First, online prototype updates would allow the system to incorporate new products without recomputing all prototypes from scratch. Second, combining features from multiple backbones or modalities (e.g., RGB and depth) could improve detection in challenging cases where a single feature space is insufficient. Third, while we have validated routing at 30 products (Section 4.7.4), scaling to 100+ categories would test whether prototype separation remains sufficient and whether restricting KNN retrieval to a routed sub-bank yields practical throughput gains at larger scales. Finally, an open-set extension with a confidence threshold on prototype distances could enable the system to flag unknown product types rather than silently misrouting them.
Additionally, storing embeddings in half-precision (float16) would halve the memory footprint with negligible impact on retrieval accuracy, enabling compression ratios beyond 32× when combined with the methods evaluated here.
6. Conclusions
We studied multi-product visual anomaly detection under a shared, memory-constrained feature bank. Our experiments on MVTec AD, VisA, and BTAD led to three findings.
First, sharing a KNN bank across products introduces measurable inter-product interference. The wrong-neighbor rate (WNR) quantifies this contamination as an upper bound on cross-product retrieval errors. A diagnostic per-product oracle, optimized with test-set labels on isolated banks, underperforms uniform allocation by up to 1.7 pp on MVTec AD and up to 2.21 pp on VisA when applied to a shared bank. This oracle inversion is consistent with memory pollution as the driving mechanism. While the cross-dataset comparison is observational, a controlled experiment that holds the per-product budget fixed and varies only the number of products (Section 4.6.2) shows that both the wrong-neighbor rate and the degradation from sharing grow with the number of co-stored products, providing controlled evidence consistent with this mechanism. An analytical model of the wrong-neighbor rate (Section 4.6.4) approximates it as a function of the number of products and the per-product budget, linking the empirical diagnosis to a simple quantitative relationship. The inversion also persists at training images (Appendix B), confirming that it is not an artifact of estimation noise.
Second, a minimal prototype router resolves the diagnosed interference on the evaluated benchmarks. Computing one mean-embedding prototype per product (0.06 MB for 15 products, 0.12 MB for the 30-product mega-bank) and restricting retrieval to the matched sub-bank reverses the oracle inversion and restores the expected benefit of adaptive allocation under top-1 retrieval. On MVTec AD, routing at 18 MB matches the detection performance of fully isolated per-product banks at 459 MB, a 25× memory reduction with negligible loss. Under routing, all five tested allocation strategies converge to within 1 pp, making uniform allocation a safe default that requires no per-product tuning. Two ablations support the design of the router: increasing the number of prototypes per product to does not yield a reliable AUROC improvement in the few-shot regime and reduces routing separability (Section 4.7.6), and a margin-based fallback, evaluated under forced misrouting, restores the original AUROC when low-confidence decisions are flagged (Section 4.7.7); this validates the recovery mechanism rather than the detection of natural misroutings, which we leave as future work. The diagnosis generalizes across four backbones spanning two families (DINOv2, CLIP, and SigLIP) on all three benchmarks, where routing reproduces isolated-subbank behavior at near-100% accuracy (Section 4.7.8); routing accuracy also stays at 100% under input corruptions with the confidence signal rising as degradation increases (Section 4.7.9), and the routing benefit is larger in the high-product-count regime, reaching about 0.6 pp at 30 products (Section 4.6.3).
Third, memory-bank compression and routing are complementary. Three compression methods achieve 16× reduction with less than 1 pp AUROC loss, establishing the constrained operating regime in which memory pollution becomes relevant. Spatial pooling can further improve pixel-level localization by suppressing patch-level noise.
The resulting system is simple: a frozen DINOv3 backbone, a compressed memory bank with a uniform budget, and a lightweight prototype router. It achieves 91.1% image AUROC on MVTec AD at 18 MB total memory with uniform allocation (91.4% when combined with oracle allocation) and scales to 30 product types across three benchmarks. Overall, the contribution of this work is diagnostic rather than architectural: a metric, an empirically validated phenomenon, an analytical model relating them, and a minimal training-free intervention that reduces the effect, rather than a new detector.
Author Contributions
Conceptualization, S.V.L., E.S.-O. and M.S.-M.; methodology, S.V.L.; software, S.V.L.; validation, S.V.L.; formal analysis, S.V.L.; investigation, S.V.L.; resources, S.V.L.; data curation, S.V.L.; writing—original draft preparation, S.V.L.; writing—review and editing, E.S.-O. and M.S.-M.; visualization, S.V.L.; supervision, E.S.-O. and M.S.-M.; project administration, E.S.-O. All authors have read and agreed to the published version of the manuscript.
Funding
S. Villanueva has been supported by Eines Vision Systems and its parent company, Konica Minolta. M. Sánchez-Montañés has been supported by grants PID2021-122347NB-I00 and PID2024-155923NB-I00 (MCIN/AEI and ERDF—“A way of making Europe”). The funding sponsors had no role in the design of the study; in the collection, analyses, or interpretation of data; in the writing of the manuscript; or in the decision to publish the results.
Institutional Review Board Statement
Not applicable.
Informed Consent Statement
Not applicable.
Data Availability Statement
All datasets used in this study are publicly available: MVTec AD [6], VisA [7], and BTAD [8]. The training and evaluation code, model configuration files, and per-seed result artifacts (scores, calibrated thresholds, anomaly maps, and ground-truth masks) are released in a public repository at https://github.com/sergiovillanueva/memory-pollution-ad (accessed on 13 July 2026).
Acknowledgments
Special thanks go to David Domingo for his continuous support and encouragement within the company and to Jorge Broto, CEO of Eines Vision Systems, for promoting research and development initiatives.
Conflicts of Interest
S.V.L. was employed by Eines Vision Systems S.L. The research reported here is independent of the company, which had no role in the study or in the decision to publish. The remaining authors declare no conflict of interest.
Abbreviations
The following abbreviations are used in this manuscript:
| AUPR | Area Under the Precision–Recall Curve |
| AUROC | Area Under the Receiver Operating Characteristic Curve |
| AuSPRO | Area Under the per-Region Overlap Curve |
| KNNs | k-Nearest Neighbors |
| pp | Percentage Points |
| WNR | Wrong-Neighbor Rate |
Appendix A. Per-Category Results
Table A1 provides per-category Image AUROC results on MVTec AD for the four configurations discussed in the main text: single-product baseline (no compression), coreset compression with 500 embeddings per product, and the 18 MB uniform-allocation budget under both global retrieval and top-1 routing. All values are averaged over three seeds.
Table A1.
Per-category Image AUROC (%) on MVTec AD (15 products, 3 seeds). Baseline = uncompressed per-product banks (∼459 MB total across 15 products); Coreset-500 = 500 embeddings per product (∼29 MB); Global and Top-1 refer to retrieval mode at 18 MB total budget with uniform allocation.
Several categories reach near-perfect scores across all configurations (leather, tile, zipper), indicating that compression and routing preserve detection quality for well-separated textures. Products such as capsules and screws are the most affected by multi-product memory sharing: capsule drops from 89.1% (baseline, ∼459 MB) to 80.7% (top-1, 18 MB shared among 15 products), a degradation driven primarily by the 25× memory reduction rather than by routing (which adds only 0.1 pp over global at the same budget). Screw remains the hardest category overall (62.3–66.9%). Screw and grid improve under routing, with grid gaining 2.1 pp from baseline to top-1 routing, which suggests that eliminating cross-product interference can benefit categories whose normal features are easily confused with other products.
Appendix B. Oracle Inversion with N = 50 Training Images
To verify that the oracle inversion reported in Section 4.3 is not an artifact of the small training set (), we replicate the experiment with images per product on MVTec AD (3 seeds, coreset compression). Table A2 reports image-level AUROC under global and top-1 routed retrieval for both uniform and oracle allocation.
Under global retrieval, the oracle underperforms uniform at every budget up to 12 MB, with deltas of −1.2 to −1.9 pp, comparable to the results in Table 2. At 18 MB the inversion vanishes (+0.4 pp), consistent with the observation that interference diminishes when per-product budgets are sufficiently large. Under top-1 routing, the oracle–uniform gap is at most 0.5 pp in absolute value, and the oracle recovers its expected advantage at low budgets, confirming that routing resolves the pollution regardless of training set size.
Table A2.
Oracle inversion with training images on MVTec AD (15 products, 3 seeds). is oracle minus uniform AUROC in percentage points.
References
- Roth, K.; Pemula, L.; Zepeda, J.; Schölkopf, B.; Brox, T.; Gehler, P. Towards Total Recall in Industrial Anomaly Detection. In Proceedings of the IEEE/CVF Conference on Computer Vision and Pattern Recognition (CVPR), New Orleans, LA, USA, 19–24 June 2022. [Google Scholar]
- Cohen, N.; Hoshen, Y. Sub-Image Anomaly Detection with Deep Pyramid Correspondences. arXiv 2021, arXiv:2005.02357. [Google Scholar] [CrossRef] [Scilit]
- Defard, T.; Setkov, A.; Loesch, A.; Audigier, R. PaDiM: A Patch Distribution Modeling Framework for Anomaly Detection and Localization. In Proceedings of the ICPR International Workshops and Challenges, Virtual, 10–15 January 2021. [Google Scholar]
- Oquab, M.; Darcet, T.; Moutakanni, T.; Vo, H.; Szafraniec, M.; Khalidov, V.; Fernandez, P.; Haziza, D.; Massa, F.; El-Nouby, A.; et al. DINOv2: Learning Robust Visual Features without Supervision. arXiv 2024, arXiv:2304.07193. [Google Scholar] [CrossRef] [Scilit]
- Siméoni, O.; Vo, H.V.; Seitzer, M.; Baldassarre, F.; Oquab, M.; Jose, C.; Khalidov, V.; Szafraniec, M.; Yi, S.; Ramamonjisoa, M.; et al. DINOv3. arXiv 2025, arXiv:2508.10104. [Google Scholar] [CrossRef] [Scilit]
- Bergmann, P.; Fauser, M.; Sattlegger, D.; Steger, C. MVTec AD—A Comprehensive Real-World Dataset for Unsupervised Anomaly Detection. In Proceedings of the 2019 IEEE/CVF Conference on Computer Vision and Pattern Recognition (CVPR), Long Beach, CA, USA; IEEE: Piscataway, NJ, USA, 2019; pp. 9584–9592. [Google Scholar] [CrossRef] [Scilit]
- Zou, Y.; Jeong, J.; Pemula, L.; Zhang, D.; Dabeer, O. SPot-the-Difference Self-Supervised Pre-training for Anomaly Detection and Segmentation. In Proceedings of the 17th European Conference on Computer Vision, Tel Aviv, Israel, 23–27 October 2022. [Google Scholar]
- Mishra, P.; Verk, R.; Fornasier, D.; Piciarelli, C.; Foresti, G.L. VT-ADL: A Vision Transformer Network for Image Anomaly Detection and Localization. In Proceedings of the 2021 IEEE 30th International Symposium on Industrial Electronics (ISIE), Kyoto, Japan, 20–23 June 2021; pp. 1–6. [Google Scholar] [CrossRef] [Scilit]
- Yang, G.; Deng, Z.; Man, J. CADIC: Continual Anomaly Detection Based on Incremental Coreset. arXiv 2025, arXiv:2511.08634. [Google Scholar] [CrossRef] [Scilit]
- Barusco, M.; Borsatti, F.; Beda, N.; Dalle Pezze, D.; Susto, G.A. Towards Continual Visual Anomaly Detection in the Medical Domain. In Proceedings of the International Workshop on Personalized Incremental Learning in Medicine (PILM), Dublin, Ireland, 31 October 2025. [Google Scholar] [CrossRef] [Scilit]
- You, Z.; Cui, L.; Shen, Y.; Yang, K.; Lu, X.; Zheng, Y.; Le, X. A Unified Model for Multi-class Anomaly Detection. In Proceedings of the Advances in Neural Information Processing Systems, New Orleans, LA, USA, 28 November–9 December 2022. [Google Scholar]
- Jiang, X.; Chen, Y.; Nie, Q.; Liu, J.; Liu, Y.; Wang, C.; Zheng, F. Toward Multi-class Anomaly Detection: Exploring Class-aware Unified Model against Inter-class Interference. arXiv 2024, arXiv:2403.14213. [Google Scholar] [CrossRef] [Scilit]
- Kashiani, H.; Talemi, N.A.; Afghah, F. ROADS: Robust Prompt-driven Multi-Class Anomaly Detection under Domain Shift. In Proceedings of the IEEE/CVF Winter Conference on Applications of Computer Vision (WACV), Tucson, AZ, USA, 28 February–4 March 2025. [Google Scholar]
- Liu, J.; Wu, K.; Nie, Q.; Chen, Y.; Gao, B.B.; Liu, Y.; Wang, J.; Wang, C.; Zheng, F. Unsupervised Continual Anomaly Detection with Contrastively-learned Prompt. In Proceedings of the AAAI Conference on Artificial Intelligence, Vancouver, BC, Canada, 20–27 February 2024; Volume 38. [Google Scholar]
- Chae, J.; Luo, L.; Liu, Y.; Wang, R.; Yu, D.; Liang, Z.; Yuan, X.; Zhang, D.; Chen, Z.; Qin, P.; et al. GCR: Geometry-Consistent Routing for Task-Agnostic Continual Anomaly Detection. arXiv 2026, arXiv:2601.01856. [Google Scholar] [CrossRef] [Scilit]
- Deng, H.; Li, X. Anomaly Detection via Reverse Distillation from One-Class Embedding. In Proceedings of the IEEE/CVF Conference on Computer Vision and Pattern Recognition (CVPR), New Orleans, LA, USA, 19–24 June 2022. [Google Scholar]
- Batzner, K.; Heckler, L.; König, R. EfficientAD: Accurate Visual Anomaly Detection at Millisecond-Level Latencies. arXiv 2024, arXiv:2303.14535. [Google Scholar]
- Guo, J.; Lu, S.; Zhang, W.; Chen, F.; Li, H.; Liao, H. Dinomaly: The Less Is More Philosophy in Multi-Class Unsupervised Anomaly Detection. In Proceedings of the IEEE/CVF Conference on Computer Vision and Pattern Recognition (CVPR), Nashville, TN, USA, 11–15 June 2025. [Google Scholar]
- De Lange, M.; Aljundi, R.; Masana, M.; Parisot, S.; Jia, X.; Leonardis, A.; Slabaugh, G.; Tuytelaars, T. A continual learning survey: Defying forgetting in classification tasks. IEEE Trans. Pattern Anal. Mach. Intell. 2022, 44, 3366–3385. [Google Scholar] [CrossRef] [Scilit] [PubMed]
- Dahmardeh, M.; Setti, F. MECAD: A multi-expert architecture for continual anomaly detection. In Proceedings of the International Conference on Image Analysis and Processing, Rome, Italy, 15–19 September 2025. [Google Scholar]
- Dosovitskiy, A.; Beyer, L.; Kolesnikov, A.; Weissenborn, D.; Zhai, X.; Unterthiner, T.; Dehghani, M.; Minderer, M.; Heigold, G.; Gelly, S.; et al. An Image is Worth 16x16 Words: Transformers for Image Recognition at Scale. arXiv 2021, arXiv:2010.11929. [Google Scholar]
- Caron, M.; Touvron, H.; Misra, I.; Jégou, H.; Mairal, J.; Bojanowski, P.; Joulin, A. Emerging Properties in Self-Supervised Vision Transformers. In Proceedings of the IEEE/CVF International Conference on Computer Vision (ICCV), Virtual, 11–17 October 2021. [Google Scholar]
- Yuan, J.; Ye, J.; Chen, W.; Gao, C. AD-DINOv3: Enhancing DINOv3 for Zero-Shot Anomaly Detection with Anomaly-Aware Calibration. In Proceedings of the International Conference on Acoustics, Speech and Signal Processing (ICASSP), Barcelona, Spain, 4–8 May 2026. [Google Scholar]
- Ben Ammar, M.; Mendoza, A.; Belkhir, N.; Manzanera, A.; Franchi, G. Foundation models and Transformers for anomaly detection: A survey. Inf. Fusion 2026, 126, 103517. [Google Scholar] [CrossRef] [Scilit]
- Lee, S.; Lee, S.; Song, B.C. CFA: Coupled-Hypersphere-Based Feature Adaptation for Target-Oriented Anomaly Localization. IEEE Access 2022, 10, 78446–78454. [Google Scholar] [CrossRef] [Scilit]
- Davis, J.; Goadrich, M. The relationship between Precision–Recall and ROC curves. In Proceedings of the 23rd International Conference on Machine Learning, Pittsburgh, PA, USA, 25–29 June 2006. [Google Scholar]
- Bergmann, P.; Batzner, K.; Fauser, M.; Sattlegger, D.; Steger, C. The MVTec Anomaly Detection Dataset: A Comprehensive Real-World Dataset for Unsupervised Anomaly Detection. Int. J. Comput. Vis. 2021, 129, 1038–1059. [Google Scholar] [CrossRef] [Scilit]
- Radford, A.; Kim, J.W.; Hallacy, C.; Ramesh, A.; Goh, G.; Agarwal, S.; Sastry, G.; Askell, A.; Mishkin, P.; Clark, J.; et al. Learning Transferable Visual Models From Natural Language Supervision. In Proceedings of the 38th International Conference on Machine Learning (ICML), Virtual, 18–24 July 2021; Volume 139, pp. 8748–8763. [Google Scholar]
- Zhai, X.; Mustafa, B.; Kolesnikov, A.; Beyer, L. Sigmoid Loss for Language Image Pre-Training. In Proceedings of the IEEE/CVF International Conference on Computer Vision (ICCV), Paris, France, 2–6 October 2023; pp. 11975–11986. [Google Scholar]
- Li, X.; Huang, Z.; Xue, F.; Zhou, Y. MuSc: Zero-Shot Industrial Anomaly Classification and Segmentation with Mutual Scoring of the Unlabeled Images. In Proceedings of the International Conference on Learning Representations (ICLR), Vienna, Austria, 7–11 May 2024. [Google Scholar]
- Pan, Y.; Wang, L.; Chen, Y.; Zhu, W.; Peng, B.; Chi, M. PA-CLIP: Enhancing Zero-Shot Anomaly Detection through Pseudo-Anomaly Awareness. arXiv 2025, arXiv:2503.01292. [Google Scholar] [CrossRef] [Scilit]
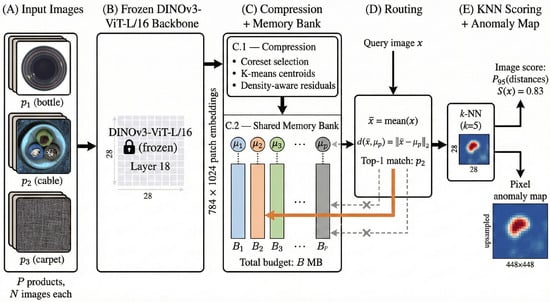
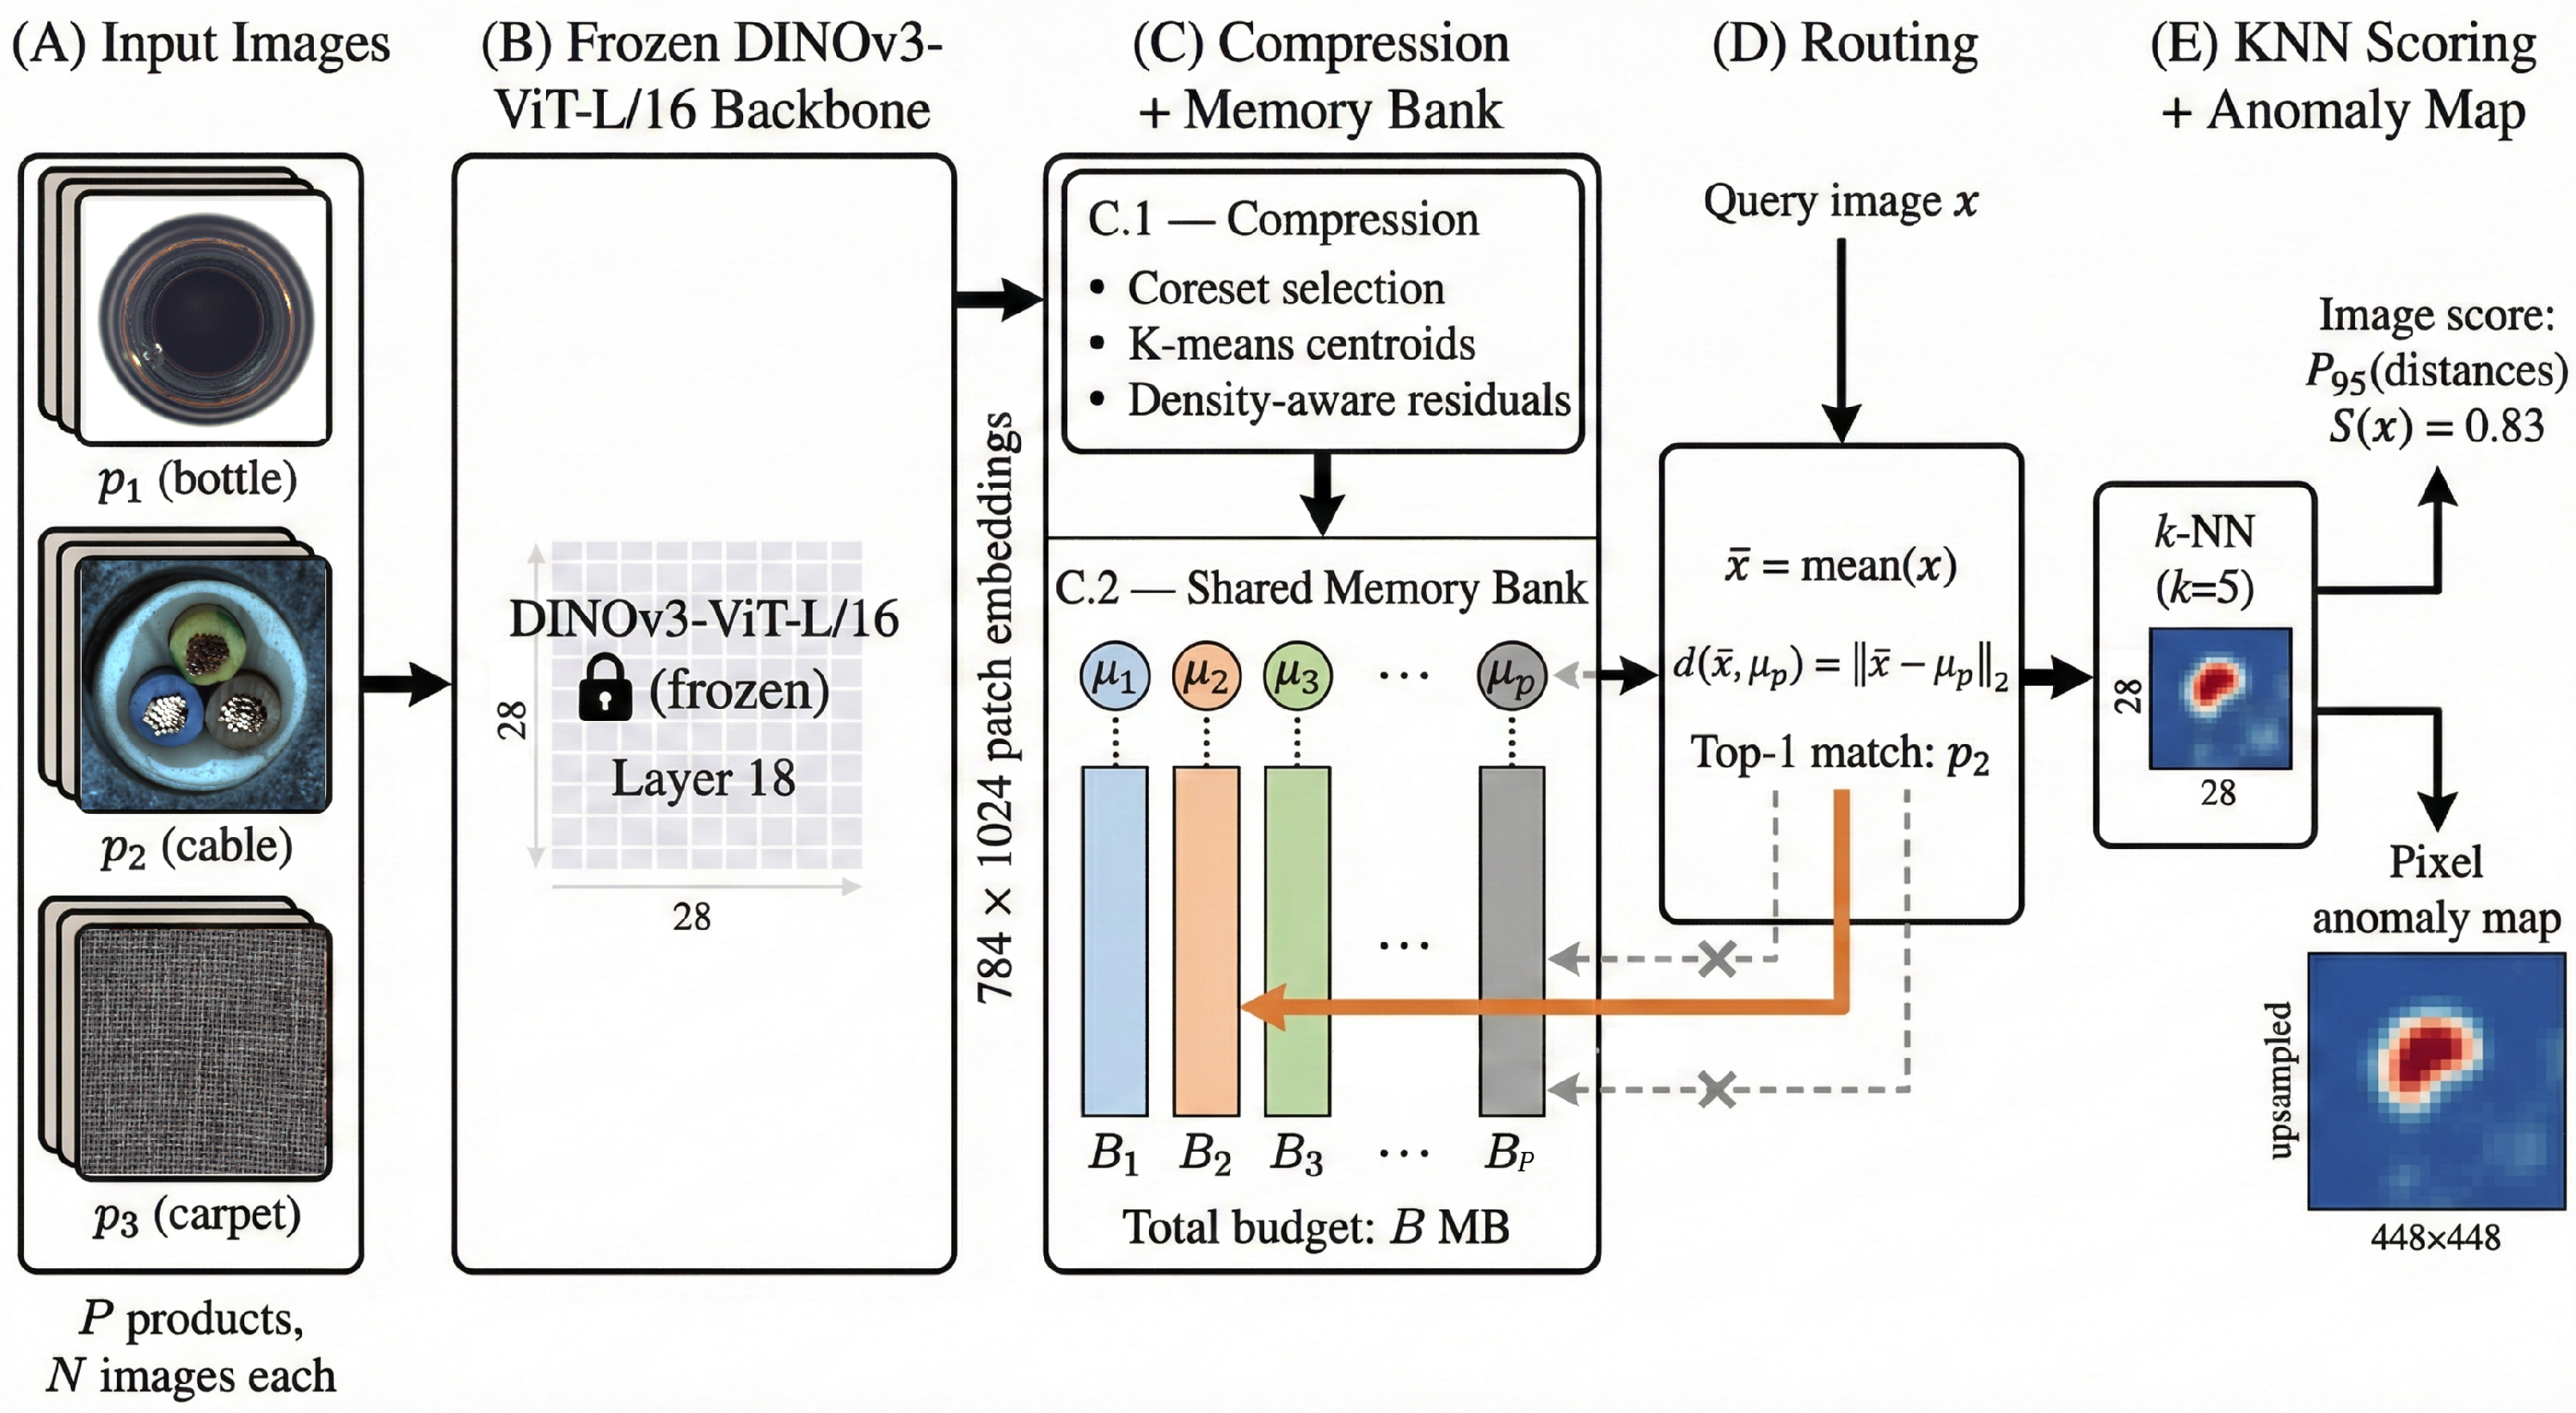
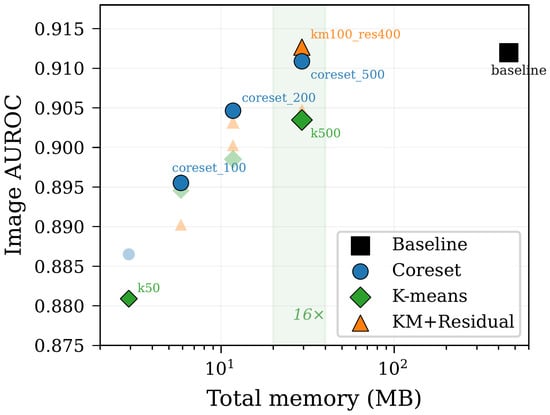
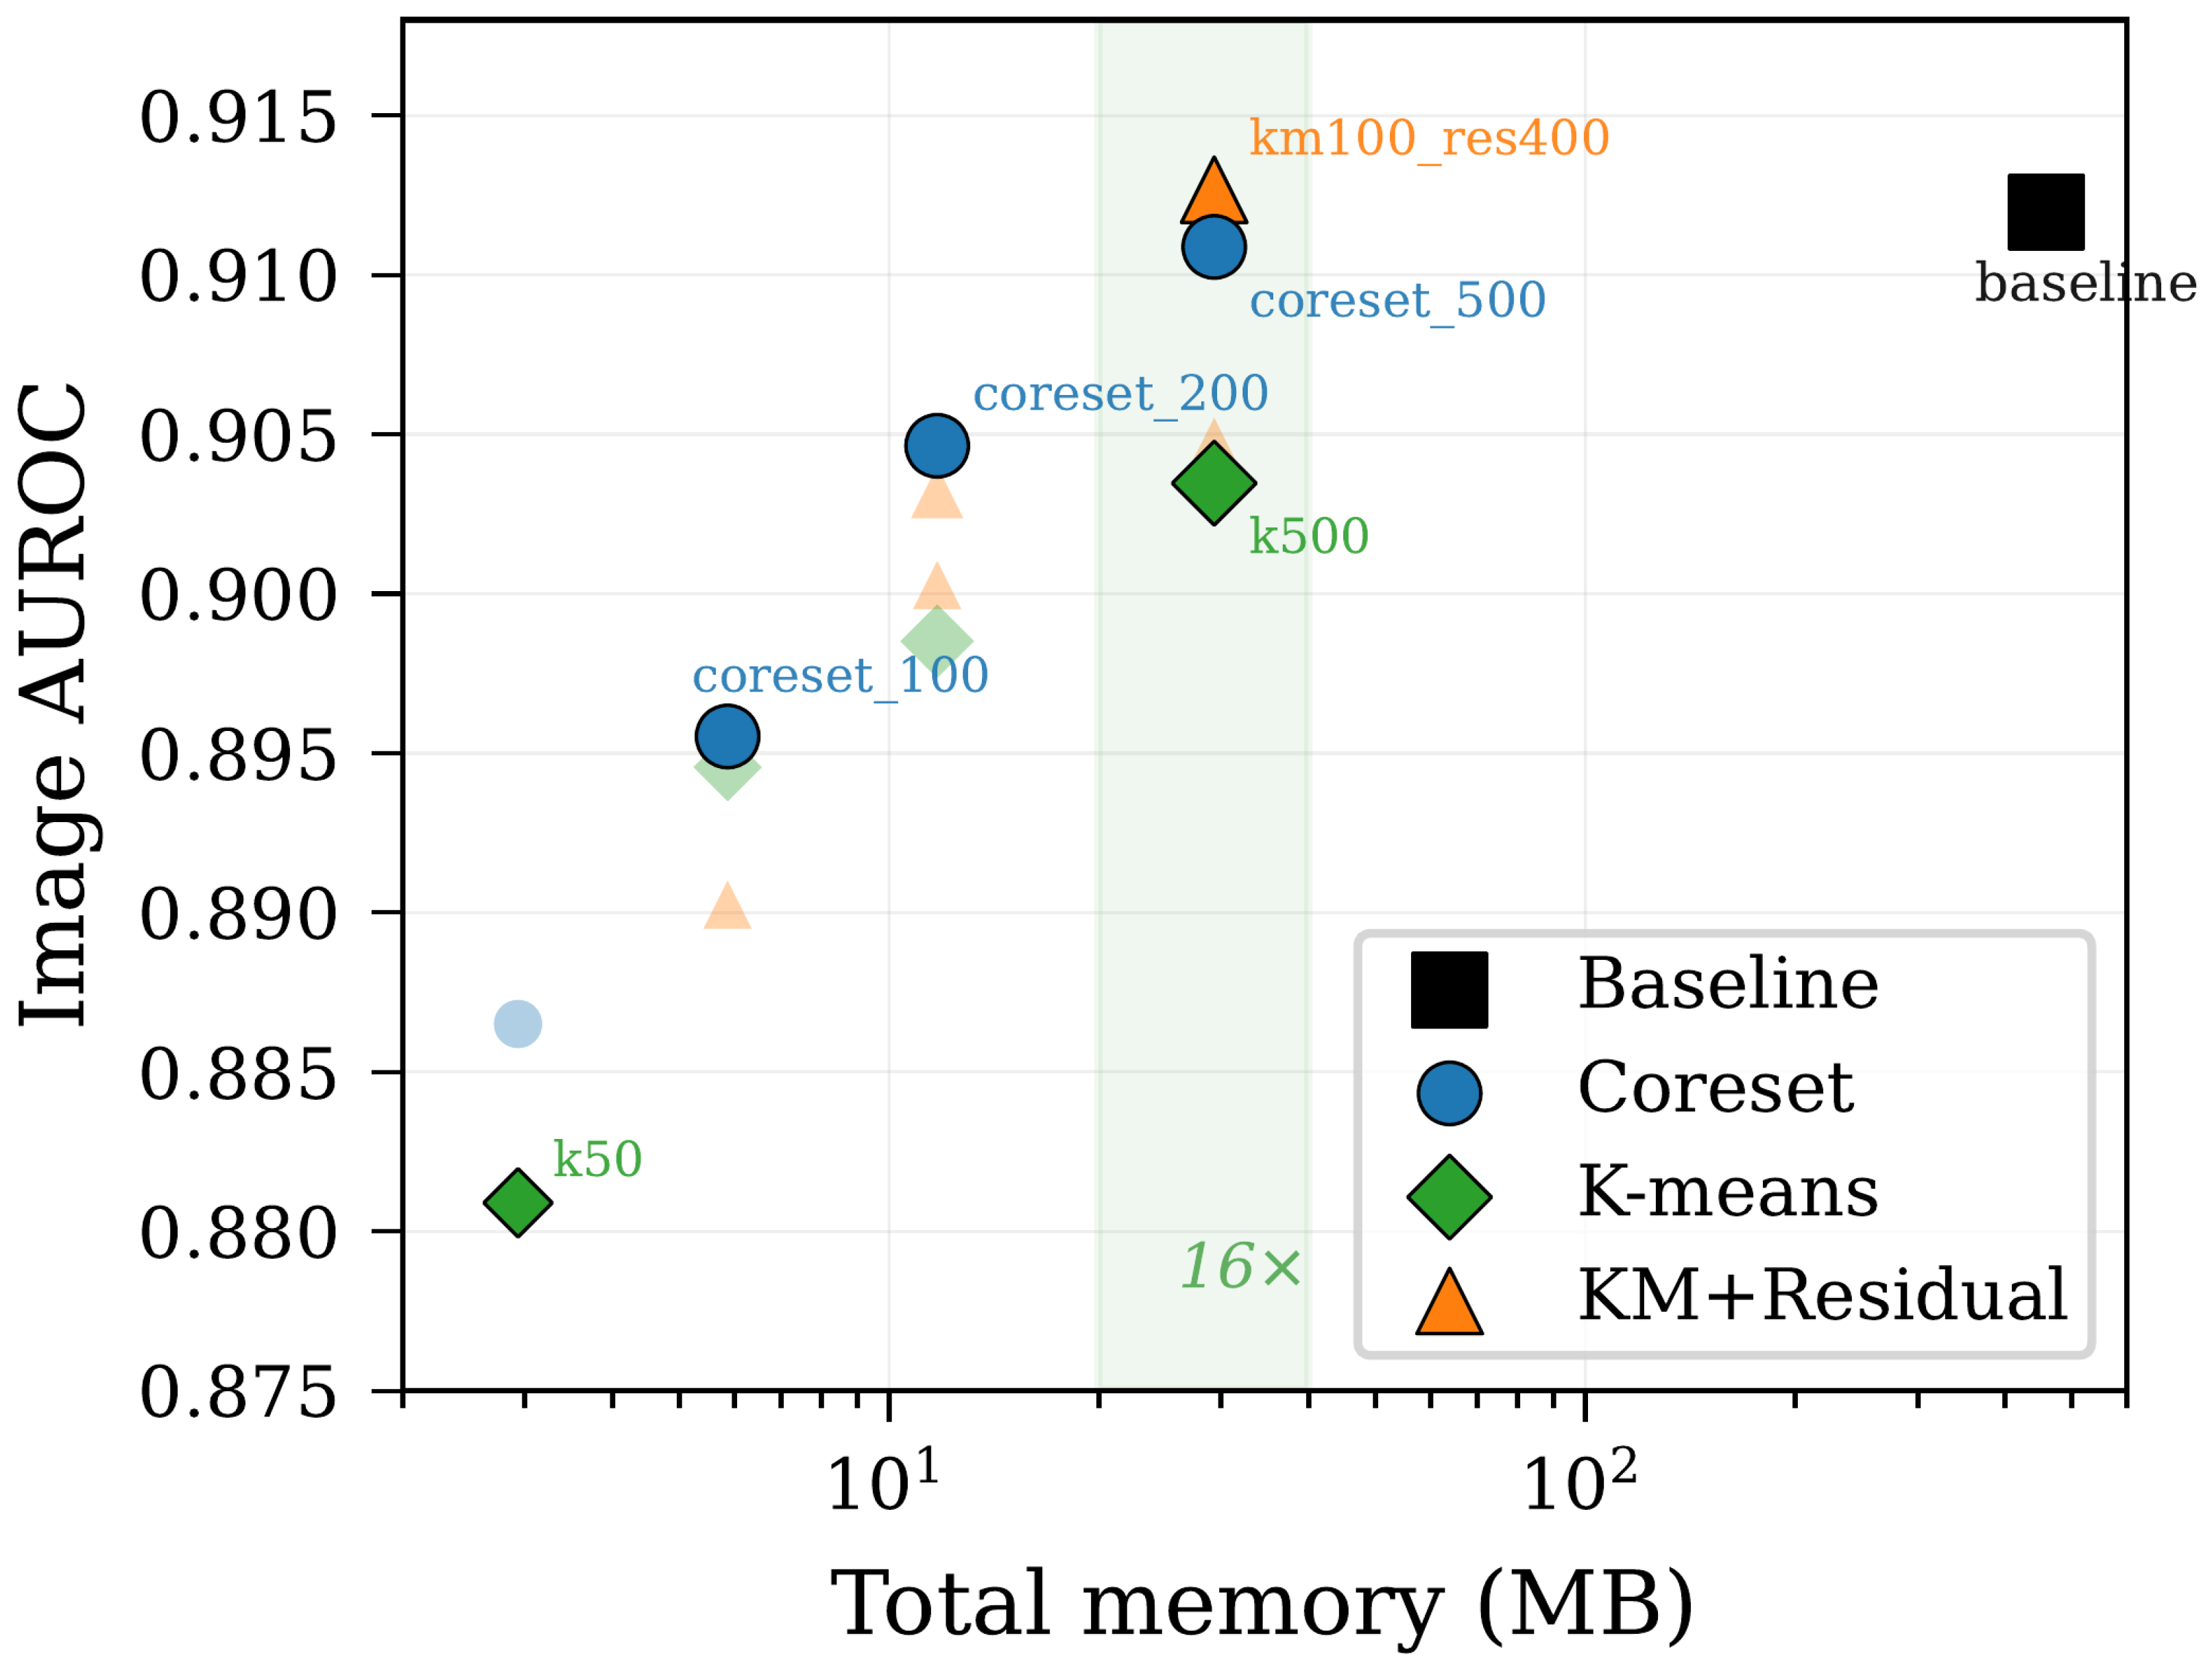
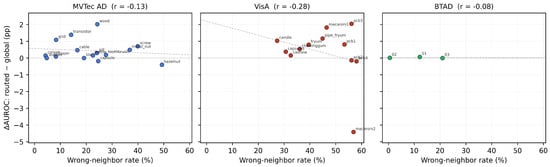
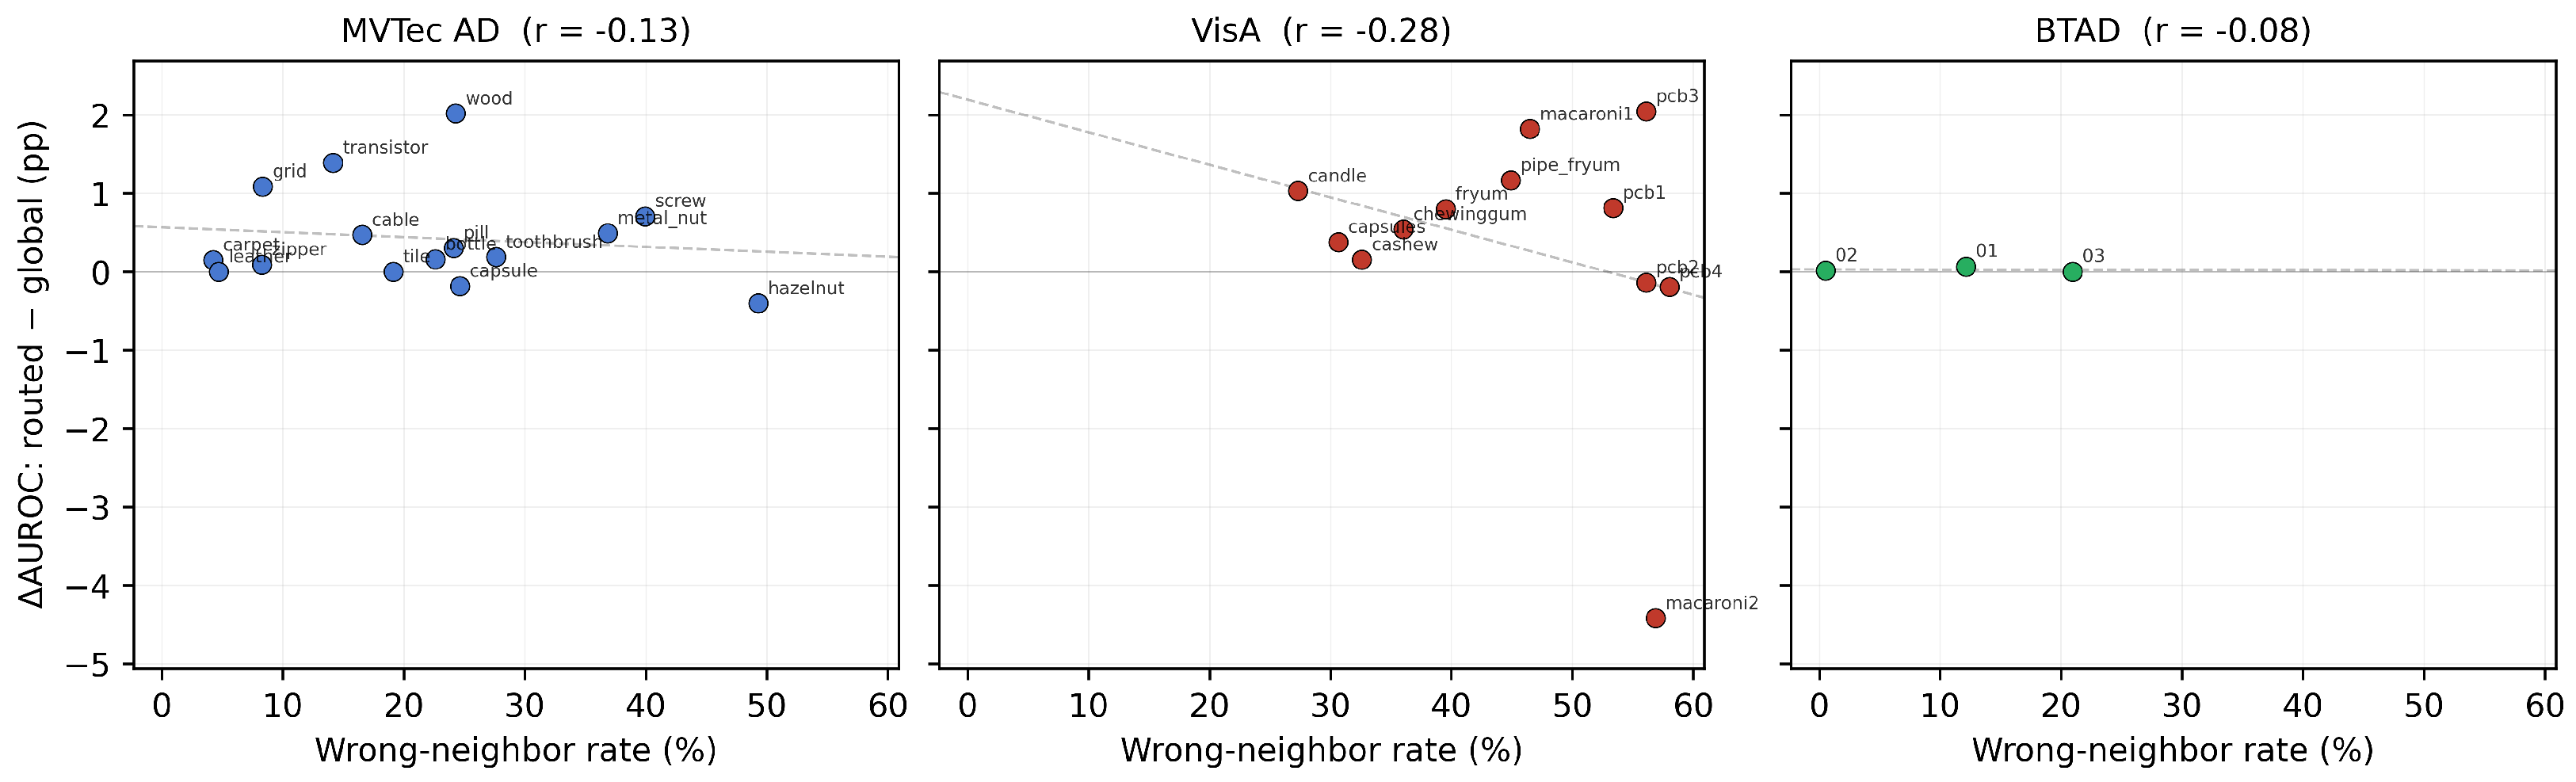
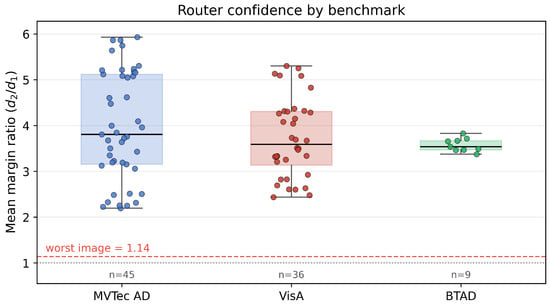
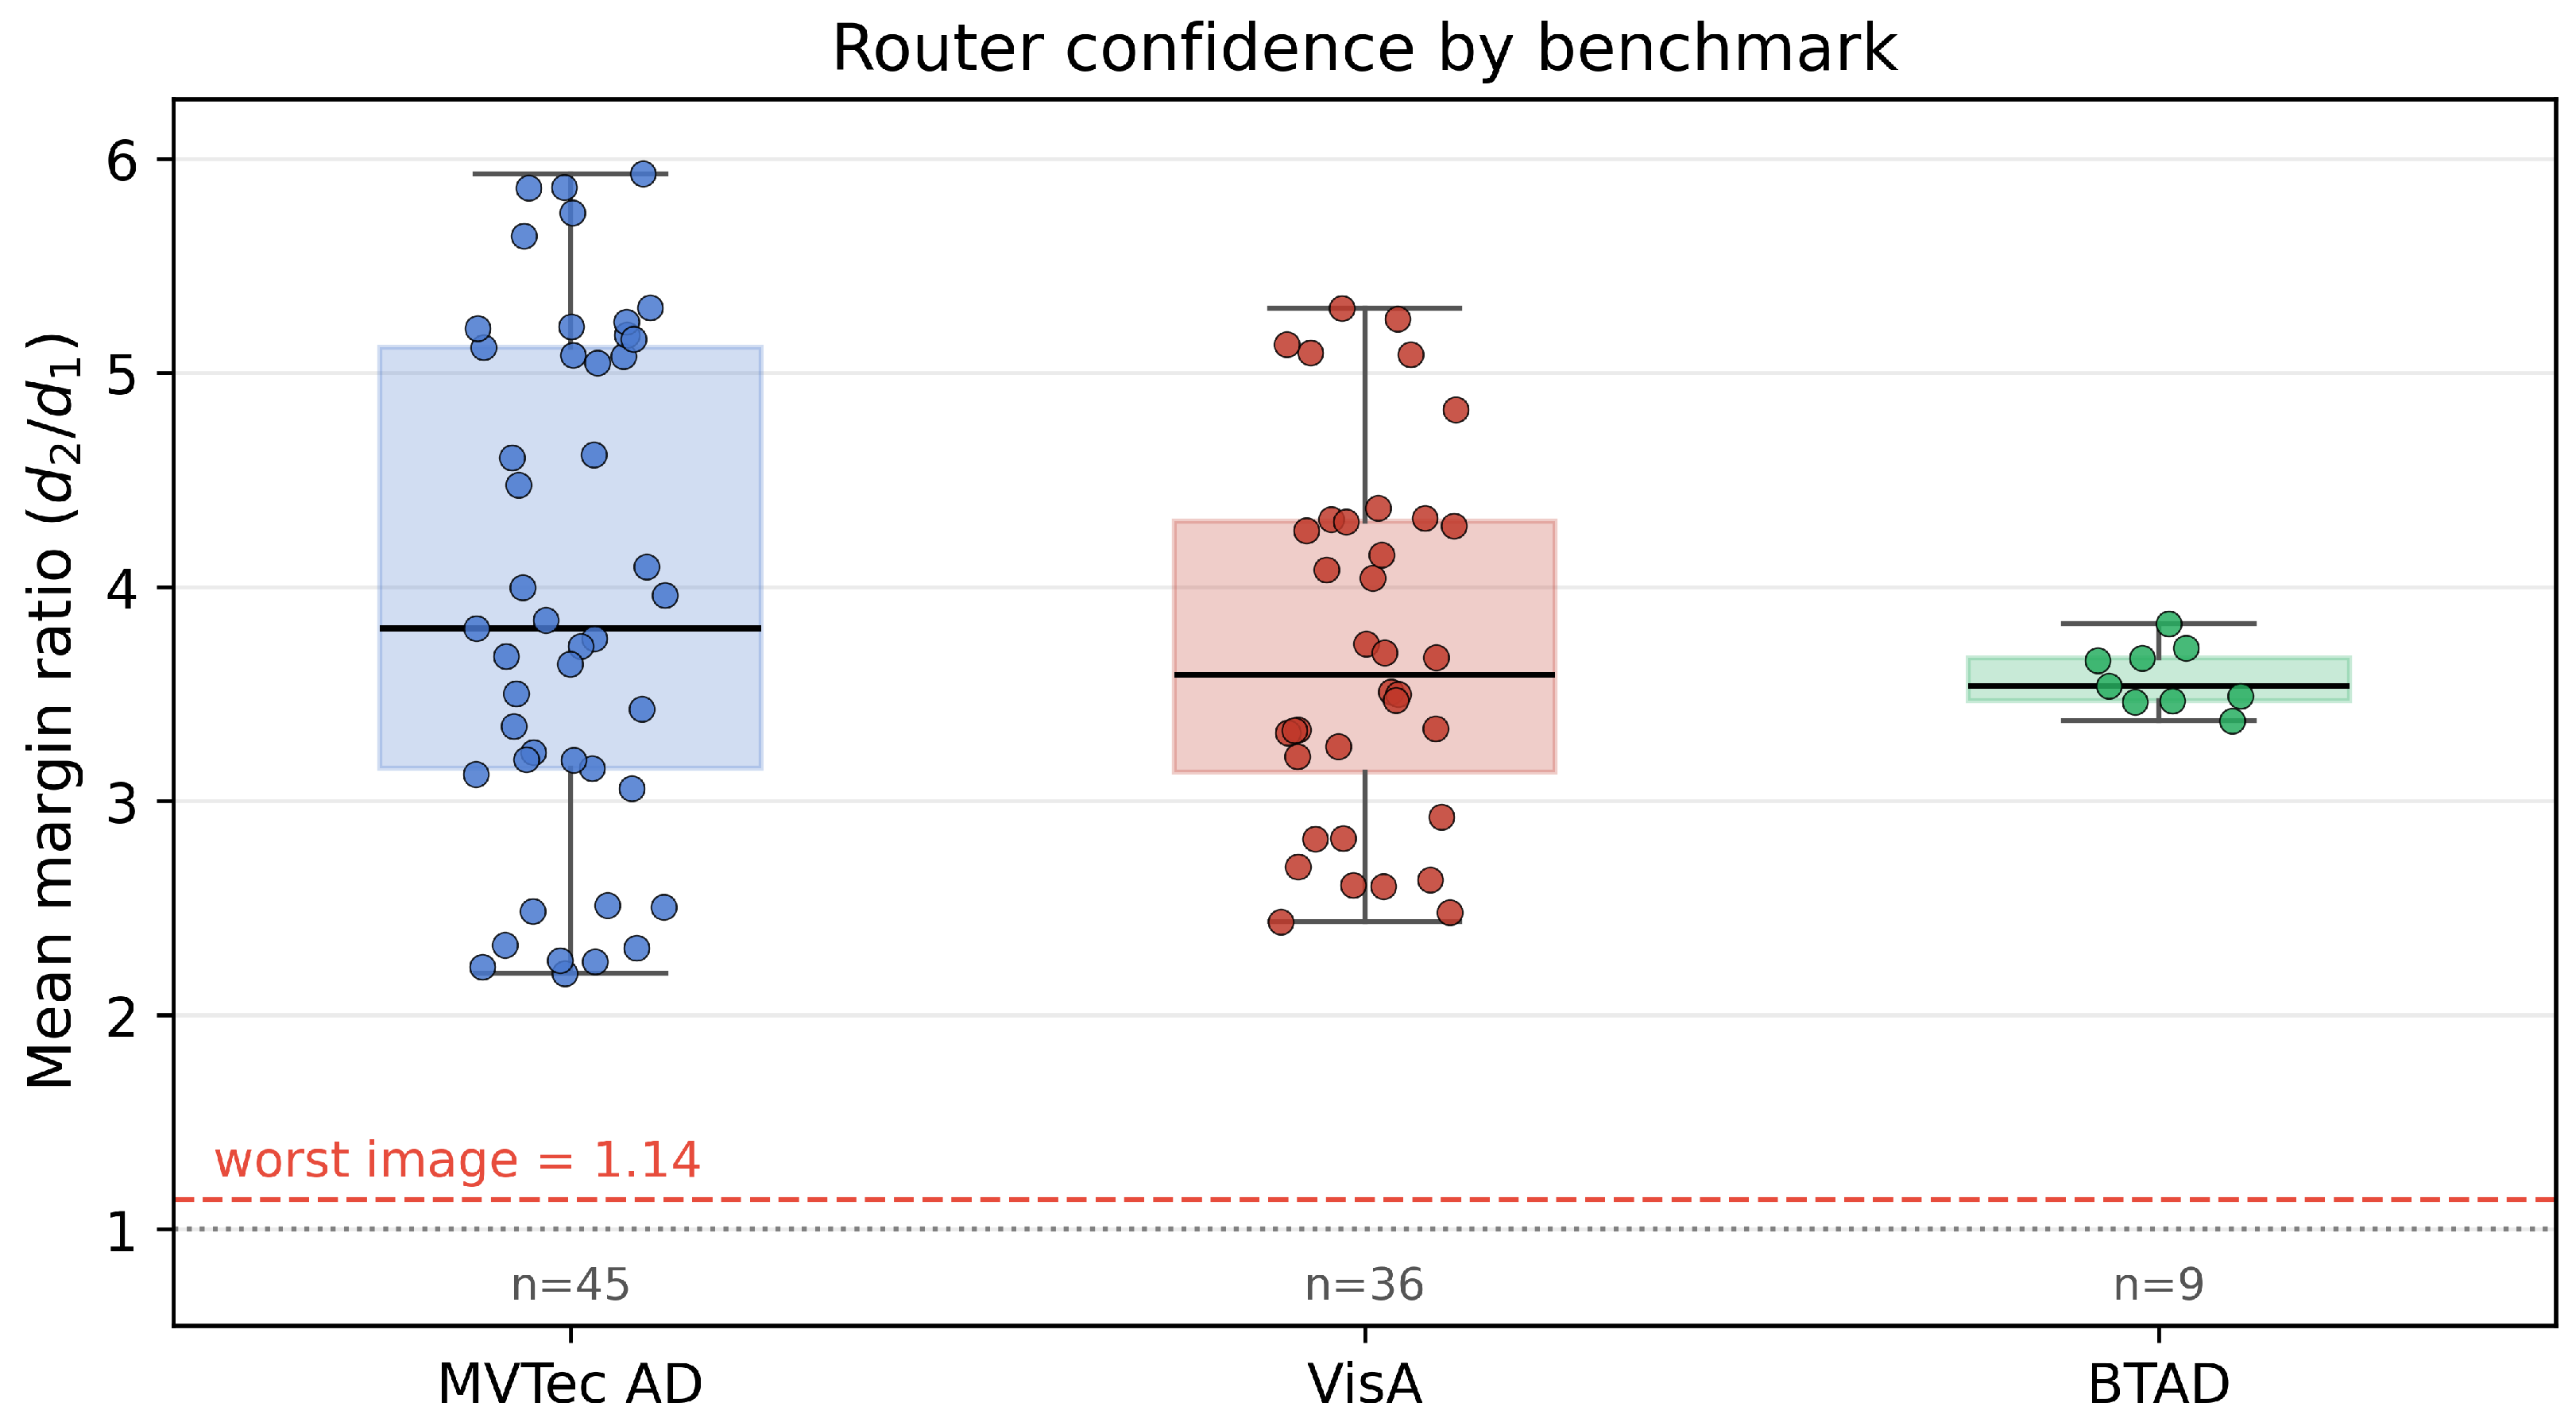
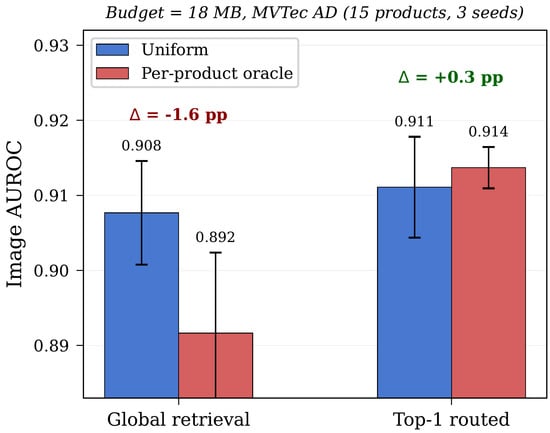
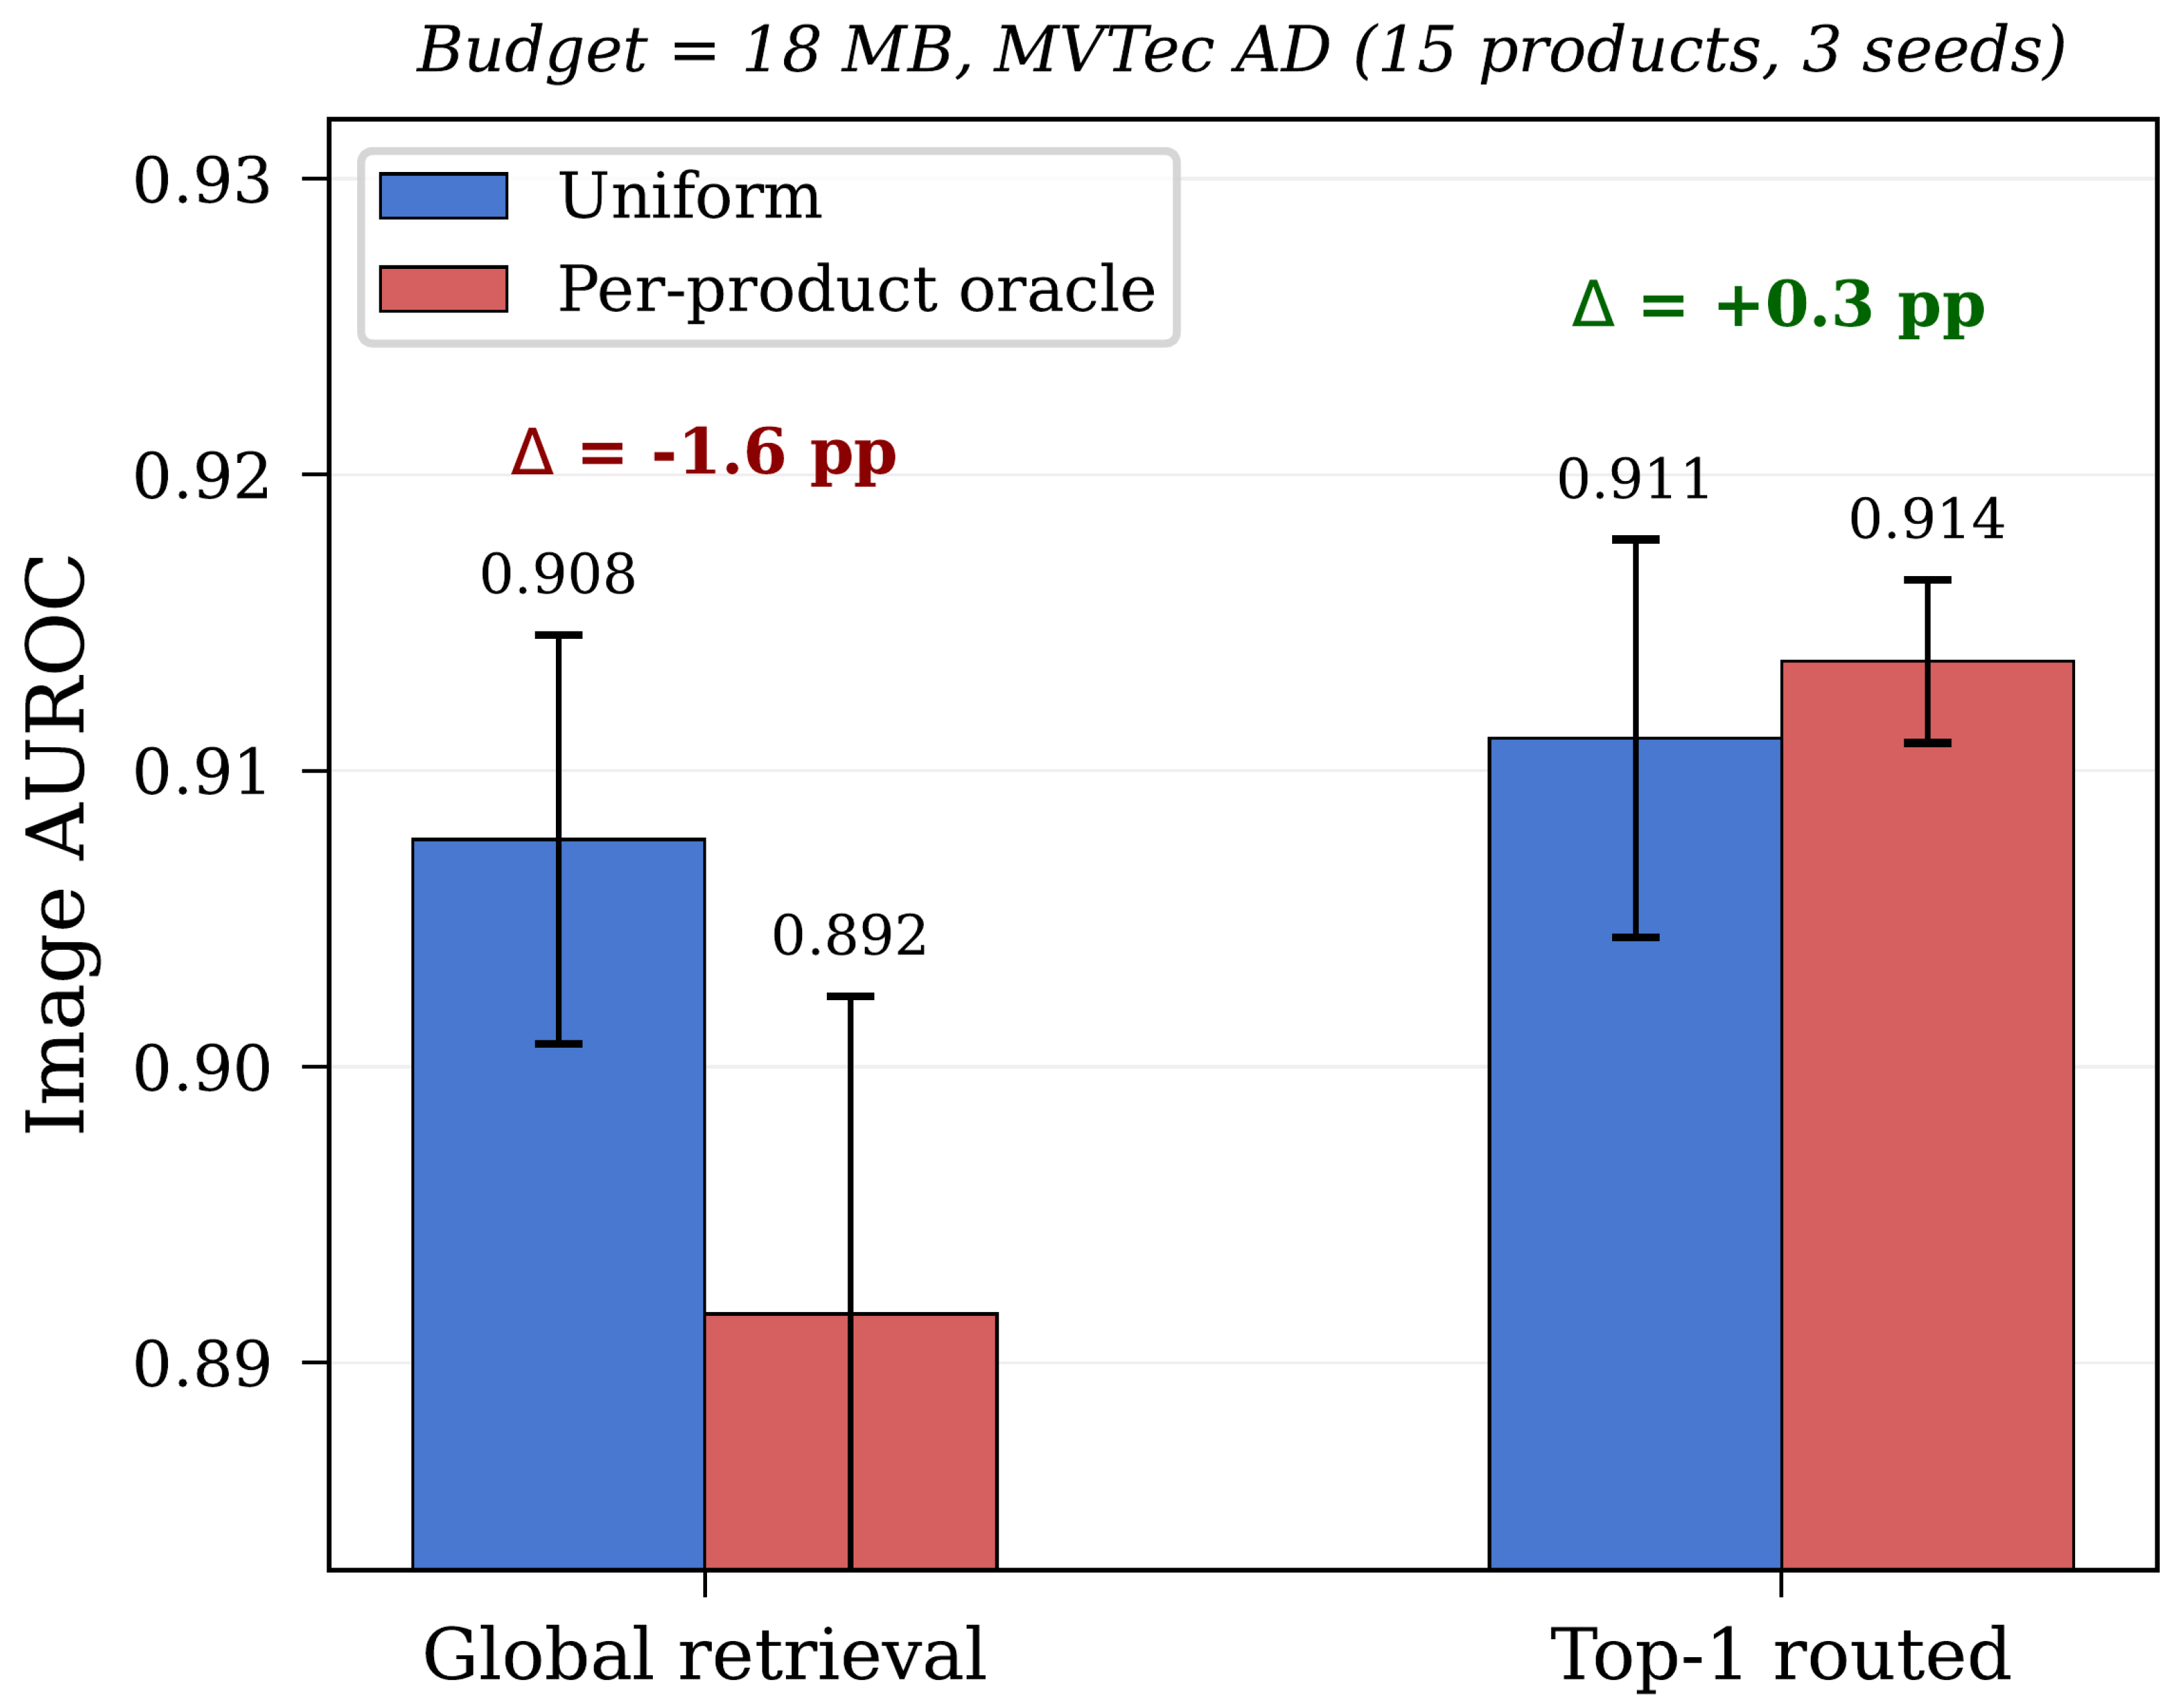
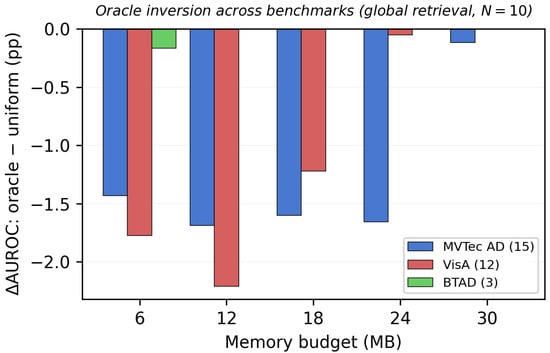
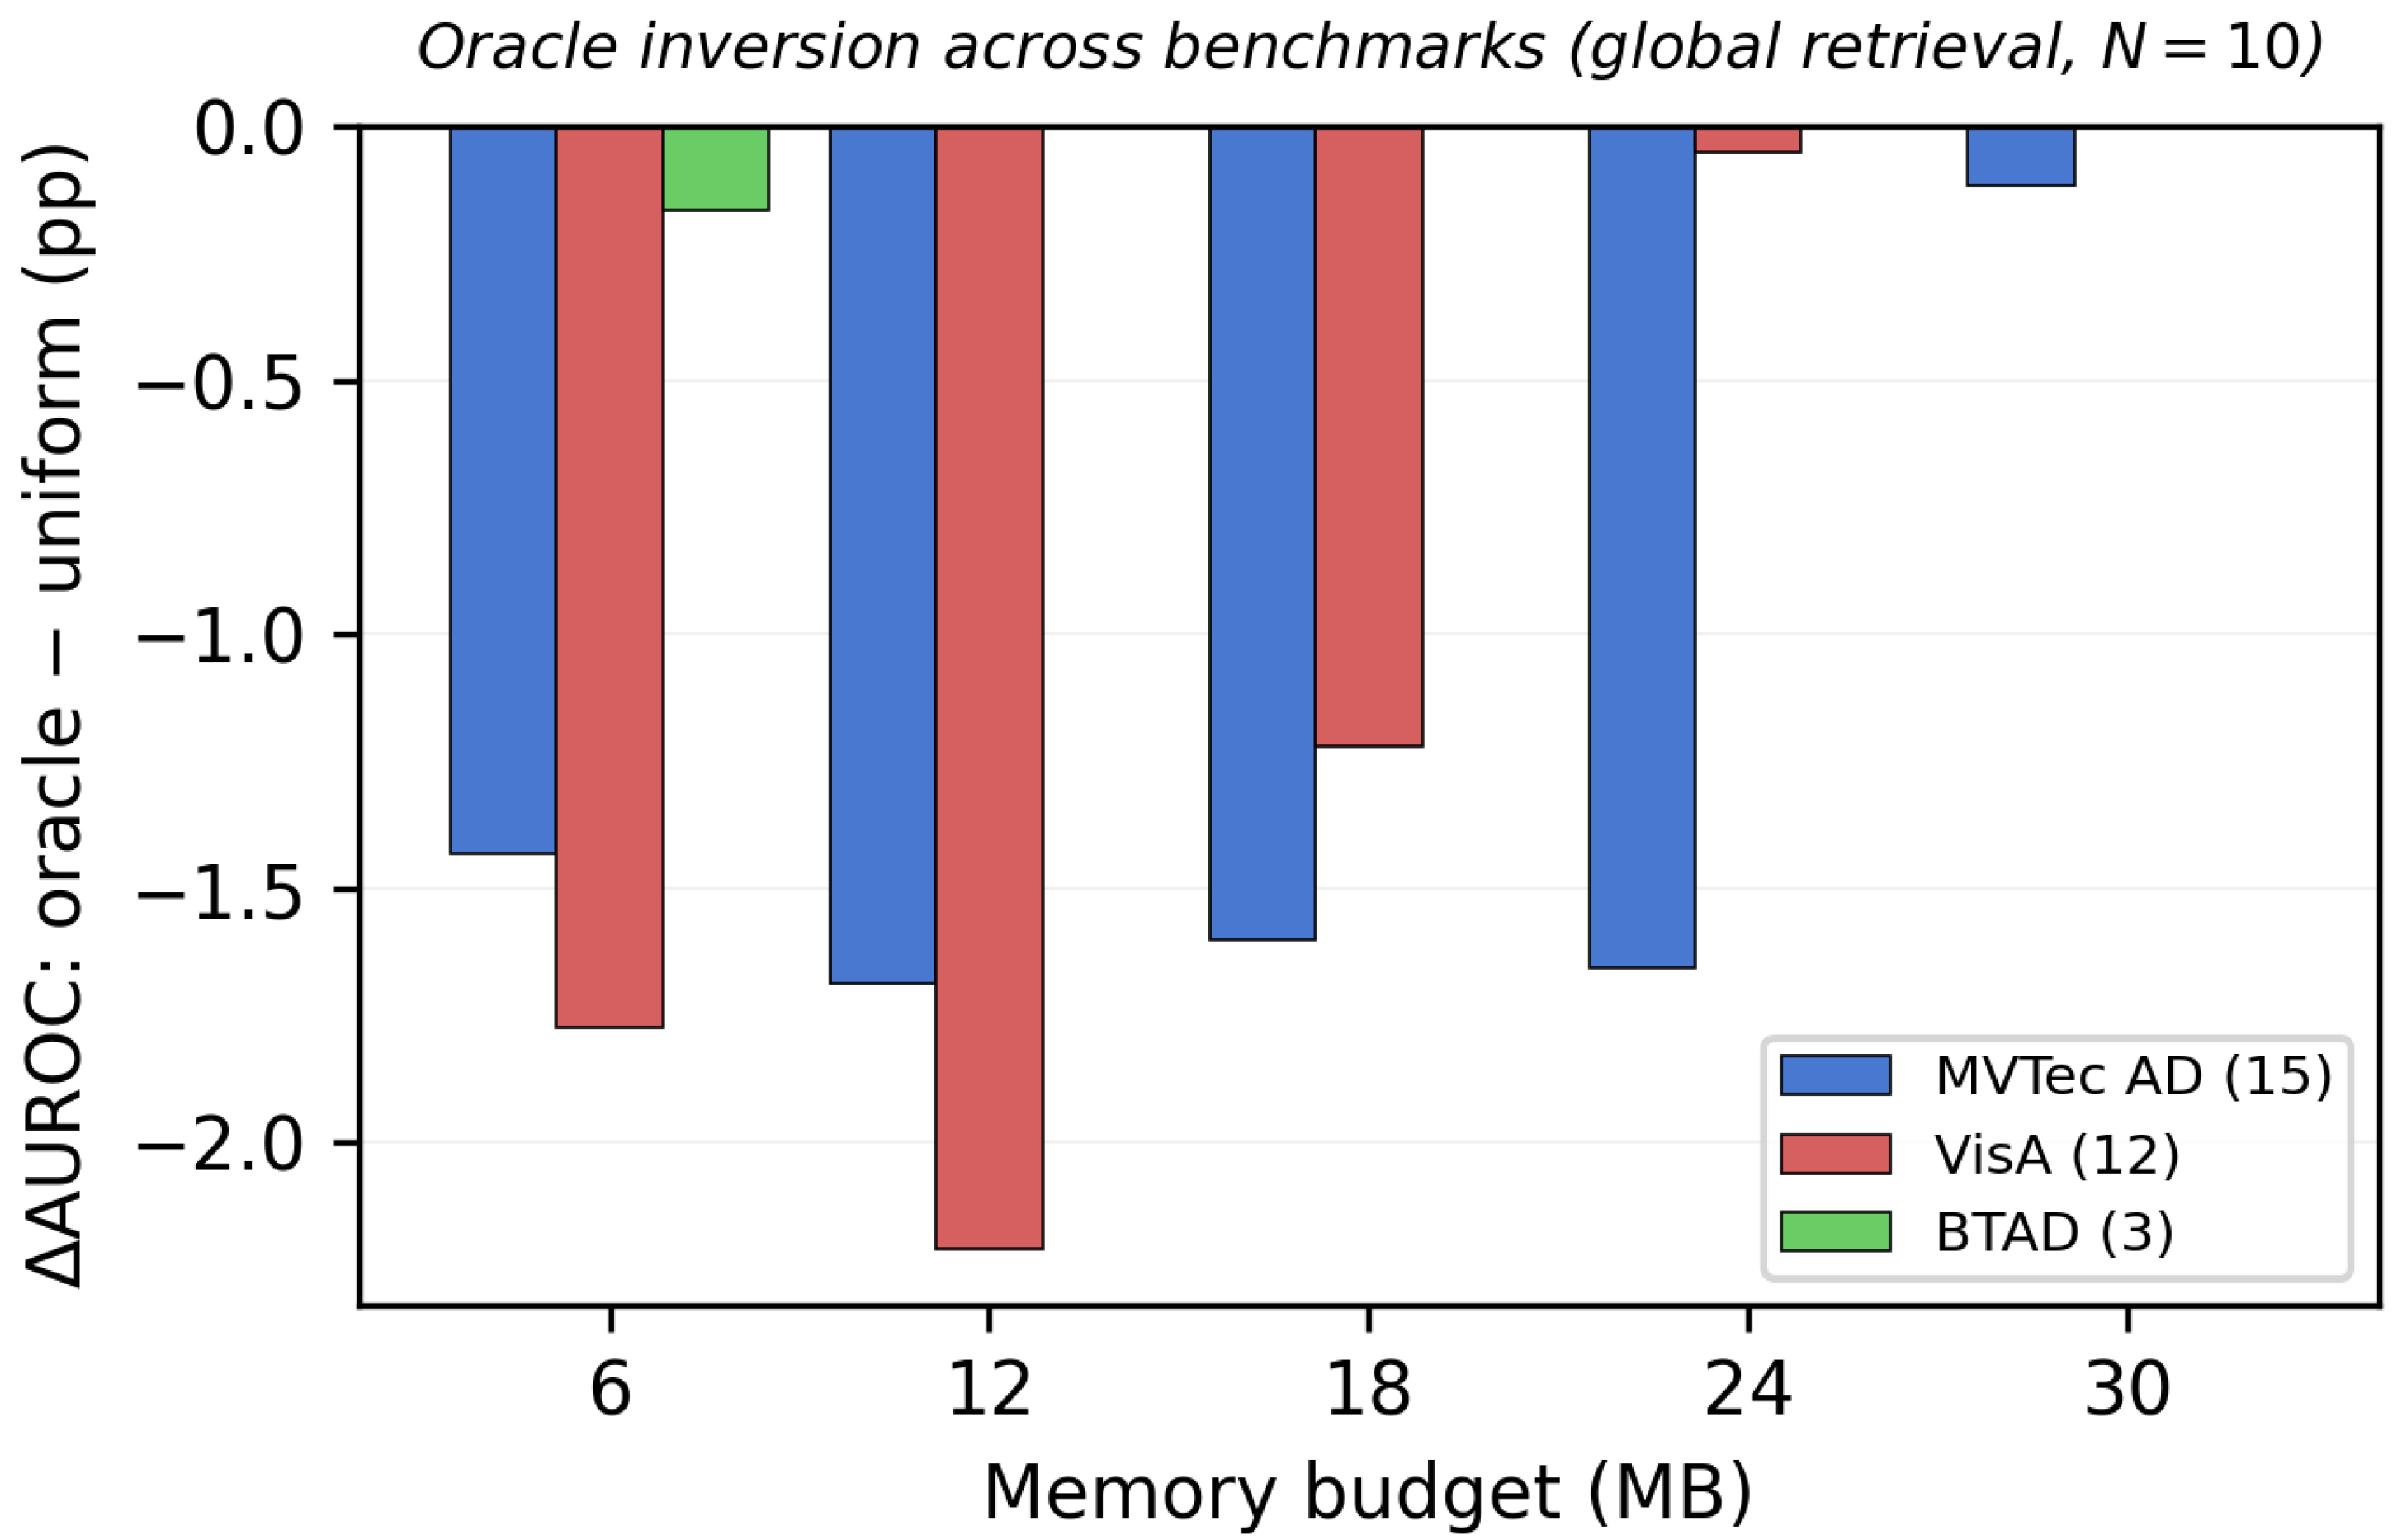
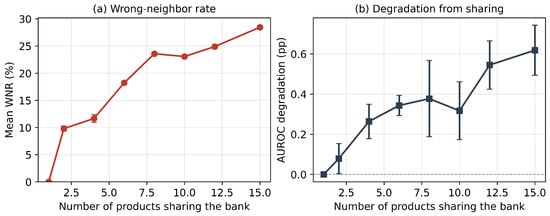
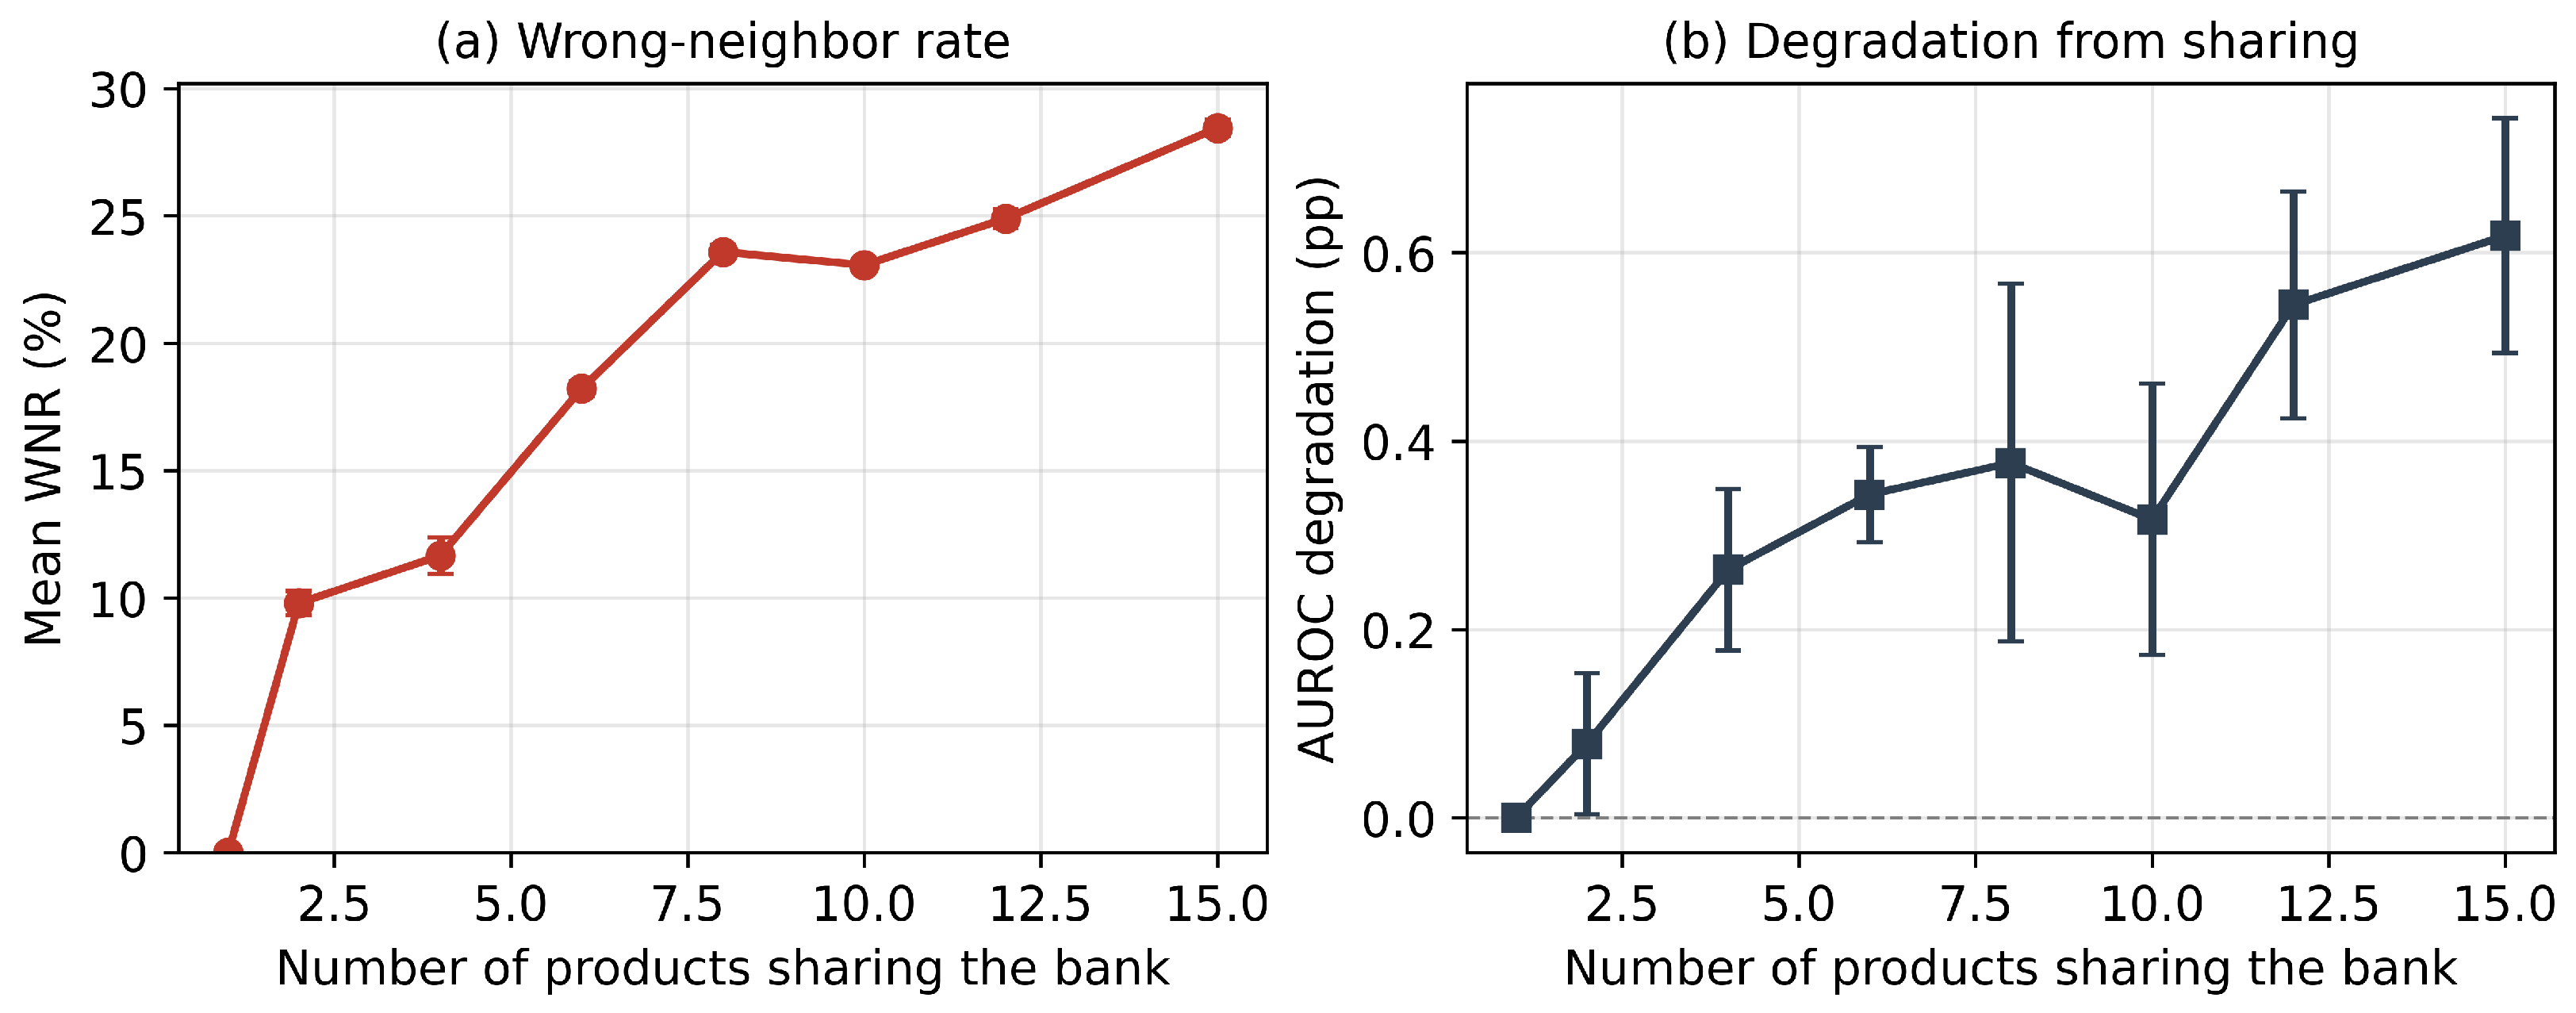
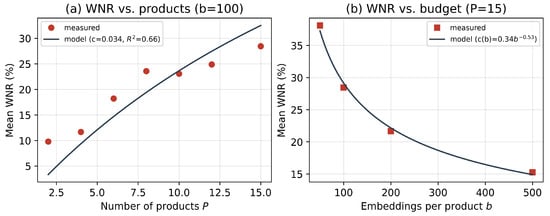
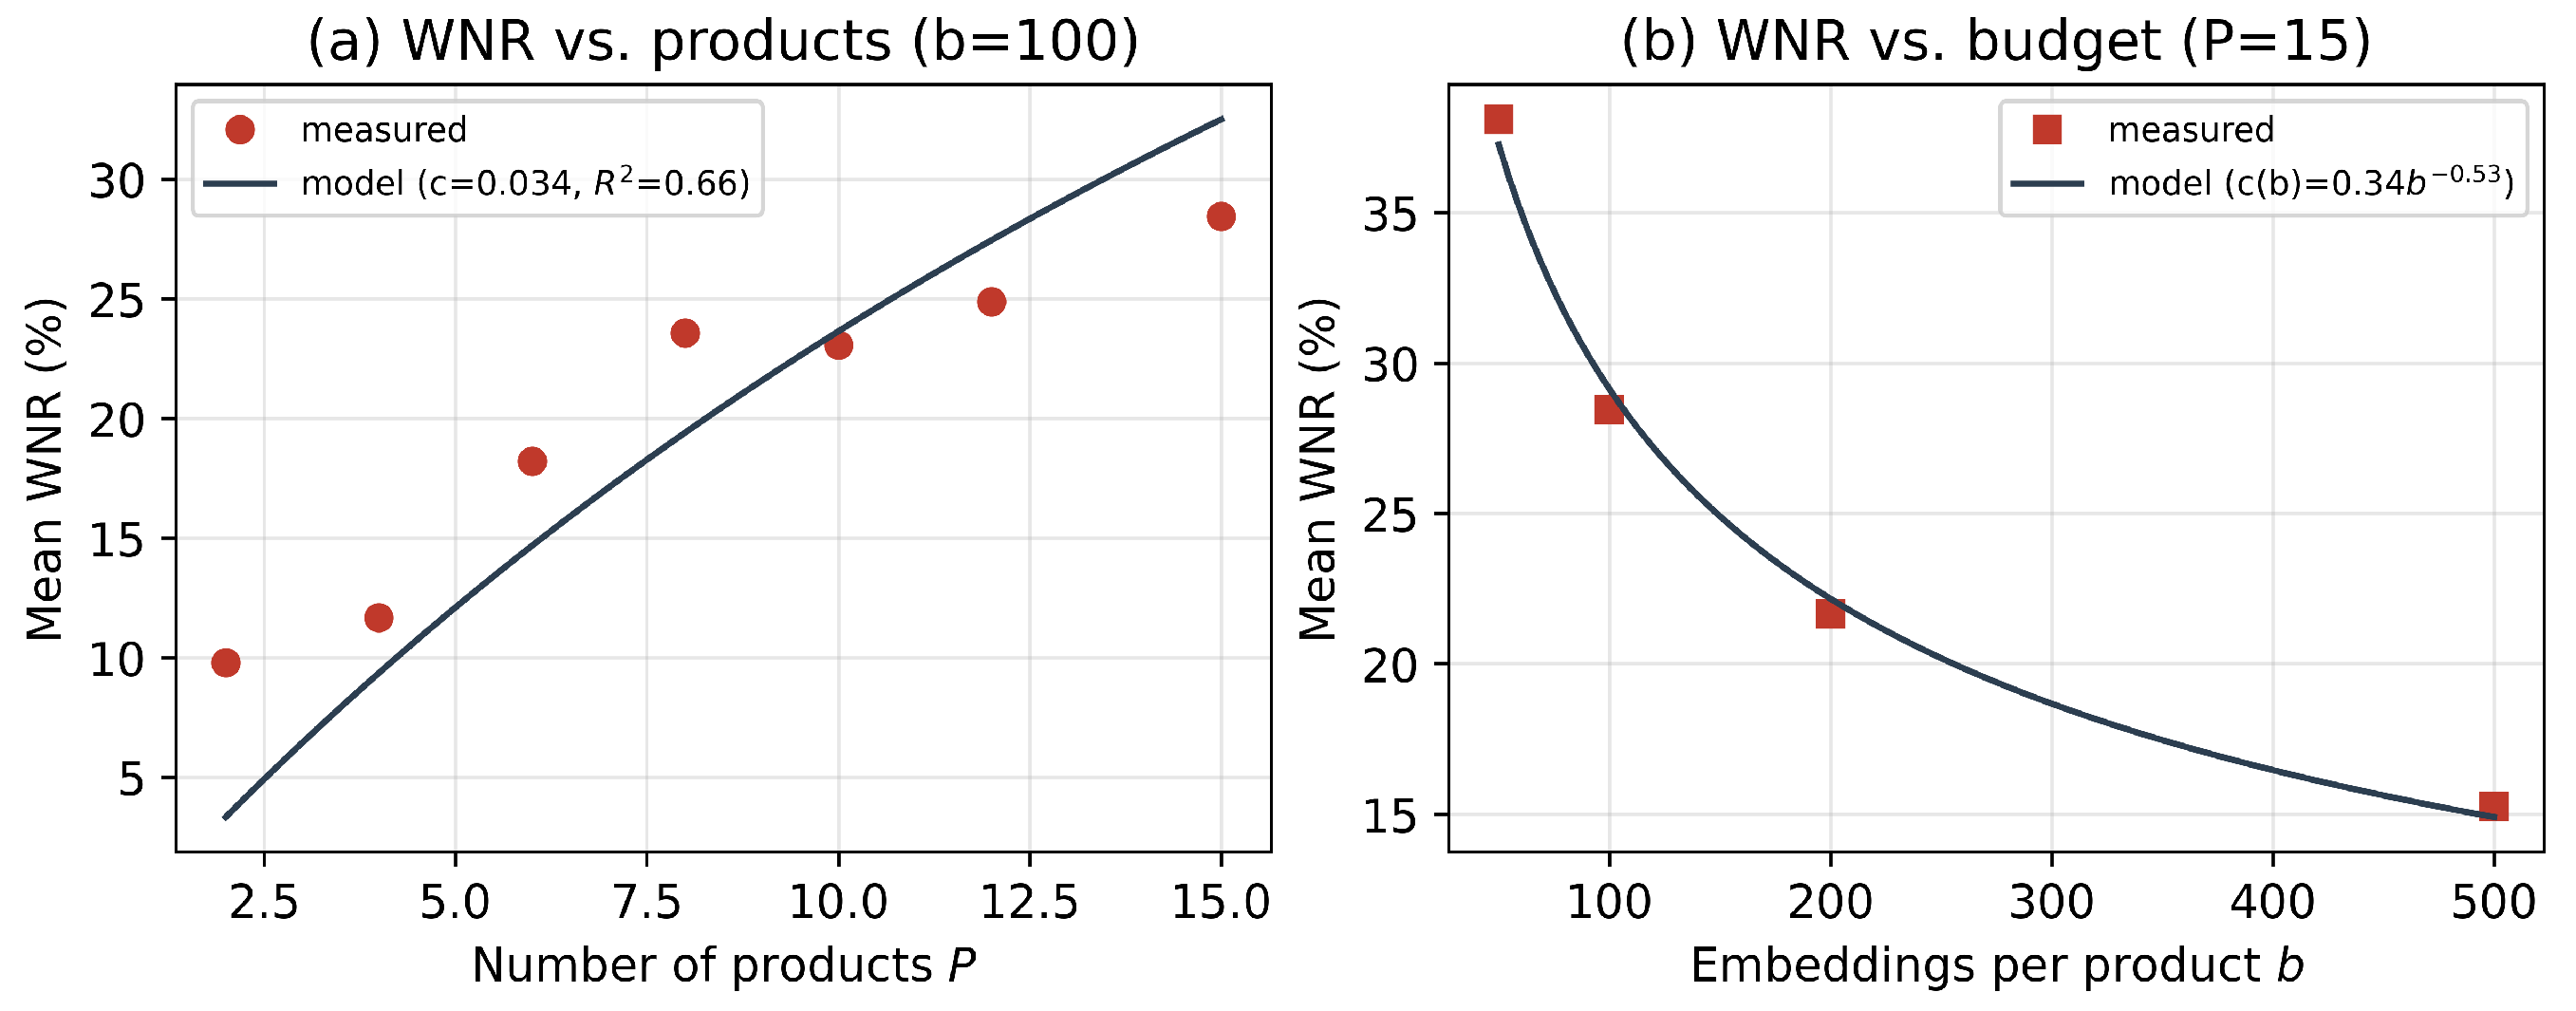
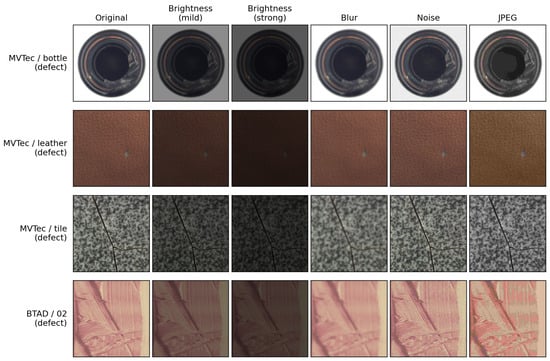
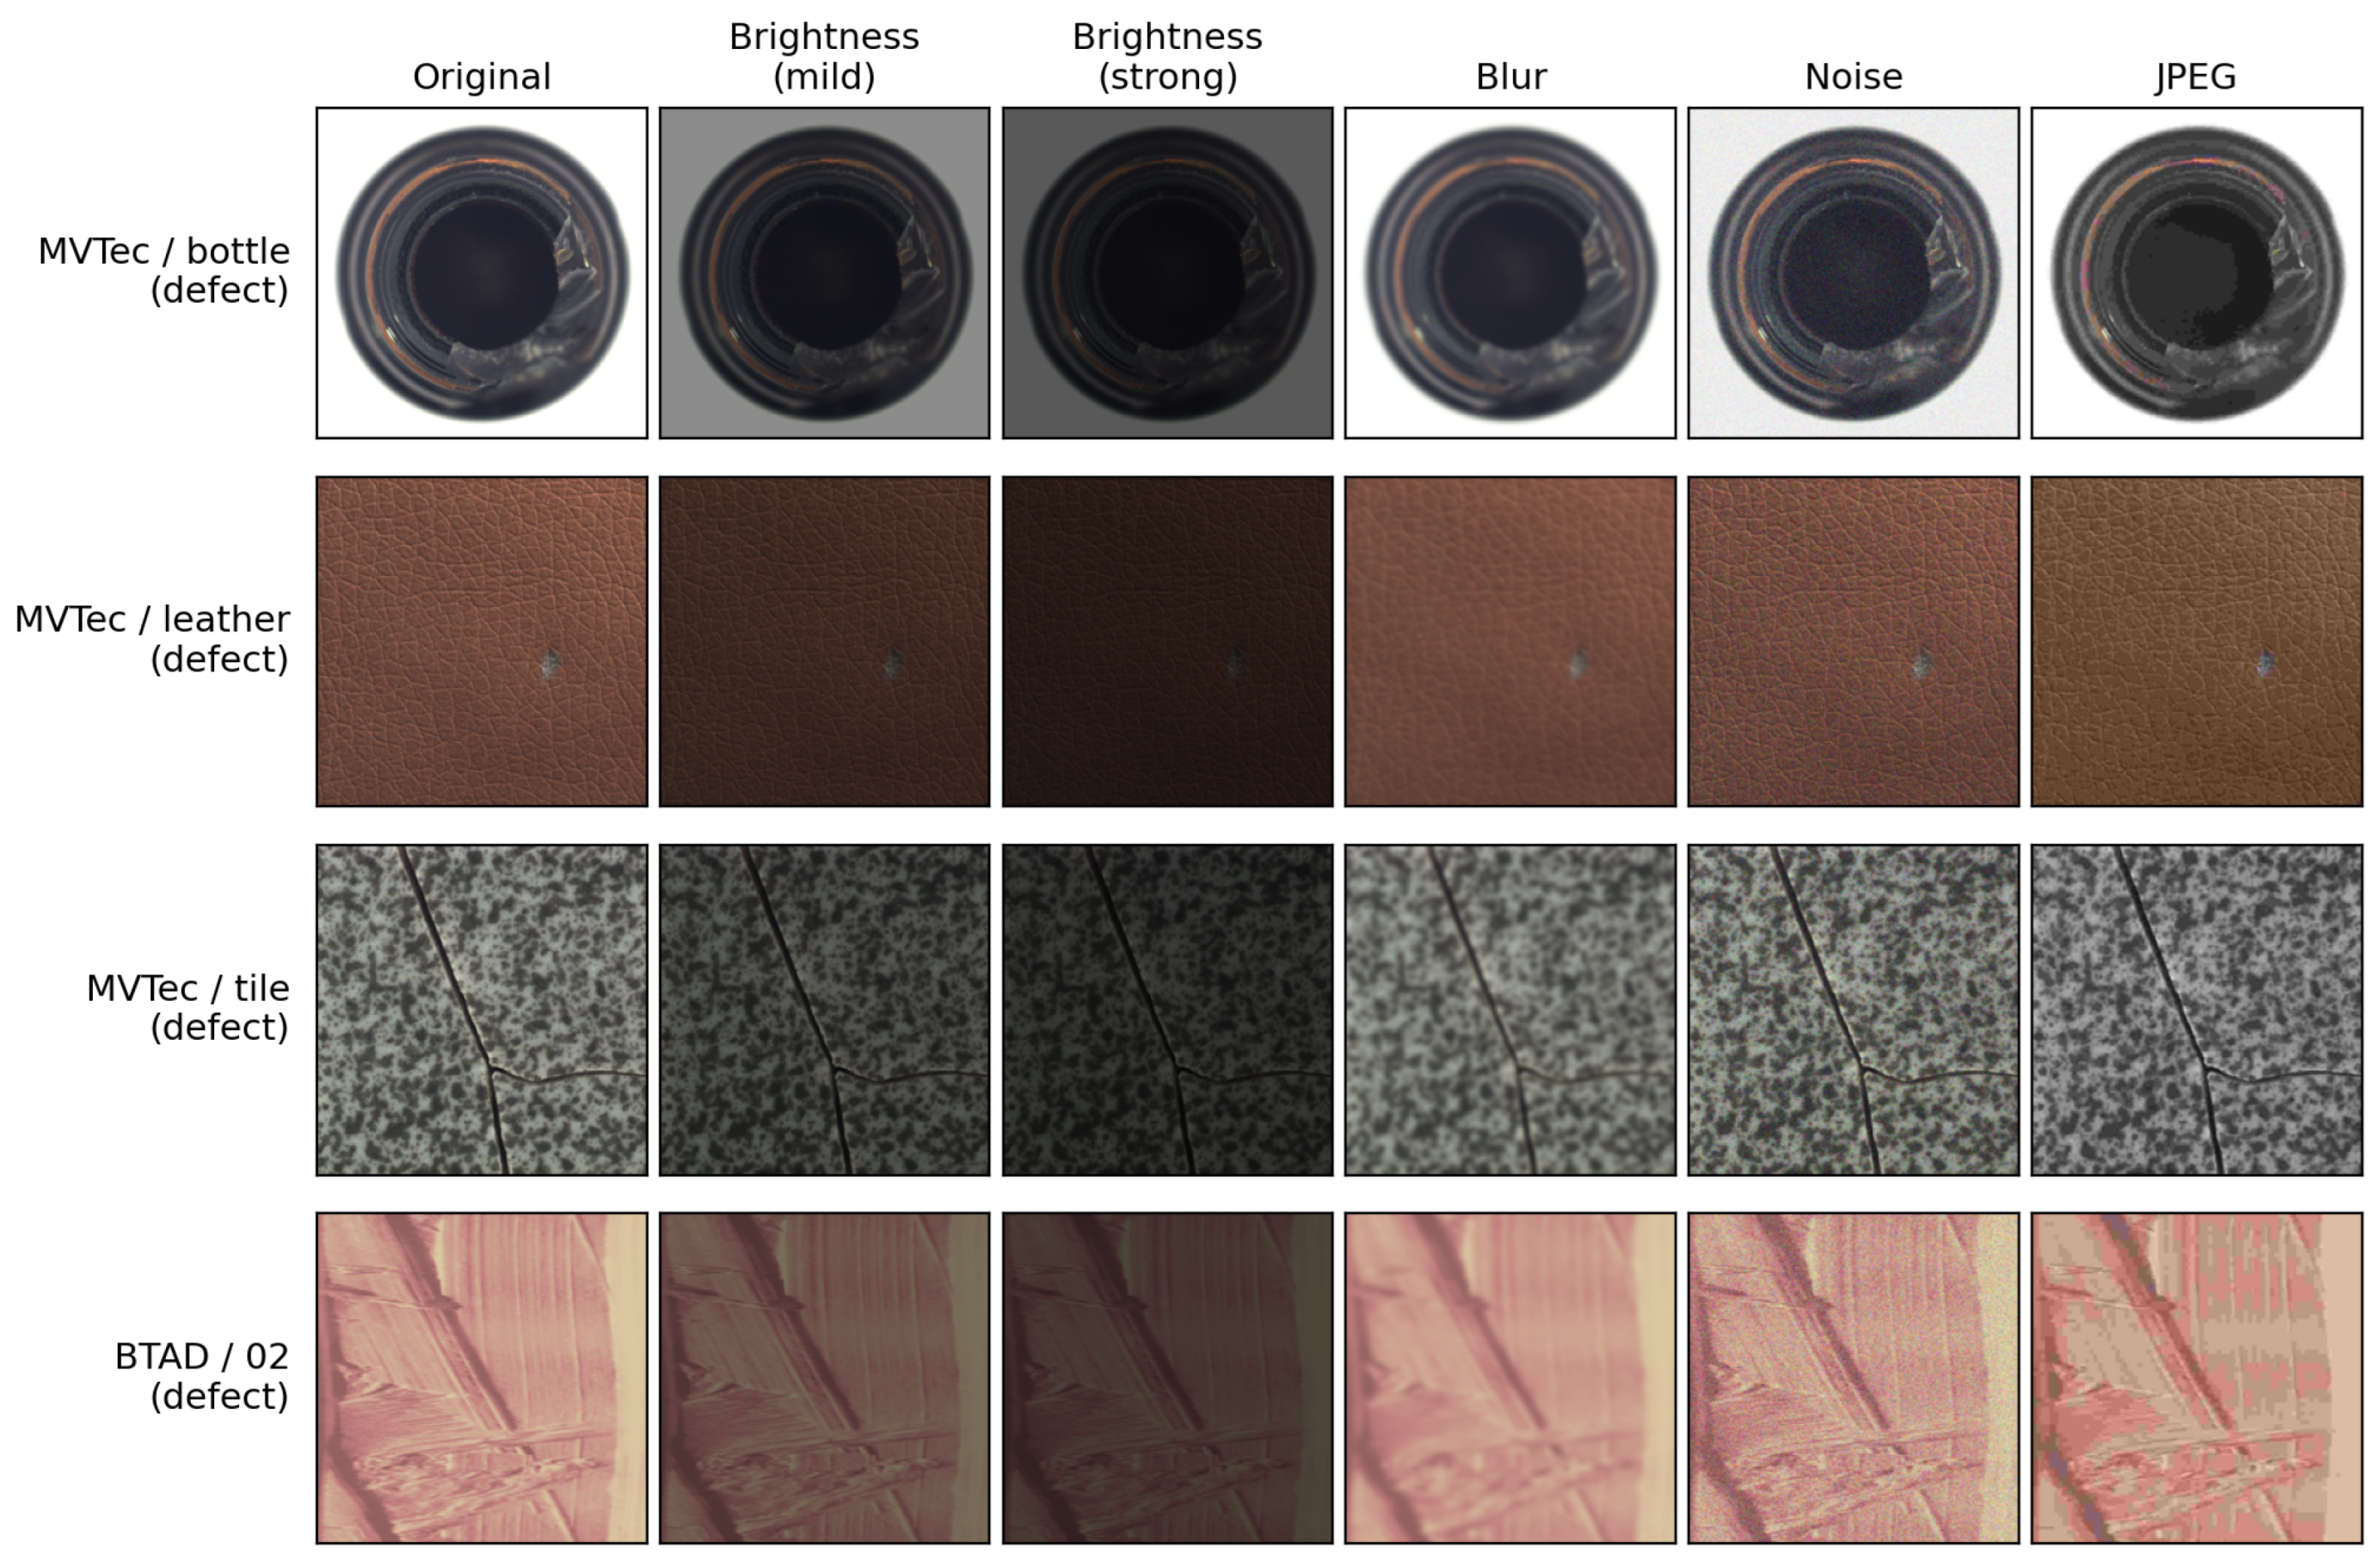

Disclaimer/Publisher’s Note: The statements, opinions and data contained in all publications are solely those of the individual author(s) and contributor(s) and not of MDPI and/or the editor(s). MDPI and/or the editor(s) disclaim responsibility for any injury to people or property resulting from any ideas, methods, instructions or products referred to in the content. |
© 2026 by the authors. Licensee MDPI, Basel, Switzerland. This article is an open access article distributed under the terms and conditions of the Creative Commons Attribution (CC BY) license.