


Abstract
We have developed an optical model of ultraviolet light-emitting diodes with a peak emission wavelength of 392 nm. The similarity between simulated and experimental spectra is verified by the normalized cross-correlation (NCC) algorithms. The emission spectrum is modeled using a combination of Gaussian and Lorentz functions. In detail, the left part before the peak wavelength is modeled with Gaussian functions, while the right part after the peak wavelength is modeled using Lorentz functions. The non-overlapping was significantly improved. Furthermore, the NCC value is 99.75% indicating the high similarity between the modeling and experimental spectrum.
1. Introduction
Ultraviolet light-emitting diodes (UV LEDs), particularly in the UVA range (315–400 nm), have gained increasing attention due to their wide applicability in agricultural lighting, environmental sterilization, biomedical systems, and solar simulation for photovoltaic testing. UVA-LEDs stand out for their stability, long lifespan, mercury-free operation, compact size, and controllable wavelength [1,2,3,4,5]. For a shorter wavelength, both UV-B and UV-C light have been applied extensively in horticulture applications to prevent disease, diminish postharvest decay of plant products, and pre- and postharvest disinfection [6,7,8,9,10]. Accurate spectral modeling of UVA-LED emission is essential for designing efficient and reliable lighting systems, especially in applications that require spectral similarity to solar radiation. In high-precision applications such as solar cell testing or horticultural lighting, developing an accurate emission model for UVA-LEDs is a critical step to ensure reliable optical and biological performance predictions. However, existing modeling approaches typically rely on single-function models such as Gaussian or Lorentzian functions, which often lead to significant deviations between simulated and measured spectra. These inaccuracies can directly impact the technical and biological assessments. Therefore, this study aims to address the problem of constructing a high-accuracy spectral model for UVA-LEDs, with potential applications in solar spectrum simulation and precision agriculture lighting.
Numerous experimental studies worldwide have demonstrated the effectiveness of UVA-LEDs in various applications [11,12,13,14,15,16,17,18,19,20,21,22,23,24,25,26,27,28,29,30,31,32,33,34,35]. Li et al. showed that combining UVA 400 nm with blue light enhanced growth and glucosinolate accumulation in Brassica vegetables [26]. Pacak et al. found that preharvest exposure to UVA 365 nm significantly increased phenolic and flavonoid content in lettuce and basil [27]. Choi et al. reported increased biomass and antioxidant levels in spinach under UVA 385 nm. In plant disease management [28], González-García et al. demonstrated that UVA-LEDs improved tomato resistance to Fusarium oxysporum by reducing oxidative stress [29]. Sonjaroon et al. showed that UVA intensities of 5–10 W/m2 improved growth, photosynthesis, and nutritional content in kale, while reducing undesirable nitrate accumulation [30]. Furthermore, Yan et al. confirmed that combining white, blue, and UVA light enhanced root-shoot development and sugar/starch accumulation in cucumber and lettuce [31,32]. However, these studies primarily focus on empirical biological effects, while little attention has been paid to accurate spectral emission modeling of UVA-LEDs.
On the other hand, spectrum fitting has attracted much attention from researchers. Nguyen has proposed a simple way for emission spectrum modeling of white LED light source using Gaussian function [36]. For evaluating properties of output light from white LEDs, Nguyen et al. have developed a high-accuracy spectral irradiance modeling which is based on the modified Gaussian function [37]. Liu et al. have optimized LED spectrum fitting using double Gaussian functions [38]. Zhuang et al. have reported a blue LED spectral simulation method using modified Gaussian functions with superimposed Pseudo-Voigt corrections [39]. Pain has extracted information from the spectral line shapes through a method to determine the energy at which the Lorentz wings of a Voigt profile intersect with the underlying Gaussian part of the profile. It thus provides us information about the dominant line-broadening process in a given energy range [40]. Hagiwara et al. presented a novel optimization approach for high-precision analysis via mixing parameter control precision which is helpful for peak parameter estimation for the Pseudo-Voigt profile [41]. Schmid et al. have proposed a new asymmetric Pseudo-Voigt function for more efficient fitting of X-ray photoelectron spectroscopy lines [42].
In general, no current models have demonstrated sufficiently high spectral matching for applications requiring high-accuracy light spectra modeling. This research gap forms the basis for the novelty and technical contribution of this paper.
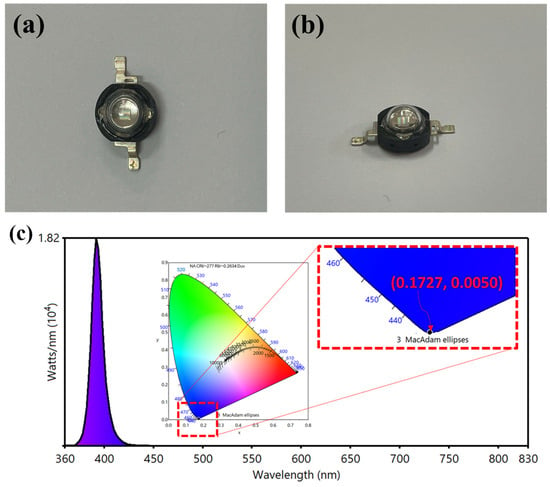
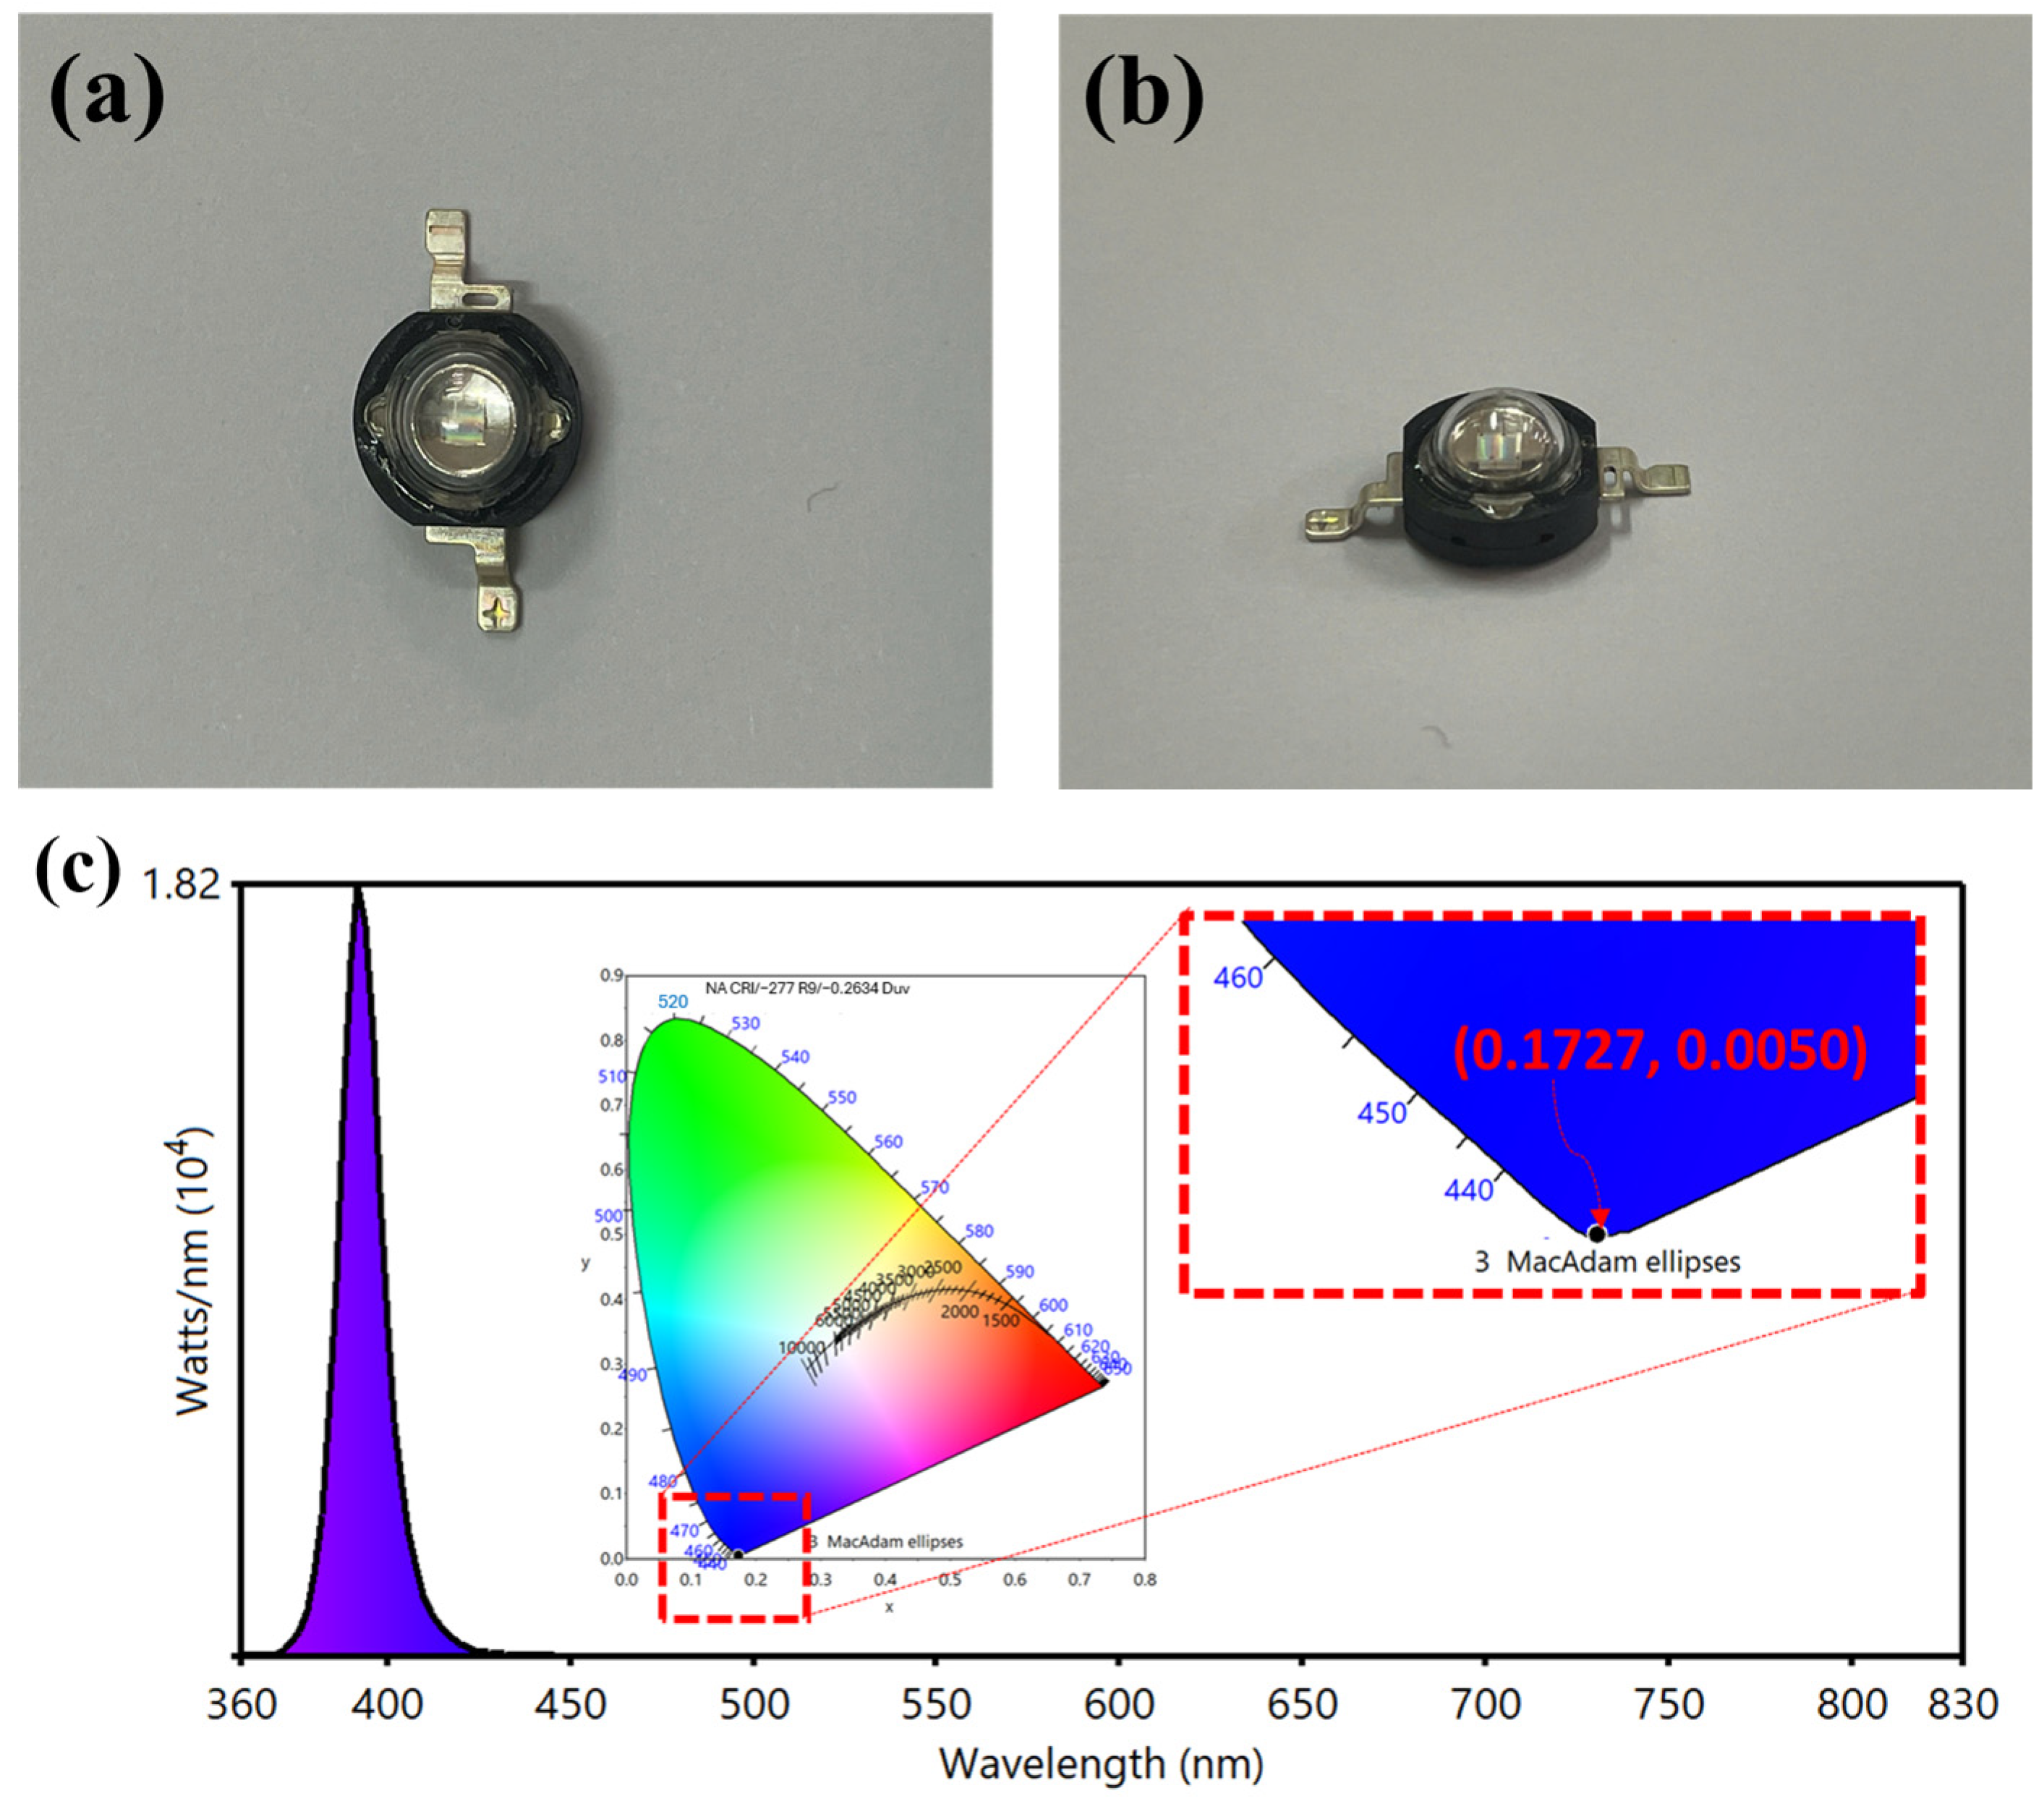
In this work, we propose a hybrid spectral modeling approach for UVA-LEDs by combining Gaussian and Lorentzian functions to improve the accuracy of emission shape fitting. The physical sample of the UVA-LED used in this study is shown in Figure 1a,b. The emission spectrum was experimentally measured and is illustrated in Figure 1c. The collected data were normalized and compared with the simulated model using the normalized cross-correlation (NCC) coefficient. The proposed hybrid model achieved a spectral similarity of 99.75% compared to the experimental spectrum, significantly outperforming traditional single-function models. This result demonstrates the effectiveness of the proposed method in accurately simulating the emission behavior of UVA-LEDs. The model provides a solid foundation for optimizing UVA-LED design and integration into systems for precision agriculture, solar simulation, and biomedical applications, where stable and accurate spectral characteristics are essential.
Figure 1.
Photo of sample of UVA-LED: (a) top view; (b) side view. (c) Emission spectrum of UVA-LED.
2. Light-Emitting Diodes with Emission Spectrum in UVA Region
Light-Emitting Diodes with emission spectrum in UVA region is presented in this section. Figure 1 presents the physical photo and optical characteristics of the UVA-LED sample. Figure 1a,b show the top and side views of the packaged UVA LED, respectively. Figure 1c shows the corresponding UVA emission spectrum, characterized by a narrow and intense emission band with peak wavelength centered near 392 nm. The enlarged view highlights the position of the UVA emission on the CIE chromaticity diagram. The chromaticity coordinates (x, y) are (0.1727, 0.0050), corresponding to the color point in the violet–near-ultraviolet region close to the lower boundary of the visible chromaticity space. This location confirms that the emitted radiation is concentrated mainly in the UVA region of color space.
3. Modeling Using Gaussian Function
3.1. Analysis of the Emission Characteristics of Emission Band of UV LED
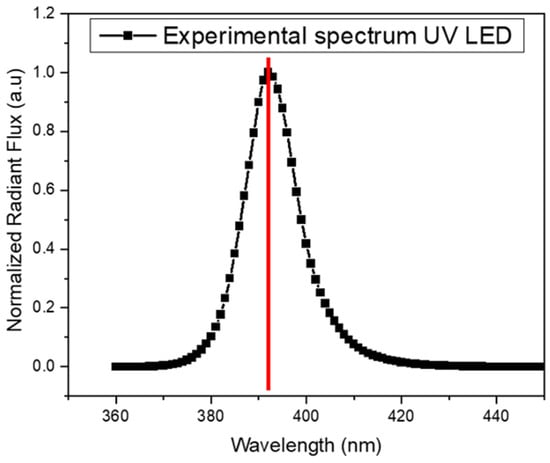
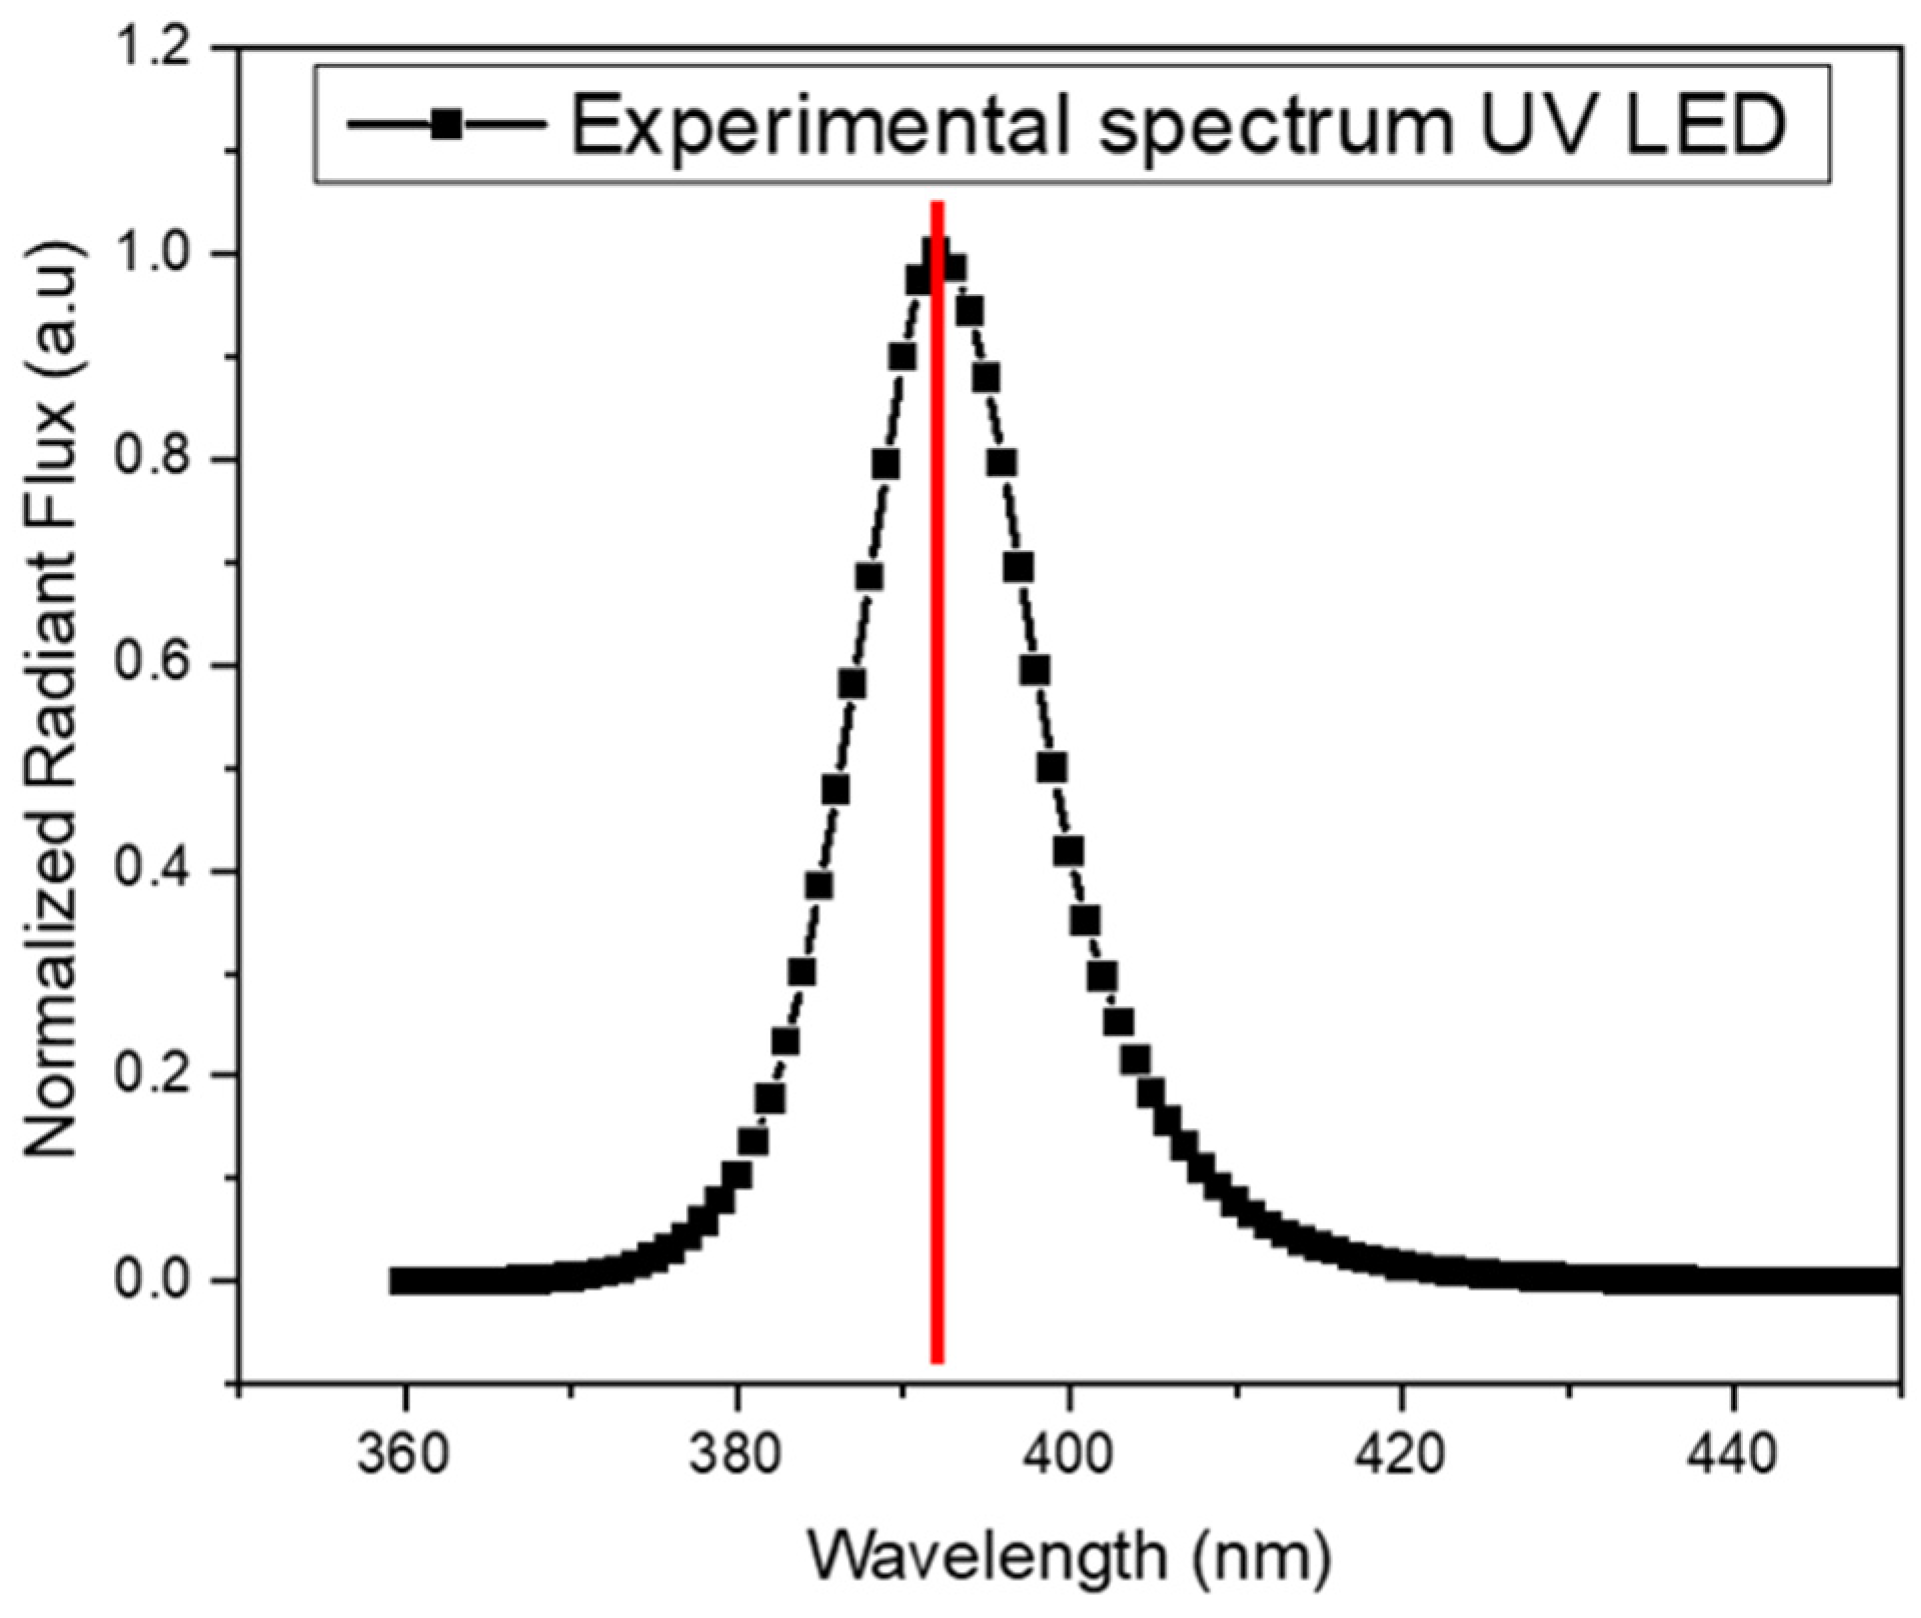
The emission band of UV LEDs has a bell shape. The emitted wavelengths are in the UV region, with a peak wavelength of 392 nm. This narrow emission band has a FWHM value of 12.6 nm from 386 nm to 399 nm. However, it is interesting when exploring that it is not a completely symmetric shape, as shown in Figure 2. To see the asymmetry characteristics of the emission band more easily, the wavelength of the emission band is enlarged in the wavelength range of 360 nm to 440 nm. The emission band is analyzed, as illustrated in Figure 3, to make these characteristics clearer.
Figure 2.
Enlarged emission band in the wavelength range of 360 nm to 440 nm to see the asymmetry characteristics of emission band.
Figure 3.
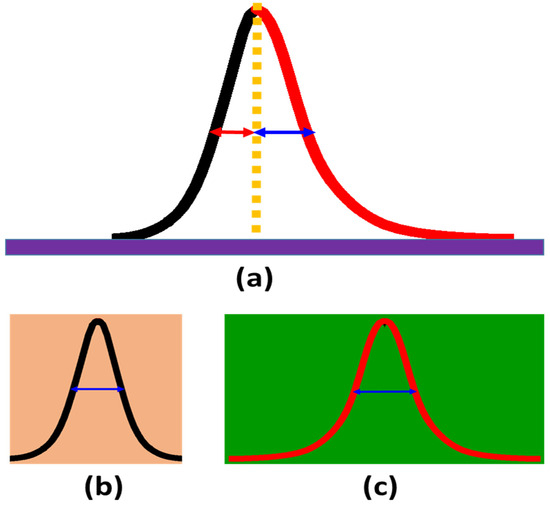
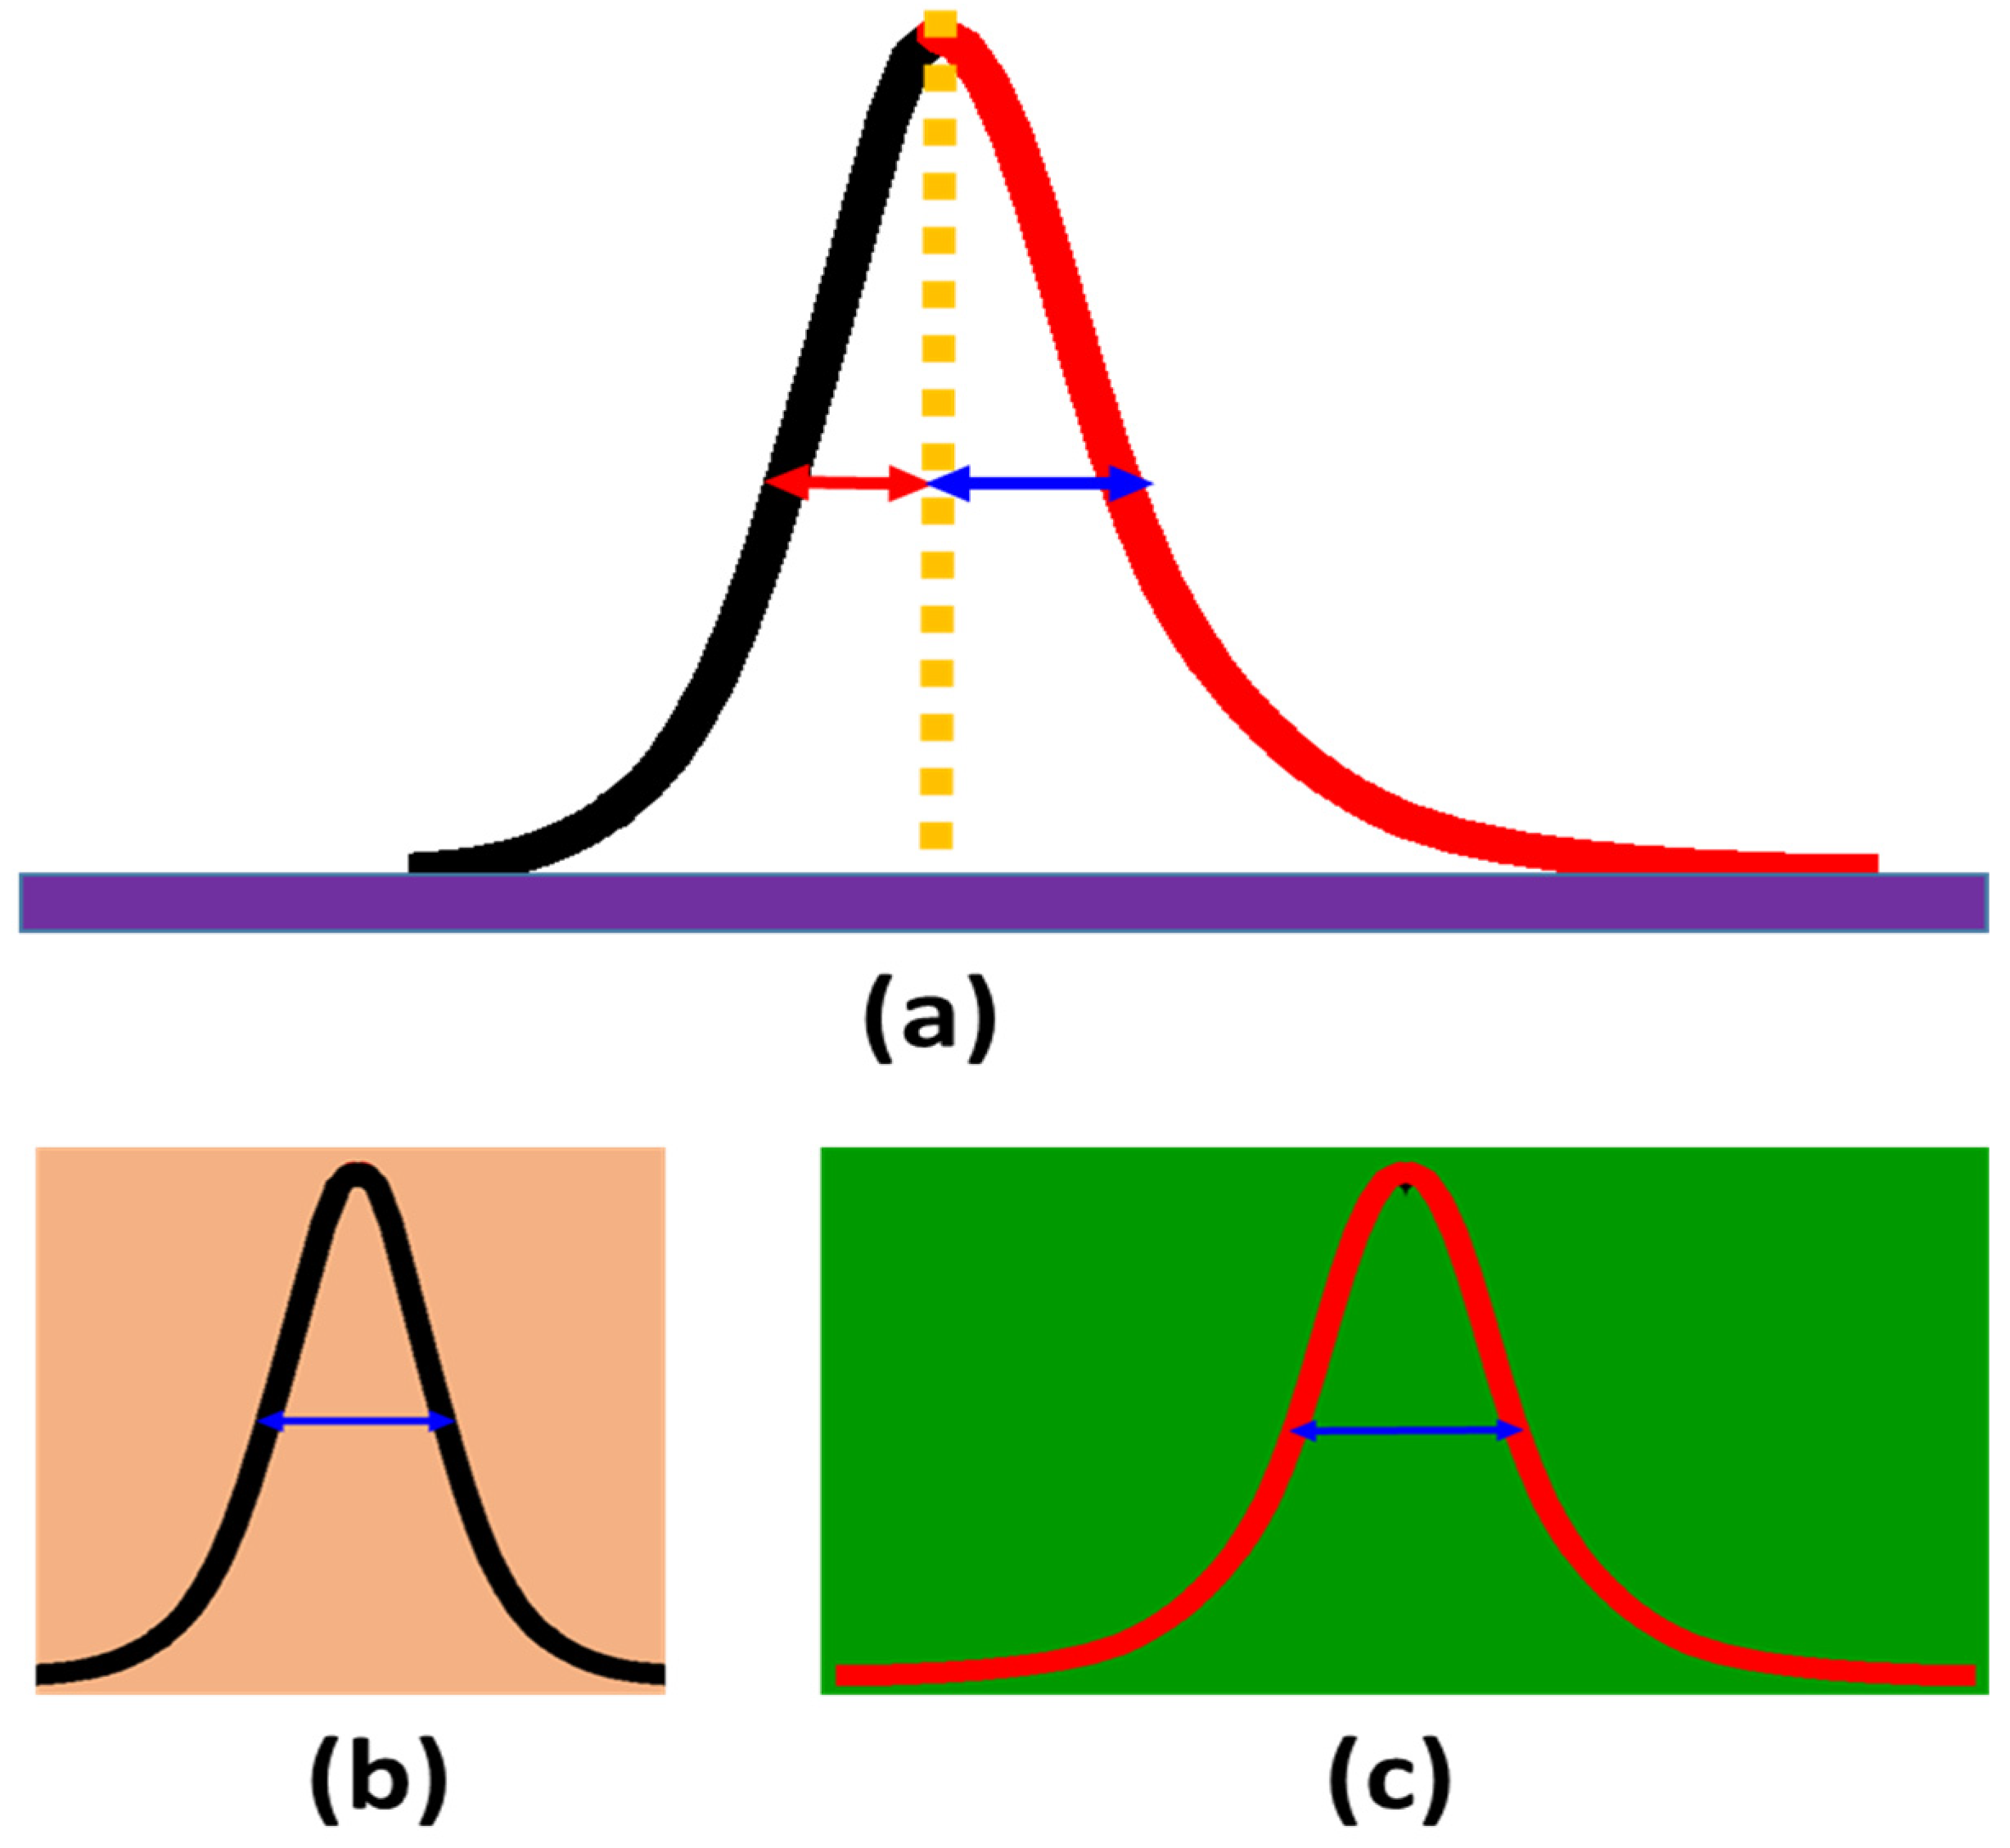
Asymmetric curve of UV LED radiation spectrum. (a) The curve exhibits asymmetry and is divided into two segments. (b) The black line relates to band with small FWHM. (c) The red line relates to the band having larger FWHM.
This step involves processing the experimental data prior to modeling the UV LED emission spectrum. Figure 3a presents the emission curve in a simplified form for clarity. The curve exhibits asymmetry and is divided into two segments for detailed analysis. In the spectrum, the left segment of Figure 3a shows a more rapid decrease in p values compared to the right segment, where the p values decline more gradually and extend further into the tail region. The left and right segments are indicated in black and red, respectively. The left segment corresponds to the left portion of a symmetrical bell-shaped curve depicted in Figure 3b, while the right segment corresponds to the right portion of a symmetrical bell-shaped curve shown in Figure 3c. Both symmetrical bell-shaped curves in Figure 3b,c share the same peak emission wavelength; however, their FWHM values differ. Specifically, the FWHM values for the bell-shaped curves corresponding to Figure 3a,b are denoted as FWHM 1 and FWHM 2, with FWHM 1 being smaller than FWHM 2.
3.2. Mathematical Modeling
Gaussian functions-based modeling has proved quite useful and effective [36,37]. The modeling process is summarized as follows. Based on the optical model using the Gaussian function in the references [37], the mathematical description for the spectral power distribution (SPD) of an emission band is expressed as follows
where is the optical power of the emission band (W); is the corrected coefficient; is the wavelength range of the emission band, is the wavelength value at peak of emission band; and is the FWHM of the emission band (nm). In this model, some parameters are constant (e.g., P, , , and ΔE) which are defined from experimental emission spectrum data. The constant of beta cannot be defined from experimental data. It requires an optimization process to find the value at which the highest matching between the simulated spectrum and the experimental spectrum is obtained. In detail, the different value of beta is investigated to understand the effect of beta value on the shape of the simulation emission band. Then, the comparison of simulation spectrum to experimental spectrum is conducted to define the optimal value of beta.
In a general way, the emission band will have constant value (e.g., P, λ, , and ΔE) and beta value. In these parameters, these constants (e.g., P, λ,, and ΔE) can be extracted from the experimental emission spectrum, while the process to define the beta value is the same as that described above. Based on Equation (1), and incorporating the analysis as described in Figure 4, the mathematical modeling for the UV band can be expressed as
where and are simulated using Equation (1). However, the wavelength range is not the same. For , the wavelength length range is from 360 to 392 nm, and the value is FWHM1. Meanwhile, for the the wavelength range is from 393 nm to 800 nm, and the value is FWHM2. n terms of mathematical expression, Equation (2) can be written as
where , , are FWHM values of each band as illustrated in Figure 3b,c. is the wavelength interval. For convenience, the value of is usually chosen as 1 nm.
Figure 4.
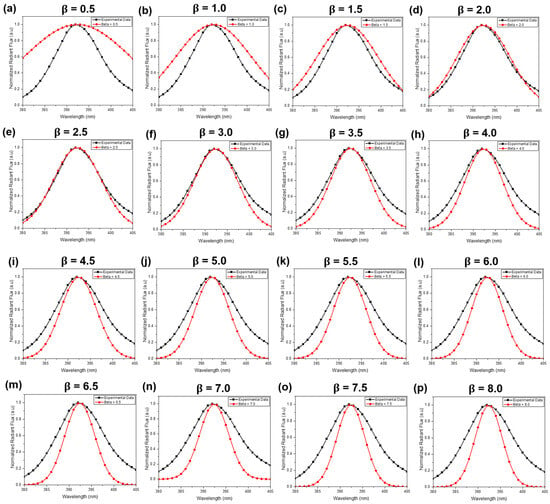
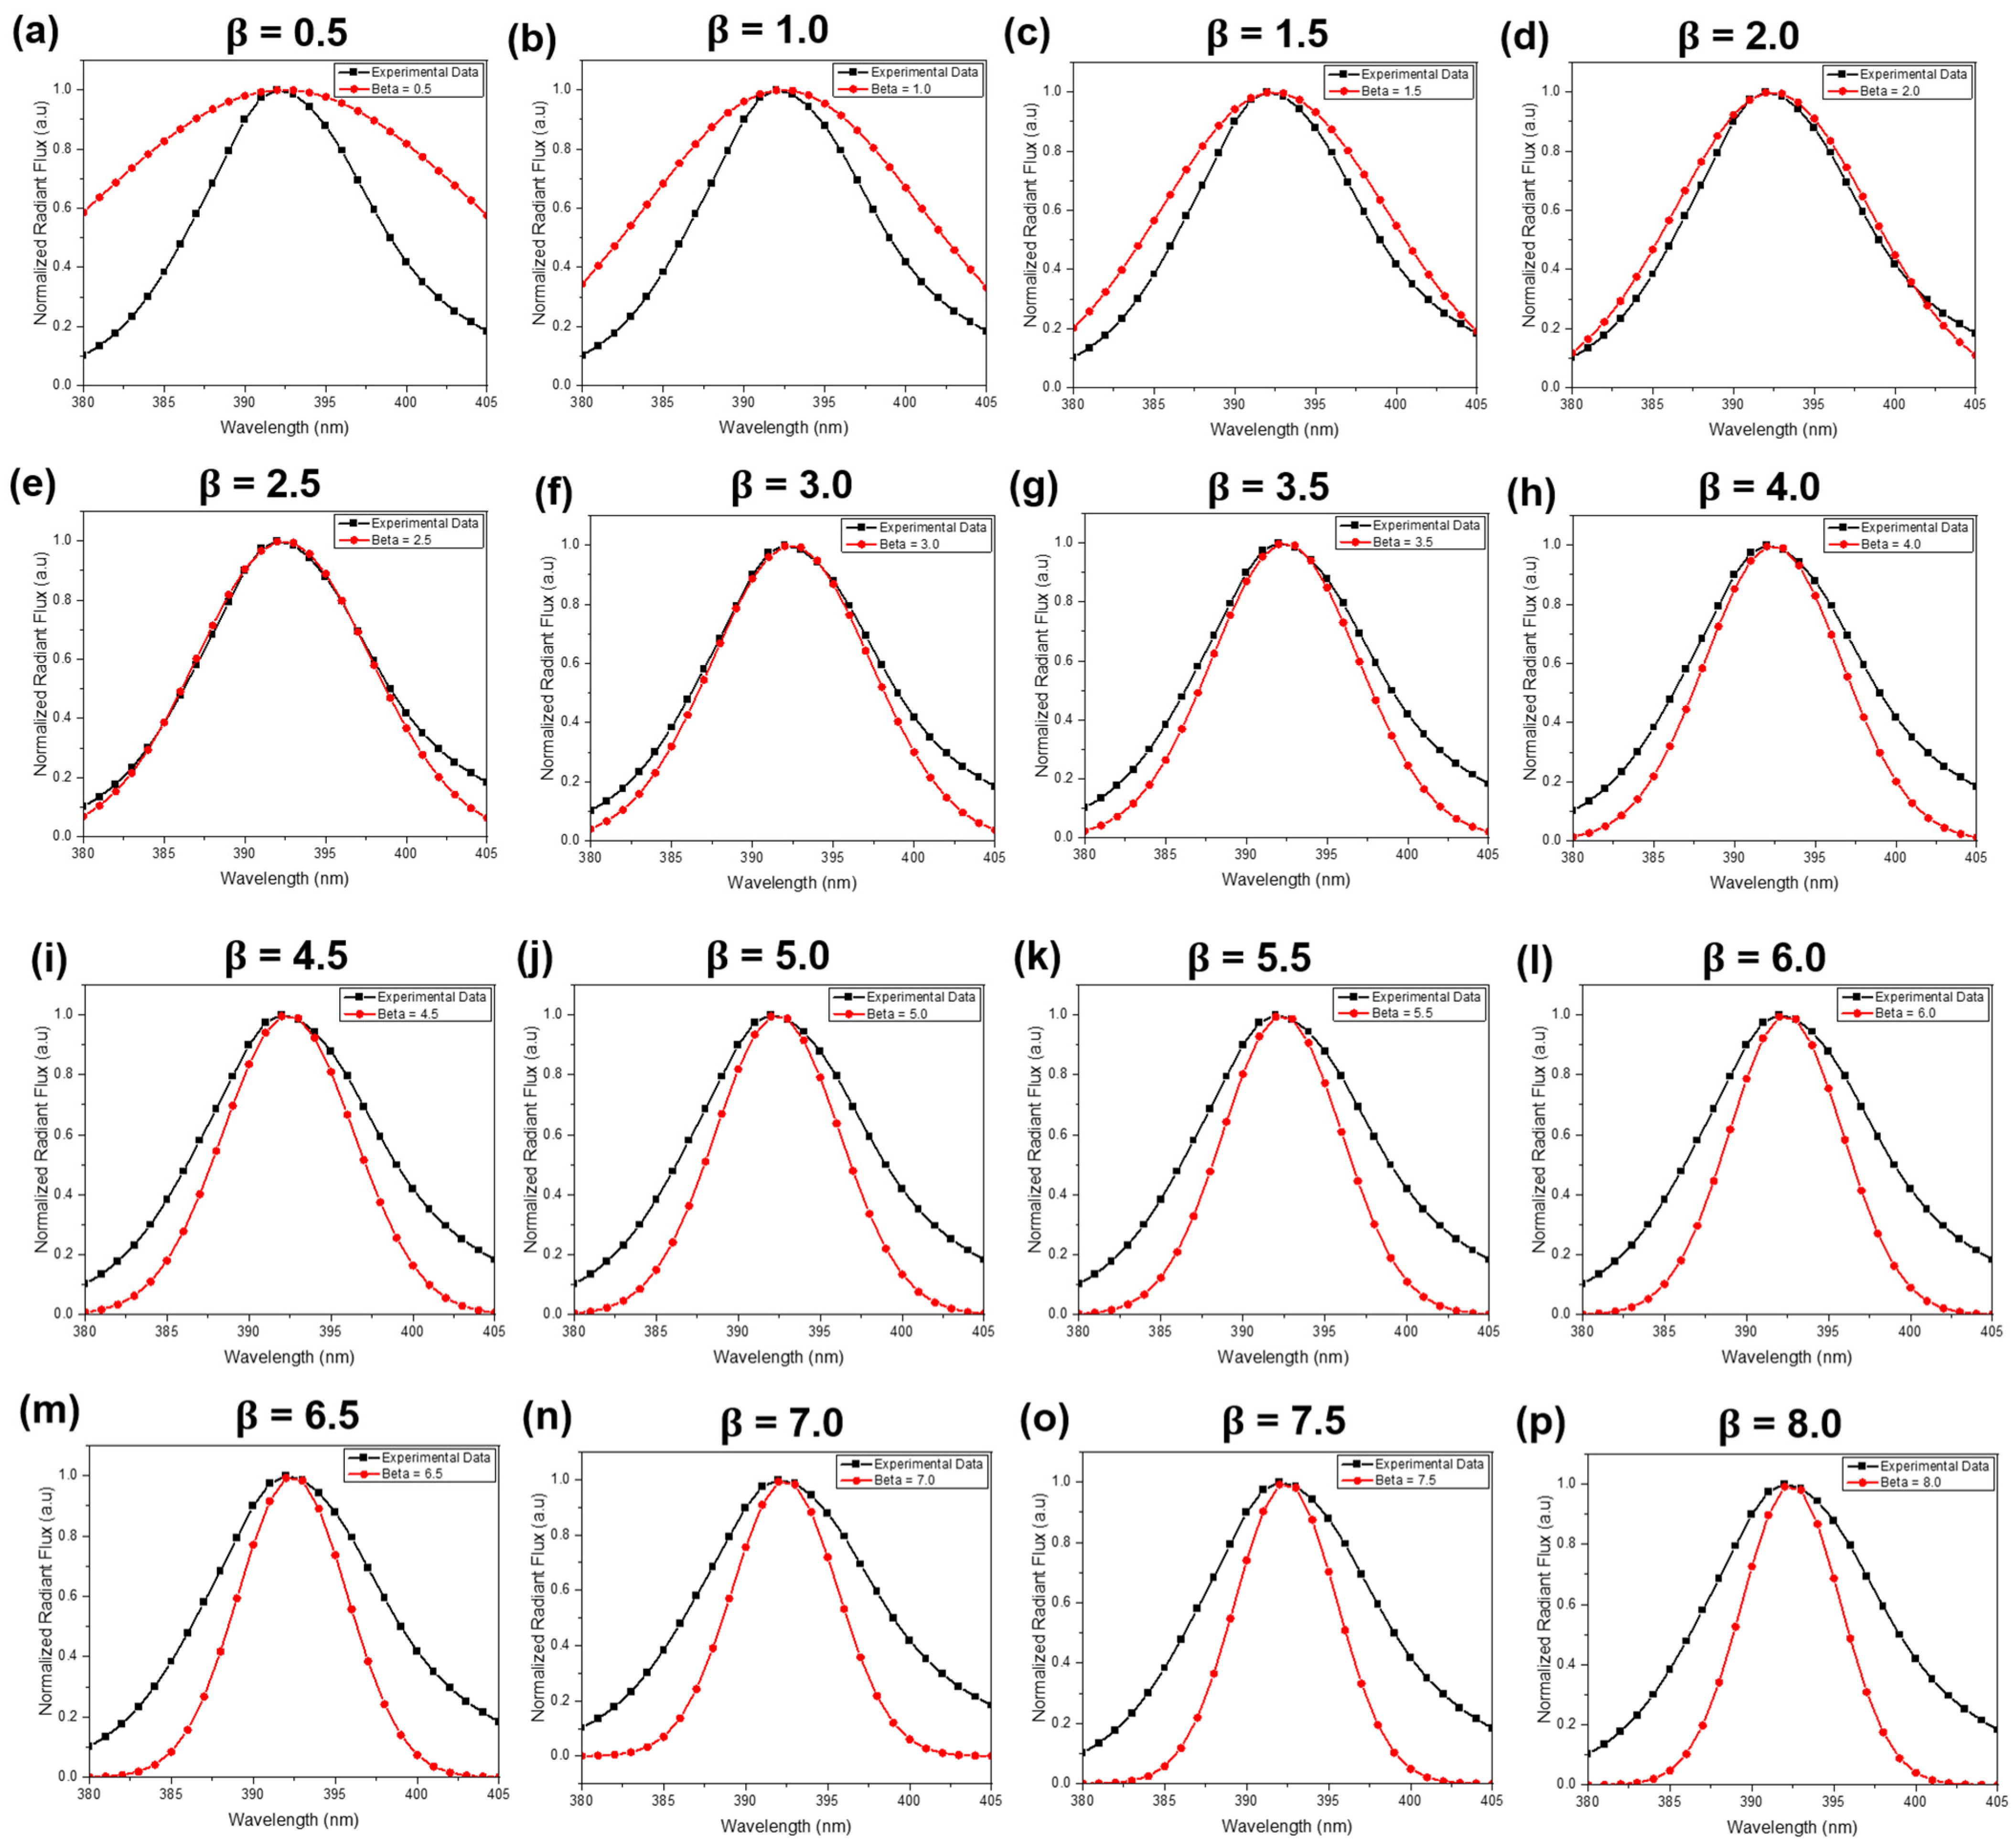
Simulation results of UV radiation at different values of beta and qualitative comparison to experimental data. (a) beta of 0.5. (b) beta of 1.0. (c) beta of 1.5. (d) beta of 2.0. (e) beta of 2.5. (f) beta of 3.0. (g) beta of 3.5. (h) beta of 4.0. (i) beta of 4.5. (j) beta of 5.0. (k) beta of 5.5. (l) beta of 6.0. (m) beta of 6.5. (n) beta of 7.0. (o) beta of 7.5. (p) beta of 8.0.
3.3. Simulation Result and Qualitative Comparison to Experimental Data
Based on the experimental data from the emission spectrum and incorporating Equation (3), the UV radiation spectrum was simulated. The simulation at each β value was qualitatively compared to the experimental data, as shown in Figure 4. In the simulation, the UV emission spectrum depends on the β value: the smaller the β constant, the broader the width of the emission band.
A qualitative evaluation was first conducted. Figure 4 presents the comparison between the simulated UV emission spectra at different β values (e.g., 0.5, 1.0, 1.5, 2.0, 2.5, 3.0, 3.5, 4.0, 4.5, 5.5, 6.0, 6.5, 7.0, 7.5, and 8.0) and the experimental emission spectrum. From this evaluation, it can be seen that the simulation at a β value of 2.5 exhibits the highest degree of overlap between the simulated and experimental emission curves, as illustrated by the red curve closely matching the experimental spectrum shown in black.
3.4. Verification Result with Experiment Data Using Normalized Cross-Correlation Algorithms
In principle, trusted modeling must have a good matching level between the simulation and the experiment spectra. The matching level can be evaluated based on the qualitative or quantitative methods. Quantitatively, the matching level is possibly determined using the normalized cross-correlation (NCC). In the qualitative method, the matching level is easily evaluated through the overlap level of two curves. After qualitative evaluation, the beta value which has the highest level of overlapping of the simulated and experimental spectrum has been roughly defined. The precise comparison is conducted through quantitative evaluation using the NCC algorithm. The similarity between simulation and experiment spectrum curves is quantitatively evaluated based on the value of NCC (e.g., the value of 100 for NCC means the complete similarity between the simulated and experimental spectrum). The mathematical expression of the NCC algorithm is described as follows
where , are the mean values of the radiant power per unit of wavelength for simulation and experiment spectra, respectively. , are the values of the light power per units of wavelength having a wavelength at the wavelength of the ordering of n for simulation and experimental spectra that are under comparison, respectively.
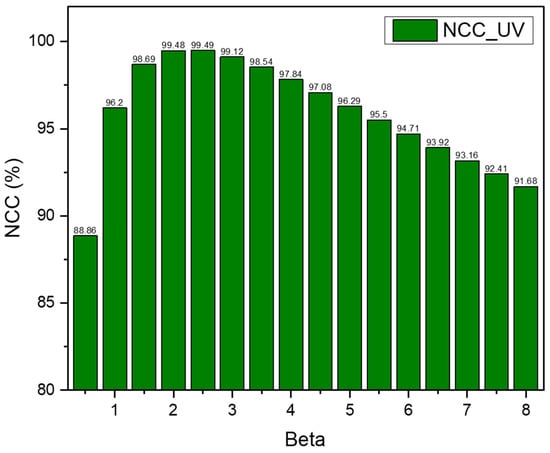
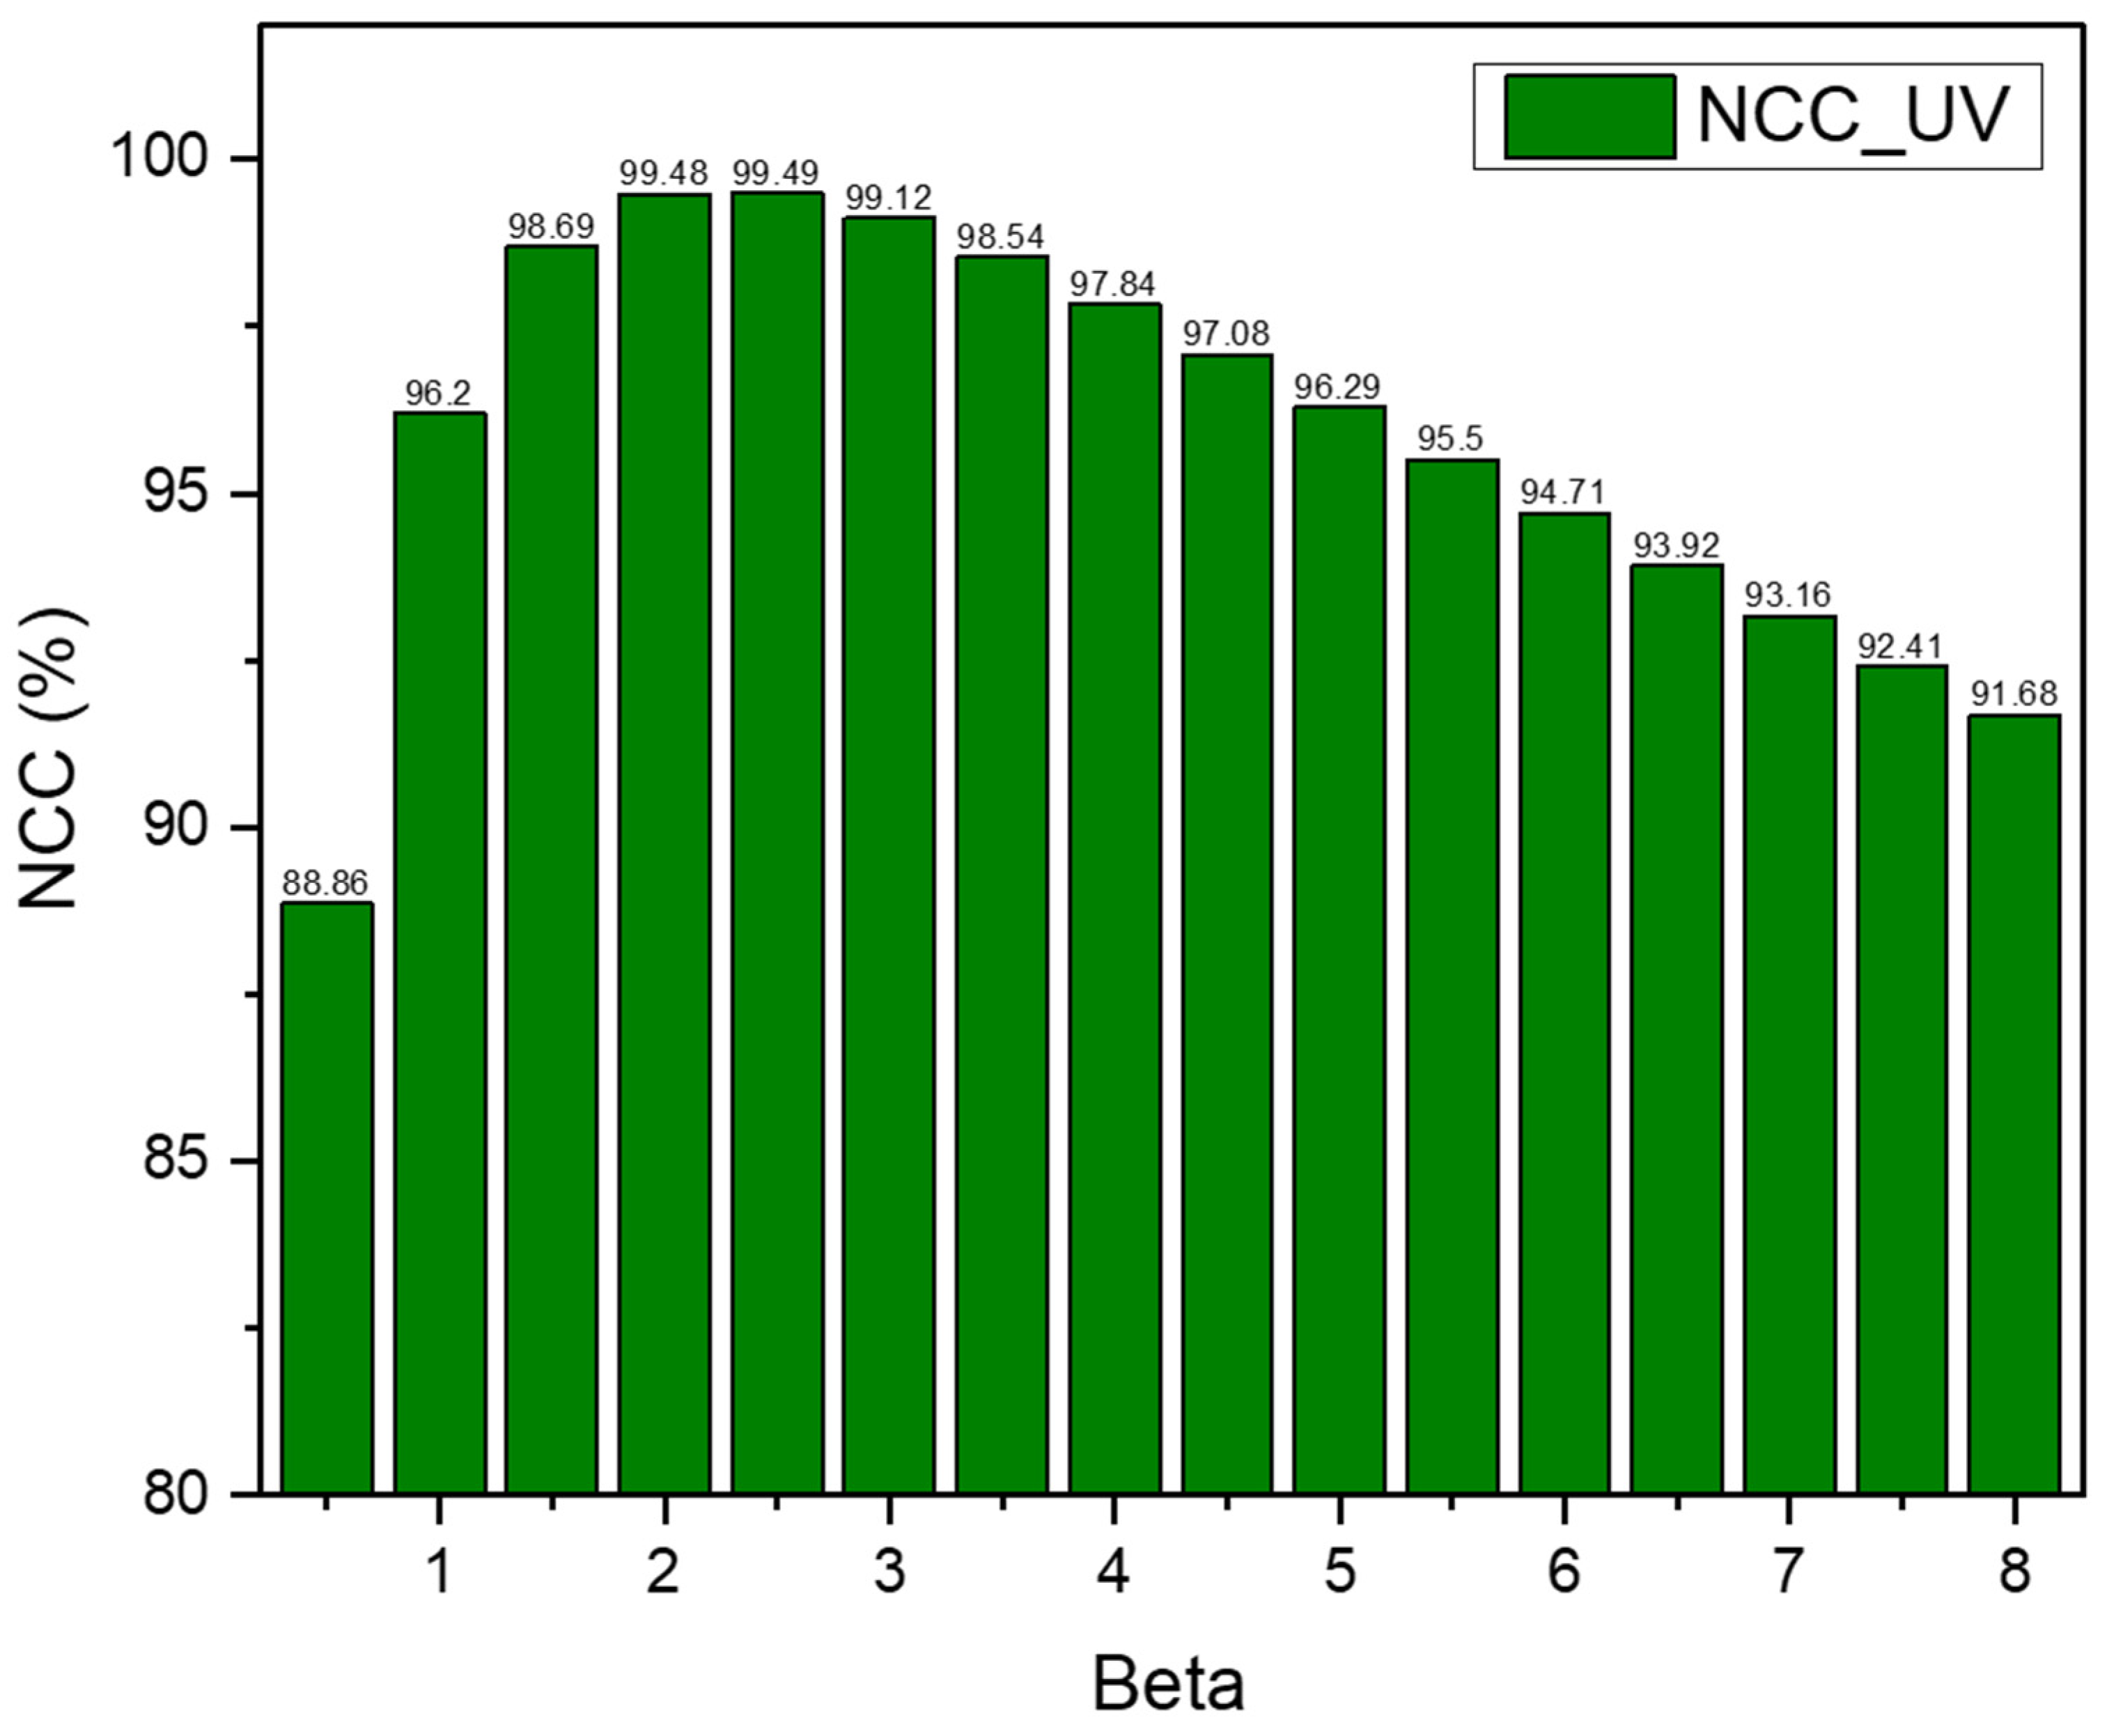
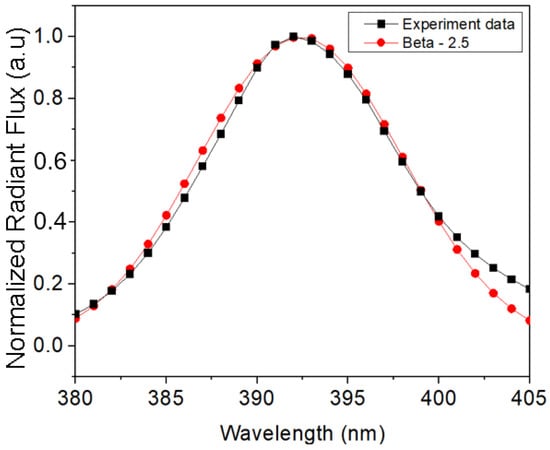
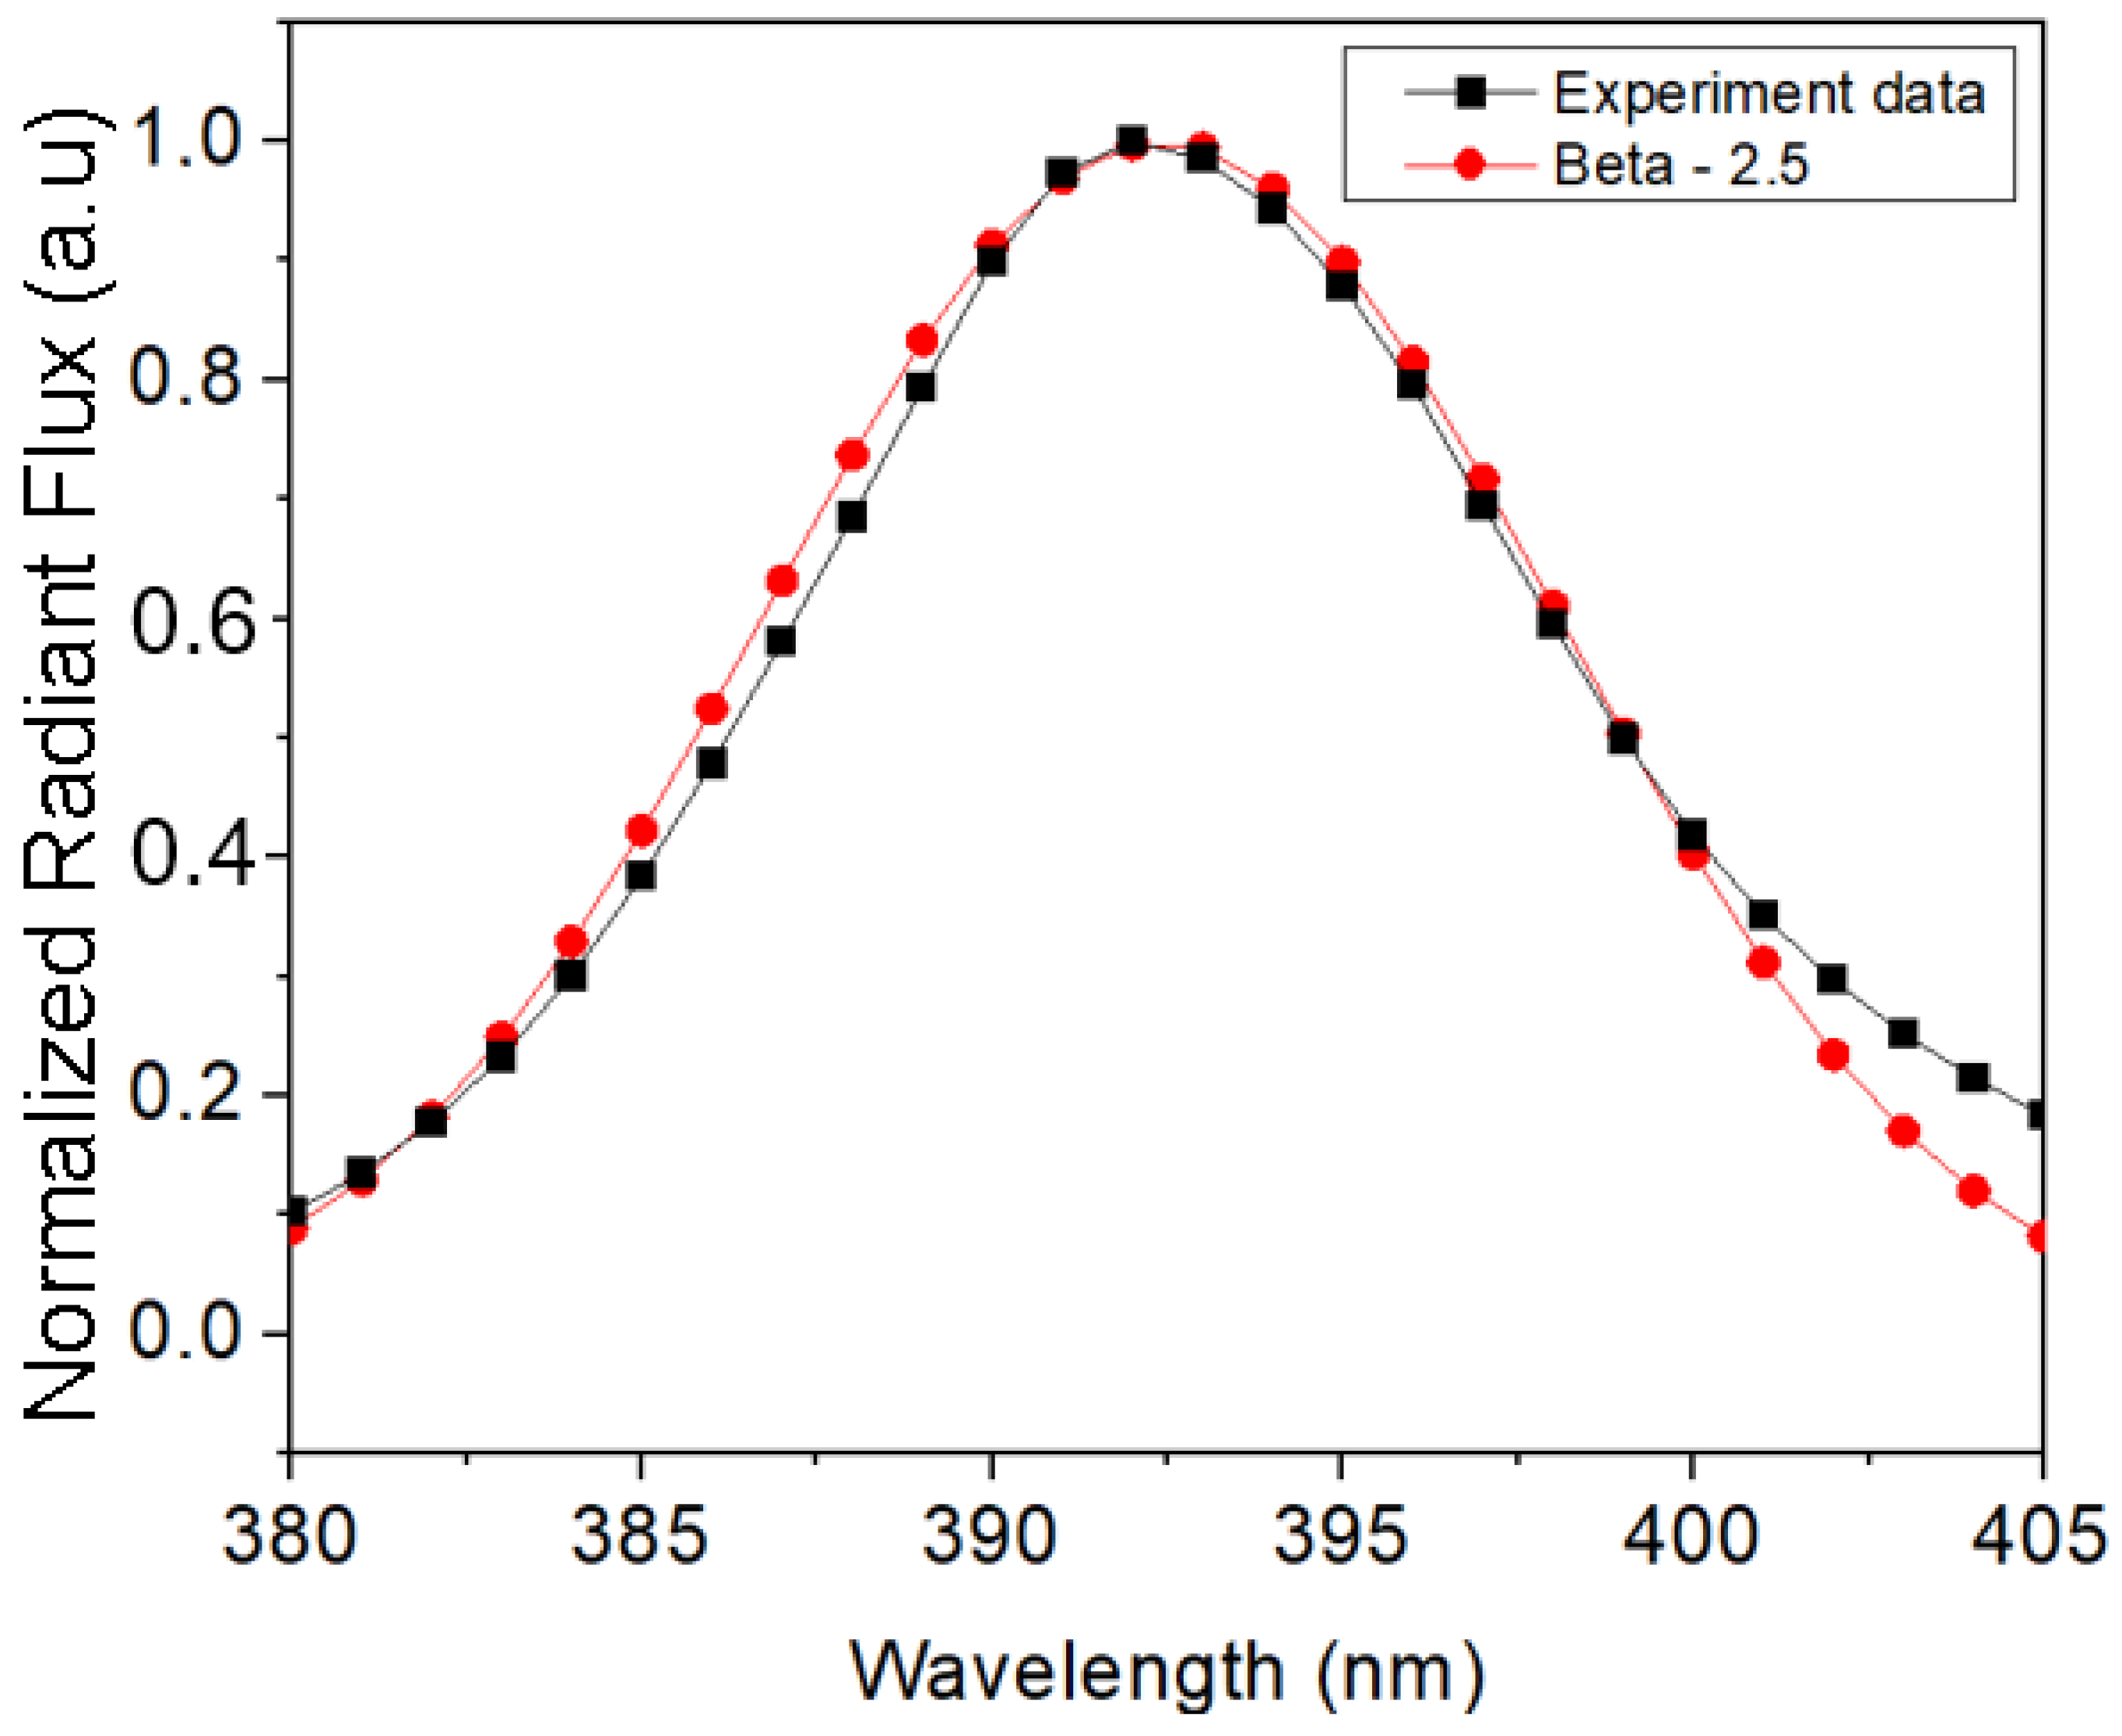
Applying NCC algorithms, the simulated spectrum at different beta values is compared to the experimental spectrum, respectively. The corresponding NCC value will be determined, and the behavior of NCC is shown in Figure 5. The highest NCC value is achieved at the beta of 2.5. The NCC value corresponding to this obtained beta value is 99.49. The comparison between the simulated spectrums at the beta of 2.5 and the experimental spectrum is shown in Figure 6.
Figure 5.
The behavior of NCC versus beta value.
Figure 6.
The comparison between the simulated spectra at the beta of 2.5 and the experimental spectrum.
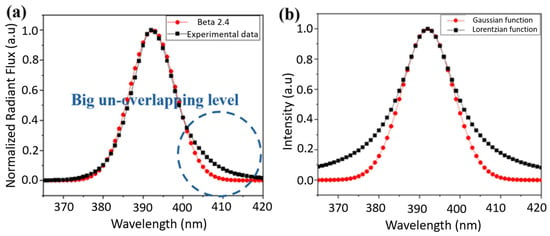
In summary, this investigation shows that at a β value of 2.5, the normalized cross-correlation (NCC) reaches 99.49%, which is high but not perfect. Furthermore, at the lower right tail of the emission spectrum, the simulated and experimental curves diverge noticeably. This indicates that the agreement between the simulation and experiment decreases beyond a wavelength of 400 nm, suggesting that the overlap in this region is limited and may require further improvement. This is clearly illustrated in Figure 7a. The shift shown in Figure 7a is related to the alloy fluctuations in modern LED fabrication, and thermal effect. Alloy fluctuations in complex semiconductor alloys such as Indium Gallium Nitride (InGaN). Because the Indium is not distributed perfectly uniformly throughout the crystal, microscopic variations in the band gap occur. This means slightly different photon energies are emitted from different regions of the chip, broadening the overall emission bandwidth and making it non-Gaussian [43]. In addition, an LED generates localized heat during operation, which raises the junction temperature well above ambient levels. This thermal energy changes the density of states and causes the band gap to shrink slightly, shifting and stretching the emission spectrum towards longer wavelengths [44].
Figure 7.
(a) Issues observed in the simulated emission spectrum. (b) The differences between the two profiles of the Gaussian and Lorentzian curves.
Relying solely on the Gaussian function does not yield an optimal simulation of the UV emission spectrum. To improve the accuracy, the Lorentz function is introduced alongside the Gaussian function. Figure 7b illustrates the differences between the two profiles: the Gaussian curve, shown in red, exhibits a standard bell shape, while the Lorentz curve, shown in black, is narrower at the peak and decays more slowly at the wings. This extended tail of the Lorentz profile results in higher intensity at the spectrum’s lower sides compared to the Gaussian. Such a feature makes the Lorentz function particularly suitable for modeling the portion of the emission spectrum beyond the peak wavelength, where the Gaussian-based simulation shows significant deviation from experimental data. Consequently, in this approach, the Lorentz function is applied to the longer-wavelength region, while the Gaussian function is retained for the remainder of the spectrum, forming a hybrid model that better represents the overall emission profile.
4. Enhancement of the Overlapping Level Between Simulation and Experimental Spectra by Using the Mixed Mathematical Model of Gaussians and Lorentz Functions
4.1. Modeling Using Lorentzian Function
The Lorentzian function has a sharp central peak and heavy tails, causing values to decrease more slowly than in a Gaussian. This results in a distinctive shape with broader wings and more pronounced long-range influence. Lorentzian function-based mathematical modeling is expressed as follows:
where gamma-γ is the corrected coefficient, ΔE is the FWHM of emission band in nm units, and P is the optical power of the emission band in watts.
4.2. Gaussian–Lorentzian Hybrid Mathematical Model
After performing the spectral analysis, the right portion of the emission spectrum is modeled using the Lorentz function in a manner similar to the Gaussian function. This allows the determination of the γ value that yields the highest normalized cross-correlation (NCC) and the best overlap with the experimental data. The β value is obtained from the analysis of the left portion using the Gaussian function. By combining these two portions, a Gaussian–Lorentzian hybrid spectrum is obtained, which represents a composite profile of both functions. The hybrid function is mathematically expressed in Equation (5).
Here, β and γ are the fitted coefficients for modifying the width of emission band. Constant β and γ still need to be determined; its optimized process is presented in the next section. The values of ΔE1 = 12 nm and ΔE2 = 14 nm correspond to the FWHM values (FWHM1 and FWHM2) determined in the previous analysis. P denotes the optical power of the emission band in watts.
5. Separate Analysis of the Left and Right Portions of the Spectrum
5.1. Qualitative and Quantitative Comparison with the Experimental Spectrum Using the Gaussian Function for the Left Portion (NCC Analysis)
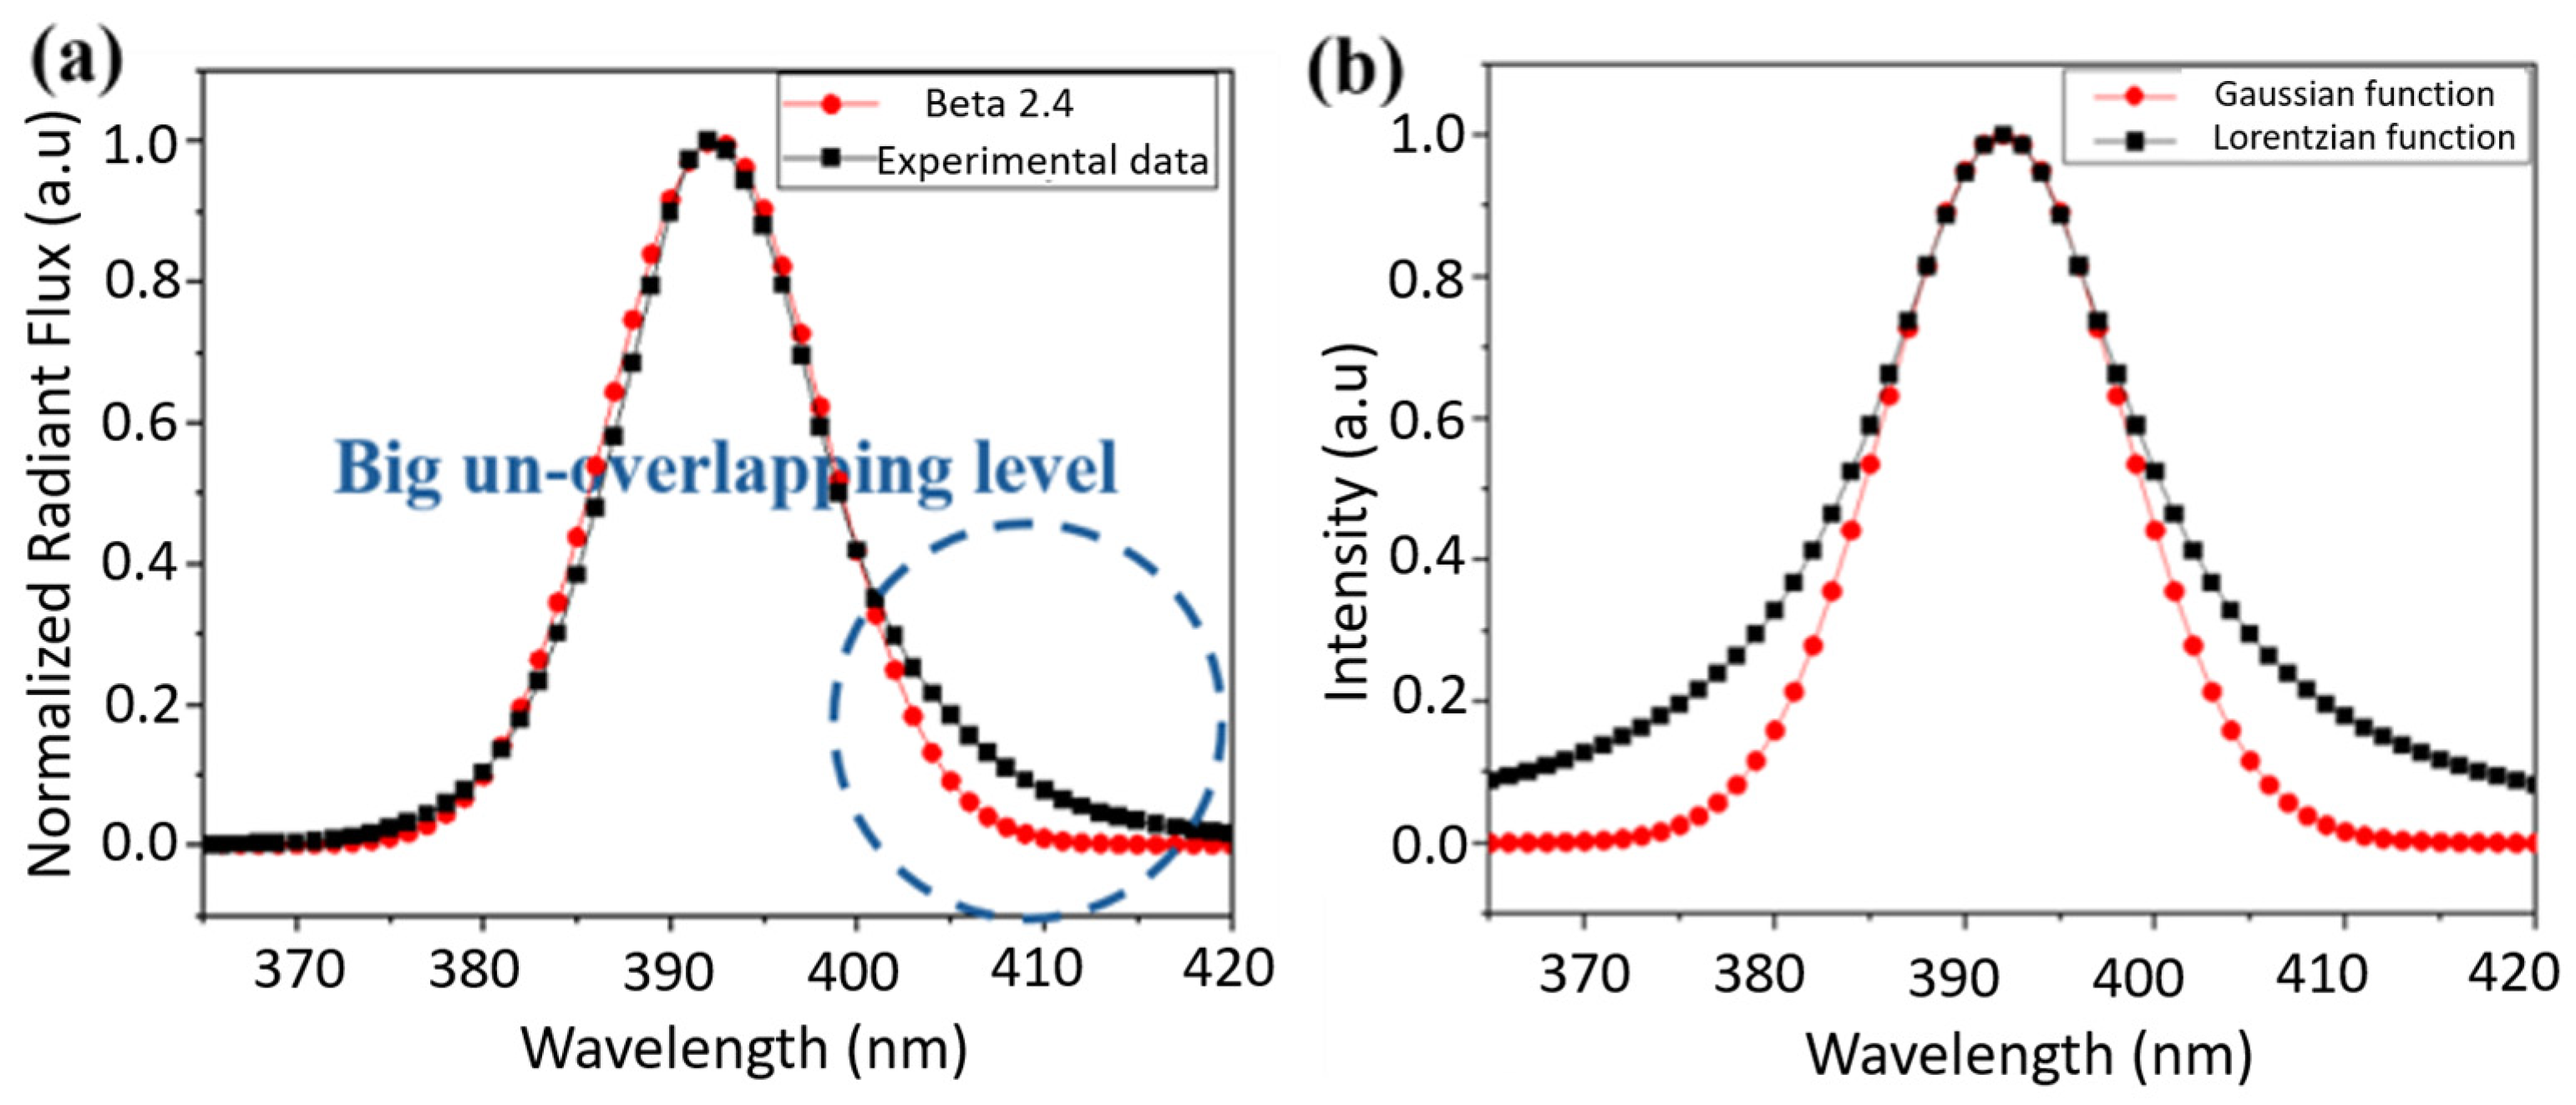
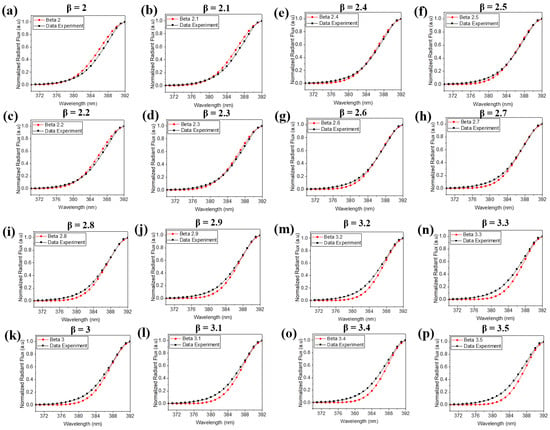
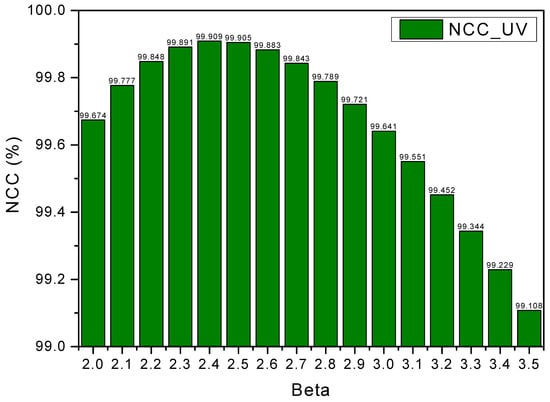
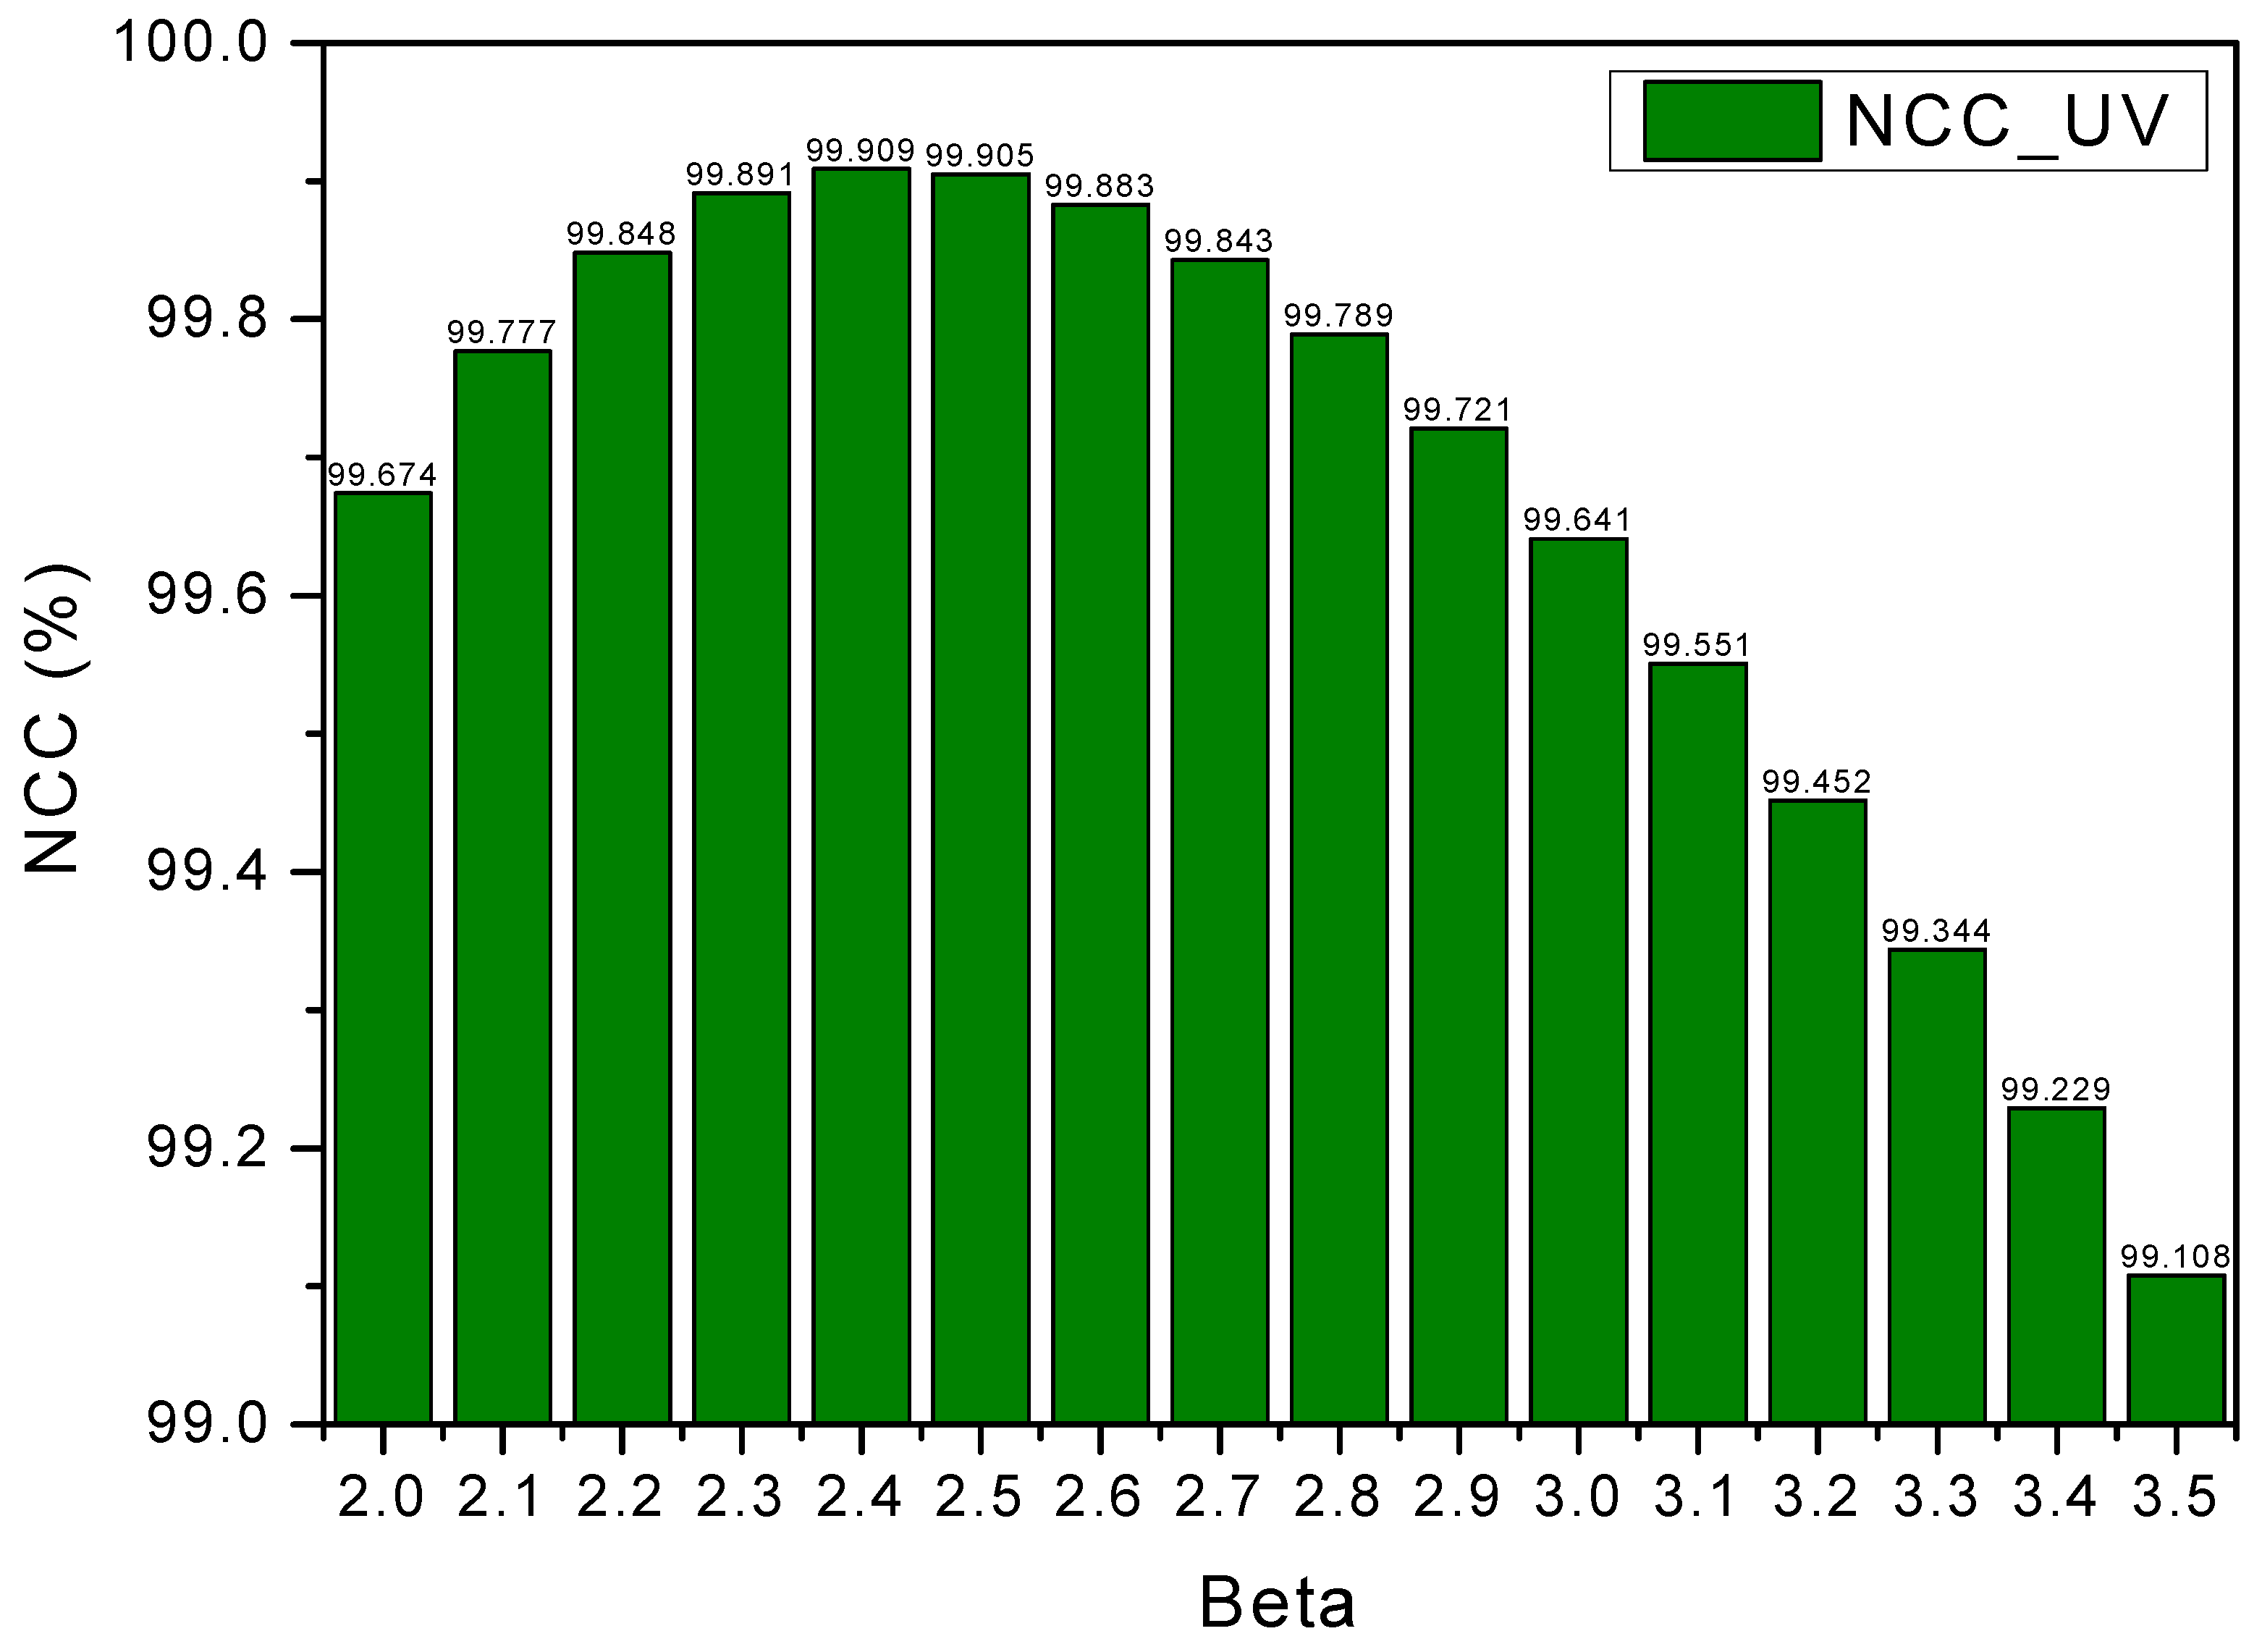
Based on the results shown in Figure 5, β values in the range of 2 to 3.5 for the left portion showed good agreement with the experimental spectrum. Therefore, the normalized cross-correlation (NCC) was calculated for the left portion over the wavelength range of 350–392 nm using Equation (4). In this calculation different values of beta are used (i.e., β = 2.0, 2.1, 2.2, 2.3, 2.4, 2.5, 2.6, 2.7, 2.8, 2.9, 3.0, 3.1, 3.2, 3.3, 3.4, 3.5); the interval value of beta is as small as 0.1 for a better evaluation of the overlap between compared curves. Figure 8 presents a qualitative assessment of the overlap between the simulated and experimental spectra for the left portion, while Figure 9 shows the corresponding NCC values obtained from this analysis. The results indicate that at β = 2.4, the NCC reaches 99.909%, which is nearly 100%.
Figure 8.
Comparison of simulated UV radiation on the left half at different beta values to the experimental spectrum in the same wavelength ranges of the emission band. (a) beta of 2.0. (b) beta of 2.1. (c) beta of 2.2. (d) beta of 2.3. (e) beta of 2.4. (f) beta of 2.5. (g) beta of 2.6. (h) beta of 2.7. (i) beta of 2.8. (j) beta of 2.9. (k) beta of 3.0. (l) beta of 3.1. (m) beta of 3.2. (n) beta of 3.3. (o) beta of 3.4. (p) beta of 3.5.
Figure 9.
Dependence of NCC on beta values on the left half of the spectrum.
5.2. Qualitative and Quantitative Comparison with the Experimental Spectrum Using the Lorentzian Function for the Right Portion (NCC Analysis)
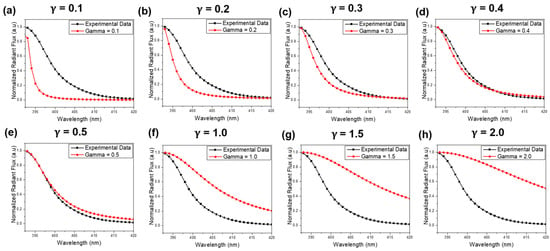
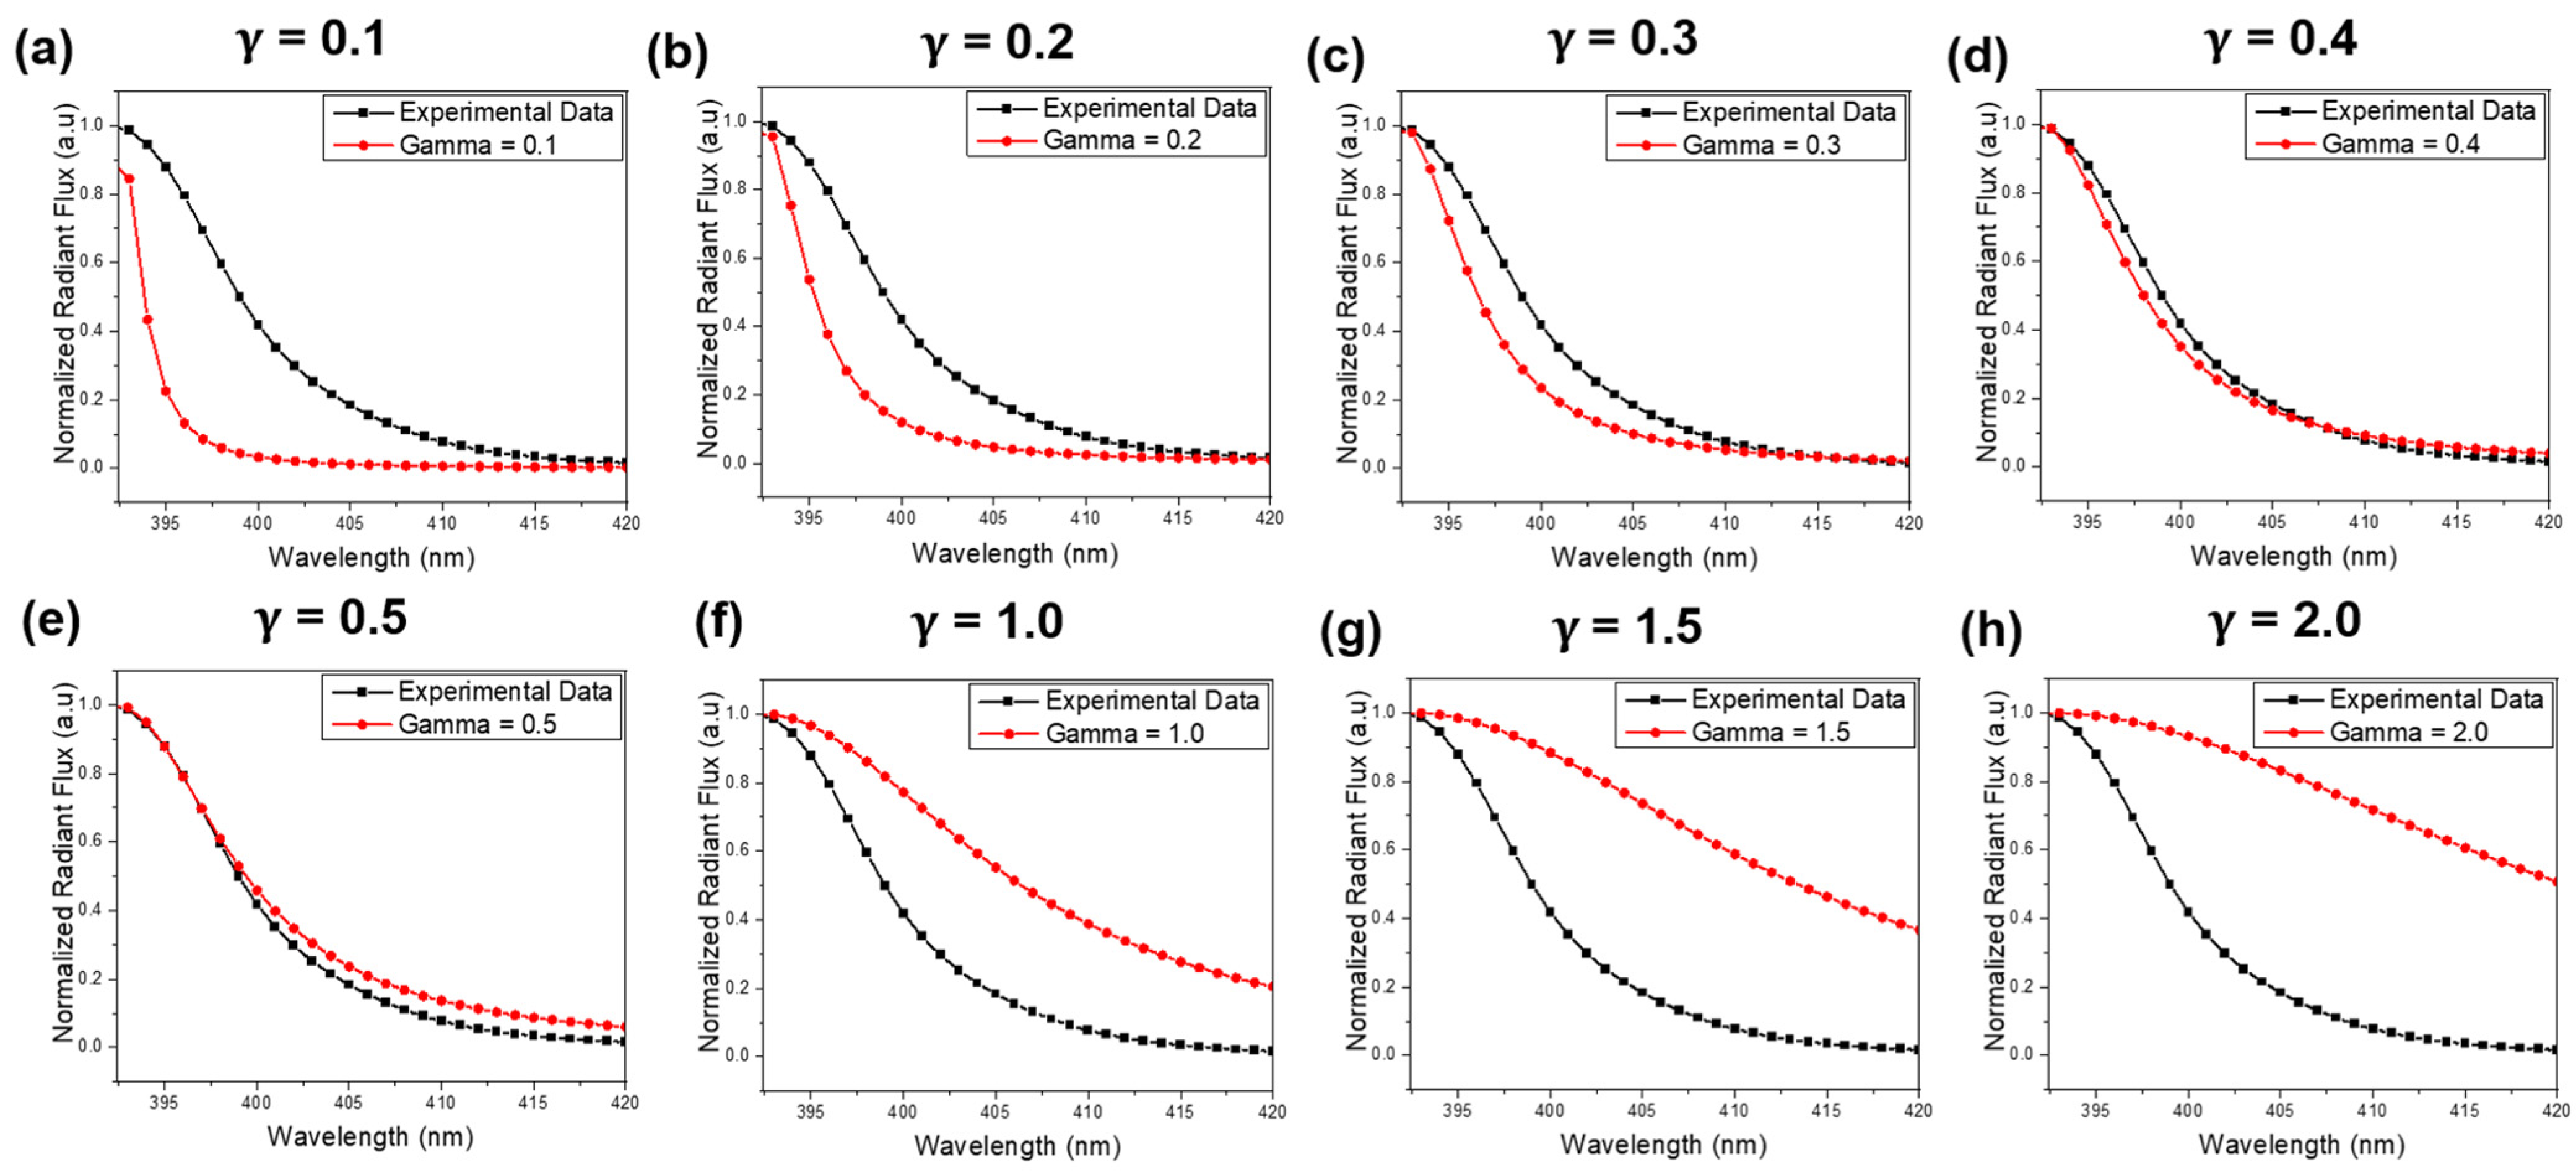
Using Equation (5), a preliminary survey of γ values ranging from 0.1 to 2.0 was conducted to identify a suitable range for a more detailed analysis and to obtain more accurate results. The survey indicated that γ values between 0.1 and 1.0 exhibit relatively good overlap with the experimental spectrum. To further assess the quality and quantify the degree of this overlap, both qualitative and quantitative analyses were subsequently performed.
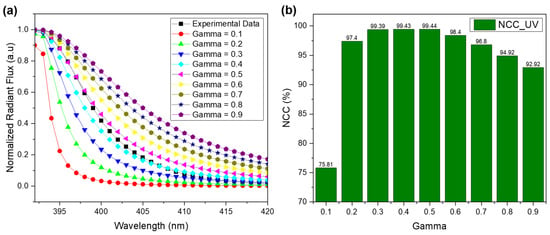
Based on the location of simulation curve compared to the location of experimental curve as shown in Figure 10, we can roughly define the value of gamma for further determination which shows the best agreement between simulation and the experimental curve. The value range of gamma selected-value is in the range of 0.1 to 1.0. Figure 11a shows the qualitative comparison of simulation curves and experiment curves. Qualitatively, simulated curves at beta values of 0.4 and 0.5 are close to the experimental data. For a better accuracy comparison, a quantitative comparison is further conducted. The similarity between the simulation and experimental spectrum is defined by cross-normalized correlation. The corresponding NCC versus gamma values are shown in Figure 11b. The highest NCCs are achieved at gamma of 0.4. Two other lower NCC values are achieved as gamma values are 0.3 and 0.5. Thus, for more detailed testing the optimized gamma value is selected in the range of 0.3 to 0.5.
Figure 10.
Effect of gamma value on the shape of curve and its comparison to experimental data. (a) gamma of 0.1. (b) gamma of 0.2. (c) gamma of 0.3. (d) gamma of 0.4. (e) gamma of 0.5. (f) gamma of 1.0. (g) gamma of 1.5. (h) gamma of 2.0.
Figure 11.
(a) Qualitative comparison of simulation curves and experimental curves. (b) The quantitative comparison based on the changing of NCC versus gamma values.
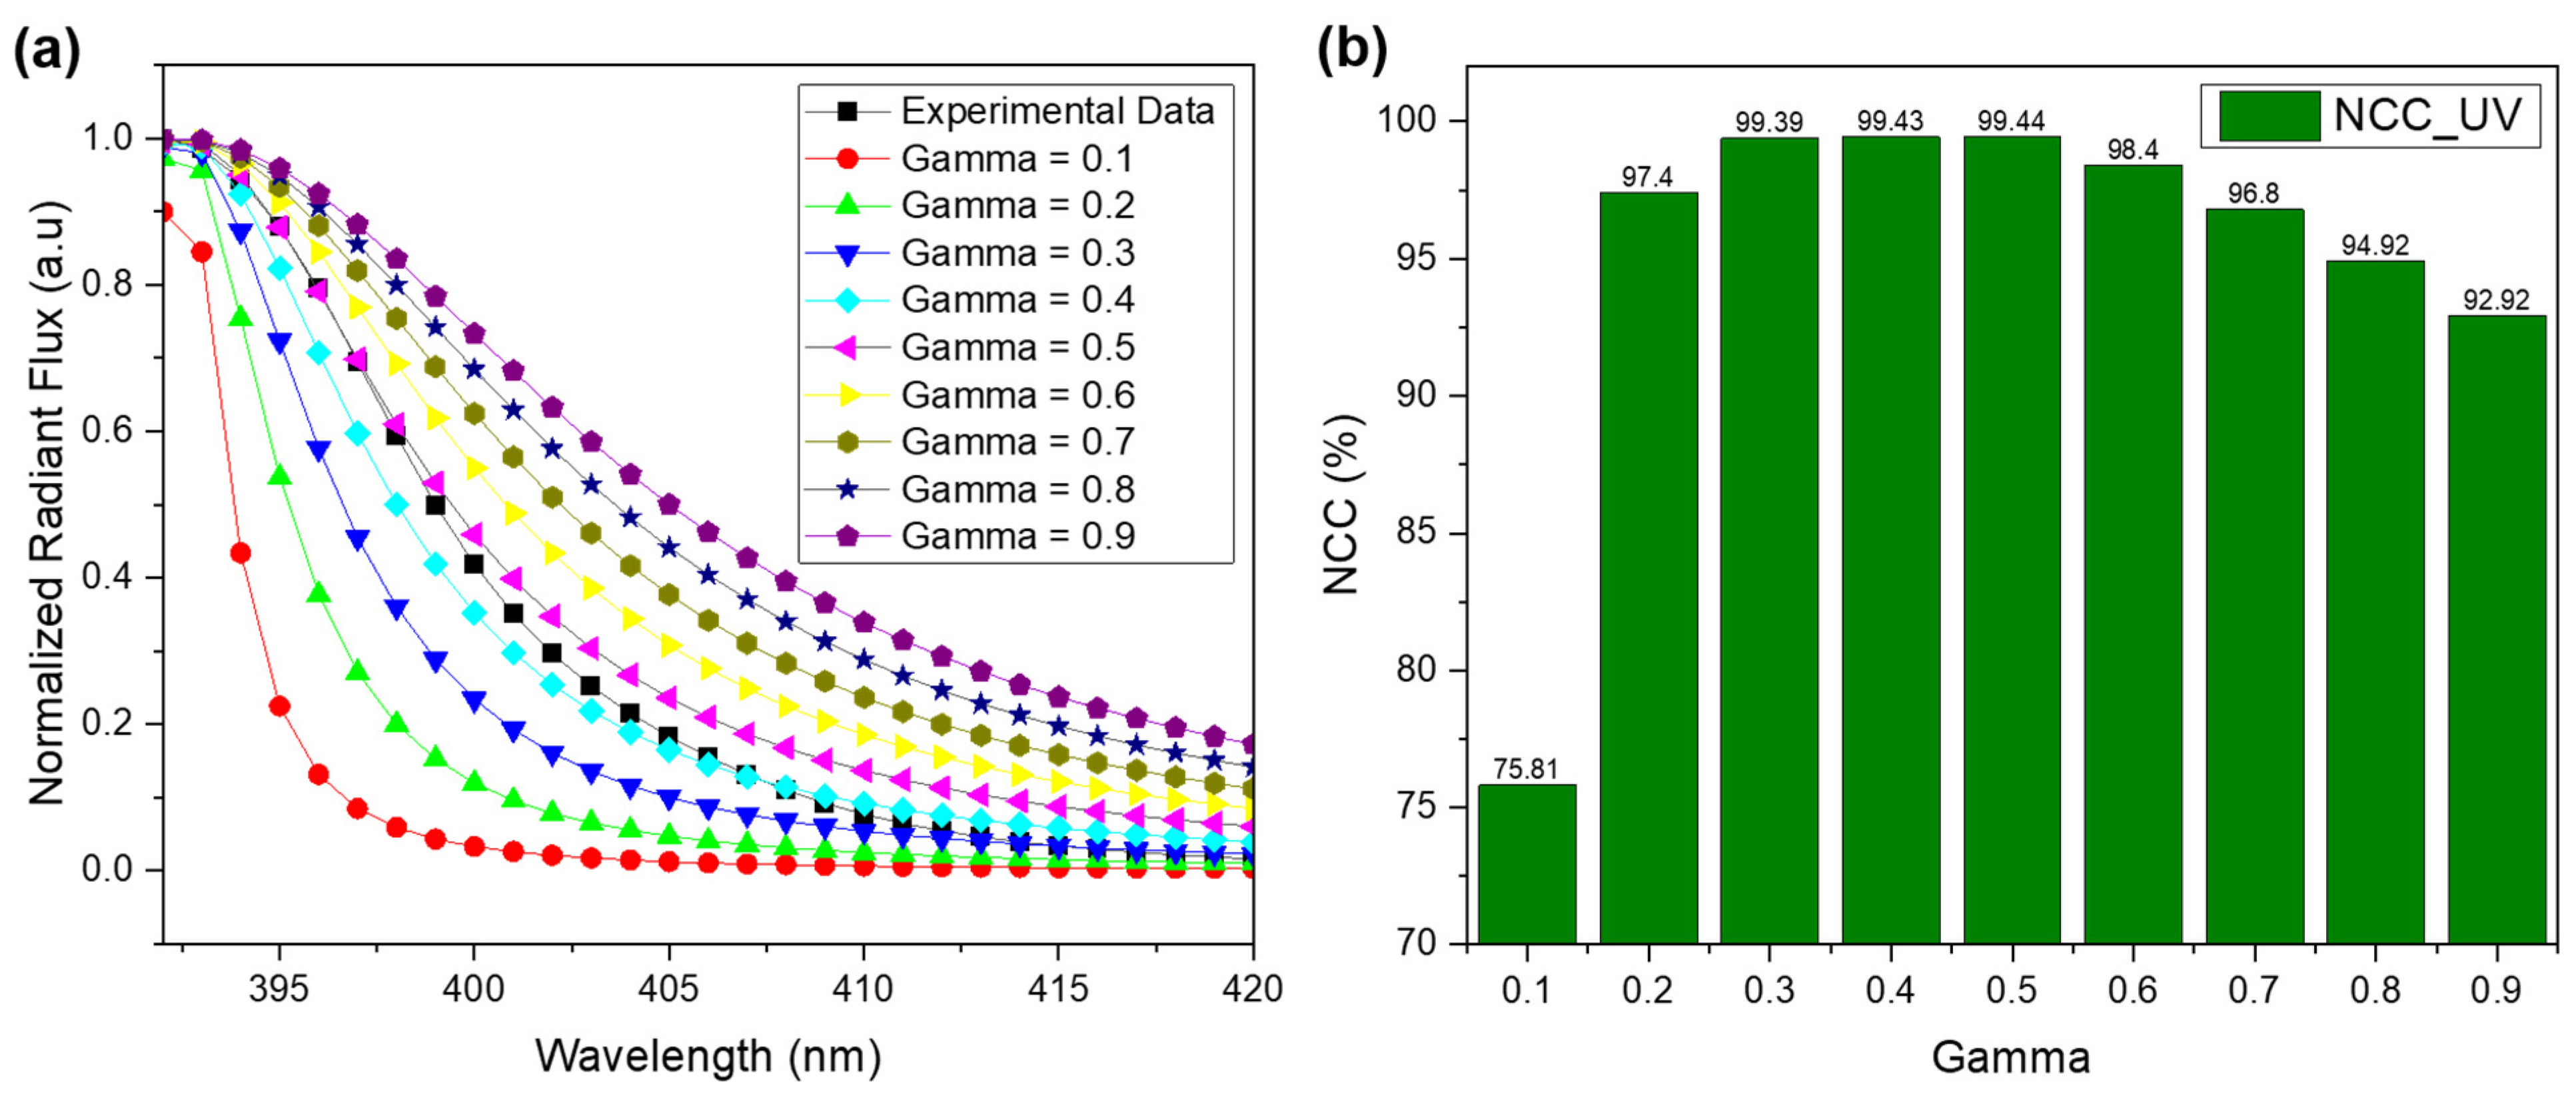
Figure 12a,b show the investigation results of the effect of the different gamma values from 0.4 to 0.49 on the similarity between simulation and experimental results. In this investigation, the gamma value is changed with an increased step of 0.01. The qualitative comparison of simulation and experiment data is shown in Figure 12a. Figure 12b shows the quantitative value of similarity between simulation and experimental data using NCC algorithms. All NCC values are higher than 99.44%. The highest NCC value of 99.612% is obtained at a gamma value of 0.45. Figure 12c shows the investigation results of the effect of the different gamma values on the similarity between simulation and experimental results at a smaller value with an increased step of 0.002. In this investigation, the gamma value is changed from 0.436 to 0.460. Figure 12c shows the quantitative value of similarity between simulation and experimental data using NCC algorithms. All NCC values are higher than 99.612%. The highest NCC value of 99.613% is obtained at a gamma value of 0.448.
Figure 12.
(a) Qualitative comparison of simulation curves and experiment curves. (b) The quantitative comparison based on the changing of NCC versus gamma values (range values from 0.4 to 0.5). (c) The quantitative comparison based on the changing of NCC versus gamma values (range values from 0.436 to 0.460).
5.3. Accuracy Modeling of Mixed Two Types of Function for UVA Emission Band
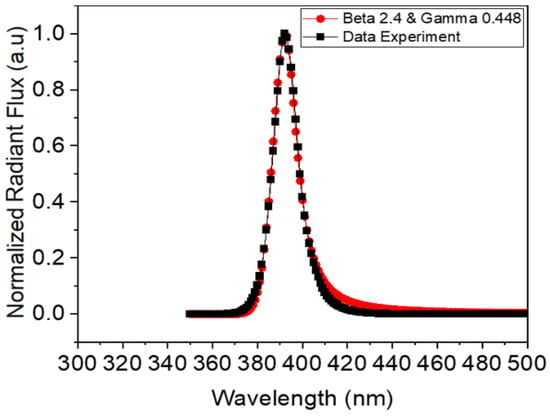
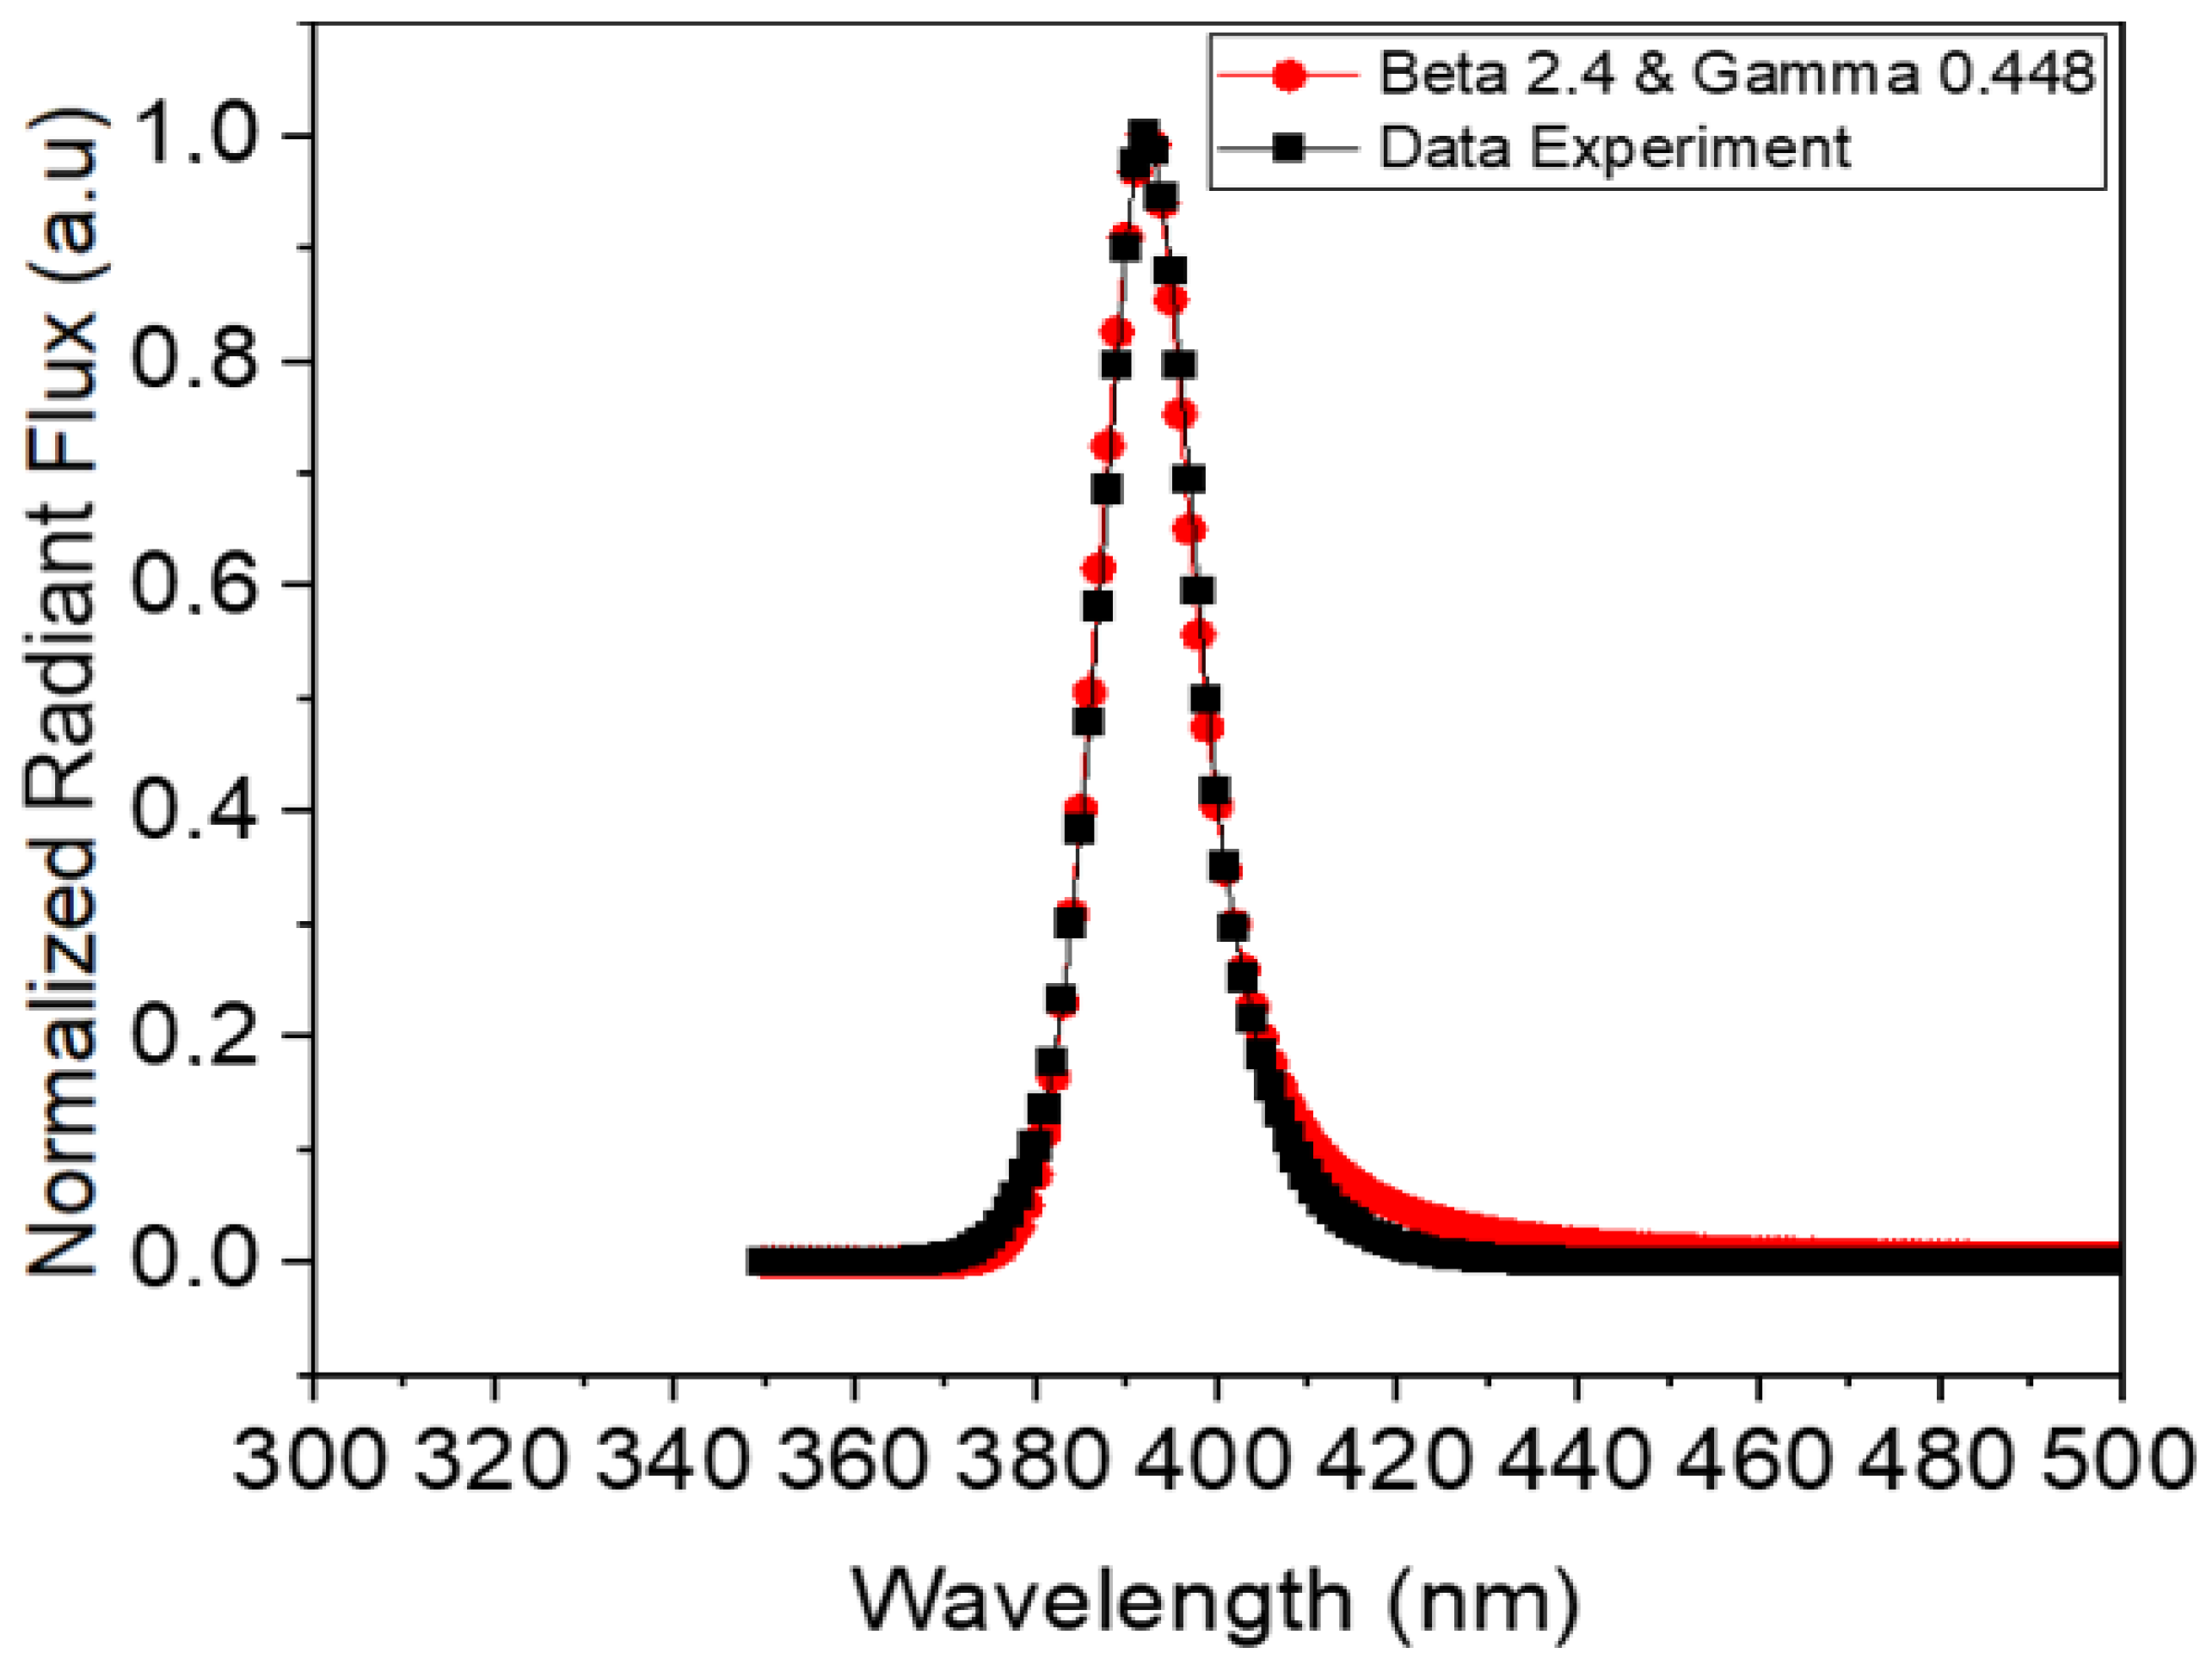
With gamma = 0.448 and beta = 2.4 previously determined correction coefficients and ΔE1 = 12 nm and ΔE2 = 14 nm, corresponding to the full width at half maximum (FWHM1 and FWHM2) of the emission band, respectively, the application of Equation (6) yields a simulated spectrum composed of the left half of a Gaussian function and the right half of a Lorentzian function. Figure 13 represents the hybrid spectrum generated based on the combination of these two functions.
Figure 13.
Comparison of Gaussian–Lorentz composite spectrum and experimental spectrum.
Figure 13 clearly shows the high overlapping level between the simulated hybrid functions and the experimental spectra. The emission band is broadened across the wavelength range of 300 to 500 nm, providing a clearer view of the spectral agreement between the model and the measured data. This visualization emphasizes the hybrid Gaussian-Lorentzian model’s ability to accurately reproduce both the shape and extent of the actual emission profile of UV LEDs.
In this case, the simulated spectrum was constructed using a hybrid function combining Gaussian and Lorentzian components, aiming to accurately reproduce the characteristics of the experimental spectrum. Through the evaluation of various values for the beta and gamma parameters, the optimal results were obtained with β = 2.4 and γ = 0.448.
By integrating both qualitative and quantitative assessments, the simulated spectrum at these parameter values exhibited a high degree of overlap with the experimental data. Specifically, the normalized cross-correlation (NCC) reached 99.75%, indicating a strong similarity between the model and actual measurements. This result represents the most optimal outcome achieved during the parameter survey, demonstrating the effectiveness of the hybrid function approach in modeling UV radiation spectra.
6. Discussions
In this work, an asymmetric optical model was successfully developed to simulate the emission spectrum of ultraviolet light-emitting diodes (UV LEDs) with a peak wavelength at 392 nm. To validate the fidelity of the model, normalized cross-correlation (NCC) algorithms were employed, yielding an exceptional similarity index of 99.75% between the simulated and experimental data. While the utilization of Gaussian and Lorentzian profiles is a well-established practice in semiconductor spectroscopy to describe emission line shapes, the conventional literature predominantly relies on symmetric functions, such as the Voigt or Pseudo-Voigt profiles, applied uniformly across the entire spectral range [40,41,42]. However, such standard approaches frequently suffer from pronounced spectral mismatch, particularly at the spectral tails. To overcome this limitation, the proposed model introduces a piecewise hybrid approach that bifurcates the emission spectrum at the peak wavelength. Specifically, the high-energy region (left side of the peak) is mathematically modeled using a Gaussian function, whereas the low-energy region (right side of the peak) is fitted with a Lorentzian function. This asymmetric decoupling led to a significant improvement in mitigating the non-overlapping areas. The physical rationale behind this superior fitting accuracy lies in the distinct broadening mechanisms governing the two regimes. The short-wavelength region conforms to a Gaussian distribution. Conversely, the long-wavelength tail is more accurately captured by a Lorentzian profile. Consequently, by independently accommodating these two distinct mathematical functions in modeling the physical emission band of UV LED, the proposed piecewise model effectively eliminates the tail-fitting errors inherent to conventional symmetrical models, achieving an unprecedented correlation with empirical observations.
Beyond its theoretical contribution, the proposed high-accuracy optical model holds significant promise for various practical application scenarios. In the realm of optoelectronic device engineering, engineers can simulate spectral shifts and tail emissions under influence of thermal effects during its operation process. Furthermore, the exceptional accuracy in spectral tail prediction is highly beneficial for precision industrial applications, such as UV photopolymerization (curing) and semiconductor lithography, where even minor spectral deviations can lead to critical process defects.
Some small disadvantages are that the model relies on post-experimental curve fitting; consequently, it cannot dynamically predict spectral variations caused by changes in operating conditions, such as injection current-induced blueshifts or thermal-induced redshifts, without recalculating the empirical parameters. The model is highly sensitive to peak wavelength detection; any experimental noise or fluctuations at the spectral apex could lead to a misalignment of the boundary between the Gaussian and Lorentzian domains, thereby limiting its robustness under non-ideal measurement conditions.
7. Conclusions
In conclusion, an optical model for ultraviolet light-emitting diodes (UV LEDs) with a peak emission wavelength of 392 nm has been successfully developed. The similarity between the simulated and experimental spectra was verified using normalized cross-correlation (NCC) algorithms. Specifically, the emission spectrum was modeled by combining Gaussian and Lorentzian functions: the spectrum below the peak wavelength was fitted with Gaussian functions, whereas the spectrum above the peak was modeled using Lorentzian functions. This asymmetric modeling approach significantly reduced the non-overlapping discrepancies. Furthermore, the calculated NCC value reached 99.75%, demonstrating an exceptionally high degree of similarity between the modeled and experimental spectra.
The simulated spectrum was constructed using a hybrid function combining Gaussian and Lorentzian components, aiming to accurately reproduce the characteristics of the experimental spectrum. The optimal values for the beta and gamma parameters were obtained with β = 2.4 and γ = 0.448. This highly accurate optical model provides a powerful tool for predicting LED behavior, thereby accelerating the design and optimization of high-efficiency UV-UVA optoelectronic systems.
Author Contributions
Conceptualization, Q.-K.N.; methodology, Q.-K.N.; software, V.-D.-M.P.; validation, M.-T.N., V.-D.-M.P. and Q.-K.N.; formal analysis, V.-D.-M.P. and Q.-K.N.; investigation, M.-T.N., V.-D.-M.P. and Q.-K.N.; data curation, M.-T.N. and V.-D.-M.P.; writing—original draft, M.-T.N. and V.-D.-M.P.; writing—review and editing, Q.-K.N.; visualization, Q.-K.N.; supervision, Q.-K.N.; project administration, Q.-K.N. All authors have read and agreed to the published version of the manuscript.
Funding
This research received no external funding.
Data Availability Statement
The original contributions presented in this study are included in the article. Further inquiries can be directed to the corresponding author.
Conflicts of Interest
The authors declare no conflicts of interest.
References
- Zhu, Y.; Ding, J.; Wang, X.; Wang, X.; Cao, H.; Teng, F.; Yao, S.; Lin, Z.; Jiang, Y.; Tao, Y. Optimizing UVA and UVC synergy for effective control of harmful cyanobacterial blooms. Environ. Sci. Ecotechnol. 2024, 22, 100455. [Google Scholar] [CrossRef] [Scilit] [PubMed]
- Wroński, A.; Jarocka-Karpowicz, I.; Surażyński, A.; Gęgotek, A.; Zarkovic, N.; Skrzydlewska, E. Modulation of Redox and Inflammatory Signaling in Human Skin Cells Using Phytocannabinoids Applied after UVA Irradiation: In Vitro Studies. Cells 2024, 13, 965. [Google Scholar] [CrossRef] [Scilit] [PubMed]
- Hunter, E.; Percival, B.; Eberl, D.T.; White, S.J. A pilot study to investigate the antimicrobial activity of pulsed UVA and UVC. Aerobiology 2023, 1, 82–97. [Google Scholar] [CrossRef] [Scilit]
- Gęgotek, A.; Conde, T.; Domingues, M.R.; Domingues, P.; Skrzydlewska, E. Impact of Nannochloropsis oceanica and Chlorococcum amblystomatis Extracts on UVA-Irradiated on 3D Cultured Melanoma Cells: A Proteomic Insight. Cells 2024, 13, 1934. [Google Scholar] [CrossRef] [Scilit] [PubMed]
- Lu, F.; Zhou, Q.; Liang, M.; Liang, H.; Yu, Y.; Li, Y.; Zhang, Y.; Lu, L.; Zheng, Y.; Hao, J.; et al. α-Arbutin ameliorates UVA-induced photoaging through regulation of the SIRT3/PGC-1α pathway. Front. Pharmacol. 2024, 15, 1413530. [Google Scholar] [CrossRef] [Scilit] [PubMed]
- Janisiewicz, W.J.; Takeda, F.; Nichols, B.; Glenn, D.M.; Jurick, W.M., II; Camp, M.J. Use of low-dose UV-C irradiation to control powdery mildew caused by Podosphaera aphanis on strawberry plants. Canad. J. Plant Pathol. 2016, 38, 430–439. [Google Scholar] [CrossRef] [Scilit]
- Janisiewicz, W.J.; Takeda, F.; Glenn, D.M.; Camp, M.J.; Jurick, W.M. Dark period following UV-C treatment enhances killing of Botrytis cinerea conidia and controls gray mold of strawberries. Phytopathology 2016, 106, 386–394. [Google Scholar] [CrossRef] [Scilit] [PubMed]
- Xie, Z.; Charles, M.; Charlebois, D.; Rolland, D.; Roussel, D.; Deschênes, M.; Dubé, C.; Khanizadeh, S.; Fan, J. Preharvest exposure to UV-C radiation: Impact on strawberry fruit quality. Acta Hortic. 2015, 1079, 589–592. [Google Scholar] [CrossRef] [Scilit]
- Pombo, M.A.; Rosli, H.G.; Martínez, G.A.; Civello, P.M. UV-C treatment affects the expression and activity of defense genes in strawberry fruit (Fragaria×ananassa, Duch.). Postharvest. Biol. Technol. 2011, 59, 94–102. [Google Scholar] [CrossRef] [Scilit]
- Urban, L.; Charles, F.; de Miranda, M.R.A.; Aarrouf, J. Understanding the physiological effects of UV-C light and exploiting its agronomic potential before and after harvest. Plant Physiol. Biochem. 2016, 105, 1–11. [Google Scholar] [CrossRef] [Scilit] [PubMed]
- Muret, C.; Crettaz, D.; Alberio, L.; Prudent, M. Increase of phosphoprotein expressions in amotosalen/UVA-treated platelet concentrates. Transfus. Med. Hemotherapy 2024, 51, 101–110. [Google Scholar] [CrossRef] [Scilit]
- Zhao, Q.; Wang, Z.; Wang, G.; Cao, F.; Yang, X.; Zhao, H.; Zhai, J. Effects of UVA on Flavonol Accumulation in Ginkgo biloba. Forests 2024, 15, 909. [Google Scholar] [CrossRef] [Scilit]
- Zhang, Y.; Li, Z.; Zhang, N.; Chai, X. The Effects of FR and UVA Irradiation Timing on Multi-Omics of Purple Lettuce in Plant Factories. Agriculture 2024, 14, 2019. [Google Scholar] [CrossRef] [Scilit]
- Khaitov, B.; Teshaev, S.; Karimov, A.; Mukhammadiev, A.; Teshaev, F.; Yuldasheva, R.; Abdalova, G.; Abdumajitov, A. Agronomic performance of cotton (Gossypium hirsutum L.) under the influence of UVA radiation. Res. Crops 2021, 22, 986–993. [Google Scholar] [CrossRef] [Scilit]
- Samenkova, N.F.; Bolochenkov, N.A.; Rusanov, A.L.; Romashin, D.D.; Solovyeva, N.A.; Karuzina, I.I.; Lisitsa, A.V.; Petushkova, N.A. Changes in cell motility proteins profile in HaCaT keratinocytes response to UVA exposure. Biomeditsinskaya Khimiya 2025, 71, 146–157. [Google Scholar] [CrossRef] [Scilit]
- Li, T.; Zuo, X.; Zhang, S.; Kong, Q. Inactivation of antibiotic resistant bacteria from stormwater runoff using UVA/LED and its potential risks. Water Sci. Technol. 2022, 86, 2963–2973. [Google Scholar] [CrossRef] [Scilit]
- Yang, J.-W.; Fan, G.-B.; Tan, F.; Kong, H.-M.; Liu, Q.; Zou, Y.; Tan, Y.-M. The role and safety of UVA and UVB in UV-induced skin erythema. Front. Med. 2023, 10, 1163697. [Google Scholar] [CrossRef] [Scilit]
- Sharma, S.; Sahoo, R.; Chawla, S.; Das, S.; Alone, D.P. Generation of FECD Phenotypes in the Mouse Cornea by UVA Exposure and Surgical Removal of its Corneal Endothelial Layer. Bio Protoc. 2025, 15, e5249. [Google Scholar] [CrossRef] [Scilit]
- She, Q.; Zhou, R.; Yang, X.; Sun, H.; Wang, J.; Wang, Z.; Song, Q. Moderate UVA Radiation Improves Semen Quality and Produces Endocrine and Immune Effects in Mice. J. Exp. Zool. Part A Ecol. Integr. Physiol. 2025, 343, 820–829. [Google Scholar] [CrossRef] [Scilit]
- Bautista-García, B.Y.; Castillo-Suárez, L.A.; Teutli-Sequeira, E.A.; Castañeda-Juárez, M.; Linares-Hernández, I.; Martínez-Miranda, V. Degradation of the commercial Paraquat herbicide by UVA-LED Photo-Electrooxidation utilizing a BDD-Fe system: Multiple response optimization. Water Air Soil Pollut. 2025, 236, 107. [Google Scholar] [CrossRef] [Scilit]
- Hu, Y.; He, R.; Ju, J.; Zhang, S.; He, X.; Li, Y.; Liu, X.; Liu, H. Effects of substituting b with fr and uva at different growth stages on the growth and quality of lettuce. Agronomy 2023, 13, 2547. [Google Scholar] [CrossRef] [Scilit]
- Atalay Ekiner, S.; Gęgotek, A.; Domingues, P.; Domingues, M.R.; Skrzydlewska, E. Comparison of Microalgae Nannochloropsis oceanica and Chlorococcum amblystomatis Lipid Extracts Effects on UVA-Induced Changes in Human Skin Fibroblasts Proteome. Mar. Drugs 2024, 22, 509. [Google Scholar] [CrossRef] [Scilit] [PubMed]
- Kanafin, Y.N.; Abdirova, P.; Arkhangelsky, E.; Dionysiou, D.D.; Poulopoulos, S.G. UVA and goethite activated persulfate oxidation of landfill leachate. Chem. Eng. J. Adv. 2023, 14, 100452. [Google Scholar] [CrossRef] [Scilit]
- Sicks, B.; Gierke, A.-M.; Sommerfeld, F.; Klein, M.; Hessling, M. Disinfection of transparent screens by side-coupled UVA LED radiation. Optics 2023, 4, 321–329. [Google Scholar] [CrossRef] [Scilit]
- Macleod, H.; Weiss, L.; Kelliher, S.; Kevane, B.; Ní Áinle, F.; Maguire, P.B. The effect of UVA light/8-methoxypsoralen exposure used in Extracorporeal Photopheresis treatment on platelets and extracellular vesicles. PLoS ONE 2024, 19, e0293687. [Google Scholar] [CrossRef] [Scilit] [PubMed]
- Li, Y.; Zheng, Y.; Zheng, D.; Zhang, Y.; Song, S.; Su, W.; Liu, H. Effects of supplementary blue and UV-A LED lights on morphology and phytochemicals of Brassicaceae baby-leaves. Molecules 2020, 25, 5678. [Google Scholar] [CrossRef] [Scilit] [PubMed]
- Pacak, I.; Trojak, M.; Skowron, E. The use of UV-A radiation for biofortification of lettuce and basil plants with antioxidant phenolic and flavonoid compounds. Folia Biol. Oecol. 2024, 18, 110–121. [Google Scholar] [CrossRef] [Scilit]
- Choi, D.-S.; Lee, J.-H.; Oh, M.-M. Effects of supplemental UV-A LED radiation on growth and bioactive compounds in spinach. J. Bio-Environ. Control 2024, 33, 45–54. [Google Scholar] [CrossRef] [Scilit]
- González-García, Y.; Escobar-Hernández, D.I.; Benavides-Mendoza, A.; Morales-Díaz, A.B.; Olivares-Sáenz, E.; Juárez-Maldonado, A. UV-A Radiation Stimulates Tolerance against Fusarium oxysporum f. sp. lycopersici in Tomato Plants. Horticulturae 2023, 9, 499. [Google Scholar] [CrossRef] [Scilit]
- Sonjaroon, W.; Tepkaew, T.; Kupia, M.; Tongkok, P.; Boonkorkaew, P.; Thussagunpanit, J. Pre-Harvest UV-A Supplementation in Plant Factory with Artificial Lighting Improves Growth, Photosynthesis, and Phytonutrients in Kale. Horticulturae 2024, 10, 701. [Google Scholar] [CrossRef] [Scilit]
- Yan, Z.; Wang, C.; Wang, L.; Li, X.; Wang, G.; Yang, Y. The combinations of white, blue, and uv-a light provided by supplementary light-emitting diodes promoted the quality of greenhouse-grown cucumber seedlings. Agriculture 2022, 12, 1593. [Google Scholar] [CrossRef] [Scilit]
- Yan, Z.; Wang, C.; Li, Z.; Li, X.; Cheng, F.; Lin, D.; Yang, Y. Supplementary white, UV-A, and far-red radiation differentially regulates growth and nutritional qualities of greenhouse lettuce. Plants 2023, 12, 3234. [Google Scholar] [CrossRef] [Scilit] [PubMed]
- Jadidi, M.; Mumivand, H.; Nia, A.E.; Shayganfar, A.; Maggi, F. UV-A and UV-B combined with photosynthetically active radiation change plant growth, antioxidant capacity and essential oil composition of Pelargonium graveolens. BMC Plant Biol. 2023, 23, 555. [Google Scholar] [CrossRef] [Scilit] [PubMed]
- Laužikė, K.; Viršilė, A.; Samuolienė, G.; Sutulienė, R.; Brazaitytė, A. UV-A for tailoring the nutritional value and sensory properties of leafy vegetables. Horticulturae 2023, 9, 551. [Google Scholar] [CrossRef] [Scilit]
- Juvela, M.; Tharakkal, D. Fast fitting of spectral lines with Gaussian and hyperfine structure models. Astron. Astrophys. 2024, 685, A164. [Google Scholar] [CrossRef] [Scilit]
- Nguyen, Q.-K.; Nguyen, Q.-C. Development of a High-Accuracy Spectral Irradiance Modeling for Evaluating Properties of Output Light from White Light-Emitting Diodes. Optics 2025, 6, 64. [Google Scholar] [CrossRef] [Scilit]
- Nguyen, Q.-K. Emission spectrum modeling of white LEDs light source with using Gaussian function. Photonics Lett. Pol. 2023, 15, 54–56. [Google Scholar] [CrossRef] [Scilit]
- Liu, J.; Su, M.; Jiang, Y.; Du, J.; Liu, X.; Yao, Z.; Deng, R.; Shen, J.; Liu, X. Optimizing LED spectrum fitting using double Gaussian functions. Opt. Appl. 2024, 54, 353–363. [Google Scholar] [CrossRef] [Scilit]
- Zhuang, H.; Wang, Y.; Dai, C.; Li, L.; Wu, Z.; Pan, J. A Blue LED Spectral Simulation Method Using Exponentially Modified Gaussian Functions with Superimposed Asymmetric Pseudo-Voigt Corrections. Photonics 2025, 12, 788. [Google Scholar] [CrossRef] [Scilit]
- Pain, J.-C. Extracting Physical Information from the Voigt Profile Using the Lambert W Function. Plasma 2024, 7, 427–445. [Google Scholar] [CrossRef] [Scilit]
- Hagiwara, Y.; Kuwatani, T. Precision in Peak Parameter Estimation for the Pseudo-Voigt Profile: A Novel Optimization Approach for High-Precision Analysis via Mixing Parameter Control. ACS Meas. Sci. Au 2025, 5, 497–510. [Google Scholar] [CrossRef] [Scilit] [PubMed]
- Schmid, M.; Steinrücka, H.-P.; Gottfriedb, J.M. A new asymmetric Pseudo-Voigt function for more efficient fitting of XPS lines. Surf. Interface Anal. 2014, 46, 505–511. [Google Scholar] [CrossRef] [Scilit]
- Titkov, I.E.; Karpov, S.Y.; Yadav, A.; Mamedov, D.; Zerova, V.L.; Rafailov, E. Efficiency of True-Green Light Emitting Diodes: Non-Uniformity and Temperature Effects. Materials 2017, 10, 1323. [Google Scholar] [CrossRef] [Scilit] [PubMed]
- Jeong, S.S.; Ko, J.-H. Analysis of the spectral characteristics of white light-emitting diodes under variousthermal environments. J. Inf. Disp. 2012, 13, 37–42. [Google Scholar] [CrossRef] [Scilit]
Disclaimer/Publisher’s Note: The statements, opinions and data contained in all publications are solely those of the individual author(s) and contributor(s) and not of MDPI and/or the editor(s). MDPI and/or the editor(s) disclaim responsibility for any injury to people or property resulting from any ideas, methods, instructions or products referred to in the content. |
© 2026 by the authors. Licensee MDPI, Basel, Switzerland. This article is an open access article distributed under the terms and conditions of the Creative Commons Attribution (CC BY) license.