


Abstract
The transient heat-transfer behavior of hybrid natural-fiber-reinforced epoxy composites containing 0–5 wt% conch shell filler and 20–35 wt% combined banana–bagasse fiber reinforcement was evaluated using active infrared thermography. A standardized protocol comprising 30 s of convective heating with 100 °C hot air followed by 60 s of natural cooling was applied to seven composite configurations tested in triplicate. The transient response was analyzed in three phases: active heating (0–30 s), thermal lag (30–57 s), and natural cooling (57–90 s). Maximum temperature (), heating rate (), cooling rate (), and a thermal retention ratio () were extracted and statistically validated by one-way ANOVA with Bonferroni correction. For specimens exhibiting zero within-group variance at the camera display resolution, significance was confirmed using exact permutation tests. Filler incorporation (3–5 wt%) was the dominant factor governing peak-temperature reduction; F5B15S10 (5 wt% filler, 25 wt% total fiber) achieved the lowest (33.80 °C, 4.57 °C below neat epoxy). Cooling efficiency was primarily governed by fiber content; F3B15S20 (3 wt% filler, 35 wt% total fiber) demonstrated the most efficient heat dissipation (). These findings demonstrate that heating resistance and cooling efficiency are governed by partially independent mechanisms, enabling tailored material design. This study indicates that the proposed transient thermographic protocol provides a valuable reference to thermal management design of hybrid biocomposites in automotive interior and building envelope applications.
1. Introduction
Composite materials used in automotive interiors and building envelopes routinely experience transient thermal exposure from solar radiation, frictional heating, and operational temperature fluctuations. These thermal loads induce interfacial stresses, matrix softening, and dimensional instability in fiber-reinforced polymers [1,2,3,4]. Hybrid biocomposite systems integrate natural fibers with particulate fillers to provide sustainable alternatives to synthetic composites while maintaining structural performance [5,6,7]. However, transient thermal characterization of these materials under short-duration convective loading has not been systematically addressed.
Thermal conductivity in polymer composites is influenced by filler dispersion, fiber architecture, and interfacial resistance. Yadav et al. [8] reviewed filler effects on thermal properties and showed that nano-scale additions improve heat-transfer pathways. Agustina et al. [9] reported that 5 wt% graphite nanoplatelet loading raised the thermal conductivity of epoxy nanocomposites by 42%. Shchegolkov et al. [10] demonstrated that carbon-nanotube addition substantially modifies the heat-release behavior of elastic nanocomposites. Shamsuri et al. [11] examined co-filler effects in polymer composites and concluded that hybrid particulate systems enhance thermal transport compared with single-filler formulations. Marine-derived shell powders, including conch, oyster, and mussel shells, have emerged as sustainable calcium-carbonate-rich fillers for polymer composites; they show thermal stability up to 800 °C and enhanced interfacial bonding through surface hydroxyl groups [12,13]. However, these studies employed steady-state measurement techniques such as flash diffusivity [14] and guarded hot-plate methods [15,16]. Such techniques provide equilibrium thermal conductivity values but do not capture dynamic heating and cooling response under transient loading.
Infrared thermography has been applied to composite materials for non-contact temperature measurement and defect characterization. Mouahid [17] reviewed infrared thermography in composites and highlighted active methods for quantitative temperature monitoring. Chrysafi et al. [18] used active thermography with digital image processing to detect damage in composites, focusing on spatial discontinuities such as delaminations and voids. Gu et al. [19] demonstrated detectability of delamination regions in CFRP-strengthened concrete members. Gupta et al. [20] surveyed sensing technologies for non-destructive evaluation of structural composites and emphasized the value of active thermography for sub-surface characterization. Queirós et al. [21] combined active thermography with digital shearography to inspect damaged composite structures, and Wang et al. [22] applied laser-line scanning thermography to identify defects in ceramic composites. Pisonero et al. [23] applied active thermography to detect defects in additively manufactured natural fiber composites. Palacios and Barasinski [24] further demonstrated that microstructural heterogeneities strongly influence the ply-scale thermal response of CFRTP composite tapes. These applications primarily target structural anomalies or microstructural mapping rather than quantitative characterization of bulk thermal response during transient heating and cooling cycles.
Natural-fiber-reinforced composites exhibit a heterogeneous microstructure due to fiber distribution and filler incorporation, and these features affect their thermal behavior [25,26]. Huseynov et al. [26] reported that fiber orientation and matrix type significantly affect heat dissipation in short-carbon-fiber composites manufactured by material extrusion. Banana and bagasse fibers exhibit low thermal conductivity (0.04–0.07 W/m·K) and high moisture absorption, which influence thermal transport in fiber-reinforced polymer systems [27,28]. Mechanical properties of hybrid biocomposites have been extensively characterized [29,30,31]. Çevik and Avşar [29] produced sustainable biocomposites with agricultural waste powders and reported tensile-strength improvements of 15–25% at 10–20 wt% filler addition. Malingam et al. [30] demonstrated that hybrid kenaf/glass fiber-reinforced polypropylene composites provide balanced mechanical performance. Ravindran et al. [31] compared impact characteristics of distinct bio-based matrix composites and discussed the role of microstructural features in damage tolerance. However, the thermal characterization of these systems remains limited to steady-state measurements that do not represent the rapid thermal cycling encountered in automotive and building applications [32].
No prior study has systematically extracted cooling-stage metrics for hybrid biocomposites under standardized short-duration convective loading. The ratio is conceptually related to established normalized temperature metrics, including the dimensionless temperature ratio used in transient conduction and lumped-capacitance analysis [33], and to normalized cooling-curve comparisons such as the T-history method, in which the temperature evolution of a sample is compared against a reference under a controlled thermal cycle [34]. The novelty of the present work lies not in the mathematical form of the ratio but in its application as a paired heating–cooling screening metric for natural-fiber hybrid biocomposites under a standardized transient convective protocol, for which normalized thermal-recovery metrics have not previously been reported. The relationship between peak-temperature resistance and cooling efficiency has not been established, and statistical validation of compositional effects on both heating and cooling metrics is lacking.
This research is the first to systematically extract paired heating-stage and cooling-stage transient thermographic metrics for banana–bagasse–conch-shell hybrid biocomposites under a standardized convective protocol. Different from previous studies that relied on steady-state conductivity, this study proposes a low-cost active-thermographic protocol that captures dynamic heating and cooling response in under two minutes per specimen. The specific objectives of this study are to (1) establish a reproducible 30 s heating and 60 s cooling protocol for hybrid biocomposite plates; (2) quantify the independent effects of filler content and fiber architecture on heating resistance and cooling efficiency; and (3) statistically validate the compositional effects using one-way ANOVA with Bonferroni correction.
2. Materials and Methods
2.1. Materials
Banana stem fiber and sugarcane bagasse fiber were used as reinforcements for the hybrid biocomposite plates. The epoxy resin system comprised Epoxy Resin LY 556 with Epoxy Hardener HY-951 at a 10:1 resin-to-hardener weight ratio, as recommended by the supplier. The particulate filler was conch shell powder with an average particle size of 20–30 nm. The reported particle size refers to the as-supplied powder. Because dispersion was performed by mechanical stirring without ultrasonication or surfactant treatment, the filler may form micron-scale agglomerates in the cured composite, and the effective filler length scale may therefore exceed the nominal primary particle size. Particle dispersion was not characterized in the present work. All materials were procured from M/s Seenu & Co., Coimbatore, Tamil Nadu, India. Banana stem fiber has a typical density of 1.35 g/cm3 and a tensile strength of 529–914 MPa, while bagasse fiber has a density of 1.15–1.25 g/cm3 and a tensile strength of 170–290 MPa [35,36,37]. Conch shell powder is a calcium-carbonate-rich marine biofiller (predominantly aragonite/calcite CaCO3), valued for its thermal stability and surface hydroxyl groups that promote interfacial bonding in polymer matrices [12,13]. Banana stem fiber and sugarcane bagasse fiber are lignocellulosic fibers composed primarily of cellulose, hemicellulose, and lignin, with irregular, elongated cross-sections typical of plant fibers [28,35]. The filler chemistry and fiber morphology are reported here from the constituent literature; particle dispersion and the fiber/filler/matrix interface were not characterized in the present work. The composite compositions considered in this work are summarized in Table 1. Seven plates were selected for detailed thermographic evaluation: FB10S10, FB15S15, F3B15S20, F5B10S20, F5B15S10, F5B20S15 (hybrid fiber composites), and EP100 (neat epoxy reference). The sample nomenclature follows the format FxBySz, where x denotes the conch shell filler weight percentage, y denotes the banana stem fiber weight percentage, and z denotes the sugarcane bagasse fiber weight percentage. For example, F3B15S20 contains 3 wt% filler, 15 wt% banana fiber, and 20 wt% bagasse fiber, with the remaining 62 wt% being epoxy matrix.
Table 1.
Composite plate composition and designation. Sample nomenclature: FxBySz, where x = conch shell filler wt%, y = banana fiber wt%, and z = sugarcane bagasse fiber wt%. The balance is epoxy resin (LY 556 + HY-951 hardener, 10:1 ratio).
2.2. Composite Plate Fabrication
Composite plates were fabricated by compression molding. Prior to fabrication, fibers were sun-dried for 48 h to reduce moisture content. All fibers from both sources were dried together under identical conditions and for the same duration, so any residual moisture was distributed comparably across compositions. The residual moisture content after drying was not quantified in the present work. The resin and hardener were mixed for 15 min and degassed for 10 min to minimize entrapped air. Conch shell filler was incorporated into the resin mixture at 0, 3, or 5 wt% relative to total composite mass and dispersed by mechanical stirring for 30 min. All weight percentages in Table 1 represent fractions of total composite mass. For example, a 100 g batch of F5B15S10 comprises 5 g conch shell filler, 15 g banana fiber, 10 g bagasse fiber, and 70 g of the epoxy resin system (including hardener at the 10:1 resin-to-hardener ratio). Chopped fibers were thoroughly mixed into the resin–filler compound, and the mixture was poured into the compression mold to obtain a nominal thickness of 3 mm and cured at room temperature for 12 h. After curing, plates were cut to the test dimensions of 290 mm × 290 mm using an electric hacksaw machine. Compression molding against the flat mold surface produced a resin-rich skin layer on the molded faces, characteristic of this process, in which the matrix flows to the mold wall during consolidation while the reinforcing fibers remain below the surface. Infrared measurements were acquired on this as-molded face for all specimens. The surfaces were not polished or sanded, in order to preserve a consistent as-molded condition across all plates and to avoid introducing specimen-to-specimen variation through manual finishing. The resin-rich skin presents an epoxy-dominated surface for every composition, which minimizes surface fiber protrusion and provides comparable optical and convective surface conditions across specimens.
2.3. Active Thermographic Testing Setup
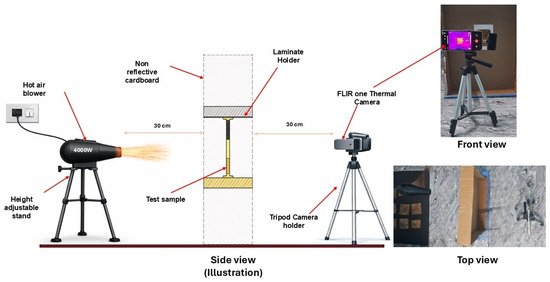
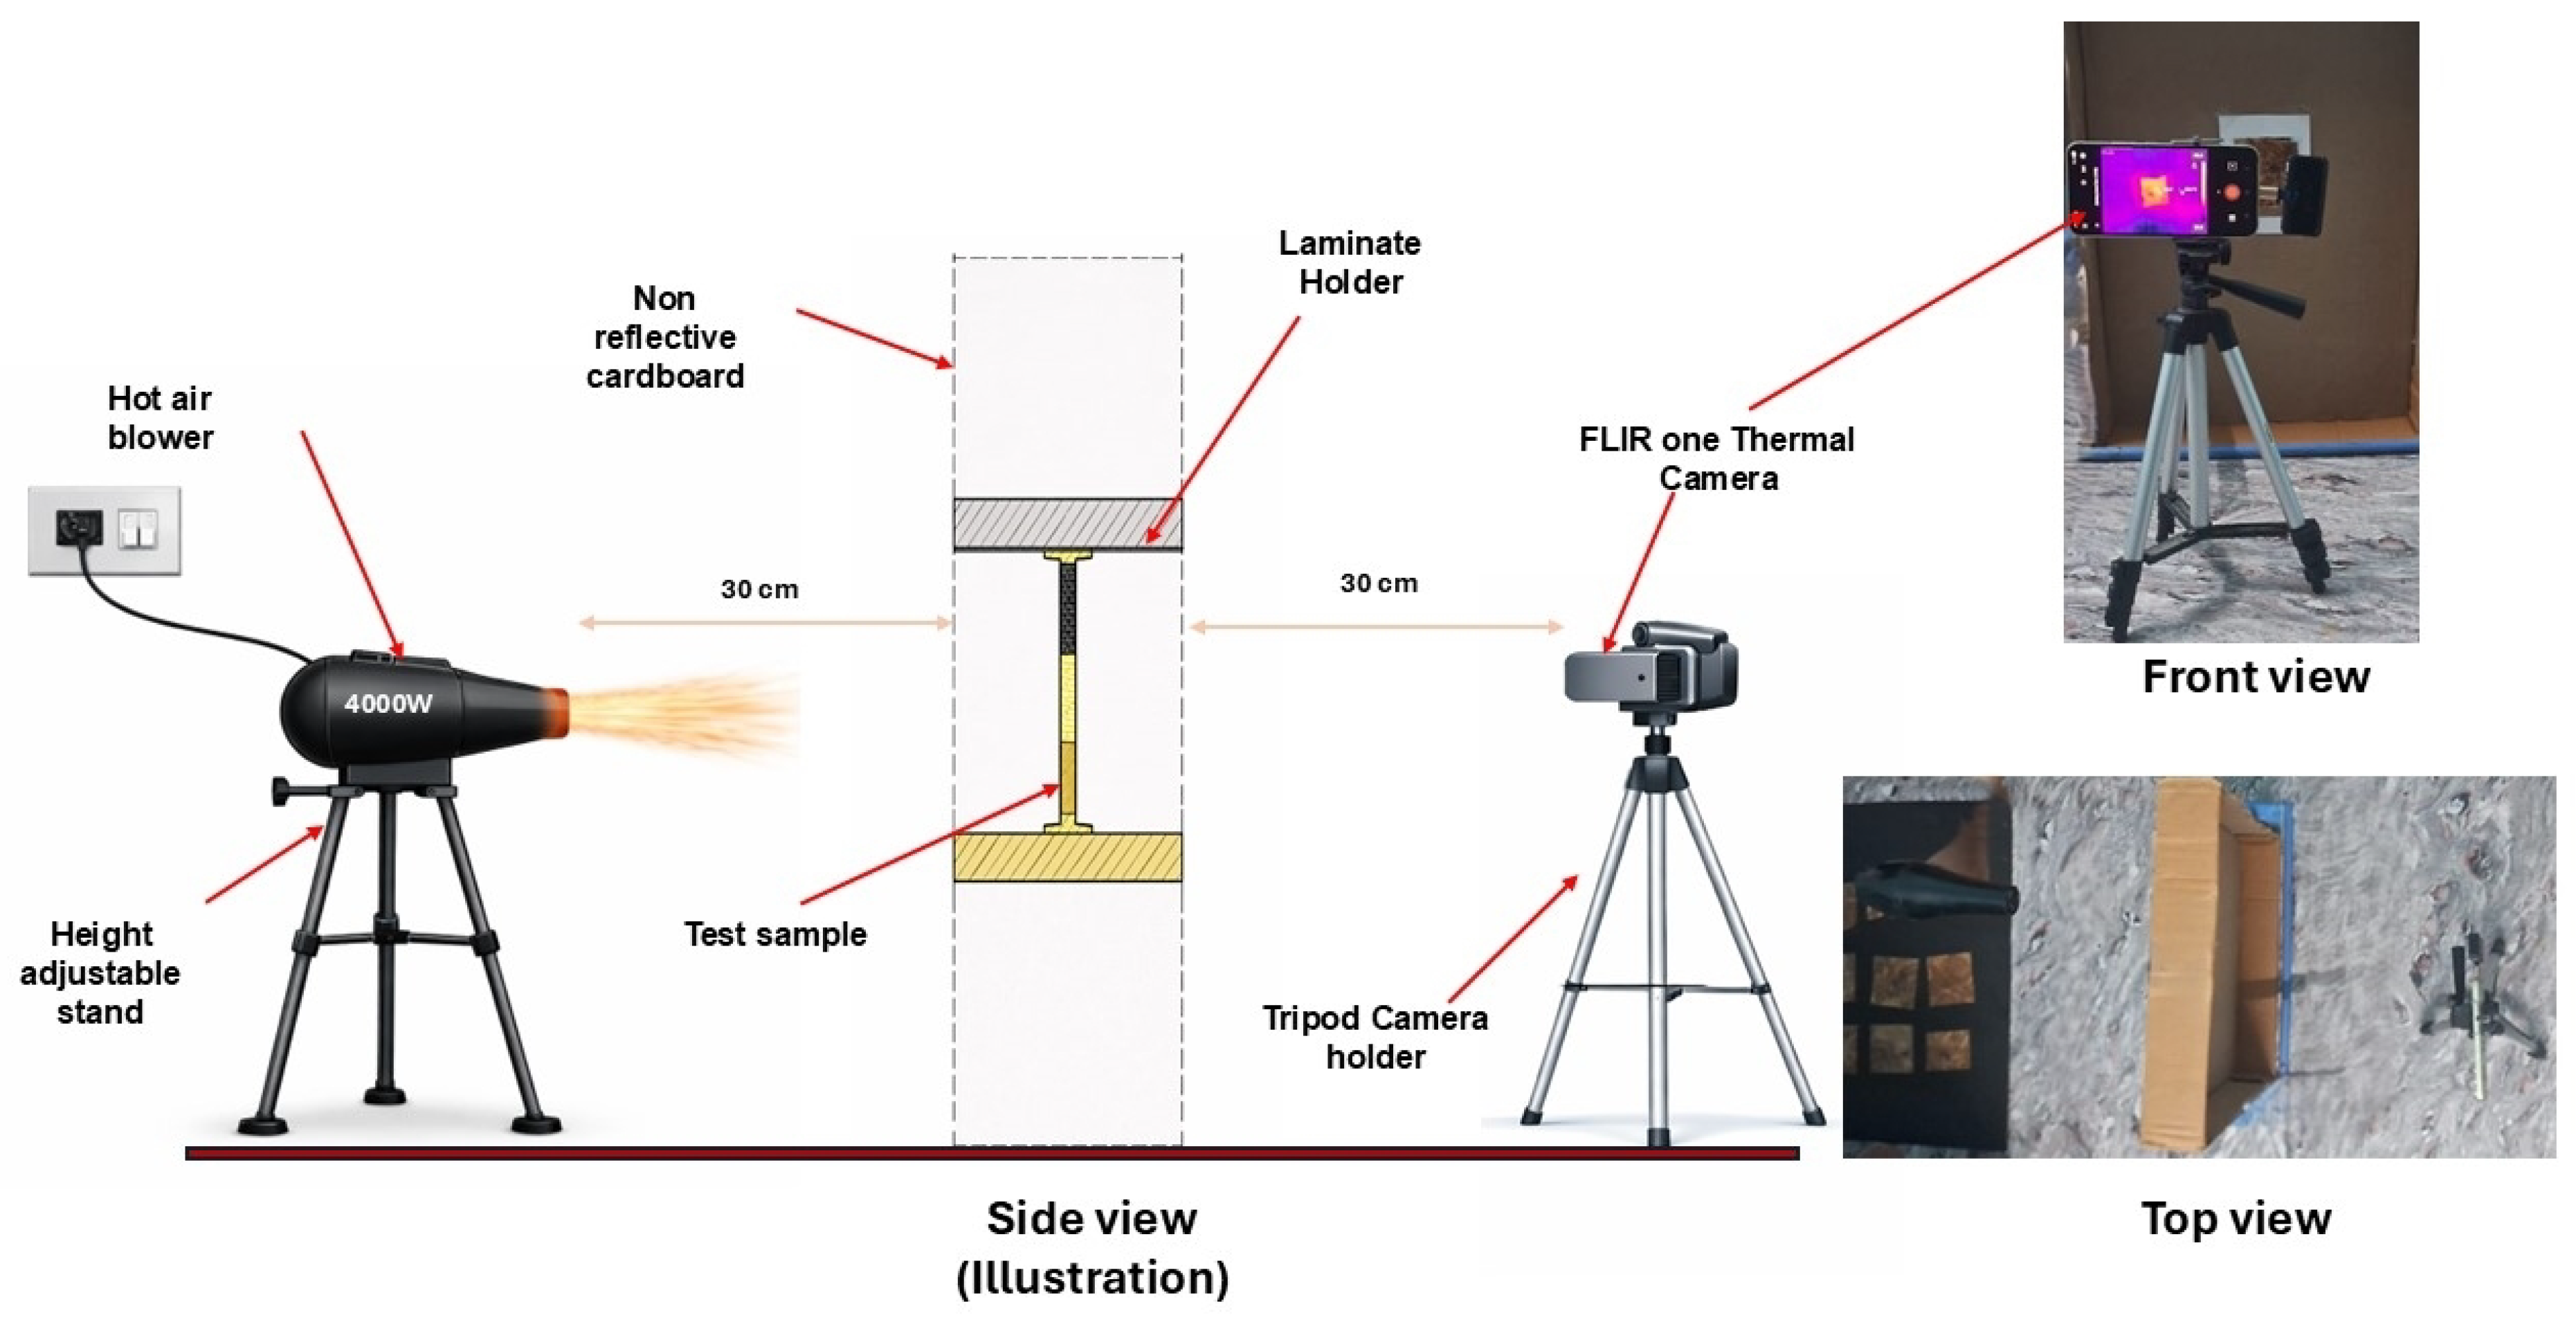
A controlled convective heating–cooling protocol was used for thermographic testing. Each specimen was positioned vertically in a cardboard holder to minimize direct conductive heat losses to the surroundings. A hot air blower delivering air at approximately 100 °C was placed at a fixed distance of 30 cm from the plate surface, and the hot air jet was directed at the geometric center of the plate. Infrared thermographic measurements were acquired using a thermal imaging camera positioned 30 cm from the opposite face of the specimen. The 100 °C value refers to the blower setpoint at the 30 cm standoff; the outlet temperature was not independently instrumented during testing. The same blower, setpoint, standoff, and orientation were used for all specimens, so the applied convective boundary condition was nominally identical across the comparison.
The thermal loading protocol consisted of three phases: Phase I (active convective heating, 0–30 s), Phase II (thermal lag, 30–57 s), and Phase III (natural cooling, 57–90 s). During Phase I, hot air at approximately 100 °C was directed at the specimen. At s, heating was terminated, initiating Phase II, during which the surface temperature continued to rise due to heat diffusion into the bulk. Phase III began once the average maximum temperature () was attained at s, followed by natural cooling to ambient conditions. This three-phase behavior is characteristic of low-thermal-diffusivity materials subjected to transient surface heating. The ambient temperature during testing was °C, and the relative humidity was %. Each composite configuration was tested in triplicate (three independent repetitions) under identical conditions. The experimental arrangement is shown in Figure 1. The through-thickness Biot number was estimated to assess the validity of treating surface temperature as representative of the local thermal state. For the impinging hot-air jet (air at approximately 100 °C, estimated jet velocity 5–10 m s−1 at the 30 cm standoff), a flat-plate forced-convection correlation yields a convective heat-transfer coefficient of the order of –40 W m−2 K−1. With a characteristic half-thickness mm and an estimated biocomposite conductivity – W m−1 K−1, the Biot number is –. This range remains below unity, supporting the use of surface temperature as a representative metric for comparative screening, although it is not sufficiently small to assert complete through-thickness thermal uniformity. The comparative conclusions of this study are therefore restricted to surface-temperature screening. Independent thermal-conductivity measurement is recommended to refine this estimate and to formally validate the lumped-capacitance treatment in future work.
Figure 1.
Schematic of the active thermographic test arrangement showing hot air blower and infrared camera positions (30 cm distance on each side), specimen holder, and heating direction toward the geometric center of the plate.
2.4. Thermal Video Acquisition and Temperature Extraction
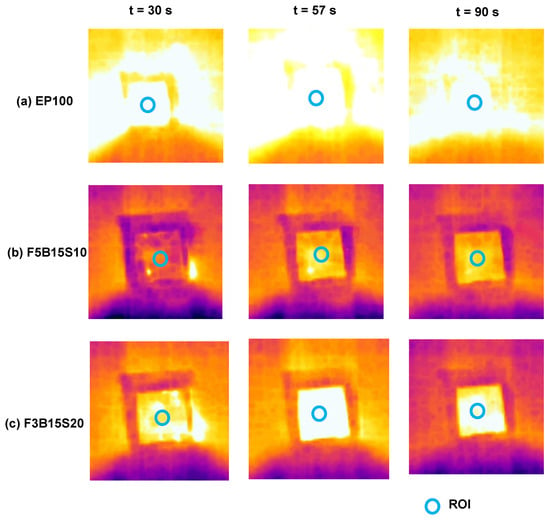
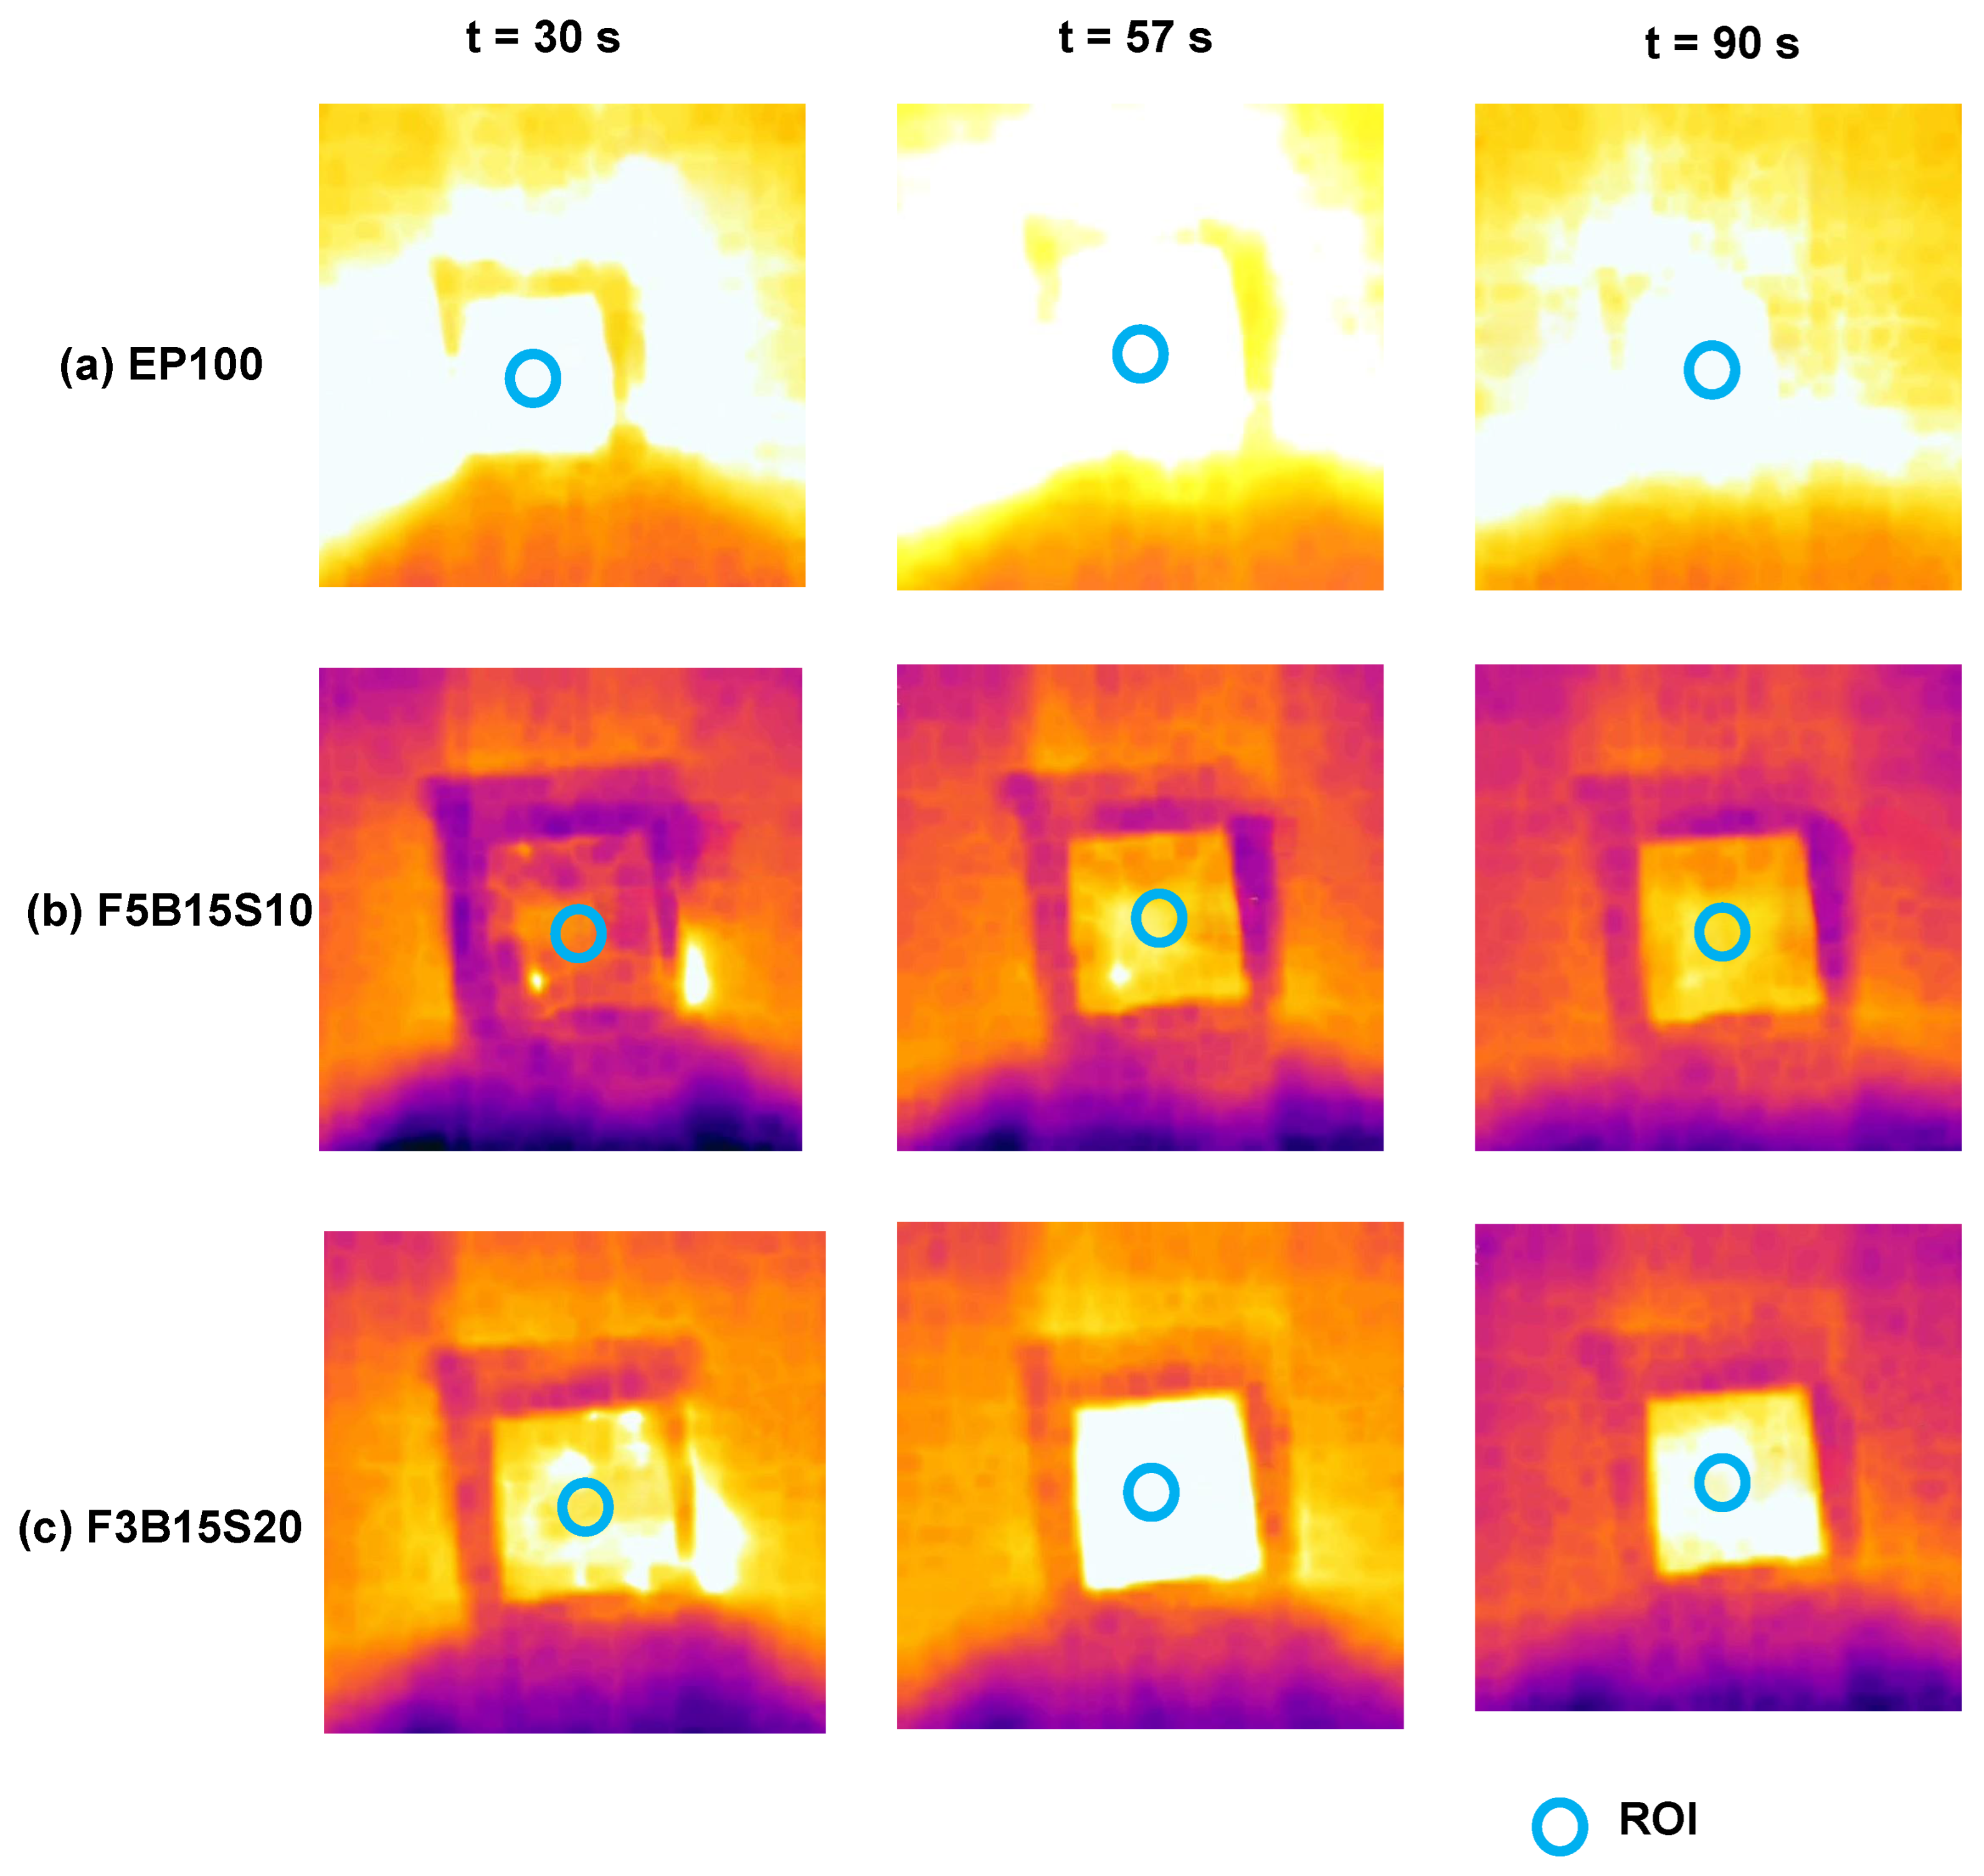
Thermal imaging was performed with an FLIR One Pro LT mobile thermal imaging camera (FLIR Systems Inc., Wilsonville, OR, USA) with thermal sensitivity °C and image resolution of 160 × 120 pixels. The camera was used with the manufacturer’s factory radiometric calibration; no additional user calibration was performed. The camera was allowed to thermally stabilize before acquisition, and the app’s automatic shutter-based non-uniformity (flat-field) correction operated during recording. A fixed surface emissivity of was applied to all specimens in the FLIR One app, consistent with the reported emissivity range of cured epoxy and natural-fiber polymer surfaces (–), and the reflected apparent temperature was set to the measured ambient value (28 ± 3 °C). The same settings were used for every specimen, so all measurements were acquired on a common radiometric basis. Because the epoxy matrix forms the continuous outer surface phase for all compositions, including the filled plates, surface emissivity is governed primarily by the matrix, and inter-composition differences in emissivity are expected to be small. Thermal videos were recorded continuously for the full test duration of s under auto-scaling mode, and frames were extracted at a rate of 1 frame per second. Representative frames were extracted at three critical time points (, 57, and 90 s) corresponding to the end of active heating, maximum-temperature attainment during the thermal-lag phase, and the end of the cooling phase, respectively (Figure 2). Quantitative temperature measurements reported in Table 2 were extracted from raw thermal video data using the FLIR One app point-measurement tool at the geometric center region of interest (ROI), independent of the auto-adjusted display scaling. A smartphone-grade FLIR One Pro LT was selected deliberately, because the objective of this study was to establish a low-cost comparative screening protocol suitable for routine material-development laboratories, rather than to obtain absolute radiometric measurements. The point-measurement temperatures reported in Table 2 were extracted from the recorded radiometric video stream using the FLIR One app measurement tool, and were not read from app-rounded on-screen display values. Frame-level radiometric export at full sensor precision through the manufacturer SDK was not performed in the present work; such export is recommended for follow-up studies to eliminate display-level quantization entirely. Thermal images provide qualitative visualization of spatial temperature distribution and are complementary to the extracted quantitative metrics.
Figure 2.
Representative infrared thermographic images showing spatial temperature distribution during the standardized thermal-loading protocol: (a) EP100 neat epoxy reference; (b) F5B15S10 (5 wt% filler, 25 wt% total fiber, lowest peak temperature); (c) F3B15S20 (3 wt% filler, 35 wt% total fiber, most efficient cooling). Left column: end of active heating phase ( s); center column: maximum-temperature attainment during the thermal-lag phase ( s); right column: end of natural cooling phase ( s). Thermal images were acquired using an FLIR One Pro LT mobile thermal camera (thermal sensitivity °C, resolution 160 × 120 pixels) in auto-scaling mode, and are shown for qualitative comparison of spatial temperature distribution. Visual comparison demonstrates lower thermal elevation in filler-containing composites (b,c) compared with the neat epoxy reference (a) at the peak-temperature phase ( s). Effective thermal recovery during the cooling phase ( s) is evident in the F3B15S20 configuration.
Table 2.
Heating-stage thermographic metrics (mean ± SD, ).
The ROI was defined as the center of the plate corresponding to the hot-air impingement location. For each frame, the center ROI temperature was tabulated as a function of time. The heating phase was defined as to 30 s and the cooling phase as to 90 s. Where duplicate entries occurred at the same timestamp (arising from video frame extraction), the temperature was represented by the arithmetic mean at that timestamp. The temperature–time data presented in Figure 3 were post-processed using combined Savitzky–Golay filtering (window length = 11, polynomial order = 3) and cubic spline interpolation to reduce measurement noise while preserving thermal-response characteristics. This smoothing was used for visual clarity only. All quantitative metrics reported in Table 2 were extracted from raw, unsmoothed data. The FLIR One Pro LT app reports temperature values rounded to 0.1 °C, and several samples consequently exhibit small or zero within-replicate variance at this display resolution; this resolution limit is reported transparently in Table 2.
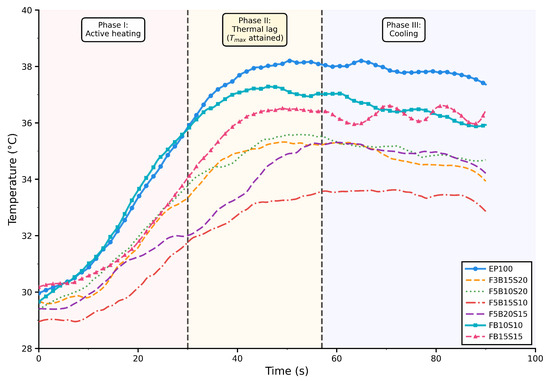
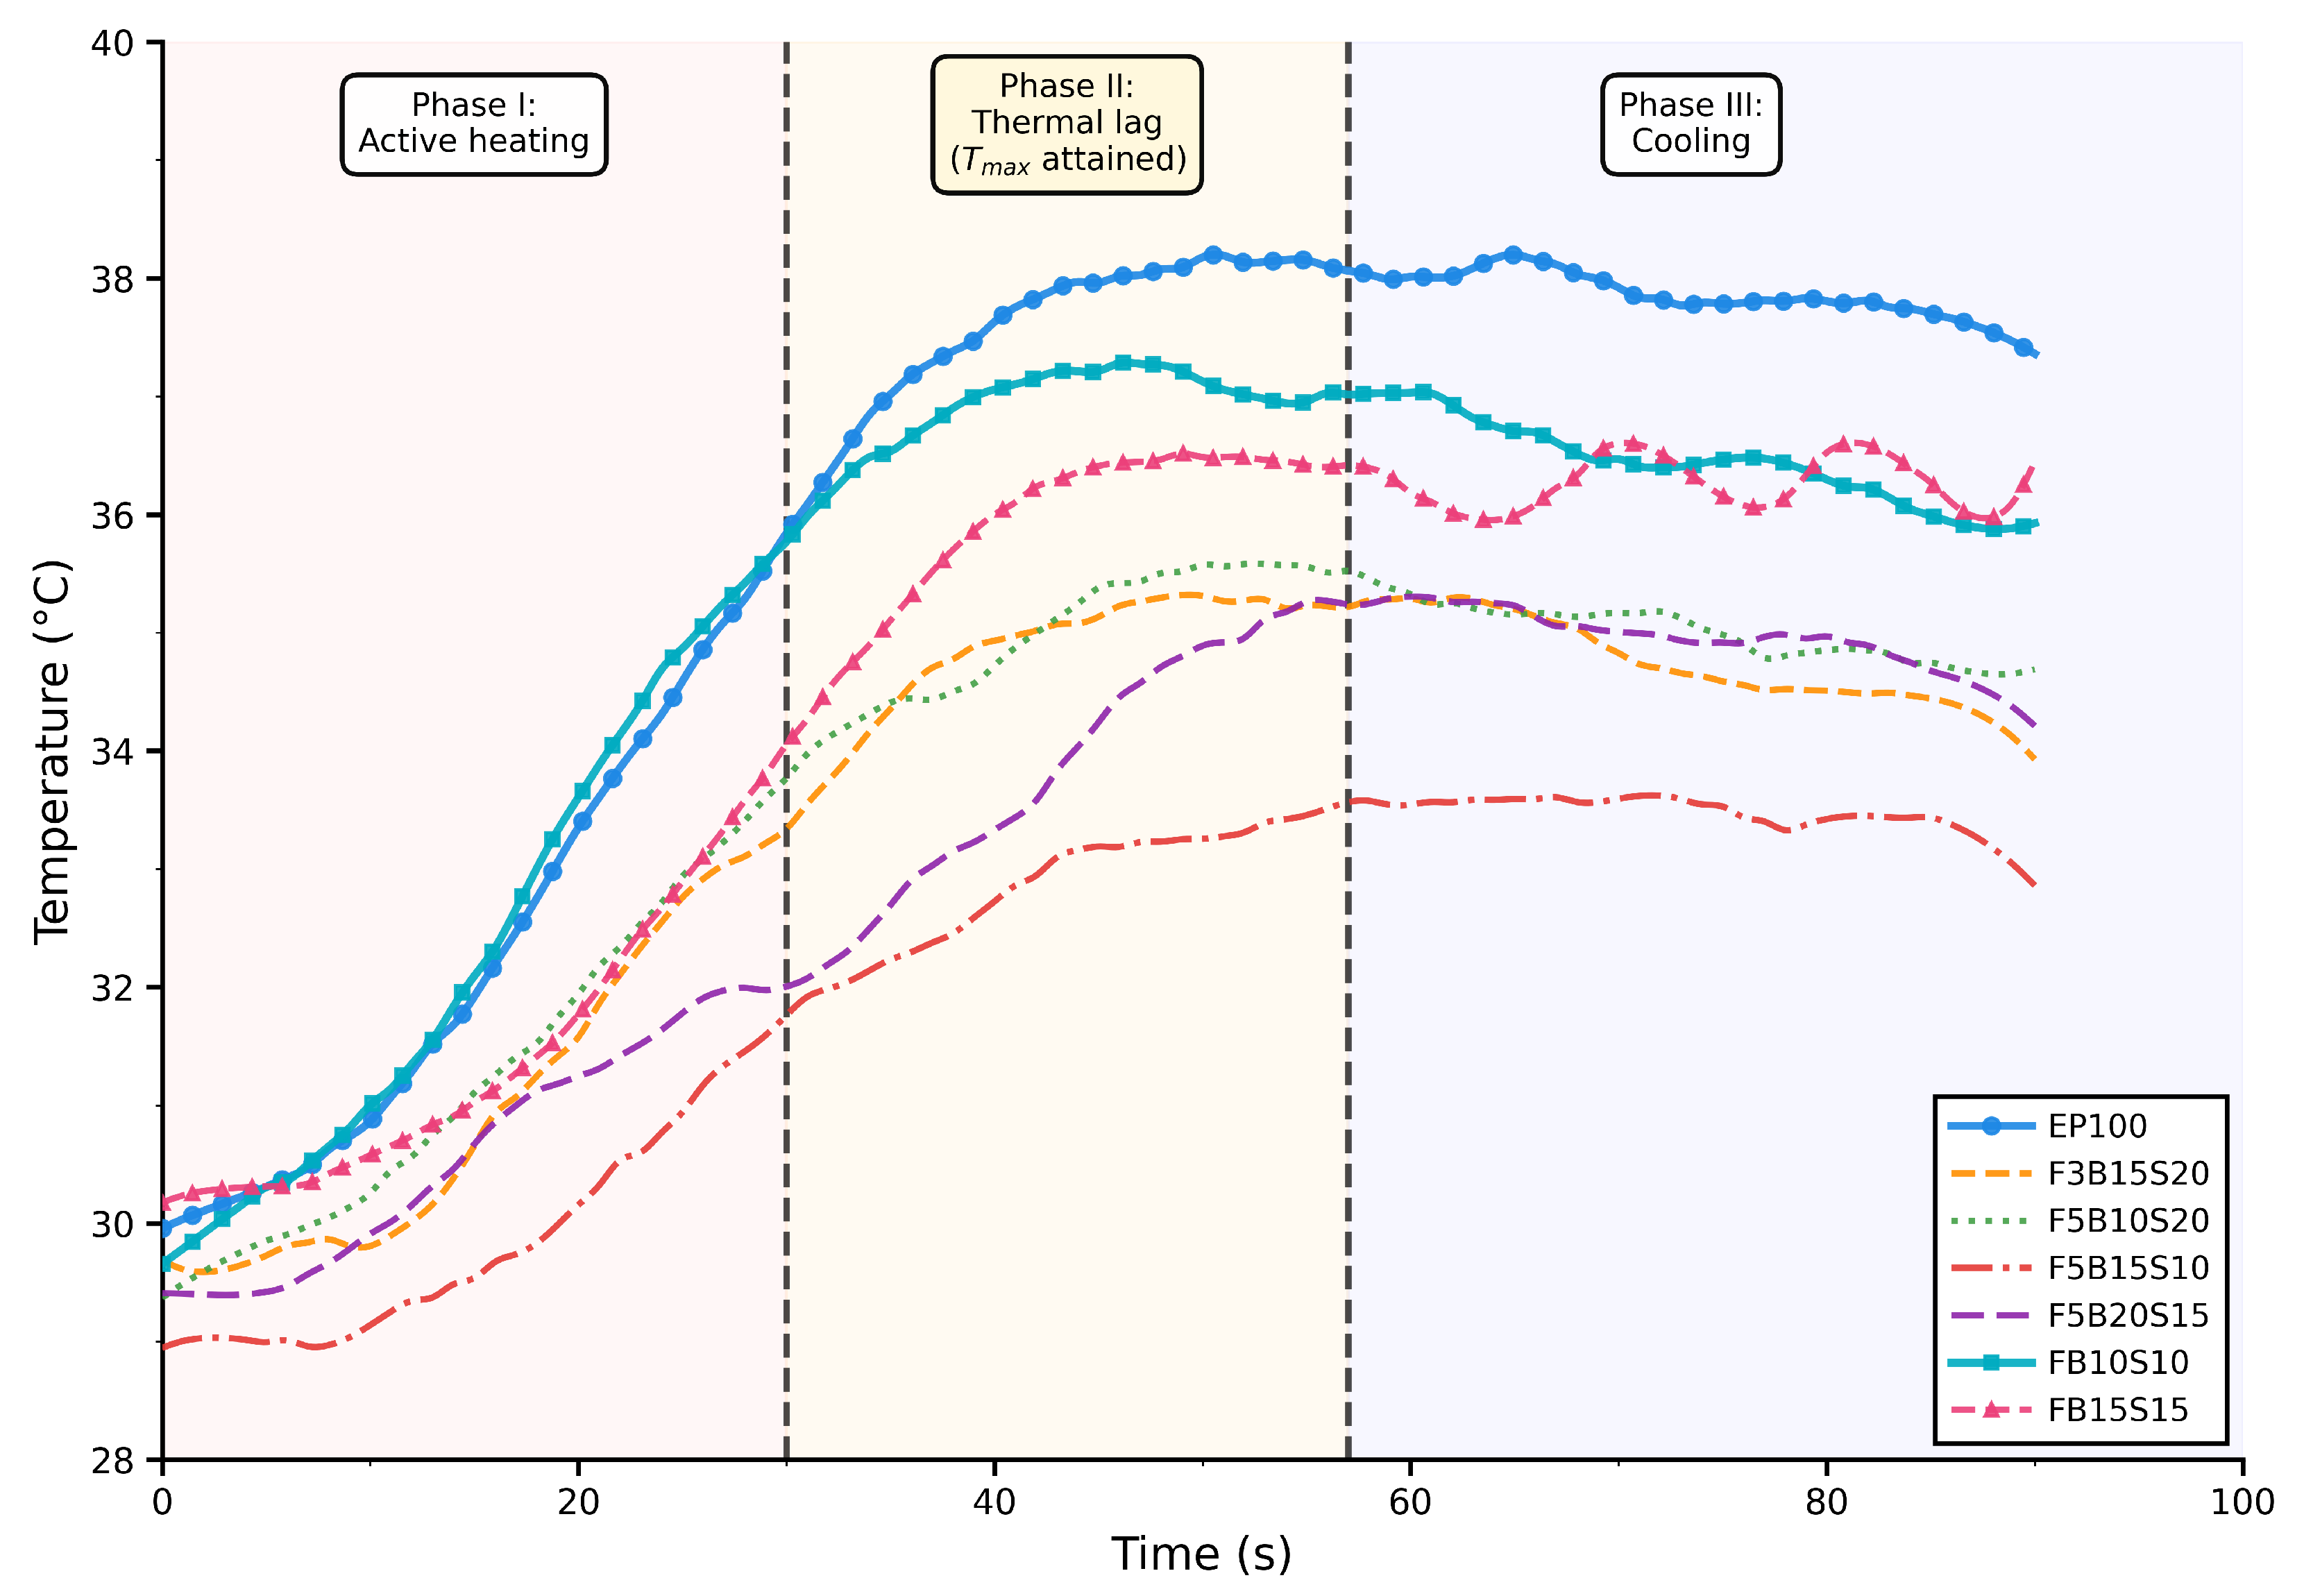
Figure 3.
Transient temperature–time response showing three distinct thermal phases: Phase I (active heating, 0–30 s), Phase II (thermal lag, 30–57 s), and Phase III (natural cooling, 57–90 s). Vertical dashed lines mark phase boundaries at s (heating cessation) and s (average attainment). Temperature curves were smoothed using Savitzky–Golay filtering (window = 11, order = 3) combined with cubic spline interpolation for visual clarity only. All statistical analyses used raw unsmoothed data (see Section 2.4). The thermal-lag phase shows composition-dependent behavior, with occurring between 46 s (FB10S10) and 73 s (FB15S15).
2.5. Thermographic Metric Extraction
To enable quantitative comparison of composite thermal behavior, characteristic parameters were extracted from the temperature–time profiles obtained during the 90 s thermal cycle. The initial temperature was the surface temperature at s. The temperature at the end of the heating stage was denoted , corresponding to s. The maximum temperature attained during the full thermal cycle was , and the temperature at the end of cooling was . Due to thermal inertia in the low-conductivity biocomposite plates, was typically attained 5–15 s after the cessation of active heating ( s), as residual heat continued to diffuse from the heated surface into the bulk. Consequently, for all tested configurations. Heating-stage metrics were calculated based on rather than to maintain consistency with the defined 30 s heating interval, as specified in Equations (1) and (2).
Heating-stage metrics were calculated as follows:
where represents the temperature rise during heating and is the average heating rate over the 0–30 s interval.
Cooling-stage behavior was quantified using the following:
where represents the temperature drop during cooling and is the average cooling rate over the 30–90 s interval. Residual heat retention after cooling was characterized by the ratio:
where indicates efficient cooling with return to ambient temperature, and indicates poor cooling with significant heat retention. By definition, ranges between 0 and 1, with higher values indicating greater residual heat retention after 60 s of natural cooling. All metrics were extracted from triplicate measurements ( per configuration), and mean ± standard deviation values are reported.
2.6. Statistical Analysis
Thermographic metrics including , , , and were compared across composite configurations using one-way analysis of variance (ANOVA). The ANOVA model tested the null hypothesis that the mean values were equal across all seven composite groups:
The F-statistic and the associated p-value were evaluated at a significance level of . Prior to ANOVA, the underlying assumptions were assessed. Homogeneity of variance was evaluated using Levene’s test, and independence was ensured through randomized replicate measurement. Given the small replicate number (), the Shapiro–Wilk test has negligible power to detect departures from normality; the normality assumption could therefore not be meaningfully verified. For this reason, exact permutation tests and non-overlapping 95% confidence intervals were adopted as the primary inferential basis for specimens affected by the display-resolution limit. When ANOVA indicated a statistically significant effect, post hoc pairwise comparisons were performed against the EP100 reference using independent-samples t-tests. To control the family-wise error rate across 21 pairwise comparisons, Bonferroni correction was applied, yielding an adjusted threshold of . Correction for 21 comparisons is conservative at this sample size. The adjusted threshold protects against family-wise error but reduces statistical sensitivity. The reported significant effects therefore represent a conservative lower bound on the compositional differences rather than a complete account.
Effect sizes were quantified using Cohen’s d:
where denotes the pooled standard deviation of the two groups. Effect sizes were interpreted as small (), medium (), and large (). Because several specimens exhibit zero within-group variance arising from the 0.1 °C display resolution of the FLIR One Pro LT app, the pooled standard deviation in Equation (7) becomes undefined for those comparisons. Glass’s , which uses the EP100 reference-group standard deviation as the denominator, was therefore reported in place of Cohen’s d to provide a finite and consistent effect-size measure across all configurations. For samples exhibiting zero within-group variance, conventional t-test statistics could not be computed. In these cases, statistical significance was determined using exact permutation tests and confirmed by non-overlapping 95% confidence intervals, rather than conventional t-tests. All statistical analyses were performed using Python (SciPy 1.11).
3. Results
3.1. Temperature–Time Evolution
Figure 3 shows the transient surface-temperature evolution of all composite configurations subjected to localized convective heating. The thermal loading consisted of a 30 s heating phase followed by 60 s of natural cooling, giving a total observation period of 90 s.
During the heating phase (0–30 s), the surface temperature rose in two stages: a slower initial rise over approximately the first 10 s, reflecting surface thermal inertia before quasi-steady convective heating was established, followed by a steeper and nearly linear rise through the remainder of the heating interval. The initial surface temperatures () were comparable across specimens, indicating consistent ambient conditions and a repeatable test setup. The neat epoxy reference (EP100) showed the highest temperature rise during heating and reached the maximum peak temperature among all configurations. Hybrid fiber composites exhibited comparatively lower peak temperatures. Among the reinforced composites, F5B15S10 showed the lowest peak temperature, indicating enhanced resistance to rapid thermal accumulation. F5B15S10 contains 5 wt% filler with 15 wt% banana and 10 wt% bagasse fibers (25 wt% total fiber loading). Despite a moderate fiber content, this configuration achieved superior thermal resistance, suggesting that 5 wt% filler combined with a balanced banana–bagasse ratio provides optimal heat-absorption mitigation. In contrast, F3B15S20 (3 wt% filler, 15 wt% banana, 20 wt% bagasse; 35 wt% total fiber) has the highest total fiber content but lower filler concentration, resulting in an intermediate peak temperature. These observations indicate that filler incorporation is the dominant factor governing peak-temperature reduction, with fiber architecture playing a secondary role.
Following the cessation of heating at 30 s, a distinct thermal-lag phase (Phase II, 30–57 s) was observed for all specimens. During this phase, the surface temperature continued to increase despite the removal of the external heat source, as residual thermal energy diffused from the heated surface into the cooler bulk. This phenomenon is characteristic of low-thermal-diffusivity materials. The time to reach maximum temperature () varied across compositions, ranging from 46 s (FB10S10) to 73 s (FB15S15), with an average of 57 s. The phase boundary at s therefore denotes the across-specimen average attainment time and is used for visual reference only; all cooling-stage metrics (Equations (3)–(5)) were computed from each specimen’s own measured and its time of attainment, not the fixed 57 s value. Fiber-only systems exhibited the largest variation (27 s range), whereas filler-containing composites showed more consistent behavior (15 s range). This indicates that particulate filler incorporation moderates thermal-lag duration. The extended thermal lag observed in low-conductivity biocomposites is characteristic of materials with high volumetric heat capacity and limited through-thickness thermal diffusivity, which delays peak-temperature attainment following surface heating [24,38].
Following attainment, Phase III (natural cooling, 57–90 s) displayed non-linear temperature decay characteristic of first-order thermal dissipation. The epoxy plate exhibited a relatively slower cooling trend compared with several hybrid composites, as evidenced by a higher residual temperature at 90 s. Conversely, certain hybrid configurations showed more pronounced temperature reduction during the cooling stage. Similar volumetric and thermal signatures during cyclic loading were reported by Candau et al. [39] in carbon-black-reinforced rubber composites, supporting the interpretation that filler–matrix interactions modulate transient thermal response. The overall temperature–time behavior confirms that fiber and filler incorporation modify the transient heat-absorption and heat-dissipation characteristics of the composite. The two-stage heating rise and exponential cooling decay provide a suitable basis for extracting quantitative thermographic parameters such as heating rate, cooling rate, and ratio. Representative infrared thermographic images at critical time points are shown in Figure 2. All specimens exhibited temperature elevation at the center region during the heating ( s) and thermal-lag ( s) phases. Visual comparison at peak temperature ( s, center column) shows lower thermal intensity in the filler-containing composites F5B15S10 and F3B15S20 (Figure 2b,c) compared with the EP100 reference (Figure 2a). Thermal images provide qualitative visual support for the compositional effects quantified in Table 2 and Table 4.
3.2. Peak Temperature and Heating-Stage Analysis
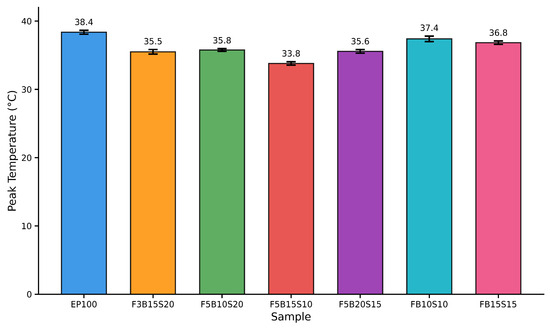
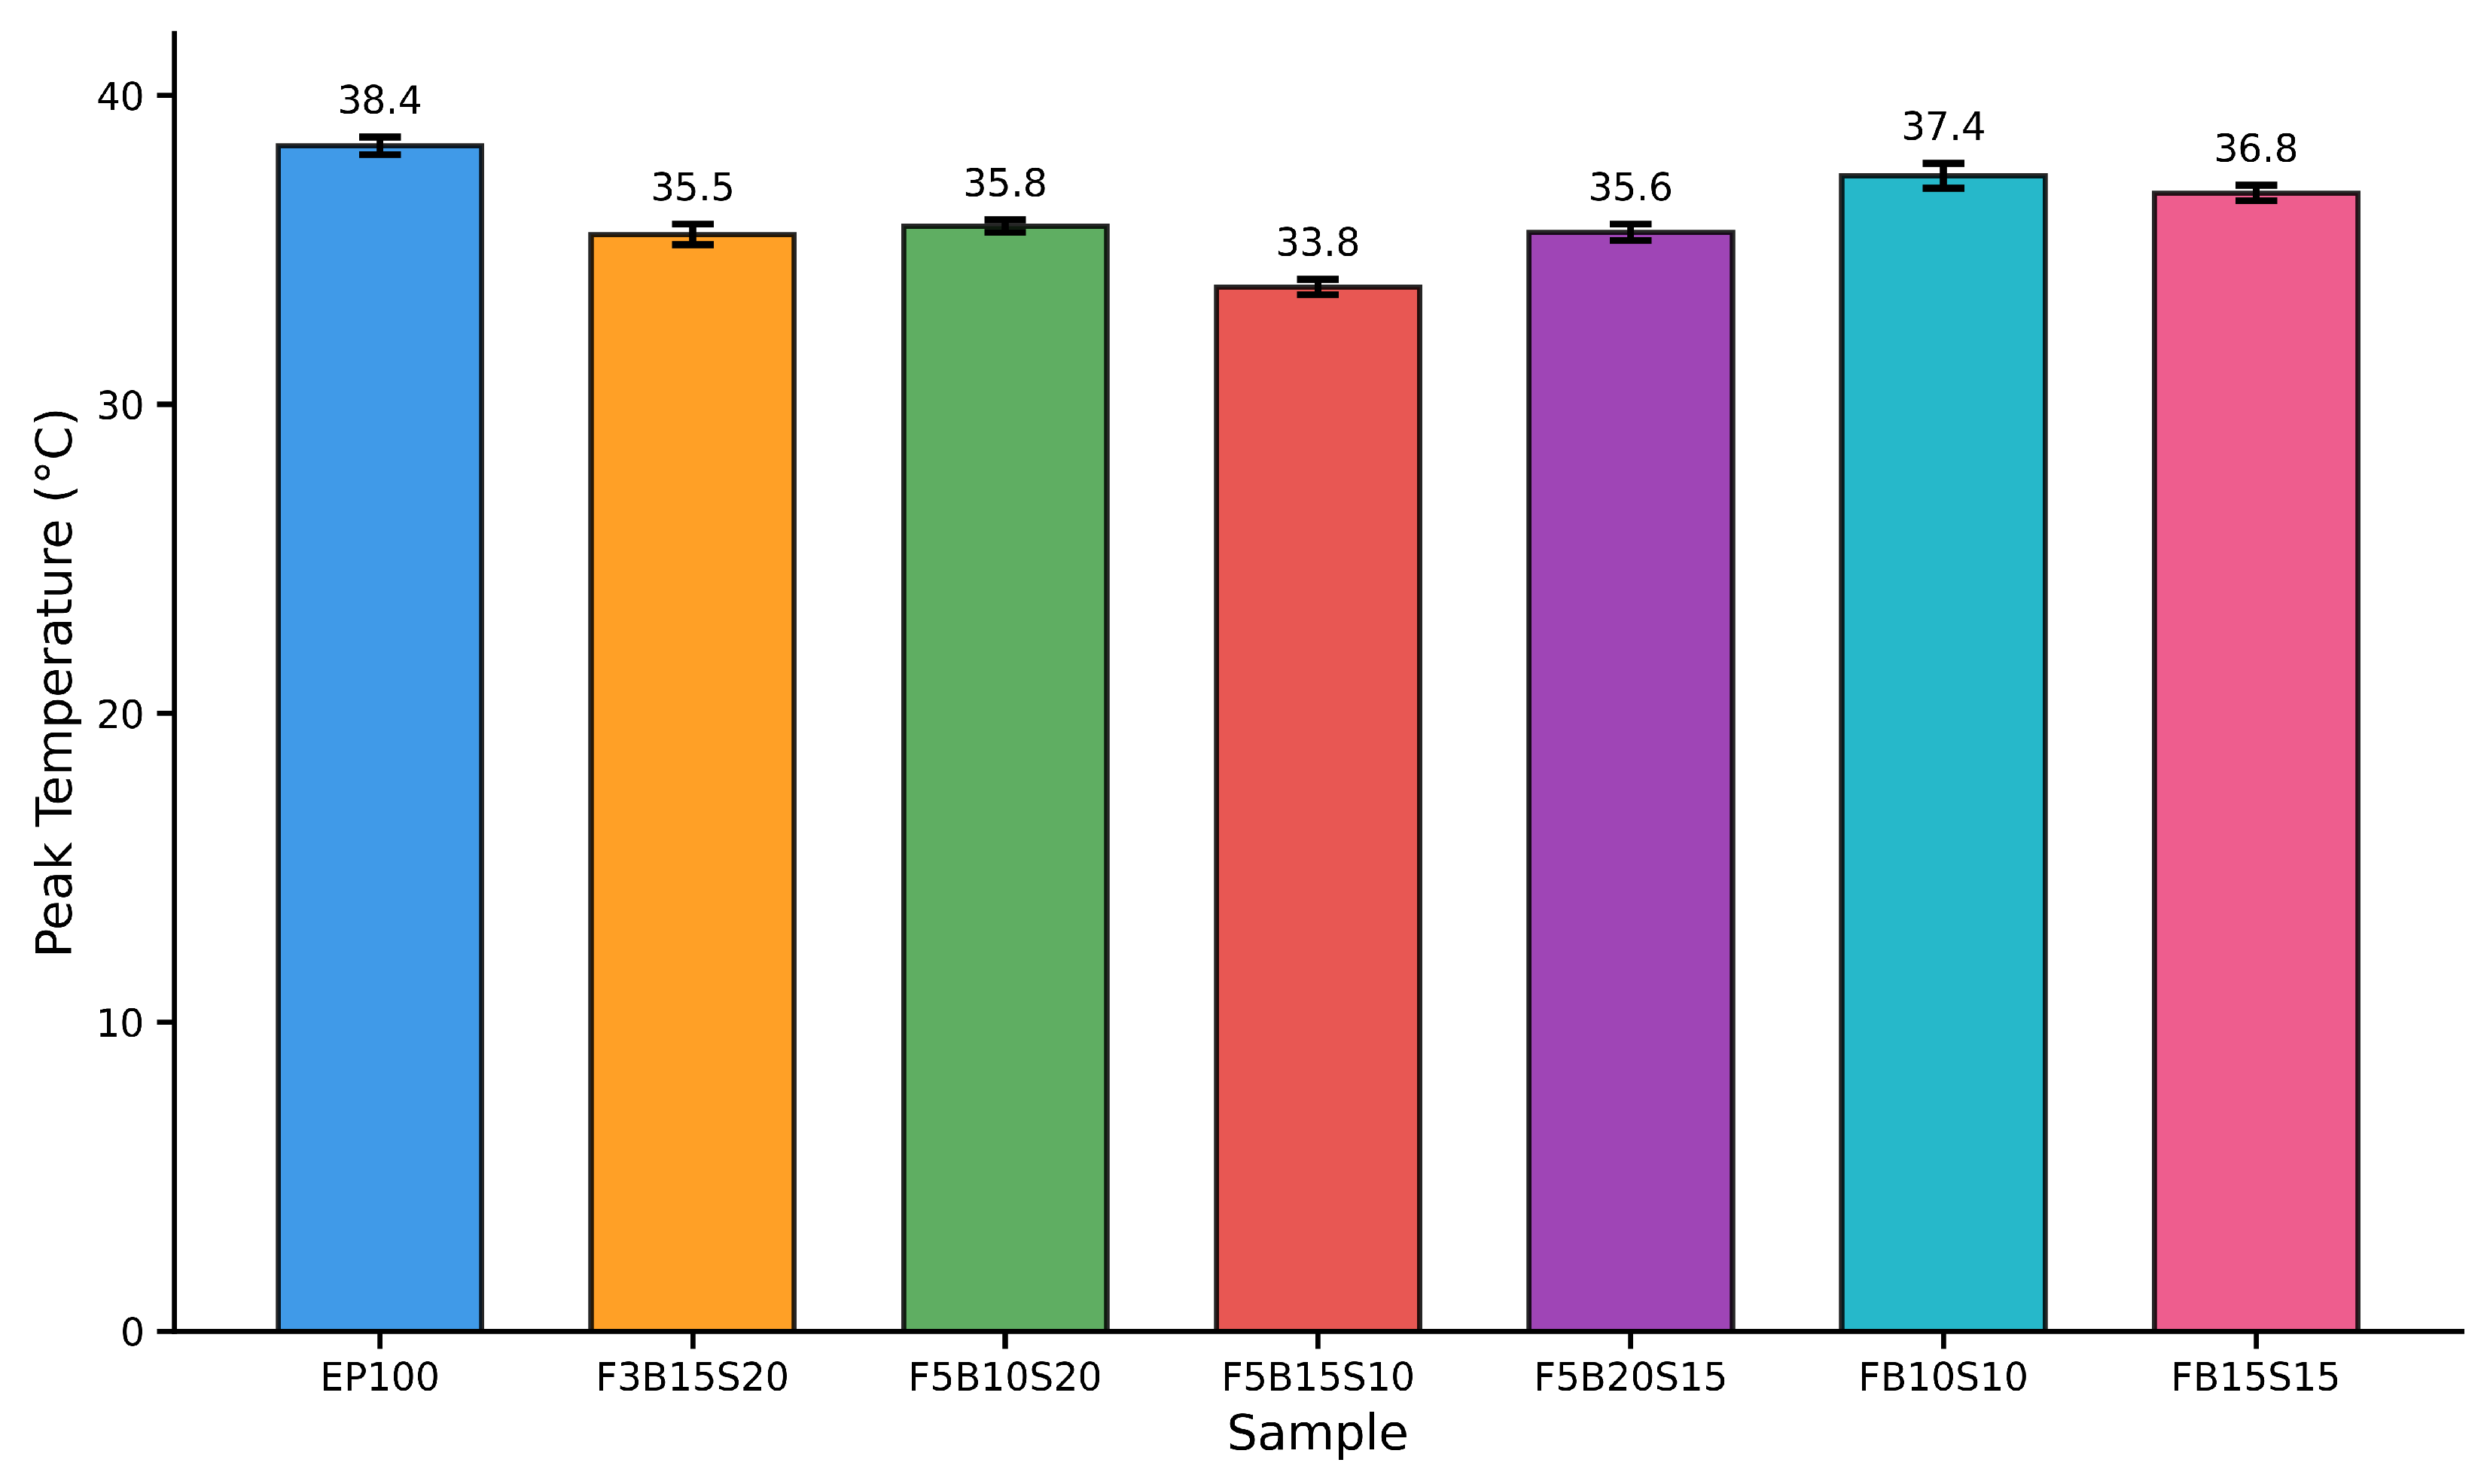
The heating stage (0–30 s) characterizes the transient heat-absorption behavior of the composite systems under convective exposure. The extracted heating-stage metrics are summarized in Table 2, and the maximum temperature attained during the thermal cycle () is compared in Figure 4.
Figure 4.
Maximum surface temperature attained during the thermal cycle for all composite configurations and the neat epoxy reference.
The neat epoxy reference (EP100) exhibited the highest temperature at the end of heating ( °C) and the highest maximum temperature ( °C). Among the hybrid composites, FB10S10 and FB15S15 reached intermediate end-of-heating temperatures ( °C and °C, respectively). In contrast, F5B15S10 demonstrated the lowest end-of-heating temperature ( °C) and the lowest maximum temperature ( °C). The remaining configurations (F3B15S20, F5B10S20, F5B20S15) exhibited values in the range of 35.50–35.77 °C. The reduction in maximum temperature relative to EP100 ranged from approximately 1.0 to 4.57 °C depending on composition, with the largest reduction observed for F5B15S10. These observations indicate improved resistance to transient thermal loading in filler-containing hybrid composites.
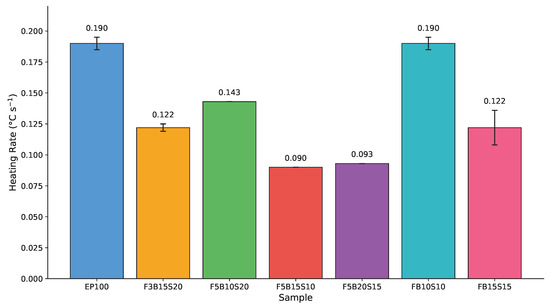
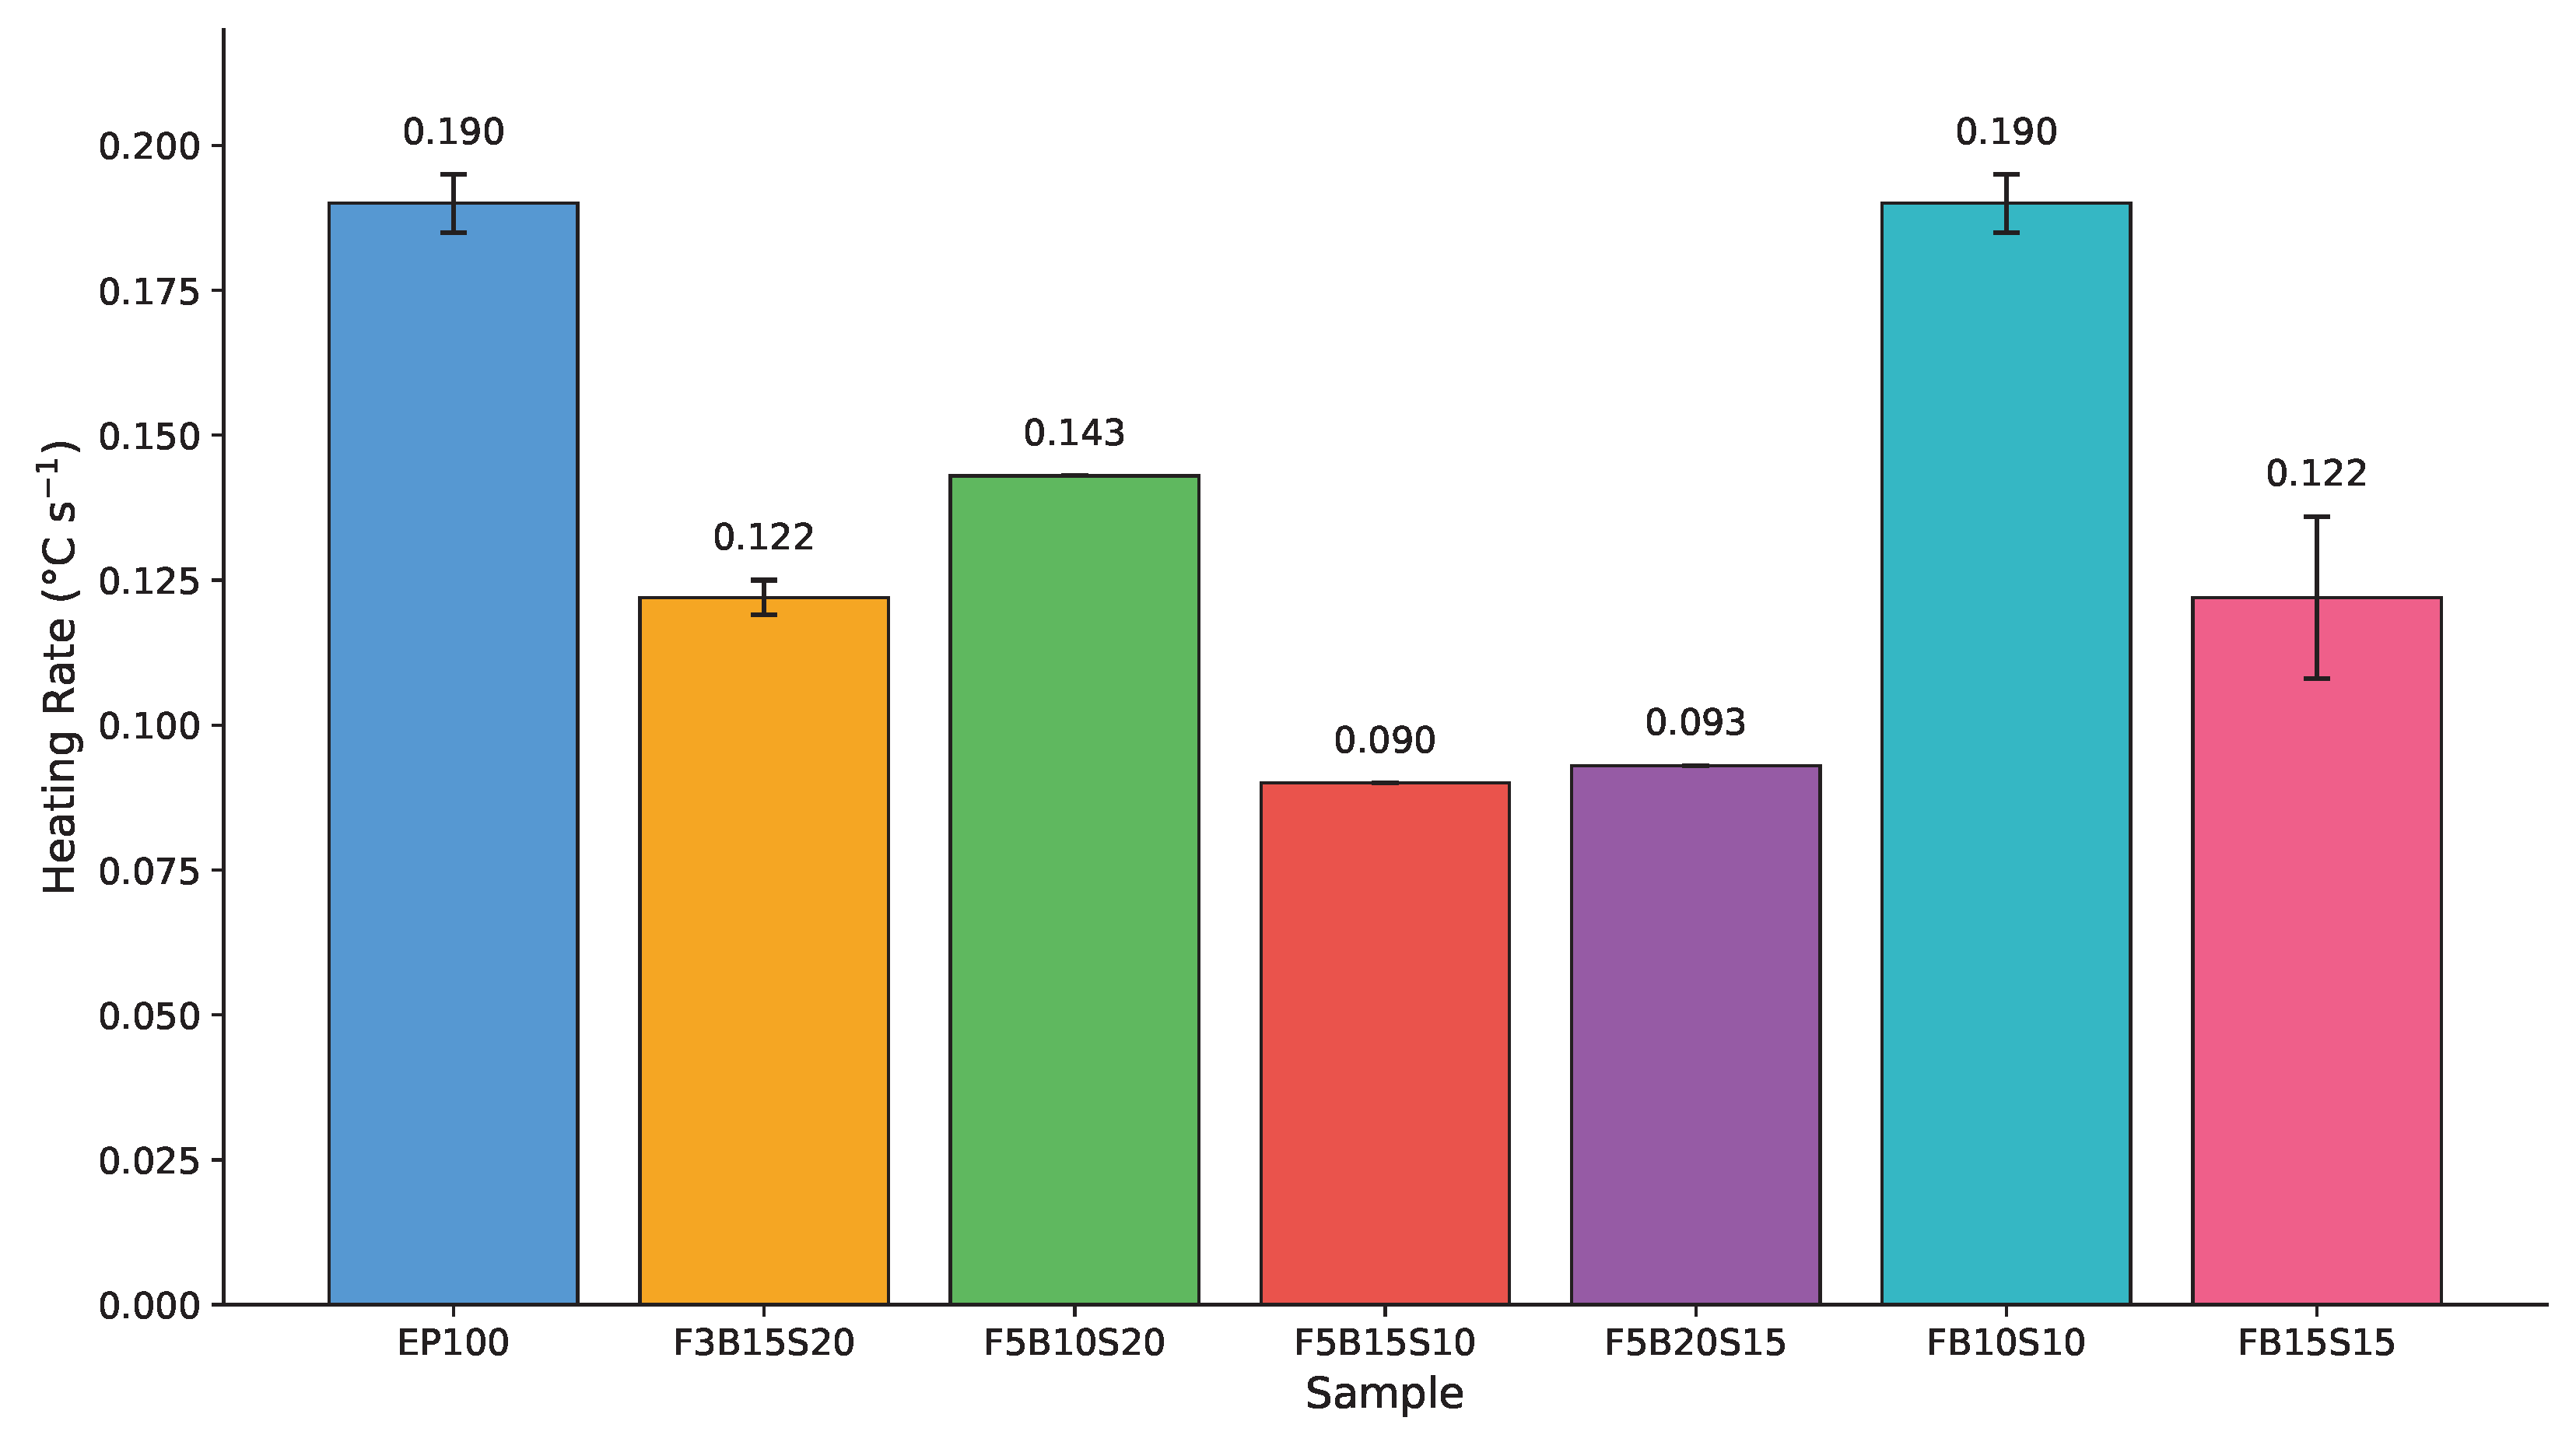
Heating-stage temperature rise and average heating rate further clarify the transient response (Table 2, Figure 5). EP100 exhibited a heating rate of 0.190 ± 0.005 °C s−1, reflecting a rapid temperature increase under direct convective exposure. Hybrid composites consistently showed moderated heating rates. The lowest value was recorded for F5B15S10 ( °C s−1), corresponding to the smallest temperature rise during the 30 s heating interval.
Figure 5.
Average heating rate during the heating phase (0–30 s) for all composite configurations.
The reduced heating rates observed in fiber- and filler-modified composites are consistent with altered effective thermal-transport behavior within the composite. Because only surface temperature was measured, the underlying mechanism cannot be uniquely identified. At least three effects may contribute: increased volumetric heat capacity associated with the calcium-carbonate-rich filler, which raises the energy required to elevate surface temperature; reduced through-thickness thermal diffusivity, which slows the surface-temperature rise during the heating pulse; and differences in surface emissivity between compositions, which affect the infrared-measured temperature itself (Section 3.5). These effects cannot be separated using surface-temperature data alone, and the proposed disruption of heat-propagation pathways is therefore presented as a hypothesis consistent with the observations rather than as a confirmed mechanism. Comparable microstructure-driven thermal heterogeneity has been reported at the ply-scale in CFRTP tapes [24].
3.3. Statistical Validation of Compositional Differences
To determine whether the observed differences in heating rate were statistically significant, a one-way ANOVA was conducted on values. The analysis revealed a highly significant effect of composite composition on heating rate (, ), confirming that the differences observed among configurations exceed experimental variability. Post hoc comparisons against the EP100 reference using Bonferroni correction (Table 3) showed that all filler-containing composites (F5B15S10, F5B20S15, F5B10S20, F3B15S20) exhibited statistically significant reductions in (). In contrast, the fiber-only configuration FB10S10 showed a heating rate identical to that of EP100 (), indicating that fiber reinforcement alone without filler incorporation does not alter heating-stage thermal resistance. The FB15S15 configuration showed a reduction in , but this difference did not meet the Bonferroni-adjusted threshold, indicating a moderate effect.
Table 3.
Statistical comparison of heating rates relative to the EP100 reference.
Effect-size analysis using Glass’s indicated large practical differences for all filler-containing systems, with ranging from 9.4 (F5B10S20) to 20.0 (F5B15S10) relative to EP100. Given the limited replicate number (), these magnitudes should be interpreted as indicative rather than precise. All samples containing 3–5 wt% filler showed significant reduction versus EP100 (), confirming the efficacy of mineral filler addition for moderating peak temperature. Notably, F5B15S10 and F5B20S15 (both containing 5 wt% filler) achieved comparable peak-temperature reductions of 4.57 °C and 2.80 °C below EP100, respectively, despite different fiber architectures (15%/10% versus 20%/15% banana/bagasse ratios). This further supports the conclusion that filler content dominates the heating-stage response, with fiber configuration exerting a secondary influence. These results confirm that filler incorporation is the dominant factor governing the reduction in peak temperature under transient convective loading.
3.4. Cooling Behavior and Thermal Retention Characteristics
Following termination of heating at 30 s, all composites exhibited non-linear temperature decay during the 30–90 s interval, characteristic of transient natural cooling. The cooling-stage metrics are summarized in Table 4. Compositional analysis provides insight into cooling-stage behavior. F3B15S20 (3 wt% filler, 35 wt% total fiber—the highest fiber loading among all samples) demonstrated the most efficient heat dissipation (, °C s−1). This suggests that high fiber content, despite lower filler concentration, enhances cooling-stage thermal transport through the heterogeneous fiber network. Natural fibers create winding heat-flow paths, with fiber–matrix boundary resistance (Kapitza resistance) contributing 40–60% of the total thermal resistance in randomly oriented fiber composites [40]. Conversely, FB15S15 (30 wt% total fiber, 0 wt% filler) retained the most residual heat (), indicating that fiber-only systems without particulate filler exhibit comparatively poor thermal-recovery characteristics.
Table 4.
Cooling-stage thermographic metrics (mean ± SD, ).
Because is defined using both and , and both vary across specimens, a sensitivity analysis was performed to confirm that the ranking is not an artifact of variation. The ratio was recomputed for all configurations using a fixed reference ambient temperature ( °C, the mean initial temperature across all specimens) in place of each specimen’s individual (Table 5). The ranking was preserved: F3B15S20 retained the lowest and FB15S15 the highest, with the intermediate ordering unchanged. The measured spread (1.17 °C) is small relative to the spread (4.57 °C), confirming that the ranking is governed by cooling-stage response rather than by initial-temperature variation.
Table 5.
Sensitivity of the thermal retention ratio () to initial-temperature variation. uses each specimen’s individual ; uses a common reference °C.
The ratio highlights differences in residual heat storage after 60 s of cooling. FB15S15 exhibited the highest (), indicating comparatively greater heat retention. EP100 showed moderate retention (). In contrast, F3B15S20 demonstrated the lowest () and the highest cooling rate, indicating more rapid thermal recovery. Intermediate behavior was observed for F5B10S20, FB10S10, F5B15S10, and F5B20S15, with values between 0.79 and 0.81. A lower corresponds to more effective heat dissipation during cooling. F3B15S20 therefore demonstrated the most efficient post-heating thermal recovery among the evaluated composites, whereas FB15S15 retained heat for a comparatively longer duration. These findings indicate that compositional modification influences not only the peak-temperature response but also cooling-stage recovery behavior.
3.5. Measurement Uncertainty and Repeatability
Infrared thermography measurements are influenced by emissivity estimation, ambient convection, and ROI positioning [17,20]. A single emissivity value () was applied across all compositions and was not individually calibrated per specimen. Because all specimens were measured under identical optical, emissivity, and acquisition conditions, systematic radiometric offsets affect all compositions equally and largely cancel in the relative comparison; the protocol was therefore applied as a comparative screening tool rather than a source of absolute, traceable temperatures. All composites were evaluated under identical experimental conditions, allowing reliable comparative assessment. The repeatability analysis (Table 6) shows good measurement stability. The standard deviation of ranged from 0.25 to 0.50 °C, corresponding to coefficients of variation below 1.5% for all configurations. This variability is substantially smaller than the observed compositional differences (1–5 °C), confirming the robustness of the experimental methodology for comparative screening. The low experimental scatter validates the statistical comparisons performed using ANOVA and supports the reliability of the reported thermal-performance trends.
Table 6.
Experimental repeatability of peak-temperature measurements ().
4. Discussion
4.1. Integrated Transient Thermal Performance
A comparison of heating and cooling metrics reveals that peak-temperature reduction and cooling efficiency are not strictly proportional. For example, F5B15S10 achieved the lowest and one of the lowest heating rates, indicating strong resistance to initial heat accumulation. However, its value (0.792) indicates moderate residual heat retention relative to F3B15S20. Conversely, F3B15S20 did not achieve the lowest peak temperature but demonstrated the most efficient cooling behavior, as reflected by the lowest and the highest cooling rate. This distinction suggests that compositional parameters influence heat absorption and heat dissipation through partially independent mechanisms. Similar decoupling between heat-absorption and heat-dissipation pathways has been observed in nanocomposites where the heat-release response is filler-dominated [10], and in filled rubber composites where cyclic thermal signatures arise from filler–matrix interface dynamics [39]. Evaluation of both heating-stage and cooling-stage metrics is therefore necessary for comprehensive transient thermal characterization.
4.2. Composition–Property Trends
Analysis of the compositions reveals clear structure–property relationships governing the transient thermal response. All filler-containing composites (3–5 wt% conch shell) demonstrated statistically significant reduction compared with neat epoxy (Table 3). These trends indicate that filler incorporation is associated with reduced peak temperature under transient convective loading; the intrinsic-property basis of this association remains to be confirmed by direct thermal-property measurement. Among filler-containing samples, F5B15S10 (5 wt% filler, 25 wt% total fiber) achieved the lowest end-of-heating temperature ( °C) and the lowest heating rate ( °C s−1), despite not having the highest fiber loading. This indicates an optimal balance between filler concentration and fiber architecture for suppressing rapid temperature rise.
The selection of F5B15S10 as the optimal heating-resistance configuration is based on the combined heating-stage metrics rather than alone. At equal filler content (5 wt%), F5B15S10 (25 wt% total fiber) achieved a lower (33.80 °C versus 35.57 °C), a lower , and a lower heating rate ( versus °C s−1) than F5B20S15 (35 wt% total fiber). The greater peak-temperature reduction at lower total fiber content indicates that filler content, rather than fiber loading, governs the heating-stage response, consistent with the secondary role of fiber architecture identified throughout. F3B15S20 has one of the highest fiber contents (3 wt% filler, 35 wt% total fiber) but lower filler concentration, resulting in intermediate thermal resistance (35.50 °C) yet superior cooling efficiency (lowest ).
Fiber-only systems (FB10S10, FB15S15) showed minimal thermal-resistance enhancement during heating. FB10S10 was statistically indistinguishable from neat epoxy (, Table 3), while FB15S15 showed a reduction in heating rate that did not meet the Bonferroni-corrected significance threshold ( vs. threshold ). This confirms that filler incorporation is the dominant factor governing peak-temperature reduction under transient convective loading, while fiber architecture primarily influences cooling-stage behavior.
The contrasting performance of F5B15S10 (optimal heating resistance) and F3B15S20 (optimal cooling efficiency) represents two distinct design strategies. Moderate filler content with balanced fiber ratios (F5B15S10) suits applications requiring peak-temperature suppression under sustained thermal exposure, whereas high fiber content with modest filler loading (F3B15S20) benefits applications requiring rapid thermal cycling and efficient heat dissipation. The composition–property relationships reported here are established at the level of bulk filler and fiber weight fraction; the underlying particle-scale and interfacial mechanisms were not resolved in the present screening study.
4.3. Comparison with Reported Thermographic Studies
The protocol developed in this study extends active-thermography practice in composites from a defect-detection role [18,19,21,22,23] to a quantitative comparative screening role for bulk transient thermal response. Recent JCS work on damaged composite inspection by combined active thermography and digital shearography [21], defect identification in ceramic composites using laser-line scanning thermography [22], and microstructure-driven ply-scale thermal response in CFRTP tapes [24] confirms active thermography as a versatile and increasingly quantitative composite-characterization tool. The present approach uses a substantially lower-cost FLIR One Pro LT instrument and a simple convective excitation, trading absolute precision for rapid (<2 min per specimen) comparative ranking suitable for formulation screening.
4.4. Study Limitations
The present study has several acknowledged limitations, grouped into instrumentation, statistical, and characterization factors.
First, regarding instrumentation, thermal imaging was performed with a smartphone-attached FLIR One Pro LT camera, whose 0.1 °C app-level display resolution introduces quantization in the reported variance values. A fixed emissivity () was applied without per-composition calibration, and the infrared-derived temperatures were not cross-validated against contact measurements. The convective source temperature was set rather than continuously monitored. Raw radiometric export at full sensor precision and contact-thermocouple cross-validation on representative specimens (EP100 and F5B15S10) are recommended to confirm absolute accuracy; the present conclusions are accordingly restricted to comparative surface-temperature screening.
Second, regarding statistics, the triplicate replication () limits the strength of effect-size inferences. The original plates were consumed during the test campaign, and expanded replication could not be performed within the revision period. The present results are therefore reported as a screening-level finding, in which the large effect magnitudes relative to the low experimental scatter (CV , Table 6) support the comparative ranking, pending confirmation with in future work.
Third, regarding material characterization, the surface-temperature interpretation assumes a small through-thickness Biot number, which was estimated but not measured. The chemical composition, particle morphology, filler dispersion, surface finish, residual fiber moisture, and fiber/filler/matrix interface were not characterized. Independent thermal-property measurement (transient plane source or differential scanning calorimetry), scanning electron microscopy with energy-dispersive spectroscopy, profilometry, and gravimetric moisture determination are recommended to resolve the particle-scale and interfacial mechanisms governing the observed thermal behavior.
Despite these limitations, the protocol provides a rapid and reproducible comparative screening method whose conclusions are supported by ANOVA-validated effect magnitudes substantially exceeding the experimental scatter.
5. Conclusions
The transient thermal response of hybrid natural-fiber-reinforced epoxy composites with conch shell filler was evaluated using active infrared thermography under a standardized 30 s heating and 60 s cooling protocol. The thermal response exhibited three distinct phases: active heating (0–30 s), thermal lag (30–57 s), and natural cooling (57–90 s), where 57 s is the average time of maximum-temperature attainment across all configurations.
Conch shell filler incorporation (3–5 wt%) was the dominant factor governing peak-temperature reduction, with F5B15S10 (5 wt% filler, 25 wt% total fiber) achieving the lowest heating rate (0.090 °C s−1, a 53% reduction versus neat epoxy) and the lowest maximum temperature (33.80 °C). Statistical analysis confirmed significant compositional effects (ANOVA, ), with all filler-containing systems demonstrating reduced thermal response versus the epoxy reference. However, heating resistance and cooling efficiency are governed by partially independent mechanisms: F3B15S20 (3 wt% filler, 35 wt% total fiber) exhibited the most efficient cooling (), indicating that fiber content primarily governs post-heating thermal dissipation. This decoupling enables tailored material design, in which filler-rich compositions support peak-temperature suppression while fiber-rich compositions favor rapid thermal recovery. Maximum temperature was attained during the thermal-lag phase at –73 s depending on composition (average 57 s), corresponding to a thermal-lag duration of 16–43 s beyond the cessation of active heating at s. Fiber-only systems exhibited greater variability in lag duration than filler-containing composites, indicating enhanced thermal homogeneity in the hybrid systems with particulate filler. Active infrared thermography was established as a rapid (<2 min per specimen) non-destructive screening tool for the transient thermal characterization of biocomposites. This study indicates that the proposed transient thermographic protocol provides a valuable reference to thermal management design of hybrid biocomposites in automotive interior and building envelope applications. These challenges can be addressed by introducing contact-thermocouple cross-validation, independent through-thickness conductivity and specific-heat measurement, expanded replication, and long-term thermal cycling stability evaluation, which will be the focus of our next research.
Author Contributions
Conceptualization, B.P. and G.D.; methodology, B.P. and P.P.; software, C.G.M.A.; validation, P.P., B.P. and C.G.M.A.; formal analysis, P.P.; investigation, P.P. and B.P.; resources, B.P. and M.S.; data curation, C.G.M.A.; writing—original draft preparation, P.P. and G.D.; writing—review and editing, B.P. and M.S.; visualization, P.P.; supervision, B.P. and M.S.; project administration, M.S.; funding acquisition, M.S. All authors have read and agreed to the published version of the manuscript.
Funding
This research was funded by King Mongkut’s University of Technology North Bangkok and the National Science, Research and Innovation Fund (NSRF) under Contract No. KMUTNB-Post-69-08 and Project No. KMUTNB-FF-69-B-03.
Institutional Review Board Statement
Not applicable. This study did not involve human participants or animal subjects.
Informed Consent Statement
Not applicable.
Data Availability Statement
The raw thermographic temperature–time data and representative thermal video files supporting the findings of this study are publicly available in Mendeley Data at https://doi.org/10.17632/4fgtzdtbth.1 (version 1).
Acknowledgments
The authors acknowledge King Mongkut’s University of Technology North Bangkok and Easwari Engineering College for providing the facilities and technical support required for this research.
Conflicts of Interest
The authors declare no conflicts of interest. The funders had no role in the design of the study; in the collection, analyses, or interpretation of data; in the writing of the manuscript; or in the decision to publish the results.
Abbreviations
The following abbreviations are used in this manuscript:
| ANOVA | Analysis of variance |
| CFRP | Carbon-fiber-reinforced polymer |
| CFRTP | Carbon-fiber-reinforced thermoplastic |
| CV | Coefficient of variation |
| FLIR | Forward looking infrared |
| ROI | Region of interest |
| SD | Standard deviation |
| TR | Thermal retention ratio |
References
- Jasmee, S.; Omar, G.; Othaman, S.S.C.; Masripan, N.A.; Hamid, H.A. Interface thermal resistance and thermal conductivity of polymer composites at different types, shapes, and sizes of fillers: A review. Polym. Compos. 2021, 42, 2629–2652. [Google Scholar] [CrossRef] [Scilit]
- Jagadeesh, D.; Sudhakara, P.; Prabhu, R.; Kumar, K.S. Experimental and numerical study of an overlay composite absorber plate material for a solar air heater. Mater. Test. 2021, 63, 681–686. [Google Scholar] [CrossRef] [Scilit]
- Arkuszyńska, A.; Rośkowicz, M. Effect of elevated temperature on load-bearing capacity and fatigue life of bolted joints in CFRP components. Polymers 2026, 18, 182. [Google Scholar] [CrossRef] [Scilit] [PubMed]
- Oliveira, T.L.L.; Silva, J.E.S.; Almeida, J.H.S.; Tita, V. The role of non-destructive testing of composite materials for aerospace applications. NDT 2025, 3, 3. [Google Scholar] [CrossRef] [Scilit]
- Erdem, S.; Gur, M.; Kaman, M.O. Effect of patch dimension and fiber orientation on nonlinear buckling of hybrid composites. Mater. Test. 2021, 63, 929–942. [Google Scholar] [CrossRef] [Scilit]
- Saha, S.; Das, S.; Rahman, M.Z. Hybridization in natural fiber composites: Enhanced performance and sustainability. Compos. Part B Eng. 2026, 308, 112986. [Google Scholar] [CrossRef] [Scilit]
- D’Andrea, D.; Salmeri, F.; Di Bella, G.; Totaro, M.; Risitano, G. Replacing glass with basalt in the vacuum infusion process of vinyl ester composite laminates: Effect on the mechanical performance and life cycle assessment (LCA). J. Compos. Sci. 2025, 9, 308. [Google Scholar] [CrossRef] [Scilit]
- Yadav, R.; Tirumali, M.; Wang, X.; Naebe, M.; Kandasubramanian, B. The role of fillers to enhance the mechanical, thermal, and wear characteristics of polymer composite materials: A review. Compos. Part A Appl. Sci. Manuf. 2023, 175, 107775. [Google Scholar] [CrossRef] [Scilit]
- Agustina, E.; Goak, J.; Lee, S.; Seo, Y.; Park, J.; Lee, N. Effect of graphite nanoplatelet size and dispersion on the thermal and mechanical properties of epoxy-based nanocomposites. Nanomaterials 2023, 13, 1328. [Google Scholar] [CrossRef] [Scilit] [PubMed]
- Shchegolkov, A.; Nachtane, M.; Stanishevskiy, Y.; Dodina, E.; Rejepov, D.; Vetcher, A. The effect of multi-walled carbon nanotubes on the heat-release properties of elastic nanocomposites. J. Compos. Sci. 2022, 6, 333. [Google Scholar] [CrossRef] [Scilit]
- Shamsuri, A.A.; Jamil, S.N.A.M.; Abu Zarin, M.; Mohamed Yusoff, M.Z. Effects of co-fillers on the tensile and hardness properties of polymer composites. Mater. Test. 2025, 67, 1409–1422. [Google Scholar] [CrossRef] [Scilit]
- Mahmood, M.A.; Hanim, M.A.A.; Amirudin, E.; Rahman, I.A.; Hassan, A.; Mohamad, D. Preparation and characterization of cockle shell aragonite nanocomposite porous 3D scaffolds for bone repair. Biochem. Biophys. Rep. 2017, 10, 237–251. [Google Scholar] [CrossRef] [Scilit] [PubMed]
- Amouzadi, A.; Shokrieh, M.M. Effects of size distribution and surface treatments of seashell particles on flexural properties of seashell/epoxy composites. Polym. Compos. 2025, 46, 9872–9890. [Google Scholar] [CrossRef] [Scilit]
- Parker, W.J.; Jenkins, R.J.; Butler, C.P.; Abbott, G.L. Flash method of determining thermal diffusivity, heat capacity, and thermal conductivity. J. Appl. Phys. 1961, 32, 1679–1684. [Google Scholar] [CrossRef] [Scilit]
- ASTM E1461-13; Standard Test Method for Thermal Diffusivity by the Flash Method. ASTM International: West Conshohocken, PA, USA, 2013.
- Giri, A.; Hopkins, P.E. A review of experimental and computational advances in thermal boundary conductance and nanoscale thermal transport across solid interfaces. Adv. Funct. Mater. 2020, 30, 1903857. [Google Scholar] [CrossRef] [Scilit]
- Mouahid, A. Infrared thermography used for composite materials. MATEC Web Conf. 2018, 191, 00011. [Google Scholar] [CrossRef] [Scilit]
- Chrysafi, A.P.; Athanasopoulos, N.; Siakavellas, N.J. Damage detection on composite materials with active thermography and digital image processing. Int. J. Therm. Sci. 2017, 116, 242–253. [Google Scholar] [CrossRef] [Scilit]
- Gu, J.-C.; Unjoh, S.; Naito, H. Detectability of delamination regions using infrared thermography in concrete members strengthened by CFRP jacketing. Compos. Struct. 2020, 245, 112328. [Google Scholar] [CrossRef] [Scilit]
- Gupta, R.; Mitchell, D.; Blanche, J.; Harper, S.; Tang, W.; Pancholi, K.; Baines, L.; Bucknall, D.; Flynn, D. A review of sensing technologies for non-destructive evaluation of structural composite materials. J. Compos. Sci. 2021, 5, 319. [Google Scholar] [CrossRef] [Scilit]
- Queirós, J.; Lopes, H.; Mourão, L.; dos Santos, V. Inspection of damaged composite structures with active thermography and digital shearography. J. Compos. Sci. 2025, 9, 398. [Google Scholar] [CrossRef] [Scilit]
- Wang, Y.; Zhou, J.; Ding, L.; Liu, X.; Jin, S. Defects identification in ceramic composites based on laser-line scanning thermography. J. Compos. Sci. 2025, 9, 532. [Google Scholar] [CrossRef] [Scilit]
- Pisonero, J.; García-Martín, J.; Gómez-Gil, F.J.; Castejón-Sisamon, S. Defect detection in additively manufactured natural fiber composites using active thermography. Int. J. Adv. Manuf. Technol. 2026, 142, 6255–6263. [Google Scholar] [CrossRef] [Scilit]
- Palacios, M.; Barasinski, A. The influence of microstructural heterogeneities on the thermal response of CFRTP composite tapes at the ply-scale. J. Compos. Sci. 2025, 9, 617. [Google Scholar] [CrossRef] [Scilit]
- Neto, J.S.S.; de Queiroz, H.F.M.; Aguiar, R.A.A.; Banea, M.D. A review on the thermal characterisation of natural and hybrid fiber composites. Polymers 2021, 13, 4425. [Google Scholar] [CrossRef] [Scilit] [PubMed]
- Huseynov, O.; Hasanov, S.; Fidan, I. Influence of the matrix material on the thermal properties of the short carbon fiber reinforced polymer composites manufactured by material extrusion. J. Manuf. Process. 2023, 92, 521–533. [Google Scholar] [CrossRef] [Scilit]
- Ramesh, M.; Palanikumar, K.; Reddy, K.H. Comparative evaluation on properties of hybrid glass fiber–sisal/jute reinforced epoxy composites. Procedia Eng. 2013, 51, 745–750. [Google Scholar] [CrossRef] [Scilit]
- Saba, N.; Jawaid, M.; Alothman, O.Y.; Paridah, M.T. A review on dynamic mechanical properties of natural fibre reinforced polymer composites. Constr. Build. Mater. 2016, 106, 149–159. [Google Scholar] [CrossRef] [Scilit]
- Çevik, B.; Avşar, Y. Production of sustainable biocomposite materials developed using different agricultural waste powders as reinforcement. Mater. Test. 2025, 67, 1675–1686. [Google Scholar] [CrossRef] [Scilit]
- Malingam, S.D.; Ng, L.F.; Chan, K.H.; Subramaniam, K.; Selamat, M.Z.; Md Zin, M.R. Mechanical properties of plain woven kenaf/glass fiber reinforced polypropylene hybrid composites. Mater. Test. 2019, 61, 1095–1100. [Google Scholar] [CrossRef] [Scilit]
- Ravindran, B.; Agathocleous, T.; Oswald-Tranta, B.; Fauster, E.; Feuchter, M. Impact characteristics and repair approaches of distinct bio-based matrix composites: A comparative analysis. J. Compos. Sci. 2024, 8, 126. [Google Scholar] [CrossRef] [Scilit]
- Kumar, G.S.; Maniraj, J.; Vasudevan, A.; Saravanakumar, S.S.; Sanjeevi, R. Mechanical and thermal characterization of coir/hemp/polyester hybrid composite for lightweight applications. J. Mater. Res. Technol. 2023, 26, 8242–8253. [Google Scholar] [CrossRef] [Scilit]
- Bergman, T.L.; Lavine, A.S.; Incropera, F.P.; DeWitt, D.P. Fundamentals of Heat and Mass Transfer, 8th ed.; John Wiley & Sons: Hoboken, NJ, USA, 2017. [Google Scholar]
- Zhang, Y.; Jiang, Y. A simple method, the T-history method, of determining the heat of fusion, specific heat and thermal conductivity of phase-change materials. Meas. Sci. Technol. 1999, 10, 201–205. [Google Scholar] [CrossRef] [Scilit]
- Amiandamhen, S.O.; Meincken, M.; Tyhoda, L. Natural fibre modification and its influence on fibre-matrix interfacial properties in biocomposite materials. Fibers Polym. 2020, 21, 677–689. [Google Scholar] [CrossRef] [Scilit]
- Mastura, M.T.; Sapuan, S.M.; Mansor, M.R.; Nuraini, A.A. Materials selection of thermoplastic matrices for `green’ natural fibre composites for automotive anti-roll bar with particular emphasis on the environment. Int. J. Precis. Eng. Manuf. Green Technol. 2018, 5, 111–119. [Google Scholar] [CrossRef] [Scilit]
- Saravanakumar, S.; Sathiyamurthy, S.; Vinod, A.; Sanjay, M.R.; Siengchin, S. Integrating machine learning and response surface methodology for analyzing anisotropic mechanical properties of biocomposites. Compos. Interfaces 2024, 31, 1–28. [Google Scholar] [CrossRef] [Scilit]
- Menczel, J.D.; Prime, R.B. Thermal Analysis of Polymers: Fundamentals and Applications; John Wiley & Sons: Hoboken, NJ, USA, 2009. [Google Scholar]
- Candau, N.; Corvec, G.; León-Albiter, N.; Mudarra Lopez, M. Thermal and volumetric signatures of the Mullins effect in carbon black reinforced styrene-butadiene rubber composites. J. Compos. Sci. 2025, 9, 393. [Google Scholar] [CrossRef] [Scilit]
- Grellmann, W.; Langer, B. Methods for polymer diagnostics for the automotive industry. Mater. Test. 2013, 55, 17–22. [Google Scholar] [CrossRef] [Scilit]

Disclaimer/Publisher’s Note: The statements, opinions and data contained in all publications are solely those of the individual author(s) and contributor(s) and not of MDPI and/or the editor(s). MDPI and/or the editor(s) disclaim responsibility for any injury to people or property resulting from any ideas, methods, instructions or products referred to in the content. |
© 2026 by the authors. Licensee MDPI, Basel, Switzerland. This article is an open access article distributed under the terms and conditions of the Creative Commons Attribution (CC BY) license.