


Abstract
Electrically conductive photopolymers enable the fabrication of functional 3D-printed components with customized electrical properties, expanding additive manufacturing applications beyond traditional structural uses. This study reports the formulation and characterization of electrically conductive, water-washable photopolymer resins for masked stereolithography (MSLA) through the incorporation of nano-graphite, PEDOT:PSS, and dimethyl sulfoxide (DMSO) as a secondary dopant. Single filler and hybrid resin systems were prepared and processed via MSLA printing, then subjected to sequential thermal treatments, 25 °C curing for 48 h followed by annealing at 80 °C and 120 °C, to investigate conductivity enhancement and microstructural evolution. Electrical characterization via current–voltage (I–V) measurements, referenced to the transversal conductivity (), showed that the hybrid formulation containing PEDOT:PSS, graphite, and DMSO achieved the highest conductivity (9.40 × 10⁻² S·cm−1), outperforming PEDOT:PSS/graphite systems (2.6 × 10⁻³ S·cm−1) and graphite-only samples (9.76 × 10⁻⁴ S·cm−1). Conductivity increased consistently after each thermal step, indicating enhanced charge transport. Scanning electron microscopy further revealed improved filler dispersion and interconnectivity within the polymer matrix. The synergistic combination of PEDOT:PSS, graphite nanofillers, and DMSO enables MSLA printed components with tunable and reproducible electrical performance. This work demonstrates a scalable strategy for producing functional, water-washable photopolymer resins suitable for applications in sensors, soft electronics, and lightweight conductive structures.
1. Introduction
Additive manufacturing (AM), well known as 3D printing, has become an established approach for the fabrication of components with complex geometries and diverse material compositions designed in CAD environments. Unlike traditional subtractive or formative processes, AM enables layer-by-layer construction, offering significant advantages in terms of design freedom, rapid prototyping, and customization. These features have contributed to the widespread adoption of AM across industrial research and development, where precision, short production cycles, and material adaptability are essential. AM encompasses a broad range of techniques that differ primarily in the mechanisms used to deposit or solidify materials during fabrication. Among the most widely used methods are fused deposition modelling (FDM) and stereolithography (SLA) [1]. In FDM technology, a thermoplastic polymer material is arranged in a spool and passed through an extrusion head that melts the filament by heating [2]. The molten polymer is expelled through a nozzle (in liquid phase) and deposited on a plate (the model base), producing a thin solid strip (model layer). The most commonly used thermoplastic polymers include PLA (Polylactic Acid), ABS (Acrylonitrile Butadiene Styrene), PETG (Polyethylene Terephthalate Glycol-modified), and PP (Polypropylene) and their blends [3]. PLA is popular due to its ease of printing, low warping, and biodegradability, making it ideal for prototypes and beginners. ABS offers higher mechanical strength and heat resistance but requires controlled printing conditions. PETG provides a good balance of toughness, chemical resistance, and printability [4]. PP is valued for its excellent chemical resistance, fatigue resistance, and low density, making it suitable for functional parts such as hinges and containers; however, due to some challenges it faces during the printing process (e.g., poor bed adhesion and significant warping), it is one of the FDM polymers that is under continuous study to enhance its performance [5]. On the other hand, SLA is the foundational 3D printing technology. It was patented in 1986 by Chuck Hull. Following his invention, Hull founded 3D Systems, effectively commercializing stereolithography and paving the way for modern additive manufacturing. In SLA, a controlled ultraviolet or visible light source is used to induce photopolymerization within a liquid photo reactive resin (or photopolymer resin). This process allows for high-resolution fabrication and the production of finely detailed structures through localized crosslinking [6,7,8]. There are different methods to control the light source in an SLA printer (e.g., galvanometer mirrors, digital micromirror device, etc.), and one of the most promising and low cost is based on using an LCD to mask part of the light generated from a UV LED matrix (e.g., at 409 nm) to selectively photopolymerize the resin following the CAD file. This type of printing is known as masked stereolithography (MSLA). In this case the precision of these types of printers depends mainly on the LCD resolution, which is enhanced continuously, following state-of-the-art the digital displays.
The mechanical behaviour, quality and application suitability of the MSLA-printed parts are directly determined by the chemistry of the photopolymer [9]. Recent advances in resin chemistry such as biocompatibility, flexibility, and high strength have expanded MSLA’s role across automotive [10], dental biomedical [11], environmental monitoring [12], and space applications, providing improved mechanical performance, optical properties, and surface finish for printed parts. In fact, Burmistrov et al. report a method that can be used to create a composite material by mixing a photopolymer resin with metallic titanium nanoparticles for use in MSLA 3D printing, improving mechanical performances (reducing its fragility) and acquiring antibacterial properties [13]. As described by Scaccabarozzi et al., it is possible to realize a QCM sensor support structure using 3D printing technology that is compliant with the environmental characteristics of the space applications which require specific compliant features to overcome the load during the launch phases and cope with a working temperature range up to cryogenic temperatures [14]. In recent years, growing interest in conductive photopolymer resins has driven research into new formulations that enable electronic functionality within printed parts. These materials make it possible to embed circuits, sensors, and connectors directly into printed objects, reducing assembly steps and lowering production costs. Their capabilities support the development of wearable electronics and sensing devices, provide effective electromagnetic shielding for electronic components, and enable the fabrication of lightweight conductive structures that are becoming increasingly important in aerospace, robotics, and automotive applications. In the scientific literature, several strategies have been proposed to formulate conductive resins. The most widely adopted approaches are: (a) dispersing conductive or semiconductive fillers, such as metallic particles, carbon-based materials, or ionic conductors into UV-curable photopolymers (e.g., epoxy or acrylate monomers), while maintaining compatibility with the precise curing requirements of MSLA technology [15,16,17]; (b) mixing conductive polymer as PEDOT:PSS creating a conductive acrylate based resin [18]. PEDOT:PSS (poly(3,4-ethylenedioxythiophene):poly(styrenesulfonate)) is a water-dispersible conductive polymer that is widely used in flexible and printed electronics as organic ink. It is a well-known conductive polymer blend, and many research groups are continuously investigating methods to enhance its performance [19]. It shows good electrical conductivity with optical transparency, mechanical flexibility, and easy processing via spin coating, inkjet/screen printing, or spraying. In smart textiles, PEDOT:PSS are applied to fibres and fabrics to create conductive tracks, heaters, and sensors for wearables; durability is improved with binders, crosslinkers, and encapsulation to survive bending and to increase its performance [20]. In the case of filler dispersion in the UV-curable resins approach [21], the major advantage is the tunability of electrical performance: once the filler loading exceeds the percolation threshold, conductivity can increase by many orders of magnitude, and high-aspect-ratio or hybrid networks (e.g., nanostructured filler) typically reduce the threshold and total loading required. At the same time, metallic and carbonaceous fillers attenuate and scatter 405 nm light, which could reduce cure depth and blur fine features in MSLA. Generally, higher filler loadings also raise viscosity and promote sedimentation, so stable, printable slurries rely on surface functionalization and dispersants plus high-shear/ultrasonic mixing to keep particles de-agglomerated without over-thickening; particle size/shape also governs both rheology and UV penetration [22]. Finally, as reported in different scientific papers, optimized filler-loaded UV-curable resins can reach electrical conductivities of approximately 102–103 S cm−1 [23,24]. There are different methods in the literature that have been used to develop conductive resins, such as (a) dispersing conductive or semiconductive fillers, such as metallic particles, carbon-based materials, or ionic conductors into UV-curable photopolymers (e.g., epoxy or acrylate monomers), while maintaining compatibility with the precise curing requirements of MSLA technology [15,16,17,25]; (b) mixing conductive polymer as PEDOT:PSS to create a conductive acrylate-based resin [18]. As reported by Shang-Cheng, a resin modified with metal fillers, such as silver-coated copper flakes (AgCu), silver nanoparticles (AgNP) and CNT, showed conductivity of up to 1000 S/cm [26,27,28,29]. For the PEDOT:PSS-based resins, the key benefits are aqueous processability, optical transparency, mechanical flexibility, and compatibility with printed/flexible electronics. Post-treatments and secondary dopants (e.g., DMSO, strong acids) can boost conductivity from < 1 S cm−1 to ~102–103 S cm−1 by removing excess PSS and promoting PEDOT chain ordering, with several studies reporting ~103 S cm−1 after solvent/acid processing; these treatment–structure–property links are now well documented [30,31,32,33]. In a recent paper [34], a conductive composite photoresin based on acrylate resin and PEDOT:PSS was used to develop a 3D microstructure (20 µm long and 10 µm high) printed with a process of two-photon polymerization, a complex printing process that resulted in a 3.5 × 10² S cm structure. Song et al. [35] report multiphoton direct laser nanoprinting of conductive organic bioelectronic structures using a PEDOT:PSS hydrogel photoresin, enabling high-resolution 3D patterning in nano/microstructures. However, this approach depends on femtosecond laser-based two-photon/multiphoton direct writing with high-aperture optics and precision stages, which is an equipment-intensive, costly setup compared with conventional printing methods.
In this work, we engineer a conductive, water-washable LCD/MSLA photopolymer by blending a commercially available base resin with PEDOT:PSS and nano-graphite, and we process it entirely on unmodified, off-the-shelf commercial MSLA printers; the only intervention is the resin formulation itself. Test coupons printed with the modified resin were electrically characterized via current–voltage (I–V) measurements to quantify conduction behaviour and formulation-to-formulation repeatability. Building on these results, we 3D-printed complex geometries at centimetre-scale volumes (on the order of cm3), demonstrating that this approach is not confined to microstructures: it supports fully 3D, macroscale parts suitable for practical assemblies and standard post-processing (wash and UV post-cure). A further advantage of our material system is that the final conductive resin remains water-washable, unlike many solvent-developed systems. This feature simplifies post-processing and handling, making the workflow more accessible for home, educational, and benchtop environments where the use of specialized organic solvents is undesirable or restricted. In other words, users can retain the familiar, low-barrier cleaning step of water washing while gaining embedded electrical functionality. Taken together, these findings outline a straightforward pathway to functional, conductive polymer components produced on commercial printers with market-available resins, lowering barriers to adoption. The printed samples, serve as a springboard for future 3D devices with substantial volumes and integrated conductometric transducers, targeting real-world applications where polymer parts can replace metal components or high-cost composites, and where conductivity is embedded directly in the printed body (e.g., integrated sensing tracks, self-monitoring housings, or multifunctional fixtures). In short, the study shows that scalable, macroscale conductive prints are feasible without bespoke equipment and without solvent-based cleaning, enabling rapid, cost-effective prototyping and deployment.
2. Materials and Methods
Resin modifications were carried out by incorporating nano-graphite and PEDOT:PSS, with or without DMSO, to achieve the desired filler content. The mixtures were homogenized under vortex mixing at room temperature until uniform dispersions were obtained. The formulations were then subjected to ultrasonic treatment to minimize particle aggregation and ensure a consistent distribution of the conductive phases throughout the polymer matrix. Thermal treatments were applied post-printing to promote drying and annealing of the PEDOT:PSS domains. Initial drying at 25 °C removed residual water from the polymer network, while subsequent annealing steps at 80 °C and 120 °C induced a reorganization of the conductive domains, enhancing interconnectivity between PEDOT:PSS and graphite aggregates. All prepared formulations were used for 3D printing without further modification. Conductivity measurements and SEM analyses were then performed to evaluate the structural and electrical effects of the additives and thermal treatments.
2.1. Materials
The water-washable LCD photopolymer resin was supplied by Multicomp Pro (wavelength range: 395–410 nm; density: 1.05–1.25 g·cm−3, Farnell, Leeds, UK). Poly(3,4-ethylenedioxythiophene):polystyrene sulfonate (PEDOT:PSS, 1.3 wt% dispersion in H2O) was purchased from Sigma-Aldrich (St. Louis, MO, USA) and used as aqueous dispersion. Nano-graphite powder (average particle size <100 nm; density 1.8–2.1 g·cm−3) was also obtained from Sigma-Aldrich and used without further purification, in dry powder form. Dimethyl sulfoxide (DMSO, ≥99.9% purity, Sigma-Aldrich) was employed as received. The electrical characterizations of the printed materials were performed using a programmable DC power supply (EA-PS 2042-10 B, Elektro-Automatik (Viersen, Germany)), which generated the voltage across the sample under measure, and a multimeter (Keithley 2100, 6½ digits, Solon, OH, USA).
2.2. Preparation of Modified Composite Resins
Preliminary tests showed that the aqueous PEDOT:PSS dispersion was incompatible with the standard resin of the same brand, leading to phase separation. In contrast, full miscibility was achieved with the water-washable resin [36,37], which justified its selection for the preparation of the conductive formulations. The formulations were further optimized to maintain a viscosity suitable for the MSLA printing process while enabling the fabrication of three-dimensional samples with stable structures. Table 1 summarizes the final formulations along with the corresponding filler concentrations, expressed as weight percent.
Table 1.
Formulations of the prepared resin systems.
The stability of the resin formulations was qualitatively assessed in terms of sedimentation behaviour, viscosity, and temporal stability during the period of use. Nano-graphite particles were incorporated into the water-washable (WW) base resin using a vortex mixer (Vortex Genie 2, Scientific Industries, Bohemia, NY, USA) at the concentrations reported in Table 1.
For the formulations containing PEDOT:PSS and PEDOT:PSS-DMSO, a preliminary step consisted of preparing a conductive additive solution. DMSO was added to the aqueous PEDOT:PSS dispersion (1.3 wt%), and the mixture was sonicated in an ultrasonic bath (Creworks Digital Ultrasonic Cleaner, Ontario, CA, USA) for 60 min at 60 °C to promote the rearrangement of PEDOT and PSS domains, following procedures previously reported in the literature [38,39,40,41]. Before being incorporated into the resin, both the PEDOT:PSS and PEDOT:PSS-DMSO dispersions were partially dehydrated. The mixtures were transferred into a borosilicate crystallizer (diameter of 10 cm) and placed in a ventilated oven (Argolab-TCN30, Carpi, Modena, Italy) at 60 °C until their mass decreased by approximately 50%. This step increased the effective solid content introduced into the resin while preserving the nominal formulation ratios based on the initial dispersion weight. The partial removal of water improved compatibility with the photocurable resin and contributed to more effective polymerization during MSLA printing. Considering the high boiling point of DMSO [42], this step primarily removed residual water while retaining DMSO as a secondary dopant.
The concentrated PEDOT:PSS or PEDOT:PSS-DMSO solution was then added to the WW–graphite dispersion and homogenized by vortex mixing for 5 min. The resulting composite resin was employed in the MSLA printing process. The same preparation route was followed for all composite variations, omitting either the PEDOT:PSS-DMSO step (graphite-only formulations) or the graphite addition (PEDOT:PSS-DMSO-only formulations). A schematic representation of the preparation steps is provided in Figure 1.
Figure 1.
Preparation of the modified WW resin involves two main stages. In the first stage (1a,2a,3a), DMSO is added to the PEDOT:PSS aqueous dispersion (1a) and ultrasonicated (2a), followed by concentration through controlled water evaporation (3a). In parallel, the base WW resin is prepared (1b,2b): graphite nanoparticles are gradually incorporated under vibration-assisted stirring (1b), and the concentrated PEDOT:PSS + DMSO solution is then added (2b). The resulting formulation is finally used for 3D printing. For graphite-only resins, only steps (1b,2b) are performed.
2.3. Three-Dimensional Printing (MSLA) Parameters
All specimens were fabricated using a MSLA 3D printer (Elegoo Mars 3, Shenzhen, Guangdong, China). Printing parameters were adjusted and optimized according to the specific rheological characteristics of each modified resin [43,44]. In particular, the build plate movement speed, the total number of printed layers, the UV light intensity, and the exposure times for both the initial and subsequent layers were finetuned to ensure successful printing. The final parameters adopted for each formulation are summarized in Table 2.
Table 2.
Printing parameters used for the different resin formulations. The reported values were experimentally determined through extensive printing trials and represent the best set of parameters required to ensure successful fabrication of defect-free specimens for each formulation. These optimized conditions reflect the specific rheological and photopolymerization characteristics introduced by the addition of nano-graphite, PEDOT:PSS, and DMSO.
It was not feasible to employ identical printing parameters for all the investigated formulations, as each modified resin required specific processing conditions. Preliminary printing tests conducted using the standard parameters revealed substantial differences in printability. Some formulations exhibited incomplete curing or structural defects, while others failed entirely. Consequently, dedicated optimization was necessary for each composition, and the final parameters reported in this work represent the experimentally determined conditions that ensured reliable printing and defect-free specimens. At the origin of the required parameter adjustments lies the intrinsic nature of the nano-graphite particles themselves, and, to a lesser extent, the modifications introduced by the addition of PEDOT:PSS and DMSO to the base resin. Nano-graphite is known to strongly absorb in the UV range used for photopolymerization in 3D printing, due to its electronic structure and π-π* transitions [45,46]. This absorption can significantly reduce the amount of UV radiation reaching the photo initiators in the resin, potentially hindering complete polymerization of the base resin in graphite-containing formulations [45,47]. To compensate for this effect, the printing parameters were adjusted to increase the exposure time of both initial and subsequent layers, ensuring full curing. These measures are in line with common practices reported in the literature to overcome UV absorption by carbon-based nanomaterials in photopolymerizable resins [48,49]. Such adjustments were less critical for formulations without nano-graphite. Nevertheless, the inclusion of aqueous PEDOT:PSS and DMSO slightly altered the viscosity of the modified resin compared to the commercial base resin, requiring minor tuning of the printing parameters to achieve consistent and successful 3D printing of the specimens [50,51].
The dimensions of the printed specimens were kept constant across all formulations and set to 12.0 mm in length, 3.0 mm in height, and 3.0 mm in width. This geometry was selected to ensure adequate thickness for handling and to guarantee compatibility with the instrumentation used for electrical conductivity measurements. An illustration of the specimens is provided in Figure 2.
Figure 2.
Schematic representations of the electrical configurations used for conductivity measurements on the 12 × 3 × 3 mm3 parallelepiped specimen. Panels (a-1–c-1) show the lateral, longitudinal, and transverse measurement configurations, respectively. Panels (a-2–c-2) report the corresponding electrical connection setups, while panels (a-3–c-3) display the actual prepared samples.
2.4. Post-Processing: UV Final Curing and Thermal Annealing
All printed specimens were subjected to a post-curing process using a UV lamp with a uniform wavelength of 405 nm (ELEGOO Mercury XS Bundle, Shenzhen, China). The total curing time was 10 min, applied in alternating cycles of 2 min exposure and 2 min rest. This procedure was adopted to prevent excessive temperature rise in the specimens, which may occur due to the partial absorption of UV radiation by the dispersed nano-graphite [46,47]. For the formulations without graphite, the same curing protocol was maintained to ensure consistency in the preparation of all samples. Thermal annealing treatments were performed to remove residual water present in the samples, originating from the aqueous PEDOT:PSS dispersion, and to induce a controlled reorganization of the PEDOT:PSS domains within the printed specimens [38,52,53]. Samples were subjected to annealing at 25 °C (drying), 80 °C, and 120 °C for the times indicated in Table 3. All treatments were conducted in a tubular furnace (Thermo Scientific Hipertoc SA, Waltham, MA, USA). With the exception of the 25 °C treatment, annealing was performed under continuous nitrogen flow (0.2 L·min−1). The operational parameters, including nitrogen atmosphere conditions and a heating ramp, are also reported in Table 3.
Table 3.
Data about operational parameters, including nitrogen atmosphere conditions and a heating ramp.
2.5. Electrical Characterization Setup
The 3D-printed specimens were electrically characterized by measuring the current response as a function of the applied potential [54,55]. A custom measurement setup was designed to match the geometry of the printed specimens. The system consisted of two spring round-tip contacts housed in a dedicated support (sample support), which was itself fabricated by 3D printing. The electrodes were connected to a programmable DC power supply (EA-PS 2042-10 B, Elektro-Automatik) that generated the voltage across the sample under measure. A multimeter (Keithley 2100, 6½ digits) measured the current (I) and send the data to a PC unit. A schematic representation of the electrical measurement configuration, together with a graphical illustration of the setup, is provided in Figure 3 for clarity.
Figure 3.
Electrical measurement scheme.
The current–voltage (I–V) curves were acquired in DC mode by applying a potential ranging from −5 V to 5 V (the applied potential was increased by 0.5 V every minute), with a data acquisition rate of one point per 1.0 s [56,57]. All measurements were conducted under ambient conditions at a constant temperature of 25 °C. For each formulation, four specimens were printed, and three independent measurements were performed on each sample. The resulting values were averaged, and the corresponding standard deviations were reported. To evaluate the influence of electrical contact pin placement and potential anisotropy in the printed structures, the electrodes were positioned on three distinct faces of the sample: along the lateral face (12.0 ± 0.1 × 3.0 ± 0.1 mm), the longitudinal face (12.0 ± 0.1 × 3.0 ± 0.1 mm), and the transverse face (3.0 ± 0.1 × 3.0 ± 0.1 mm), as schematically illustrated in Figure 3. This approach enabled the assessment of possible directional dependence in electrical conductivity, potentially arising from the printing process and layer-by-layer polymerization, which may introduce anisotropic conductive pathways within the resin composites. The electrical conductivity (σ) of the printed specimens was determined using the current–voltage (I–V) curve method [58,59]. The calculation of σ was based on Ohm’s law, according to the following relationship:
where σ is the electrical conductivity (expressed in S·m−1) and ρ is the electrical resistivity. Experimentally, the conductance (G) of each specimen was obtained from the slope of the linear region of the I–V curves [60]. The average conductivity was then calculated using the equation:
where G is the electrical conductance (S), l is the effective length of the current path (m), and S is the cross-sectional area (m2) perpendicular to the current flow. The conductance G itself was determined as:
with I representing the measured current (A) and VDC the applied voltage (V).
σ = 1/ρ
2.6. SEM-Based Microstructural Analysis
Scanning electron microscopy (SEM) analyses were performed using a (Coxem EM-30AX, Daejeon, Republic of Korea) instrument. Samples were mounted on aluminum stubs using conductive carbon tape and coated with a thin layer of graphite using a (Cressington 108CarbonA, Watford, UK) sputter coater to enhance conductivity and prevent charging during imaging [61]. SEM imaging was conducted at various magnifications using a secondary electron detector under a high vacuum, with an accelerating voltage of 20 kV and a working distance of 11.8 mm. Images were acquired from at least three different regions of each sample to ensure a representative characterization of the surface morphology.
3. Results and Discussion
No appreciable currents were detected for the water-washable (WW) photocurable resin without filler under any of the tested conditions, either in the as-printed state or after thermal annealing. The measured signals remained at the level of background noise, confirming the intrinsically insulating nature of the pristine resin [62]. This result is consistent with the intrinsic insulating nature of acrylate–phenolic-based photo-polymeric matrices, which lack both delocalized electronic pathways and mobile ionic species capable of supporting charge transport [63]. Consequently, any improvement in the electrical performance of the composite formulations can be attributed exclusively to the incorporation of conductive additives employed in this study: nano-graphite, PEDOT:PSS, or their combined systems [64,65,66]. Within this framework, the insulating behaviour of the pristine resin serves as a fundamental reference to assess the relative contribution of each filler and to identify potential synergistic effects arising from their combination. Furthermore, the measurements confirm that the base resin remains insulating regardless of thermal treatment, excluding the possibility that annealing alone induces conductive behaviour [67]. As an illustrative example, Figure 4 reports the I–V curves of specimens printed with the standard resin, both in the as-printed state and after heat treatment, clearly demonstrating its insulating character. Although a small current of approximately 125 nA is detected for the samples treated at 80 °C for 1 h, this value remains sufficiently low to classify the material as electrically insulating [67]. Moreover, when the same resin is subjected to a higher thermal treatment at 120 °C for 1 h, the measured current falls below both the background noise level and the values obtained for the untreated reference samples. These results indicate that thermal exposure does not induce any measurable increase in charge transport within the resin; in fact, higher curing temperatures may further stabilize or reduce its residual conductivity, reinforcing its classification as a highly insulating material. The applied potential was varied from 0 to 5 V, with an increment of 0.5 V every minute and one experimental data point collected every 1.0 s. The graph reports the average current values over time at each applied potential, together with the corresponding Standard Error (SE). The current response of WW samples, both untreated and thermally treated, is comparable to the instrument current detection limit, showing fluctuations within ±50 nA. Therefore, experimental results indicate that the samples printed with standard WW resin are non-conductive, both in the as-printed condition and after annealing treatments at 25 °C, 80 °C, and 120 °C.
Figure 4.
Current response of samples obtained by direct printing using WW resin, before and after thermal treatments, compared with the instrument current detection limit.
3.1. Electrical Characterization Through I–V Measurements
Electrical conductivity measurements were performed by applying a variable potential in the range of −5 V to +5 V, including the transition through zero. The acquired current–voltage (I–V) curves exhibited a linear trend in both the negative and positive potential regimes, with equivalent slopes. The absence of slope variations or discontinuities across the potential inversion highlights a symmetric, ohmic behaviour of the material, indicating that charge transport is dominated by continuous electronic pathways within the composite matrix [68]. No significant capacitive effects or charge accumulation phenomena were detected, further confirming the stability and reliability of the measurements. In addition, the lack of rectifying behaviour or polarized junctions suggests that the samples act as homogeneous conductors. As illustrative evidence, Figure 5 reports the raw data collected for one representative conductive specimen, showing both the time-dependent current response during the potential sweep and the corresponding I–V curve. The linear regression shows an excellent agreement with the data (R2 = 0.999). The intercept is 1.78 ± 0.26, while the slope is 22.94 ± 0.12, as obtained from an ordinary least squares fit. The same linear and symmetric behaviour was consistently observed for all formulations containing nano-graphite, and exclusively for these systems, strongly suggesting that electrical conductivity primarily originates from the dispersed graphite phase within the polymeric matrix.
Figure 5.
Panel (a) shows the resulting I–V characteristic along with its linear fit, whereas panel (b) displays the corresponding time-domain instrumental response to the applied potential sweep. The linear fit slope confirms that the tested material behaves ohmically, with no detectable deviation from Ohm’s first law throughout the potential excursion (0 to –5 V, returning to 0 V, then to +5 V, and finally back to 0 V).
Regression shows an excellent agreement with the data (R2 = 0.999). The intercept is 1.78 ± 0.26, while the slope is 22.94 ± 0.12, as obtained from an ordinary least squares fit. The same linear and symmetric behaviour was consistently observed for all formulations containing nano-graphite, and exclusively for these systems, strongly suggesting that electrical conductivity primarily originates from the dispersed graphite phase within the polymeric matrix.
3.2. Effect of Filler Addition and Printing Orientation
To impart electrical conductivity to the standard photocurable resin, the incorporation of conductive dopants was required. In this study, nano-graphite was selected as the primary conductive filler, while the conductive polymer PEDOT:PSS was employed as a secondary dopant. Electrical characterization revealed that incorporating 1–2 wt% nano-graphite into the water-washable (WW) base resin did not yield any appreciable enhancement in the charge transport properties of the printed specimens. In contrast, formulations containing 3, 4 and 5 wt% nano-graphite displayed measurable current responses as a function of the applied potential, with the 4 wt% and 5 wt% compositions providing the most significant improvements. As expected, electrical conductivity increased progressively with the nano-graphite loading. Nevertheless, increasing the filler content beyond 5 wt% resulted in a marked rise in resin viscosity, ultimately rendering the formulations incompatible with MSLA printing parameters.
Despite the superior preliminary performance of the 4 wt% and 5 wt% formulations in terms of conductivity, the 3 wt% composition remains the most practical to handle and process during printing. Moreover, nano-graphite strongly absorbs in the spectral region required for photopolymerization, further compromising printability and preventing the fabrication of defect free specimens at higher filler loadings. Representative I–V curves for as-printed specimens containing 1.0–5.0 wt% nano-graphite are shown in Figure 6. Electrical characterization also revealed a pronounced anisotropy in the conductivity of the printed samples. Measurable current responses were consistently observed only along the transverse section (), which exhibited a significantly higher current output compared to the other two orientations. In contrast, the lateral and longitudinal sections ( and ), showed responses so low that they can be considered within the range of insulating materials [67]. These results suggest that the printing direction may influence the formation of conductive pathways within the specimens. While we hypothesize that gravity could cause some sedimentation of nano-graphite particles during the printing process, potentially leading to variations in filler concentration across the layers, this effect has not been directly measured in the present study. Consequently, the observed higher conductivity on the transverse face and the partial percolating network on the lateral face are interpreted with caution. On the longitudinal face, where the upper layers may contain a lower effective concentration of nano-graphite, no continuous percolation pathway appears to form, resulting in negligible current. Based on the conductivity measurements obtained, the composite resin containing only nano-graphite exhibits an anisotropic behaviour in terms of specific conductivity σ along the three investigated directions: transverse, lateral, and longitudinal (hereafter referred to as , , ), as shown in Figure 7. As previously discussed, this anisotropy can be attributed to the printing methodology and to the imperfect homogeneity of the printed parts, an intrinsic limitation of the additive manufacturing technique used, particularly when processing nano-reinforcements of this type.
Figure 6.
Representative I–V curves of as-printed specimens containing 1.0–5.0 wt% nano-graphite for the three measurement orientations (a) transverse, (b) lateral and (c) longitudinal.
Figure 7.
Measured conductivities of samples containing 0–5 wt% nano-graphite along the three orientations: transverse, lateral, and longitudinal. The data are reported in Table A1 of the Appendix A.
To enhance the conductivity of the modified resin and to improve the anisotropy of its electrical behaviour along the different directions of the printed material, a second dopant, PEDOT:PSS, was introduced. The addition of PEDOT:PSS in an aqueous solution at 1.3 wt%, combined with DMSO, is intended to generate conductive secondary polymeric chains capable of interconnecting the percolation pathways of the graphite nanoparticles dispersed within the standard resin matrix [41]. The effects of incorporating PEDOT:PSS, both with and without the addition of DMSO, into the standard resin were systematically investigated. In both cases, increasing concentrations of PEDOT:PSS were considered, ranging from 10 to 50 wt%, where the indicated wt% refers to the weight fraction of the 1.3 wt% aqueous PEDOT:PSS dispersion added during resin preparation prior to the printing process and before any partial dehydration treatments.
The DMSO content in the modified resins was varied from 0 wt% up to 20 wt%. Experimental results revealed that measurable conductivity was observed only in the as-printed specimens containing PEDOT:PSS, whereas all samples printed with the standard WW resin remained electrically insulating. In the PEDOT:PSS-containing samples, conductivity vanished after 48 h at room temperature (25 °C). This behaviour indicates that the conductivity detected in the as-printed state is not primarily due to the conductive polymer itself, but rather to residual water entrapped within the polymerized network [69]. Such water likely originates from the 1.3 wt% aqueous PEDOT:PSS dispersion and, despite partial removal during the dehydration step, remains confined within the printed specimens immediately after fabrication. After complete drying for 48 h at 25 °C, the measured conductivity falls within the background noise and is therefore comparable to that of the standard WW resin, confirming its insulating nature. Figure 8 reports the electrical conductivity values obtained from the measurements performed on specimens printed with the standard WW resin modified with PEDOT:PSS, as well as with PEDOT:PSS combined with DMSO.
Figure 8.
(a) Schematic representation of the standard WW resin and the WW resin modified with PEDOT:PSS, shown in the as-printed state and after 48 h of drying at room temperature (25 °C). In the fully dried state, PEDOT chains are not continuous throughout the resin network, whereas in the as-printed samples, the residual water film enables electrical contact between the polymer chains. This behaviour is appreciable only for PEDOT:PSS contents of 20 wt% and above. (b) Plot showing the conductivity of the PEDOT:PSS- and DMSO-modified resins before and after drying. The results indicate that the conductivity measured in the as-printed samples returns to values comparable to the standard WW resin after 48 h at room temperature, confirming that the observed conductivity is primarily associated with the residual water content and is significant only above 20 wt% PEDOT:PSS.
Regarding the addition of DMSO, it partially increases the conductivity values by approximately 10% when moving from the composition without DMSO to that containing 10 wt%, and by an additional 10% when increasing from 10 wt% to 20 wt%. However, as observed for the samples containing only PEDOT:PSS, the printed specimens become electrically insulating after complete drying. The specimens obtained from the standard resin modified with the combined addition of PEDOT:PSS, DMSO, and nano-graphite exhibited the most promising electrical response among all investigated formulations. The electrical behaviour of the PEDOT:PSS-containing formulations indicates that the polymer does not act as the primary conductive phase within the printed resin. While PEDOT:PSS alone does not form a continuous conductive network after drying, its incorporation alongside nano-graphite significantly enhances the overall conductivity by improving the interconnection between graphite-rich domains. This secondary doping effect promotes more continuous percolation pathways throughout the polymer matrix. The data supporting this interpretation, together with the resulting structural hypotheses, are presented and discussed in detail in the subsequent sections of this work. These composites showed higher conductivity in the transverse direction (), both in the as-printed state and after the first thermal treatment at 25 °C for 48 h. Unlike the systems containing only nano-graphite, they also displayed appreciable conductivity along the non-printing directions, namely the longitudinal direction (), and lateral direction (). Based on the electrical data obtained from formulations containing only nano-graphite, the two most promising compositions were identified as the 5 wt% and 3 wt% nano-graphite resins. The 5 wt% formulation was selected because it exhibited the highest and most stable current response, confirming that increased nano-graphite loading significantly enhances electrical transport. In contrast, the 3 wt% formulation, despite being characterized by lower conductivity, demonstrated markedly superior printability, with reduced viscosity, shorter exposure times, and fewer structural defects during MSLA processing. The 4 wt% composition represented an intermediate case: it did not achieve the conductivity values of the 5 wt% formulation, yet it retained nearly the same printing limitations, while also not offering the ease of handling associated with the 3 wt% formulation. For these reasons, the 3 wt% and 5 wt% nano-graphite formulations were selected for further optimization through the addition of PEDOT:PSS and DMSO. Specifically, PEDOT:PSS and DMSO were incorporated at 50 wt% and 20 wt% in the 5 wt% formulation (WW-P50-D20-G5), and at 25 wt% and 10 wt% in the 3 wt% formulation (WW-P25-D10-G3), respectively. The resulting mixtures are essentially scaled versions of one another, enabling two complementary approaches: one designed to maximize electrical current response (5 wt%) and the other to maximize printability, minimizing printing time and the occurrence of structural defects (3 wt%). The conductivity data for the samples containing 3 and 5 wt% nano-graphite, both with and without the addition of PEDOT:PSS and DMSO, are reported in Figure 9. All measurements were performed after complete drying of the printed specimens, following 48 h of conditioning at 25 °C. The samples that exhibit the highest conductivity are those in which nano-graphite acts synergistically with PEDOT:PSS and DMSO. Comparing the different formulation families, it becomes evident that conductivity further increases when DMSO is used as a dopant, as it promotes the reorganization of the PEDOT chains prior the heat treatment. In these systems, electrical conductivity is detectable in all directions, although primarily along the printing direction. This behaviour can be attributed to the formation of conductive PEDOT bridges that connect the various nano-graphite aggregates dispersed within the resin matrix. As a result, a percolative pathway for electron transport is established between the nano-graphite clusters. However, this network is not fully continuous: interruptions in the nano-graphite framework are effectively bridged by PEDOT, enabling charge transport across otherwise nonconductive gaps. This interpretation is also supported by SEM observations, which are discussed later in the text, showing the presence of PEDOT bridging structures in samples containing PEDOT:PSS-features that are absent in samples formulated with nano-graphite alone.
Figure 9.
The plot shows the conductivity values calculated from the collected data, highlighting the sample families that exhibited the highest performance. The analysis focuses on two intermediate nano-graphite loadings, 3 and 5 wt%, combined with PEDOT:PSS at 25 and 50 wt% (prior to the drying process, as reported in Table 1). The two corresponding families incorporating DMSO as a secondary dopant are also included. These are the samples that were subsequently subjected to thermal annealing in order to evaluate how the treatment influences the internal structure and, consequently, the measured conductivity.
3.3. Effect of Thermal Annealing on Electrical Conductivity
The electrical conductivity of the printed specimens doped with graphite + PE-DOT:PSS + DMSO is, according to the experimental results, higher than that of samples containing only graphite or graphite combined with PEDOT:PSS, when comparing materials with the same graphite loading percentage in the printed resins. Although the conductivity increases in all measured directions (, and sections), significant differences between these directions remain. Therefore, even after the incorporation of PEDOT:PSS and DMSO, which is intended to promote the reorganization of PEDOT:PSS into more linear and conductive structures, the specimens do not exhibit an improvement in the anisotropic coherence of their electrical conductivity across the three measurement directions: transverse, longitudinal, and lateral faces.
To enhance the anisotropy of the electrical conduction within the printed parts, additional thermal treatments were applied following complete drying at room temperature. The thermal annealing process was selected to further promote the reorganization of PEDOT:PSS, which is only partially achieved through the introduction of DMSO during resin formulation [38,65]. Thermal treatments were performed on the printed specimens after complete drying for 48 h at room temperature. In accordance with the scientific literature, two annealing steps were selected: 1 h at 80 °C and 1 h at 120 °C [53]. These treatments aim to facilitate the full reorganization of PEDOT:PSS, enabling the formation of conductive bridges between the nano-graphite aggregate domains within the printed parts, thereby enhancing percolation pathways and improving electrical continuity along all spatial directions of the material. Thermal treatments were performed on the formulations that exhibited the highest electrical conductivity, as previously shown in Figure 9. Specifically, these included samples containing 3 wt% and 5 wt% graphite, as well as their combinations with PEDOT:PSS and DMSO at concentrations of 25–50 wt% and 10–20 wt%, respectively. Table 4 summarizes the tested formulations along with their corresponding measured conductivity values. Based on the current–voltage measurements used to derive the electrical conductivity (σ), it is evident that increasing the annealing temperature generally leads to higher conductivity values for all tested specimens, with the exception of the formulation containing only nano-graphite. This trend further supports the interpretation that thermal annealing induces structural rearrangements within PEDOT:PSS, thereby enhancing its electrical conductivity. Figure 10 shows the conductivity trends measured on the thermally treated samples.
Table 4.
Measured conductivity values for the different sample families along the three measurement directions (, and ).
Figure 10.
Conductivity trends measured on the thermally treated sample (a) WW-P25-G3, (b) WW-P25-D10-G3 and (c) WW-G3.
For the formulations containing only nano-graphite (3 wt% and 5 wt%), the conductivity values remain essentially unchanged across the different annealing temperatures. In contrast, the samples containing graphite (3 and 5 wt%) combined with PEDOT:PSS (25 and 50 wt%) exhibit a marked decrease in conductivity after the first thermal step: 48 h at 25 °C.
Based on the current–voltage measurements used to derive the electrical conduc-tivity (σ), it is evident that increasing the annealing temperature generally leads to higher conductivity values for all tested specimens, with the exception of the formulation containing only nano-graphite. This trend further supports the interpretation that thermal annealing induces structural rearrangements within PEDOT:PSS, thereby enhancing its electrical conductivity. Figure 10 shows the conductivity trends measured on the thermally treated samples for the WW-G3, WW-P25-G3, and WW-P25-D10-G3 formulations, while the same data for WW-G5, WW-P50-G5, and WW-P50-D20-G5 are reported in Figure A1, which is provided in Appendix A. For the formulations containing only nano-graphite (3 wt% and 5 wt%), the conductivity values remain essentially unchanged across the different annealing temperatures. In contrast, the samples containing graphite (3 and 5 wt%) combined with PEDOT:PSS (25 and 50 wt%) exhibit a marked decrease in conductivity after the first thermal step: 48 h at 25 °C.
This initial treatment corresponds to the complete removal of residual water, as previously observed for formulations containing only PEDOT:PSS and DMSO without nano-graphite. In these graphite–PEDOT:PSS composites, the conductivity decreases after drying but does not drop to zero because of the graphite content. Subsequent annealing treatments (1 h at 80 °C and 1 h at 120 °C) lead to an increase in conductivity along all measurement directions (, and ). This enhancement is particularly pronounced in the transverse direction of the printed parts. For example, the conductivity of sample WW-P25-G3 increases by 117.6% between the fully dried state (after 48 h at 25 °C) and the final 120 °C annealing step. For sample WW-P50-G5, the same comparison yields an increase of 5873%.
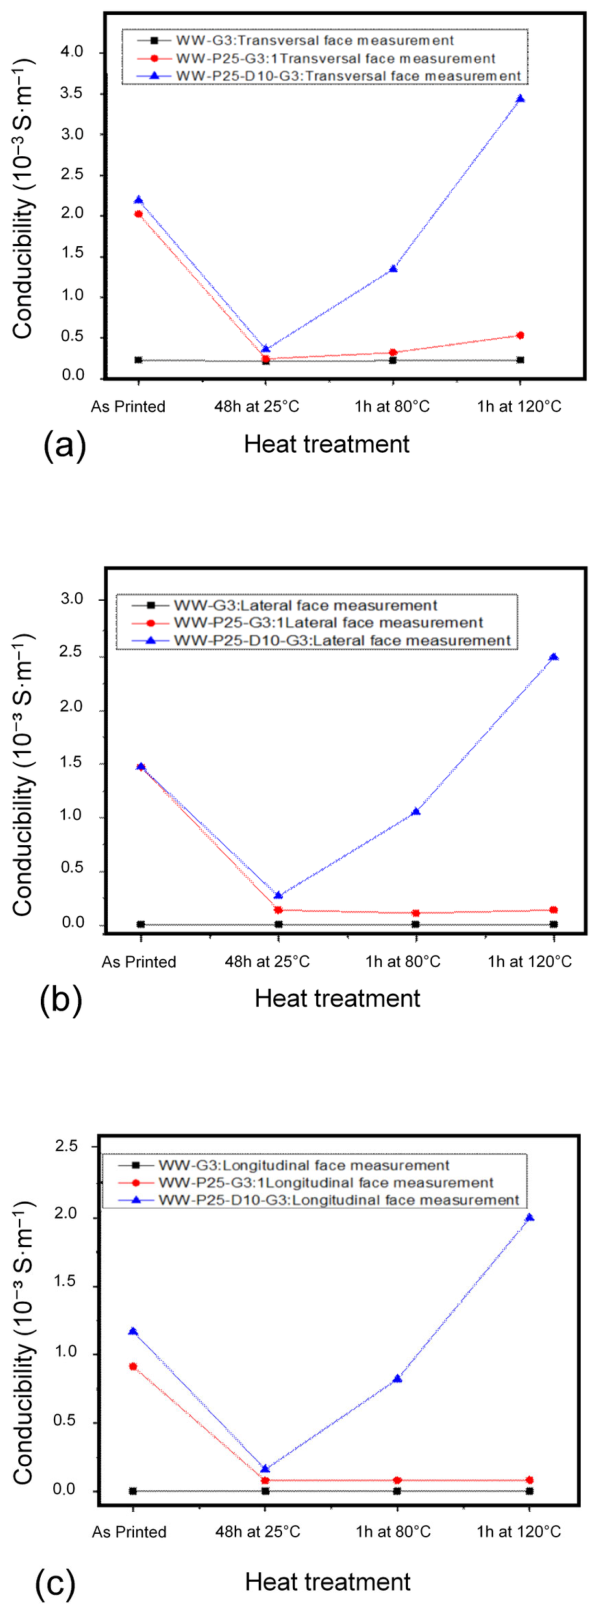
Considering only the effect of graphite content, the difference in between samples WW-G3 and WW-G5 after all thermal treatments is 321%. However, when comparing WW-P25-G3 and WW-P50-G5, the difference rises to 388%. The difference becomes even larger when comparing the PEDOT:PSS-DMSO-modified samples WW-P25-D10-G3 and WW-P50-D20-G5, reaching 2641%. These results indicate that the substantial increases in conductivity are not primarily driven by the graphite content, but rather by the presence of PEDOT:PSS and DMSO. This behaviour is consistent with literature reports showing that post-printing thermal annealing promotes spatial rearrangement of PEDOT:PSS domains into a more linear and conductive configuration [53]. The effect is even more pronounced in samples containing DMSO, which chemically interacts with PEDOT:PSS during resin preparation and promotes its structural reorganization [25,40], which is later enhanced by heat treatments. As shown in Figure 10, these DMSO-containing formulations exhibit conductivity increases not only in but also in and , an effect that is not observed in samples containing only PEDOT:PSS and graphite, where conductivity improvements remain marginal (typically 5–7%). Despite the significant increase in observed after thermal treatments in sample WW-P50-D20-G5, a substantial discrepancy remains compared with the other measurement directions ( and ). This indicates that strong anisotropy persists in the percolative pathways governing electrical conduction. Among all tested formulations, sample WW-P25-D10-G3 exhibits the highest degree of isotropy, showing relatively balanced conductivity values along the three measurement directions (, and ). Although its absolute conductivity values are lower than those of WW-P50-D20-G5, its conductive behaviour is more uniform within the printed structure. The conductivity values measured along the three principal directions are compared for the sample families with equal total graphite content WW-G5, WW-P50-G5, and WW-P50-D20-G5 as shown in Figure 11; the corresponding data for the additional formulations WW-G3, WW-P25-G3, and WW-P25-D10-G3 are reported in Figure A2 in the Appendix A. The most significant conductivity increases after annealing are observed in the formulations containing both PEDOT:PSS and DMSO. Across all measurement directions (, and ), the conductivity values after the 80 °C treatment, referenced to the values obtained after drying at 25 °C, show an average increase of approximately 25% in samples containing graphite and PEDOT:PSS, and an average increase of about 400% in samples containing graphite, PEDOT:PSS, and DMSO. After the 120 °C annealing step, again relative to the fully dried state at 25 °C, the conductivity increases by an average of 140% in the graphite–PEDOT:PSS samples, and by approximately 1200% in those containing graphite, PEDOT:PSS, and DMSO. In contrast, the formulations containing only graphite as filler do not exhibit measurable conductivity improvements after either the 80 °C or the 120 °C thermal treatments.
Figure 11.
Comparison of the conductivity values measured along the three directions for the different sample families with identical total graphite content, (a) transversal, (b) lateral and (c) longitudinal.
Additional tests were carried out by extending the thermal treatments beyond 120 °C, up to 180 °C, on the PEDOT:PSS-DMSO–graphite sample. Conductivity decreased by 13.3% when the annealing temperature exceeded 150 °C, but increased again by 32.3% when the specimen was treated at 180 °C. Despite this apparent improvement, the specimen exhibited material loss and significant deformation at 180 °C. This indicates that raising the annealing temperature above 120 °C is not advisable for the compositions investigated. It is worth noting that many photocurable resins begin to deform or lose their mechanical integrity at temperatures between 50 °C and 80 °C [70,71]. The incorporation of nano-graphite increases the maximum temperature the resin can withstand; however, this enhancement remains limited, and excessive thermal exposure ultimately compromises the material.
3.4. SEM Morphological Analysis and Interpretation of Conductivity Results
Microstructural analyses performed by scanning electron microscopy were carried out to investigate how the addition of nano-graphite, PEDOT:PSS, and DMSO, combined with subsequent thermal annealing, affects the surface morphology of the printed resin samples. As a representative example, Figure 12 compares the micrographs of the standard WW resin with those of the modified samples WW-G3, WW-P25-G3, and WW-P25-D10-G3. All micrographs were acquired after the thermal treatment in order to examine the final morphology following the structural rearrangements induced by the annealing temperatures. The standard resin, without any compositional modification, exhibits a surface typical of polymeric growth processes: compact and relatively homogeneous, with superficial asperities of several tens of micrometres, likely originating from residual nucleation sites.
Figure 12.
Micrographs of the standard WW resin with those of the modified samples (a) WW, (b) WW-G3, (c) WW-P25-G3, and (d) WW-P25-D10-G3.
The introduction of nano-graphite visibly alters the surface morphology. The WW-G3 sample shows a less uniform texture with surface porosity ranging between 10 and 20 µm. At higher magnifications, aggregates of particles with regular, spherical shapes and diameters between 0.5 and 1.0 µm appear within the pores. Although it was not possible to confirm their composition by EDX, due to the carbon-based polymer matrix, the absence of these aggregates in the standard WW resin suggests that they originate from the added nano-graphite filler. Although SEM imaging suggests the presence of interconnecting features between graphite rich domains, these observations cannot be conclusively attributed to PEDOT:PSS, as compositional analysis by EDX is inherently limited in carbon-based systems. For this reason, the proposed mechanism, where PEDOT:PSS acts as a secondary dopant promoting improved connectivity within the graphite network, should be regarded as a working hypothesis supported primarily by the electrical trends and by the synergistic effect observed when PEDOT:PSS, DMSO, and nano-graphite are combined. The main focus of the present study is the characterization of the conductivity enhancement achieved through this synergistic formulation, while a definitive structural assignment of the observed SEM features remains beyond the scope of the current work. Future studies will therefore include more advanced and targeted analytical techniques to more precisely characterize these microstructural features and verify the mechanisms hypothesized in this work. The combined addition of PEDOT:PSS and graphite (sample WW-P25-G3) results in an even more porous structure, which may be due to the evaporation of water, characterized by aggregated flake-like domains arranged with a higher degree of order compared to the WW-G3 sample. The greater regularity of these features indicates a significant contribution of PEDOT:PSS to the morphological rearrangement. After thermal annealing, PEDOT:PSS undergoes a partial reorganization of its tertiary structure, forming connective features between the different aggregates. These structures are presumed to act as conductive bridges between graphite clusters, promoting the formation of a continuous percolation network [72,73,74,75]. This interpretation aligns with the conductivity measurements, which show a substantial increase in electrical conductivity along all spatial directions when PEDOT:PSS is incorporated. An even stronger effect is observed in the samples containing both PEDOT:PSS and DMSO. In the WW-P25-D10-G3 sample, the initial rearrangement of PEDOT:PSS induced by DMSO is further enhanced by the thermal treatment, leading to a more interconnected structural network. Compared to WW-P25-G3, this sample exhibits a higher number of bridging connections between resin domains, consistent with the significant conductivity improvements reported in the previous sections. As previously discussed and widely reported in the literature, the addition of DMSO to PEDOT:PSS primarily induces a chemical–physical reorganization of the polymer blend. This process reduces the amount of free PSS and results in PEDOT chains that are more exposed and aligned into continuous domains, thereby lowering the energy barriers for electronic transport. Thermal annealing, by contrast, does not chemically modify PEDOT:PSS; rather, it drives a physical reorganization of the conductive domains within the printed resin. The initial drying stage promotes the evaporation of residual water, forcing the chains to become more compact. Subsequent heating enhances the growth and interconnection of PEDOT domains, which are already made more linear by the presence of DMSO, leading to more continuous conductive pathways, particularly within the plane of the material. The different mechanisms through which PEDOT:PSS reorganizes, via the chemical action of DMSO as a secondary dopant and through thermally induced annealing, are schematically illustrated in Figure 13. The greatest improvement in electrical conductivity is achieved when both processes act synergistically, as confirmed by the experimental results. To further support the structural interpretation discussed above, Figure 14 presents the SEM micrographs of the WW-P25-D10-G3 sample. These images allow a direct visualization of the morphological features produced by the combined presence of nano-graphite, PEDOT:PSS, and DMSO, as well as the effects of thermal annealing. At the microscale, the surface displays interconnected porous regions in which clusters of nano-graphite can be clearly distinguished. These aggregates are embedded within the polymer matrix and exhibit irregular, non-spherical shapes, consistent with the expected morphology of nano-graphite fillers. Between these clusters, one can observe continuous bridges and interconnecting structures attributed to PEDOT:PSS. These features appear as elongated or thread-like domains spanning across adjacent graphite-rich regions, supporting the formation of electrically conductive percolation pathways throughout the material. The micrographs therefore provide direct evidence of the multiscale organization first promoted by DMSO, which facilitates PEDOT:PSS chain rearrangement, and subsequently by thermal annealing, which enhances the connection between conductive domains. This morphology is coherent with the substantial increase in conductivity measured for this formulation.
Figure 13.
Different mechanisms through which PEDOT:PSS reorganizes: (a) via the chemical action of DMSO as a secondary dopant and (b) through thermally induced annealing.
Figure 14.
SEM micrograph of the (a) WW-P25-D10-G3 sample and its two details (b,c).
The ability to print commercial resins rendered conductive through the addition of nano-graphite, PEDOT:PSS, and DMSO using masked stereolithography 3D printing opens up an interesting perspective for the fabrication of miniaturized sensors and complex electronic systems, thanks to the high spatial resolution and versatility of the technique. To assess the potential for scale up, several specimens with different geometries and dimensions were printed using the formulations investigated in this work. Figure 15 shows the printed samples together with a reference marker used for measurement. As illustrated, the optimized printing parameters reported in Table 2 enabled the fabrication of components with complex geometries, such as hollow cylinders, springs, flat discs, and larger structures like a rectangular container. To provide an indication of the resin characteristics, the smallest printed sample that exhibited electrical conductivity in the same order of magnitude as previously discussed was a planar spring with approximate dimensions of 1 mm in height, 14 mm in length, and 8 mm in width. During preliminary tests, these samples withstood repeated compression and extension cycles performed to measure variations in electrical resistance.
Figure 15.
Printed specimens obtained from the conductive resin formulations: (a) helical springs; (b) a cylindrical structure with internal holes (REF); (c) a flat disc; (d) a hollow parallelepiped-shaped container; (e) two small alternative spring designs; and (f) the reference sample used for electrical measurements alongside similar specimens of different lengths.
All the printed objects reported in Figure 15, displayed electrical conductivity; however, the study of how their electrical properties vary with size and geometry falls outside the scope of this work. The modified resins were successfully printed using MSLA, with multiple test parts of different geometries demonstrating consistent curing and no visible macro-defects. While a detailed quantitative assessment of dimensional accuracy, surface quality, and printing reproducibility is beyond the scope of this study, these qualitative observations indicate that the formulations are compatible with MSLA printing and allow reproducible evaluation of electrical properties. Ensuring reliable printing was essential to accurately assess conductivity. A more systematic quantitative study of printability metrics will be addressed in future work to correlate processing parameters with material performance.
4. Conclusions
This work demonstrates the feasibility of developing electrically conductive 3D-printed photopolymer resins through the combined use of nano-graphite, PEDOT:PSS, and DMSO. The results show that graphite alone provides only a limited enhancement in electrical performance, and only along specific measurable directions, with its contribution remaining largely unaffected by thermal treatments. In contrast, the incorporation of PEDOT:PSS markedly improves conductivity, particularly when the polymer undergoes post-printing annealing. Electrical characterization via current–voltage (I–V) measurements, referenced to the transversal conductivity ), confirmed that the hybrid formulation containing PEDOT:PSS, graphite, and DMSO achieved the highest conductivity (9.40 × 10⁻² S·cm−1), significantly outperforming all other systems. The PEDOT:PSS/graphite samples reached 2.6 × 10⁻³ S·cm−1, whereas graphite only specimens measured 9.76 × 10⁻⁴ S·cm−1. Formulations containing both PEDOT:PSS and DMSO exhibited conductivity increases of several orders of magnitude, particularly after thermal annealing, which consistently enhanced charge transport. Morphological analyses performed by SEM revealed improved filler dispersion and interconnectivity within the polymer matrix. DMSO acts as an effective secondary dopant, promoting the structural rearrangement of PEDOT:PSS, reducing excess PSS, and enabling the formation of more linear and interconnected PEDOT domains. Upon annealing, these reorganized domains evolve into continuous conductive pathways, forming a percolative network in which graphite-rich regions are bridged by PEDOT:PSS. These microstructural features correlate directly with the enhanced and more isotropic conductivity observed along the three principal directions of the printed specimens. Overall, the combined use of DMSO doping and controlled thermal annealing provides a powerful strategy for tailoring and significantly improving the electrical performance of 3D-printed photopolymer materials. These findings open promising avenues for the development of additively manufactured components with integrated conductive functionalities, particularly for applications in soft electronics, sensing, and smart structural systems.
Author Contributions
Conceptualization, M.C. and E.Z.; methodology, M.C. and E.Z.; software, M.C., E.Z., S.S. and T.R.; validation, M.C., E.Z., S.S. and A.M.; formal analysis, M.C., S.S. and T.R.; investigation, M.C. and E.Z.; resources, E.Z., A.M. and T.R.; data curation, M.C., S.S. and T.R.; writing—original draft preparation, M.C.; writing—review and editing, M.C. and E.Z.; visualization, M.C. and E.Z.; supervision, A.M. and E.Z.; project administration, E.Z.; funding acquisition, E.Z. All authors have read and agreed to the published version of the manuscript.
Funding
This research received no external funding.
Data Availability Statement
The original contributions presented in this study are included in the article. Further inquiries can be directed to the corresponding authors.
Acknowledgments
The authors gratefully acknowledge Ettore Guerriero for providing access to the Thermo Scientific Hipertoc SA tubular furnace used for the annealing treatments.
Conflicts of Interest
The authors declare no conflicts of interest.
Abbreviations
The following abbreviations are used in this manuscript and are listed in alphabetical order:
| AM | Additive Manufacturing. |
| CAD | Computer-Aided Design. |
| DMSO | Dimethyl sulfoxide. |
| FDM | Fused Deposition Modelling. |
| LCD | Liquid Crystal Display. |
| MSLA | Masked Stereolithography Apparatus. |
| PEDOT:PSS | Poly(3,4-ethylenedioxythiophene) polystyrene sulfonate. |
| QCM | Quartz Crystal Microbalance. |
| SEM | Scanning Electron Microscope. |
| SLA | Stereolithography. |
| UV-LED | Ultraviolet Light-Emitting Diode. |
| WT% | Weight Percentage. |
| WW | Water Washable (resin). |
Appendix A
Table A1.
Measured conductivities of samples along the three orientations: transverse, lateral, and longitudinal.
Figure A1.
Conductivity trends measured on (a) WW-G5, (b) WW-P50-G5 and (c) WW-P50-D20-G5 samples following the applied thermal treatment steps.
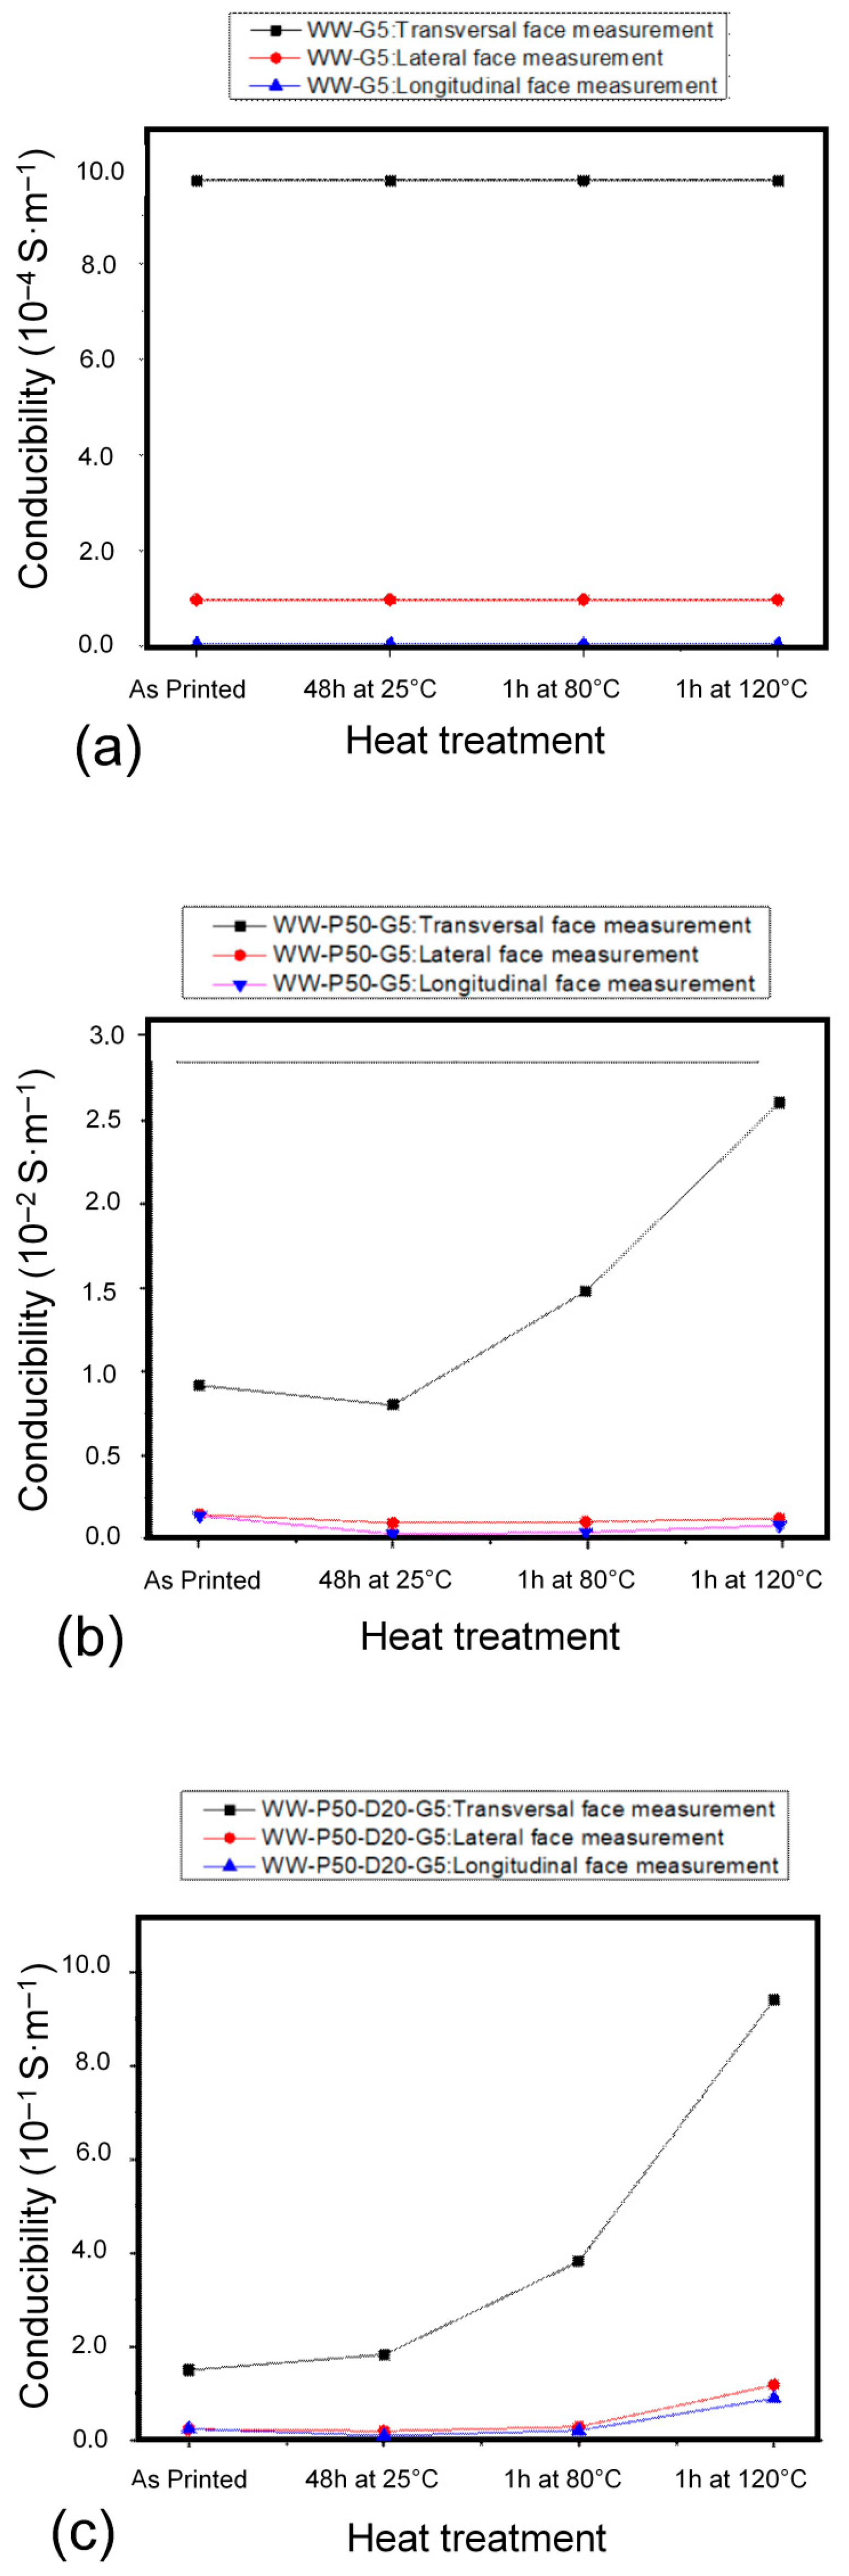
Figure A2.
Comparison of the conductivity values measured along the three directions (a) transversal, (b) lateral, (c) longitudinal for the different sample families with identical total graphite content.
References
- Prabhakar, M.M.; Saravanan, A.K.; Lenin, A.H.; Mayandi, K.; Ramalingam, P.S. A short review on 3D printing methods, process parameters and materials. Mater. Today Proc. 2021, 45, 6108–6114. [Google Scholar] [CrossRef] [Scilit]
- Swetham, T.; Reddy, K.M.M.; Huggi, A.; Kumar, M.N. A Critical Review on of 3D Printing Materials and Details of Materials used in FDM. Int. J. Sci. Res. Sci. Eng. Technol. 2017, 2, 353–361. [Google Scholar]
- Wickramasinghe, S.; Do, T.; Tran, P. FDM-Based 3D printing of polymer and associated composite: A review on mechanical properties, defects and treatments. Polymers 2020, 12, 1529. [Google Scholar] [CrossRef] [Scilit] [PubMed]
- Hozdić, E.; Hozdić, E. Comparative Analysis of the Influence of Mineral Engine Oil on the Mechanical Parameters of FDM 3D-Printed PLA, PLA+CF, PETG, and PETG+CF Materials. Materials 2023, 16, 6342. [Google Scholar] [CrossRef] [Scilit]
- Yu, Y.; Jiang, B.; Chen, Y.; Wang, Y.; He, Y.; Fan, Y. Modifying crystallisation behaviour to improve forming quality and mechanical properties of 3D-printed semicrystalline polymers. J. Mater. Sci. 2025, 60, 14268–14278. [Google Scholar] [CrossRef] [Scilit]
- Pham, D.T.; Ji, C. Design for stereolithography. Proc. Inst. Mech. Eng. Part C J. Mech. Eng. Sci. 2000, 214, 635–640. [Google Scholar] [CrossRef] [Scilit]
- Hull, C.W. The birth of 3D printing. Res.-Technol. Manag. 2015, 58, 25–30. [Google Scholar]
- Pagac, M.; Hajnys, J.; Ma, Q.-P.; Jancar, L.; Jansa, J.; Stefek, P.; Mesicek, J. A Review of Vat Photopolymerization Technology: Materials, Applications, Challenges, and Future Trends of 3D Printing. Polymers 2021, 13, 598. [Google Scholar] [CrossRef] [Scilit]
- Mhmood, T.R.; Al-Karkhi, N.K. A Review of the Stereo lithography 3D Printing Process and the Effect of Parameters on Quality. Al-Khwarizmi Eng. J. 2023, 19, 82–94. [Google Scholar] [CrossRef] [Scilit]
- Chinthavali, M. 3D printing technology for automotive applications. In 2016 International Symposium on 3D Power Electronics Integration and Manufacturing (3D-PEIM); IEEE: New York, NY, USA, 2016; pp. 1–13. [Google Scholar]
- Ahangar, P.; Cooke, M.E.; Weber, M.H.; Rosenzweig, D.H. Current Biomedical Applications of 3D Printing and Additive Manufacturing. Appl. Sci. 2019, 9, 1713. [Google Scholar] [CrossRef] [Scilit]
- Zampetti, E.; Ammiraglia, M.; Conti, M.; Montiroli, C.; Papa, P.; Bianconi, D.; Macagnano, A. Three-Dimensionally Printed Mini Air Scrubbing Cartridges Based on Nano-Graphite for Air Pollution Monitoring. Sensors 2025, 25, 122. [Google Scholar] [CrossRef] [Scilit]
- Burmistrov, D.E.; Serov, D.A.; Baimler, I.V.; Gritsaeva, A.V.; Chapala, P.; Simakin, A.V.; Astashev, M.E.; Karmanova, E.E.; Dubinin, M.V.; Nizameeva, G.R.; et al. Polymethyl Methacrylate-like Photopolymer Resin with Titanium Metal Nanoparticles Is a Promising Material for Biomedical Applications. Polymers 2025, 17, 1830. [Google Scholar] [CrossRef] [Scilit]
- Scaccabarozzi, D.; Saggin, B.; Magni, M.; Corti, M.G.; Valnegri, P.; Palomba, E.; Longobardo, A.; Dirri, F.; Zampetti, E. Quartz Crystal Microbalances for Space: Design and Testing of a 3D Printed Quasi-Kinematic Support. Aerospace 2023, 10, 42. [Google Scholar] [CrossRef] [Scilit]
- Zheng, Y.; Huang, X.; Chen, J.; Wu, K.; Wang, J.; Zhang, X. A Review of Conductive Carbon Materials for 3D Printing: Materials, Technologies, Properties, and Applications. Materials 2021, 14, 3911. [Google Scholar] [CrossRef] [Scilit]
- Omar, M.H.; Razak, K.A.; Ab Wahab, M.N.; Hamzah, H.H. Recent progress of conductive 3D-printed electrodes based upon polymers/carbon nanomaterials using a fused deposition modelling (FDM) method as emerging electrochemical sensing devices. RSC Adv. R. Soc. Chem. 2021, 11, 16557–16571. [Google Scholar] [CrossRef] [Scilit]
- Baker, D.V.; Bao, C.; Kim, W.S. Highly Conductive 3D Printable Materials for 3D Structural Electronics. ACS Appl. Electron. Mater. Am. Chem. Soc. 2021, 3, 2423–2433. [Google Scholar] [CrossRef] [Scilit]
- Scordo, G. A Novel Electrical Conductive Resin for Stereolithographic 3D Printing. Ph.D. Dissertation, Politecnico di Torino, Turin, Italy, 2021. [Google Scholar]
- Doshi, S.; Forner, M.O.A.; Wang, P.; Hadwe, S.E.; Jin, A.T.; Dijk, G.; Brinson, K.; Lim, J.; Dominguez-Alfaro, A.; Lim, C.Y.J.; et al. Thermal Processing Creates Water-Stable PEDOT:PSS Films for Bioelectronics. Adv Mater. 2025, 37, e2415827. [Google Scholar] [CrossRef] [Scilit] [PubMed] [PubMed Central]
- Das, P.; Ganguly, S.; Perelshtein, I.; Margel, S.; Gedanken, A. Acoustic Green Synthesis of Graphene-Gallium Nanoparticles and PEDOT:PSS Hybrid Coating for Textile to Mitigate Electromagnetic Radiation Pollution. ACS Appl. Nano Mater. 2022, 5, 1644–1655. [Google Scholar] [CrossRef] [Scilit]
- Vajtai, R. (Ed.) Springer Handbook of Nanomaterials; Springer Science & Business Media: Berlin/Heidelberg, Germany, 2013. [Google Scholar]
- Turek, P.; Bazan, A.; Kubik, P.; Chlost, M. Development of a Calibration Procedure of the Additive Masked Stereolithography Method for Improving the Accuracy of Model Manufacturing. Appl. Sci. 2025, 15, 7412. [Google Scholar] [CrossRef] [Scilit]
- Sarikhani, N.; Arabshahi, Z.S.; Saberi, A.A.; Moshfegh, A.Z. Unified modeling and experimental realization of electrical and thermal percolation in polymer composites. Appl. Phys. Rev. 2022, 9, 041403. [Google Scholar] [CrossRef] [Scilit]
- Chaudhary, R.; Fabbri, P.; Leoni, E.; Mazzanti, F.; Akbari, R.; Antonini, C. Additive manufacturing by digital light processing: A review. Prog. Addit. Manuf. 2023, 8, 331–351. [Google Scholar] [CrossRef] [Scilit]
- Yildirim, E.; Wu, G.; Yong, X.; Tan, T.L.; Zhu, Q.; Xu, J.; Ouyang, J.; Wang, J.; Yang, S. A theoretical mechanistic study on electrical conductivity enhancement of DMSO treated PEDOT:PSS. J. Mater. Chem. C Mater. 2018, 6, 5122–5131. [Google Scholar] [CrossRef] [Scilit]
- Tsai, S.C.; Chen, L.H.; Chu, C.P.; Chao, W.C.; Liao, Y.C. Photo curable resin for 3D printed conductive structures. Addit. Manuf. 2022, 51, 102590. [Google Scholar] [CrossRef] [Scilit]
- Scordo, G.; Bertana, V.; Scaltrito, L.; Ferrero, S.; Cocuzza, M.; Marasso, S.L.; Romano, S.; Sesana, R.; Catania, F.; Pirri, C.F. A novel highly electrically conductive composite resin for stereolithography. Mater. Today Commun. 2019, 19, 12–17. [Google Scholar] [CrossRef] [Scilit]
- Lee, J.W.; Lee, I.H.; Cho, D.W. Development of micro-stereolithography technology using metal powder. Microelectron. Eng. 2006, 83, 1253–1256. [Google Scholar] [CrossRef] [Scilit]
- Bauhofer, W.; Kovacs, J.Z. A review and analysis of electrical percolation in carbon nanotube polymer composites. Compos. Sci. Technol. 2009, 69, 1486–1498. [Google Scholar] [CrossRef] [Scilit]
- Oh, B.; Baek, S.; Nam, K.S.; Sung, C.; Yang, C.; Lim, Y.S.; Ju, M.S.; Kim, S.; Kim, T.S.; Park, S.M.; et al. 3D printable and biocompatible PEDOT:PSS-ionic liquid colloids with high conductivity for rapid on-demand fabrication of 3D bioelectronics. Nat. Commun. 2024, 15, 5839. [Google Scholar] [CrossRef] [Scilit]
- Bertana, V.; Scordo, G.; Manachino, M.; Romano, S.; Gomez, M.G.; Marasso, S.L.; Ferrero, S.; Cocuzza, M.; Pirri, C.F.; Scaltrito, L. 3D Printed Active Objects based on the Promising PEDOT: PSS Resin: Investigation of their Integration inside an Electronic Circuit. Int. J. Eng. Res. Technol. 2020, 13, 37624. [Google Scholar] [CrossRef] [Scilit]
- Yuk, H.; Lu, B.; Lin, S.; Qu, K.; Xu, J.; Luo, J.; Zhao, X. 3D printing of conducting polymers. Nat. Commun. 2020, 11, 1604. [Google Scholar] [CrossRef] [Scilit]
- Ghaderi, S.; Hosseini, H.; Haddadi, S.A.; Kamkar, M.; Arjmand, M. 3D printing of solvent-treated PEDOT:PSS inks for electromagnetic interference shielding. J. Mater. Chem. A 2023, 11, 16027–16038. [Google Scholar] [CrossRef] [Scilit]
- Amruth, C.; Singh, A.K.; Sharma, A.; Corzo, D.; Baran, D. Micro-3D Printed Conductive Polymer Composite via Two-Photon Polymerization for Sensing Applications. Adv. Mater. Technol. 2024, 9, 2400290. [Google Scholar] [CrossRef] [Scilit]
- Song, S.; Zhou, Q.; Chen, Z.; Liu, Y.; Zeng, X.; Li, X.; Cao, Y. 3D laser Nanoprinting of Ultra-High Conductivity Organic Bioelectronics. Laser Photonics Rev. 2026, e02686. [Google Scholar] [CrossRef] [Scilit]
- Stansbury, J.W.; Idacavage, M.J. 3D printing with polymers: Challenges among expanding options and opportunities. Dent. Mater. 2016, 32, 54–64. [Google Scholar] [CrossRef] [Scilit]
- Liu, Y.; Jin, G.; Lim, J.H.; Kim, J.E. Effects of washing agents on the mechanical and biocompatibility properties of water-washable 3D printing crown and bridge resin. Sci. Rep. 2024, 14, 9909. [Google Scholar] [CrossRef] [Scilit]
- Shi, H.; Liu, C.; Jiang, Q.; Xu, J. Effective Approaches to Improve the Electrical Conductivity of PEDOT:PSS: A Review. Adv. Electron. Mater. 2015, 1, 1500017. [Google Scholar] [CrossRef] [Scilit]
- Vedovatte, R.M.; Saccardo, M.C.; Costa, E.L.; Cava, C.E. PEDOT:PSS post-treated by DMSO using spin coating, roll-to-roll and immersion: A comparative study. J. Mater. Sci. Mater. Electron. 2020, 31, 317–323. [Google Scholar] [CrossRef] [Scilit]
- Lee, I.; Kim, G.W.; Yang, M.; Kim, T.S. Simultaneously Enhancing the Cohesion and Electrical Conductivity of PEDOT:PSS Conductive Polymer Films using DMSO Additives. ACS Appl. Mater. Interfaces 2016, 8, 302–310. [Google Scholar] [CrossRef] [Scilit] [PubMed]
- Tounakti, C.; Decorse, P.; Kouki, F.; Lang, P. Relationship between enhancement of PEDOT:PSS conductivity by solvent treatment and PSS chain reorganization. J. Polym. Sci. 2023, 61, 582–603. [Google Scholar] [CrossRef] [Scilit]
- Macgregor, W.S. The Chemical and Physical Properties of DMSO. Ann. N. Y. Acad. Sci. 1967, 141, 3–12. [Google Scholar] [CrossRef] [Scilit]
- Madou, M.J. Manufacturing Techniques for Microfabrication and Nanotechnology; Taylor and Francis: Boca Raton, FL, USA, 2011. [Google Scholar]
- Štaffová, M.; Ondreáš, F.; Svatík, J.; Zbončák, M.; Jánčář, J.; Lepcio, P. 3D printing and post-curing optimization of photopolymerized structures: Basic concepts and effective tools for improved thermomechanical properties. Polym. Test. 2022, 108, 107499. [Google Scholar] [CrossRef] [Scilit]
- Kasry, A.; Fadlallah, M.M.; Voelcker, N.H.; Maarouf, A.A. Experimental and theoretical demonstrations of ultraviolet absorption enhancement in porous nano-membrane graphene. Carbon 2019, 155, 65–70. [Google Scholar] [CrossRef] [Scilit]
- Uran, S.; Alhani, A.; Silva, C. Study of ultraviolet-visible light absorbance of exfoliated graphite forms. AIP Adv. 2017, 7, 035323. [Google Scholar] [CrossRef] [Scilit]
- Smausz, T.; Kondász, B.; Gera, T.; Ajtai, T.; Utry, N.; Pintér, M.; Kiss-Albert, G.; Budai, J.; Bozóki, Z.; Szabó, G. Determination of UV–visible–NIR absorption coefficient of graphite bulk using direct and indirect methods. Appl. Phys. A Mater. Sci. Process. 2017, 123, 633. [Google Scholar] [CrossRef] [Scilit]
- Mubarak, S.; Dhamodharan, D.; Kale, M.B.; Divakaran, N.; Senthil, T.; P, S.; Wu, L.; Wang, J. A Novel Approach to Enhance Mechanical and Thermal Properties of SLA 3D Printed Structure by Incorporation of Metal–Metal Oxide Nanoparticles. Nanomaterials 2020, 10, 217. [Google Scholar] [CrossRef] [Scilit] [PubMed]
- Weng, Z.; Zhou, Y.; Lin, W.; Senthil, T.; Wu, L. Structure-property relationship of nano enhanced stereolithography resin for desktop SLA 3D printer. Compos. Part A Appl. Sci. Manuf. 2016, 88, 234–242. [Google Scholar] [CrossRef] [Scilit]
- Mondal, D.; Willett, T.L. Enhanced mechanical performance of mSLA-printed biopolymer nanocomposites due to phase functionalization. J. Mech. Behav. Biomed. Mater. 2022, 135, 105450. [Google Scholar] [CrossRef] [Scilit]
- Song, S.Y.; Park, M.S.; Lee, J.W.; Yun, J.S. A Study on the Rheological and Mechanical Properties of Photo-Curable Ceramic/Polymer Composites with Different Silane Coupling Agents for SLA 3D Printing Technology. Nanomaterials 2018, 8, 93. [Google Scholar] [CrossRef] [Scilit]
- Khodakarimi, S.; Hekhmatshoar, M.H.; Nasiri, M.; Khaleghi Moghaddam, M.; Abbasi, F. Effects of process and post-process treatments on the electrical conductivity of the PEDOT:PSS films. J. Mater. Sci. Mater. Electron. 2016, 27, 1278–1285. [Google Scholar] [CrossRef] [Scilit]
- Huang, J.; Miller, P.F.; De Mello, J.C.; Bradley, D.D.C. Influence of thermal treatment on the conductivity and morphology of PEDOT/PSS films. Synth. Met. 2003, 139, 569–572. [Google Scholar] [CrossRef] [Scilit]
- Xie, Z.; Ventura, H.; Ardanuy, M. A Review of the Electrical Conductivity Test Methods for Conductive Fabrics. Textiles 2024, 4, 284–308. [Google Scholar] [CrossRef] [Scilit]
- Clingerman, M.L.; King, J.A.; Schulz, K.H.; Meyers, J.D. Evaluation of electrical conductivity models for conductive polymer composites. J. Appl. Polym. Sci. 2002, 83, 1341–1356. [Google Scholar] [CrossRef] [Scilit]
- Shrotriya, V.; Yang, Y. Capacitance voltage characterization of polymer light emitting diodes. J. Appl. Phys. 2005, 97, 054504. [Google Scholar] [CrossRef] [Scilit]
- Kaiser, A.B.; Park, Y.W. Current-voltage characteristics of conducting polymers and carbon nanotubes. Synth. Met. 2005, 152, 181–184. [Google Scholar] [CrossRef] [Scilit]
- Marion, B.; Rummel, S.; Anderberg, A. Current-voltage curve translation by bilinear interpolation. Prog. Photovolt. Res. Appl. 2004, 12, 593–607. [Google Scholar] [CrossRef] [Scilit]
- Türüt, A. On current-voltage and capacitance-voltage characteristics of metal-semiconductor contacts. Turk. J. Phys. 2021, 44, 302–347. [Google Scholar] [CrossRef] [Scilit]
- Antonov, A.Y.; Varayun, M.I. I–V Curve Investigation with Regression Methods. In 2016 14th International Baltic Conference on Atomic Layer Deposition (BALD); IEEE: New York, NY, USA, 2016. [Google Scholar]
- Goldstein, J.I.; Newbury, D.E.; Echlin, P.; Joy, D.C.; Romig, A.D., Jr.; Lyman, C.E.; Fiori, C.; Lifshin, E. Coating and Conductivity Techniques for SEM and Microanalysis. In Scanning Electron Microscopy and X-Ray Microanalysis: A Text for Biologists, Materials Scientists, and Geologists; Springer: Boston, MA, USA, 1992. [Google Scholar]
- Minar, J.; Pulpan, J.; Vesely, P.; Sefl, O.; Dušek, K. Electrical Properties of Photopolymers for 3D Printing. In Proceedings of the International Spring Seminar on Electronics Technology; IEEE Computer Society: New York, NY, USA, 2021. [Google Scholar]
- Liang, Y. Biobased Epoxy Composites: Sustainable Alternative for Advanced Materials; Case Western Reserve University: Cleveland, OH, USA, 2018. [Google Scholar]
- Pietronero, L.; Strassler, S.; Zeller, H.R.; Rice, M.J. Electrical conductivity of a graphite layer. Phys. Rev. 1980, 22, 904–910. [Google Scholar] [CrossRef] [Scilit]
- Van Reenen, S.; Scheepers, M.; Van De Ruit, K.; Bollen, D.; Kemerink, M. Explaining the effects of processing on the electrical properties of PEDOT:PSS. Org. Electron. 2014, 15, 3710–3714. [Google Scholar] [CrossRef] [Scilit]
- Greco, G.; Giuri, A.; Gambino, S.; Carallo, S.; Carallo, S.; Ingrosso, C.; Kiani, A.; Acocella, M.R.; Rizzo, A.; Corcione, C.E. Sustainable and cost-effective edge oxidized graphite/PEDOT:PSS nanocomposites with improved electrical conductivity. J. Sci. Adv. Mater. Devices 2024, 9, 100723. [Google Scholar] [CrossRef] [Scilit]
- Reza, T.; Kausar, A. Electrical Conductivity in Polymer-Based Composites: Experiments, Modelling and Applications; William Andrew: Norwich, NY, USA, 2018. [Google Scholar]
- Yoshino, T. Electrical conductivity measurement. In Magmas Under Pressure: Advances in High-Pressure Experiments on Structure and Properties of Melts; Elsevier: Amsterdam, The Netherlands, 2018; pp. 281–319. [Google Scholar]
- Gad, M.M.; Alshehri, S.Z.; Alhamid, S.A.; Albarrak, A.; Khan, S.Q.; Alshahrani, F.A.; Alqarawi, F.K. Water Sorption, Solubility, and Translucency of 3D-Printed Denture Base Resins. Dent. J. 2022, 10, 42. [Google Scholar] [CrossRef] [Scilit]
- Temiz, A. The Tensile Properties of Functionally Graded Materials in MSLA 3D Printing as a Function of Exposure Time. J. Mater. Mechatron. A 2024, 5, 49–59. [Google Scholar]
- Ligon-Auer, S.C.; Schwentenwein, M.; Gorsche, C.; Stampfl, J.; Liska, R. Toughening of photo-curable polymer networks: A review. Polym. Chem. 2016, 7, 257–286. [Google Scholar] [CrossRef] [Scilit]
- Mamunya, E.P.; Davidenko, V.V.; Lebedev, E.V. Percolation conductivity of polymer composites filled with dispersed conductive filler. Polym. Compos. 1995, 16, 319–324. [Google Scholar] [CrossRef] [Scilit]
- Tsangaris, G.M.; Kazilas, M.C. Conductivity and percolation in epoxy resin/conductive filler composites. Mater. Sci. Technol. 2002, 18, 226–230. [Google Scholar] [CrossRef] [Scilit]
- Le Ouay, B.; Boudot, M.; Kitao, T.; Yanagida, T.; Kitagawa, S.; Uemura, T. Nanostructuration of PEDOT in Porous Coordination Polymers for Tunable Porosity and Conductivity. J. Am. Chem. Soc. 2016, 138, 10088–10091. [Google Scholar] [CrossRef] [Scilit]
- Huang, X.; Zhi, C. (Eds.) Polymer Nanocomposites Electrical and Thermal Properties; Springer: Berlin/Heidelberg, Germany, 2016. [Google Scholar]
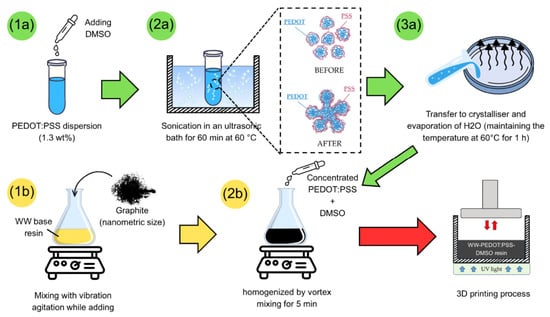
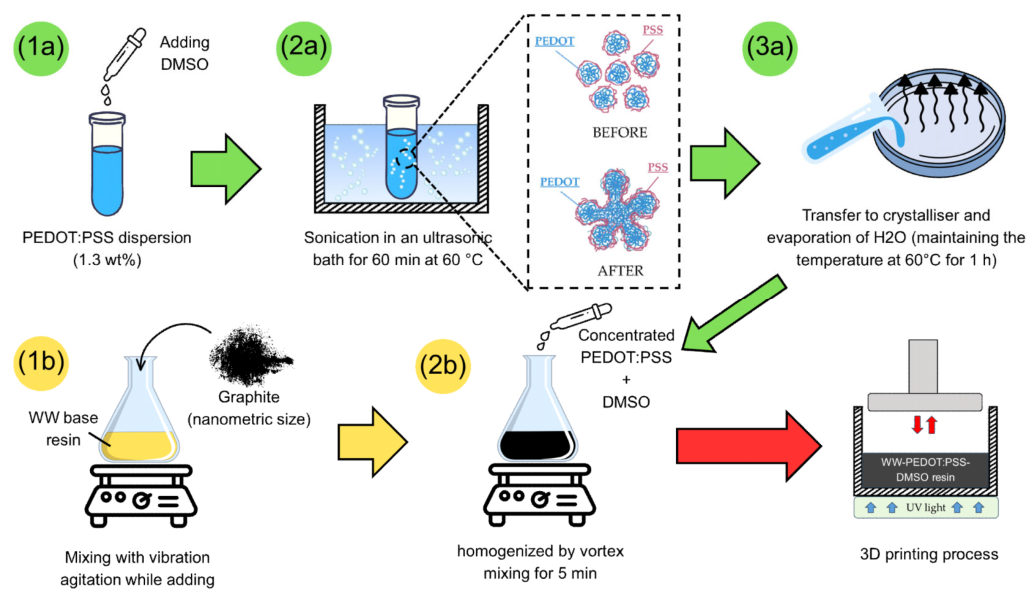
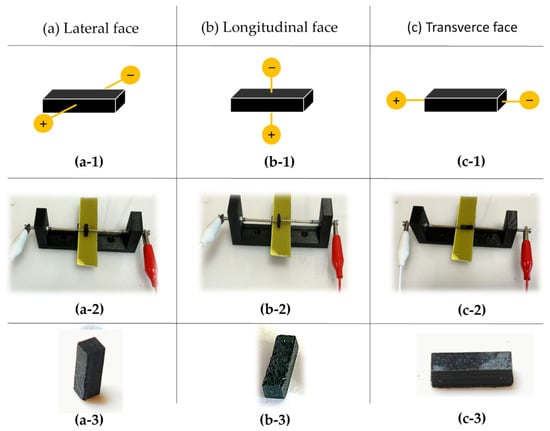
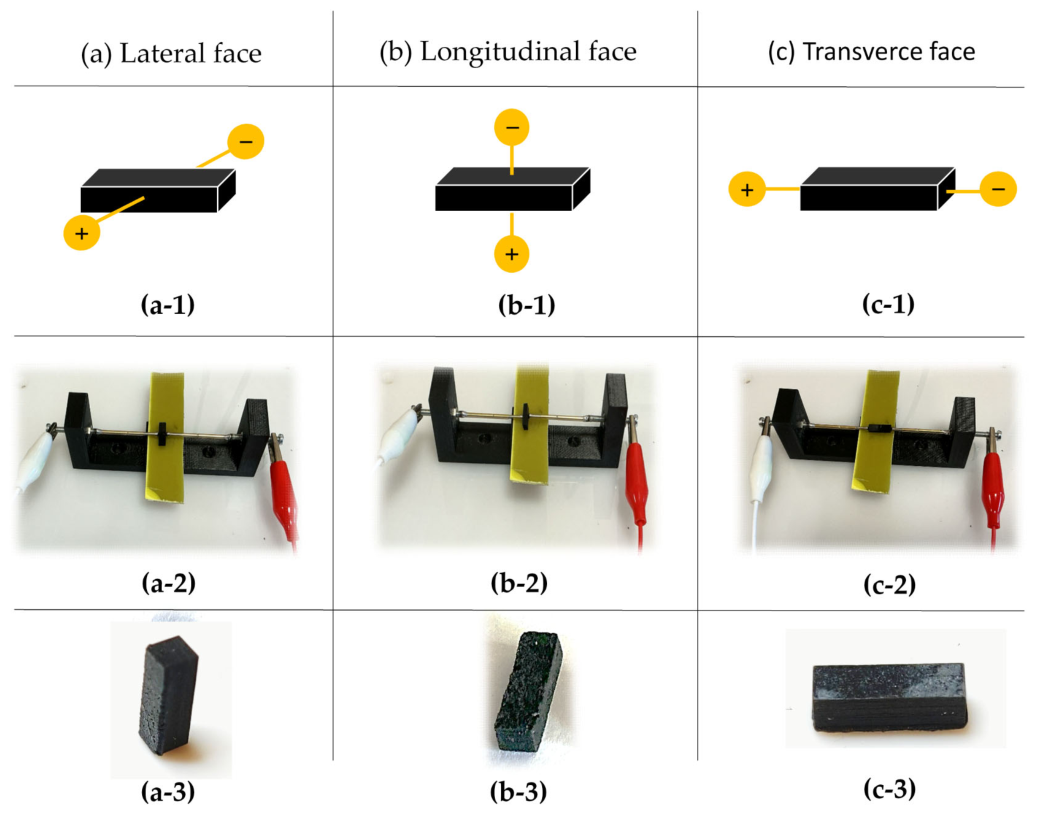
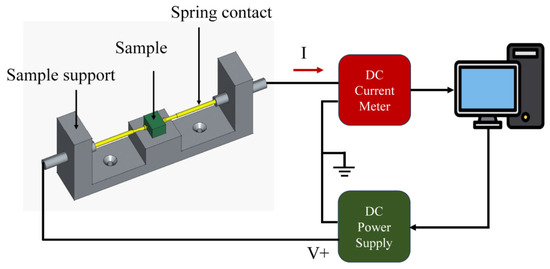
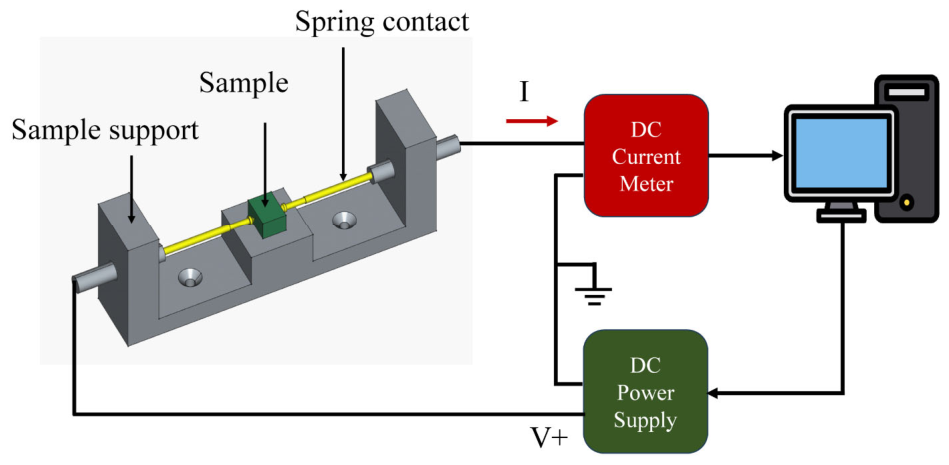
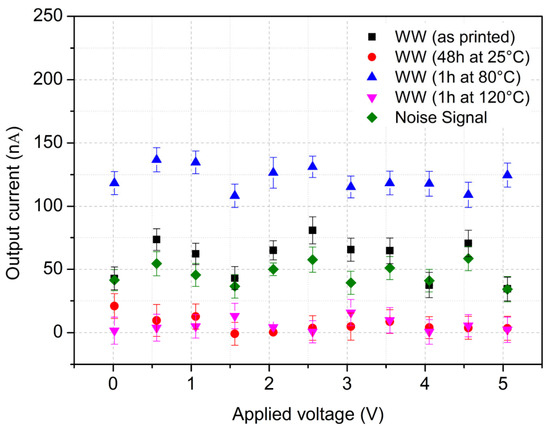
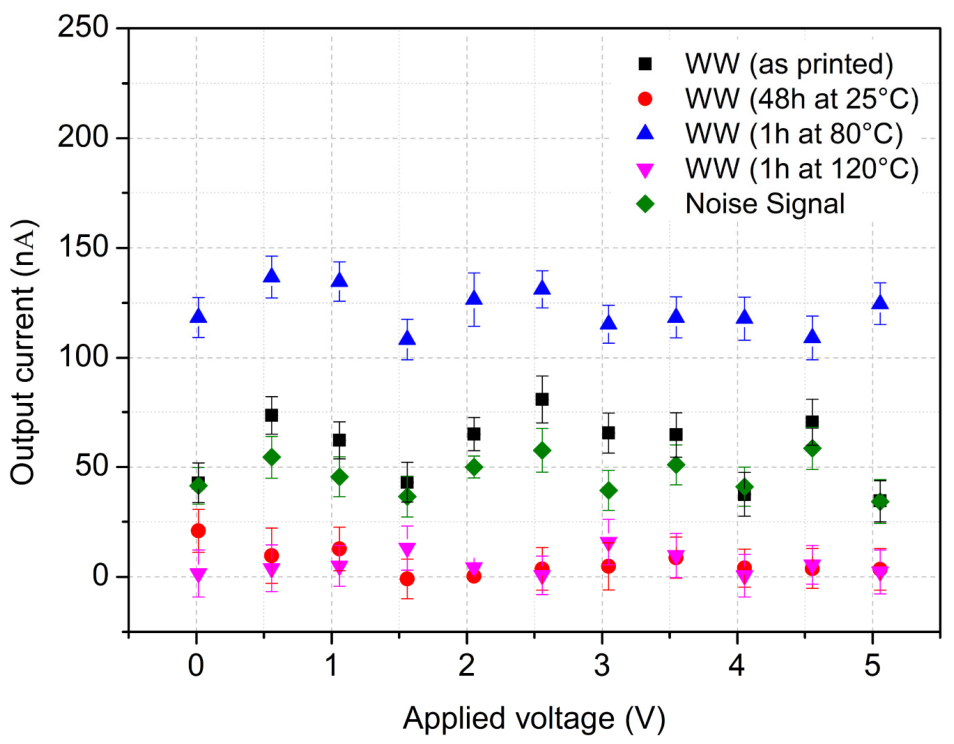
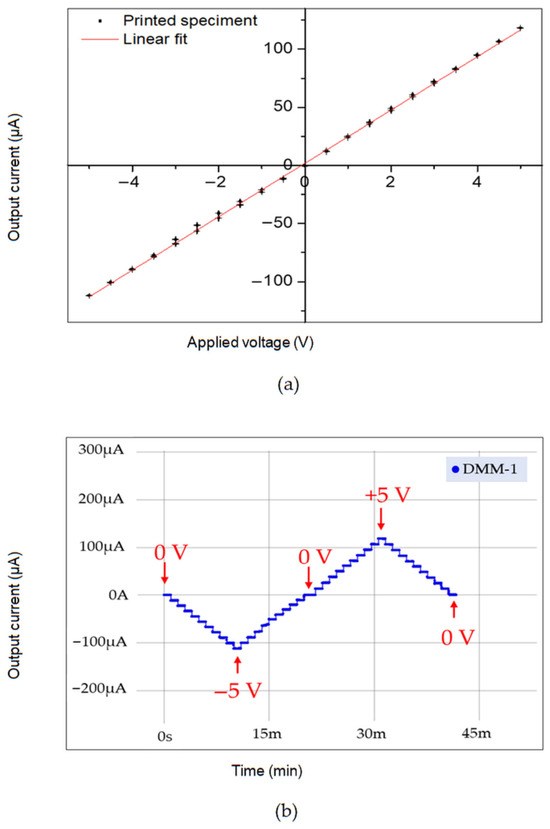
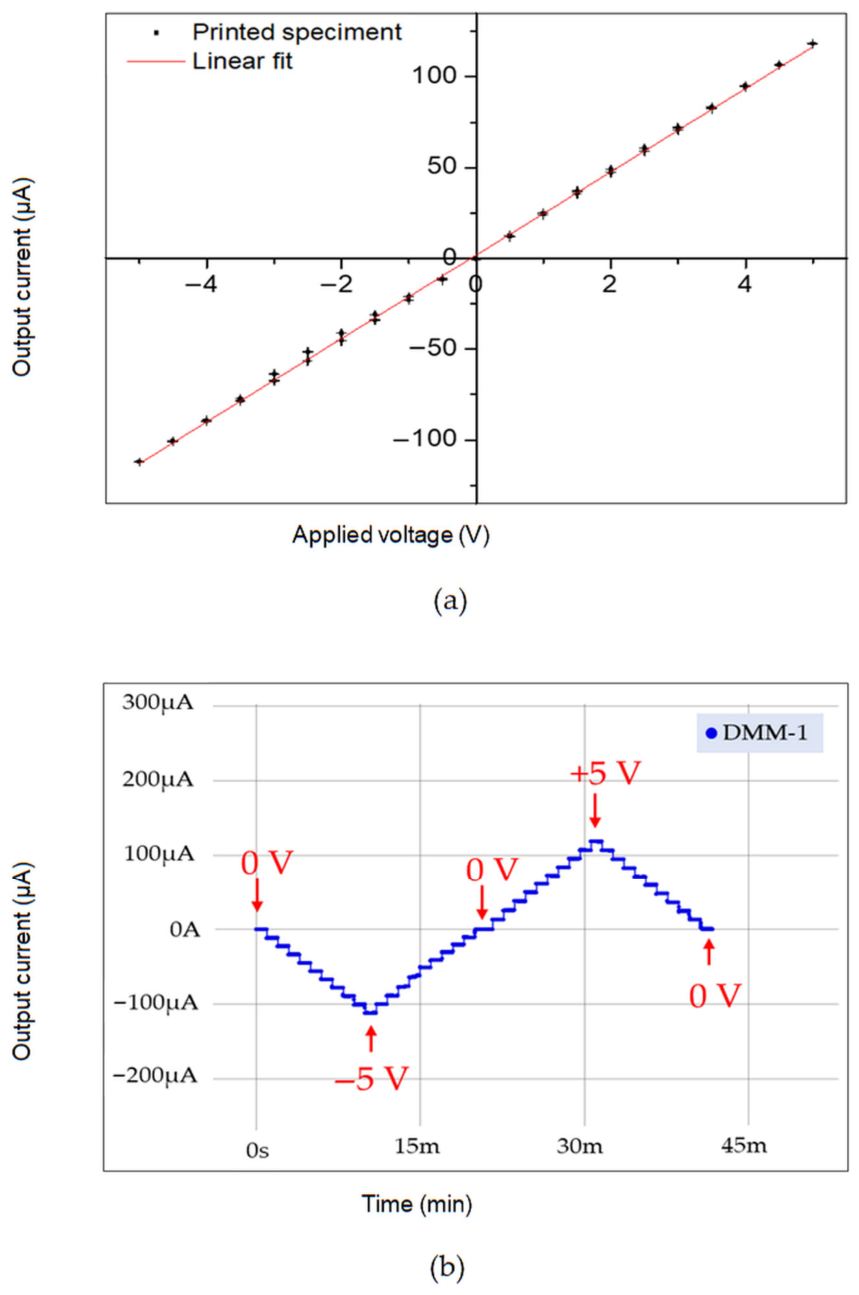
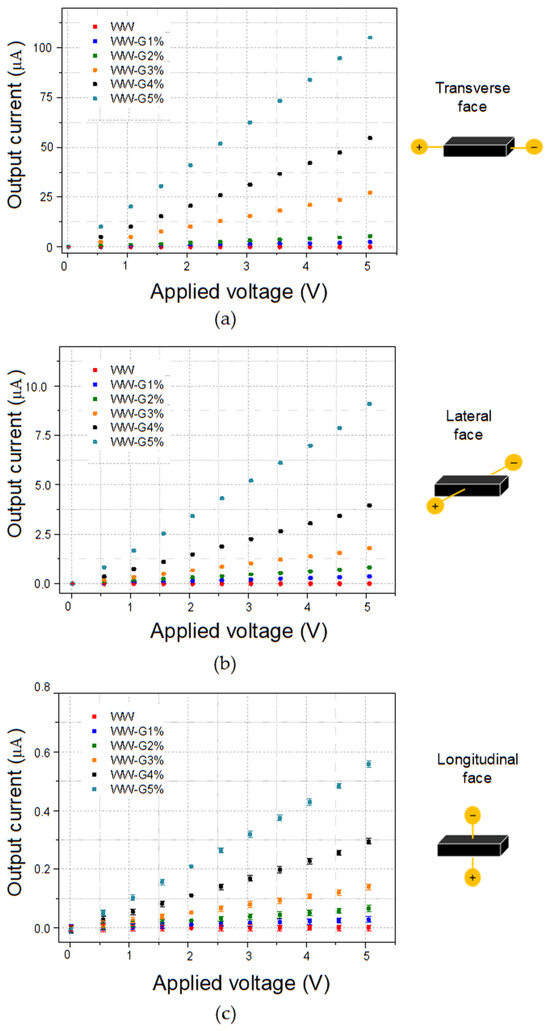
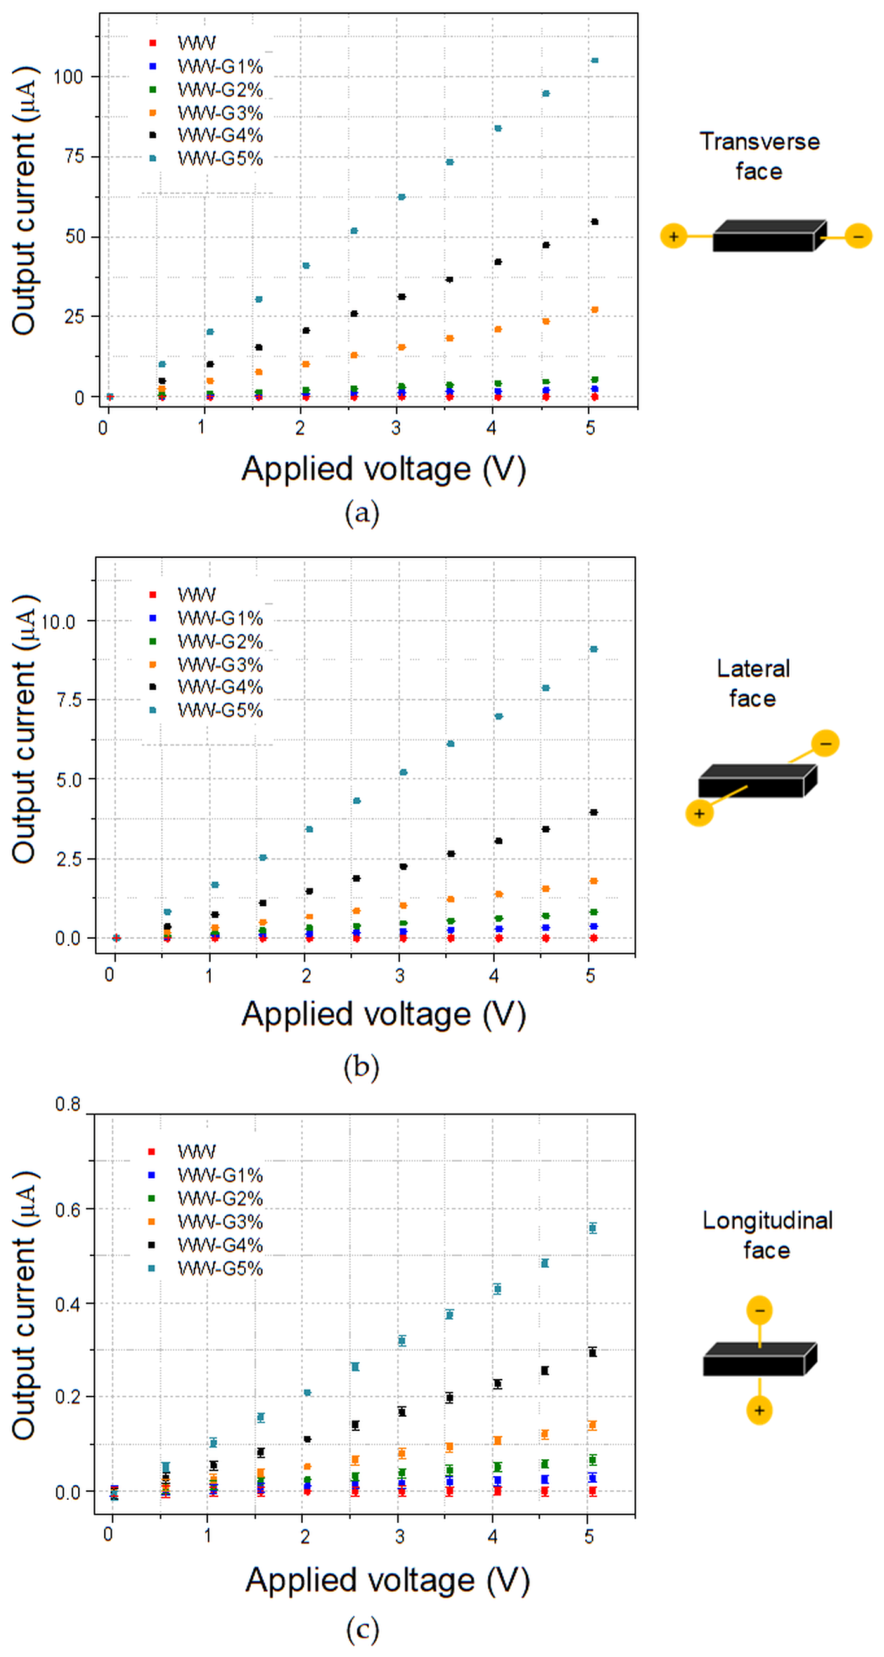
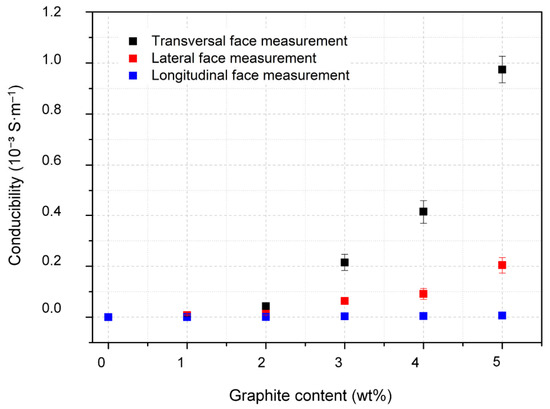
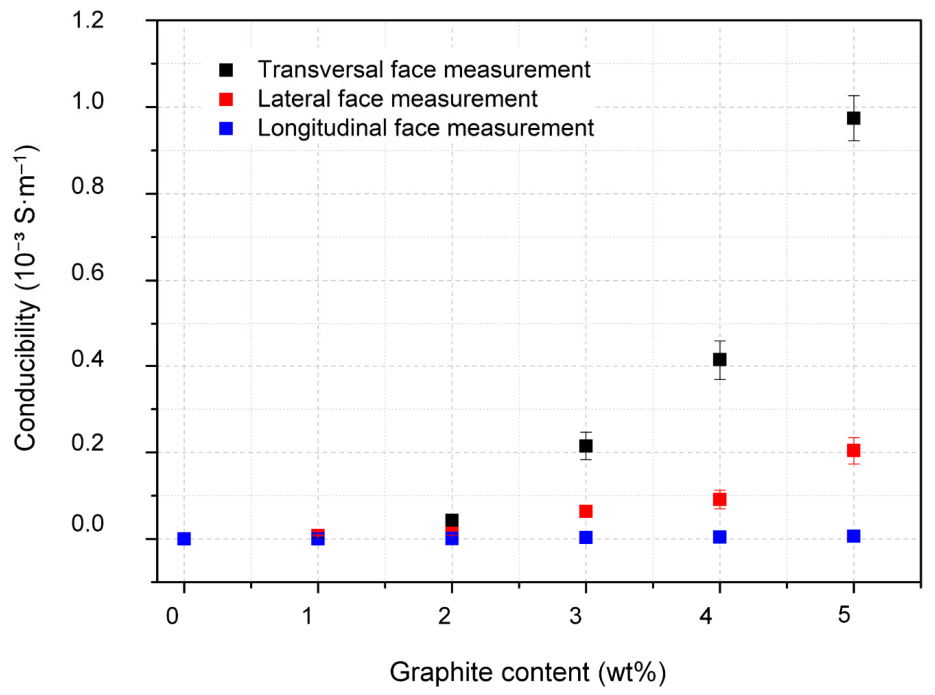
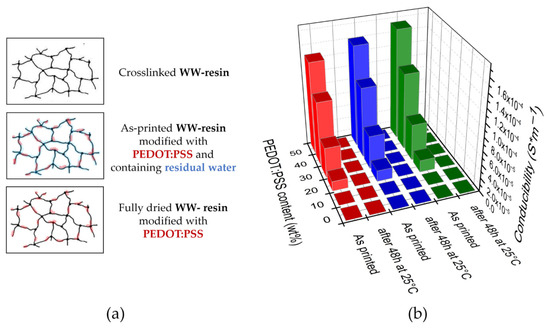
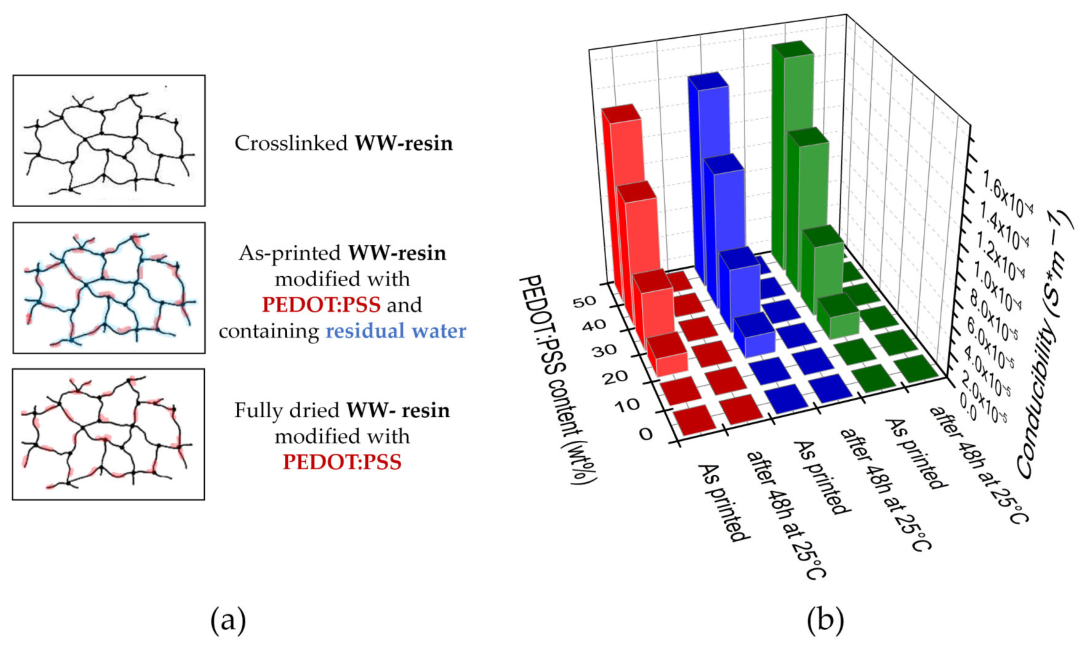
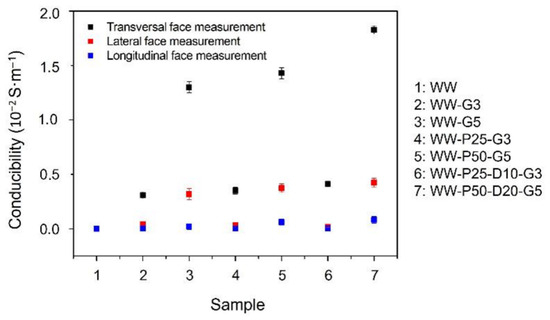
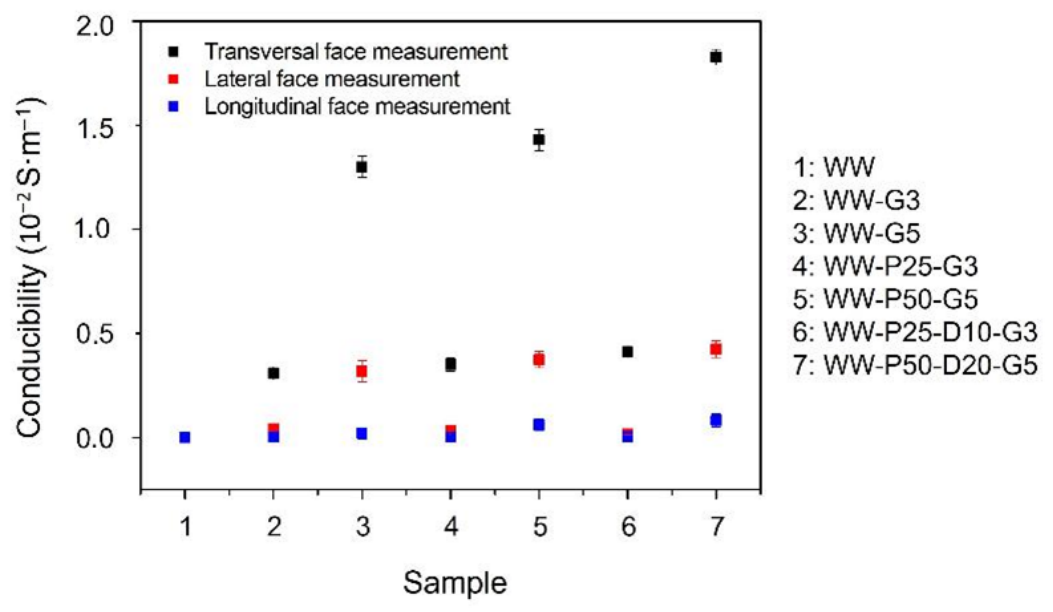
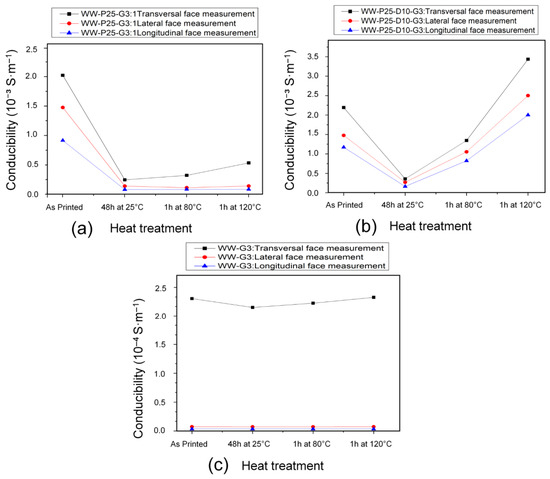
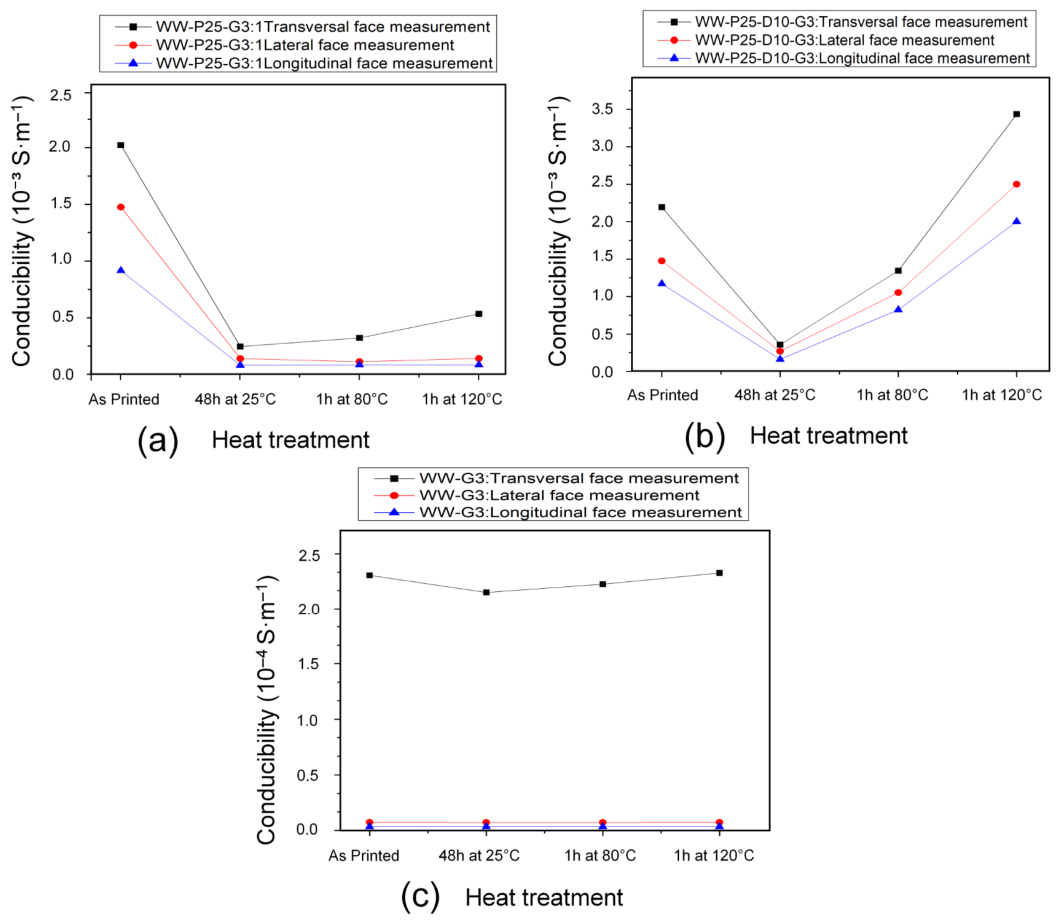
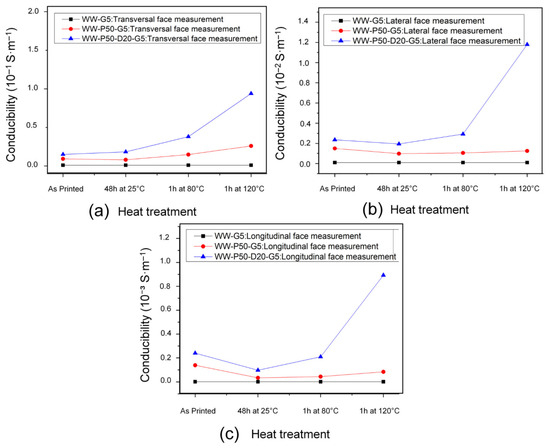
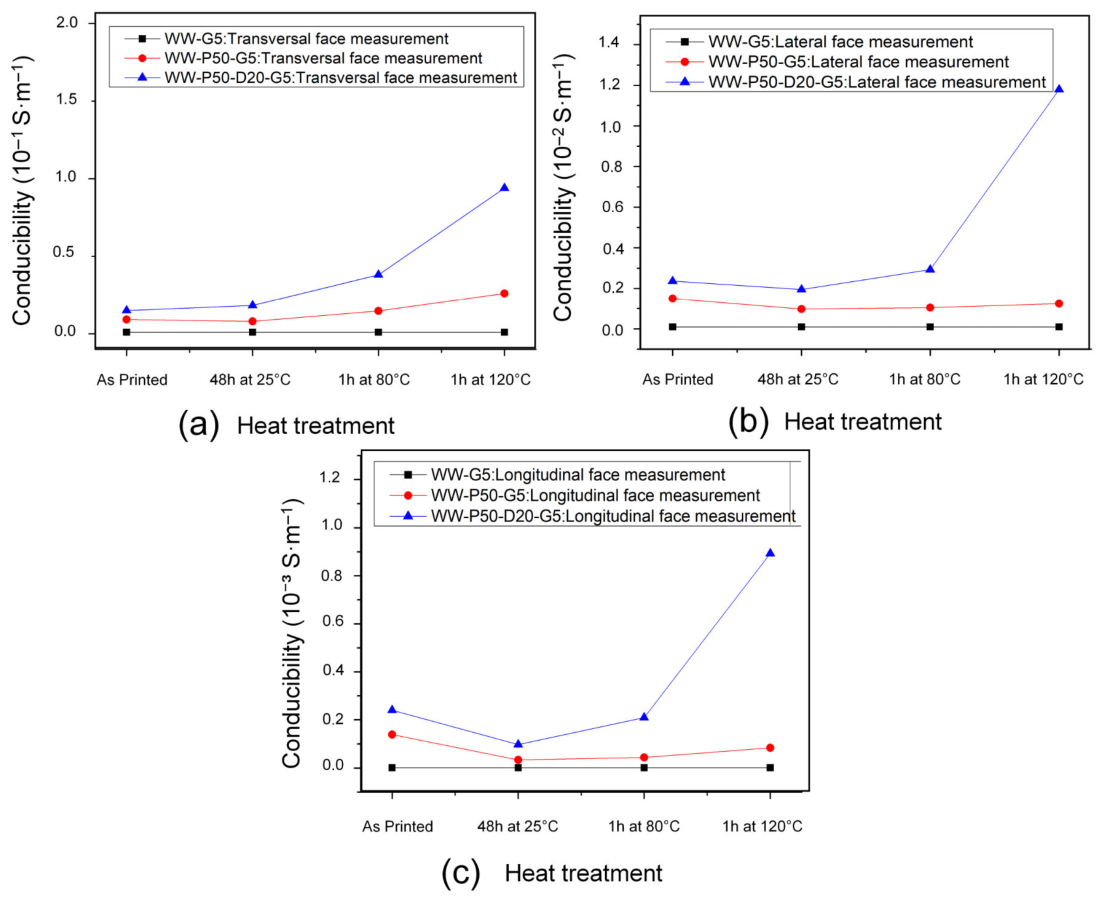
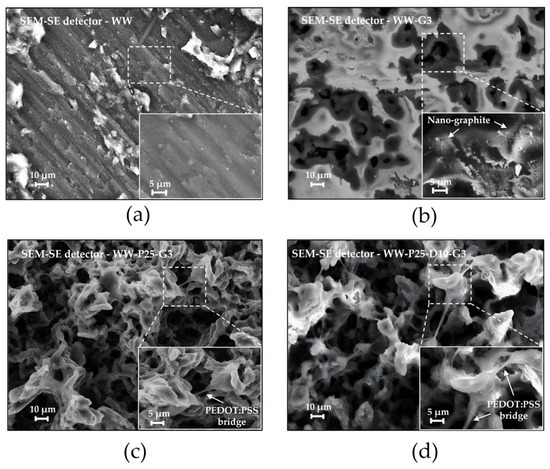
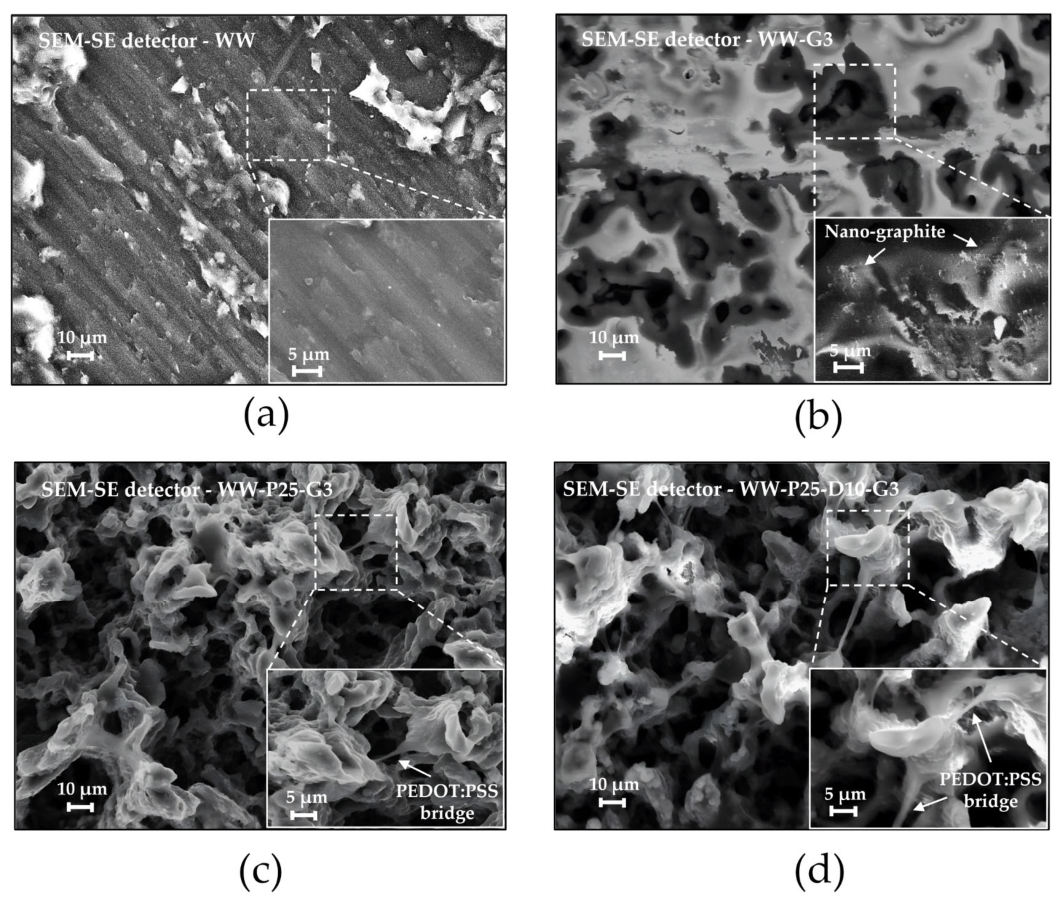
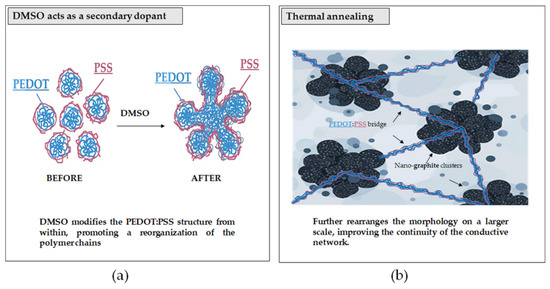
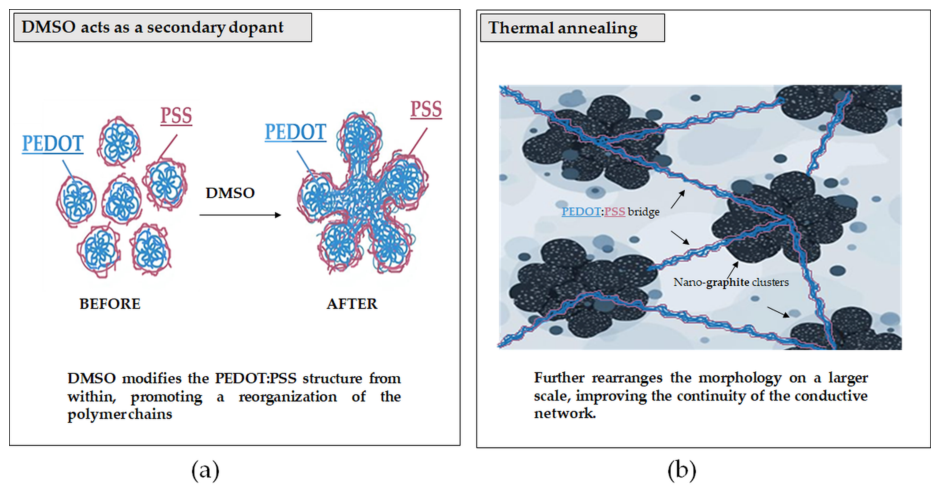
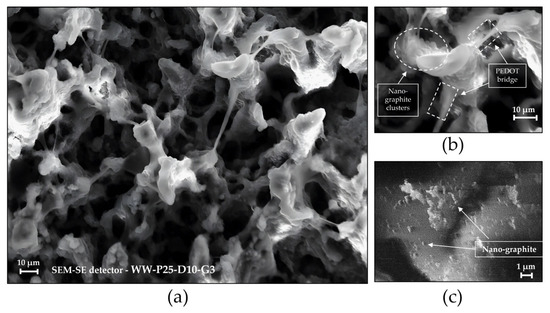
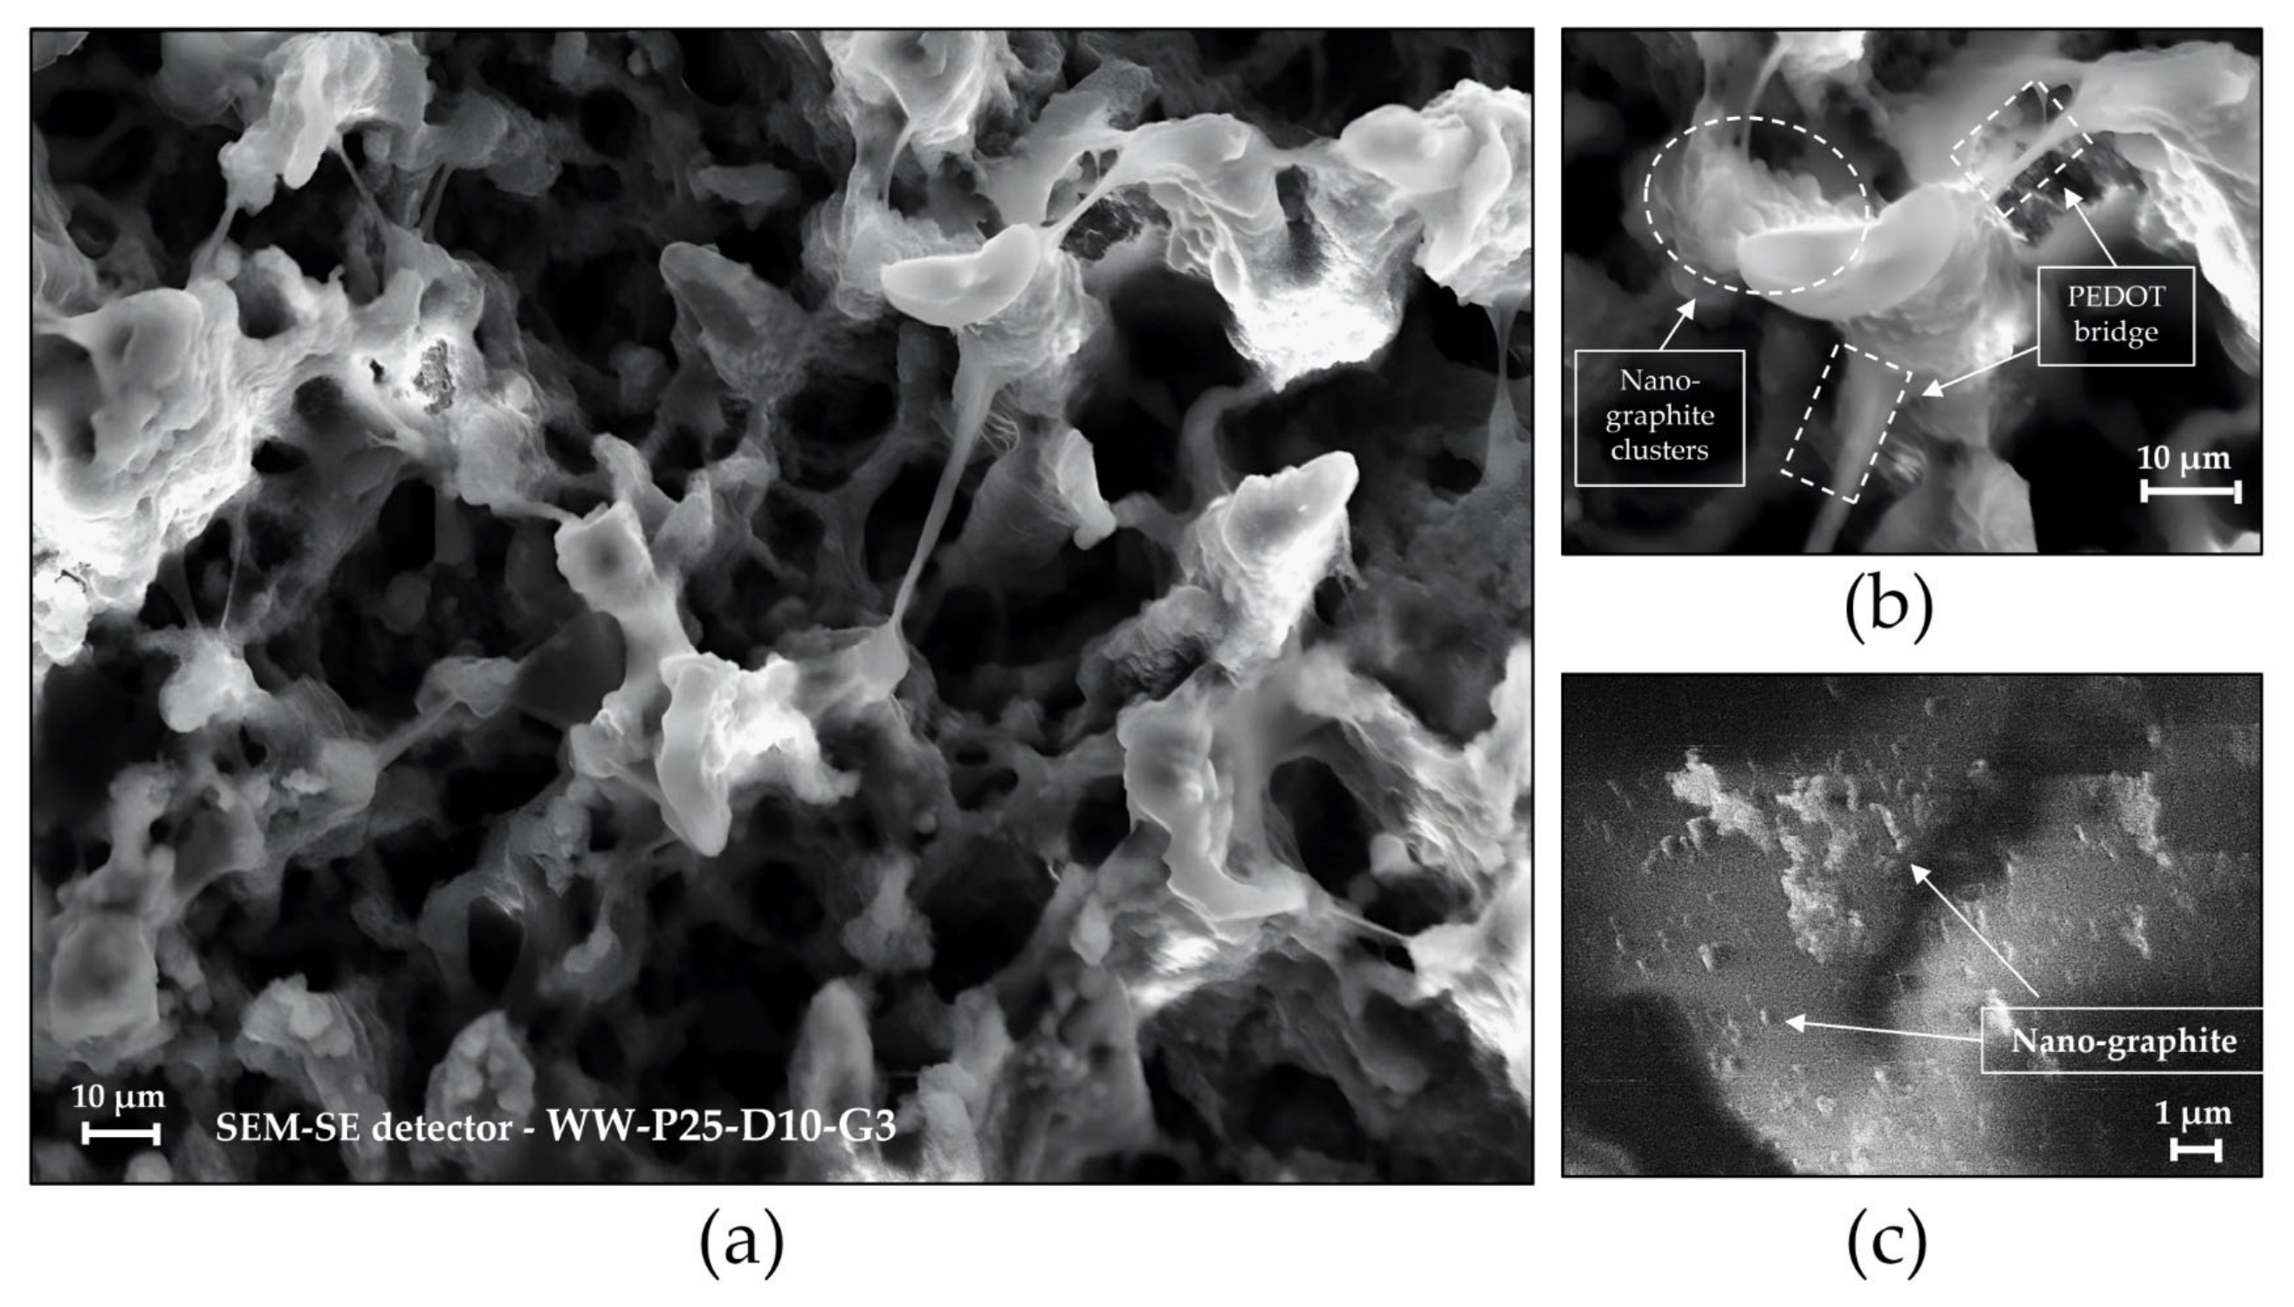
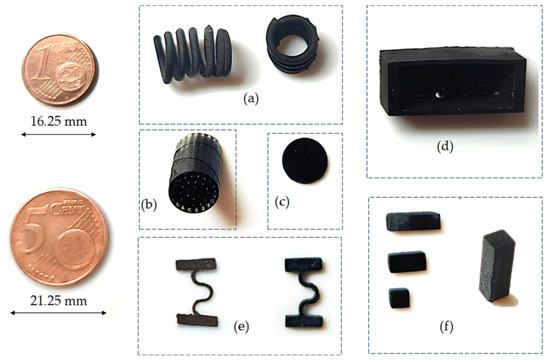
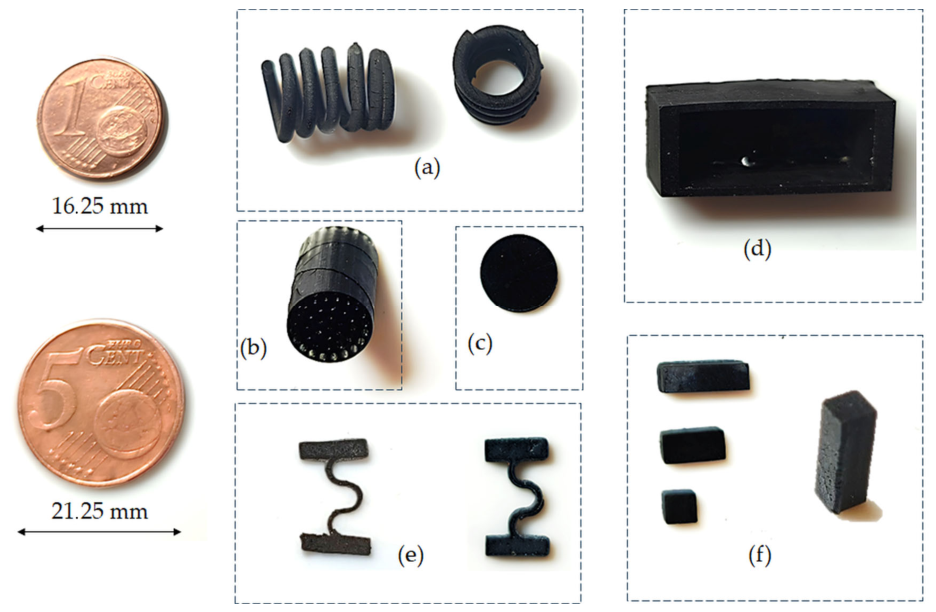

Disclaimer/Publisher’s Note: The statements, opinions and data contained in all publications are solely those of the individual author(s) and contributor(s) and not of MDPI and/or the editor(s). MDPI and/or the editor(s) disclaim responsibility for any injury to people or property resulting from any ideas, methods, instructions or products referred to in the content. |
© 2026 by the authors. Licensee MDPI, Basel, Switzerland. This article is an open access article distributed under the terms and conditions of the Creative Commons Attribution (CC BY) license.