


Abstract
Carbon Fiber Reinforced Polymers (CFRP) are extensively utilized in high-performance engineering, yet localized structural discontinuities can severely compromise their integrity. This paper aims to achieve high-sensitivity characterization of such anomalies using a proposed acoustic shearography technique based on continuous acoustic excitation. A comprehensive finite element model (FEM) was developed to clarify the mechanical-energy coupling between the acoustic fields and localized surface strain field modulations. By exploiting ultrasonic energy coupling, the localized features of discontinuities were identified through full-field, non-contact optical measurement of localized phase distortions. Key parameters, including shearing amount, excitation frequency, driving voltage, and geometric characteristics of blind flat-bottom holes (BFBH), were systematically investigated. The results demonstrate a high correlation between FEM simulations and experimental observations quantitatively elucidating how defect diameter and hole depth modulate surface strain distributions. The proposed hybrid acoustic optical approach achieves near-instantaneous full field imaging within a millisecond timeframe typically under 200 ms. Additionally, the methodology leverages localized acoustic resonance to significantly boost the signal-to-noise ratio (SNR) resulting in highly quantified phase map contrast.
1. Introduction
Carbon Fiber Reinforced Polymers (CFRP) are increasingly adopted in safety-critical structures across aerospace, wind energy, rail transit, and lightweight automotive industries due to their high specific strength and stiffness, as well as excellent corrosion and fatigue resistance [1]. However, the laminated architecture and strong anisotropy of CFRP make them susceptible to manufacturing- and service-induced subsurface defects, including delamination, matrix cracking, fiber breakage, voids, and impact damage [2,3]. Such defects are typically subsurface and localized and may initiate and propagate under complex stress fields or sustained loading, leading to structural stiffness degradation or catastrophic failure in severe cases [4,5]. Consequently, efficient and reliable non-destructive testing (NDT) and imaging techniques are essential for ensuring the structural integrity and operational safety of CFRP components.
Currently, the prevalent NDT methodologies for composites include X-ray Computed Tomography (XCT) [6], infrared thermography [7], conventional ultrasonic testing [8,9], and shearography [10]. While XCT offers high-resolution reconstruction of internal 3D structures and precise damage identification [11,12,13], its application to the rapid, on-site inspection of large-scale components is hindered by bulky equipment, low efficiency, and radiation hazards [14]. Infrared thermography facilitates large-area non-contact scanning [15]; however, it is limited by thermal conductivity, resulting in poor sensitivity to deep-seated defects and susceptibility to surface reflectivity interference. Although ultrasonic testing and its phased array derivatives [16] are mature in identifying delamination [17,18] and cracks [19,20], conventional inspection modes typically rely on point-by-point scanning with probes and require couplant. This contact-based operation significantly limits inspection efficiency on large complex curved surfaces or in high-temperature environments and makes intuitive full-field imaging less straightforward.
Shearography [21] is a full-field optical technique that accurately captures variations in displacement gradient fields through phase measurement techniques. It exhibits exceptional sensitivity to local stiffness anomalies induced by defects, leading to its widespread application in the nondestructive evaluation of composite materials. In practice, defect detectability strongly depends on the applied loading methods, which are commonly implemented via thermal [22], vacuum [23], or mechanical vibration [24]. These loading approaches may involve operational complexity, impose constraints on component geometry and inspection conditions, or provide insufficient excitation for minute subsurface defects [25,26]. Although numerical studies have explored complex defect scenarios [27,28,29], a more robust and versatile excitation strategy is needed for practical inspections.
To address these limitations, acoustic shearography has been developed by combining high-frequency acoustic excitation with full-field interferometric readout [30,31,32,33]. In this approach, piezoelectric transducers introduce acoustic energy into the structure, while shearography provides non-contact measurement of the resulting dynamic strain field. Compared with conventional ultrasonic scanning, acoustic shearography reduces reliance on point-by-point probe motion and enables visualization of localized resonance patterns over a wide field of view. Despite its potential, the coupling mechanism between acoustic frequency and the response of specific defect geometries has not been systematically established. Existing studies predominantly focus on macroscopic damage detection, leaving limited guidance for parameter selection and interpretation when targeting small-scale discontinuities [34,35,36].
Front-surface blind flat-bottom holes, BFBHs, in CFRP serve as controllable surrogate models for investigating localized stiffness discontinuities [37]. With precisely defined apertures and depths, BFBHs enable quantitative investigation of the correlation between defect geometry and the associated modulation of the acoustic-induced displacement gradient field. However, due to the anisotropic nature of laminated CFRP, the synergistic effects of excitation frequency, defect geometry, and shearing parameters remain insufficiently understood. Establishing systematic frequency–geometry–response relationships is therefore critical for optimizing imaging performance and improving the reliability of defect interpretation. In this study, we systematically investigated the coupling relationships between acoustic excitation frequency, BFBHs geometry, and the resulting interferometric response in CFRP laminates. Finite element simulations are combined with shearography experiments to interpret the underlying dynamic strain concentration based on the LDR principle and to validate the observed response trends. On this basis, we developed a practical parameter optimization strategy for acoustic shearography, specifically targeting excitation frequency and driving voltage to maximize defect contrast. Overall, this work provides quantitative guidance for parameter selection and supports more reliable full-field characterization of localized structural discontinuities in CFRP composites.
2. Methodology
2.1. Principle
Shearography based on a Michelson interferometer is commonly implemented in two forms: digital subtraction shearography and phase-stepping shearography. Digital subtraction shearography provides a simple baseline for fringe formation, whereas phase-stepping shearography introduces controlled phase modulation to enable quantitative phase retrieval and improved sensitivity.
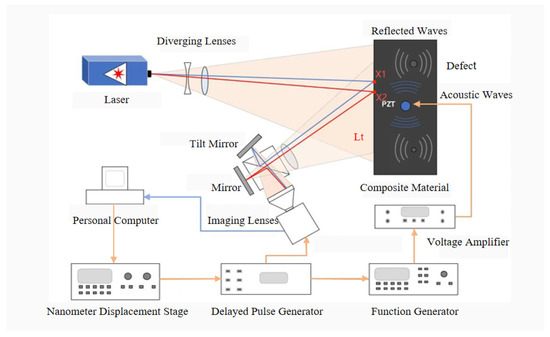
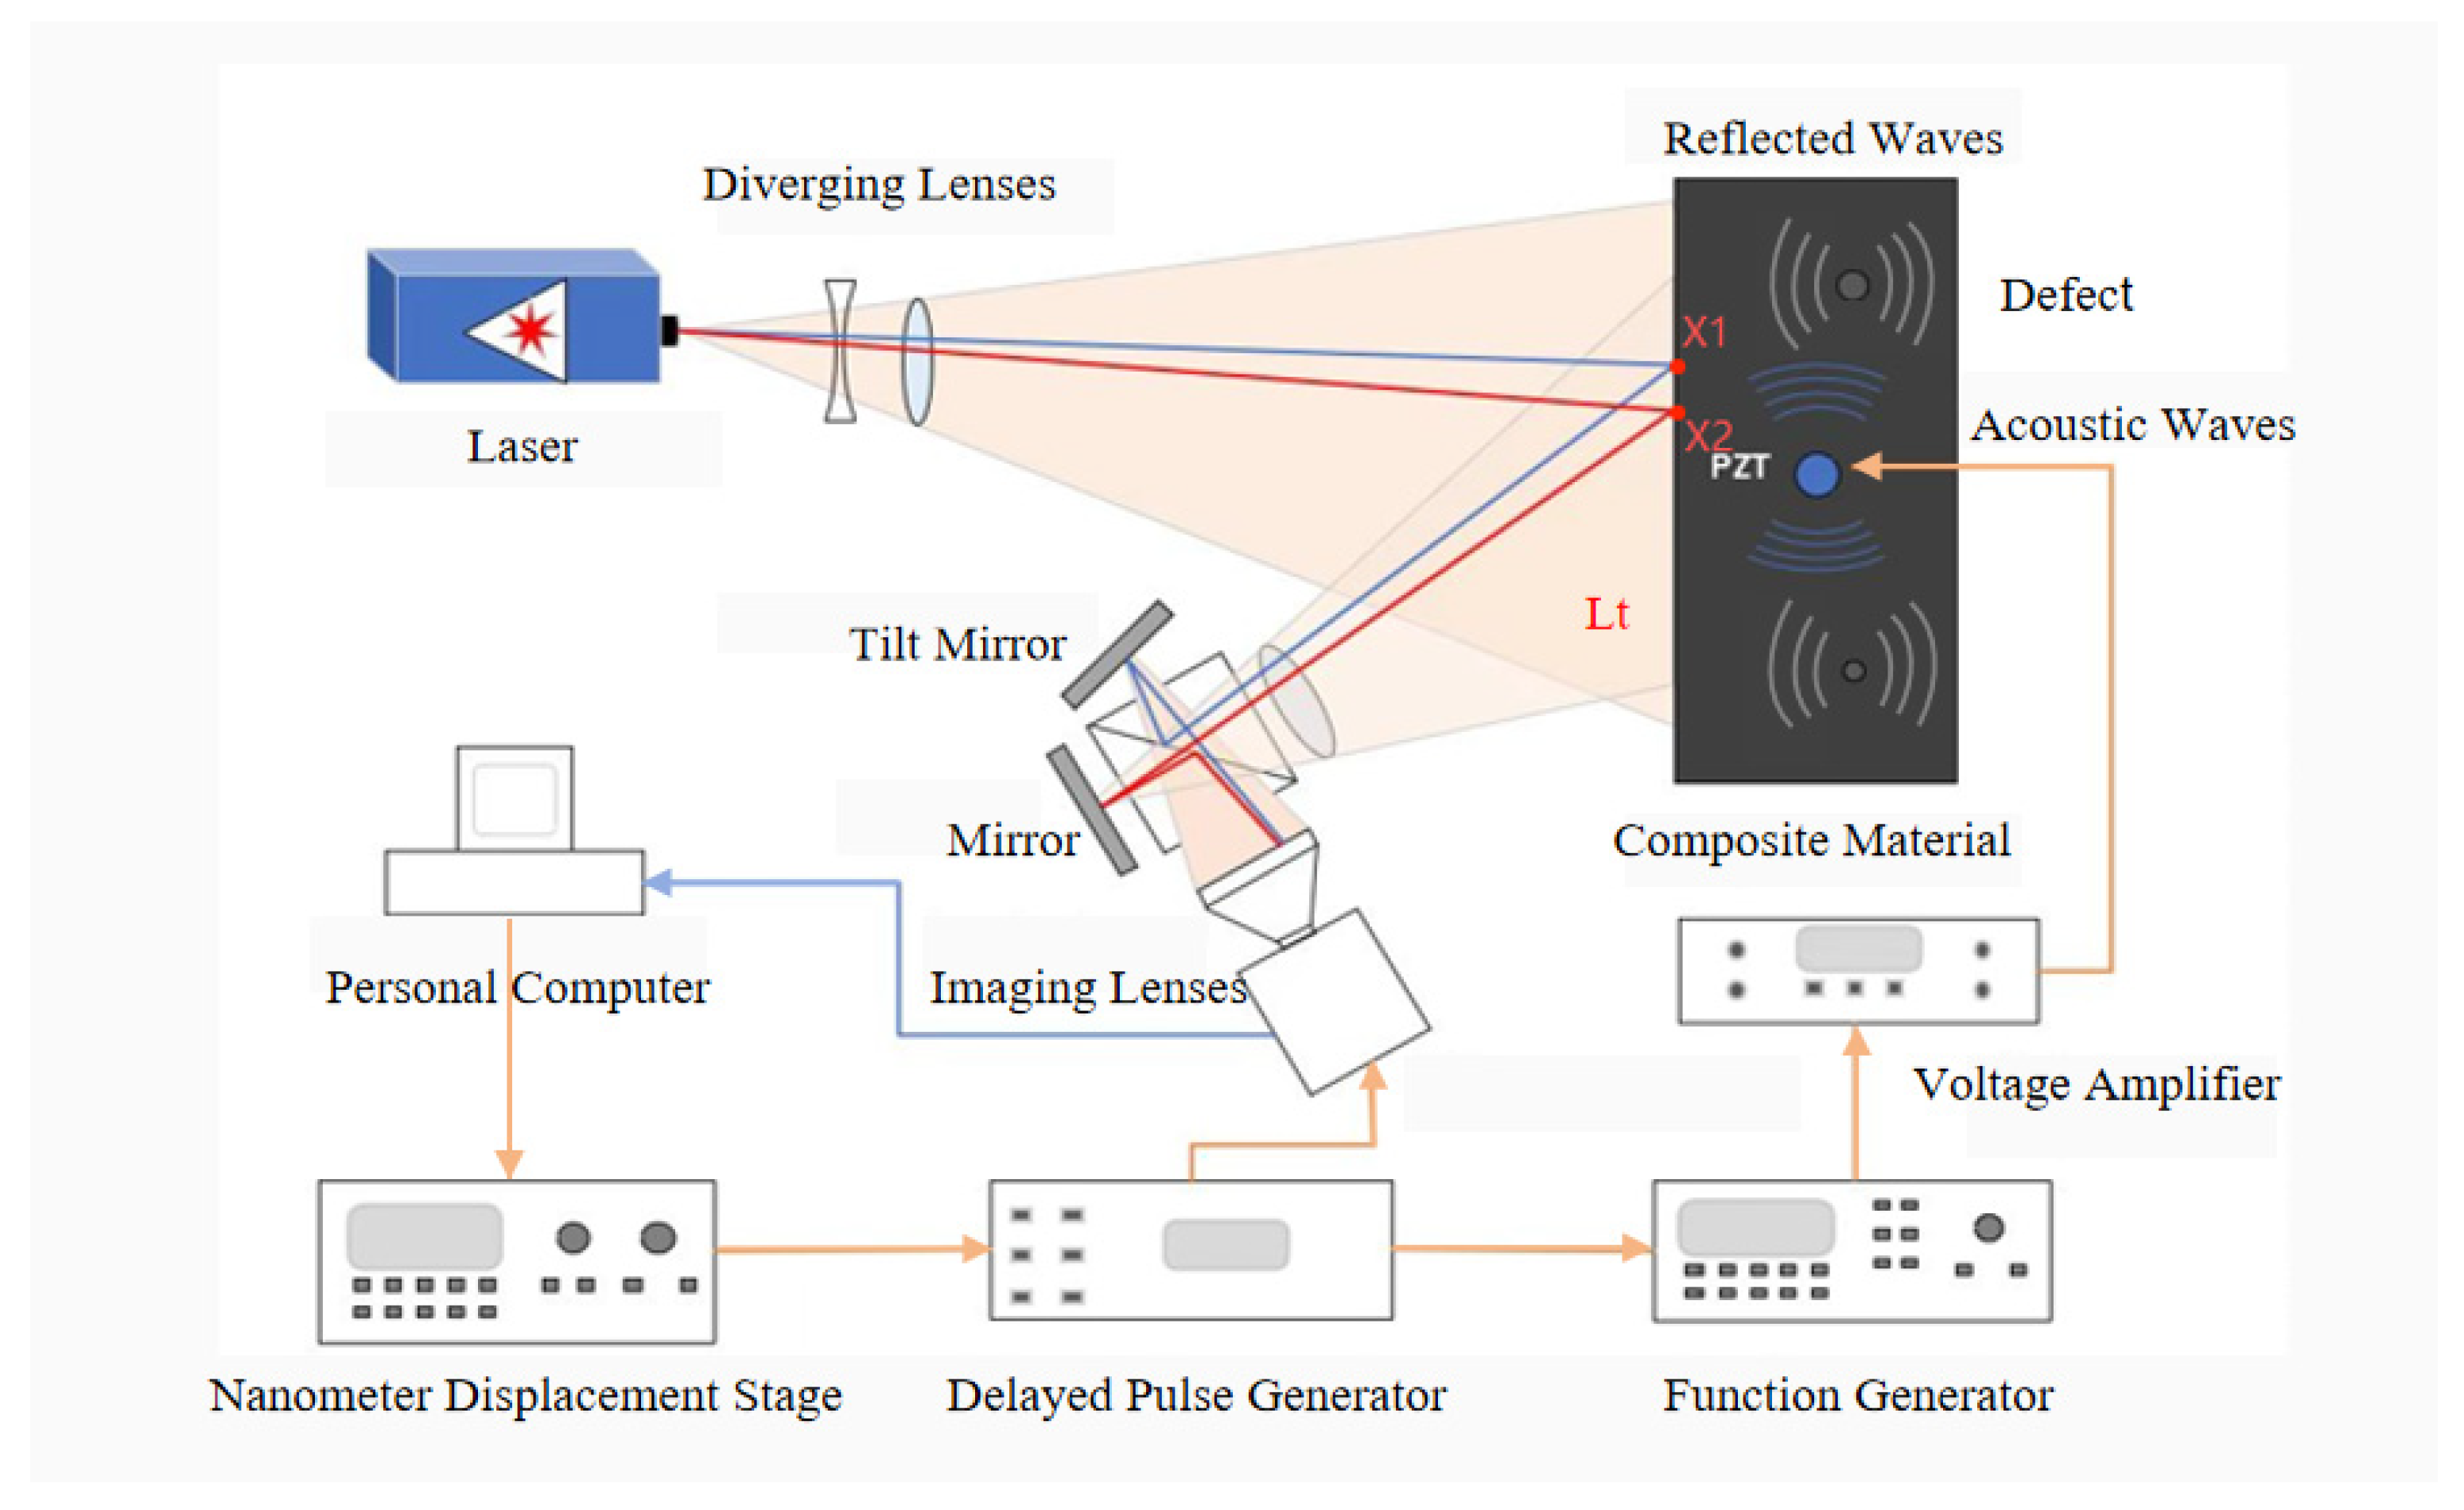
In the practice of subtraction shearography, obtaining the fundamental interference fringe pattern involves the arithmetic subtraction of the light intensities of two speckle images acquired in the unloaded and loaded states, respectively. The total optical field received by the image sensor at position Lt is the superposition of the optical fields illustrated in Figure 1. In the ideal case, we assume a shear distance exists only along the x-direction, and this relationship is described by Equation (1).
Figure 1.
The working principle of acoustic shear imaging includes a shear imaging optical system and ultrasonic excitation. Ultrasonic excitation generates sound waves to penetrate deeper into the sample, while the CCD detects deformation anomalies caused by the interaction of the sound waves with defects.
Expanding Equation (1) yields
here, and denote the amplitudes of the light waves from the distinct paths, while and correspond to their relative phases at positions and in the figure, respectively.
The recorded light intensity distribution in the reference state which is unloaded is given by Equation (3).
where the superscript ∗ denotes the complex conjugate. Expanding Equation (3) yields
For convenience, Equation (4) can be rewritten as
where , , and , denoting the phase difference between two sheared wave-fronts. As is depicted in Equation (3) the total light intensity is defined as the product of the total optical field and its complex conjugate . Subsequently, the object undergoes deformation under the action of the excitation source, inducing a relative phase difference between two sheared points and .
Substituting into the derived expression for the unloaded intensity yields the mathematical formulation of the light intensity in the loaded state, as presented in Equation (6).
The subtraction shearogram is then formed from the difference between the loaded and unloaded intensity maps. In practice, the raw difference contains both positive and negative values; therefore, an absolute value (or equivalently an offset/rescaling) is commonly applied for display and subsequent processing within the non-negative camera dynamic range.
The intensity distribution of the subtraction shearogram is thus described by Equation (7):
Expanding Equation (7) yields
In a Michelson-type shearing interferometer system, when acoustic excitation causes small deformations on the surface of an object, the resulting relative phase difference is related to the out-of-plane displacement gradient of the object’s surface as follows:
here, is the laser wavelength. is the shear amount, which is the spatial displacement between two points on the object’s surface. is the gradient of displacement w along the shear direction x. This formula assumes that the beam is nearly normally incident and reflects normally, so that the phase change is mainly attributed to the out-of-plane displacement component perpendicular to the specimen surface. However, the raw interference patterns acquired from the Michelson interferometer are severely degraded by high-frequency speckle fluctuations. This stochastic intensity modulation drastically reduces the fringe visibility, rendering the direct analytical extraction of the phase difference highly unreliable. To achieve high-precision quantitative measurement, a structured phase-shifting procedure combined with advanced digital image processing is required to resolve the underlying phase information from the modulated intensity distributions.
2.2. Phase Extraction and Speckle Noise Reduction
To extract high precision phase information from high-noise laser speckles, this study integrates a phase-shifting technique into a shear system based on a Michelson interferometer. A piezoelectric transducer (PZT) is mounted on the reference mirror and driven to produce precise displacements, thereby inducing phase modulation. The ‘4 + 4’ phase-shifting algorithm is employed, where four speckle images with phase shifts are acquired both before and after loading to accurately calculate the target phase. In the context of the four-step phase-shifting algorithm, the intensity expressions in Equations (5) and (6) can be rewritten as Equations (10) and (11), which accounts for the phase modulation at each step.
Based on trigonometric identities, the phase distributions before and after loading can be expressed as
Therefore, the phase change can be expressed as
Since direct subtraction may result in phase wrapping due to phase jumps in , which can be significantly affected by laser speckle noise, air fluctuations, and CCD noise, we do not simply use Formulas (12) and (13) for subtraction. Instead, we introduce complex division to calculate the phase difference, which effectively cancels out system errors, ensuring that the phase difference calculation remains stable and within range :
Expanding Equation (15) yields
Equation (16) can be rewritten as
Influenced by interference factors such as laser speckle characteristics, ambient air vibrations, and CCD camera noise, the experimentally acquired shearography phase maps typically exhibit significant noise levels. This speckle noise is characterized by signal dependence and multiplicative modulation; moreover, its frequency spectrum falls within the same high-frequency domain as the target phase information. Consequently, effectively filtering out the noise while accurately preserving critical phase details is of paramount importance. To address this challenge, this study primarily employs a sine-cosine filtering method to process the phase maps.
2.3. Sine-Cosine Filtering Algorithm
When conventional spatial filters are applied directly to a wrapped phase map, the discontinuities at 2π phase jumps are often misinterpreted as high-frequency noise. This typically leads to erroneous smoothing across jump locations, thereby distorting local phase features and attenuating sharp phase transitions. To overcome this limitation, we adopt a sine–cosine filtering strategy, which exploits the continuity of trigonometric functions to transform the wrapped phase into two continuous components.
Specifically, the wrapped phase map is first mapped to its sine and cosine representations, and , respectively, as defined in Equations (18) and (19). This transformation converts the discontinuities induced by phase wrapping into smoothly varying signals, avoiding the artificial “spike” suppression commonly introduced by direct filtering in the phase domain. The two components are then filtered independently, and the filtered phase is reconstructed from the filtered sine and cosine fields.
Mean filtering is independently applied to the two components derived from the sine and cosine components, utilizing a filter window size of . The filtered fields, denoted as and , are expressed as
Subsequently, the de-noised phase map is reconstructed from the filtered sine and cosine components by an inverse trigonometric operation, as given in Equation (22):
In practice, the mean-filter window size is set to 5 × 5 in order to maximize the retention of local strain field characteristics caused by defects while filtering out high-frequency noise. The selection of a filtering window needs to balance noise suppression and spatial resolution. For the CFRP speckle field in this experiment, an excessively large window will blur the boundaries of small defects, such as a 3 mm defect, while a window that is too small cannot eliminate the noise in the phase. Consequently, the comprehensive phase extraction and phase filtering algorithms described in the Principle section were implemented using MATLAB R2021b® to ensure both computational efficiency and image fidelity.
3. Finite Element Analysis (FEA) of Acoustic Loading
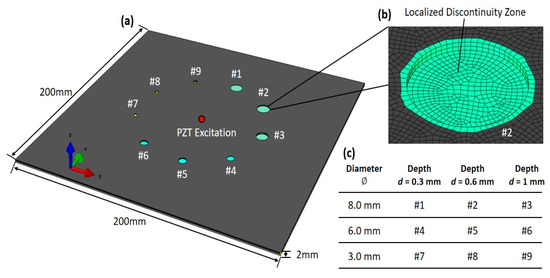
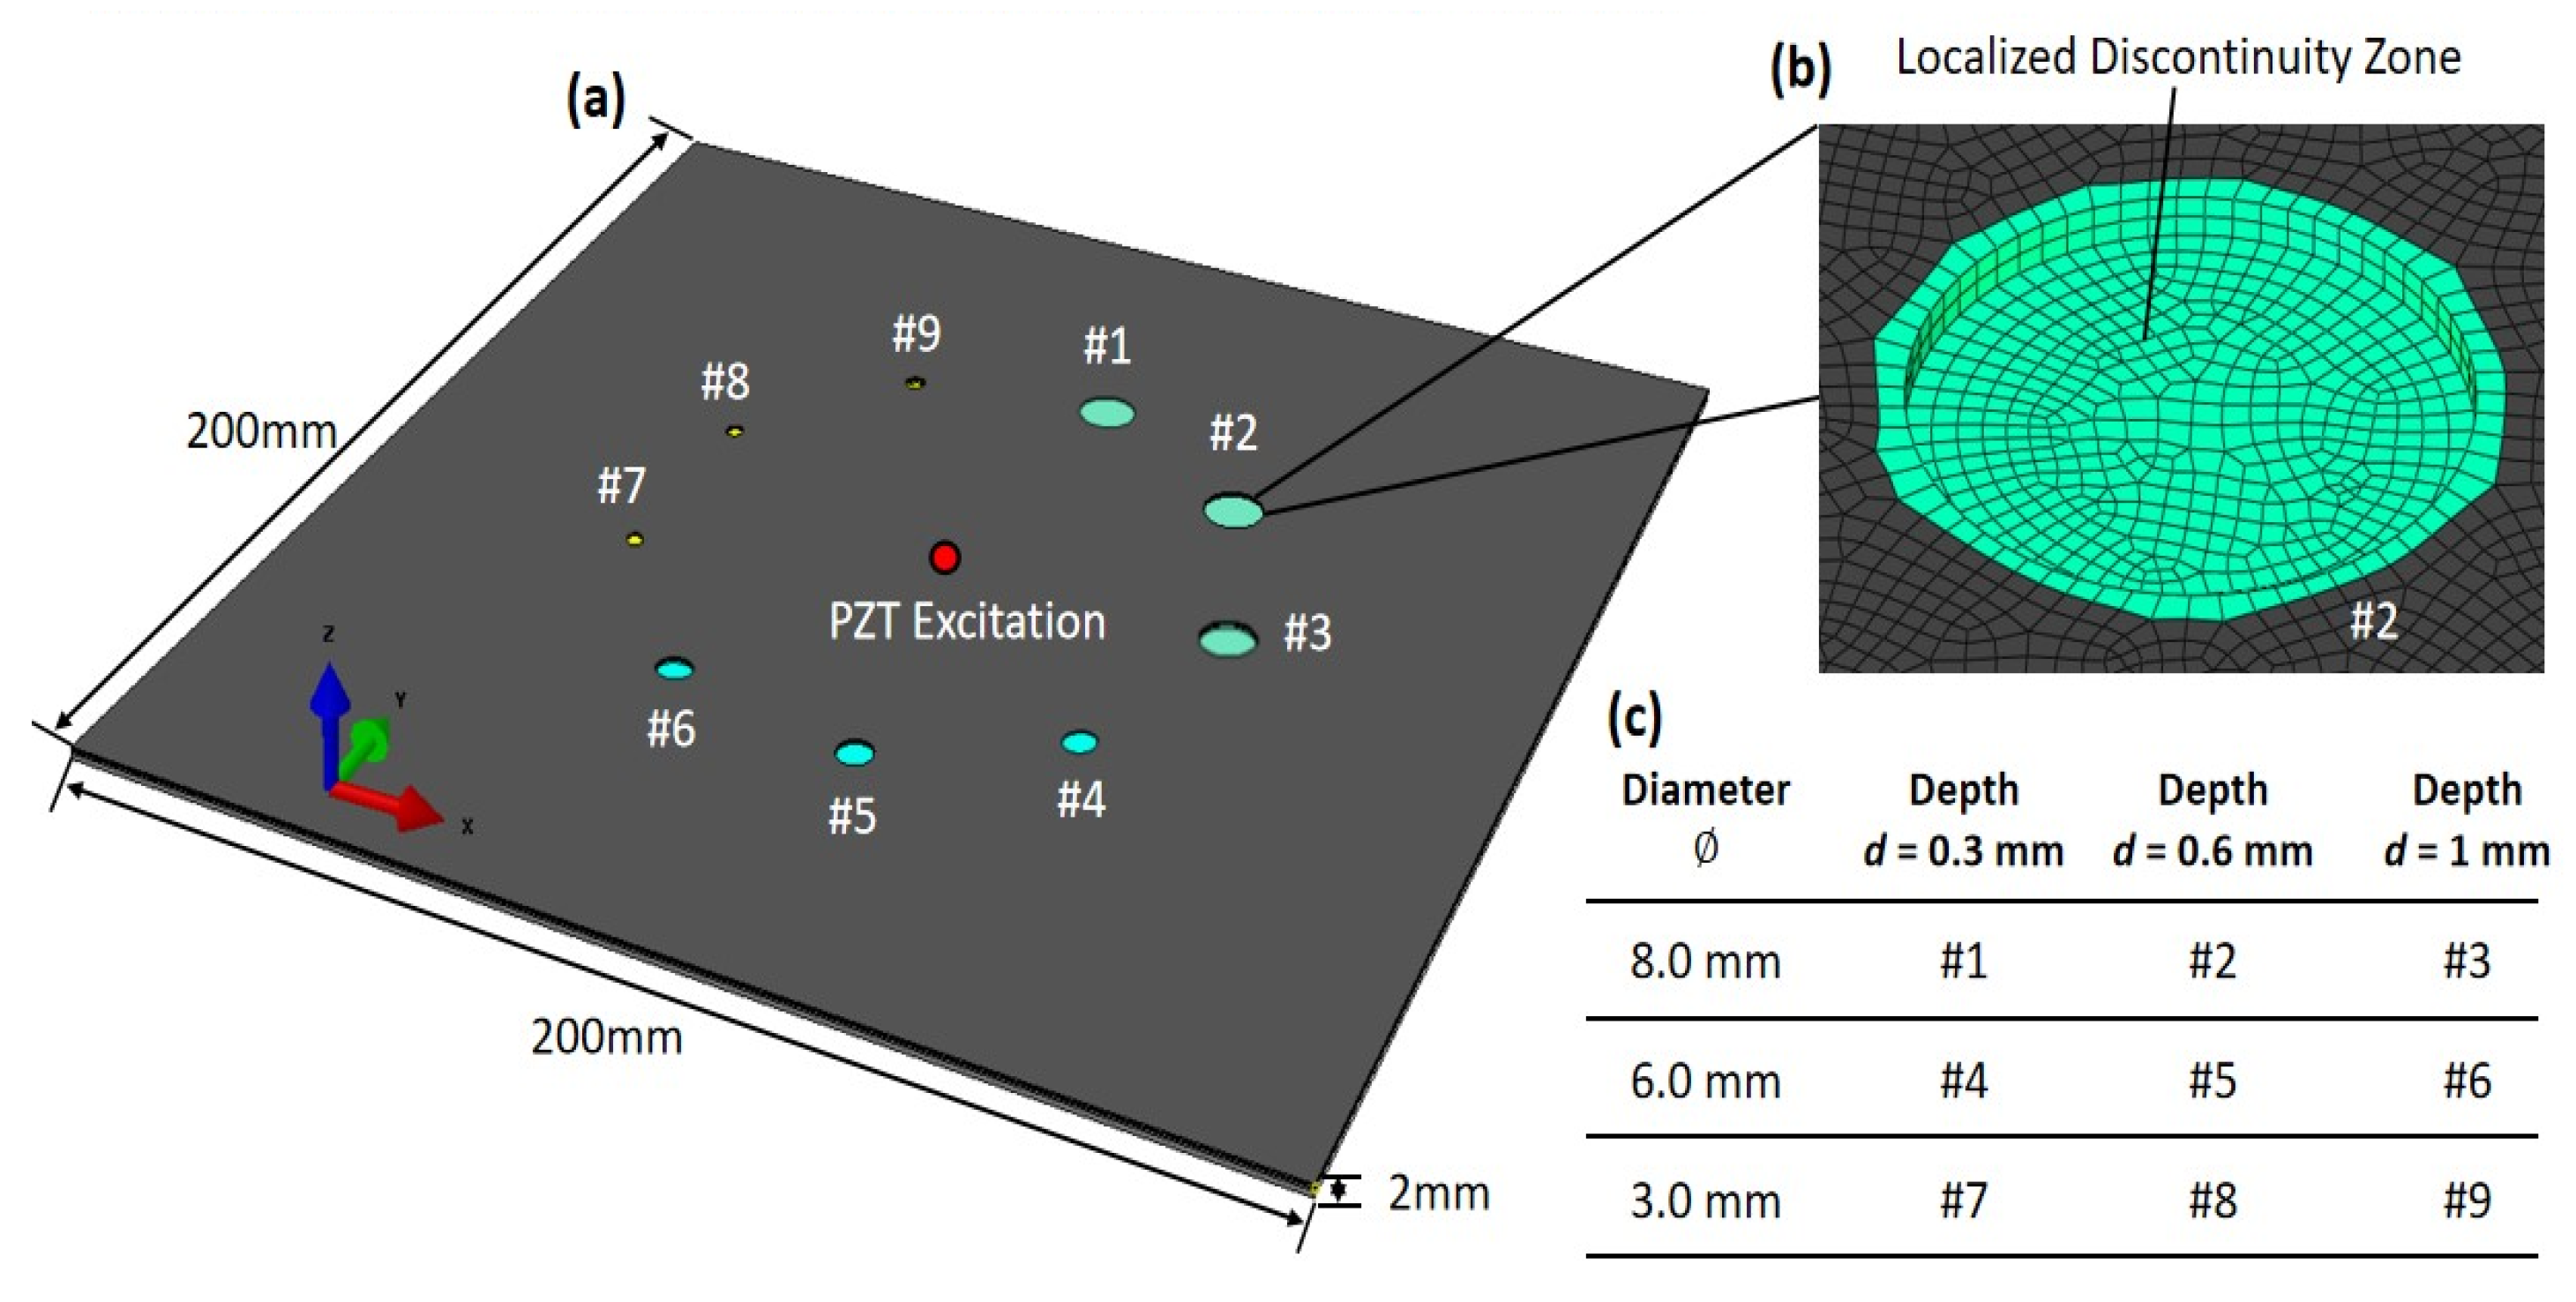
Finite element simulations were performed using Abaqus Standard 2022® to investigate the deformation response induced by acoustic loading and its sensitivity to hole-like deformations in CFRP laminates. The simulations aim to quantify the defect-induced perturbation in the displacement gradient field that is directly relevant to shearography measurements. As illustrated in Figure 2, the finite element model was established based on the actual geometric dimensions of the specimen. The material properties were defined using an orthotropic elastic model to characterize the mechanical behavior of the T300 CFRP. To ensure the physical fidelity of the simulation, nine independent elastic constants were prescribed based on the established engineering properties of T300 laminates as reported by Daniel and Ishai [38]. These parameters reflect the transverse isotropy inherent in the material plane situated perpendicular to the principal fiber direction. Specifically, nine independent elastic constants were prescribed, reflecting the transverse isotropy in the 2–3 plane perpendicular to the fiber direction: the longitudinal modulus E11 = 135 GPa, the transverse moduli E22 = 10 GPa and E33 = 10 GPa. The shear moduli were G12 = 5 GPa, G13 = 5 GPa, and G23 = 3.5 GPa. Poisson’s ratios were v12 = 0.3, v13 = 0.3, and v23 = 0.4, with a density of 1600 kg/m3. Defects were simulated by introducing BFBHs on the inspected surface of the model. The BFBHs featured diameters ranging from 3 mm to 8 mm and three specific hole depths of 0.3 mm, 0.6 mm, and 1.0 mm, thereby precisely replicating the artificially fabricated defect features from the experiments.
Figure 2.
Finite element configuration of composite laminates with localized non-penetrating blind-holes. (a) Global FE model of the composite laminate, showing the centrally located PZT excitation and all nine non-penetrating blind-holes (#1–#9). (b) Zoomed view of a representative localized discontinuity zone. (c) Geometric parameter matrix, summarizing the geometric parameters of discontinuities with diameter ∅ ranging from 3.0 to 8.0 mm and machined depth d ranging from 0.3 to 1.0 mm.
A structured meshing strategy was adopted to accurately represent the laminate lay-up and the defect geometry while maintaining numerical robustness. The model was discretized using 8-node linear brick elements, i.e., C3D8R. Along the thickness direction, i.e., Z-axis, the laminate was partitioned into 15 layers and meshed with exactly 15 element layers, such that each ply corresponds to one element through the thickness. This ply-resolved discretization enables consistent assignment of the local material orientation for each ply and supports capturing through-thickness coupling at the laminate level. In the in-plane directions, i.e., X-Y, a uniform mesh size of 0.5 mm was employed to sufficiently resolve the smallest 3 mm flat-bottom-hole defect and the spatial variation of the displacement gradient field relevant to shearography. Mesh quality was controlled by limiting element distortion and aspect ratio to ensure stable and repeatable computations.
Regarding loads and boundary conditions, the excitation from the piezoelectric transducer was simplified as a prescribed kinematic boundary condition within a structural dynamic framework. A sinusoidal out-of-plane displacement with an excitation frequency of 300 kHz was applied to the specific nodes at the specimen center, corresponding to the footprint of the PZT disk. The displacement amplitude was normalized to match the relative deformation levels observed in the experimental steady-state response. This approach focuses on the structural vibration modes and resultant strain fields, which are the primary interest in shearographic imaging, while significantly reducing computational complexity by bypassing the piezoelectric constitutive modeling. To suppress rigid-body motion and approximate the localized support of the experimental fixture, fully fixed constraints were applied to the four corner regions of the plate, while the remaining boundaries were designated as free edges. This configuration ensures a stable numerical environment for capturing the steady-state displacement gradient field. The simulated response thus provides a direct mechanical representation of the acoustic-induced surface deformation, serving as a reliable benchmark for the subsequent quantitative evaluation of the BFBH features.
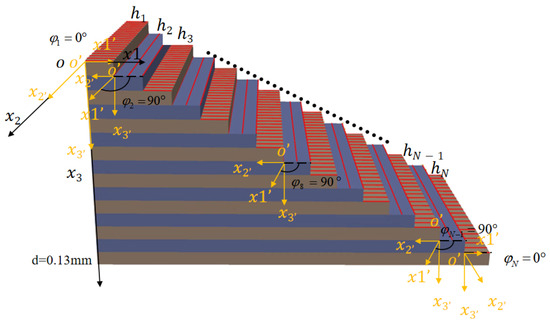
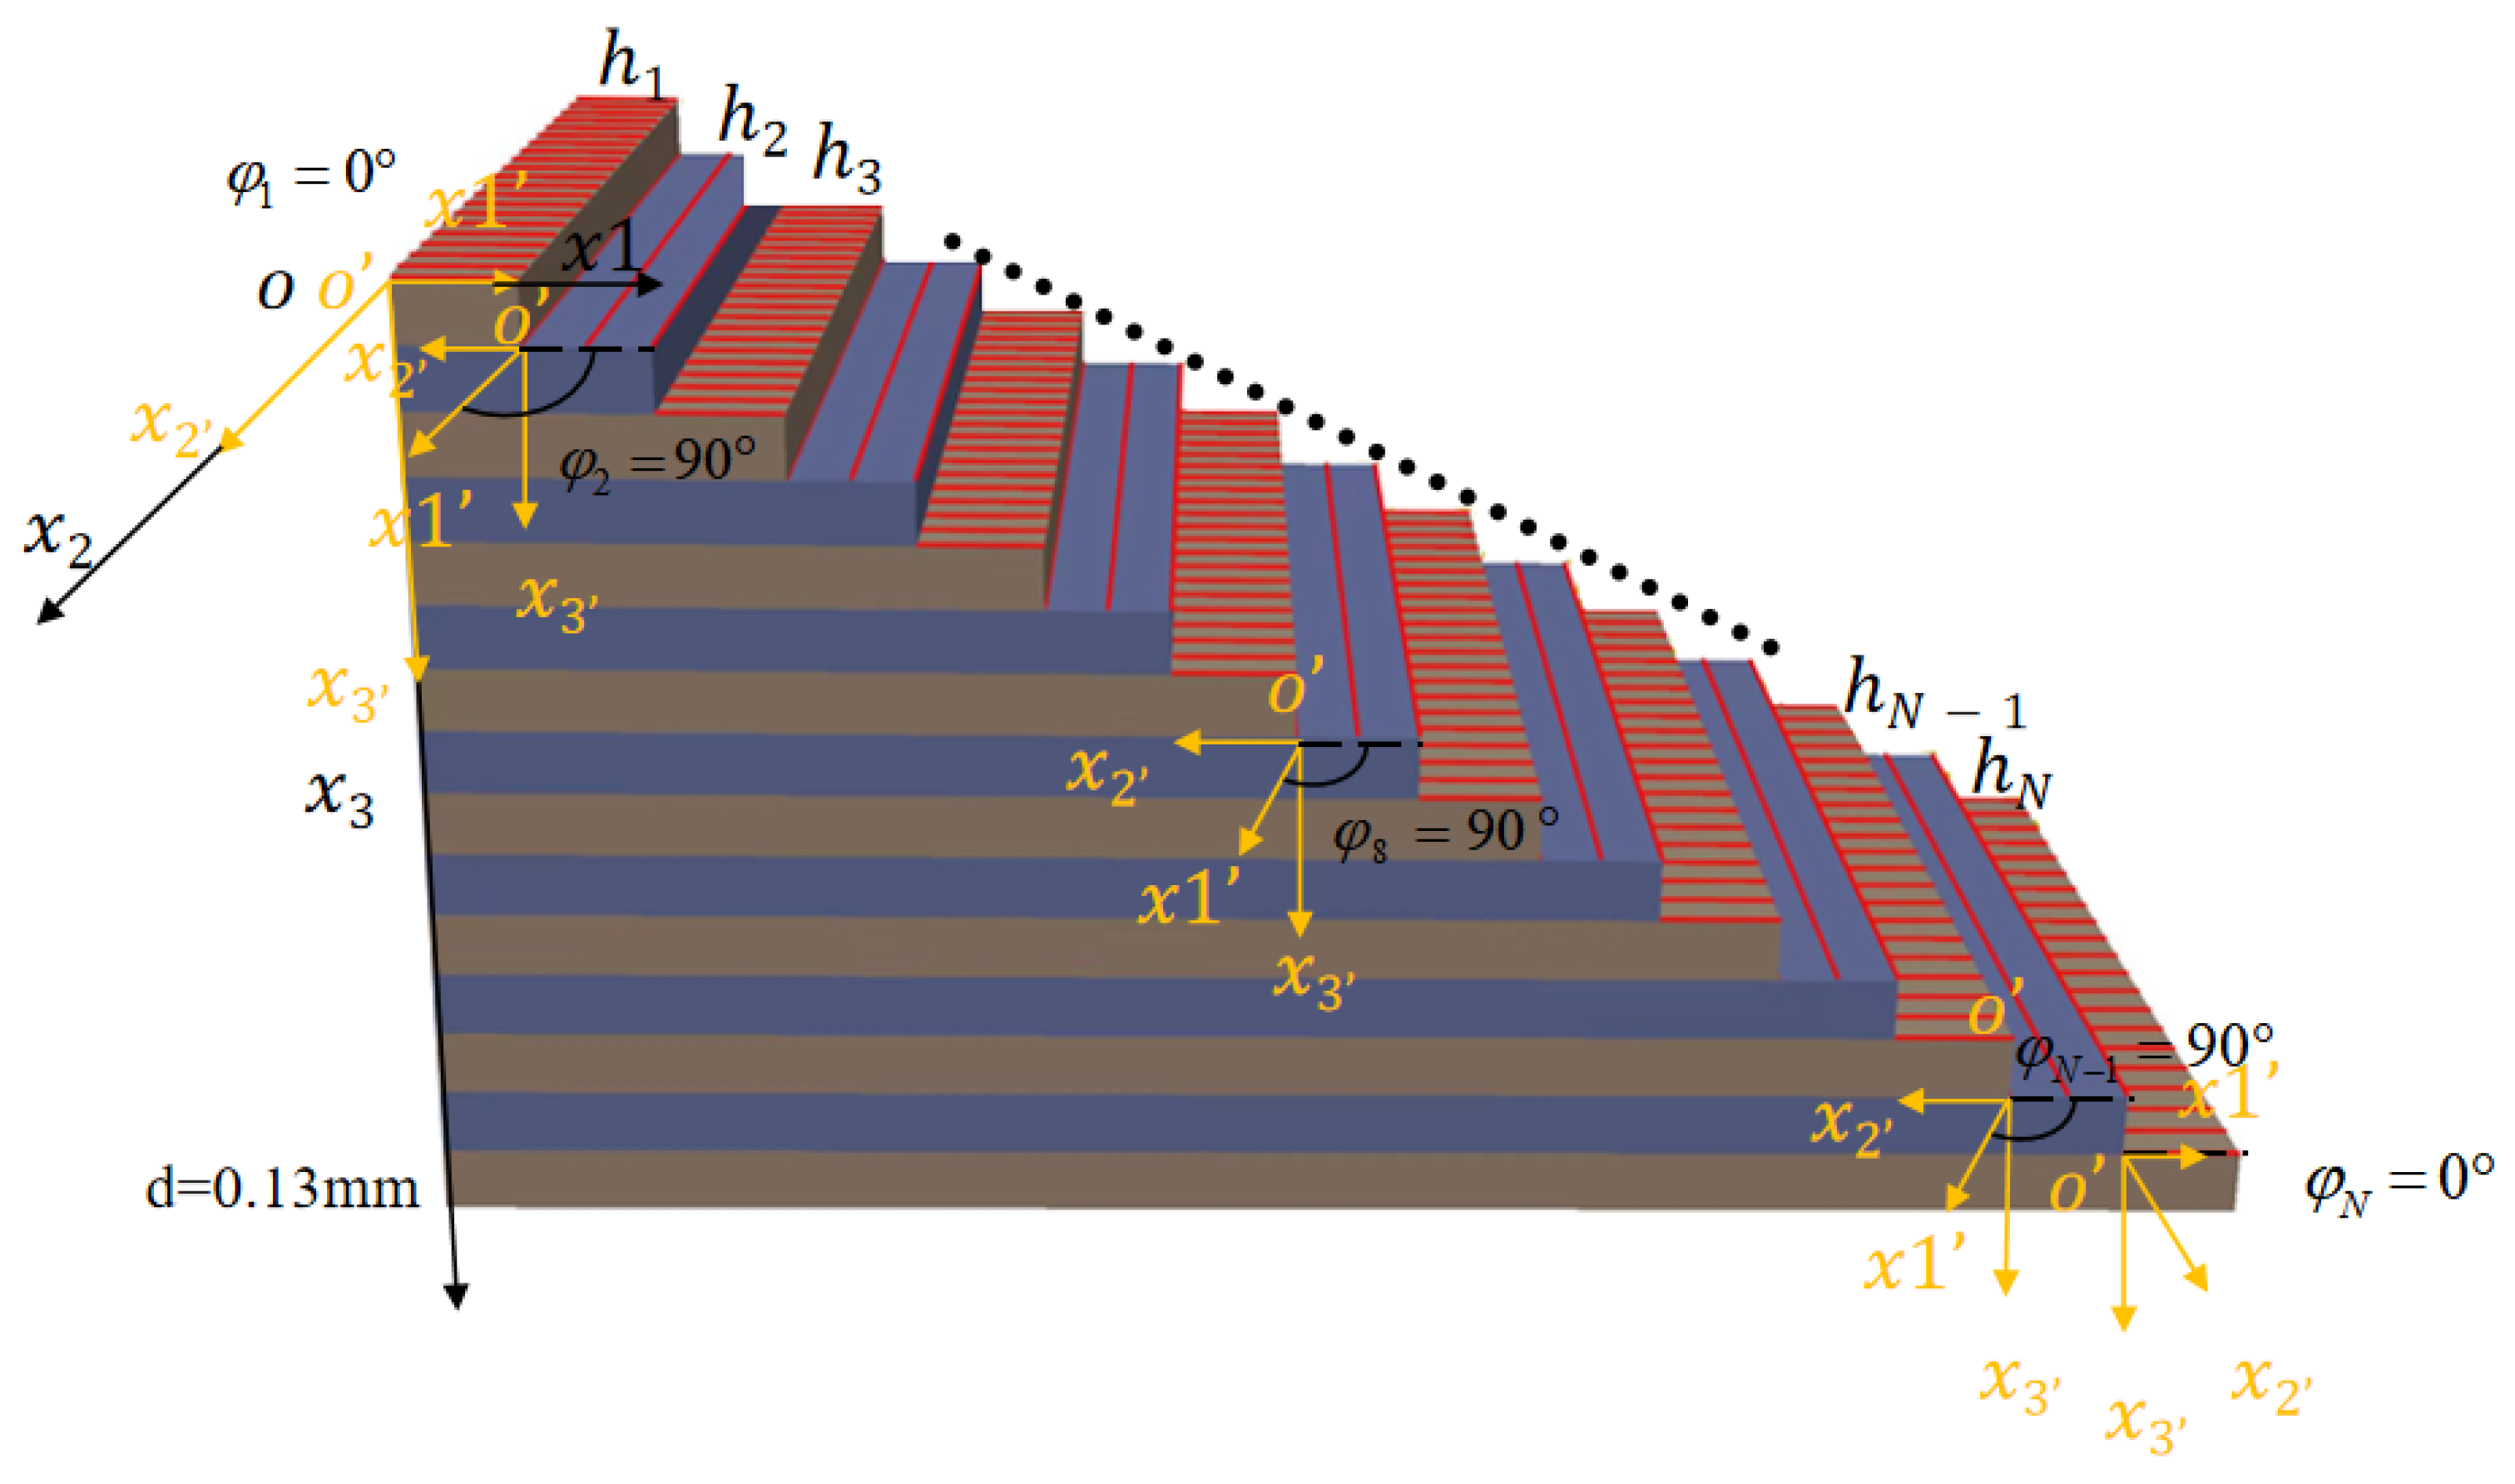
Figure 3 schematically illustrates the laminate stacking configuration and the coordinate definitions adopted in this study. A global Cartesian coordinate system is established to define the overall specimen geometry, whereas a local material coordinate system is assigned to each individual ply to prescribe the specific fiber orientation. In this local framework, the axis aligns with the fiber direction, defined by the ply angle relative to the global axis. This dual-coordinate approach enables an explicit representation of ply-wise anisotropy within the numerical model. The laminate comprises 15 plies with a symmetric cross-ply stacking sequence of , where each ply maintains a uniform thickness of d = 0.13 mm. For acoustic shearography, this cross-ply configuration generates diverse shear paths within the material. This complexity renders the wave defect interaction more distinguishable, thereby enhancing the imaging contrast and boundary discernibility of defects. Furthermore, this stacking arrangement facilitates the application of local orthotropic material properties to each layer within the FE model, ensuring an accurate simulation of the structural response under acoustic excitation.
Figure 3.
Lamina stacking diagram of composite laminate.
4. Experimental Setup and Procedures
4.1. Specimen Preparation
The experimental specimen employed in this study was a high-performance CFRP panel, measuring 200 mm 200 mm with a nominal thickness of 2.0 mm. The composite laminate was fabricated with a symmetric cross-ply stacking sequence of , comprising 15 individual layers to ensure balanced in-plane stiffness and minimize cure-induced warping. For acoustic excitation, a piezoelectric ultrasonic transducer with a center frequency of 300 kHz was fixed at the geometric center of the CFRP specimen using ERGO1309 high-strength epoxy adhesive. The artificial defects were precision-machined onto the specimen surface using a CNC milling system. As illustrated in Figure 2, the BFBHs were organized into three diameter groups of 8 mm, 6 mm, and 3 mm, each containing three distinct drilling depths: 1.0 mm, 0.6 mm, and 0.3 mm. It should be explicitly noted that these fabricated features are employed as calibrated stiffness modulators to rigorously evaluate the imaging fidelity of the acoustic shearography framework rather than serving as simple visual targets. During the experiments, the specimen was supported by a dedicated fixture to ensure positional stability and to minimize interference from ambient environmental vibrations. This setup provided reliable experimental conditions for steady-state wave field observation and subsequent comparative analysis of the defect-induced strain modulations.
4.2. Experimental Setup of Shearography
The testing was conducted using a custom-built acoustic shearography system, as schematically illustrated in Figure 1. The system integrates a 5 megapixel two-dimensional CCD camera featuring a spatial resolution of 2448 by 2048 pixels alongside a 200 mW solid state laser operating at a wavelength of 532 nm provided by Changchun New Industries Optoelectronics Tech Co., Ltd. (Changchun, China) With the laser source positioned at an approximately 1 m stand-off distance from the specimen, an expanded laser beam illuminates the specimen surface, and the reflected wave-fronts pass through the shearing optics before being recorded by the camera. The effective field of view (FOV) is sufficiently large to cover the entire 200 mm 200 mm specimen area.
For acoustic excitation, a PZT disk is bonded to the geometric center of the plate to serve as the excitation point, with the complete excitation and synchronization chain depicted in Figure 1. The driving signal is generated by an arbitrary function generator (Tektronix AFG3021C, Beaverton, OR, USA) and amplified by a power amplifier (Aigtek ATA-2021, Xi’an, China) to provide continuous sinusoidal actuation. The system further incorporates a digital delay pulse generator (SRS DG645, Sunnyvale, CA, USA) for temporal synchronization, while a piezo-positioning stage introduces controlled nanometer-scale displacement of the reference mirror for phase stepping.
The shearing distance is introduced through a controlled angular adjustment or tilt of the Michelson interferometer mirror, resulting in a lateral separation between the two sheared wave-fronts within the image plane. This horizontal shear distance is calibrated by observing the overlap region of the generated double image on the CCD, ensuring a precise configuration between 1 mm and 4 mm along the x axis.
Image acquisition and phase stepping are synchronized via a computer control system. Once the acoustic excitation achieves a steady-state response, the CCD captures a sequence of eight speckle images to perform the phase-stepping procedure, comprising four frames acquired before loading and four frames after loading. The exposure time for each frame is set to 20 ms to cover multiple acoustic cycles, thereby achieving a time-averaged interferometric response. To minimize environmental noise, the entire optical system shown in Figure 1 is mounted on an air-floating active vibration isolation optical platform.
5. Results and Discussion
5.1. Numerical Investigation of Geometry-Dependent Acoustic Shearographic Responses
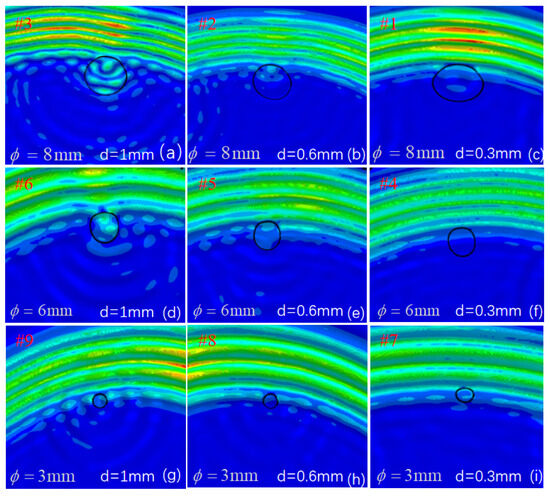
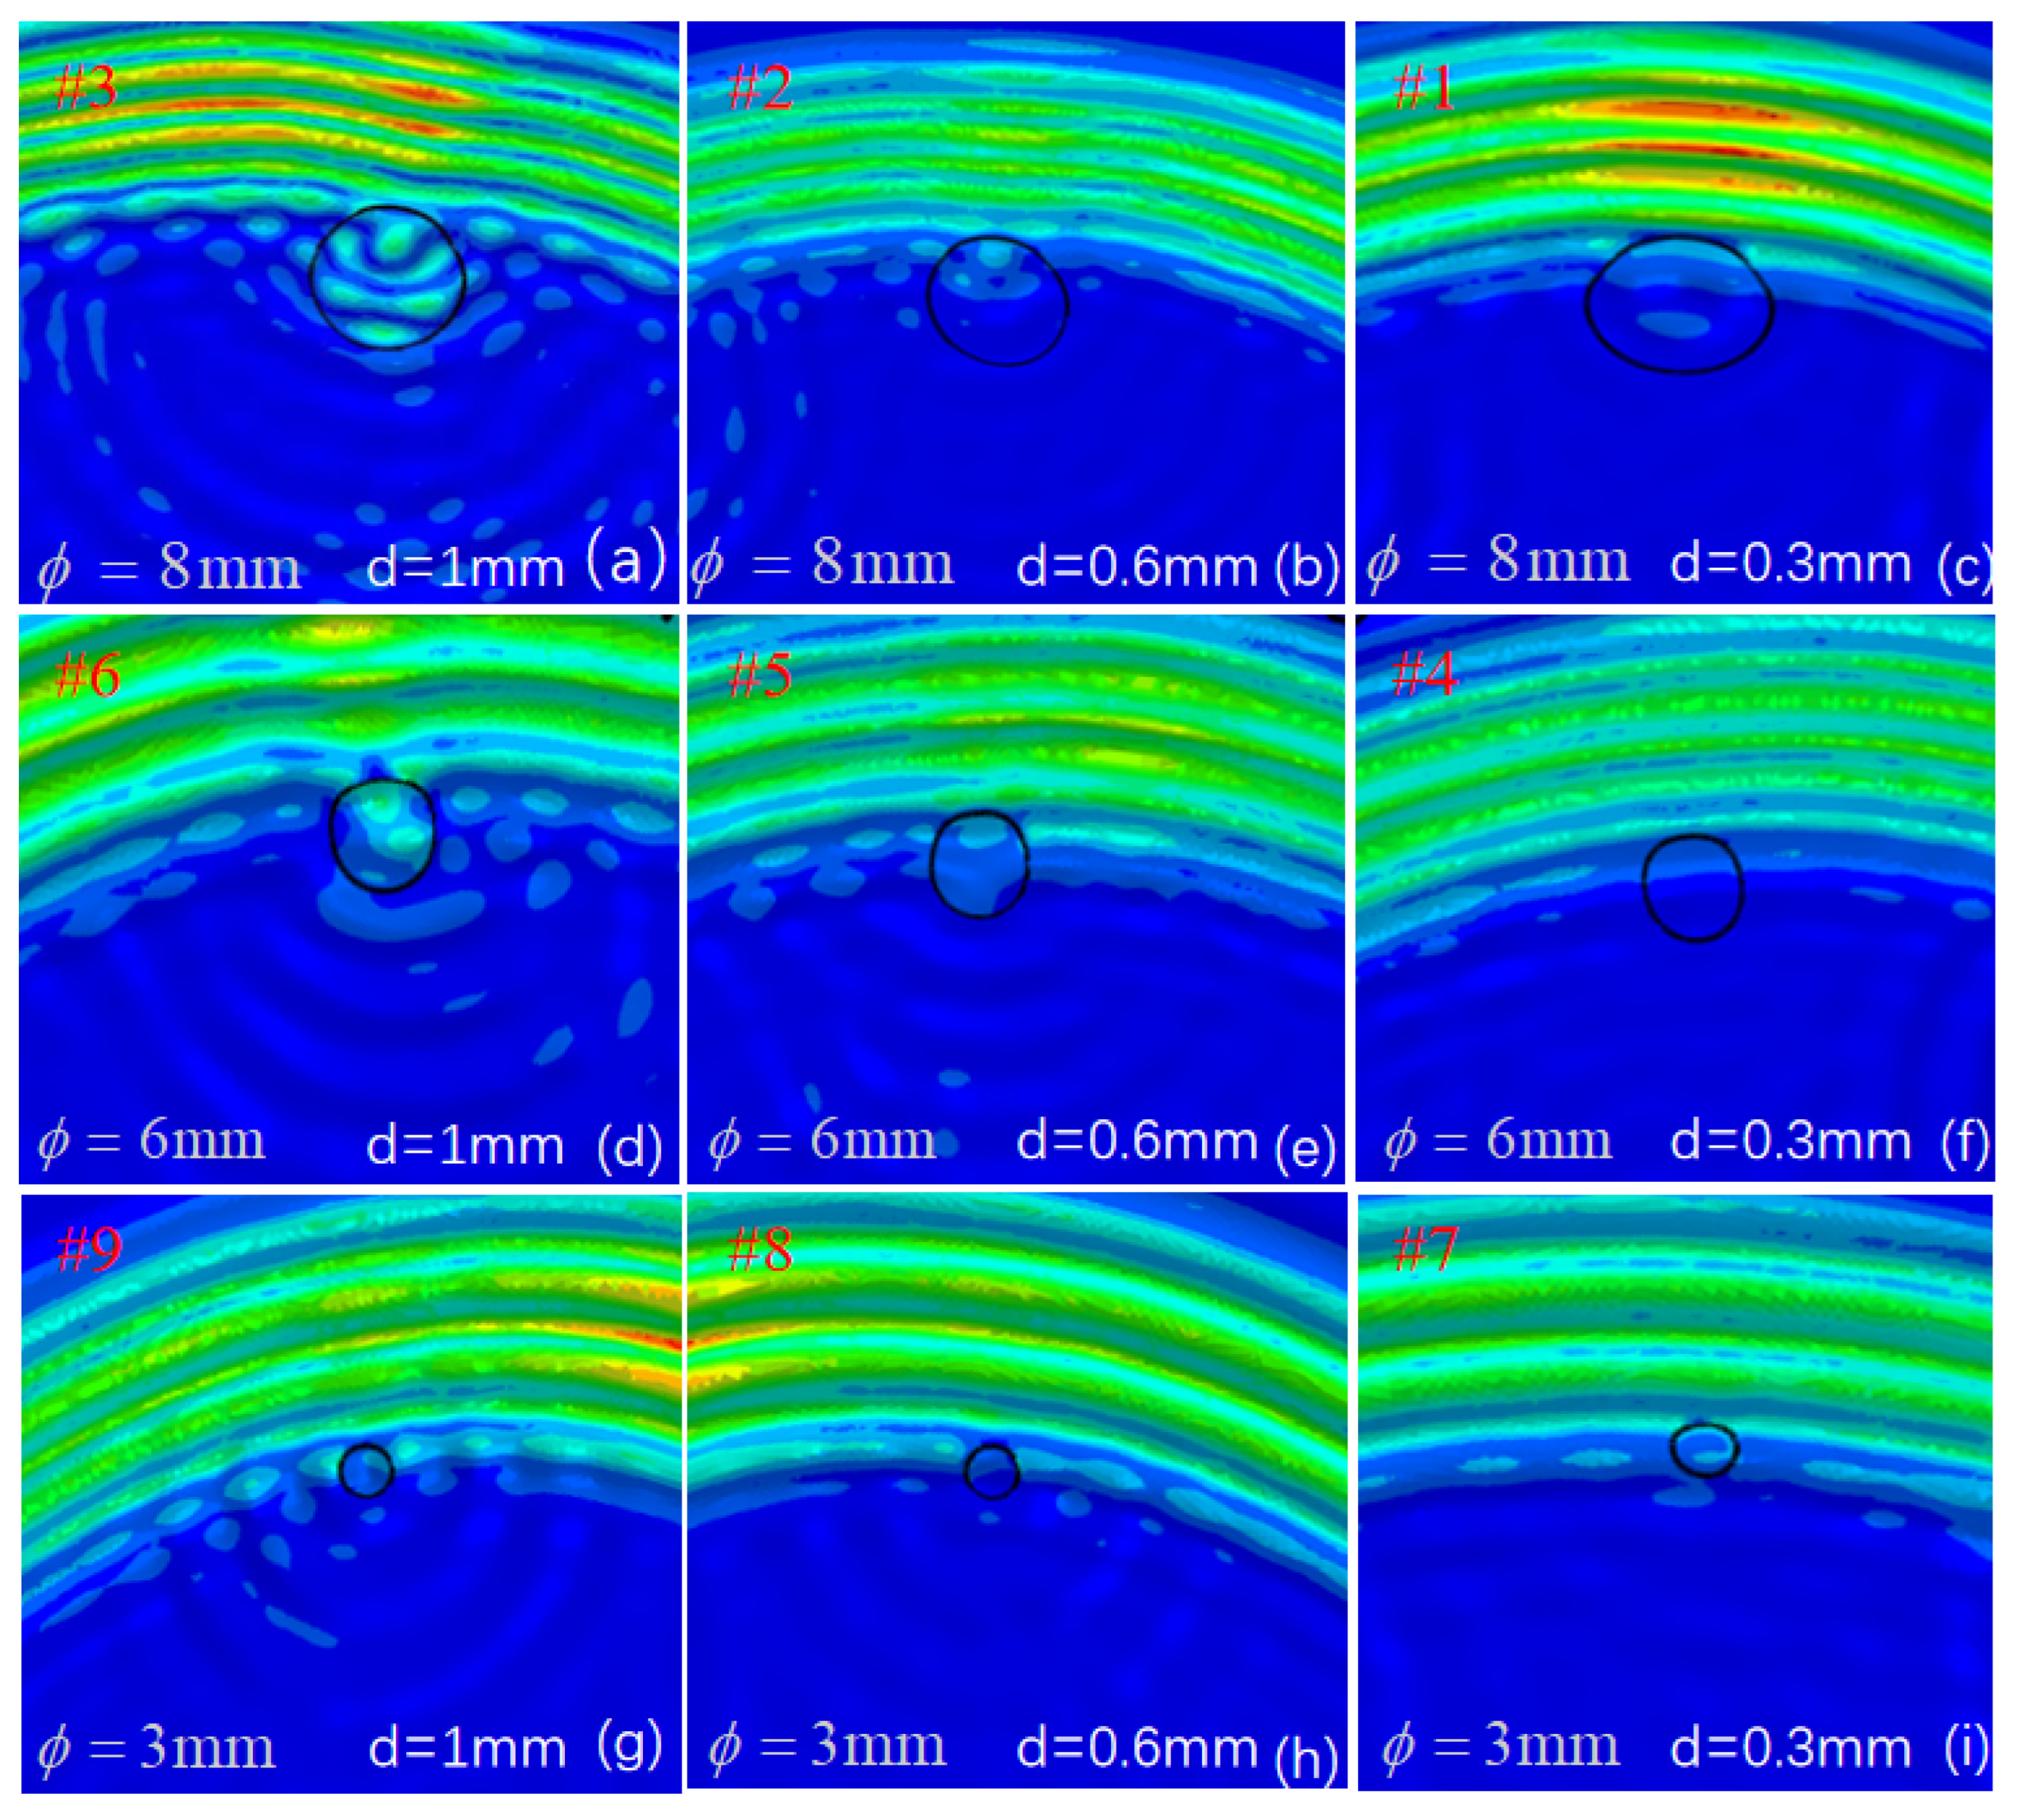
Figure 4 illustrates the simulated surface displacement gradient modulations for nine distinct BFBH configurations. To systematically evaluate the detection performance, these defect scenarios are categorized into three groups based on their geometric parameters: the 8 mm diameter group comprises (d = 0.3 mm), (d = 0.6 mm), and (d = 1.0 mm); the 6 mm diameter group includes d = 0.3 mm), (d = 0.6 mm), and (d = 1.0 mm); and the 3 mm diameter group consists of (d = 0.3 mm), (d = 0.6 mm), and (d = 1.0 mm).
Figure 4.
Sound field distribution diagrams of defects with different geometric sizes. Different diameters: (a–c) 8 mm, (d–f) 6 mm, (g–i) 3 mm; different depths: (a,d,g) 1 mm, (b,e,h) 0.6 mm, (c,f,i) 0.3 mm sound field.
The numerical results visualize the sensitivity of acoustic shearography to varying defect scales and depths through the clarity of the induced wave patterns. The simulation reveals that the characterization sensitivity is directly reflected in the definition of the surface ripples. Drilling depth is the dominant factor governing this sensitivity. For the deepest features illustrated in Figure 4c,f,i, the significant reduction in local stiffness allows for intense mechanical energy coupling, manifesting as sharp and highly distinct wave-like phase distortions at the defect sites. In contrast, as the depth decreases to 0.3 mm, as seen in Figure 4a,d,g, the surface becomes increasingly smooth and undisturbed, resembling a stable state where the wave patterns nearly vanish due to the higher residual structural rigidity. This transition confirms that deeper BFBHs excite a much stronger and more detectable surface response.
Furthermore, the influence of the aperture scale on wave clarity is non-monotonic, with the 6 mm group in Figure 4d–f exhibiting the highest characterization sensitivity. While the 8 mm features in Figure 4a–c perturb a wider area, the resulting wave ripples are relatively diffuse and lack sharp definition. In contrast, the 3 mm features in Figure 4g–i produce extremely subtle modulations that are easily suppressed, leaving the surface in a relatively stable and undisturbed state. The 6 mm BFBHs consistently yield the most vivid and well-defined circular wave patterns, indicating that this specific diameter achieves an optimal resonance-like coupling with the acoustic excitation. Notably, this numerical observation is in strong agreement with the subsequent experimental results, where the 6 mm defects also demonstrate superior contrast and boundary fidelity. This consistency between the dynamic ripple response in the simulation and the clear phase patterns in the experiment validates the accuracy of the FEM. These findings demonstrate that the clarity of surface ripples serves as a reliable indicator of detection sensitivity, providing a robust theoretical basis for identifying localized structural discontinuities through wave field perturbations.
5.2. Effect of Excitation Frequency
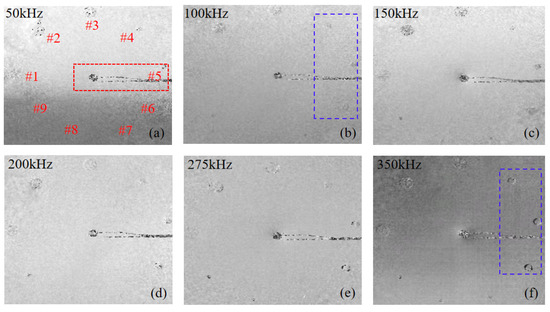
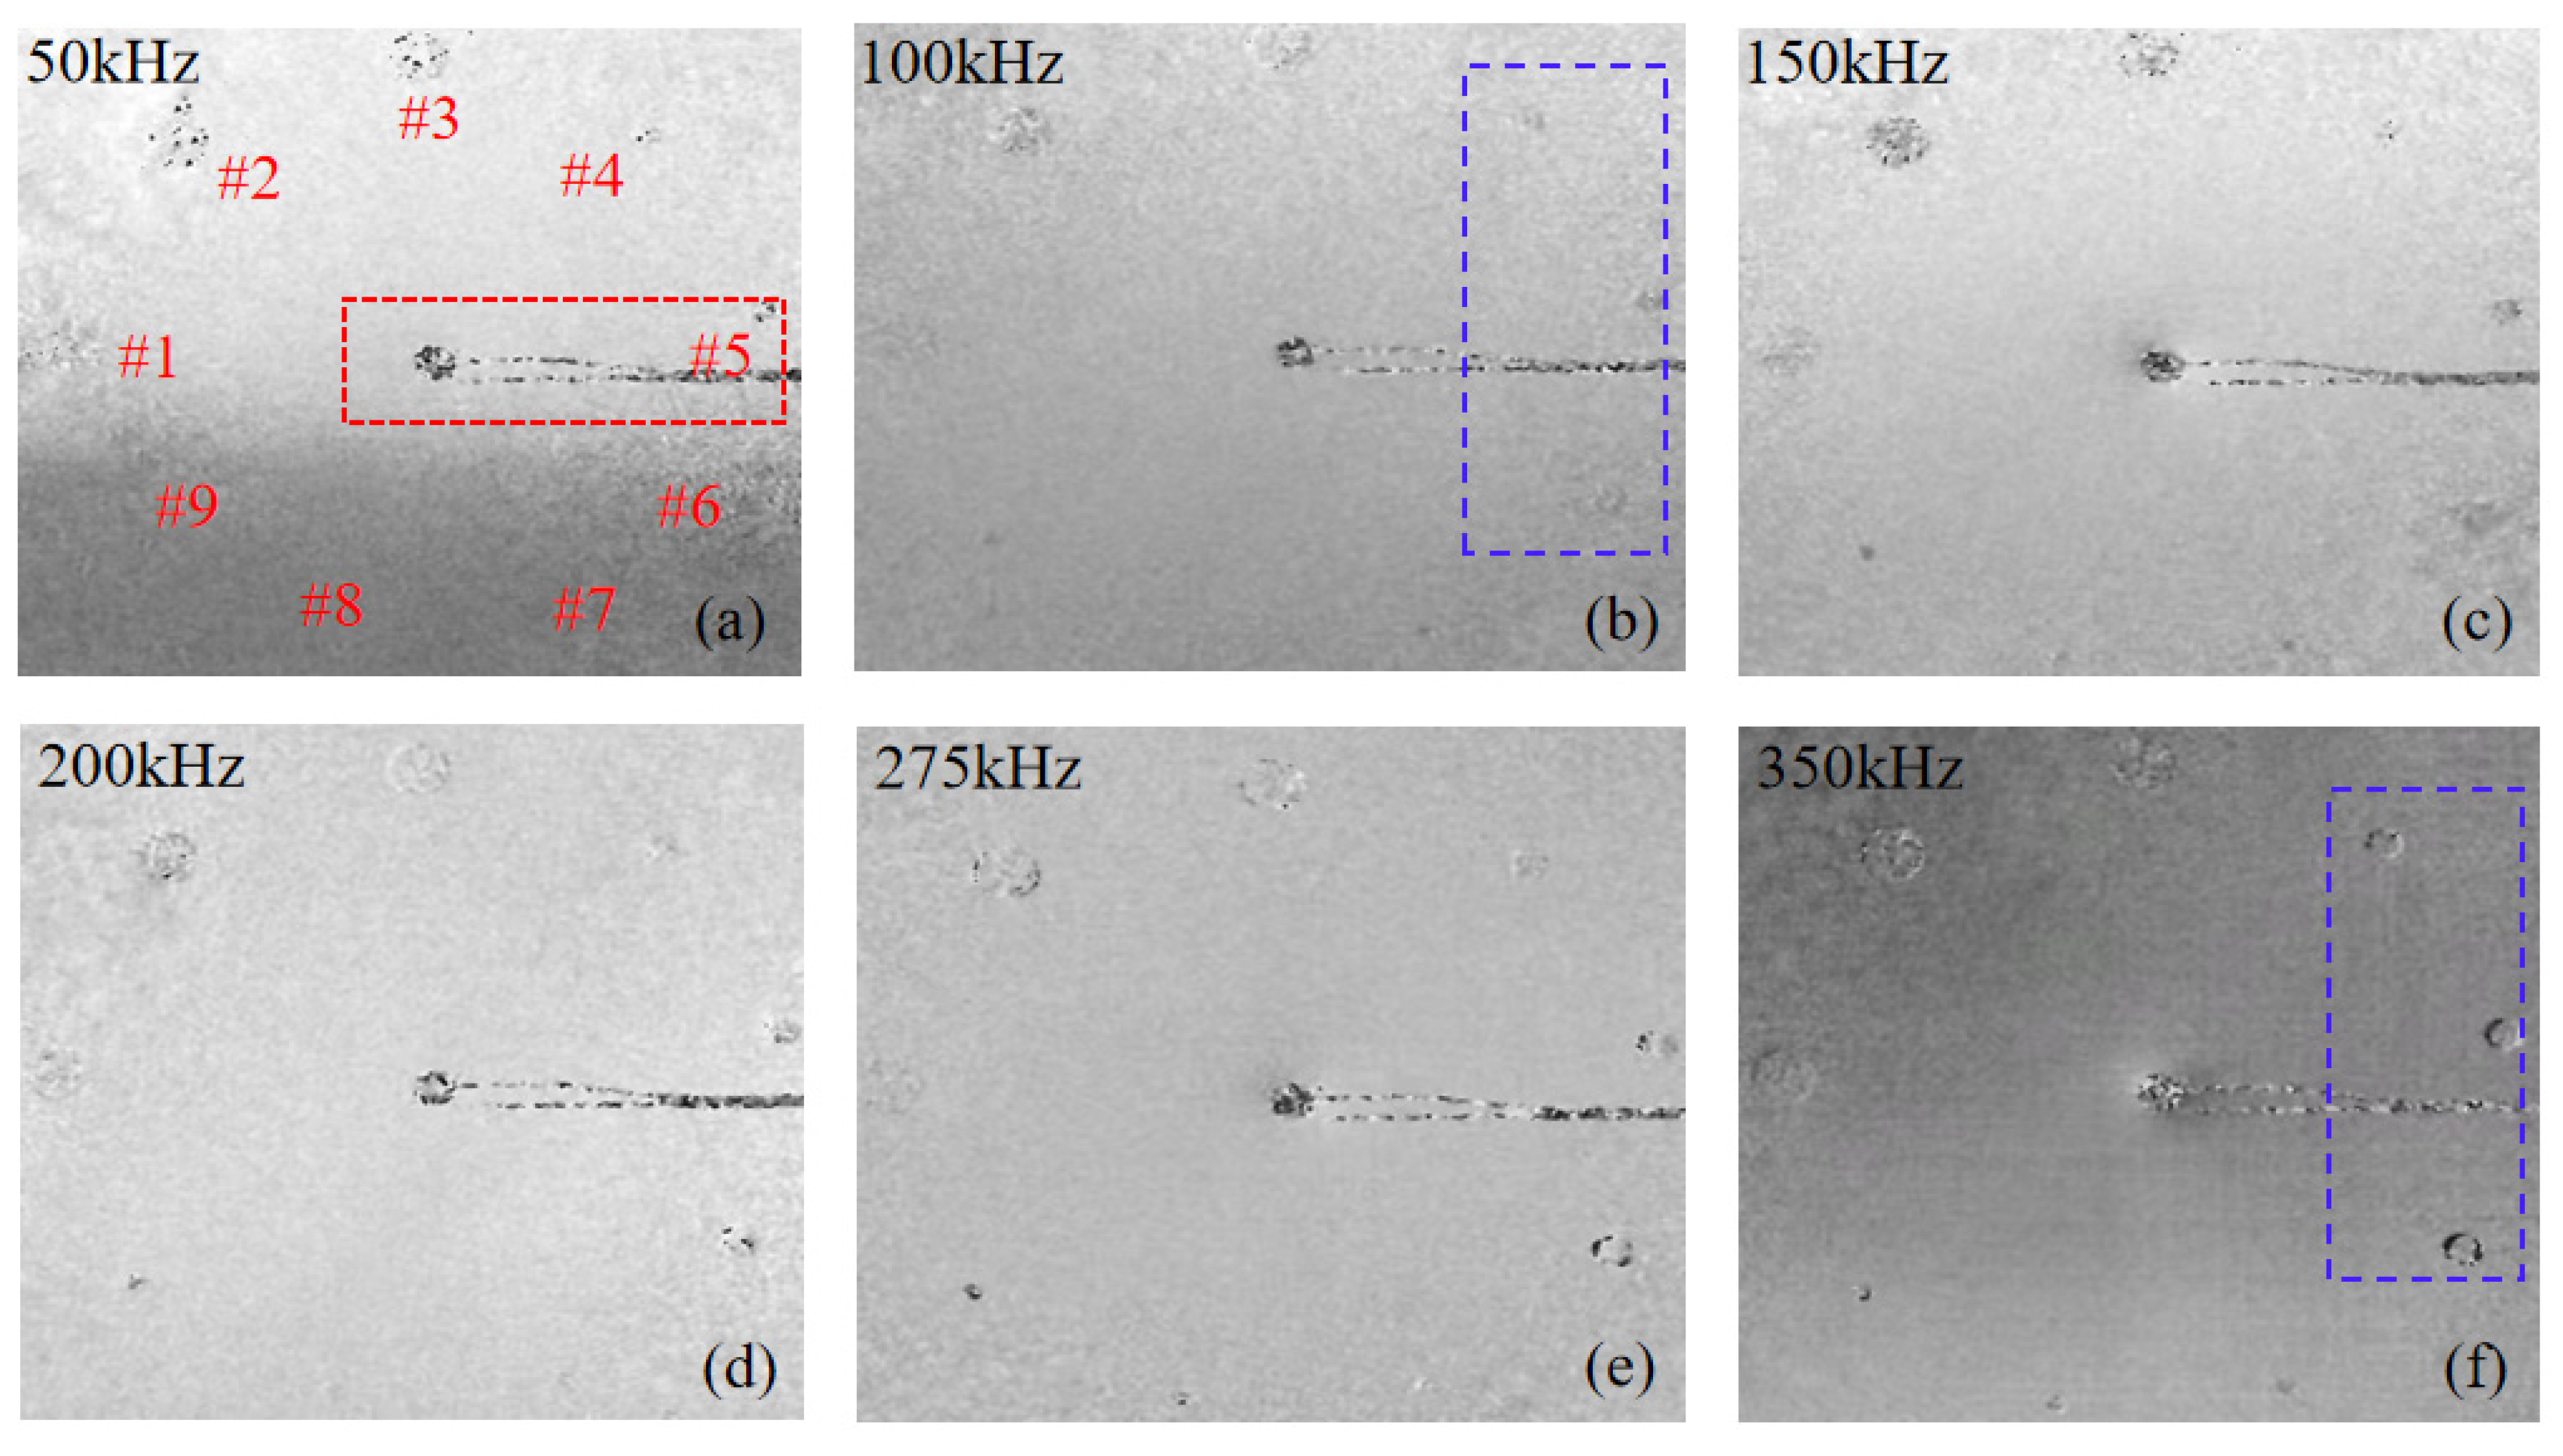
To investigate the influence of acoustic excitation frequency on the characterization of localized structural discontinuities, phase maps were acquired across a frequency range from 50 kHz to 350 kHz. Throughout the frequency sweep the excitation amplitude was maintained at a constant 100 V peak to peak voltage, thereby ensuring that the observed structural variations remained solely frequency-dependent. As illustrated in Figure 5, where – represent defects of different geometric scales and depths, the excitation frequency is a decisive factor in governing the energy coupling efficiency and the subsequent surface strain modulation. It should be noted that the high contrast features observed at the center of the phase maps, such as the central red boxed region in Figure 5a, correspond to the piezoelectric transducer PZT and its electrical wiring, which are excluded from the defect characterization analysis.
Figure 5.
Piezoelectric transducer acoustic shear images at different excitation frequencies of (a) 50 kHz, (b) 100 kHz, (c) 150 kHz, (d) 200 kHz, (e) 275 kHz, and (f) 350 kHz.
In the lower frequency regime 50–100 kHz, the acoustic energy exhibits limited coupling with the local compliance of the BFBH models. As highlighted by the blue boxed region in Figure 5b 100 kHz, the phase maps appear as a uniform field of random speckle noise with no discernible localized phase distortions. This indicates that the low-frequency excitation is insufficient to overcome the local structural stiffness of the smaller BFBHs. Under these conditions, the vibrational energy is distributed more uniformly across the laminate, and the mechanical impedance mismatch at the BFBH locations is too subtle to trigger a circular phase anomaly. As the excitation frequency increases to 150–275 kHz, the acoustic–mechanical coupling becomes more effective, particularly for features with larger diameters. This leads to an augmented local phase gradient, reflecting the increased sensitivity of the shearographic system to structural perturbations Figure 5c–e. In this frequency band, the dynamic strain concentration at the defect boundaries becomes more pronounced, manifesting as the gradual emergence of circular features within the speckle field that delineate the defect sites.
Within the investigated range, 350 kHz was identified as the optimal frequency for the current experimental configuration Figure 5f. A direct comparison between the blue boxed regions in Figure 5b,f clearly illustrates the frequency-dependent sensitivity enhancement: the previously invisible feature in Figure 5b manifests as a sharp, high-contrast circular phase anomaly in Figure 5f. At this optimal frequency, the acoustic excitation effectively stimulates the LDR of the BFBH features. This frequency-matched energy coupling induces significant localized displacement gradients on the surface, resulting in clear and distinct phase distortions that accurately define the circular defect morphology. These results suggest that selecting an excitation frequency that approaches the LDR of the BFBHs is essential for activating the circular features and achieving high-fidelity characterization of subsurface structural anomalies.
5.3. Effect of Driving Voltage
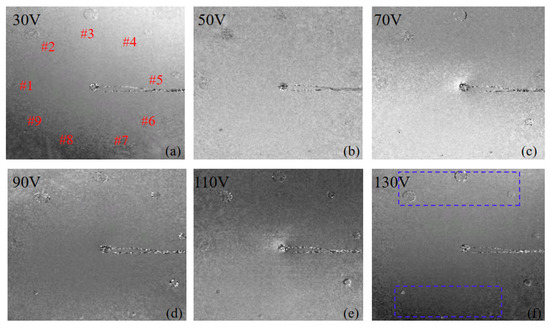
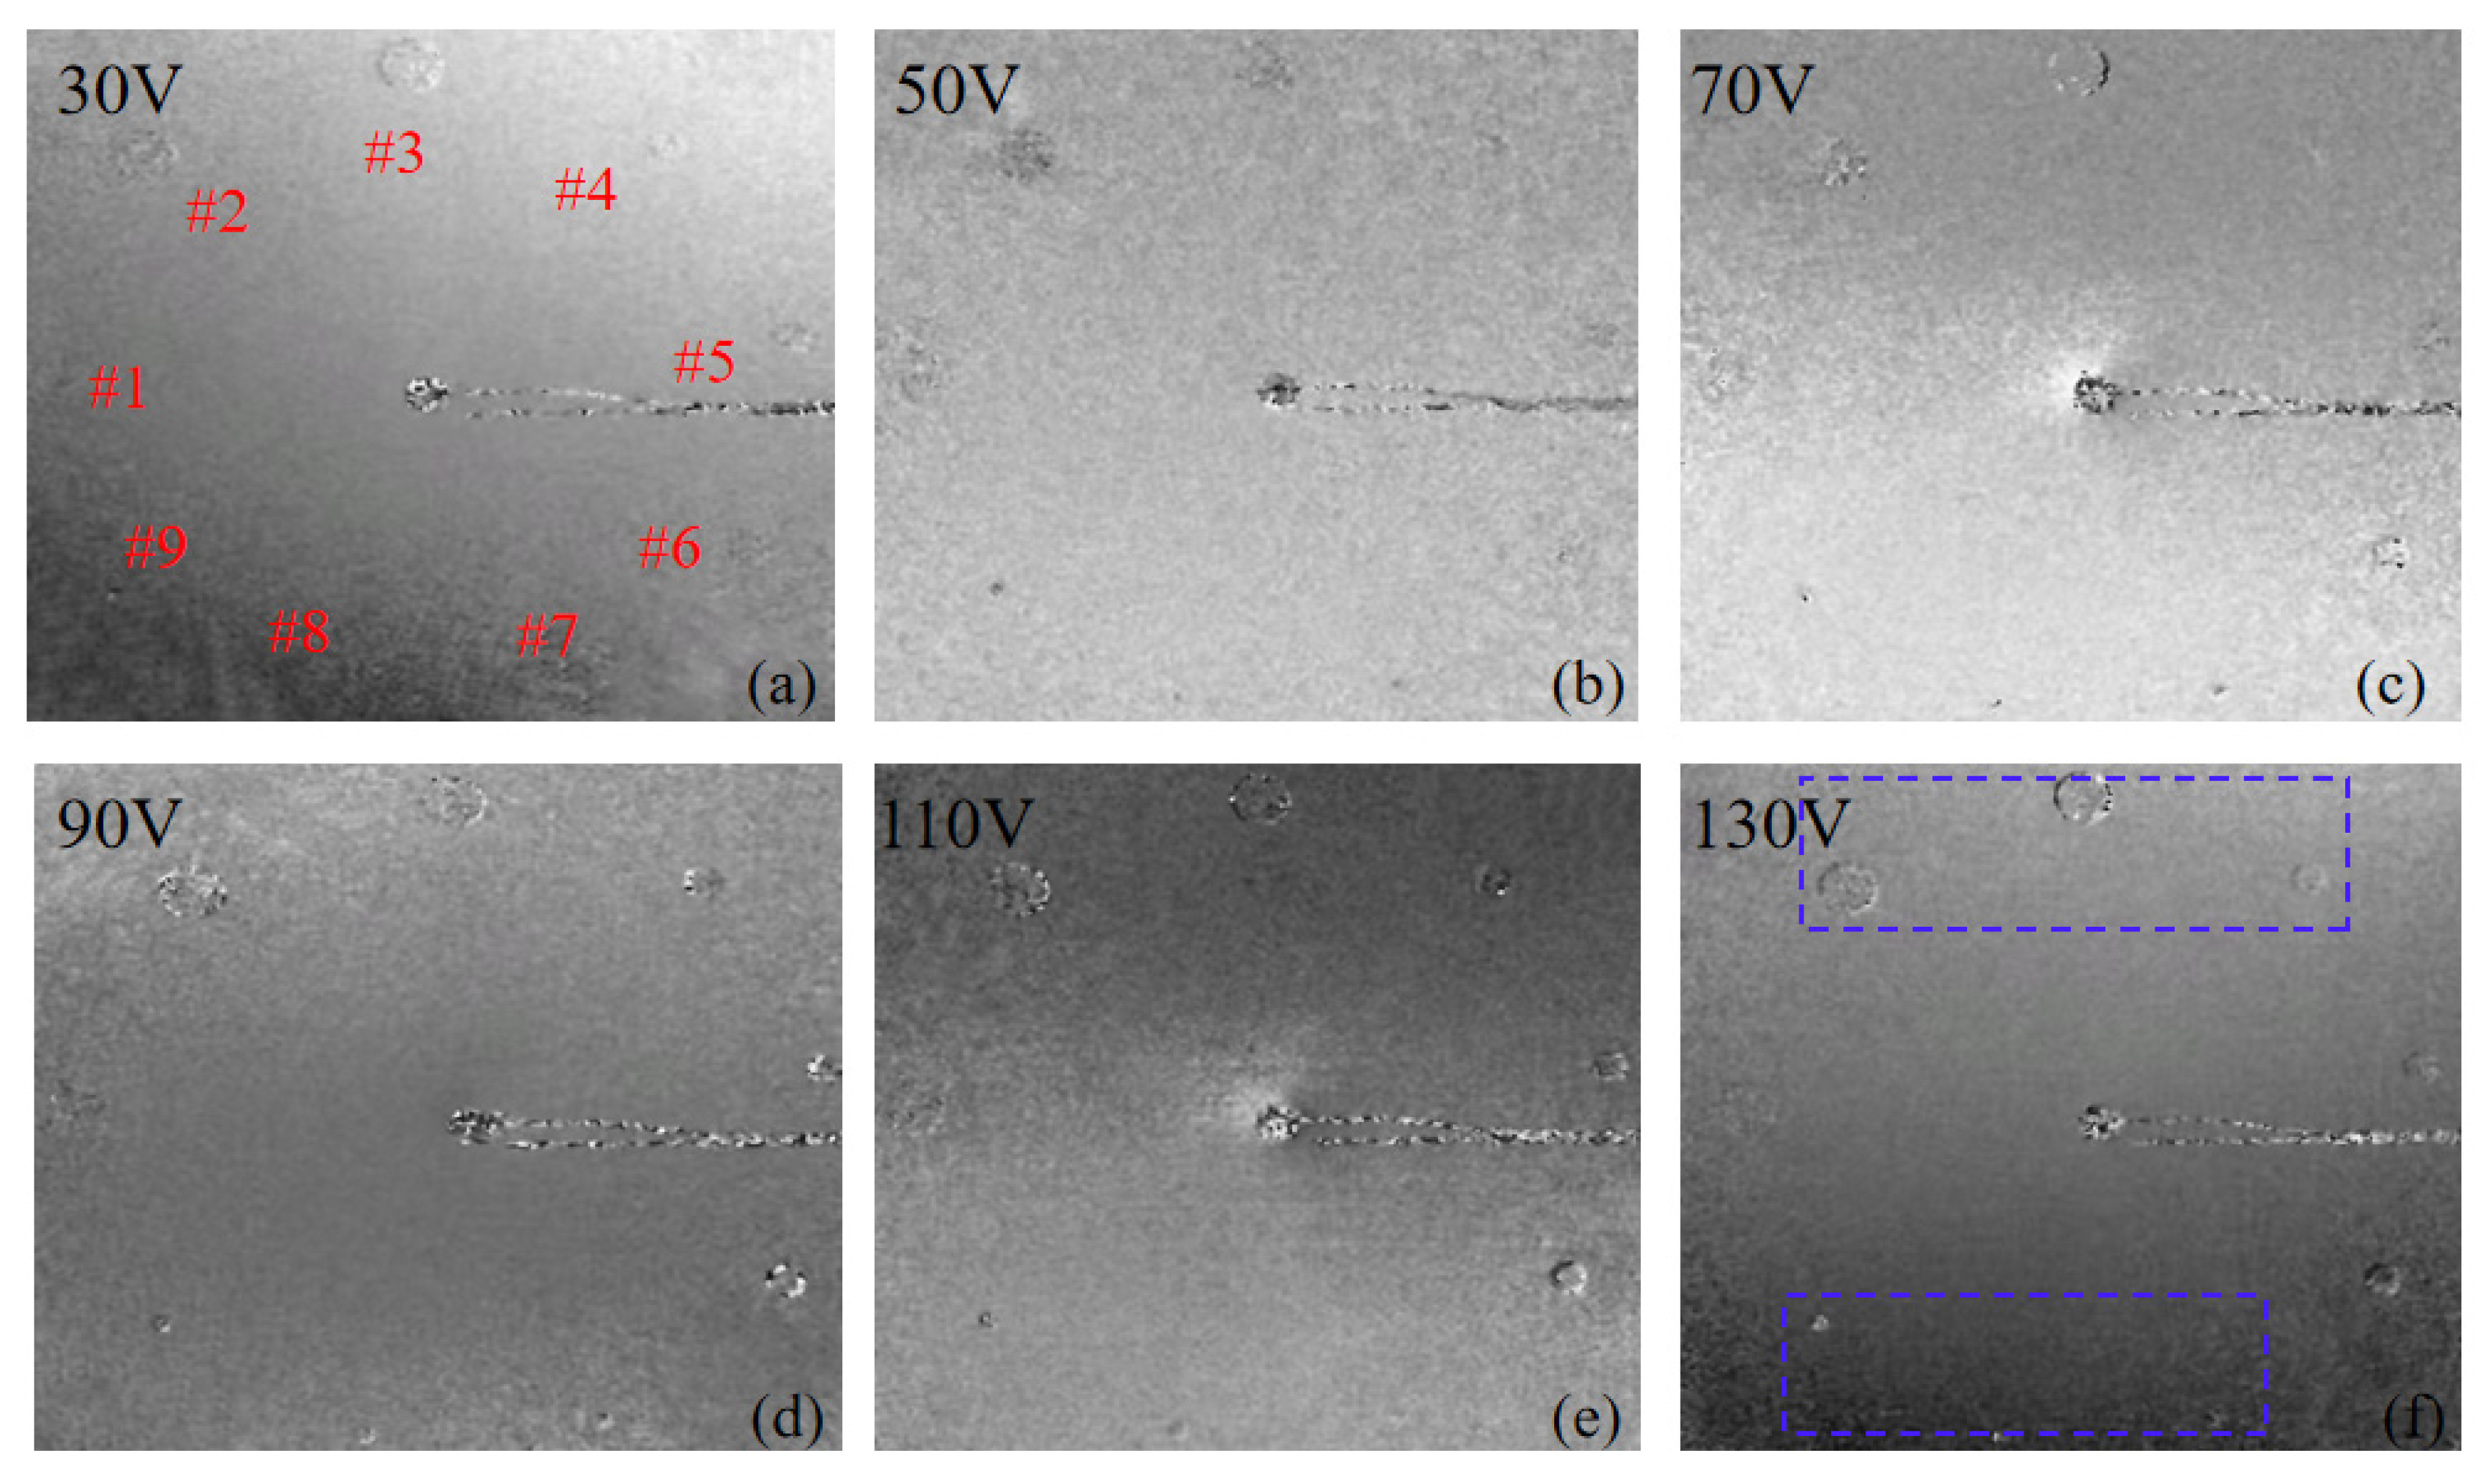
To evaluate the influence of excitation intensity on the characterization sensitivity of localized structural discontinuities, the driving voltage applied to the piezoelectric transducer was varied from 30 V to 130 V at the optimized frequency of 350 kHz. The resulting phase maps, as illustrated in Figure 6, demonstrate that the driving voltage is a critical factor in enhancing the SNR for the identification of BFBH features within the speckle field.
Figure 6.
Acoustic shear imaging of the piezoelectric transducer at 350 kHz under different driving voltages: (a) 30 V, (b) 50 V, (c) 70 V, (d) 90 V, (e) 110 V, and (f) 130 V.
At low driving voltages between 30 V and 50 V, the acoustic power coupled into the CFRP laminate is relatively low. Due to the high damping characteristics of composite materials, the dynamic stress field modulation induced by the BFBHs is too weak to produce a detectable surface displacement gradient. As observed in Figure 6a, the defect-induced signal at 30 V is completely masked by the background speckle noise, rendering the hole-shaped defects indiscernible. Under these conditions, the mechanical energy is insufficient to overcome the internal structural damping, leaving the localized features in a sub-threshold state.
As the driving voltage increases toward 130 V, the amplified excitation amplitude significantly intensifies the localized mechanical response of the BFBHs. The higher energy input induces more pronounced strain concentrations at the feature boundaries, which are effectively projected onto the specimen surface. The impact of this energy increment is most prominent when comparing the initial response in Figure 6a with the blue boxed region in Figure 6f: the previously obscured feature at 30 V emerges as a sharp and well-defined circular phase anomaly at 130 V. This manifestation appears as clearer localized phase distortions and more distinct phase discontinuities in the phase maps shown in Figure 6c–f.
The increased voltage allows even the smaller 3 mm BFBHs to be clearly resolved by providing sufficient energy to drive the local defect resonance. Within the investigated range, no phase aliasing or measurement saturation was observed, indicating that operating at the higher end of the permissible driving voltage is essential for capturing high-fidelity structural details of localized discontinuities. This voltage level remains well within the linear operating regime of the piezoelectric transducer, ensuring a stable and repeatable acoustic mechanical response. These observations establish that delivering adequate excitation energy remains a fundamental prerequisite for achieving high-contrast characterization of circular subsurface anomalies.
5.4. Effect of Shearing Distance
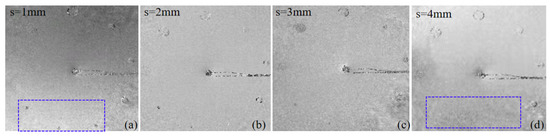
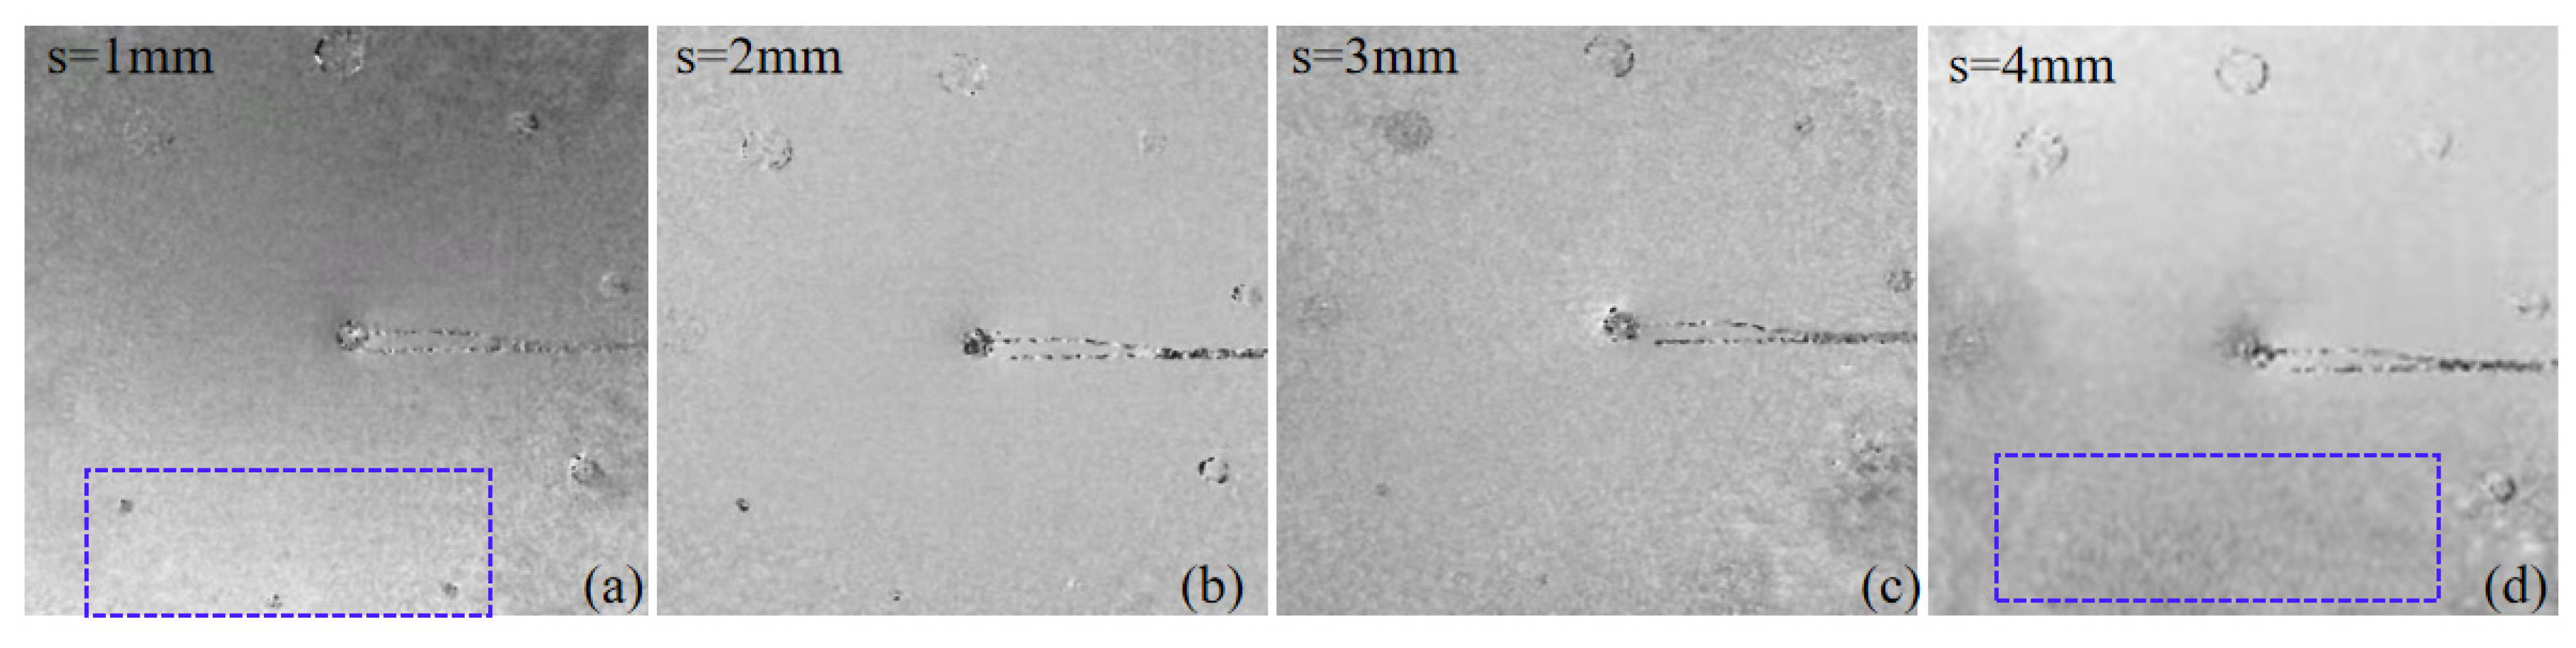
As the definer of the spatial offset between two interfering optical wave-fronts, the shearing distance is a critical parameter in digital shearography. It determines the sensitivity of the system to displacement gradients induced by acoustics, particularly regarding out-of-plane strain components. Furthermore, it influences both spatial resolution and the localized fidelity of the phase map. In this study, the shearing distance was varied from 1 mm to 4 mm along the x direction to evaluate these effects, as shown in the localized phase patterns in Figure 7.
Figure 7.
Shear wave images at shearing distances of (a) 1 mm, (b) 2 mm, (c) 3 mm and (d) 4 mm.
Under a small shearing distance configuration of s = 1 mm, the differential phase contribution remains relatively low. However, this regime is characterized by superior spatial fidelity, which is indispensable for the identification of micro-scale localized discontinuities. For the 3 mm BFBHs, the small spatial shift ensures that the localized phase distortion remains spatially coherent and confined, effectively suppressing the onset of phase aliasing within the peripheral region of the feature. As delineated by the blue boxed region in Figure 7a, the micro feature is clearly distinguishable as a localized circular phase anomaly. In contrast, for larger macroscopic anomalies such as the 8 mm BFBHs, the induced phase gradient under minimal shear is insufficient to yield a high SNR, resulting in poorly defined morphology and ambiguous boundary demarcation within the speckle field.
As the shearing distance is progressively increased to 4 mm, the amplified optical path difference significantly elevates the phase sensitivity of the system to structural deformations. This leads to a more pronounced visualization of the 8 mm features, where the circular contours and boundary gradients exhibit increased definition, reflecting the heightened sensitivity to the global strain distribution. Nevertheless, this enhancement occurs at the cost of spatial sampling integrity. The steep phase gradients associated with substantial shearing distance frequently induce excessive localized phase variations, precipitating localized aliasing and speckle decorrelation. Consequently, the 3 mm BFBHs, which were resolvable under low shear conditions, become progressively obscured or entirely masked by the background noise and the broadened double image effect, as evidenced in the blue boxed region of Figure 7d.
In summary, the optimization of the shearing distance for structural discontinuity characterization necessitates a scale-dependent trade-off. Minimal shearing distance prioritizes the mitigation of the double-image effect and the preservation of spatial resolution for micro feature resolution, whereas substantial shearing distance is optimal for maximizing phase sensitivity in the characterization of larger scale circular phase anomalies.
5.5. The Influence of Defect Geometry on Image Quality
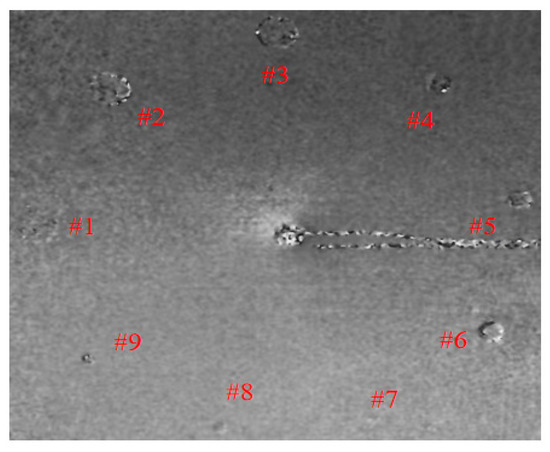
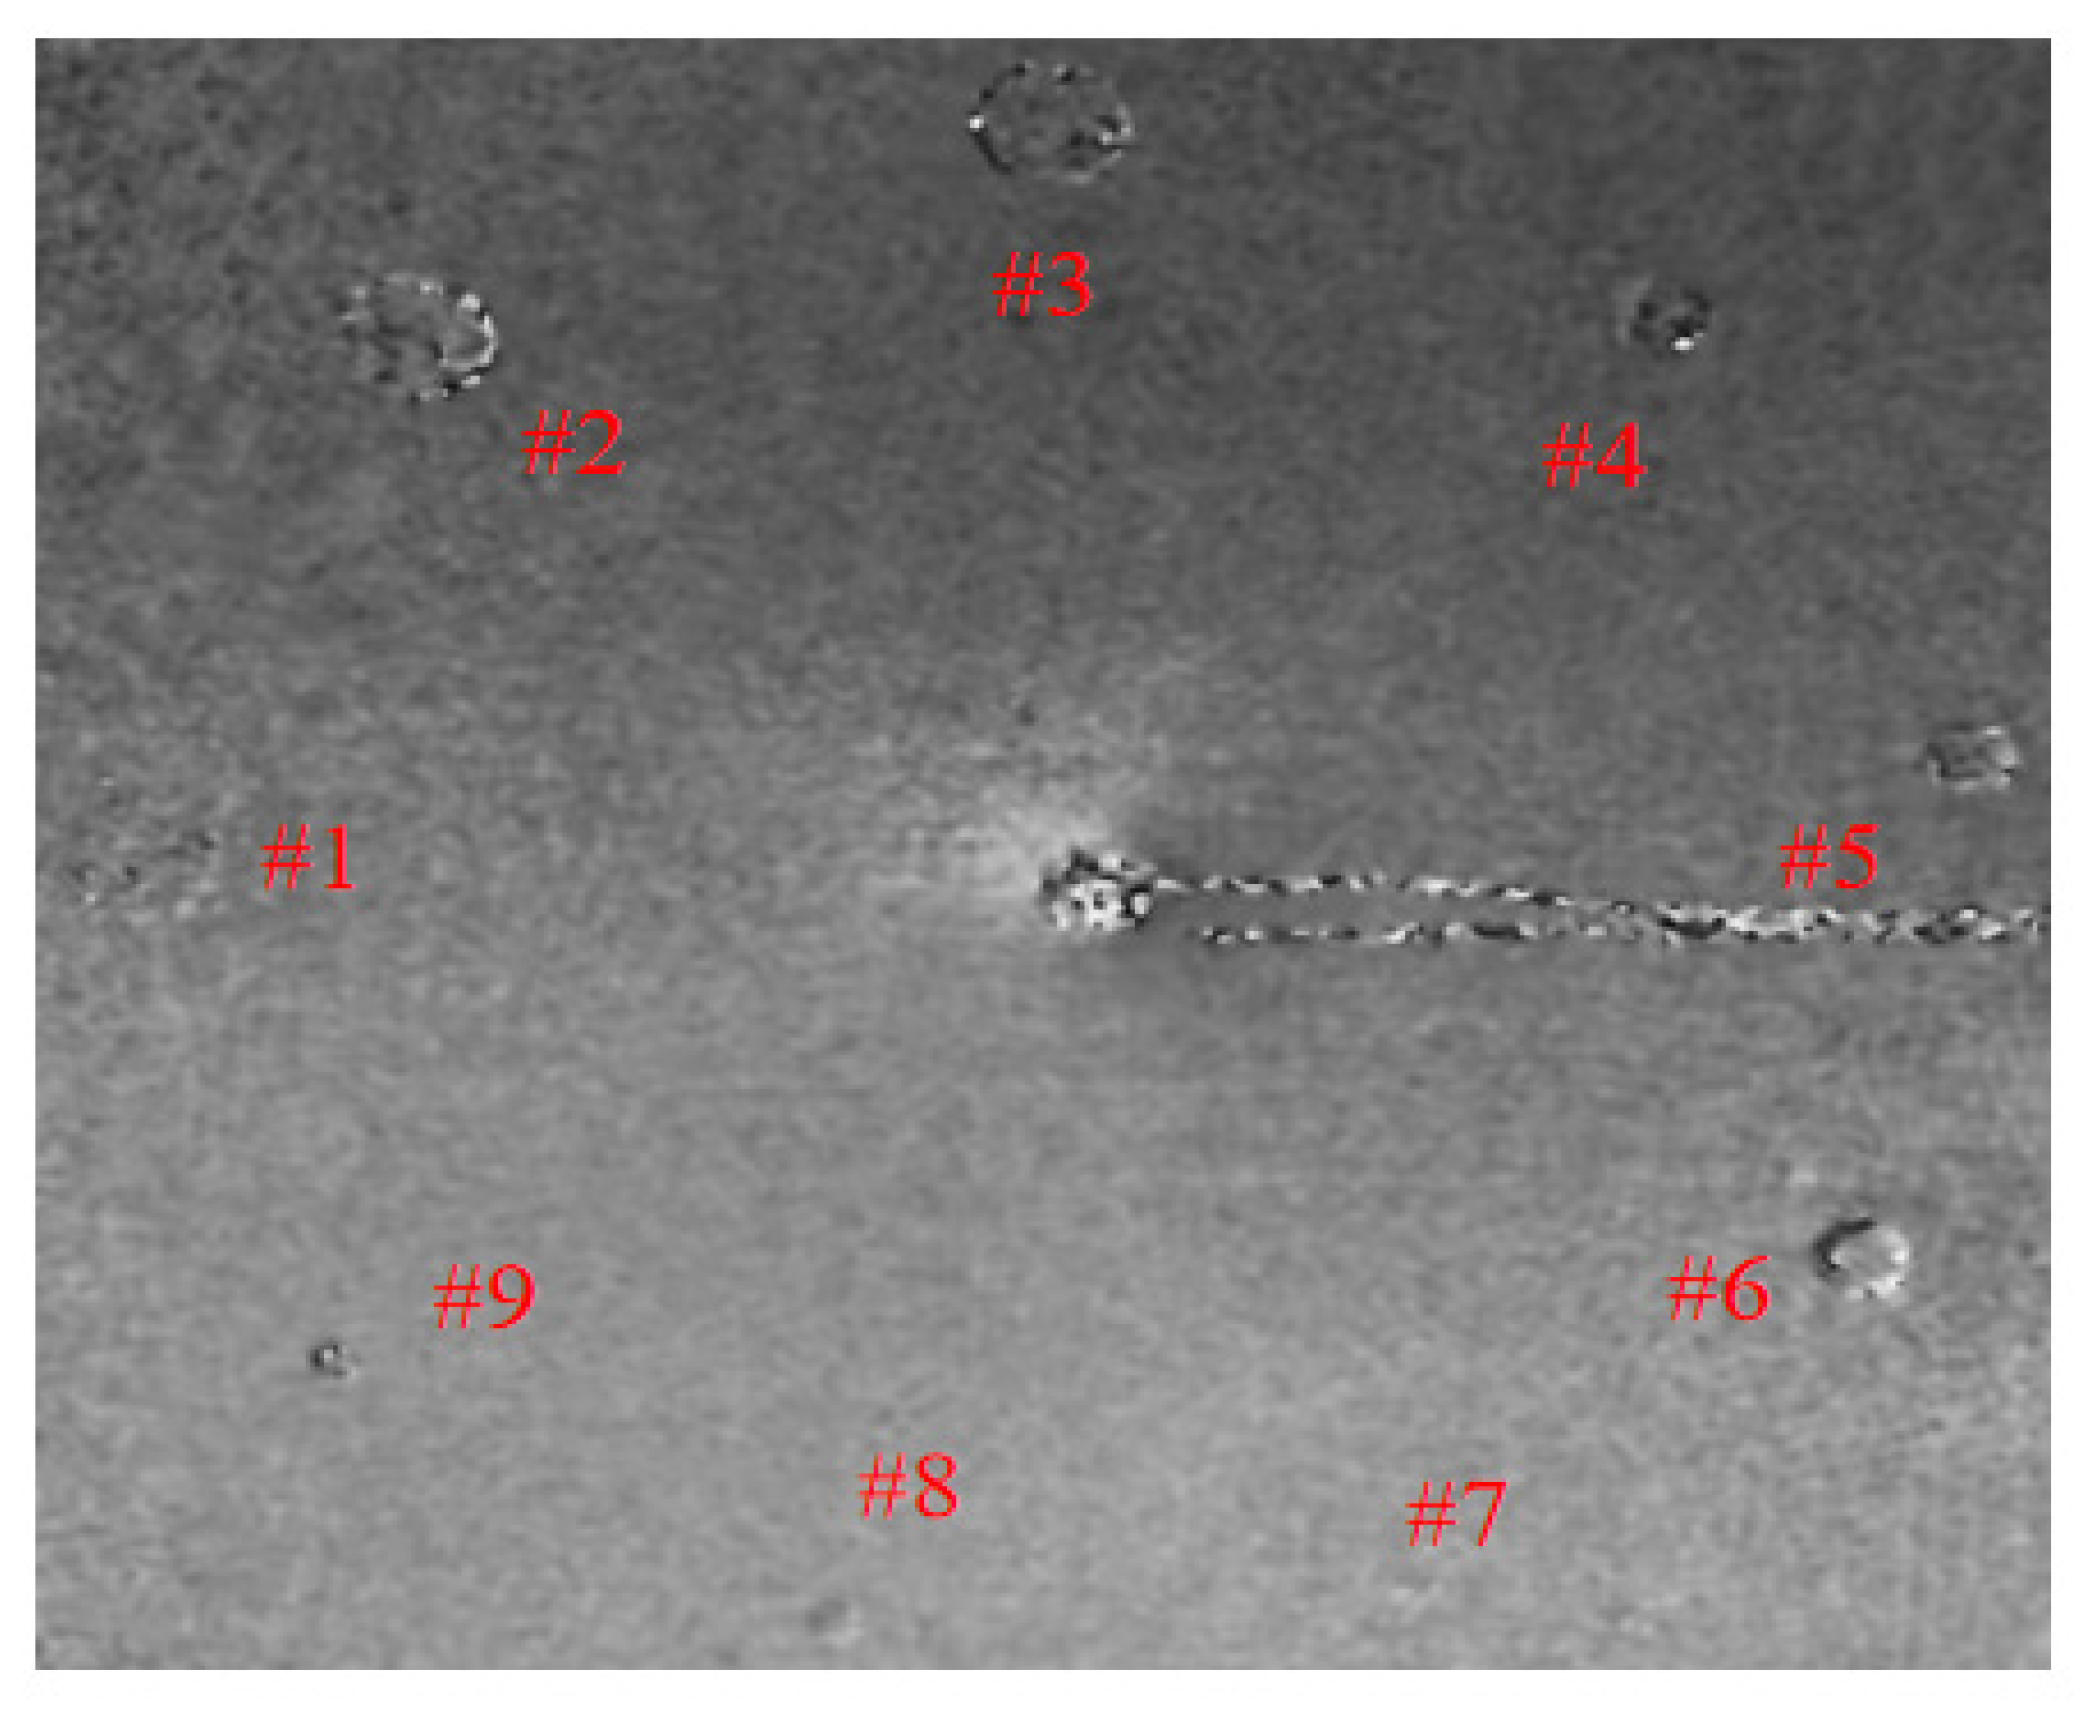
To systematically evaluate the performance of the system in characterizing various structural discontinuities, three groups of BFBH models with nominal diameters of 8 mm, 6 mm, and 3 mm were analyzed. As illustrated in Figure 8, the 8 mm diameter group comprises defects , and ; the 6 mm diameter group includes defects , and ; and the 3 mm diameter group consists of defects , and . Each group represents three distinct drilling depths of 0.3 mm, 0.6 mm, and 1.0 mm, respectively. The experimental results, summarizing the influence of feature geometry on imaging quality, show that a depth-wise comparison across all groups reveals that imaging contrast and boundary definition significantly improve as the drilling depth increases. In the context of localized discontinuity characterization, a deeper BFBH such as d = 1.0 mm represents a more substantial reduction in local structural stiffness due to the diminished residual wall thickness. This localized compliance effectively modulates the acoustic induced displacement field, creating a sharp phase gradient on the specimen surface. For the shallowest features where d = 0.3 mm, the higher residual stiffness leads to weaker mechanical energy coupling and more subtle surface strain field modulations, resulting in lower visibility in the phase maps.
Figure 8.
Shear acoustic imaging maps for holes defects of different depths and diameters under the same frequency, voltage, and shear-quantity.
The results in Figure 8 indicate a non-monotonic relationship between feature size and imaging quality. While the 8 mm BFBH group #1–#3 perturbs a wider spatial area, the resulting surface strain gradient is relatively diffuse, making the boundary definition less sharp compared to the 6 mm feature. Under the optimized 350 kHz excitation, the 6 mm BFBH group #4–#6 provides the highest contour fidelity and contrast, likely due to a closer match with the LDR frequency for that specific geometry. This experimental observation is in high agreement with the numerical predictions shown in Figure 4, where the 6 mm BFBH consistently yielded the most vivid and well-defined circular wave like patterns. The consistent superiority of the 6 mm feature across both simulation and experiment confirms that specific aperture scales optimize energy coupling and feature discernibility, validating the reliability of the FE model in guiding the characterization of localized structural discontinuities.
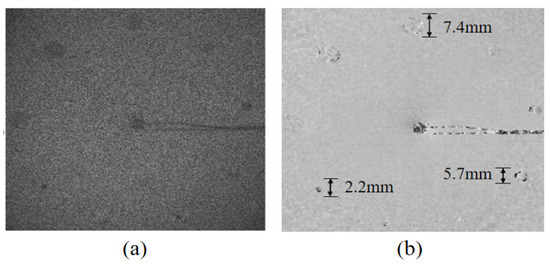
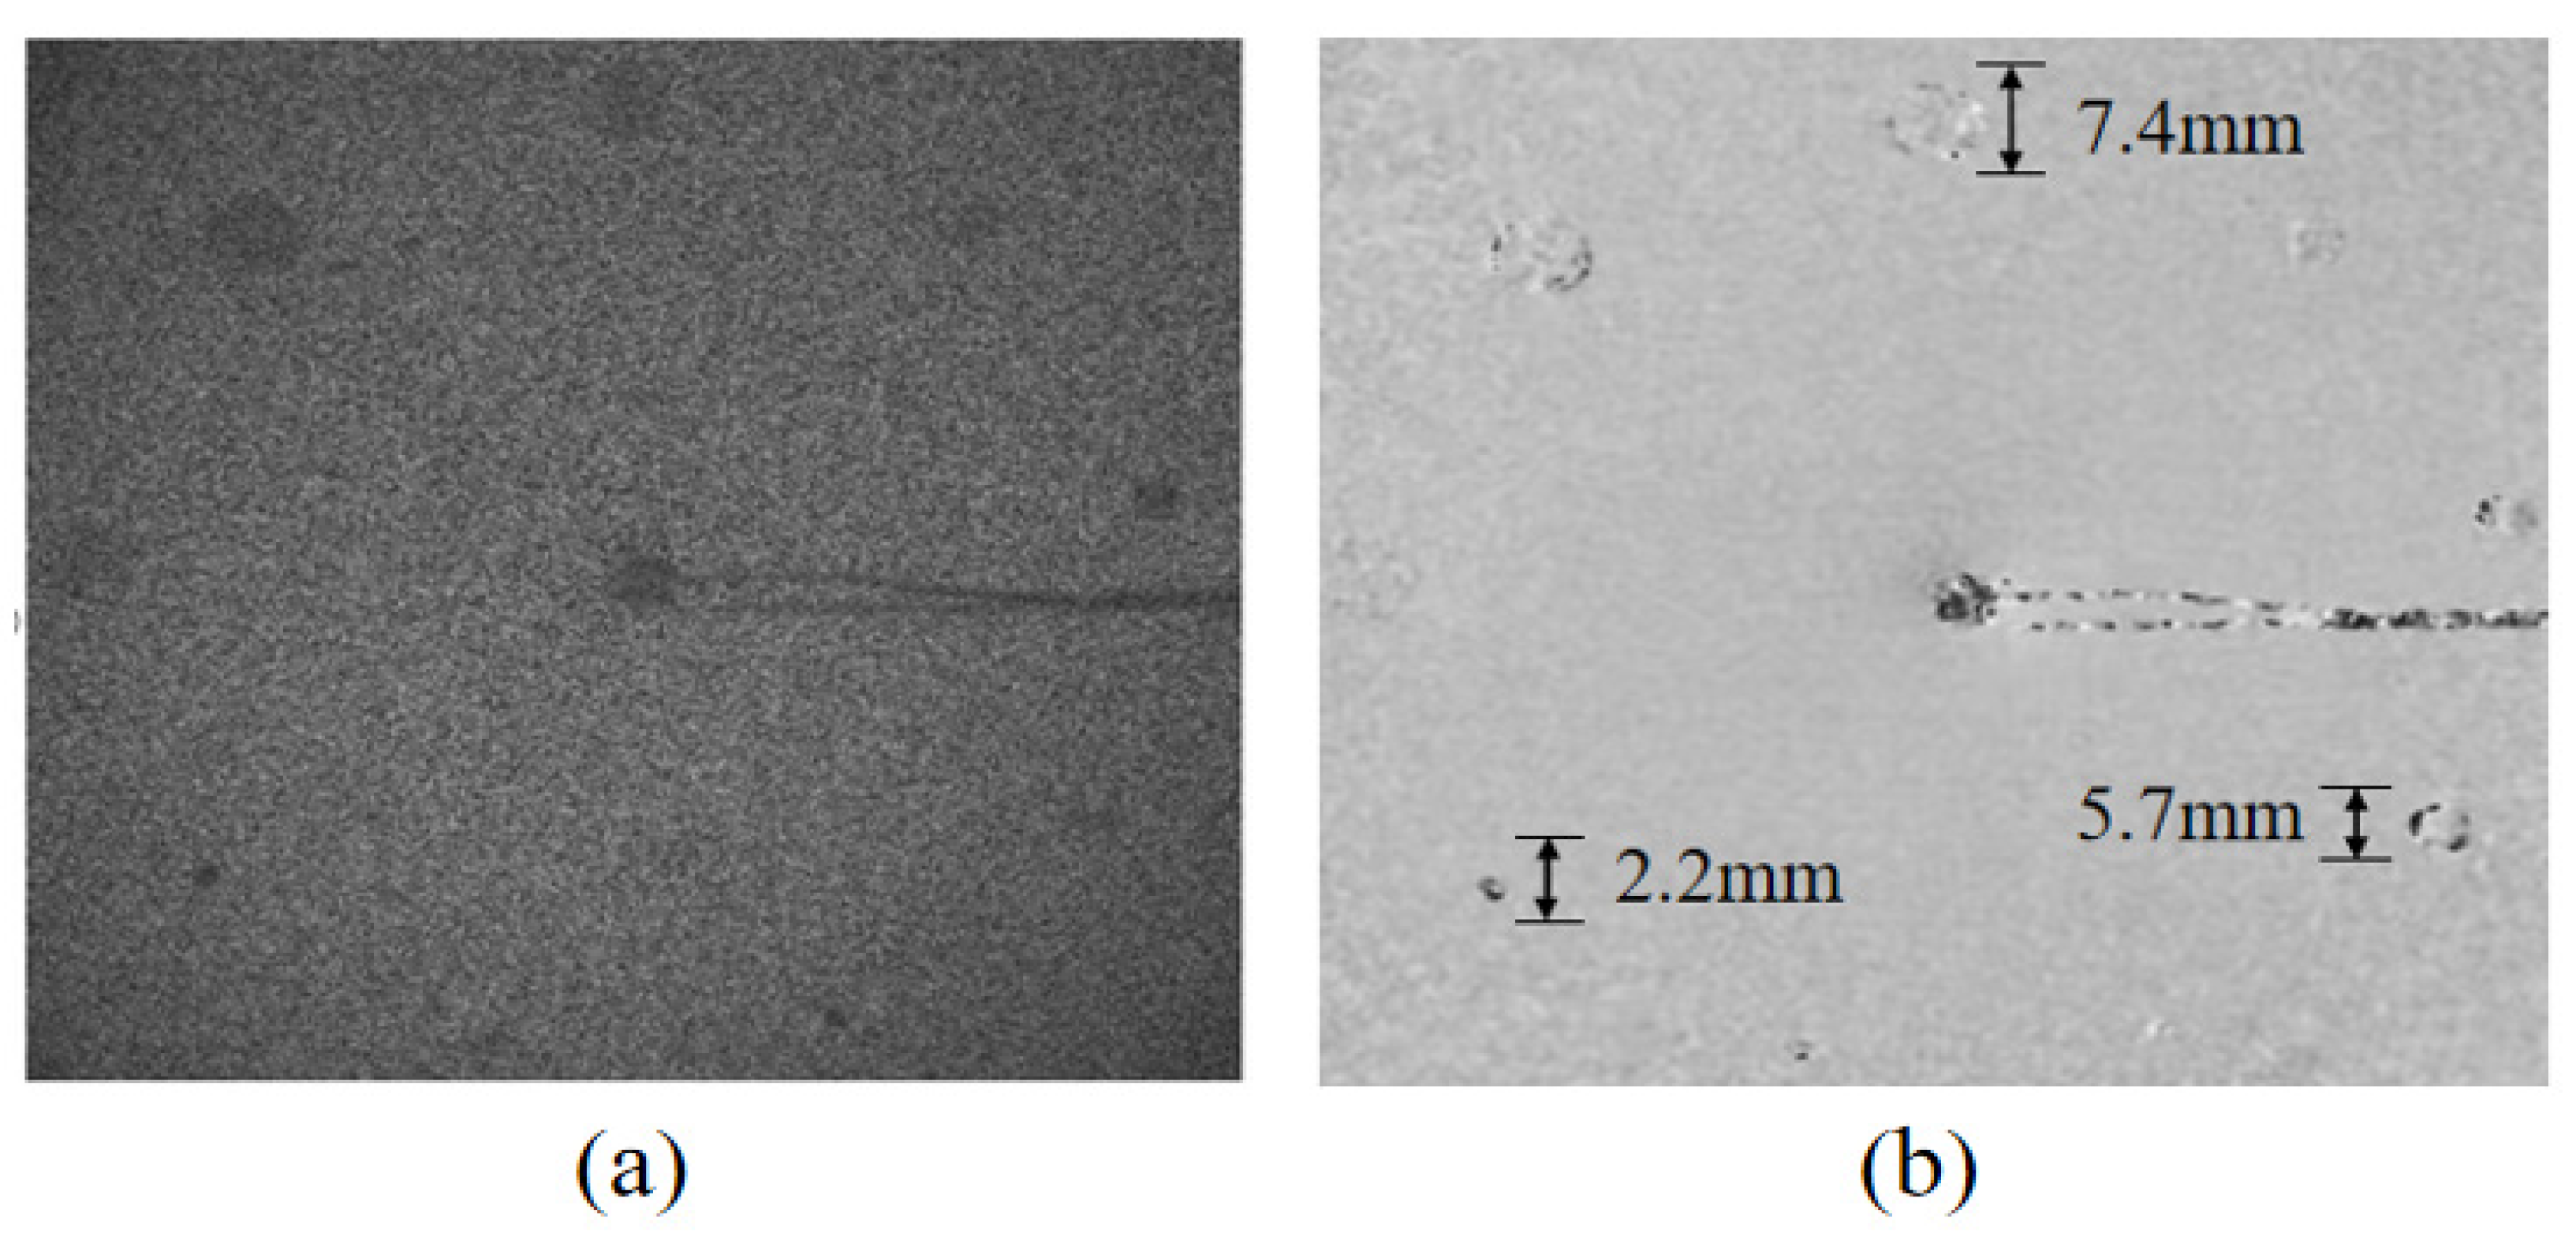
To validate the quantitative measurement capability of the proposed system, defect dimensions were extracted from the phase maps, as illustrated in Figure 9. Specifically, Figure 9a displays the raw wrapped phase map, which is characterized by high-density speckle noise and localized phase distortions at the defect sites. These localized phase anomalies directly correspond to the out-of-plane displacement gradients induced by the BFBHs. Figure 9b presents the corresponding de-noised phase map after applying the sine–cosine filtering algorithm. This process effectively suppresses multiplicative speckle noise while accentuating the circular boundaries of the phase distortions, thereby enabling a more reliable identification of the defect dimensions. The measured diameters for the 8 mm and 6 mm groups were 7.4 mm and 5.7 mm, respectively. For the 3 mm group, the measured value was 2.2 mm. The discrepancies between the measured values and nominal dimensions are primarily attributed to the constraints of the applied acoustic excitation energy. Specifically, the single miniature piezoelectric transducer employed in this study generates a relatively bounded acoustic wave field. When interacting with smaller structural anomalies such as the 6 mm and 3 mm groups, this constrained driving energy yields a weaker modulation of the local surface displacement gradient. Recognizing that the current bottleneck lies fundamentally in the excitation energy provides a logical rationale for our future transition utilizing multiple simultaneous actuators to adequately excite and identify critical micro-scale structural precursors.
Figure 9.
Wrapped phase map and filtered map after four-step phase shifting. (a) Wrapped phase diagram, (b) sine and cosine filter diagram.
As summarized in Table 1, a comprehensive benchmarking of the acoustic shearoraphy [33] against conventional phased array ultrasonic testing PAUT [39,40,41] and long pulse thermography LPT [42,43] reveals distinct operational advantages. The most profound improvement lies in the acquisition time. While PAUT requires minutes due to the necessity of point-by-point spatial scanning and LPT relies on temporal thermal integration lasting several seconds, the hybrid approach in this study achieves near-instantaneous full-field acquisition. By capturing phase modulations within a millisecond timeframe typically under 200 ms, this method dramatically accelerates the overall inspection process. Regarding diagnostic spatial limits, while PAUT is widely recognized for offering a superior minimum detectable diameter at 0.8 mm, the recent literature utilizing acoustic shearography has also demonstrated an equivalent 0.8 mm ultimate detection capability. Consequently, the 3 mm diameter features investigated in this study do not represent the fundamental resolution boundary of the proposed methodology. Rather, these features are explicitly utilized as standardized surrogate models to systematically investigate the quantitative coupling between the acoustic induced displacement gradient field and specific structural discontinuities.
Table 1.
Performance comparison of the proposed acoustic shearography framework with conventional nondestructive evaluation techniques.
In summary, the experimental and numerical results demonstrate that the characterization fidelity of acoustic shearography is governed by a complex synergy of systemic and geometric parameters. The detection performance is primarily sensitive to the excitation frequency and driving voltage; while the frequency activates the localized response of BFBHs by approaching the LDR condition, the voltage enhances the signal-to-noise ratio by overcoming internal structural damping. From an optical perspective, the shearing distance represents a critical trade-off, where larger values maximize phase sensitivity for macroscopic features and minimal shearing preserves the spatial resolution necessary for micro-scale discontinuities. Ultimately the intrinsic detectability is determined by the defect geometry, specifically the aperture radius and hole depth which dictate the modulation strength of the surface displacement gradient field. Achieving high-fidelity imaging thus requires an optimized strategy that integrates resonance-matched frequencies, sufficient power, and scale-dependent shearing configurations to ensure reliable quantitative evaluation of structural anomalies in CFRP composites.
6. Conclusions
This study systematically investigated the characterization of localized structural discontinuities in CFRP composites using acoustic shearography. To establish a quantitative framework for evaluation, CFRP specimens featuring front-surface BFBHs with varying diameters and depths were utilized as controllable surrogate models. The research integrated FEM simulations with experimental validation, where the numerical results showed high-fidelity agreement with the shearographic phase maps. This mutual validation confirms the reliability of the proposed methodology and elucidates the underlying acoustic–mechanical energy coupling mechanism, demonstrating that structural discontinuities act as localized compliance zones that modulate the surface displacement gradient field.
The investigation identifies the acoustic excitation frequency as a decisive factor in imaging performance, with optimal sensitivity achieved when the frequency approaches the LDR condition. Furthermore, the driving voltage was found to significantly enhance the signal-to-noise ratio by providing sufficient energy to overcome internal structural damping, thereby effectively activating the localized strain response of micro-scale features. The consistency between the simulated strain field distributions and the experimental fringe patterns further proves that the system can accurately capture the dynamic response triggered by these excitation parameters.
The experimental evidence further demonstrates that the residual wall thickness and aperture scale of the BFBHs exert a synergistic effect on the resulting phase patterns. Specifically, deeper holes with lower residual stiffness yield more pronounced surface perturbations, while the shearing amount must be carefully calibrated to balance the inherent trade-off between phase sensitivity and spatial resolution. In summary, acoustic shearoraphy provides a robust and rapid approach for the quantitative characterization of structural anomalies.
Despite the robust quantitative framework established in this study, several avenues remain for future investigation to bridge the gap between laboratory surrogate models and industrial diagnostic requirements. First, while the current methodology focuses on planar CFRP components with artificial BFBHs, extending this acoustic shearography approach to complex curved geometries is essential as surface curvature introduces non-uniform geometric stiffness that complicates phase map interpretation. Second, future work will transition from controlled surrogate models to the detection of stochastic manufacturing defects, including localized porosity resin-rich zones and inter-laminar kissing bonds which exhibit more complex scattering behaviors than flat-bottom holes. To effectively evaluate these completely invisible defects, the simultaneous excitation of multiple actuators represents a highly promising avenue for our future research. Furthermore, in high-performance composite structures even minuscule anomalies can act as severe stress concentrators under operational loading. The integration of deep learning-based de-noising and automated feature extraction could potentially surpass the resolution limits identified in current work, enabling the autonomous characterization of sub-millimeter anomalies.
Author Contributions
Conceptualization, H.L.; Methodology, W.M., H.L. and S.Z.; Software, W.M. and S.Z.; Validation, W.M., H.L., S.Z. and M.S.; Formal analysis, W.M., H.L., S.Z., M.S. and A.M.; Investigation, W.M., H.L., S.Z., M.S. and A.M.; Resources, H.L.; Data curation, W.M., S.Z. and A.M.; Writing – original draft, W.M., H.L. and S.Z.; Writing – review & editing, W.M., H.L. and S.Z.; Visualization, W.M. and S.Z.; Supervision, H.L.; Funding acquisition, H.L. All authors have read and agreed to the published version of the manuscript.
Funding
This research was funded by [National Natural Science Foundation of China] grant number [52175513 and 51705325].
Data Availability Statement
All data generated or analyzed during this study are included in this published article. Further information is available from the corresponding author upon reasonable request.
Conflicts of Interest
The authors declare no conflict of interest.
References
- Zhang, T.; Yasaee, M. Influence of thermoplastic interleaves and its healing effect on the failure mechanisms of open-hole notched composite laminates. Compos. Sci. Technol. 2022, 227, 109597. [Google Scholar] [CrossRef] [Scilit]
- Willmann, E.; Boll, B.; Mikaelyan, G.; Wittich, H.; Meißner, R.H.; Fiedler, B. Vibro-acoustic modulation based measurements in CFRP laminates for damage detection in open-hole structures. Compos. Commun. 2023, 42, 101659. [Google Scholar] [CrossRef] [Scilit]
- Patil, S.; Reddy, D.M.; Reddy, M. Low velocity impact analysis on composite structures—A review. In AIP Conference Proceedings; AIP Publishing LLC: New York, NY, USA, 2018; Volume 1943, p. 020009. [Google Scholar]
- Niutta, C.B.; Tridello, A.; Paolino, D.S. Ultrasonic fully reversed axial tests for exploring the very high cycle fatigue of composite materials. Int. J. Fatigue 2025, 190, 108653. [Google Scholar] [CrossRef] [Scilit]
- Wang, B.; Zhong, S.; Lee, T.L.; Fancey, K.S.; Mi, J. Non-destructive testing and evaluation of composite materials/structures: A state-of-the-art review. Adv. Mech. Eng. 2020, 12, 1–51. [Google Scholar] [CrossRef] [Scilit]
- Paltán, C.; Costa, J.; Fajardo, J. Computed tomography of polymer composites reinforced with natural short fiber. In International Conference on Computational Science and Its Applications; Springer International Publishing: Cham, Switzerland, 2019; pp. 452–467. [Google Scholar]
- Johnston, J.P.; Pereira, J.M.; Ruggeri, C.R.; Roberts, G.D. High-speed infrared thermal imaging during ballistic impact of triaxially braided composites. J. Compos. Mater. 2018, 52, 3549–3562. [Google Scholar] [CrossRef] [Scilit]
- Yue, J.; Hong, X.; Zhang, B. A damage imaging method based on particle swarm optimization for composites nondestructive testing using ultrasonic guided waves. Appl. Acoust. 2024, 218, 109878. [Google Scholar] [CrossRef] [Scilit]
- Zhang, Z.; Li, Q.; Liu, M.; Yang, W.; Ang, Y. Through transmission ultrasonic inspection of fiber waviness for thickness-tapered composites using ultrasound non-reciprocity: Simulation and experiment. Ultrasonics 2022, 123, 106716. [Google Scholar] [CrossRef] [Scilit]
- Wu, R.; Wei, H.; Lu, C.; Liu, Y. Automatic and accurate determination of defect size in shearography using U-net deep learning network. J. Nondestruct. Eval. 2025, 44, 12. [Google Scholar] [CrossRef] [Scilit]
- McDonald, S.A.; Preuss, M.; Maire, E.; Buffiere, J.Y.; Mummery, P.M.; Withers, P.J. X-ray tomographic imaging of Ti/SiC composites. J. Microsc. 2003, 209, 102–112. [Google Scholar] [CrossRef] [Scilit]
- Watanabe, T.; Takeichi, Y.; Niwa, Y.; Hojo, M.; Kimura, M. Nanoscale in situ observations of crack initiation and propagation in carbon fiber/epoxy composites using synchrotron radiation X-ray computed tomography. Compos. Sci. Technol. 2020, 197, 108244. [Google Scholar] [CrossRef] [Scilit]
- Duhovic, M.; Keilmann, A.; Schommer, D.; Redenbach, C.; Schladitz, K. Quantitative fiber orientation analysis of carbon fiber sheet molding compounds using polarization imaging and X-ray computed tomography. Compos. Part B Eng. 2025, 295, 112146. [Google Scholar] [CrossRef] [Scilit]
- Ziabari, A.; Bedhief, M.H.; Rahman, O.; Venkatakrishnan, S.; Brackman, P.; Katuch, P. Combining deep learning and scatterControl for high-throughput X-ray CT based non-destructive characterization of large-scale casted metallic components. J. Nondestruct. Eval. 2025, 44, 148. [Google Scholar] [CrossRef] [Scilit]
- Morikawa, J.; Hashimoto, T. Thermal imaging of micro-structured polymers with high-speed infrared camera. In Smart Nano-Micro Materials and Devices; SPIE: Bellingham, WA, USA, 2011; Volume 8204, pp. 415–420. [Google Scholar]
- Caminero, M.A.; García-Moreno, I.; Rodríguez, G.P.; Chacón, J.M. Internal damage evaluation of composite structures using phased array ultrasonic technique: Impact damage assessment in CFRP and 3D printed reinforced composites. Compos. Part B Eng. 2019, 165, 131–142. [Google Scholar] [CrossRef] [Scilit]
- Zhou, H.; Gao, F.; Gu, P. Research on laser ultrasonic propagation characteristics and quantitative detection of delamination of carbon fiber composite. Optik 2022, 271, 170173. [Google Scholar] [CrossRef] [Scilit]
- Yu, Z.; Jin, H.; Chen, J. Adaptive total focusing method for ultrasonic full-matrix imaging of anisotropic CFRP laminates. J. Phys. Conf. Ser. 2024, 2822, 012127. [Google Scholar] [CrossRef] [Scilit]
- Satyarnarayan, L.; Pukazhendhi, D.M.; Balasubramaniam, K.; Krishnamurthy, C.V.; Ramachandra Murthy, D.S. Phased array ultrasonic measurement of fatigue crack growth profiles in stainless steel pipes. J. Press. Vessel. Technol. 2007, 129, 737–743. [Google Scholar] [CrossRef] [Scilit]
- Feng, L.; Qian, X. Enhanced sizing for surface cracks in welded tubular joints using ultrasonic phased array and image processing. NDT E Int. 2020, 116, 102334. [Google Scholar] [CrossRef] [Scilit]
- Zhao, Q.; Dan, X.; Sun, F.; Wang, Y.; Wu, S.; Yang, L. Digital shearography for NDT: Phase measurement technique and recent developments. Appl. Sci. 2018, 8, 2662. [Google Scholar] [CrossRef] [Scilit]
- Chen, Y.S.; Hung, Y.Y.; Ng, S.P.; Huang, Y.H.; Liu, L. Review and comparison of shearography and active thermography for nondestructive testing and evaluation (NDT&E). In ICEM 2008: International Conference on Experimental Mechanics 2008; SPIE: Bellingham, WA, USA, 2009; Volume 7375, pp. 1139–1144. [Google Scholar]
- Shang, H.M.; Chau, F.S.; Tay, C.J.; Toh, S.L.; Tham, L.M. A simple model for sizing unbonds in foam-adhesive bonded laminates from shearographic fringes. Compos. Eng. 1994, 4, 233–245. [Google Scholar] [CrossRef] [Scilit]
- Wen, T. Vibration-Based Structural Health Monitoring of Composite Plates with Integrated Sustainable Micro-Fibre Transducers. Ph.D. Thesis, University of Chester, Chester, UK, 2024. [Google Scholar]
- Yin, J.F.; Bai, Q.; Zhang, B. Methods for detection of subsurface damage: A review. Chin. J. Mech. Eng. 2018, 31, 41. [Google Scholar] [CrossRef] [Scilit]
- Nejad, M.T.; Akbari, D.; Tirband, H. Detection of Sub-Surface Defects in Polymer Materials Using Digital Shearography Method with Different Loading and Set-up Parameters. In Proceedings of the 6th Iranian International NDT Conference, Tehran, Iran, 17–18 February 2020; pp. 17–18. [Google Scholar]
- Agathos, K.; Chatzi, E.; Bordas, S.P. Multiple crack detection in 3D using a stable XFEM and global optimization. Comput. Mech. 2018, 62, 835–852. [Google Scholar] [CrossRef] [Scilit] [PubMed]
- Zhao, W.; Du, C.; Jiang, S. An adaptive multiscale approach for identifying multiple flaws based on XFEM and a discrete artificial fish swarm algorithm. Comput. Methods Appl. Mech. Eng. 2018, 339, 341–357. [Google Scholar] [CrossRef] [Scilit]
- Nicolas, A.; Mello, A.W.; Sun, Y.; Johnson, D.R.; Sangid, M.D. Reconstruction methods and analysis of subsurface uncertainty for anisotropic microstructures. Mater. Sci. Eng. A 2019, 760, 76–87. [Google Scholar] [CrossRef] [Scilit]
- Tham, Z.W.; Chen, Y.F.; Tan, C.Y.; Zhang, L. Wave-based acoustic shearography for defect imaging. In Nondestructive Characterization and Monitoring of Advanced Materials, Aerospace, Civil Infrastructure, and Transportation XVII; SPIE: Bellingham, WA, USA, 2023; Volume 12487, pp. 213–218. [Google Scholar]
- Liu, H.; Liu, M.; Zhang, L.; Chen, Y.F.; Tan, C.Y.; Guo, S.; Cui, F. Directed acoustic shearography for crack detection around fastener holes in aluminum plates. NDT E Int. 2018, 100, 124–131. [Google Scholar] [CrossRef] [Scilit]
- Adebahr, W.; Solodov, I.; Rahammer, M.; Gulnizkij, N.; Kreutzbruck, M. Local defect resonance for sensitive non-destructive testing. In AIP Conference Proceedings; AIP Publishing LLC: Melville, NY, USA, 2016; Volume 1706, p. 050005. [Google Scholar]
- Zhang, L.; Tham, Z.W.; Chen, Y.F.; Tan, C.Y.; Cui, F.; Mutiargo, B.; Ke, L. Defect imaging in carbon fiber composites by acoustic shearography. Compos. Sci. Technol. 2022, 223, 109417. [Google Scholar] [CrossRef] [Scilit]
- Solodov, I. Resonant ultrasonic activation of damage: Application for diagnostic imaging. Res. Nondestruct. Eval. 2017, 28, 28–44. [Google Scholar] [CrossRef] [Scilit]
- Gupta, R.; Mitchell, D.; Blanche, J.; Harper, S.; Tang, W.; Pancholi, K.; Flynn, D. A review of sensing technologies for non-destructive evaluation of structural composite materials. J. Compos. Sci. 2021, 5, 319. [Google Scholar] [CrossRef] [Scilit]
- Sencu, R.M.; Yang, Z.; Wang, Y.C.; Withers, P.J.; Soutis, C. Multiscale image-based modelling of damage and fracture in carbon fibre reinforced polymer composites. Compos. Sci. Technol. 2020, 198, 108243. [Google Scholar] [CrossRef] [Scilit]
- Tao, N.; Anisimov, A.G.; Groves, R.M. Shearography non-destructive testing of thick GFRP laminates: Numerical and experimental study on defect detection with thermal loading. Compos. Struct. 2022, 282, 115008. [Google Scholar] [CrossRef] [Scilit]
- Daniel, I.M.; Ishai, O. Engineering Mechanics of Composite Materials; Oxford University Press: New York, NY, USA, 1994; p. 256. [Google Scholar]
- Taheri, H.; Hassen, A.A. Nondestructive ultrasonic inspection of composite materials: A comparative advantage of phased array ultrasonic. Appl. Sci. 2019, 9, 1628. [Google Scholar] [CrossRef] [Scilit]
- Ma, M.; Wang, Z.; Gao, Z.; Jiang, M. Ultrasonic phased array testing and identification of multiple-type internal defects in carbon fiber reinforced plastics based on convolutional neural network. Materials 2025, 18, 318. [Google Scholar] [CrossRef] [Scilit]
- Zhang, H.; Peng, L.; Zhang, H.; Zhang, T.; Zhu, Q. Phased array ultrasonic inspection and automated identification of wrinkles in laminated composites. Compos. Struct. 2022, 300, 116170. [Google Scholar] [CrossRef] [Scilit]
- Wang, Z.; Wan, L.; Zhu, J.; Ciampa, F. Evaluation of defect depth in CFRP composites by long pulse thermography. NDT E Int. 2022, 129, 102658. [Google Scholar] [CrossRef] [Scilit]
- Wang, Z.; Zhu, J.; Tian, G.; Ciampa, F. Comparative analysis of eddy current pulsed thermography and long pulse thermography for damage detection in metals and composites. NDT E Int. 2019, 107, 102155. [Google Scholar] [CrossRef] [Scilit]

Disclaimer/Publisher’s Note: The statements, opinions and data contained in all publications are solely those of the individual author(s) and contributor(s) and not of MDPI and/or the editor(s). MDPI and/or the editor(s) disclaim responsibility for any injury to people or property resulting from any ideas, methods, instructions or products referred to in the content. |
© 2026 by the authors. Licensee MDPI, Basel, Switzerland. This article is an open access article distributed under the terms and conditions of the Creative Commons Attribution (CC BY) license.