


Abstract
Dissimilar friction stir welding (FSW) of titanium alloys offers a route to spatially optimized aerospace structures, but the asymmetric thermomechanical environment produces heterogeneous microstructures and textures whose interaction with mechanical performance is not well characterized. A near-α/α+β combination of titanium alloys, Ti–6242 SG (advancing side, ADV) and Ti–54M (retreating side, RET), was welded across a matrix of rotation speeds (225–325 rpm) and traverse speeds (100–150 mm·min−1), spanning rotation-to-traverse-speed ratios N/v of 1.80–2.75, which was used throughout as an empirical processing index that orders the conditions of this matrix rather than as a measure of specific heat input. Microstructure, phase identification, relative diffracted-intensity trends, and crystallographic textures were characterized by 2D-XRD at three cross-section locations (ADV, weld nugget center [CEN], RET) and correlated with transverse tensile properties and fracture locations. Partial pole figures were plotted in the simple-shear reference frame with ideal-orientation overlays, intensities in multiples of a random distribution (m.r.d.). The CEN develops the strongest textures, dominated by a basal {002}α component (20–31 m.r.d.) with poles near the normal direction; this concentration lies away from the ideal shear fiber loci and is more readily explained by orientation inheritance during the β→α transformation on cooling than by direct shear, although unambiguous identification of variant selection would require orientation-resolved measurements. The RET develops {101}α and {100}α pole concentrations clustering near the ideal P-fiber loci, consistent with deformation-related texture development, intensifying with both rotation and traverse speed. The ADV shows mixed textures varying non-monotonically with parameters. Two conditions of nearly identical N/v obtained from different parameter combinations (225 rpm/125 mm·min−1 and 275 rpm/150 mm·min−1) nevertheless develop measurably different streak morphologies, microstructures, textures, and tensile responses, showing directly that N/v orders but does not determine the thermomechanical state. Yield strength is uniform (≈900–940 MPa) across the full matrix, consistent with a Schmid-factor estimate in which the basal-near-ND CEN texture gives a very low resolved shear stress on basal systems under transverse loading; joint efficiencies reach ≈90–96%. Ductility, in contrast, tracks consolidation quality rather than texture severity: fracture strain rises almost monotonically with N/v, from ≈0.6–1.4% at N/v ≈ 1.8 (defect-driven, erratic failure) to ≈5.4–6.0% at N/v = 2.60, despite the latter condition carrying the strongest RET pyramidal texture. Full-field strain measurement shows the weld nugget to carry the lowest strain and the highest apparent stiffness of any zone in every condition for which the load record is reliable, with strain accumulating on the advancing side. Consolidated conditions fracture on the advancing side where deformation concentrates, whereas the lowest N/v and longest-exposure conditions fracture in the nugget center; all fracture surfaces are ductile, with the crack path following continuous α layers at prior-β grain boundaries. A favorable processing range within the investigated parameter matrix is N/v ≈ 2.2–2.6, with the best overall combination at 325 rpm and 125 mm·min−1 (N/v = 2.60: UTS ≈ 1010 MPa, ≈5.4–6.0% elongation). Within the parameter range examined here, consolidation quality is the first-order design variable for this dissimilar system, with the zonal texture architecture setting the yield strength level.
1. Introduction
Titanium alloys are integral to aerospace propulsion systems, where thermal capability, specific strength, and durability must be simultaneously optimized. Near-α alloys such as Ti–6Al–2Sn–4Zr–2Mo (Ti–6242) are deployed in high-temperature compressor stages owing to their superior creep resistance and microstructural stability at elevated temperatures, while α+β alloys such as Ti–54M offer a more favorable strength-to-machinability balance suited to structural components and complex geometries where forming and machining costs must be minimized [1,2]. Integrating these two alloy classes into a single joined structure would enable spatially optimized designs that exploit the high-temperature capability of Ti–6242 where it is needed and the improved machinability of Ti–54M elsewhere. The mechanical integrity of such dissimilar joints depends not only on freedom from macroscopic defects but, critically, on the crystallographic texture that develops during joining, because hexagonal close-packed (HCP) α-Ti has a restricted set of slip systems whose activation is highly sensitive to grain orientation [3,4,5,6].
Friction stir welding (FSW) is a solid-state joining process in which a rotating, non-consumable tool plasticizes and stirs adjacent materials without melting them [6]. Conducted under an inert atmosphere for titanium alloys, FSW subjects the weld nugget (WN) to intense simple-shear deformation and thermal cycles that can exceed the β-transus temperature (Tβ) of the alloys involved. Material that passes above Tβ transforms to body-centered cubic (BCC) β, which then decomposes to HCP α upon cooling following the Burgers orientation relationship (Burgers OR), {110}β ‖ {0001}α and ⟨111⟩β ‖ ⟨11–20⟩α, which generates twelve possible α variants per parent β grain. The strength of subsequent variant selection, i.e., whether all twelve variants nucleate with equal probability or only a subset is favored, is governed jointly by alloy chemistry, local stress state during cooling, and cooling rate [7,8,9,10]. Shear textures inherited from β-phase deformation (D1/D2-type BCC shear components) can be preserved in the final α microstructure via the Burgers OR, or the material may reorganize into HCP shear textures if deformation continues below Tβ [8,11,12,13,14,15]. Stationary-shoulder FSW studies on Ti–6Al–4V have reported that processing above Tβ can produce D2 BCC shear textures that transform to fully lamellar α upon cooling [8], while processing conditions that remain below Tβ have been associated with direct HCP shear textures attributed to active prismatic ⟨a⟩ and pyramidal ⟨c+a⟩ slip systems [9,16]. For dissimilar welds involving Ti–6242 SG (Tβ ≈ 990 °C) and Ti–54M (Tβ ≈ 938 °C), the distinct transus temperatures and alloy compositions create strongly asymmetric thermomechanical and textural gradients across the joint cross-section that are not present in similar alloy welds.
Pole-figure analysis of FSW α-Ti is most usefully framed in the simple-shear reference frame attached to the tool, rather than the rolling-mill frame familiar from sheet-metal texture work. In this convention, intensities are reported in multiples of a random distribution (m.r.d.)—a value of unity corresponds to an untextured polycrystal, while values above unity quantify the local degree of preferred orientation, and ideal-orientation overlays are commonly superposed on the experimental pole figure to identify which canonical shear components are active. For HCP simple shear, the principal fibers (P, B, and C in the Beausir–Tóth nomenclature) capture the dominant orientations developed by ⟨a⟩-type prismatic and ⟨c+a⟩-type pyramidal slip [11,12,13,14,16,17,18]. Reading FSW pole figures against these ideal-orientation loci, rather than as standalone intensity maps, permits direct comparison between weld zones, between alloys, and across different parameter sets, and is the framework adopted throughout the present study.
Studies of titanium FSW and of additively manufactured titanium [19,20] document texture development across alloy types, but systematic studies of dissimilar titanium joints remain scarce, and quantitative texture–property correlations across multiple processing parameters are rarer still. In Ti–6Al–4V, Yoon et al. [9] showed that rotation speed governs the transition between sub- and super-transus microstructures, producing distinct lamellar and equiaxed α morphologies and characteristic [0001]α pole concentrations from variant selection. Fall et al. [16] correlated microtexture with local mechanical properties across FSW zones and found that the stir-zone center develops a fine equiaxed microstructure exhibiting P- and C-fiber shear orientations consistent with active prismatic ⟨a⟩ and pyramidal ⟨c+a⟩ slip; these texture gradients have been reported to govern strain localization in the stir zone [19]. Malik et al. [20] examined FSW of electron-beam-melted Ti–6Al–4V, in which the as-built material carries a strong transformation texture, a basal intensity of ≈38 multiples of uniform density (MUD, equivalent to the m.r.d. units used in the present work), and pronounced variant selection, with ⟨11–20⟩/60° α/α boundaries occurring at more than twice their random frequency. Friction stir welding progressively dismantled this texture, with basal intensity falling from ≈35 MUD in the HAZ to ≈13 in the TMAZ and ≈7 near the stir-zone center through continuous dynamic recrystallization; yet at the very center of the stir zone, where deformation is most severe and cooling slowest, the texture re-intensified (≈15 MUD) and variant selection re-emerged during the β→α transformation. It should be noted that those intensities were obtained from EBSD-derived orientation distribution functions and are therefore not numerically equivalent to the partial-pole-figure m.r.d. values reported here (Section 2.5); the comparison drawn below is one of mechanism and relative ranking, not of absolute magnitude. This coexistence of shear-induced randomization and transformation-driven variant selection within a single weld is precisely the competition that governs the zonal texture architecture of the present dissimilar joint, where the deformation-dominated RET and the transformation-dominated CEN represent its two limiting outcomes. For the Ti–6242 SG/Ti–54M dissimilar system, Gangwar et al. have characterized macrostructures and mechanical properties [3,4,21] and residual stress distributions [22], but a unified account integrating both rotation-speed and traverse-speed effects with zonal texture quantification, transformation- and deformation-related texture development, and transverse tensile and fracture behavior has not been reported.
Philip et al. [18] have recently consolidated two decades of friction stir processing of titanium and its alloys, synthesizing how rotation speed, traverse speed, and pass number govern β-region grain size, α-phase morphology, and shear texture development, and cataloging the characteristic defect families and unusually narrow processing windows of α+β titanium alloys. Their synthesis, however, is confined almost entirely to similar alloy processing; a systematic dissimilar titanium study integrating both rotation and traverse-speed axes with zonal texture quantification and transverse tensile behavior remains absent, motivating the present work.
The present work addresses this gap with three specific objectives: (i) to document how rotation speed and traverse speed independently and jointly influence the relative diffracted intensities of the principal α and β reflections and crystallographic textures across the three characteristic weld zones (ADV, CEN, RET) in dissimilar Ti–6242 SG/Ti–54M FSW; (ii) to interpret the measured partial pole figures within a unified simple-shear reference frame using ideal-orientation overlays, so that the experimental pole distributions can be discussed in terms of transformation-related and deformation-related mechanisms; and (iii) to relate the zonal textures to transverse tensile behavior and fracture location through a Schmid-factor estimate and to identify the mechanisms most plausibly governing yield strength and elongation across the parameter matrix. To address these objectives, two complementary parameter series were designed; a rotation-speed series at fixed traverse speed and a traverse-speed series at fixed rotation speed, sharing one common specimen so that systematic comparison is possible.
Throughout this work the rotation-to-traverse-speed ratio N/v (rpm·min·mm−1) is used as an empirical processing index that orders the conditions of the present matrix; it is deliberately not described as a specific heat input. The heat generated in FSW is set by the interfacial shear stress and slip condition integrated over the tool contact area, and therefore depends on spindle torque and power, axial force, shoulder and pin geometry, plunge depth and tool tilt, the friction and contact state at the tool/workpiece interface, and the temperature-dependent flow behavior of the workpiece [5,23,24,25]. None of these quantities were instrumented in the present experiments, so N/v is a kinematic descriptor of the process rather than an energy balance. Rotation speed and traverse speed also remain thermomechanically coupled: rotation speed principally scales the interfacial shear rate and hence the rate of heat generation, whereas traverse speed principally sets the thermomechanical exposure time and the effective cooling rate, but neither variable can be changed without simultaneously altering peak temperature, strain rate, and cooling rate. Because tool geometry, tilt, plunge depth, fixturing, and alloy placement were held fixed across the entire matrix, the two-series design adopted here permits the relative influence of rotation and traverse speed to be examined under otherwise identical conditions; it does not permit their effects to be separated completely. Consistent with this limitation, the matrix contains two conditions of nearly equal N/v obtained from different parameter combinations, S1 (P5) (225 rpm, 125 mm·min−1; N/v = 1.80) and P2 (275 rpm, 150 mm·min−1; N/v = 1.83), whose microstructures, textures, and tensile responses are compared explicitly in Section 4.1.1 to test the adequacy of the N/v description.
2. Materials and Methods
2.1. Base Materials
As-milled sheets of Ti–54M (Ti–5Al–4V–0.6Mo–0.4Fe) and Ti–6242 SG (Ti–6Al–2Sn–4Zr–2Mo, standard-grain), each 200 mm × 100 mm × 4 mm, were used as received. Ti–6242 SG (near-α) consists of elongated primary α grains (typical width 5–15 µm in the rolling plane) with thin intergranular β films; its Tβ is approximately 990 °C and Vickers hardness is 323 ± 8 HV (mean ± standard deviation, n = 10 indents). Ti–54M (α+β) consists of equiaxed primary α grains (5–10 µm) with fine α laths interspersed within a transformed β matrix; its Tβ is approximately 938 °C and Vickers hardness is 333 ± 9 HV. Material flow at FSW peak temperatures (≈900–1050 °C) is governed by the temperature-dependent flow stress and effective viscosity of each alloy at those temperatures, not by room temperature hardness. The small room temperature hardness difference between the two alloys is therefore reported here only as a convenient empirical indicator, which has been observed to track which alloy migrates preferentially in similar-titanium FSW [3,4,22]; the asymmetric flow behavior is interpreted thermomechanically in Section 4.1.
2.2. Welding Configuration and Process Matrix
Sheets were butt-welded with Ti–6242 SG on the ADV side and Ti–54M on the RET side in an argon-purged chamber at The Boeing Company, Auburn, WA, USA. A tungsten–rhenium (W–Re) tool with a tapered pin and profiled shoulder was used; specific tool dimensions are proprietary, but the same tool geometry was used for all welds reported here, and tilt angle and plunge depth were kept constant across all experiments. The ADV-side assignment of Ti–6242 SG was held fixed throughout the parameter matrix to isolate the effects of rotation and traverse speed; the converse configuration is the subject of separate work and is referenced where appropriate in the discussion.
Two parameter series were investigated. In the rotation-speed series, rotation speed N was varied at 225 rpm (S1 (P5)), 275 rpm (S2 (P1)), and 325 rpm (S3 (P3)) with traverse speed fixed at 125 mm·min−1. In the traverse-speed series, traverse speed v was varied at 100 mm·min−1 (P4), 125 mm·min−1 (P1), and 150 mm·min−1 (P2) with rotation speed fixed at 275 rpm. The specimen S2 (P1) is common to both series and therefore provides the point on which the two series are compared; its measurements are reported in both series and are not independent replicates (Section 2.5). Parameters are summarized in Table 1.
Table 1.
Friction stir welding parameters.
The rotation-to-traverse-speed ratio N/v (rpm·min·mm−1) ranges from 1.80 (S1 (P5)) to 2.75 (P4), with P1 at an intermediate value of 2.20. It is used throughout as an empirical processing index that provides a compact, monotonic ordering of the present matrix, and is widely used for that purpose in the FSW literature [1,5,15]. It is not used as a measure of specific heat input, and no conclusion drawn in this paper depends on equating a given N/v with a given heat input. As set out in Section 1, heat generation additionally depends on spindle torque and power, axial force, shoulder and pin geometry, plunge depth and tilt, interfacial friction and contact state, and temperature-dependent material flow [5,23,24,25]. In the present experiments, spindle torque, spindle power, axial force, and weld thermal cycles were not recorded, and no direct temperature measurement is available; peak-temperature statements made in Section 3 and Section 4 are therefore inferences from the observed microstructural state relative to the known Tβ of each alloy, not measurements. Two conditions of the matrix, S1 (P5) (N/v = 1.80) and P2 (N/v = 1.83), have nearly identical N/v but different combinations of N and v, and this pair is used in Section 4.1.1 to test how far N/v alone describes the thermomechanical state.
2.3. Metallographic and Compositional Characterization
Transverse cross-sections were cut from the steady-state welding region (≥30 mm behind the leading edge of the weld), mounted in conductive epoxy, ground sequentially on SiC papers from 320 to 4000 grit, polished with 1 µm diamond suspension followed by 0.04 µm colloidal silica, and etched with Kroll’s reagent (5 mL HF, 10 mL HNO3, 85 mL H2O, prepared in-house from reagent-grade acids) for 10–15 s. Macrographs documented weld nugget geometry, the absence of volumetric defects, and Ti–54M streak morphology. Microstructures were characterized at three locations identified 1.5 mm below the weld top surface (Figure 1): the ADV interface (red circle, sampled within the Ti–6242 SG region adjacent to the weld nugget boundary), the WN center (CEN, green circle), and the RET interface (blue circle, sampled within the Ti–54M region adjacent to the weld nugget boundary). The 1.5 mm depth was selected to lie within the steady-state pin-stirred zone and to avoid edge-effect artifacts associated with the shoulder-affected near-surface region. Streak compositions were verified by energy-dispersive X-ray spectroscopy (EDS) at the CEN and ADV regions of representative specimens (S2 (P1) and P4): light-shaded streaks consistently exhibited the V-bearing chemistry of Ti–54M, while the matrix exhibited the Sn- and Zr-bearing chemistry of Ti–6242 SG. Additional details can be found elsewhere [26]. Scanning electron microscopy and EDS were performed on a JEOL JSM-6010 Plus scanning electron microscope (JEOL Ltd., Tokyo, Japan) at an accelerating voltage of 10 keV for imaging and 20–30 keV with spot size 4–5 for EDS acquisition; EDS spectra were processed and peaks identified using Oxford AZtec software (version 3.3; Oxford Instruments NanoAnalysis, High Wycombe, UK). Specimens for SEM were repolished through 3, 0.5, 0.25 and 0.05 µm diamond followed by colloidal silica with H2O2 and etched with an HF-rich reagent to provide the relief required for electron imaging. Representative EDS line and map scans across the ADV, CEN and RET locations are presented in Section 3.1. Because EDS has poor sensitivity to light elements, no interstitial (O, N) analysis was attempted [26].
Figure 1.
Friction stir welding setup and characterization scheme. (a) Schematic showing plunging force, welding direction, tool rotation, and the designation of advancing (ADV, Ti–6242 SG) and retreating (RET, Ti–54M) sides. (b) Transverse cross-section schematic with three characterization locations (blue circle: RET; green circle: CEN; red circle: ADV) positioned 1.5 mm below the weld top surface.
2.4. X-Ray Diffraction: Phase Identification and Peak-Intensity Analysis
X-ray diffractograms were collected by two-dimensional X-ray diffraction (2D-XRD) [27] using Cu-Kα radiation (λ = 1.5418 Å) with a collimated incident beam of diameter ≈ 800 µm at the same three locations used for metallography. Diffractometer parameters are summarized in Table 2. The α-phase reflections {100}α, {002}α, {101}α, and {102}α and the β-phase reflection {110}β were identified across the 2θ range 30–60°. Instrumental configuration and alignment followed the procedures previously reported for residual stress measurement on this weld series [22] and are described in Section 2.5.
Table 2.
X-ray diffraction parameters.
Background was subtracted using a linear baseline fit between local minima flanking each peak; integrated peak intensities (counts per second, cps) are reported in Section 3.3 as semi-quantitative indicators of the relative abundance of each crystallographic plane, not as absolute volume fractions. The scope of that statement is set out in full in the following paragraph.
Three restrictions on the interpretation of these intensities should be stated explicitly. First, they are not phase fractions. Volume fraction quantification by Rietveld refinement was not attempted, because the strong preferred orientation of the welded material violates the random-orientation assumption underlying both Rietveld and simple intensity-ratio methods; correcting for it would itself require the full orientation distribution function, which the present partial pole figures do not provide. Second, they are not α variants. Each measured quantity is the integrated intensity of a single crystallographic plane family, {100}α, {002}α, {101}α, {102}α, {110}β, and the term “variant”, which denotes one of the twelve Burgers-related α orientations derived from a common parent β grain, is therefore not applied to them anywhere in this paper. Third, the integrated intensity of a reflection in a textured polycrystal depends jointly on the abundance of that phase and on how much of the diffracting volume happens to present that plane family to the detector in the fixed measurement geometry; a change in integrated intensity between two locations may therefore reflect a change in orientation distribution, in phase abundance, or in both. For this reason, intensities are compared only between measurements made in identical geometry, are read only as relative trends across location and parameter set, and are interpreted throughout alongside the pole-figure measurements of Section 2.5, which capture orientation directly. The uncertainty on each integrated intensity arising from counting statistics and from the choice of baseline end-points is estimated at approximately ±5–10% of the reported value; differences smaller than this are not discussed.
2.5. Texture Measurement and Partial-Pole-Figure Reconstruction, Correction, and Conventions
Pole figures were constructed from the 2D-XRD diffraction frames using the same beam configuration as the phase analysis. The partial pole figures presented in Section 3.4 were reconstructed as described below. The sequence of operations is set out in the order in which it was applied.
Instrumentation and frame acquisition. Diffraction frames were collected on a Bruker D8 (Bruker AXS, Karlsruhe, Germany) diffractometer equipped with a GADDS™ general-area detector diffraction system and a HI-STAR multiwire area detector (1024 × 1024 pixels, 47.5 pixels·cm−1) at the University of Washington. The incident beam was conditioned by 60 mm Göbel mirrors and a 0.8 mm collimator, giving a quasi-parallel, quasi-monochromatic Cu-Kα beam (λ = 1.54184 Å weighted mean; Kα1 1.54056 Å, Kα2 1.54439 Å) with the generator operated at 45 kV and 120 mA. The sample-to-detector distance was 200.1 mm. Detector geometry, beam center and spatial calibration were established from a corundum reference standard, and every frame was corrected for spatial distortion and detector non-uniformity using the stored spatial and flood-field calibration files before any further processing. This is the same instrument and beam-conditioning configuration used for the residual stress measurements previously reported on this weld series, to which the reader is referred for further instrumental detail [22]. The detector was held at a single position centered at 2θ = 44°, whose angular acceptance spans the range 30–60° and therefore captures the {100}α, {002}α, {101}α, {102}α and {110}β reflections simultaneously in every frame; no detector repositioning was required between reflections, so all five pole figures at a given measurement location derive from one common set of frames. Twenty-four frames were collected at ω = 22° and ψ = 68°, spanning 360° of φ in 15° steps at 20 s per frame (Table 2). Frame acquisition and reduction were carried out in GADDS-WNT v4.1.50 (Bruker AXS, Karlsruhe, Germany).
The use of Göbel-mirror parallel-beam optics has a direct bearing on tilt-dependent artifacts. In a parallel-beam geometry the diffraction condition is far less sensitive to specimen displacement and to the divergence-driven broadening that produces defocusing in conventional Bragg–Brentano optics, so the tilt-dependent correction described below is a smaller correction here than it would be in a focusing instrument. It is applied nonetheless, and its residual uncertainty is treated as systematic and common to all measurements (Section 2.7).
Frame integration and correction. Each frame records a set of Debye rings whose azimuthal (γ) coordinate encodes crystallite orientation. Pole figures were reconstructed from these frames in GADDS-WNT v4.1.50 by integrating each ring in 2θ across the window bracketing the reflection of interest, binning the result in γ, and mapping the binned intensities onto pole-figure coordinates through the diffraction geometry defined by ω, ψ and φ [27]. Integrated intensities were taken above the local linear background defined by the minima flanking each peak, as described in Section 2.4. A defocus correction based on a randomly oriented reference titanium standard was applied to each pole figure to compensate for the geometric attenuation of diffracted intensity with tilt angle, which would otherwise be misread as a genuine reduction in pole density at high ψ [28,29,30]. No orientation distribution function was calculated, and no harmonic-series expansion or additional smoothing was applied; the plotted contours represent the measured pole densities, subject only to the interpolation inherent in contour rendering. Identical reduction settings, 2θ integration window, γ binning, background definition and defocus correction, were applied to every measurement reported here and were not varied between specimens, locations or reflections. It is this uniformity, rather than the absolute accuracy of any individual setting, that supports the internal comparisons on which the conclusions rest; absolute pole densities are treated accordingly (Section 2.7(i)).
Normalization. Pole densities are normalized to multiples of a random distribution (m.r.d.); a value of 1.00 m.r.d. corresponds to an untextured polycrystal, and values above unity quantify the local degree of preferred orientation. Normalization was performed over the measured region of the pole sphere only, so that the mean pole density across the covered area equals unity. This is the standard convention for partial pole figures, but it has an important consequence: when the measured region does not sample the whole orientation space, the normalizing denominator is computed over a restricted solid angle, and a texture component that happens to lie within the measured region is expressed relative to that restricted average rather than to a true spherical average. Partial-pole-figure maxima are therefore systematically higher than the equivalent maxima obtained from full pole figures or from EBSD-derived orientation distribution functions on the same material. This is the principal reason why the absolute intensities reported here (up to 31 m.r.d.) exceed those typically quoted in the EBSD-based FSW-Ti literature, and this is discussed further in Section 2.7.
Because of the partial nature of the pole figures, absolute values of the maximum density should be interpreted as comparable across this study (where geometry is held constant) but are not directly comparable to values from the literature measured under different geometries; relative trends across location and parameter set are therefore the focus of all interpretation below.
Spatial resolution and grain statistics. The collimated beam diameter (≈800 µm) sets the spatial resolution of each measurement and is appropriately small relative to the dimensions of the three target zones (ADV/CEN/RET, each several millimeters across) but is too large to resolve sub-zone gradients, which are not the focus of this study. The information depth is set by the attenuation of Cu-Kα in titanium, for which the linear attenuation coefficient is of order 9 × 102 cm−1; at the diffraction angles used here this gives an effective sampling depth of only a few micrometers. Taking the illuminated area defined by the ≈800 µm beam together with this sampling depth, the diffracting volume is of order 106 µm3. For the fine equiaxed α observed at the lower-N/v conditions (mean intercept ≈ 3 µm) this corresponds to on the order of 104–105 individual grains, comfortably above the number generally regarded as sufficient for a statistically meaningful texture measurement. The relevant statistic for the lamellar conditions, however, is not the number of laths but the number of independent orientations: α laths within a single colony share a common orientation, and colonies within one prior-β grain are related by the Burgers correspondence, so the effective number of independent orientations sampled falls to the number of prior-β grains or α colonies within the diffracting volume, plausibly two to three orders of magnitude fewer. This reduction in effective orientation statistics is a genuine limitation of the present measurements and is one of the contributing factors to the high pole densities recorded at the CEN; it is discussed together with the other contributions in Section 2.7.
Pole-figure conventions adopted throughout this paper. Each pole figure is plotted in the simple-shear reference frame appropriate to the local orientation of the FSW tool at the measurement location: the sample axes Y and Z, marked as small open circles on every pole figure, define the orientation of the projection relative to the weld geometry—Y points along the through-thickness (normal-to-weld-surface) direction and Z along the shear-plane normal at the measurement point. The label “PF” in the upper-left corner is a software-generated identifier denoting that the plot is a pole figure (as opposed to an inverse pole figure or ODF section); the small numerical pair printed at the lower-left and lower-right corners of each pole figure indicates, respectively, the minimum and maximum pole densities of the contoured region in m.r.d. units. Filled magenta diamonds labeled −k and z denote sample-frame projections of specific crystallographic directions of the chosen ideal orientation in Miller–Bravais notation. The dotted great-circle trace running through the pole-figure interior, populated by blue tick marks and terminating at the marker labeled d, represents the great-circle locus of the principal HCP simple-shear fiber appropriate to the reflection: the P-fiber for {100}α and {101}α reflections and the B/C-fiber for {002}α, as defined by Beausir et al. [17] and used in subsequent FSW-Ti texture work [8,9,16,20]. The blue tick marks correspond to the discrete ideal orientations sampled along the fiber. Where the experimental pole density clusters near these ideal-fiber loci, the texture is interpreted as containing the corresponding shear component. Slight angular displacements between the experimental maxima and the ideal-fiber positions are commonly attributed to dynamic recrystallization and to the local rigid-body rotation imposed by the tool, which together blur and shift the as-sheared component without erasing it.
It should be acknowledged that the local shear direction varies with position around the tool circumference and across the weld cross-section, so a single sample fixed frame is an approximation. Following established practice [9,10,16], the frame is chosen here to align with the macroscopic flow direction at each of the three measurement locations; local deviations from this idealization contribute to the angular spread of the pole density maxima around the ideal-fiber positions. Because the readability of m.r.d. values printed inside the pole-figure compilations is limited by figure size, for each reflection at each parameter set, and are tabulated numerically in Appendix A (Table A1 and Table A2), to which the reader is referred wherever a value cannot be read directly from the plotted figures.
Uncertainty. No pole-figure measurement reported here was repeated. Each parameter condition was welded once, one transverse cross-section was prepared from it, and one measurement was made at each of the three characterization locations on that section. The specimen S2 (P1) belongs to both parameter series, so its values are reported in both and appear identically in Table A1 and Table A2; these are one measurement presented twice and are not independent replicate measurements. The random component of the measurement uncertainty is therefore estimated rather than measured. Estimated on the same basis as the integrated intensities of Section 2.4, namely counting statistics at the frame exposure used and the choice of the local background against which each Debye ring was integrated, it is taken to be of the order of 10% of the reported maximum pole density. This estimate does not bound the systematic component, which arises from the restricted pole-sphere coverage, the defocus correction, and the effective orientation statistics discussed above; that component is common to all measurements reported here and is addressed in Section 2.7. Differences in maximum m.r.d. smaller than approximately 10% are accordingly not treated as significant anywhere in this paper.
2.6. Tensile Testing and Fracture Analysis
Flat tensile specimens were machined transverse to the weld with the weld centerline at mid-gauge (gauge length 25 mm, width 6 mm, thickness 4 mm), giving a gauge cross-section that spans both base metals, the WN, and the thermomechanically affected zones (TMAZ) on both sides. Quasi-static tests were performed at room temperature on an electromechanical Instron 5585H frame (Instron, Norwood, MA, USA) at a nominal strain rate of 10−3 s−1. Two replicate specimens, both taken from the same weld, were tested per condition; in addition, a reference response was measured by digital image correlation (DIC) on material free of surface tool marks, providing an internal benchmark for the influence of the as-welded surface condition. Engineering stress–strain curves were used to extract 0.2% offset yield strength (σ0.2), ultimate tensile strength (UTS), uniform elongation, total elongation, and fracture location. Replicate agreement is close for σ0.2 and UTS (≤5%) at all conditions except P2, for which one specimen fractured before the flow plateau was reached (Section 3.5); total elongation scatter is condition-dependent; small at high N/v and large at the lowest N/v; a pattern examined in Section 3.5.
Two families of transverse tensile specimens were tested. The as-welded replicates described above retain the surface tool marks produced by the shoulder. A second, tool-mark-free family was prepared for full-field strain measurement by digital image correlation (DIC): the tool marks were removed by face milling and all four gauge surfaces were then polished successively on 150, 220, 400, 600, 800, 1200 and 2000 grit SiC paper to remove burrs and milling marks before a random speckle pattern was air-sprayed on the gauge section. These specimens were machined by abrasive water jet (Model WJP1313 (CNC controlled)) to ASTM E8 proportions (57.2 mm gauge length, 12.7 mm gauge width) and tested under displacement control at a constant crosshead speed of 1.27 mm·min−1 on an Instron 5585H frame. The two families therefore differ in surface condition and in specimen size, and the comparison between them isolates the influence of the as-welded surface rather than of the weld microstructure; this is the origin of the tool-mark-free reference curves presented in Section 3.5 and it is discussed in Section 3.5 and Section 4.5.
Digital image correlation. In-plane displacement and strain fields were measured over the entire gauge section using a three-dimensional (stereo) Vic-3D system (version 7, Correlated Solutions Inc., Irmo, SC, USA) with two 2448 × 2048 pixel cameras fitted with Schneider Xenoplan lenses (Schneider Kreuznach, Bad Kreuznach, Germany) (focal length 34.9 mm, focal ratio 1.9) and positioned symmetrically at a stereo angle of 22°. Images were acquired at 10 s intervals until fracture, giving 101–135 images per specimen. Lagrangian and engineering strains were computed from the correlated displacement fields; acquisition and correlation parameters are given in Table 3. Local stresses were obtained by dividing the load recorded by the load frame by the instantaneous zonal cross-section, corrected from the local strain as Ai = A0i exp(−εi), where εi is the local Lagrangian strain in the zone concerned. Five positions along the gauge centerline were selected for zonal analysis—base metal on the ADV side (Pt0), the ADV weld boundary (Pt1), the weld nugget center (Pt2), the RET weld boundary (Pt3), and base metal on the RET side (Pt4)—together with a continuous 101-point line spanning ADV base metal to RET base metal for the strain-profile plots. Because the local stresses at five different points, as described in the Full-Field Strain Distribution section, are referred to the instantaneous zonal cross-section rather than the original area, they exceed the engineering stresses of the whole specimen (as described in Section 3.5) at the most highly strained positions; therefore, the stress values in those two figures are not directly comparable. Full details of the DIC procedure are given elsewhere [26,31].
Table 3.
Digital image correlation acquisition and correlation parameters.
Fracture analysis. After testing, the fracture position of every specimen was recorded photographically against the corresponding weld macrograph, so that the failure path could be located relative to the weld nugget, the TMAZ, and the advancing and retreating interfaces. Sections containing the fracture surface were then removed from the tested coupons by abrasive water jet, cleaned ultrasonically in acetone for approximately 10 min at the lowest available frequency to avoid damaging the fracture surface, and sputter-coated with a nominally 1 nm layer of gold–palladium for 60 s. Fracture surfaces were examined on the JEOL JSM-6010 Plus microscope described in Section 2.3. Matching ADV-side and RET-side halves of each fracture were imaged so that the surfaces could be compared as conjugate pairs, and the full width of each surface was scanned; representative fields are reproduced in Section 3.6, and the complete survey is available in [26]. It should be noted that the fracture surfaces examined are those of the tool-mark-free DIC specimens, so the fractographic observations describe failure in the absence of the surface stress concentrators present on the as-welded replicates.
2.7. Limitations of the Experimental Approach
Seven limitations are stated at the outset, since together they bound every conclusion drawn below. They are grouped by the kind of inference each one restricts.
(i) Restricted pole-sphere coverage. The partial nature of the 2D-XRD pole figures means that quantitative comparison with m.r.d. values from full-pole-figure or EBSD-derived ODF measurements reported in the literature require care; trends within this study are internally consistent, but absolute magnitudes should be cross-validated by EBSD in future work. The single-position acquisition at ω = 22° and ψ = 68° with 360° of φ rotation samples an annular band of the pole sphere rather than the complete hemisphere. Two consequences follow. First, an orientation component whose poles fall outside the measured band cannot be detected at all, so the absence of a component from a pole figure in this study is weaker evidence than its presence. Second, as described in Section 2.5, normalization over a restricted solid angle systematically inflates the maximum m.r.d. relative to full coverage measurements. Absolute intensities reported here should therefore be compared with one another and with the ideal-fiber overlays, but not directly with published EBSD-derived values.
(ii) Magnitude of the reported pole densities. The measured intensities of 20–31 m.r.d. should be read in this light. Values in this range are high by comparison with the EBSD-based FSW-Ti literature, and at least four contributions plausibly combine to produce them. The restricted-coverage normalization described above raises the reported maximum for a texture of any given true sharpness. The effective number of independent orientations in the diffracting volume is reduced, in lamellar regions, from the number of α laths to the number of α colonies or prior-β grains (Section 2.5), which sharpens the measured distribution. The Burgers correspondence itself clusters the α orientations produced from one parent β grain into a small number of related positions, so a transformation product is intrinsically less uniformly distributed than a deformation product of comparable strength. Finally, a pole figure of a single reflection is a projection of the orientation distribution, not the distribution itself, and its maximum is not equivalent to an ODF maximum. None of these four contributions is quantified here. The consequence for the interpretation is specific and limited: the CEN texture can be described confidently as far sharper than the ADV texture and comparable to or sharper than the RET texture, because all three were measured identically, but the number 31 m.r.d. should not be transferred to another measurement geometry or compared numerically with an ODF maximum.
(iii) Absence of orientation-resolved measurement. No electron backscatter diffraction, inverse-pole-figure mapping, orientation distribution function calculation, or prior-β reconstruction was performed in this study. This is the most consequential limitation for the mechanistic reading of the CEN texture. Establishing variant selection in the strict sense—demonstrating that a subset of the twelve Burgers-related α variants is preferentially selected from a given parent β grain—requires the orientation relationship between parent and product to be measured directly, which in practice means EBSD mapping followed by reconstruction of the prior-β orientation field [32], together with an analysis of α/α misorientation statistics. Neither is available here. What the present data do establish is the geometric fact that the CEN {002}α pole density concentrates near the sample normal direction, away from the ideal simple-shear fiber loci, whereas the RET {100}α and {101}α maxima cluster close to those loci. Throughout Section 3 and Section 4, therefore, the CEN texture is described as being more readily explained by orientation inheritance during the β→α transformation than by direct shear, and the language of variant selection is used only when reporting the conclusions of studies in which orientation-resolved measurements were made.
(iv) Deformation and transformation textures cannot be fully separated. Because the α phase in the weld nugget may inherit its orientation from deformed β through the Burgers correspondence, may be produced by transformation from an undeformed or partially recrystallized β, or may itself be deformed after transformation, a single α-phase pole figure is in general consistent with more than one history. The present study discriminates between these possibilities only indirectly, on three grounds: the position of the experimental maxima relative to the ideal HCP shear fiber loci; the microstructural morphology at the same location (equiaxed versus lamellar, Section 3.2); and the systematic contrast between zones that experienced markedly different shear intensities. This is circumstantial reasoning, and it is treated as such: mechanistic statements in Section 4.2 are framed as the reading most consistent with the combined evidence rather than as demonstrated fact. A definitive separation would require prior-β reconstruction and, ideally, interrupted or quenched welds.
(v) Zone-averaged rather than grain-specific sampling. The X-ray spot size (≈800 µm) averages over a large number of grains, so the texture distributions reported here are zone-averaged rather than grain-specific. Sub-zone gradients, in particular any variation between the streak interiors and the surrounding matrix on the ADV side, and any through-thickness gradient within the nugget, are integrated into a single measurement and cannot be resolved. Where the ADV region contains both Ti–54M streaks and a Ti–6242 SG matrix, the reported texture is a volume-weighted mixture of the two, which is one reason the ADV pole figures are less sharply defined than those of the other two zones.
(vi) Absence of process instrumentation and of the converse alloy configuration. Torque, spindle power, axial force, and thermal cycles were not recorded (Section 2.2), so all statements about peak temperature and cooling rate are inferences from microstructure rather than measurements, and the relative contributions of rotation and traverse speed to the local thermomechanical state cannot be separated quantitatively. In addition, although the parameter matrix systematically spans rotation and traverse speeds at one fixed alloy configuration (Ti–6242 SG on ADV, Ti–54M on RET), the converse configuration is not examined here; the asymmetry observed in the present results suggests that swapping the alloy assignments would substantially change the texture and property fields, and this is examined in related work [21].
(vii) Scope and reliability of the full-field strain measurements. The DIC results reported in Section 3.5 were obtained on tool-mark-free specimens of a different geometry from the as-welded replicates (Section 2.6), so the two datasets are complementary rather than interchangeable: the DIC fields describe how strain partitions between weld zones in the absence of surface stress concentrators, whereas the as-welded curves describe the joint as produced. One condition requires a specific caveat. During testing of S1 (P5) the load exceeded the capacity of the grip assembly initially fitted, the record was truncated, and the test was restarted after a higher-capacity assembly was installed; although the test was interrupted before the flow plateau was reached, the load and stress data for this condition are not reliable and no quantitative conclusion is drawn from them here [26]. The strain-field topology and the fracture location of S1 (P5) are reported, since these are observations on the specimen rather than on the load record, but the local stress–strain curves for this condition are excluded from interpretation throughout. Only one specimen per condition was examined by DIC, so the strain fields are not replicated.
3. Results
3.1. Macrostructure and Ti–54M Intercalation
The Ti–54M origin of the streaks is confirmed compositionally in Figure 2, which reproduces EDS line and map scans taken at the ADV, CEN and RET locations [26]. The line scans resolve sharp, well-defined steps in V, Mo and Zr across each streak boundary, whereas Al, which differs by only about one weight per cent between the two alloys, shows no distinct step, and Sn shows a diffuse rather than a sharp transition. The elements that discriminate the two alloys unambiguously are therefore the β-stabilizers V and Mo, carried in from Ti–54M, and Zr and Sn, resident in Ti–6242 SG. The map scans (Figure 2) show the same partitioning in two dimensions and confirm that the streak population visible in the macrographs is compositional rather than merely etching contrast.
Figure 2.
EDS line and map scans across the weld cross-section: (a) RET, (b) CEN, (c) ADV. Line scans on the ADV side and at the CEN show sharp steps in V, Mo and Zr at the Ti–54M/Ti–6242 SG streak boundaries and an indistinct Al transition; elemental map scans are shown at all three locations. Adapted from [26].
Defect-free welds with consistent sheet thickness and parabolic weld nuggets were obtained for all parameter combinations (Figure 3 and Figure 4), in the sense that no volumetric defects were resolved at the magnification of the macrographs; the tensile results of Section 3.5 indicate that sub-macroscopic bonding deficiencies nevertheless persist at the lowest N/v conditions. EDS analysis confirmed that the lighter shaded streaks visible in the WN and on the ADV side originate from Ti–54M migrating from the RET side; the origin of this asymmetric transport is discussed in Section 4.1.
Figure 3.
Typical macrostructures for the rotation-speed series. S1 (P5) (225 rpm), S2 (P1) (275 rpm), and S3 (P3) (325 rpm); traverse speed fixed at 125 mm·min−1. Ti–54M on RET side, Ti–6242 SG on ADV side. Scale bar 5 mm.
Figure 4.
Typical macrostructures for the traverse-speed series. P4 (100 mm·min−1), P1 (125 mm·min−1), P2 (150 mm·min−1); rotation speed fixed at 275 rpm. Scale bar 5 mm.
In the rotation-speed series (Figure 3), streak morphology evolves markedly with rotation speed. At S1 (P5) (225 rpm), numerous narrow, evenly spaced Ti–54M streaks (typical thickness 100–250 µm) traverse much of the WN and many reach the ADV interface, producing a finely intercalated cross-section. At S2 (P1) (275 rpm), streaks thicken (300–500 µm) and begin to coalesce, with penetration toward the ADV side becoming less complete. At S3 (P3) (325 rpm), the elevated shear intensity causes streaks to consolidate into one or two dense bands (≥800 µm thick) concentrated near the RET-to-mid-WN region, leaving the ADV side largely occupied by Ti–6242 SG.
In the traverse-speed series (Figure 4), streak morphology is governed by exposure time at a constant rotation speed of 275 rpm. At P4 (100 mm·min−1, longest exposure time), Ti–54M is well consolidated within the WN; tool marks on the weld surface terminate before the ADV interface, indicating that the extended thermal and mechanical exposure allows Ti–6242 SG to resist inward material flow effectively. As traverse speed increases to P1 then P2 (150 mm·min−1), the shorter exposure reduces this resistance and progressively finer, more numerous streaks (some as thin as 80 µm) disperse across the WN and extend toward the ADV side. These observations indicate that rotation speed principally governs streak coalescence whereas traverse speed principally governs streak dispersion. Both trends are consistent with the ordering provided by N/v, but they are not reducible to it: S1 (P5) and P2, which differ in N/v by less than 2%, produce visibly different streak architectures, evenly spaced 100–250 µm streaks in the first case and finer, more numerous streaks down to 80 µm in the second. This comparison is developed in Section 4.1.1.
3.2. Microstructure
Figure 5.
Low-magnification optical micrographs at ADV (red), CEN (green), and RET (blue) locations for the rotation-speed series (S1 (P5), S2 (P1), S3 (P3)). Vertical arrow indicates increasing rotation speed (RPM). Scale bars 20 µm.
Figure 6.
Low-magnification optical micrographs at ADV (red), CEN (green), and RET (blue) locations for the traverse-speed series (P2, P1, P4). Vertical arrow indicates increasing traverse speed (mm·min−1). Scale bars 20 µm.
In the rotation-speed series (Figure 5), the CEN microstructure at S1 (P5) (225 rpm) reveals refined equiaxed α (mean intercept ≈ 3 µm) in Ti–6242 SG regions alongside lamellar α+β (lath thickness 1–2 µm) from Ti–54M, indicating that the WN reached temperatures above Tβ for Ti–54M (≈938 °C) but below Tβ for Ti–6242 SG (≈990 °C). At S2 (P1) and S3 (P3), both alloys exceed their respective Tβ values, yielding predominantly lamellar α colonies within prior-β grains; lamellar thickness increases from ≈1.5 µm at S2 (P1) to ≈3 µm at S3 (P3), consistent with progressive coarsening at higher N/v. On the ADV side, refined Ti–6242 SG grains with localized lamellar colonies are present at all rotation speeds, with the extent of transformation increasing with N. On the RET side, the microstructure evolves from refined equiaxed α at S1 (P5) to a progressively more lamellar character at S2 (P1) and S3 (P3). These morphological transitions are the primary evidence on which the peak-temperature statements in this paper rest; as noted in Section 2.2, no thermal measurements were made.
In the traverse-speed series (Figure 6), rotation speed is fixed at 275 rpm so peak temperature is approximately constant, but exposure time decreases from P4 to P2. The CEN microstructure at P4 (longest exposure) contains the coarsest lamellar α (lath thickness ≈ 3.5 µm), while P2 (shortest exposure) displays finer lamellae (≈1 µm) and a narrower transformed region, consistent with faster effective cooling. On the RET side, P4 and P1 show intergranular α with interspersed β, while the highest traverse speed P2 produces a bimodal microstructure (equiaxed α with lamellar α+β colonies) indicating incomplete β-phase transformation within the available thermal window.
3.3. XRD Peak-Intensity Trends and Phase Identification
XRD diffractograms and semi-quantitative integrated-intensity distributions are presented in Figure 7 and Figure 8. Following Section 2.4, the quantities plotted are integrated intensities of individual crystallographic plane families measured in a fixed geometry; they index the relative prominence of each reflection at each location, not phase volume fractions, and they respond to both phase abundance and orientation. All comparisons below are therefore expressed as relative trends. The pyramidal {101}α reflection dominates at every location and condition, with integrated intensities (≈1000–2100 cps) several times those of all other reflections. The identity of the second-ranked reflection is location-dependent: on the ADV side it is basal {002}α, whereas on the RET side it is prismatic {100}α; {102}α is minor throughout (≈210–320 cps). The β-phase reflection {110}β is detected exclusively on the ADV side in both series, consistent with the lower Tβ of Ti–54M and the resulting more complete β→α transformation in the CEN and RET zones, where the retreating-side alloy dominates the sampled volume.
Figure 7.
XRD diffractograms and integrated peak intensities for the rotation-speed series. (A) S1 (P5), (B) S2 (P1), (C) S3 (P3): 2θ patterns for ADV (red), CEN (green), and RET (blue). (D) Comparative bar chart of integrated peak intensities across all specimens, locations, and reflections.
Figure 8.
XRD diffractograms and integrated peak intensities for the traverse-speed series. (A) P4, (B) P1, (C) P2: 2θ patterns for ADV (red), CEN (green), and RET (blue). (D) Comparative bar chart.
In the rotation-speed series (Figure 7), {100}α shows the highest integrated intensity on the RET side and the lowest at the CEN for all three specimens (RET reaching ≈910 cps at S3 (P3), which is consistent with a greater proportion of prismatic-plane-normal orientations presented to the detector on the deformation-dominated RET side than at the thermally dominated CEN. The {101}α intensity at the CEN is likewise the lowest of the three locations at all rotation speeds; its cross-section maximum shifts from the RET side at S1 (P5) (≈1910 cps) to the ADV side at S2 (P1) and S3 (P3) (≈2090 and ≈1670 cps, respectively), suggesting that at higher N/v the {101}α contribution on the ADV side is increasingly fed by both the transformed Ti–6242 SG matrix and the incoming Ti–54M streaks. The {002}α intensity is highest on the ADV side at every rotation speed and varies non-monotonically there (≈840, ≈600, and ≈1330 cps at S1 (P5), S2 (P1), and S3 (P3)), while at the CEN it remains low and nearly constant between S1 (P5) and S2 (P1) before rising distinctly at S3 (P3) (≈555 cps), consistent with more complete super-transus transformation at the highest N/v. The {110}β integrated intensity is greatest at S3 (P3) and least at S2 (P1); this ordering of diffracted intensity is distinct from the texture-strength trend reported in Section 3.4, where the {110}β pole distribution is sharpest at S2 (P1)—the two quantities measure phase abundance and orientation concentration, respectively, and need not vary together. The reflection of lowest integrated intensity throughout is {102}α.
In the traverse-speed series (Figure 8), the same zonal hierarchy holds: {100}α is highest on the RET side (≈700–730 cps at P4 and P2) and lowest at the CEN, and {101}α at the CEN and RET decreases monotonically from P4 to P2 (CEN: ≈1040 → ≈825 cps; RET: ≈1800 → ≈1480 cps), consistent with less transformation time at higher traverse speed. On the ADV side, {101}α peaks at P1 (≈2090 cps); the same measurement reported as S2 (P1) in the rotation-speed series; and {002}α is again non-monotonic with its minimum at P1 (≈1740, ≈600, and ≈1370 cps at P4, P1, and P2). The {110}β intensity mirrors this pattern, reaching its minimum at P1 (≈220 cps versus ≈ 400–410 cps at P4 and P2), where Ti–54M streaks are present on the ADV side and given sufficient time to transform fully to α, reducing residual β. Across both series, {102}α is consistently the weakest reflection, and {101}α dominates the diffracted intensity at all examined locations and conditions, with the secondary contribution partitioned between {002}α on the ADV side and {100}α on the RET side.
3.4. Crystallographic Texture
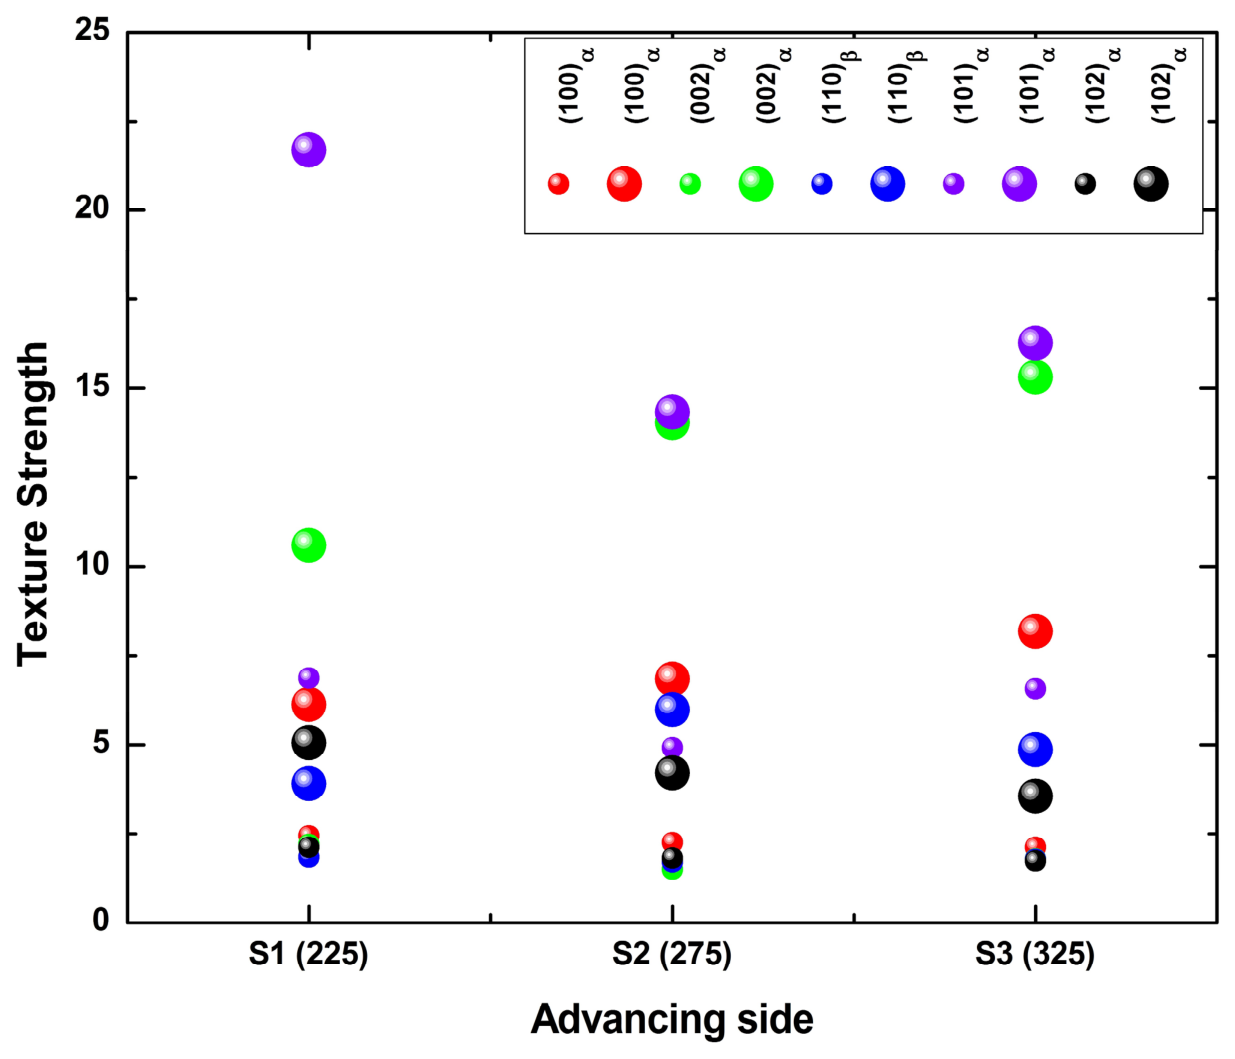
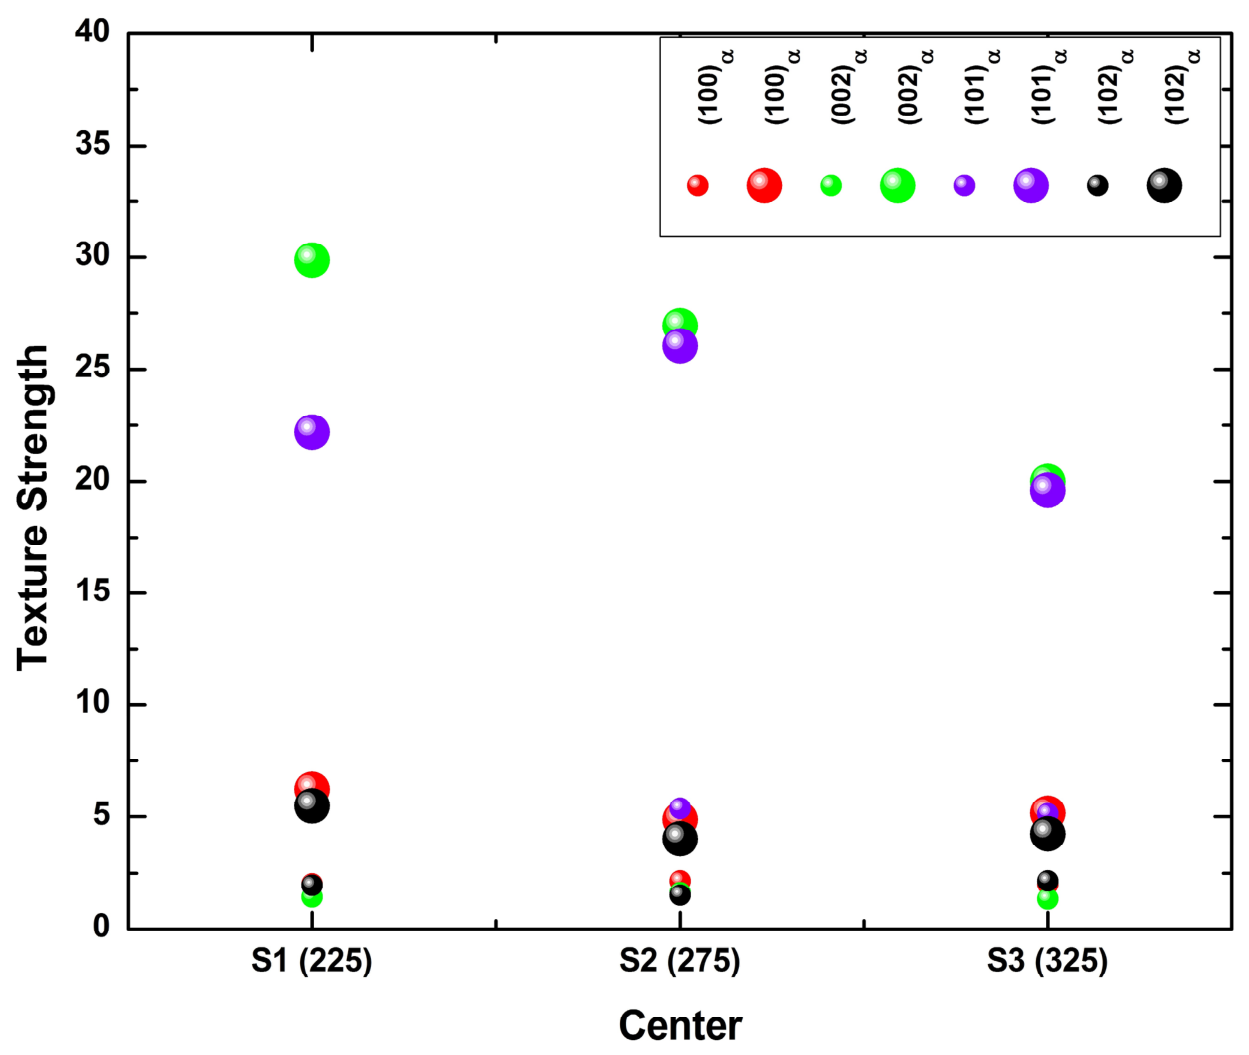
Partial pole figures and the corresponding minimum/maximum m.r.d. bubble plots are presented in Figure 9, Figure 10, Figure 11, Figure 12, Figure 13 and Figure 14 for the rotation-speed series (ADV, Figure 9 and Figure 10; CEN, Figure 11 and Figure 12; RET, Figure 13 and Figure 14) and in Figure 15, Figure 16, Figure 17, Figure 18, Figure 19 and Figure 20 for the traverse-speed series (ADV, Figure 15 and Figure 16; CEN, Figure 17 and Figure 18; RET, Figure 19 and Figure 20). All pole figures use the simple-shear reference frame defined in Section 2.5, with sample axes Y and Z marked as open circles and the dotted great-circle trace and blue tick marks indicating the ideal-orientation locus of the relevant HCP simple-shear fiber. All intensities are subject to the coverage and normalization caveats set out in Section 2.5 and Section 2.7 and are read as relative values. Because the m.r.d. values printed within the pole figures are small at the reproduction size used here, the complete set of minimum and maximum intensities is tabulated in Appendix A. No measurement was repeated (Section 2.5), and differences in maximum m.r.d. smaller than approximately 10% are therefore not treated as significant. The specimen S2 (P1) belongs to both parameter series, so its values appear identically in Table A1 and Table A2 and in both sets of figures: the maximum m.r.d. values for {002}α at the CEN, {101}α at the RET and {002}α at the ADV are 26.93, 25.91 and 14.03 in both series. These are one measurement reported twice and not an agreement between independent measurements.
3.4.1. Advancing Side—Rotation-Speed Series (Figure 9 and Figure 10)
On the ADV side (Figure 9 and Figure 10), the experimental maxima do not coincide closely with the ideal-fiber tick marks, and the pole distributions are predominantly random or weakly sheared. The peak intensity for {101}α decreases from ≈21.7 m.r.d. at S1 (P5) to ≈14.3 m.r.d. at S2 (P1) before partially recovering to ≈16.3 m.r.d. at S3 (P3), while {002}α increases monotonically from ≈10.59 m.r.d. (S1 (P5)) to ≈14.03 (S2 (P1)) and ≈15.32 (S3 (P3)). {100}α rises modestly from ≈6.0 (S1 (P5)) to ≈8.2 m.r.d. (S3 (P3)). The {110}β texture is strongest at S2 (P1) (≈6.0 m.r.d.), where Ti–6242 SG occupies the ADV region with minimal streak dilution; {102}α remains low (3–5 m.r.d.) throughout. These trends may be attributed to competing influences of temperature-dependent transformation of the Ti–6242 SG matrix and streak-dependent contributions from Ti–54M; as noted in Section 2.7(v), the ≈800 µm beam integrates both populations into a single measurement, which is itself a plausible contributor to the diffuse character of the ADV pole figures.
Figure 9.
Pole figures at the ADV side for the rotation-speed series (S1 (P5), S2 (P1), S3 (P3)). Columns: {100}α, {002}α, {110}β, {101}α, {102}α. Each pole figure is plotted in the simple-shear reference frame with sample axes Y and Z marked as open circles; minimum and maximum intensities (m.r.d.) are printed at the lower-left and lower-right of each plot. The dotted great-circle trace and blue tick marks represent the ideal HCP simple-shear fiber locus, and the magenta diamonds labeled −k and z, together with the marker d at the trace extremity, identify specific crystallographic directions of the chosen ideal orientation. Vertical arrow indicates increasing rpm. WD perpendicular to page.
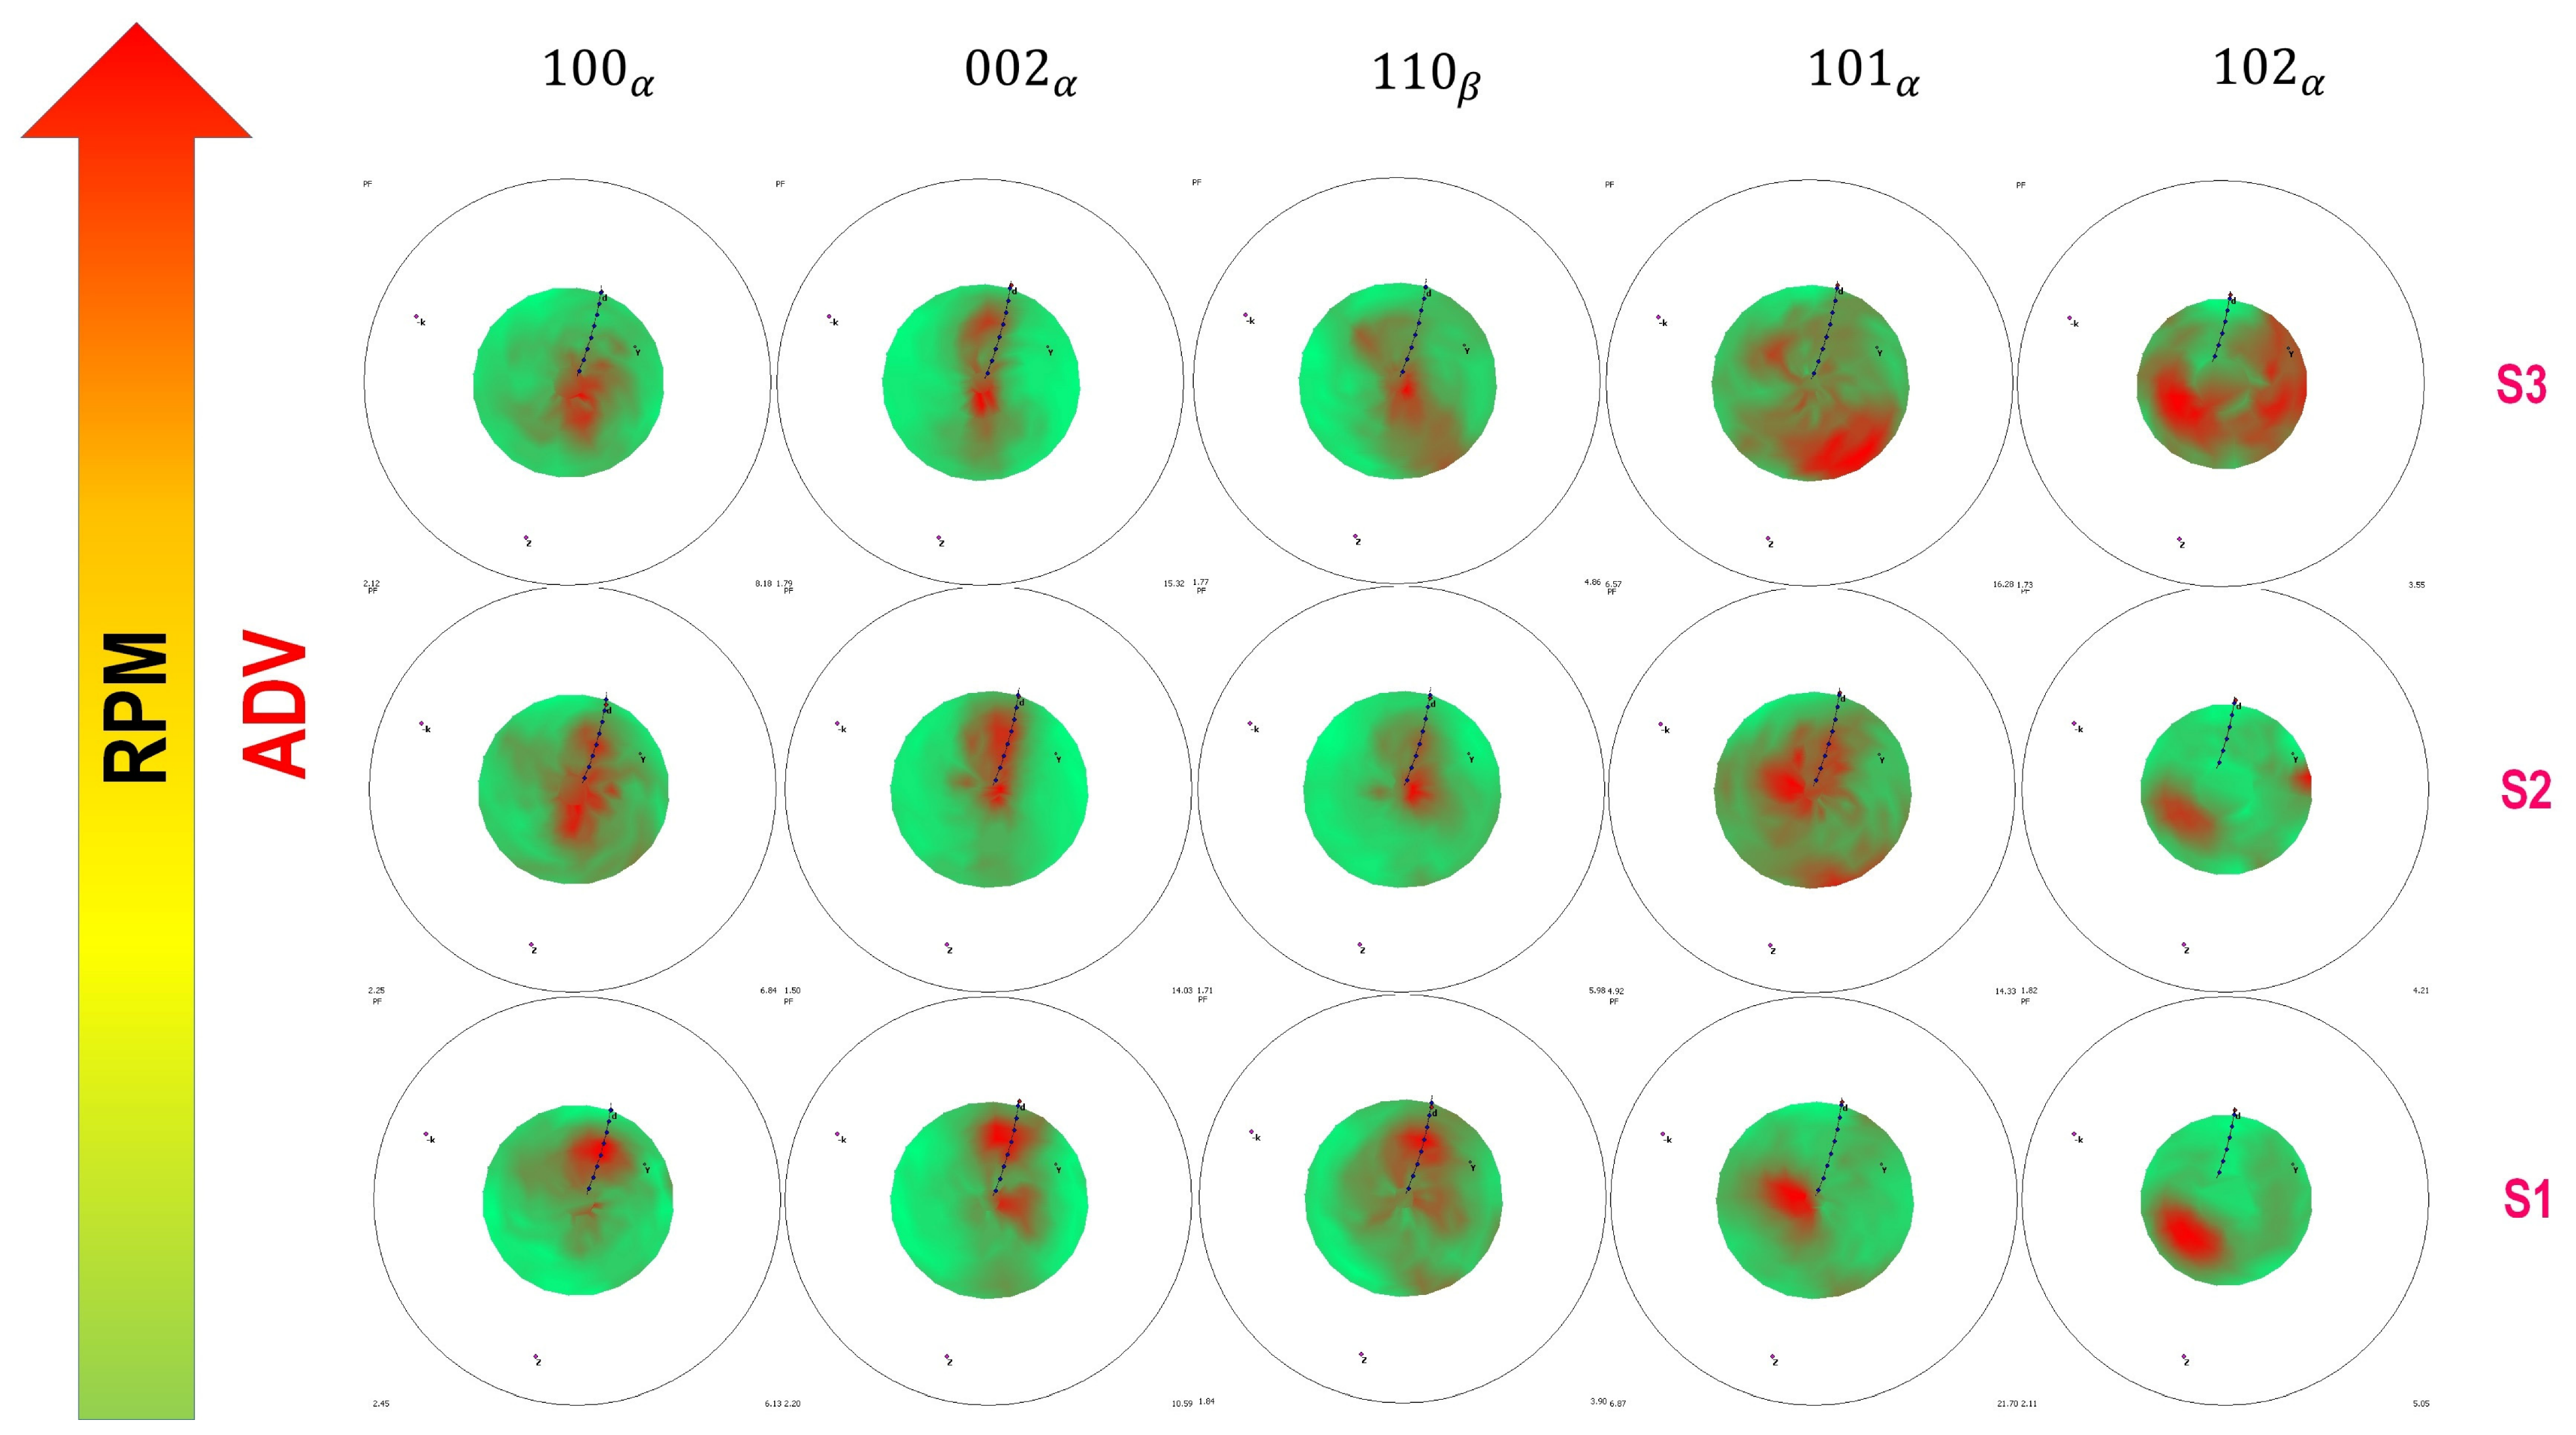
Figure 10.
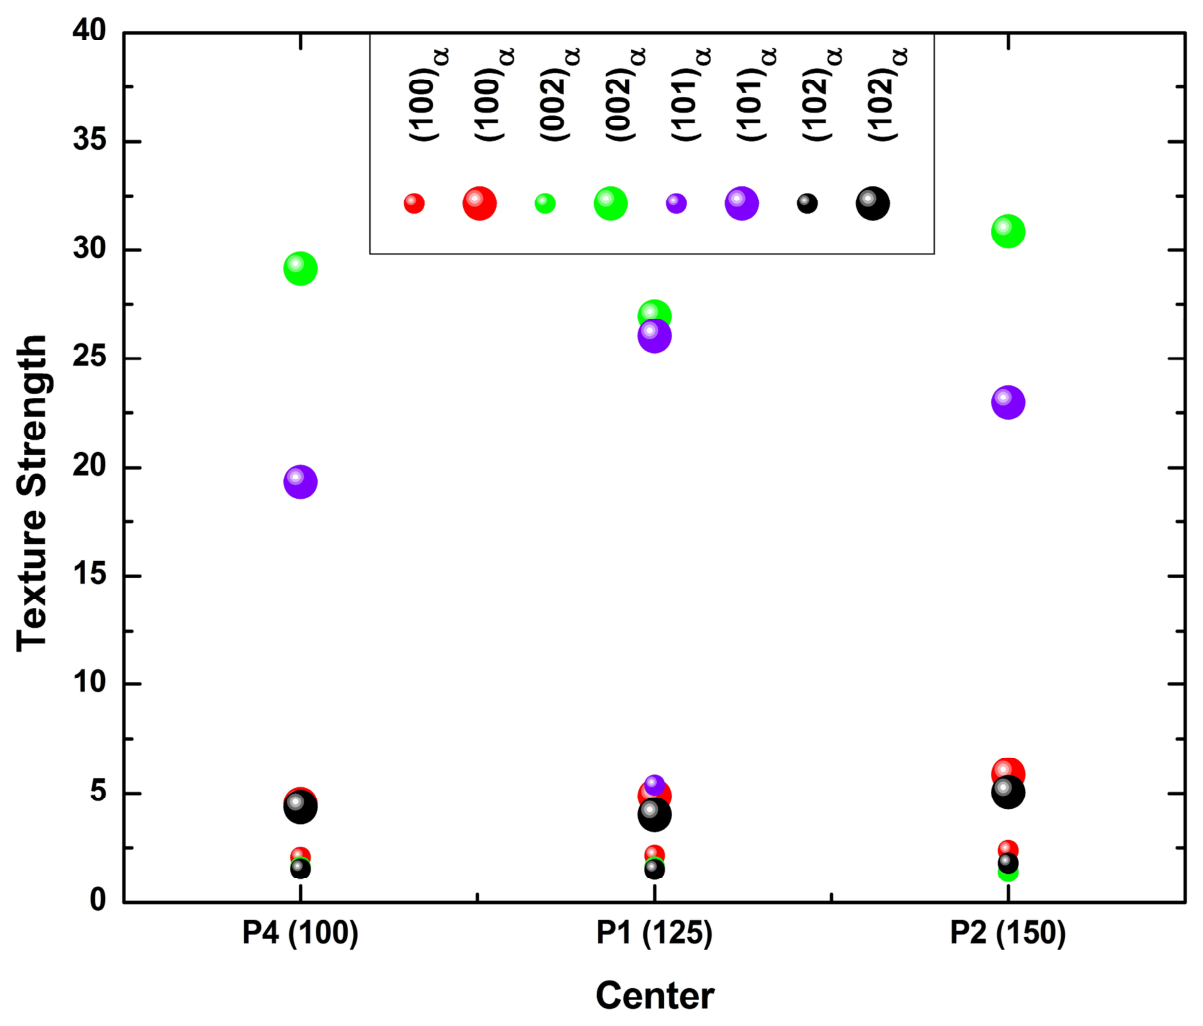
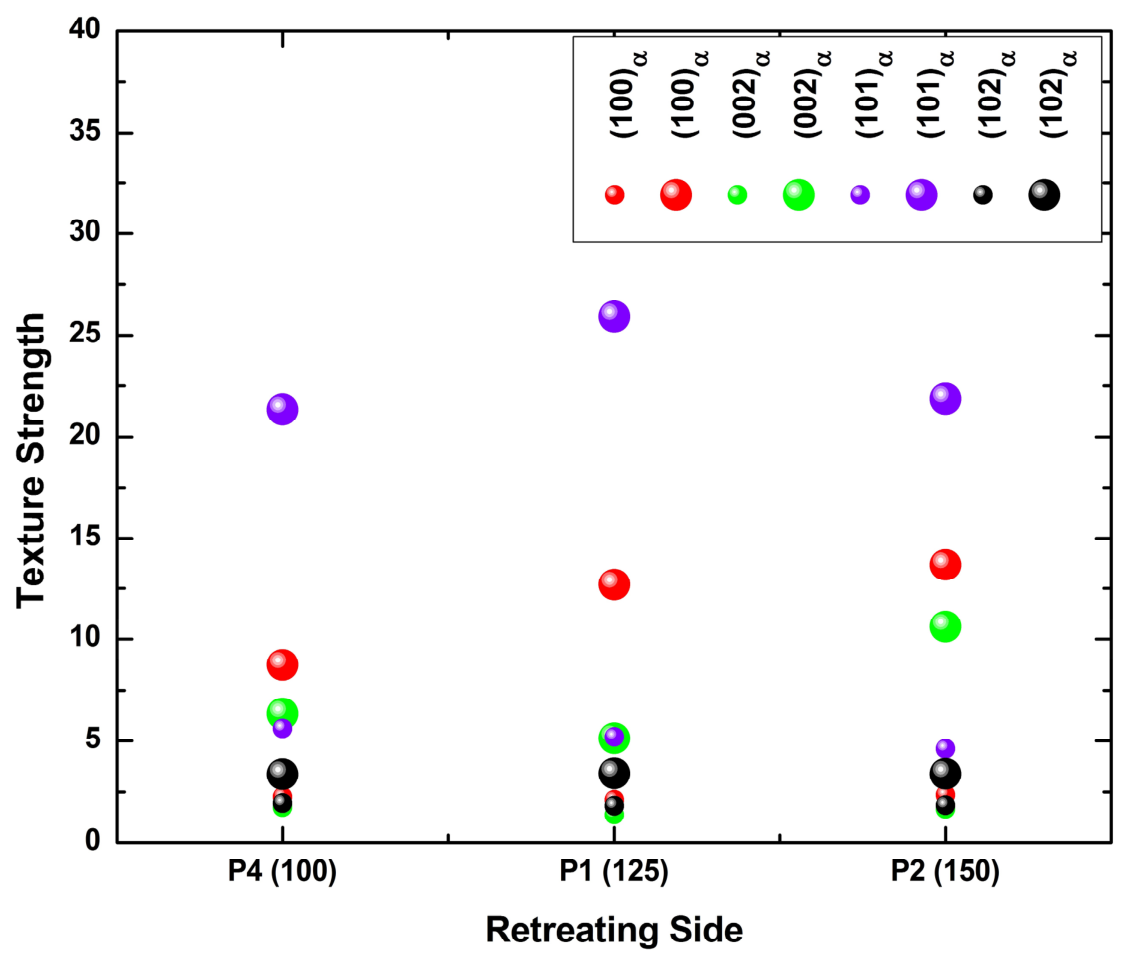
Bubble plot of texture strength (m.r.d.) at the ADV side for the rotation-speed series. Each cluster shows {100}α, {002}α, {110}β, {101}α, and {102}α intensities for S1 (P5), S2 (P1), and S3 (P3). Small bubbles = minimum m.r.d.; large bubbles = maximum m.r.d Each reflection therefore appears twice in the legend, once for its minimum and once for its maximum value.
3.4.2. Weld Nugget Center—Rotation-Speed Series (Figure 11 and Figure 12)
The CEN exhibits the strongest and most stable textures across all conditions. The {002}α basal component dominates with peak intensities of ≈30 m.r.d. at S1 (P5), ≈27 at S2 (P1), and ≈20 at S3 (P3), with basal poles concentrated near the center of the pole figure (near ND) rather than along the simple-shear fiber trace through the marker d. A concentration at this position lies away from the ideal simple-shear loci and is therefore more readily explained by orientation inheritance during the β→α transformation on cooling than by direct shear deformation. As set out in Section 2.7(iii), this remains an inference from pole-figure geometry: identification of variant selection in the strict sense would require prior-β reconstruction from orientation-resolved data [32], which was not performed here. The decrease from S1 (P5) to S3 (P3) is consistent with grain coarsening broadening the pole distribution. The {101}α component shows a secondary peak which is strongest at the intermediate S2 (P1) (≈26 m.r.d.). The {100}α and {102}α reflections remain weak (≤6 m.r.d.) at this thermally dominant location.
Figure 11.
Pole figures at the CEN for the rotation-speed series (S1 (P5), S2 (P1), S3 (P3)). Columns: {100}α, {002}α, {101}α, {102}α. Same conventions as in Figure 9. {110}β is not detected at the CEN.
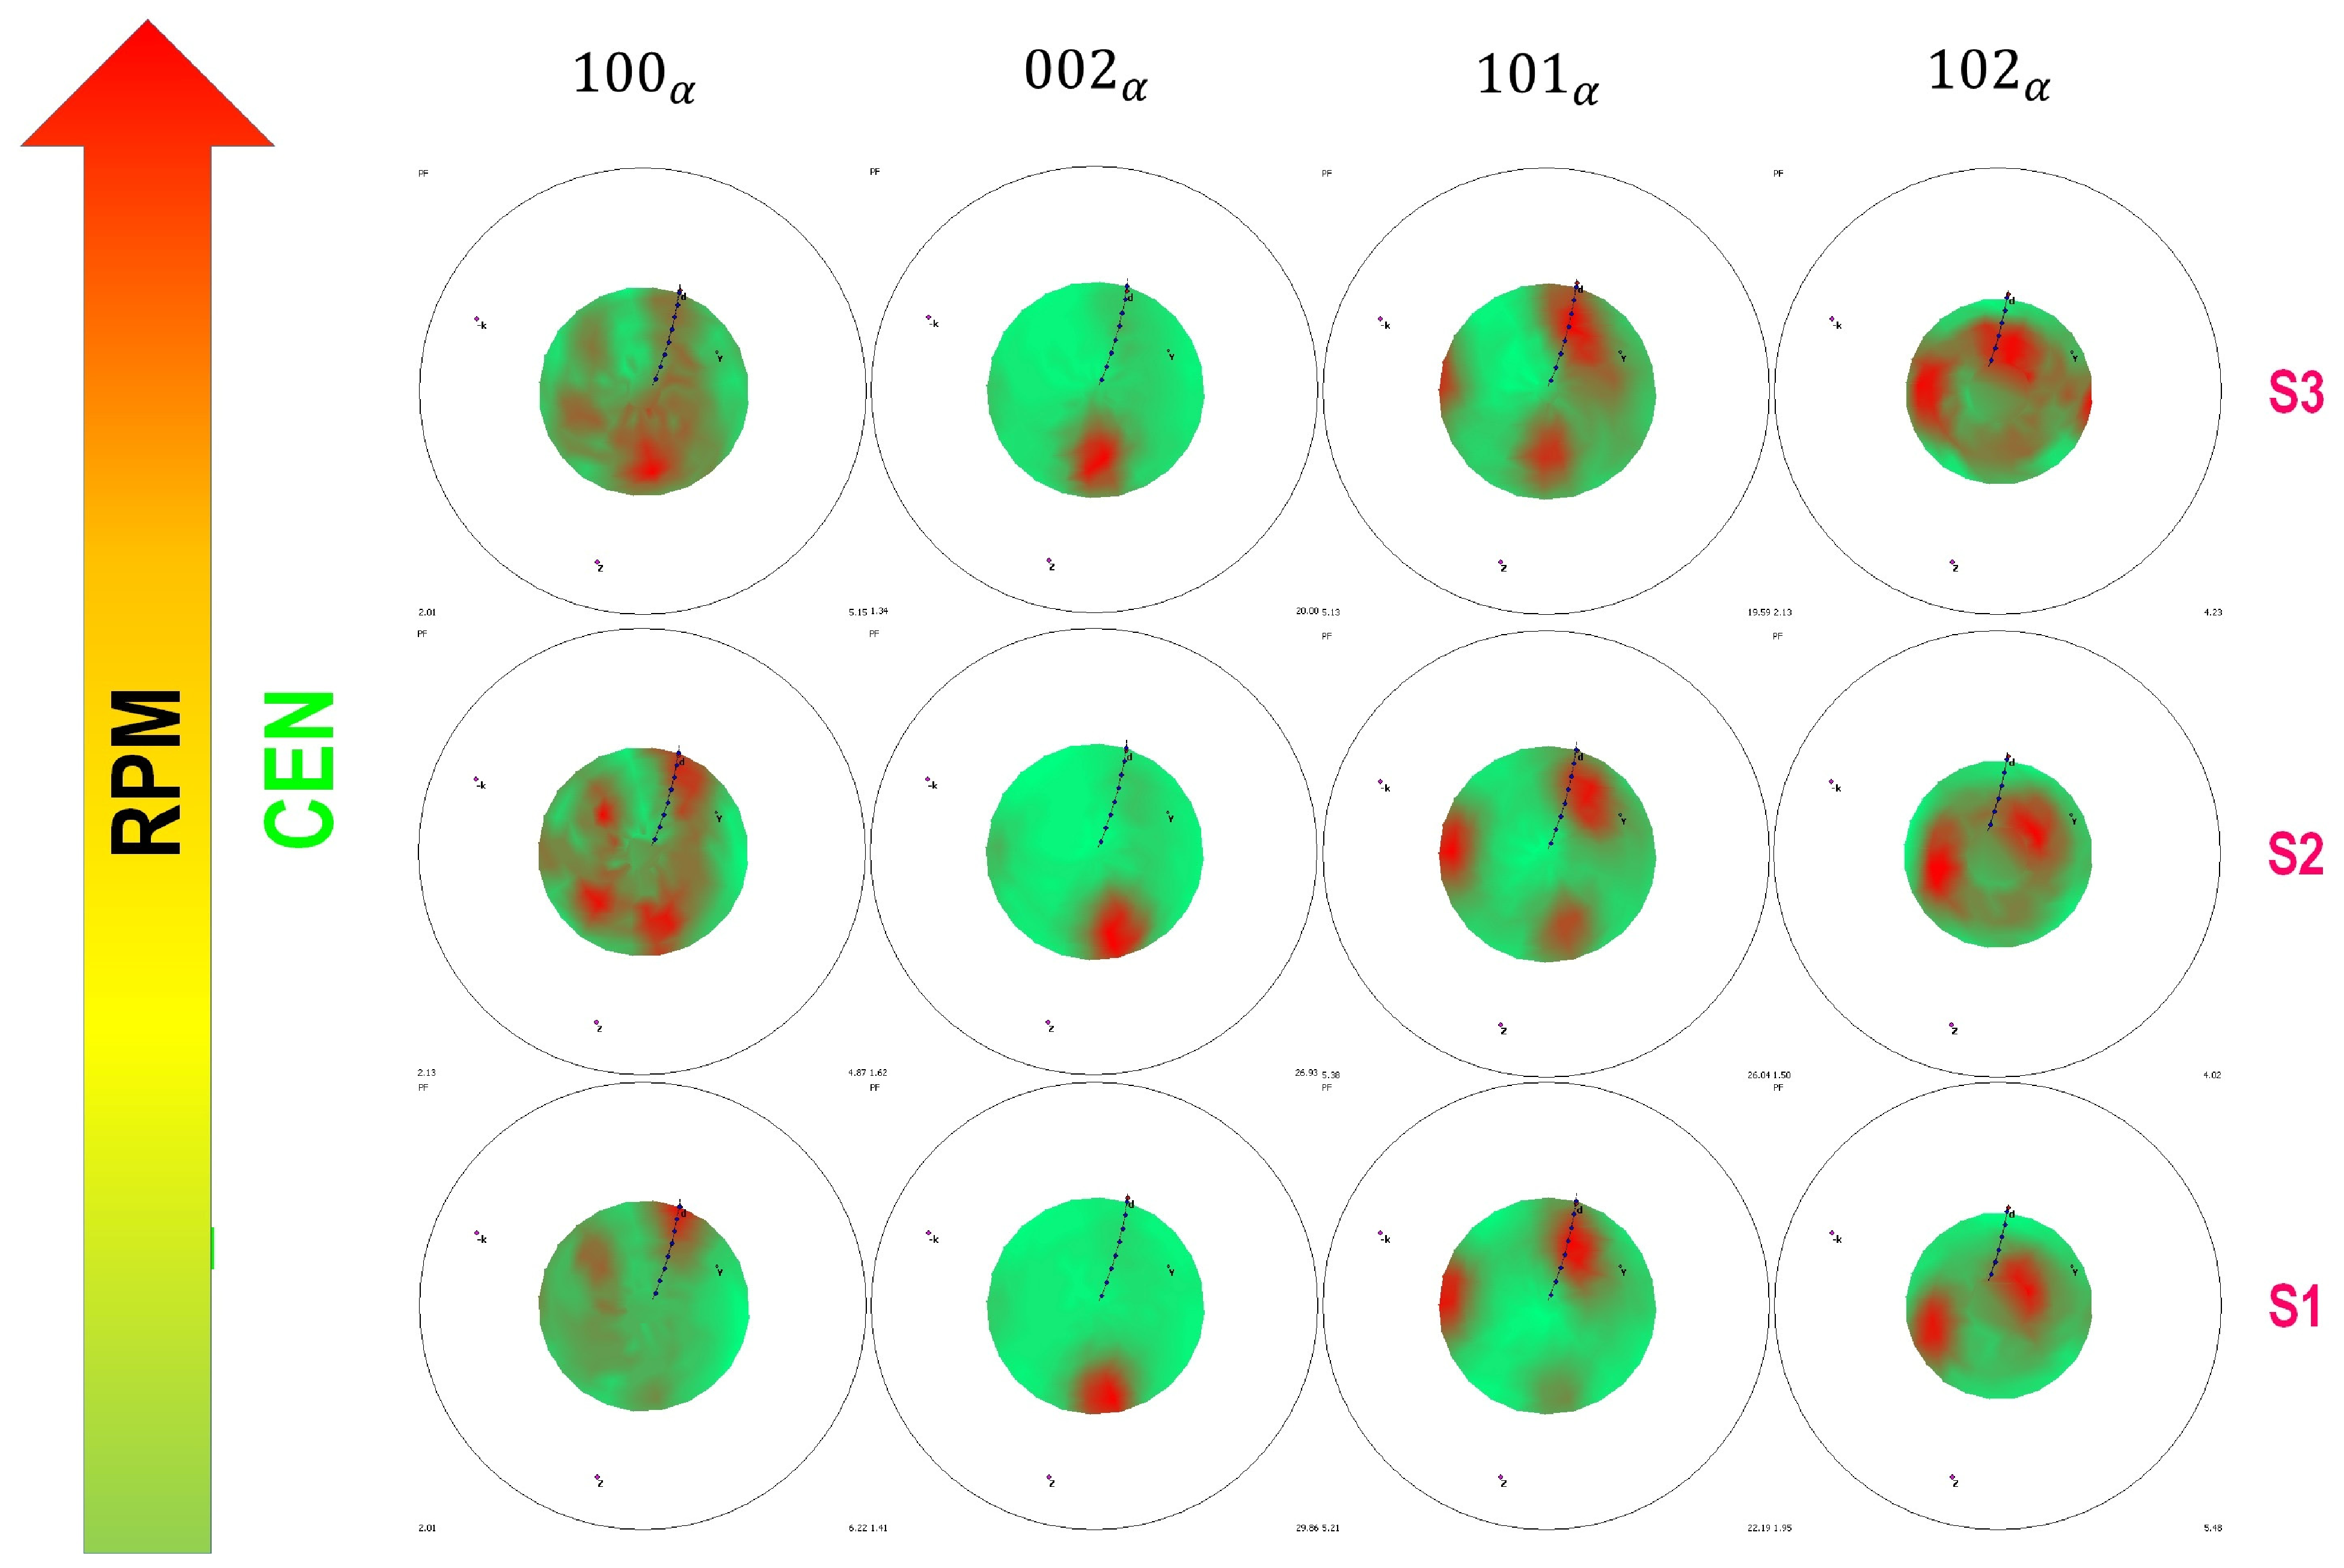
Figure 12.
Bubble plot of texture strength (m.r.d.) at the CEN for the rotation-speed series. Clusters show {100}α, {002}α, {101}α, {102}α for S1 (P5), S2 (P1), S3 (P3). Conventions are the same as those in Figure 10.
3.4.3. Retreating Side—Rotation-Speed Series (Figure 13 and Figure 14)
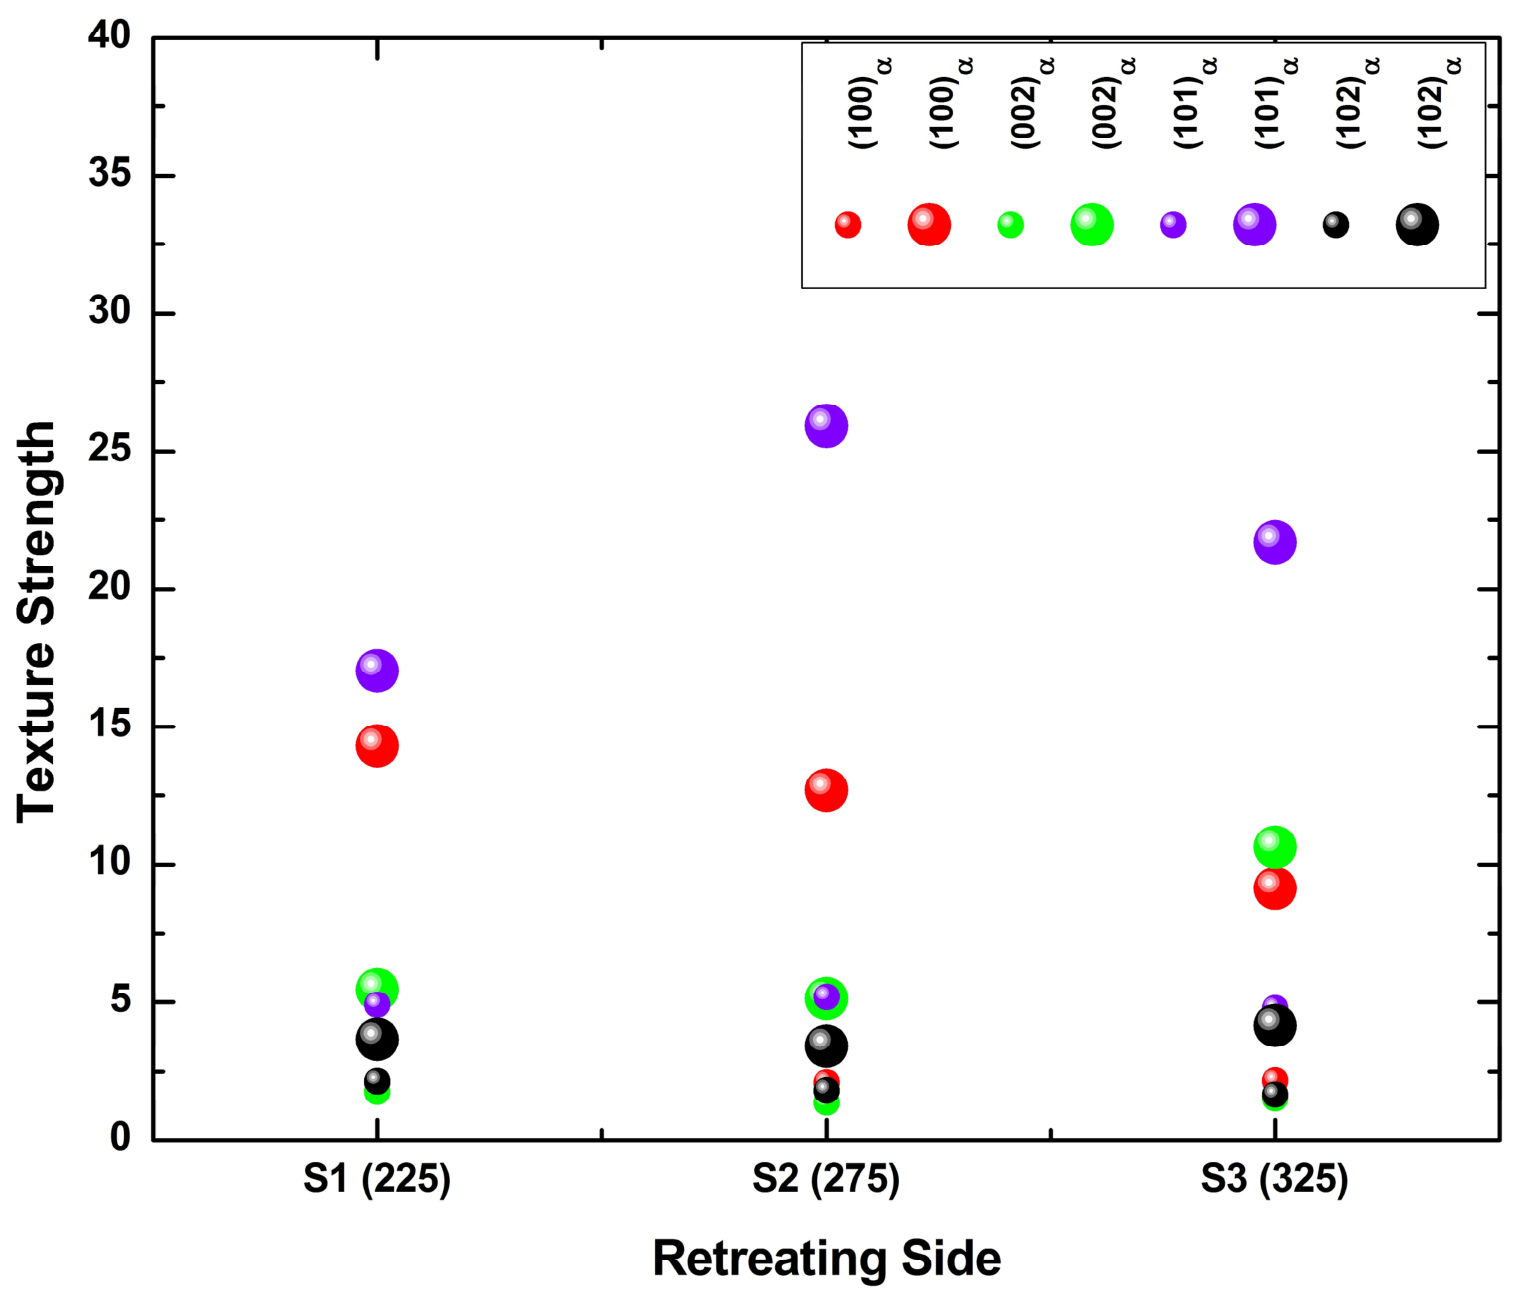
On the RET side, textures are predominantly consistent with a deformation-related origin and evolve systematically with rotation speed. The experimental maxima cluster close to, but slightly off, the ideal P-fiber positions marked by the blue tick marks, a displacement consistent with partial randomization by dynamic recrystallization and tool-imposed rigid-body rotation. The {100}α component presents a sheared texture at S1 (P5) (≈14.3 m.r.d.) that rotates toward a more compact orientation at S2 (P1) (≈12.7) and S3 (P3) (≈9.0). Conversely, {002}α, {101}α, and {102}α all evolve from sheared and weak at S1 (P5) toward stronger, more defined orientations at higher rotation speeds: {101}α reaches ≈26 m.r.d. at S2 (P1) and ≈22 at S3 (P3), among the highest texture strengths observed anywhere in the cross-section.
Figure 13.
Pole figures at the RET side for the rotation-speed series (S1 (P5), S2 (P1), S3 (P3)). Columns: {100}α, {002}α, {101}α, {102}α. Same conventions as in Figure 9.
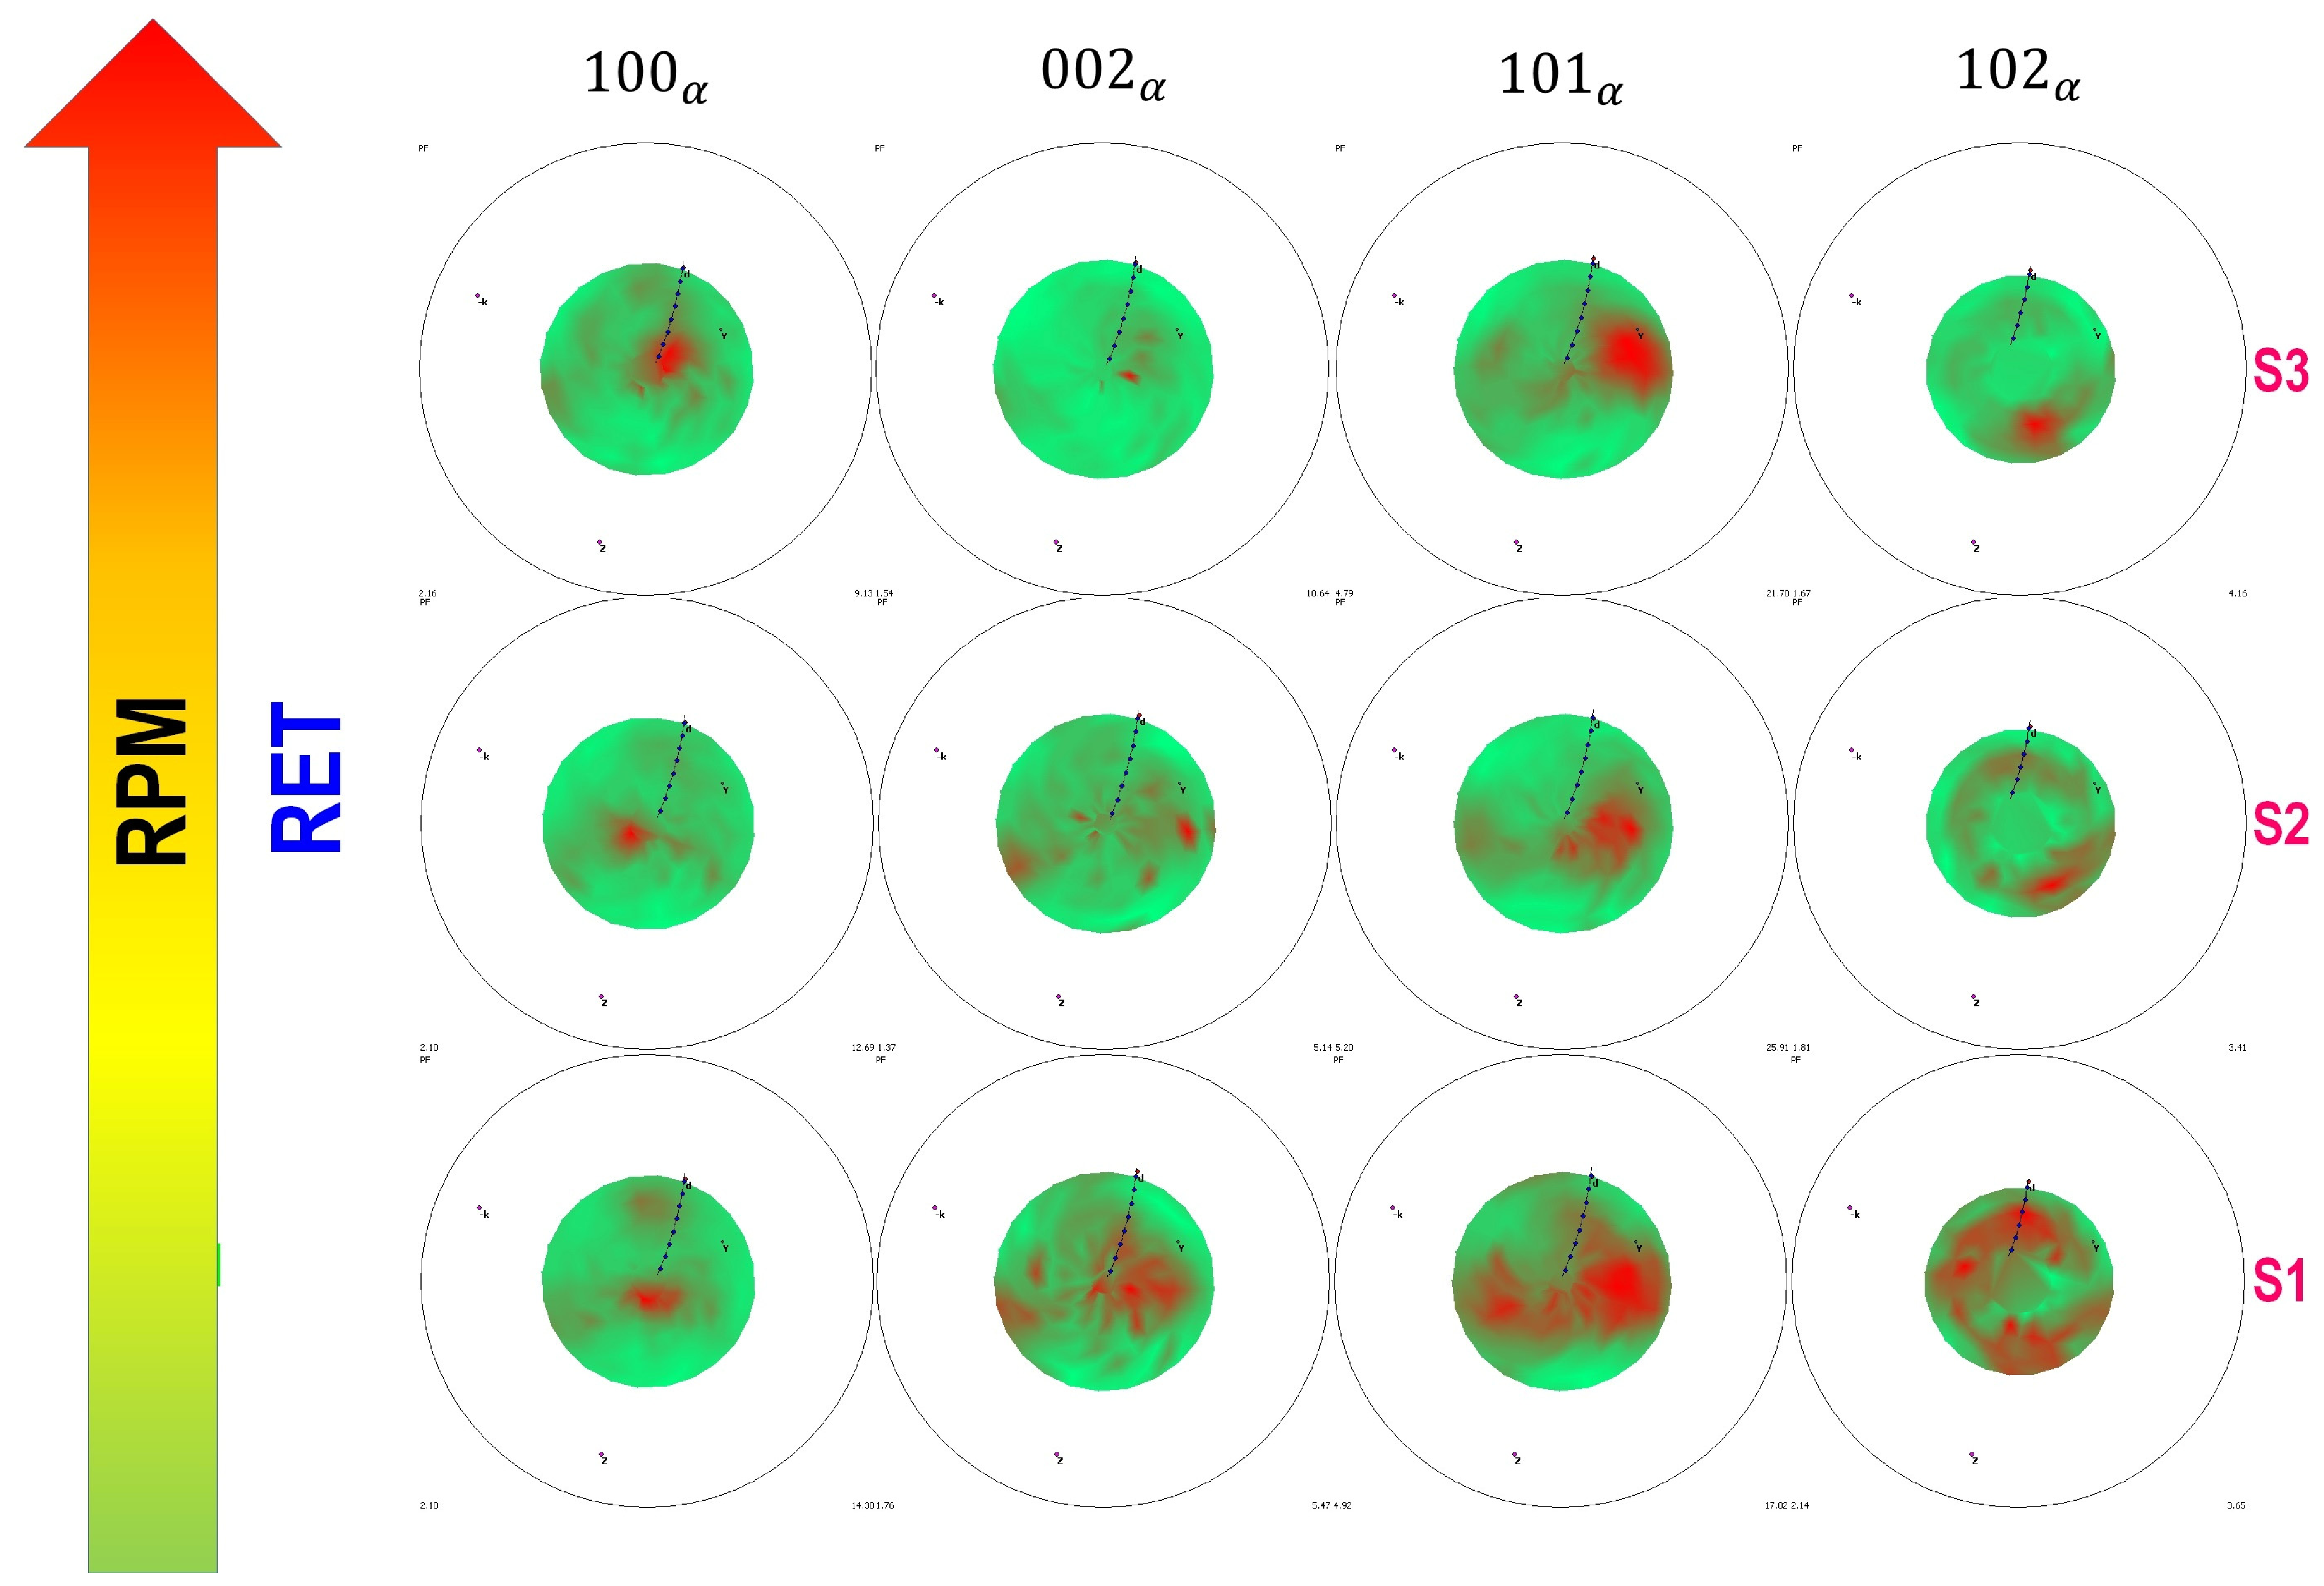
Figure 14.
Bubble plot of texture strength (m.r.d.) at the RET side for the rotation-speed series. Clusters show {100}α, {002}α, {101}α, {102}α for S1 (P5), S2 (P1), S3 (P3). Conventions are the same as those in Figure 10.
3.4.4. Advancing Side—Traverse-Speed Series (Figure 15 and Figure 16)
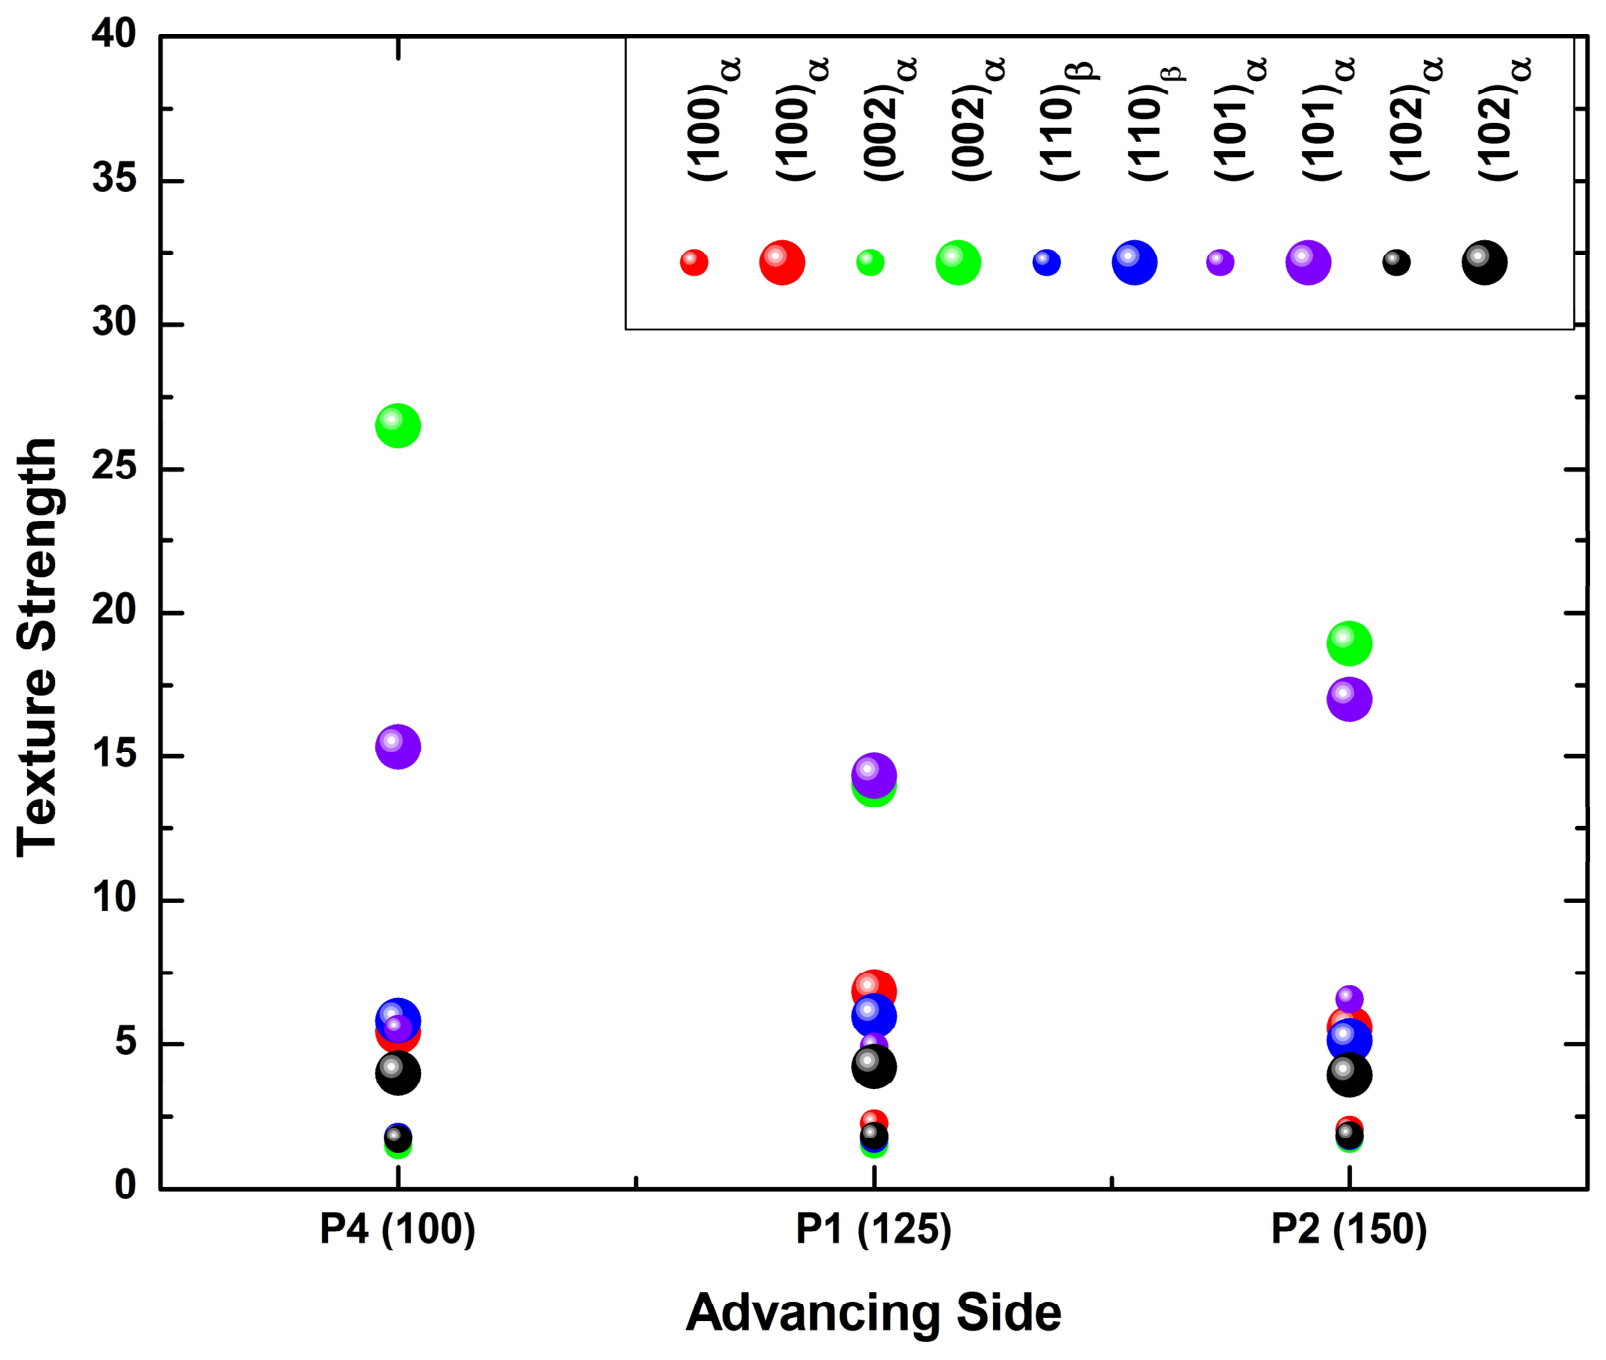
The traverse-speed series ADV (Figure 15 and Figure 16) exhibits notable non-monotonic behavior. The {002}α intensity is highest at P4 (≈26.50 m.r.d.), comparable to CEN intensities, drops at P1 (≈14.03), and partially recovers at P2 (≈18.94). The {101}α component follows a similar pattern (P4 ≈ 15.33, P1 ≈ 14.33, P2 ≈ 17.0 m.r.d.). This is consistent with the streak morphology evolution: at P4 the longest exposure yields a Ti–6242-SG-dominated ADV region with a strong basal component, which may be attributed to the higher Al content of that alloy; at P1 moderate streak intercalation dilutes the basal-favoring driving force; and at P2 the finest dispersed streaks distribute Ti–54M at sufficiently low local fraction that the basal component in the Ti–6242 SG matrix re-emerges. {002}α also exhibits a clockwise rotation of its pole concentration with increasing traverse speed. This reading is one of several consistent with the data; the alternative that the non-monotonic ADV response reflects varying proportions of streak and matrix material within the ≈800 µm sampled volume cannot be excluded without spatially resolved orientation mapping.
Figure 15.
Pole figures at the ADV side for the traverse-speed series (P4, P1, P2). Columns: {100}α, {002}α, {110}β, {101}α, {102}α. Same conventions as Figure 9. Vertical arrow indicates increasing traverse speed (mm·min−1). WD is perpendicular to the page.
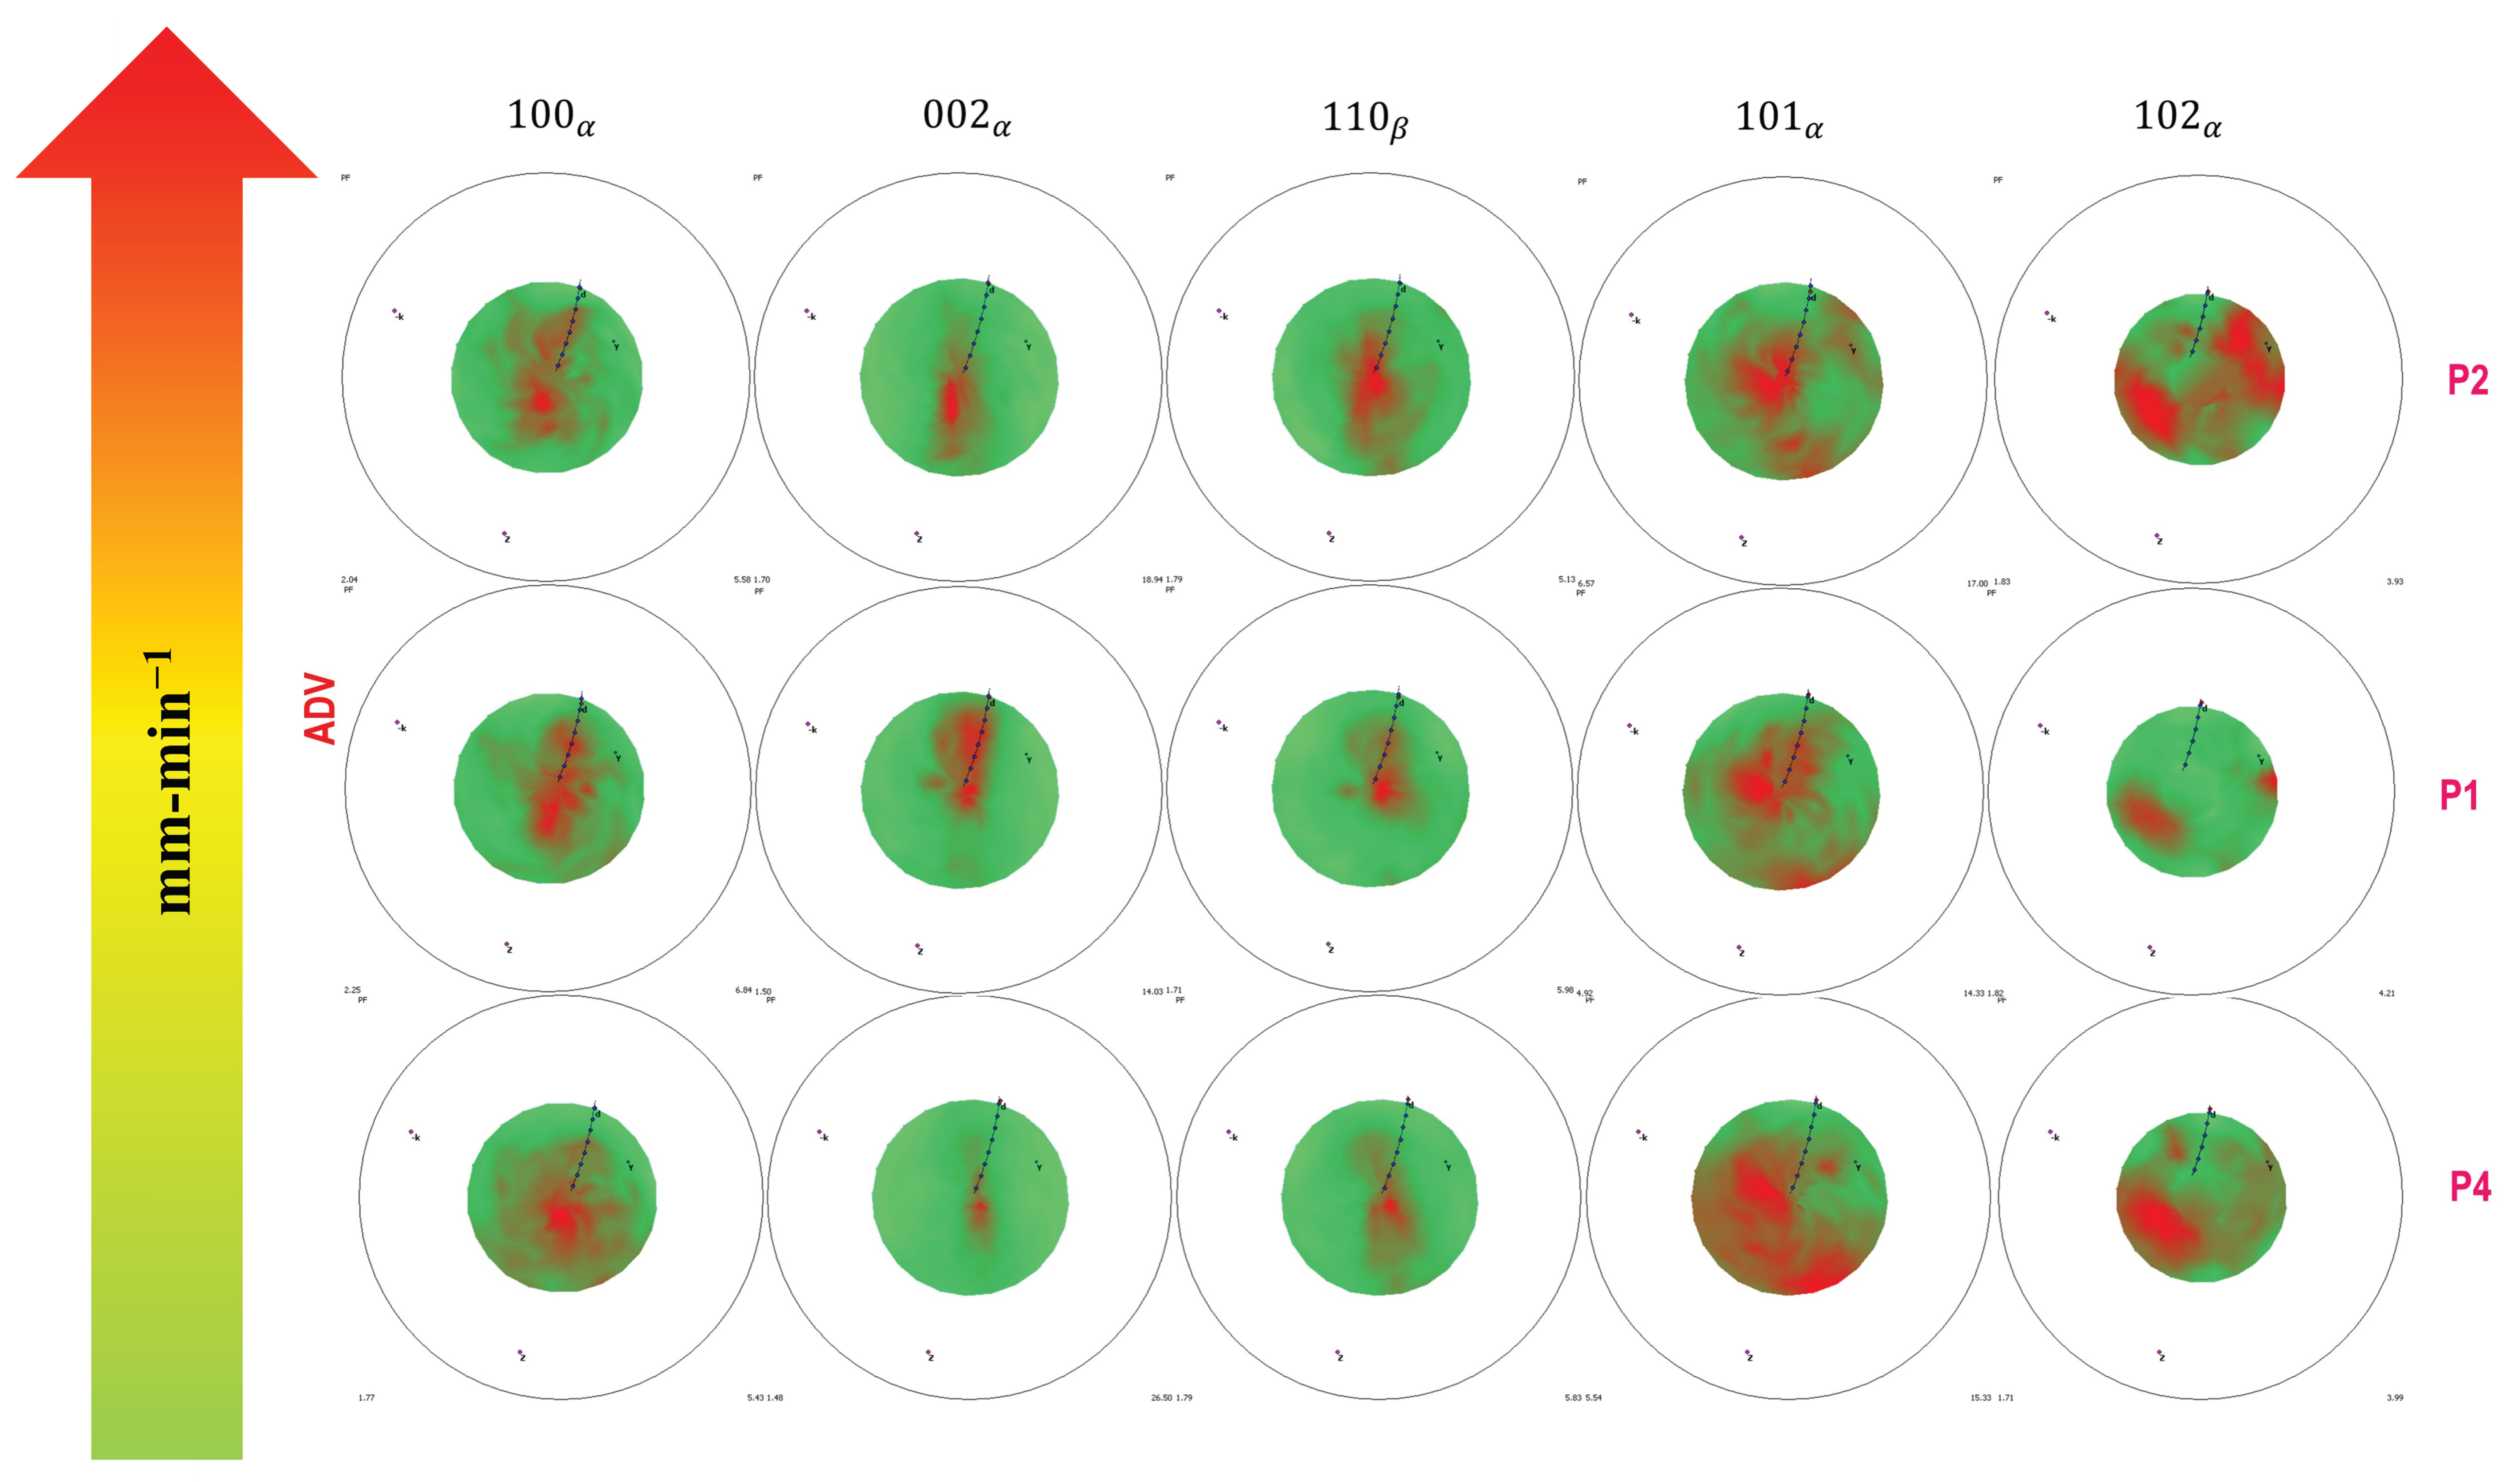
Figure 16.
Bubble plot of texture strength (m.r.d.) at the ADV side for the traverse-speed series. Clusters show {100}α, {002}α, {110}β, {101}α, {102}α for P4, P1, P2. Conventions are the same as those in Figure 10.
3.4.5. Weld Nugget Center—Traverse-Speed Series (Figure 17 and Figure 18)
The CEN textures of the traverse-speed series (Figure 17 and Figure 18) remain strong across all conditions. The {002}α basal component is ≈29 m.r.d. at P4, ≈26 at P1, and ≈31 at P2; the response is non-monotonic, with a local minimum at P1. The {101}α pyramidal component varies in the opposite sense, reaching a local maximum at the same condition: ≈19 (P4), ≈26 (P1), ≈23 (P2). This may be attributed to the distinct role of traverse speed: at fixed rotation, traverse speed sets the cooling rate and available transformation time, so very long exposure (P4) coarsens prior-β grains and broadens the basal distribution while very short exposure (P2) preserves a sharper Burgers-inherited basal texture but reduces pyramidal-component nucleation. It should be noted that the spread across these three conditions (≈26–31 m.r.d.) is only marginally larger than the ≤10% combined measurement uncertainty estimated in Section 2.5, so the non-monotonic ordering is reported but not relied upon. The basal poles remain concentrated near ND across all conditions, which is consistent across the whole traverse-speed series with a transformation-related rather than a shear-related origin for the CEN basal texture. {002}α exhibits an anticlockwise rotation with increasing traverse speed.
Figure 17.
Pole figures at the CEN for the traverse-speed series (P4, P1, P2). Columns: {100}α, {002}α, {101}α, {102}α. Same conventions as in Figure 9.
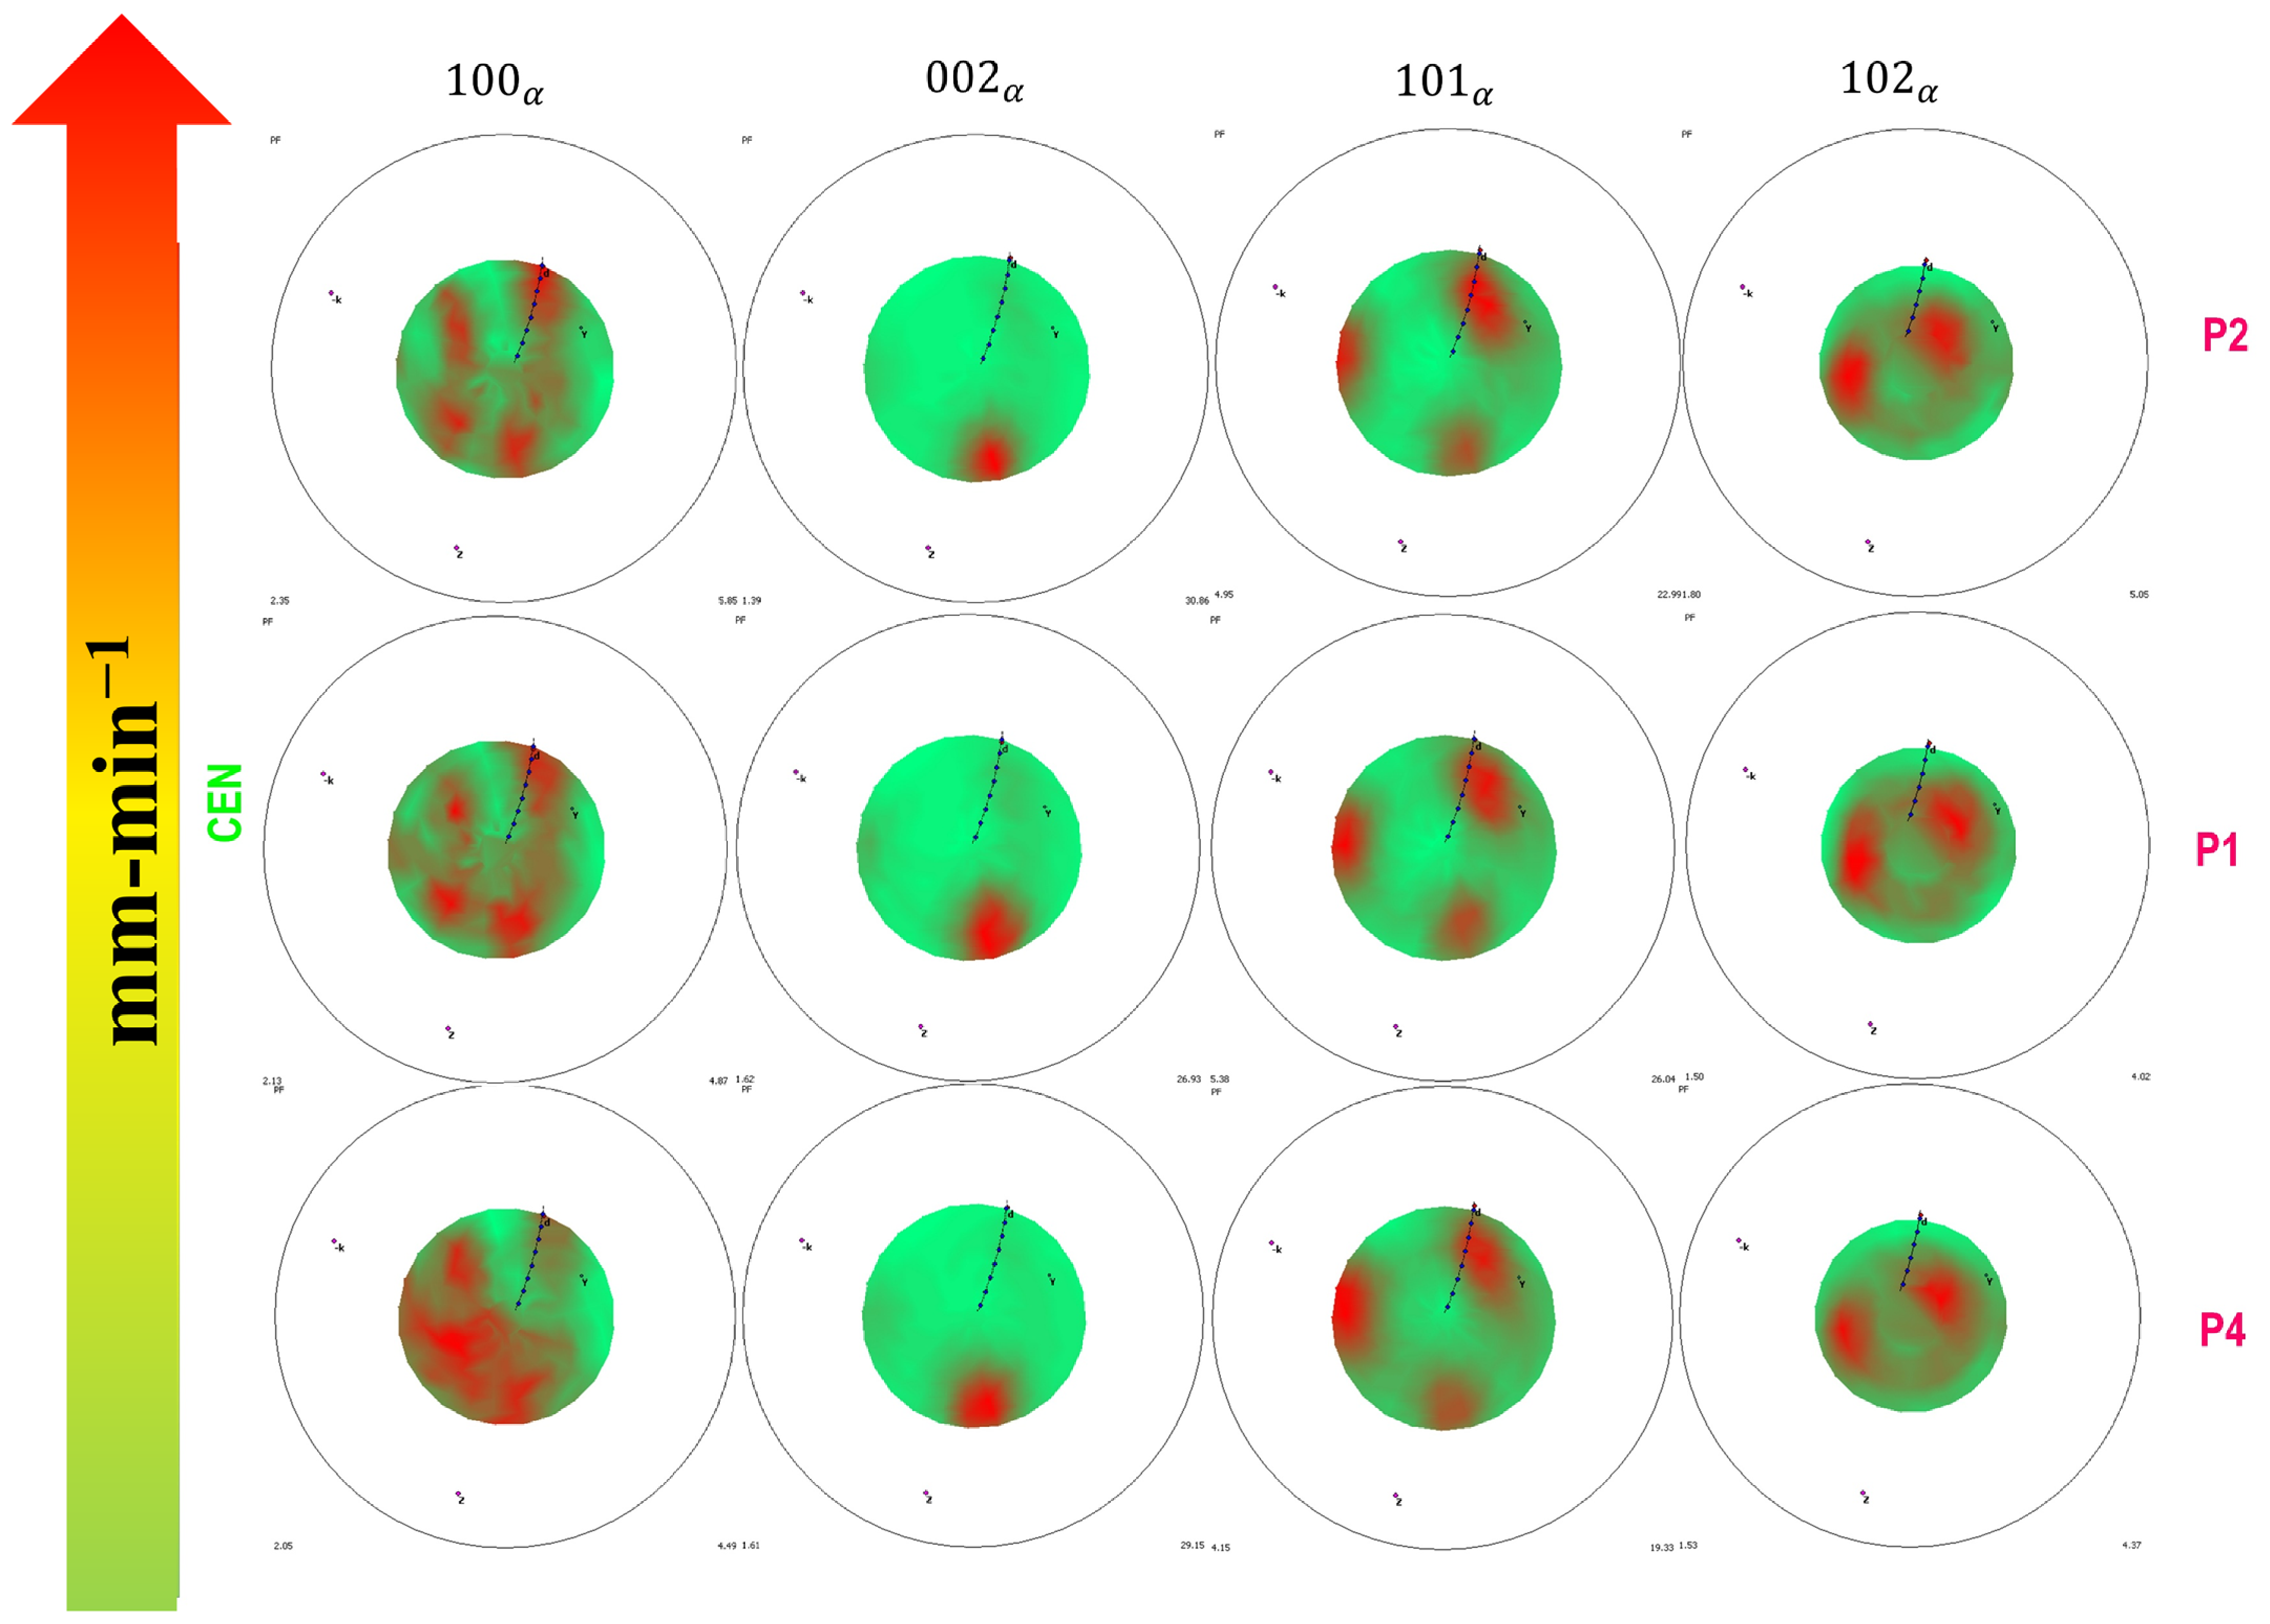
Figure 18.
Bubble plot of texture strength (m.r.d.) at the CEN for the traverse-speed series. Clusters show {100}α, {002}α, {101}α, {102}α for P4, P1, P2. Conventions are the same as those in Figure 10.
3.4.6. Retreating Side—Traverse-Speed Series (Figure 19 and Figure 20)
The RET-side textures of the traverse-speed series (Figure 19 and Figure 20) are likewise consistent with a deformation-related origin for the texture. {100}α strengthens monotonically with increasing traverse speed (≈8.73 m.r.d. at P4, ≈12.69 at P1, ≈13.67 at P2). {101}α peaks at P1 (≈25.9 m.r.d.) and is lower at both P4 (≈21.4) and P2 (≈21.9). {102}α maintains nearly constant strength but progressively rotates toward the ideal P-fiber position. Integrating both series, pyramidal {101}α and prismatic {100}α textures at the RET intensify with thermomechanical severity, regardless of whether that severity arises from higher rotation speed or higher traverse speed.
Figure 19.
Pole figures at the RET side for the traverse-speed series (P4, P1, P2). Columns: {100}α, {002}α, {101}α, {102}α. Same conventions as in Figure 9.
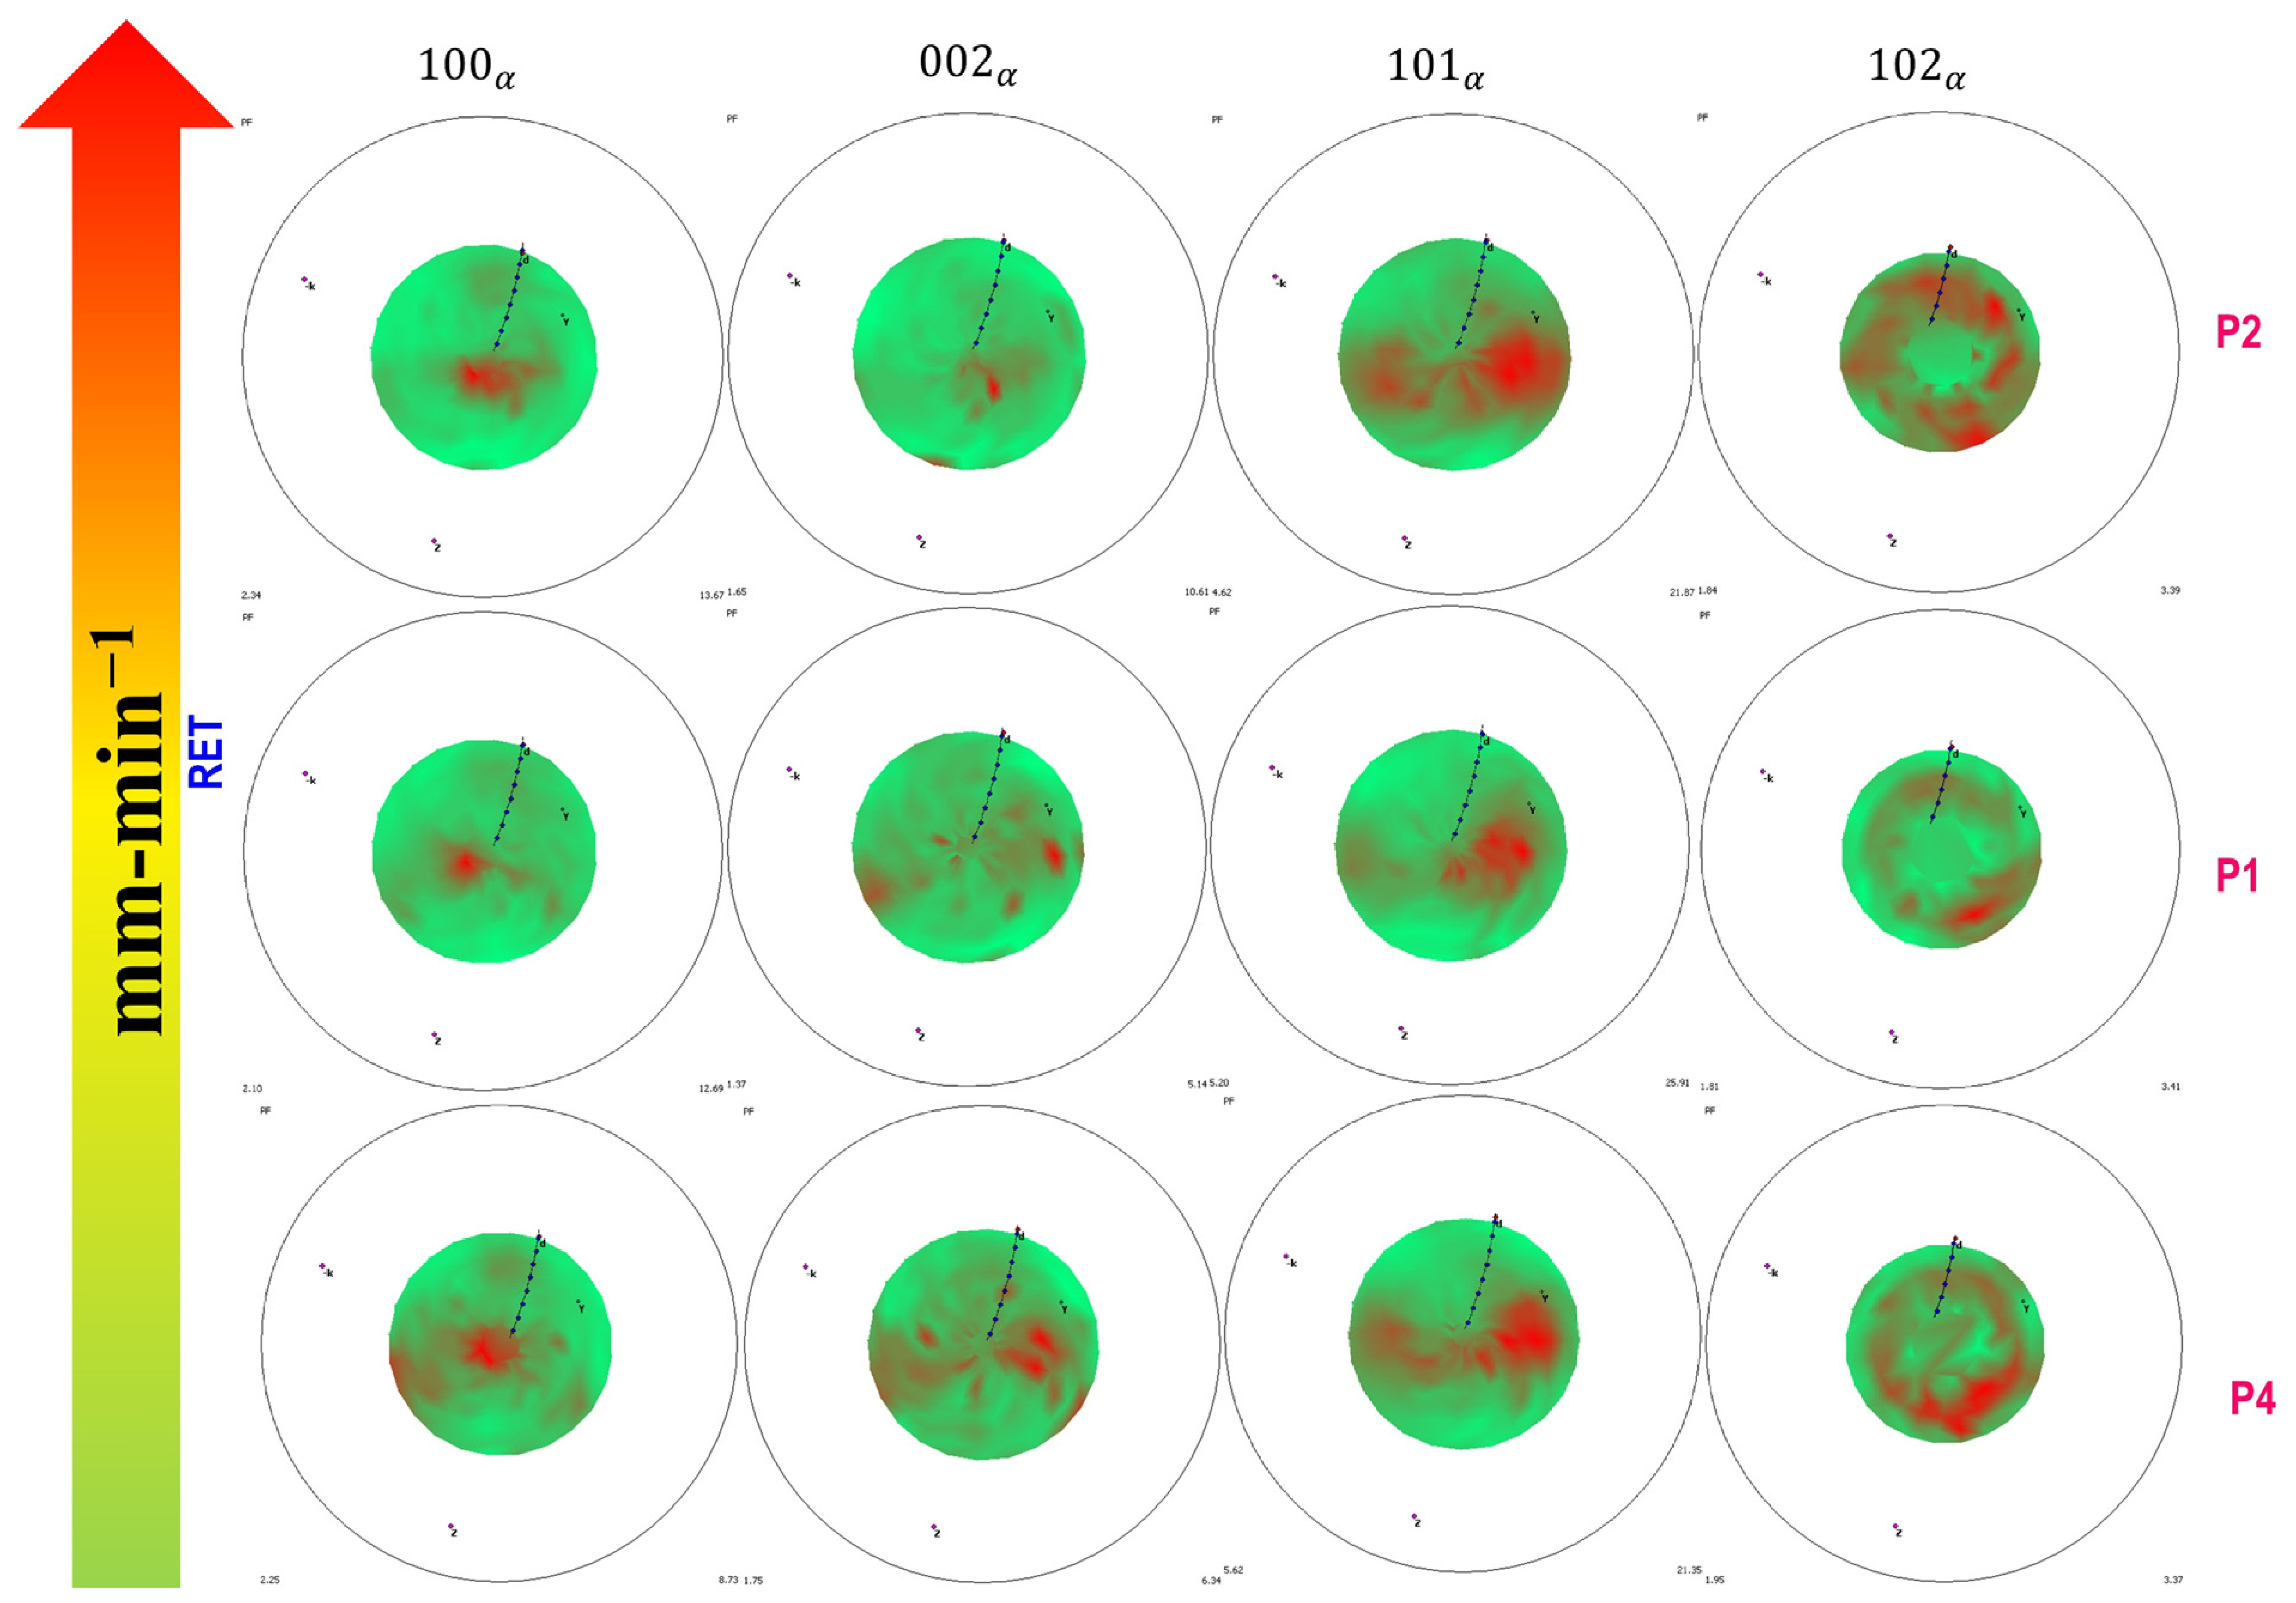
Figure 20.
Bubble plot of texture strength (m.r.d.) at the RET side for the traverse-speed series. Clusters show {100}α, {002}α, {101}α, {102}α for P4, P1, P2. Conventions are the same as those in Figure 10.
3.5. Tensile Behavior
Transverse tensile results are presented in Figure 21 and summarized in Table 4, with two replicate specimens per condition, both taken from the same weld, and, in each panel, a reference response measured by DIC on material free of surface tool marks. The σ0.2 and UTS values reported in Table 4 are averages of the two as-welded replicates for each condition. Across the full matrix, average σ0.2 lies within ≈900–940 MPa. Average UTS is ≈955 MPa at S1 (P5) and lies within ≈985–1010 MPa for the remaining four conditions. Joint efficiencies across the whole matrix are ≈90–96% relative to Ti–54M (≈1050 MPa, the weaker base metal). Total elongation, in contrast, varies strongly and systematically with N/v. The highest N/v rotation condition S3 (P3) (325 rpm; N/v = 2.60) exhibits the best tensile performance of the entire matrix, sustaining an extended flat plateau at ≈1010 MPa to fracture strains of ≈5.4–6.0% with excellent replicate agreement. The moderate conditions S2 (P1) (275 rpm, 125 mm·min−1) and P4 (275 rpm, 100 mm·min−1) follow, with fracture strains of ≈3.0–4.1% and ≈3.8%, respectively; P4 shows the closest replicate agreement and a slightly lower flow-stress plateau, consistent with lamellar coarsening at the longest exposure. The two lowest N/v conditions perform worst. S1 (P5) (225 rpm; N/v = 1.80) fails at ≈1.2–1.4% strain, shortly after macroscopic yield, with negligible plastic reserve. P2 (150 mm·min−1; N/v = 1.83) is erratic: one specimen fractured prematurely at ≈0.6% strain before reaching the full flow plateau, while its replicate reached ≈2.9%—a specimen-to-specimen scatter characteristic of stochastic, defect-initiated failure rather than an intrinsic material limit.
Figure 21.
Engineering stress–strain curves from transverse tensile tests for all parameter sets. Legend: S1 (P5) (225 rpm, 125 mm·min−1), P4 (275 rpm, 100 mm·min−1), S2 (P1) (275 rpm, 125 mm·min−1), P2 (275 rpm, 150 mm·min−1), S3 (P3) (325 rpm, 125 mm·min−1). Room temperature. As-welded replicates were tested at a nominal strain rate of 10−3 s−1; the tool-mark-free DIC reference specimens were tested under displacement control at a constant crosshead speed of 1.27 mm·min−1 (Section 2.6).
Table 4.
Average transverse tensile properties for all conditions, calculated from the two as-welded replicate specimens per condition. Fracture locations are those of the tool-mark-free specimens shown in Figure 24 (Section 3.6).
It is worth noting at this point that S1 (P5) and P2 have nearly identical N/v (1.80 and 1.83) yet fail in qualitatively different ways: the first reproducibly, just past yield, and the second erratically, with a factor of five between replicates. The two conditions are compared in detail in Section 4.1.1.
Finally, in most conditions the DIC reference without tool marks continues to higher strain (and, for P1 and P2, higher stress, up to ≈1090–1110 MPa) than the as-welded specimens, indicating that surface tool marks act as stress concentrators and that the reported elongations are conservative lower bounds on the intrinsic ductility of the weld material. The exception is S3 (P3), for which removal of the tool marks left the UTS essentially unchanged but reduced the total elongation relative to the as-welded replicates and lowered σ0.2; the same removal raised the elongation of P2 by more than a factor of two [26]. Face milling removes not only the tool marks but also the shoulder-affected surface layer, whose microstructure at high N/v is coarse lamellar α, so the net effect of the operation is not a simple removal of stress concentrators and is not uniform across the matrix. This qualification is carried into the practical recommendation in Section 4.5. Fracture locations and fracture-surface morphologies are reported in Section 3.6.
Full-Field Strain Distribution
Full-field strain maps recorded at the onset of fracture are shown in Figure 22, and the corresponding zonal stress–strain responses and through-weld strain profiles are shown in Figure 23 [26]. As mentioned in Section 2.6, the local stresses of Figure 23a are referred to the instantaneous zonal cross-section and therefore rise above the engineering stresses of Figure 21 at the most highly strained positions, reaching ≈1350 MPa at P2 and ≈1150–1160 MPa at P4 and S2 (P1), while remaining near ≈1010–1030 MPa at S3 (P3) and S1 (P5); the stress values of the two figures are not directly comparable. Three features are common to every condition for which the load record is reliable. First, strain is strongly heterogeneous along the gauge section: the weld nugget carries the lowest strain of any zone, while the largest strains accumulate on the advancing side. Second, the nugget exhibits the highest apparent stiffness and the smallest elongation of the five zones examined, and in the lower N/v conditions it remains within the elastic range while the surrounding material has already yielded and work hardened. In Figure 23a the nugget position (Pt2) terminates at a local strain of ≈0.01 in every condition, an order of magnitude below the strain reached at the advancing-side base-metal position (Pt0) in the most ductile conditions. The point values marked on Figure 22 make this quantitative, and show it to be the most parameter-insensitive feature of the entire dataset: the nugget strain at the onset of fracture lies between 0.0086 and 0.0101 in all five conditions, a spread of less than ±10% about its mean, while the advancing-side base-metal strain measured in the same specimens ranges from 0.0285 to 0.2665, a factor of more than nine. Third, both weld boundaries (Pt1 and Pt3) harden relative to the adjacent base metal, in contrast to the softening reported at the equivalent position in friction stir welds of some steels and aluminum alloys. The point values of Figure 22 quantify this as well: in every condition each weld-boundary position carries between about one-third and two-thirds of the strain measured at the base-metal position adjacent to it, and the nugget in turn between about one-tenth and one-half of the boundary values, so that the strain minimum is reached at the nugget in every case and the maximum always lies in base metal outside the weld.
Figure 22.
Full-field Lagrangian normal strain (εyy) maps at the onset of fracture, measured by DIC on tool-mark-free specimens, arranged as in Figure 21, with rotation speed increasing vertically and traverse speed increasing horizontally: S3 (P3) top; P4, S2 (P1) and P2 in the middle row from left to right; S1 (P5) bottom. ADV (Ti–6242 SG) at top and RET (Ti–54M) at bottom in each panel. The five analysis positions defined in Section 2.6 are marked on each panel together with their local strain values, from Pt0 in the ADV base metal through Pt1, Pt2 (nugget center) and Pt3 to Pt4 in the RET base metal. The bracketed “[1]” in the point labels is the Vic-3D notation for a dimensionless quantity and is not a reference citation. Strain scales differ between panels; peak local strains are quoted in the text. Adapted from [26].
Figure 23.
Local DIC response for all five conditions, arranged as in Figure 21 with rotation speed increasing vertically and traverse speed horizontally. (a) Local stress–strain response at the five analysis positions from ADV base metal (Pt0) through the ADV boundary (Pt1), nugget center (Pt2) and RET boundary (Pt3) to RET base metal (Pt4); strain axis 0–0.32, stress axis 0–1400 MPa. Local stresses are referred to the instantaneous zonal cross-section (Section 2.6) and therefore exceed the engineering stresses of Figure 21. The local stress–strain curves of S1 (P5) are shown for completeness only; the load record for that condition is compromised (Section 2.7(vii)) and is excluded from interpretation. (b) Major strain along the ADV-to-RET centerline (BM–ADV–WN–RET–BM) at successive stages of loading; strain axis 0–0.30 in every panel. Adapted from [26]. BM = base metal; ADV = advancing side; WN = weld nugget or weld center; RET = retreating side.
The magnitude of the advancing side strain concentration varies by nearly an order of magnitude across the matrix, and its endpoints, but not its intermediate ordering, follow the streak morphology described in Section 3.1. The reported peak local strain is ≈0.112 at S2 (P1), ≈0.138 at P4 and ≈0.256 at P2, against ≈0.06 at both S3 (P3) and S1 (P5). It is largest by a wide margin at P2, the condition that disperses Ti–54M into the greatest number of fine streaks reaching the ADV interface, and smallest at S3 (P3), in which the transported material is coarsest and most fully coalesced. The intermediate conditions, however, are not ordered by streak architecture: P4, in which the transported material is well consolidated within the nugget and comparatively little of it reaches the advancing interface, nevertheless develops the second largest concentration of the matrix, while S1 (P5), whose numerous fine streaks do reach that interface, develops the smallest. The advancing-side concentration is therefore reported here as an observed ordering rather than as a quantity determined by the streak architecture or by either process variable. The local stress–strain curves of Figure 23a show the same ordering, although the advancing-side base-metal position (Pt0) reaches ≈0.27 at P2, ≈0.14 at P4 and ≈0.12 at S2 (P1) but only ≈0.06 at S3 (P3), so the ≈0.256 peak reported above and the ≈0.27 Pt0 value should not be treated as necessarily identical quantities. The centerline strain profiles of Figure 23b likewise show a deep minimum at the weld nugget in every condition and, in every condition other than S1 (P5), a pronounced advancing-side peak together with a smaller and broader retreating-side peak. The transition from base metal to weld boundary is also asymmetric: on the ADV side the strain rises and falls over a narrower distance and with a steeper gradient than on the RET side, where the strained region is wider and the transition smoother.
S1 (P5) departs from this pattern, with the largest strains on the RET side rather than the ADV side (Figure 22; in Figure 23a the retreating-side base-metal position Pt4 rather than Pt0 carries the largest local strain for this condition, and the centerline profile of Figure 23b likewise shows the retreating-side peak to be the larger of the two). As set out in Section 2.7(vii), the load record for this specimen is compromised and its stress data are excluded from interpretation; the anomalous strain topology may equally reflect the interrupted test as any property of the weld, and no conclusion is drawn from it. The fracture location of this specimen, which is an observation on the specimen rather than on the load record, is reported in Section 3.6.
3.6. Fracture Location and Fractography
Fracture locations for all conditions are shown in Figure 24 and summarized in Table 4; the fracture surfaces of the same specimens are shown in Figure 25. All observations in this section are on the tool-mark-free specimens described in Section 2.6 and are drawn from the fuller survey reported in [26].
Figure 24.
Fracture locations of the transverse tensile specimens. Rotation speed increases vertically and traverse speed horizontally. ADV (Ti–6242 SG) and RET (Ti–54M) sides are marked on each coupon. Adapted from [26].
Figure 25.
Scanning electron fractographs of the transverse tensile specimens. Left and right columns are the conjugate ADV-side and RET-side halves of the same fracture; rows correspond to positions near the weld root, the mid-thickness and the weld top surface. Adapted from [26].
Two fracture positions occur across the matrix, and they separate along the same N/v boundary that separates the tensile behavior. The two consolidated intermediate conditions fail on the advancing side: S2 (P1) fractures between the TMAZ and the weld boundary on the ADV side, and P2 fractures on the ADV side after the onset of macroscopic necking there. The longest-exposure condition P4 and the lowest-N/v condition S1 (P5) both fracture in the center of the weld nugget, the latter with a flat, brittle-appearing fracture and no measurable necking. S3 (P3) fractures in the TMAZ on the advancing side, with no visible sign of necking.
The advancing-side failures occur on the same side of the weld as the location of maximum accumulated strain identified by DIC in Section 3.5 (Full-Field Strain Distribution), and the two observations are consistent: in these conditions the joint fails on the side where it deforms most, which is the behavior expected of a fully consolidated weld loaded transversely. The correspondence is one of side rather than of exact position: the DIC maximum lies at the advancing-side base-metal position Pt0, outside the advancing weld boundary, whereas the fractures themselves are located at or just outside that boundary (Figure 24). At S3 (P3) the advancing side likewise carries the larger of the two peaks, although the strain field of that condition is the most nearly uniform of the matrix and its advancing-side concentration the smallest, consistent with the absence of visible necking. The nugget-center failures have a different character. At S1 (P5) the nugget is the one region of the cross-section that did not exceed the Tβ of Ti–6242 SG (Section 3.2); it carries the highest basal pole density of the matrix (Section 3.4.2) and it is the region of lowest measured strain; failure there occurs at 1.2–1.4% total elongation with no plastic reserve. At P4 the nugget contains the coarsest lamellar α of the matrix (lath thickness ≈ 3.5 µm), and the flow-stress plateau is correspondingly the lowest of the consolidated conditions. P4 is in this respect the clearest counter-example to a purely strain-based reading of the failure site: its advancing-side concentration is the second largest of the matrix (≈0.138), yet fracture occurs at the nugget center, where the measured strain is only ≈0.009. In that condition the failure location is set by the nugget microstructure rather than by the position of greatest accumulated deformation.
The fracture surfaces are ductile throughout. Conjugate ADV and RET halves interlock as matching peaks and valleys, and at the specimen edges the morphology is uniformly dimpled. Across the central region the surface is divided into rounded, globule-like clusters, each of which is itself internally dimpled and separated by ridges; the appearance is that of groups of grains having been drawn apart together rather than of a single planar crack front. No brittle facets, and no flat unbonded regions of the kind associated with lack of bonding at a dissimilar alloy interface, were identified at any location or in any condition. The cluster scale varies across the cross-section in a way that follows the microstructural gradient, which is consistent with each cluster corresponding to a volume of similar prior-β grain size and transformation history.
Where the crack path can be traced, it runs from a Ti–54M streak into the adjacent Ti–6242 SG along the continuous α layers that decorate the prior-β grain boundaries. This is the classical preferential-deformation path in lamellar titanium, and its severity depends on the strength contrast between the grain-boundary α layer and the colony interior and on the prior-β grain size; it is a microstructural rather than an interfacial failure path. A single initiation site could not be identified with confidence on any specimen. The morphology is most consistent with initiation within the nugget away from the specimen edges, followed by successive failure of neighboring clusters. In the two nugget-center failures a distinct feature is present at the weld root: the fracture terminates in a sharp edge there, and the root of the weld shows the concave–convex interface between the two alloys visible in the macrographs of Figure 3 and Figure 4. The root, which is the region of least tool penetration and which contacts the backing anvil rather than the argon atmosphere, is therefore a plausible initiation site in these conditions.
Two limitations of this evidence should be stated. The fractographs are of the tool-mark-free specimens, so they describe failure with the surface stress concentrators removed and cannot speak directly to the initiation behavior of the as-welded replicates whose elongations are reported in Figure 21 and Table 4. And because no initiation site could be located unambiguously, the identification of the weld root as a candidate rests on the geometry of the fracture edge and of the root interface rather than on a directly observed origin.
4. Discussion
4.1. Processing Parameters, Deformation Behavior and Material Flow, and Zonal Microstructure
Across the present matrix, N/v orders the thermomechanical balance of the joints. Conditions of higher N/v, reached either by raising the rotation speed (S1 (P5)→S3 (P3)) or by lowering the traverse speed (P2→P4), are associated with higher inferred peak temperatures and longer thermomechanical exposure, promoting full β-phase formation in both alloys, coarser prior-β grains, and thicker lamellar α on cooling. At the lowest rotation speed, S1 (P5), the WN remains below the Tβ of Ti–6242 SG, producing refined equiaxed α and compromising bonding where the two alloys interface; as Section 4.1.1 shows, this is a property of that specific condition and not of low N/v as such. Across the present matrix the ranking of microstructural and textural features follows the ordering given by N/v, which is why the index is retained as an organizing variable. That ordering, however, should not be read as an equivalence between N/v and thermal state for the reasons given in Section 2.2 and demonstrated directly below.
4.1.1. Conditions of Equal N/v Are Not Equivalent
The present matrix contains a natural test of how far N/v alone describes the process. S1 (P5) (225 rpm, 125 mm·min−1) and P2 (275 rpm, 150 mm·min−1) differ in N/v by less than 2%, 1.80 against 1.83, yet were produced with rotation speeds differing by 50 rpm and traverse speeds differing by 25 mm·min−1. If N/v were a sufficient descriptor of the thermomechanical state, these two welds should be closely similar. Table 5 shows that they are not.
Table 5.
Comparison of the two conditions of near-equal N/v produced by different parameter combinations. All entries are taken from Section 3.1, Section 3.2, Section 3.3, Section 3.4 and Section 3.5 of this paper; the corresponding welding parameters are given in Table 1.
Three differences are significant relative to the measurement uncertainties established in Section 2.4 and Section 2.5. First, the streak architecture differs in kind rather than degree: S1 (P5) produces relatively coarse, regularly spaced lamellae of transported Ti–54M, whereas P2 produces a finer and more widely dispersed distribution. Second, the CEN microstructures indicate different thermal excursions. At S1 (P5) the retention of refined equiaxed α in the Ti–6242 SG regions indicates that the nugget did not exceed the Tβ of that alloy, whereas at P2 the nugget is lamellar throughout, indicating that it did; the higher rotation speed at P2 raised the peak temperature even though the higher traverse speed shortened the time spent there. Third, the ADV {002}α pole density differs by nearly a factor of two (≈10.5 against ≈ 19.0 m.r.d.), far outside the ≤10% combined uncertainty of the texture measurement.
The reason these two welds differ is that N and v enter the thermomechanical problem through different physical channels. Rotation speed sets the sliding velocity at the tool–workpiece interface and therefore both the local shear strain rate and the rate at which frictional and plastic work are dissipated as heat; it acts primarily on peak temperature and on the intensity of stirring. Traverse speed sets the residence time of any material element within the deformation zone and the rate at which the heat source moves away from it; it acts primarily on the duration of the thermal excursion and on the effective cooling rate. The ratio N/v collapses these two channels into a single number and in doing so discards the distinction between a short excursion to a high temperature and a longer excursion to a lower one. S1 (P5) and P2 are precisely such a pair. The same reasoning applies to any comparison of the type raised in the literature, for instance, 400 rpm/180 mm·min−1 against 600 rpm/270 mm·min−1, which share N/v ≈ 2.2 but differ by 50% in both rotation and traverse speed and would be expected, on the same grounds, to differ in peak temperature, strain rate, cooling rate, and consequently in α morphology, texture sharpness, and defect population.
The practical consequence for this study is limited but should be stated plainly. N/v remains useful here as a monotonic ordering variable, and the principal trends of the paper, the increase in ductility with N/v, the invariance of yield strength, and the zonal texture architecture, are unaffected. What cannot be claimed is that a target N/v value is by itself a sufficient process specification. A processing recommendation drawn from this work must specify N and v separately, which is why the favorable range identified in Section 4.5 is anchored to the specific condition 325 rpm/125 mm·min−1 rather than to the number 2.60 alone.
4.1.2. Deformation Behavior and Material Flow of the Two Alloys
The asymmetry of the joint originates in the deformation behavior of the two alloys under the conditions imposed by the tool, and it is worth setting out that behavior explicitly, since it underlies both the streak morphology of Section 3.1 and the zonal texture architecture of Section 3.4.
Flow field and side asymmetry. In friction stir welding the advancing side, where the tool surface velocity and the traverse velocity are co-directional, experiences a higher relative velocity between the tool and the workpiece, a steeper velocity gradient, and a correspondingly narrower and more intensely sheared deformation layer; on the retreating side the two velocities oppose, the relative velocity is lower, and the deformation layer is broader and less severely strained. Material is swept around the pin predominantly on the retreating side and deposited behind it toward the advancing side, so that the advancing-side interface is characteristically sharp while the retreating-side transition is diffuse [5,33,34]. In the present dissimilar configuration this generic asymmetry is superimposed on an alloy asymmetry, and the two reinforce one another: Ti–54M, placed on the retreating side, is the material entrained into the flow, and it is deposited as discrete streaks toward the advancing side, which is precisely what the macrographs of Figure 3 and Figure 4 and the EDS analysis of Section 3.1 show.
Alloy chemistry and flow partitioning. The two alloys do not soften identically. Ti–54M (Ti–5Al–4V–0.6Mo–0.4Fe) has a β-transus near 938 °C and a higher β-stabilizer content, so at any temperature within the FSW window it contains a larger fraction of the softer, more readily deformed β phase; Ti–6242 SG (Tβ ≈ 990 °C) remains predominantly α over a wider temperature range, and its higher aluminum content raises the flow stress of that α. The consequence is a window of temperature, bounded below by the Tβ of Ti–54M and above by that of Ti–6242 SG, within which the two alloys have markedly different effective viscosities under shear. Within this window Ti–54M flows preferentially and Ti–6242 SG resists entrainment, which is the mechanism underlying the observed one-directional transport of Ti–54M into the nugget and toward the ADV interface. Room temperature hardness (333 HV against 323 HV) is not the operative variable here, as noted in Section 2.1; it is reported only because the same ranking has been observed to accompany preferential migration in previous similar-titanium work [3,4,22]. The EDS evidence of Figure 2 supports this reading in a specific way. The elements that mark the streak boundaries sharply are V and Mo, the β-stabilizers carried in from Ti–54M, together with Zr and Sn resident in Ti–6242 SG; Al, which differs by only about one weight per cent between the alloys, produces no resolvable step. The transported material therefore enters the nugget carrying its own β-stabilizer inventory, and the sharpness of the V and Mo steps indicates that it does so without appreciable interdiffusion on the timescale of the process. Each streak consequently retains a locally lower Tβ than the surrounding Ti–6242 SG matrix, which is the microstructural basis for the streak-dependent β retention and transformation behavior discussed in Section 4.2.
Thermomechanical conditions and their effect on flow. The two process variables act on this partitioning differently, which explains why they produce opposite streak morphologies. Raising rotation speed raises both the shear rate and the temperature, moving both alloys further above their transus temperatures and reducing the viscosity contrast between them; the transported Ti–54M is then stirred more thoroughly and coalesces into fewer, thicker, better-mixed bands, which is what is observed from S1 (P5) to S3 (P3). Raising traverse speed shortens the time available for that coalescence while leaving peak temperature approximately unchanged, so the transported material is deposited as a larger number of thinner streaks that have not had time to merge, which is what is observed from P4 to P2. Rotation speed therefore acts on the degree of mixing and traverse speed on the spatial distribution of the transported phase—the two effects reported in Section 3.1—and the two are not interchangeable even at equal N/v, as Section 4.1.1 demonstrates.
Consequences for the deformation state of each zone. This flow field produces three distinct deformation histories within a single cross-section. The retreating side experiences sustained shear at temperatures at or below the Tβ of Ti–54M, so that a substantial part of the strain is accommodated in the α phase itself; this is the condition under which HCP shear textures develop directly, and it is consistent with the P-fiber-adjacent {100}α and {101}α maxima reported in Section 3.4.3 and Section 3.4.6. The nugget center is the hottest region and, at all but the lowest N/v, exceeds the transus of both alloys, so that the terminal deformation occurs in the β phase and the observed α orientation distribution is established during cooling; this is consistent with the near-ND basal concentration reported in Section 3.4.2 and Section 3.4.5. The advancing side is intermediate and, in addition, is compositionally heterogeneous, containing both the Ti–6242 SG matrix and Ti–54M streaks within the sampled volume; this is consistent with the mixed and non-monotonic textures reported in Section 3.4.1 and Section 3.4.4. The zonal texture architecture of this joint is, in this sense, a direct readout of the flow field.
This trend is consistent with the parametric synthesis of Philip et al. [18], who report that increasing rotation speed prolongs the excursion above the β-transus and coarsens the prior-β regions, whereas increasing traverse speed shortens the high-temperature dwell and refines the acicular α—with needle-type martensite-α′ appearing only at traverse speeds high enough to impose quench-like cooling rates. The present dissimilar joints follow the same directional dependence on N and v individually. The inverse dependence of stir-zone hardness on rotation speed and its direct dependence on traverse speed reported across the FSP literature [18], reflecting α-colony and prior-β grain-size control of strength, is congruent with the microstructural trends observed here.
4.2. Texture Development and the Origin of the Zonal Texture Architecture
The spatial separation of texture into three characteristic zones, basal-dominated CEN, mixed/non-monotonic ADV, and pyramidal/prismatic RET, reflects the distinct thermomechanical histories described in Section 4.1.2 and is most clearly read by comparing the experimental pole densities against the ideal-orientation overlays superposed on each pole figure.
At the CEN, the texture is most readily explained by orientation inheritance during the β→α transformation on cooling. The relevant observation is that the {002}α pole density concentrates near ND rather than along the simple-shear fiber trace through the marker d, which is the position expected of a transformation product and not of material whose terminal deformation occurred in the α phase. Davies et al. [8] reported that above-transus processing produces D2 BCC shear textures that transform on cooling to lamellar α with Burgers-inherited orientations, while Yoon et al. [9] showed that strong [0001]α concentrations form via strict variant selection when peak temperatures exceed Tβ; both are consistent with the present observations, although in both of those studies the identification rested on orientation-resolved measurement, which is not available here (Section 2.7(iii)). The high Al content of Ti–6242 SG contracts the HCP c-axis (reducing c/a ratio), increasing the energetic preference for basal planes and may therefore promote the formation of α orientations with basal poles near ND [10]. This effect would be expected to be strongest when Ti–6242 SG occupies the largest fraction of the CEN volume and to be diluted when Ti–54M streaks reduce local Al content. The non-monotonic basal intensity in the traverse-speed series (P4 ≈ 29, P1 ≈ 26, P2 ≈ 31 m.r.d.) is consistent with this picture—longer exposure (P4) coarsens prior-β grains, while shorter exposure (P2) preserves a sharper Burgers-inherited texture—although, as noted in Section 3.4.5, the spread across these three values is close to the measurement uncertainty and the interpretation is offered as the reading most consistent with the microstructural evidence rather than as a demonstrated dependence.
In similar alloy stir zones the deformation-related P1 shear texture component (in the Beausir–Tóth nomenclature, and distinct from the specimen designated P1 here) is reported to dominate the weld center [18]; in the present dissimilar joint, by contrast, the center texture is dominated by the transformation-inherited basal {002}α concentration near ND, suggesting that the orientation distribution established during cooling, rather than the terminal shear field, is the principal contributor to the nugget-center texture in this system. It is further noted that α-phase textures generated by friction stir processing are generally weak, with maximum intensities of only about 2.5 times random reported for Ti–6Al–4V [18]; although absolute pole densities measured here are not directly comparable to values from the literature owing to the partial-pole-figure geometry (Section 2.5), the relative ranking of components across zones follows the same ordering. The gap between that value and the 20–31 m.r.d. reported here is large, and Section 2.7(ii) sets out the four contributions—restricted-coverage normalization, reduced effective orientation statistics in lamellar material, Burgers-related clustering of transformation products, and the difference between a single reflection pole-figure maximum and an ODF maximum—that plausibly account for it. The comparison drawn here is therefore one of ranking and mechanism, not of magnitude.
On the ADV side, the coexistence of Ti–6242 SG and Ti–54M streaks creates a mixed texture that is neither as sharp as the CEN nor as deformation-dominated as the RET. The exclusive presence of {110}β texture on the ADV side is consistent with the higher Tβ of Ti–6242 SG: when this alloy dominates the ADV region with minimal streak dilution (S2(P1)), thermal conditions support β-phase retention and an oriented β population through the D1 BCC shear mechanism; the {110}β pole distribution is accordingly sharpest at S2 (P1) (Section 3.4.1), even though the integrated β diffraction intensity is greatest at S3 (P3) (Section 3.3), with the two quantities reflecting orientation concentration and phase abundance, respectively. When Ti–54M streaks are present, their lower Tβ causes earlier β→α transformation, disrupting β-texture inheritance. The displacement of the experimental ADV maxima from ideal-fiber loci, combined with intensities that become substantial only at long-exposure conditions (P4 ≈ 26.5 m.r.d. for {002}α), offers a consistent account of the non-monotonic ADV trends in the traverse-speed series. It should be borne in mind that the ADV measurement necessarily averages streak and matrix material within the ≈800 µm sampled volume (Section 2.7(v)), so part of the non-monotonic behavior may simply reflect a varying volume fraction of the two alloys within the beam rather than a change in the texture of either.
On the RET side, Ti–54M experiences intense simple shear from the retreating tool at temperatures at or below its Tβ. The primary mechanism appears to be deformation of the α phase itself rather than transformation on cooling, producing P- and C-fiber-oriented grains consistent with prism ⟨a⟩ and pyramidal ⟨c+a⟩ slip [16,20]. The supporting observation is the close, but not exact, clustering of the experimental {100}α and {101}α maxima around the blue tick marks along the dotted great-circle trace through d, which contrasts directly with the near-ND concentration measured at the CEN in the same specimens and under identical geometry; it is this internal contrast, rather than the absolute intensities, that supports the distinction drawn between the two zones. Under increasing rotation speed, shear intensity grows, progressively converting disorganized grains into preferred pyramidal {101}α orientations whose Schmid factors are favorable under simple shear. Liu et al. [19] reported that such texture gradients govern strain localization in the stir zone. Increasing traverse speed reduces exposure time but raises the instantaneous strain rate, which independently promotes pyramidal slip activity [35]; both factors strengthen the RET pyramidal texture.
The zonal distribution of shear components observed here mirrors the pattern summarized for similar-alloy friction stir processing of titanium [18], in which C1/C2 components dominate the advancing and retreating sides while the fiber orientations on the two sides differ by approximately 90°, tracking the local material-flow directions.
4.3. Texture–Property Relationships via Schmid-Factor Estimation
The connection between the measured zonal textures and transverse tensile behavior can be examined through Schmid-factor analysis [36,37], validated for FSW Ti–6Al–4V by Fall et al. [16]. For transverse tensile loading (load axis along the transverse direction, TD), the Schmid factor for a slip system with plane normal n and slip direction s is m = (l·n)(l·s), where l is the unit vector along TD. Yielding begins when the resolved shear stress reaches the critical resolved shear stress (CRSS) for the easiest available system, giving σy ≈ τCRSS/mmax. In α-Ti at room temperature, the approximate CRSS hierarchy is as follows: prismatic {10–10}⟨11–20⟩ (≈100–150 MPa) ≤ basal {0001}⟨11–20⟩ (≈120–180 MPa) ≪ pyramidal {10–11}⟨11–23⟩ (≈250–400 MPa) [36,37]. The analysis below uses ratios and relative magnitudes rather than absolute values, so it is robust to moderate variations in these CRSS estimates with alloy chemistry. It is important to state at the outset what this calculation can and cannot deliver here: because the underlying orientation data are partial pole figures rather than a full orientation distribution function, the Schmid factors quoted below are estimates evaluated over the measured region of orientation space, and they support statements about which slip modes are geometrically favored or suppressed at a given location, not quantitative predictions of yield stress.
This slip-system hierarchy, easy prismatic ⟨a⟩ slip at low critically resolved shear stress and pyramidal ⟨c+a⟩ slip at substantially higher CRSS, the latter activated by strain-compatibility requirements and the presence of the β phase, is consistent with the deformation-mode framework compiled for friction-stir-processed titanium [18], which likewise attributes direction-dependent strength and ductility to the alignment of the dominant fiber components with the loading axis.
At the CEN, basal poles concentrated near ND place most grains in a configuration where l·nbasal ≈ 0 for transverse loading, so that the resolved shear stress on the basal system is very low; the mean basal Schmid factor, evaluated by integrating the experimental pole density against the geometric Schmid-factor field, is mbasal ≈ 0.02–0.08 across the parameter matrix. Deformation must instead proceed via prismatic and pyramidal systems of higher CRSS, raising the effective slip threshold. This mechanism offers a consistent explanation of the most uniform feature of Figure 21: every consolidated condition, regardless of N/v, yields within the narrow band of ≈900–940 MPa, and the basal unfavorable CEN texture is present, at 20–31 m.r.d., in all of them. It should be acknowledged that this is a consistency argument rather than a demonstration: a uniform yield strength across conditions is compatible with a common texture-based cause, but other invariant features of the joint, such as the presence of the same two base metals within every gauge section, could contribute. The analysis is a single crystal idealization extended to the polycrystal by averaging over the measured orientation distribution; grain-boundary effects, through-thickness gradients, the presence of the retained β phase, and the incomplete coverage of orientation space are neglected, which would reduce absolute predictive power but not the relative ranking of conditions.
The full-field strain measurements of the Full-Field Strain Distribution (Section 3.5) provide a direct test of this argument. If the nugget-center orientation distribution raises the slip threshold in the manner proposed, then under transverse loading the nugget should deform less than any other zone of the gauge section, and it should do so in every condition, because the responsible texture component is present in every condition. This is what is observed: across the parameter matrix the weld nugget carries the lowest strain and the highest apparent stiffness of the five zones examined, and at the lower N/v it remains within the elastic range while the surrounding material has yielded and work hardened (Figure 22 and Figure 23). The point values of Figure 22 sharpen this test considerably: the nugget strain at the onset of fracture is 0.0086–0.0101 across the whole matrix, a spread of less than ±10% about its mean, while the advancing-side base-metal strain in the same specimens varies by a factor of more than nine. The measurement is independent of the diffraction data and of the Schmid calculation, and it is a prediction of the texture argument rather than an input to it. It does not identify the orientation distribution as the cause, a nugget that is simply stronger for other reasons would behave the same way, but it removes the possibility that the proposed mechanism is inconsistent with how the joint actually deforms, and the invariance of the effect across conditions of very different nugget microstructure is more readily explained by the invariant texture than by the varying α morphology.
Two further features of the strain fields bear on the interpretation. The weld boundaries on both sides harden relative to the adjacent base metal rather than softening, which is consistent with the refined and partly transformed microstructures reported at those positions in Section 3.2 and means that no soft zone exists at the weld boundary to localize strain. Strain instead accumulates on the advancing side, where the material is compositionally heterogeneous and the texture weakest and least well aligned with the ideal shear loci (Section 3.4.1). The magnitude of that accumulation is largest at P2, which disperses the transported material most finely (peak local strain ≈0.26), and smallest at S3 (P3), where it is coarsest and most fully coalesced (≈0.06), with S2 (P1) intermediate (≈0.11). As Section 3.5 (Full-Field Strain Distribution) records, however, the intermediate conditions are not ordered by streak architecture, since P4 develops the second largest concentration (≈0.14) although comparatively little transported material reaches its advancing interface; on the present evidence the streak morphology accounts for the extremes of the ordering but is not a sufficient predictor of the magnitude of the advancing-side concentration across the matrix. S1 (P5), whose load record is compromised and whose strain topology is anomalous (Section 3.5, Full-Field Strain Distribution), is excluded from this comparison. The zonal texture architecture, the flow field of Section 4.1.2 and the strain partitioning therefore describe one coherent picture: the flow field sets where the two alloys sit and what deformation history each experiences, that history sets the local texture and morphology, and those in turn set where the joint deforms and where it fails, if not the magnitude of the deformation at each location.
The same analysis does not, however, account for ductility in this dataset, and the tensile results of Figure 21 require the texture-localization reading to be set aside. If intense RET pyramidal texture (mpyr ≈ 0.35–0.45 against a high pyramidal CRSS) were the rate-limiting factor for elongation, the condition with the strongest deformation texture at the RET, S3 (P3), should exhibit the earliest strain localization. The opposite is observed: S3 (P3) sustains the longest plastic plateau of the entire matrix (≈5.4–6.0% fracture strain). Instead, ductility ranks almost monotonically with N/v: the two conditions clustered at N/v ≈ 1.8 (S1 (P5) at 1.80 and P2 at 1.83) fail at ≈0.6–2.9% with poor replicate reproducibility, the intermediate condition (N/v = 2.20) reaches ≈3–4%, and the conditions at N/v = 2.60–2.75 reach ≈3.8–6.0%. This ranking, together with the near-yield fracture at S1 (P5) and the one premature failure at P2, points to incomplete consolidation as the dominant ductility-limiting mechanism: below a threshold near N/v ≈ 2, the WN remains sub-Tβ for Ti–6242 SG, and weakly bonded streak interfaces and volumetric flaws initiate fracture before texture-mediated plasticity can develop. The fracture evidence of Section 3.6 requires this interpretation to be stated more precisely than it was. The fracture surfaces are ductile at every condition, with dimpled, globule-like morphology and no brittle facets and no flat unbonded regions of the kind that distributed debonding at streak interfaces would produce; where the crack path can be traced it follows the continuous α layers at the prior-β grain boundaries from a Ti–54M streak into the adjacent Ti–6242 SG, which is a microstructural path rather than an interfacial one. The consolidation deficiency at low N/v is therefore not manifest as widespread weak bonding between the alloys. What the fractography does identify, in the two conditions that fail in the nugget center, is a sharp fracture edge at the weld root together with the concave–convex root interface visible in the macrographs in the region of least tool penetration. The more defensible statement is accordingly that at low N/v the joint fails from a localized deficiency associated with incomplete penetration and transformation at the weld root and nugget center, rather than from a distributed population of weak streak interfaces. Above the threshold, fully consolidated joints tolerate even strongly pyramidal textured RET material, plausibly because the super-transus lamellar α that accompanies high N/v distributes slip at the colony scale and because the consolidated, coalesced Ti–54M bands at S3 (P3) present fewer, better-bonded interfaces than the fine intercalated streaks at low N/v. Hard-oriented RET grains may still contribute to strain partitioning within consolidated welds, but on the evidence of Figure 21 this effect is secondary to bond quality. The observation that the DIC reference without tool marks outperforms the as-welded specimens in every panel further supports a defect-dominated picture, with surface tool marks providing an additional, geometric initiation site.
The dual pathway framing is accordingly revised: rather than texture-driven localization at high N/v versus defect-driven failure at low N/v, the data are better described by a single consolidation-quality axis, with defect-driven brittle or erratic failure below N/v ≈ 2 and progressively improving, texture-tolerant ductility above it, moderated at the highest exposure (P4) by lamellar coarsening. This description is drawn from five conditions and two replicates each; the threshold value of N/v ≈ 2 should be read as the approximate location of a transition observed within this matrix and this tool configuration, not as a transferable constant.
4.4. Comparison with the Literature on a Similar Alloy FSW Ti
Quantitative comparison with the literature is instructive, provided the differences in measurement method are kept in view. Yoon et al. [9] reported {0001}α intensities of 12–20 m.r.d. in the stir zone of Ti–6Al–4V FSW under super-transus conditions, with the strongest concentration near ND—comparable to our CEN values of 20–31 m.r.d., given that the present pole figures sample a smaller solid-angle range. Davies et al. [8] reported maximum basal m.r.d. values of 8–15 in stationary-shoulder FSW of Ti–6Al–4V, lower than the present values, which may relate to the higher Al content of Ti–6242 SG but is also consistent with the normalization difference discussed in Section 2.7(ii). Fall et al. [16] reported pyramidal stir-zone intensities of 15–22 m.r.d. and identified P-fiber as the dominant component, in close agreement with the RET-side pyramidal intensities measured here (17–26 m.r.d.). Because these values from the literature were obtained by EBSD or by full pole-figure measurement, the numerical agreement should not be over-read; what the comparison establishes is that the present results fall within the range reported for FSW titanium and that the identification of component types, near-ND basal in the nugget, P-fiber pyramidal and prismatic on the sheared side, matches the published pattern. The dissimilar nature of the present joint introduces additional features absent from these similar alloy studies, notably the streak morphology dependence of ADV textures and the asymmetric Tβ effect on β-phase retention, but the underlying texture-generating mechanisms operate consistently with the similar-alloy literature.
Philip et al. [18] further emphasize that titanium alloys differ markedly in their response to friction stir processing owing to alloy-specific transus temperatures and transformation kinetics; in a dissimilar couple these two responses are superimposed within a single stir zone, which rationalizes the strongly asymmetric advancing-/retreating-side microstructures and textures observed across the present parameter matrix.
4.5. Favorable Processing Range Within the Investigated Matrix
The integrated dataset identifies the high-rotation-speed condition S3 (P3) (325 rpm, 125 mm·min−1; N/v = 2.60) as the best-performing condition of the matrix, combining the highest UTS (≈1010 MPa), fracture strains of ≈5.4–6.0%, and excellent replicate reproducibility. More generally, all three conditions at N/v ≥ 2.20 (S2 (P1), S3 (P3), P4) deliver joint efficiencies above 90% with total elongations of ≈3–6%; performance is best at N/v = 2.60 and begins to decline again at N/v = 2.75, so the favorable range within the investigated matrix is placed at N/v ≈ 2.2–2.6, while both conditions near N/v ≈ 1.8 (S1 (P5), P2) fall below the consolidation threshold and fail prematurely or erratically. Within this range the trends are consistent with the microstructural record: moving from N/v = 2.20 to 2.60 increases ductility as super-transus transformation of both alloys becomes complete and Ti–54M consolidates into well-bonded bands, while pushing exposure further to N/v = 2.75 (P4) begins to trade performance away again through lamellar coarsening and a slightly reduced flow stress. Notably, the strong RET pyramidal texture and thick consolidated Ti–54M bands at S3 (P3), features the texture analysis alone might flag as ductility risks, coexist with the best tensile performance, underscoring that consolidation quality, not texture severity, is the primary design variable for this dissimilar system over the range examined here.
Three practical implications follow, each bounded by the matrix from which it is drawn. First, the favorable range should be specified as N/v ≈ 2.2–2.6 with the best result at its upper end, rather than centered on the intermediate condition. Second, and following directly from Section 4.1.1, a target N/v is not by itself an adequate process specification: the recommendation of this work is the parameter pair 325 rpm and 125 mm·min−1, and a different pair yielding the same ratio should not be assumed to give equivalent results. Third, post-weld removal of surface tool marks recovers additional ductility in most, but not all, conditions and should therefore be qualified rather than recommended generally: it more than doubled the elongation of P2, but at S3 (P3) it left the UTS unchanged while reducing both σ0.2 and the total elongation (Section 3.5). Face milling removes the shoulder-affected surface layer along with the tool marks, and at high N/v that layer is coarse lamellar α whose contribution to the section is not negligible, so the operation is not a pure removal of stress concentrators. Where it is applied, its effect should be verified for the specific parameter set. It should be emphasized that these statements apply to the tool geometry, sheet thickness, alloy placement, and fixturing used here; the five-condition matrix locates a transition and an optimum within itself, but does not establish either as transferable.
This defect-dominated behavior is consistent with the defect taxonomy compiled by Philip et al. [18]—voids, incomplete material consolidation, and cracking arising from insufficient heat input, inadequate forging pressure, or excessive travel speed—and with the exceptionally narrow processing window they report for α+β titanium alloys, for which the permissible variance in spindle speed for defect-free welds is on the order of only 25 rpm, a parameter sensitivity some five to ten times greater than for aluminum alloys. Within so narrow a window, modest parameter excursions can shift a joint from consolidation-limited to microstructure/texture-limited behavior, which supports the consolidation-quality-first interpretation advanced here and underscores why the 325 rpm/125 mm·min−1 condition emerges as optimal despite not maximizing any single texture metric.
These findings emphasize that securing full consolidation across the joint—and managing surface condition—takes precedence over microtexture optimization in this dissimilar system, with the zonal texture architecture then governing the yield strength level through the unfavorable basal orientation of the CEN material. Future work should explore how tool geometry, post-weld heat treatment, the converse alloy assignment, and EBSD-based ODF reconstruction with prior-β reconstruction [32] (to validate the m.r.d. scaling, to test the transformation-inheritance interpretation of the CEN texture directly, and resolve sub-zone gradients beyond the 800 µm X-ray spot) can further probe the residual, second-order influence of RET texture on strain partitioning within fully consolidated welds. Direct process instrumentation, spindle torque, axial force, and embedded or infrared thermal measurement, would additionally allow the kinematic index N/v used here to be replaced by a measured energy quantity, which Section 4.1.1 identifies as the principal methodological limitation of the present parameter study.
5. Conclusions
Dissimilar FSW of Ti–6242 SG (ADV) and Ti–54M (RET) was investigated across a parameter matrix spanning rotation speeds of 225–325 rpm and traverse speeds of 100–150 mm·min−1. Microstructure and crystallographic texture were characterized by 2D-XRD at three cross-section locations and correlated with elemental partitioning measured by EDS, with transverse tensile properties, with full-field strain measured by digital image correlation, and with fracture location and fracture-surface morphology. Partial pole figures were analyzed in the simple-shear reference frame against ideal-orientation overlays for the principal HCP shear fibers, with intensities in multiples of a random distribution (m.r.d.). The principal findings are as follows.
- Sound welds were obtained across the whole matrix at the macroscopic scale, and the transport of Ti–54M from the retreating side into the nugget was governed by the two process variables in distinct ways: rotation speed controlled the coalescence of the transported material into thicker bands, and traverse speed controlled its dispersion into finer, more numerous streaks. These are separate effects of separate variables, not two expressions of a single heat-input parameter.
- Conditions of the nearly equal rotation-to-traverse-speed ratio are not equivalent. S1 (P5) (225 rpm/125 mm·min−1, N/v = 1.80) and P2 (275 rpm/150 mm·min−1, N/v = 1.83) differ by less than 2% in N/v yet differ in streak architecture, in whether the nugget exceeded the β-transus of Ti–6242 SG, in advancing-side basal pole density by nearly a factor of two, and in the character of their tensile failure. N/v is therefore useful as an ordering index for a fixed tool and configuration, but is not a sufficient process specification and is not a measure of heat input.
- The joint develops a reproducible three-zone texture architecture. At the nugget center the {002}α pole density concentrates near the sample normal, away from the ideal shear fiber loci, at 20–31 m.r.d.; on the retreating side the {100}α and {101}α maxima cluster close to the ideal P-fiber loci and intensify with both rotation and traverse speed; the advancing side is mixed and varies non-monotonically. The contrast between the first two, measured in the same specimens under identical geometry, is the strongest single result of the texture study.
- The near-normal-direction basal concentration at the nugget center is more readily explained by orientation inheritance during the β→α transformation on cooling than by direct shear and the retreating-side texture by deformation of the α phase itself. These are interpretations of pole-figure geometry supported by the accompanying microstructural morphology; they are not demonstrations of variant selection, which would require orientation-resolved measurement and prior-β reconstruction.
- Yield strength is uniform at ≈900–940 MPa across the whole matrix, with joint efficiencies of ≈90–96%. This invariance is consistent with a Schmid-factor estimate in which the near-normal basal orientation of the nugget-center material gives a very low resolved shear stress on the basal system under transverse loading (mbasal ≈ 0.02–0.08), so that yielding requires the harder prismatic and pyramidal modes at every condition. Full-field strain measurement provides an independent and consistent observation: under transverse loading the weld nugget carries the lowest strain and the highest apparent stiffness of any zone, in every condition for which the load record is reliable, while strain accumulates on the compositionally heterogeneous and weakly textured advancing side. The nugget strain at the onset of fracture is moreover essentially invariant across the matrix, 0.0086–0.0101 in all five conditions, while the advancing-side base-metal strain measured in the same specimens varies by a factor of more than nine; an invariance more readily attributed to the texture component common to every condition than to the α morphology, which is not common to every condition.
- Ductility, by contrast, tracks consolidation quality rather than texture severity. Fracture strain rises from ≈0.6–1.4% at N/v ≈ 1.8 to ≈5.4–6.0% at N/v = 2.60, even though the latter condition carries the strongest retreating-side pyramidal texture of the matrix. Two fracture positions occur across the matrix and separate along the same boundary: the consolidated intermediate conditions fail on the advancing side, where the strain fields show deformation to be concentrated, whereas the lowest-N/v condition and the longest-exposure condition fail in the nugget center. The longest-exposure condition P4 shows that the strain field does not by itself determine the failure site: its advancing-side concentration is the second largest of the matrix, yet it fails at the nugget center, where the measured strain is the lowest of any zone. The fracture surfaces are ductile in every condition, with dimpled, globule-like morphology and no unbonded regions; the crack path follows the continuous α layers at prior-β grain boundaries. The consolidation deficiency at low N/v is therefore better described as a localized deficiency associated with incomplete penetration and transformation at the weld root and nugget center than as distributed debonding at streak interfaces.
- Within the matrix examined, the most favorable result is obtained at 325 rpm and 125 mm·min−1 (UTS ≈ 1010 MPa, ≈5.4–6.0% elongation), with acceptable performance across N/v ≈ 2.2–2.6. This recommendation is expressed as a parameter pair rather than as a ratio, for the reason given in finding 2. Post-weld removal of surface tool marks recovers ductility in most conditions but not all: it more than doubled the elongation of P2 while reducing it at S3 (P3), because face milling removes the shoulder-affected surface layer along with the marks; it should therefore be qualified rather than recommended generally.
Scientific significance. The broader implication is that in a dissimilar titanium joint the texture field and the property field are set by different things. The zonal texture architecture, which is a direct readout of the flow field and of the thermal path of each zone, establishes the level of the yield strength and does so almost independently of the process parameters, because the responsible component is present in every condition. Ductility, in contrast, is set by how completely the two alloys are bonded to one another, which is strongly parameter-dependent. Design effort for this system is therefore better spent on securing consolidation and on managing the as-welded surface than on optimizing microtexture—the reverse of the priority that a texture study alone would suggest.
Limitations. Several limitations bound these conclusions and are stated in full in Section 2.7. The pole figures are partial, so absolute m.r.d. values are internally comparable but are not equivalent to full-pole-figure or EBSD-derived values and should not be transferred between measurement geometries. No orientation-resolved measurement was performed, so the transformation-related origin proposed for the nugget-center texture remains an inference rather than a demonstration. No process instrumentation—torque, spindle power, axial force, or thermal cycles—was recorded, so all statements about peak temperature and cooling rate are inferences from microstructure, and the effects of rotation and traverse speed can be compared in their relative influence but cannot be separated quantitatively. The full-field strain and fractographic evidence was obtained on tool-mark-free specimens of a different geometry from the as-welded replicates, so it describes how the joint partitions strain and fails once the surface stress concentrators are removed; the load record for S1 (P5) was compromised by a grip-capacity change during testing and its stress data are excluded from interpretation, and no DIC measurement was replicated. No initiation site could be located unambiguously on any fracture surface, so the identification of the weld root as a candidate rests on the geometry of the fracture edge rather than on a directly observed origin. In addition, one alloy placement was examined at one tool geometry, each condition was welded once, and no diffraction measurement was repeated; the two tensile coupons per condition were taken from a single weld, so the scatter reported is between specimens rather than between welds. The transition near N/v ≈ 2 and the optimum at 325 rpm/125 mm·min−1 locate features within this matrix and are not established as transferable constants.
Future work. EBSD mapping with prior-β reconstruction would test the transformation-inheritance interpretation directly and place the m.r.d. scaling on a common footing with the published literature; instrumented welding would replace the kinematic index used here with a measured energy quantity; and examination of the converse alloy assignment would test how much of the observed asymmetry is attributable to the alloys and how much is attributable to the advancing/retreating geometry.
Author Contributions
Conceptualization, K.G. and M.R.; methodology, K.G.; formal analysis, K.G.; investigation, K.G.; resources, M.R.; data curation, K.G.; writing—original draft preparation, K.G.; writing—review and editing, K.G. and M.R.; visualization, K.G.; supervision, M.R.; funding acquisition, M.R. All authors have read and agreed to the published version of the manuscript.
Funding
This work was accomplished using facilities at the University of Washington, funded by the Boeing Company.
Data Availability Statement
The data that support the findings of this study are available from the corresponding author upon reasonable request.
Acknowledgments
The authors sincerely thank the University of Washington and The Boeing Company for supporting this research, and are grateful to the facility at Boeing Auburn, WA, for conducting the friction stir welding experiments under controlled conditions. The authors gratefully acknowledge the use of facilities and instrumentation at the Molecular Analysis Facility (MAF) at the University of Washington for X-ray diffraction (XRD) and scanning electron microscopy (SEM) analysis. Additionally, the authors thank the Department of Materials Science and Engineering for providing facilities used for microstructure preparation, and the Mechanical Testing Lab in the Department of Mechanical Engineering at the University of Washington for access to the Instron and DIC instrumentation used for mechanical testing.
Conflicts of Interest
The authors declare no conflicts of interest.
Appendix A. Minimum and Maximum Pole-Figure Intensities
The minimum and maximum pole-figure intensities plotted as bubble plots in Figure 10, Figure 12, Figure 14, Figure 16, Figure 18 and Figure 20 are tabulated below, so that the values printed within the pole figures of Figure 9, Figure 11, Figure 13, Figure 15, Figure 17 and Figure 19 can be read directly and compared quantitatively across measurement locations and processing conditions. All values are subject to the coverage and normalization caveats of Section 2.5 and Section 2.7 and are read as relative quantities.
Table A1.
Rotation-speed series. Minimum and maximum pole-figure intensities (m.r.d.) measured by 2D-XRD at the advancing side, weld nugget center and retreating side for the three rotation-speed conditions, at a fixed traverse speed of 125 mm·min−1. Specimens are listed in order of increasing rotation speed (S1–S3), i.e., increasing N/v.
Table A2.
Traverse-speed series. Minimum and maximum pole-figure intensities (m.r.d.) measured by 2D-XRD at the advancing side, weld nugget center and retreating side for the three traverse-speed conditions, at a fixed rotation speed of 275 rpm. Specimens are listed in order of increasing traverse speed (P4–P2), i.e., decreasing N/v.
References
- Gangwar, K.; Ramulu, M. Friction stir welding of titanium alloys: A review. Mater. Des. 2018, 141, 230–255. [Google Scholar] [CrossRef] [Scilit]
- Gangwar, K.; Ramulu, M. Dataset for interpreting the Circos figures used in the review of friction stir welding of titanium alloys. Data Brief 2019, 22, 164–168. [Google Scholar] [CrossRef] [Scilit] [PubMed]
- Gangwar, K.; Ramulu, M.; Cantrell, A.; Sanders, D.G. Microstructure and Mechanical Properties of Friction Stir Welded Dissimilar Titanium Alloys: TIMET-54M and ATI-425. Metals 2016, 6, 252. [Google Scholar] [CrossRef] [Scilit]
- Ramulu, M.; Gangwar, K.; Cantrell, A.; Laxminarayana, P. Study of Microstructural Characteristics and Mechanical Properties of Friction Stir Welded Three Titanium Alloys. Mater. Today Proc. 2018, 5, 1082–1092. [Google Scholar] [CrossRef] [Scilit]
- Mishra, R.S.; Ma, Z.Y. Friction stir welding and processing. Mater. Sci. Eng. R Rep. 2005, 50, 1–78. [Google Scholar] [CrossRef] [Scilit]
- Thomas, W.M.; Nicholas, E.D.; Needham, J.C.; Murch, M.G.; Templesmith, P.; Dawes, C.J. Friction Stir Welding. GB Patent Applications No. 9125978.8; International Patent Application No. PCT/GB92/02203, 6 December 1991. [Google Scholar]
- Pilchak, A.L.; Williams, J.C. Microstructure and Texture Evolution during Friction Stir Processing of Fully Lamellar Ti-6Al-4V. Met. Mater. Trans. A 2011, 42, 773–794. [Google Scholar] [CrossRef] [Scilit]
- Davies, P.S.; Wynne, B.P.; Rainforth, W.M.; Thomas, M.J.; Threadgill, P.L. Development of Microstructure and Crystallographic Texture during Stationary Shoulder Friction Stir Welding of Ti-6Al-4V. Met. Mater. Trans. A 2011, 42, 2278–2289. [Google Scholar] [CrossRef] [Scilit]
- Yoon, S.; Ueji, R.; Fujii, H. Effect of rotation rate on microstructure and texture evolution during friction stir welding of Ti–6Al–4V plates. Mater. Charact. 2015, 106, 352–358. [Google Scholar] [CrossRef] [Scilit]
- Lütjering, G.; Williams, J.C. Titanium, Engineering Materials and Processes, 2nd ed.; Springer: Berlin/Heidelberg, Germany, 2013; Available online: https://books.google.com/books?id=wBXsCAAAQBAJ (accessed on 19 August 2026).
- Fonda, R.W.; Knipling, K.E. Texture development in friction stir welds. Sci. Technol. Weld. Join. 2011, 16, 288–294. [Google Scholar] [CrossRef] [Scilit]
- Knipling, K.; Fonda, R. Texture development in the stir zone of near-α titanium friction stir welds. Scr. Mater. 2009, 60, 1097–1100. [Google Scholar] [CrossRef] [Scilit]
- Mironov, S.; Sato, Y.; Kokawa, H. Development of grain structure during friction stir welding of pure titanium. Acta Mater. 2009, 57, 4519–4528. [Google Scholar] [CrossRef] [Scilit]
- Reynolds, A.; Hood, E.; Tang, W. Texture in friction stir welds of Timetal 21S. Scr. Mater. 2005, 52, 491–494. [Google Scholar] [CrossRef] [Scilit]
- Mironov, S.; Sato, Y.; Kokawa, H. Friction-stir welding and processing of Ti-6Al-4V titanium alloy: A review. J. Mater. Sci. Technol. 2018, 34, 58–72. [Google Scholar] [CrossRef] [Scilit]
- Fall, A.; Monajati, H.; Khodabandeh, A.; Fesharaki, M.; Champliaud, H.; Jahazi, M. Local mechanical properties, microstructure, and microtexture in friction stir welded Ti-6Al-4V alloy. Mater. Sci. Eng. A 2019, 749, 166–175. [Google Scholar] [CrossRef] [Scilit]
- Beausir, B.; Tóth, L.S.; Neale, K.W. Ideal orientations and persistence characteristics of hexagonal close packed crystals in simple shear. Acta Mater. 2007, 55, 2695–2705. [Google Scholar] [CrossRef] [Scilit]
- Philip, J.T.; Alex, A.G.; Abhimanyu, K.S. Process-structure-property correlation in friction stir processing and deposition (FSP/D) of titanium and its alloys: A review. Crit. Rev. Solid State Mater. Sci. 2025, 50, 321–417. [Google Scholar] [CrossRef] [Scilit]
- Liu, F.; Liao, J.; Gao, Y.; Nakata, K. Influence of texture on strain localization in stir zone of friction stir welded titanium. J. Alloys Compd. 2015, 626, 304–308. [Google Scholar] [CrossRef] [Scilit]
- Malik, W.; Lone, N.; Bajaj, D.; Abidi, M.; Chaudhary, S.; Mohammed, M.; Chen, D.; Siddiquee, A. Deformation induced microstructure and texture evolution in additively manufactured Ti-6Al-4V sheets via friction stir welding. Mater. Sci. Eng. A 2025, 927, 148043. [Google Scholar] [CrossRef] [Scilit]
- Gangwar, K.; Ramulu, M.; Sanders, D.G. Friction Stir Welding of near α and α + β Titanium Alloys: Metallurgical and Mechanical Characterization. Metals 2017, 7, 565. [Google Scholar] [CrossRef] [Scilit]
- Gangwar, K.; Ramulu, M. Residual Stress Measurement Using X-ray Diffraction in Friction Stir-Welded Dissimilar Titanium Alloys. Materials 2024, 17, 1482. [Google Scholar] [CrossRef] [Scilit] [PubMed]
- Schmidt, H.; Hattel, J.; Wert, J. An analytical model for the heat generation in friction stir welding. Model. Simul. Mater. Sci. Eng. 2004, 12, 143–157. [Google Scholar] [CrossRef] [Scilit]
- Nandan, R.; Debroy, T.; Bhadeshia, H. Recent advances in friction-stir welding—Process, weldment structure and properties. Prog. Mater. Sci. 2008, 53, 980–1023. [Google Scholar] [CrossRef] [Scilit]
- Colegrove, P.A.; Shercliff, H.R. 3-Dimensional CFD modelling of flow round a threaded friction stir welding tool profile. J. Mech. Work. Technol. 2005, 169, 320–327. [Google Scholar] [CrossRef] [Scilit]
- Gangwar, K. Metallurgical and Mechanical Characterization of High Temperature Titanium Alloys Joined by Friction Stir Welding; University of Washington: Seattle, WA, USA, 2017. [Google Scholar]
- He, B.B. Two-Dimensional X-Ray Diffraction; John Wiley & Sons: Hoboken, NJ, USA, 2018. [Google Scholar]
- Bunge, H.J. Texture Analysis in Materials Science: Mathematical Methods; Butterworth-Heinemann: Oxford, UK, 2013; Available online: https://books.google.com/books?id=wAQcBQAAQBAJ (accessed on 19 August 2026).
- Schulz, L.G. A Direct Method of Determining Preferred Orientation of a Flat Reflection Sample Using a Geiger Counter X-ray Spectrometer. J. Appl. Phys. 1949, 20, 1030–1033. [Google Scholar] [CrossRef] [Scilit]
- Kocks, U.F.; Tomé, C.N.; Wenk, H.R. Texture and Anisotropy: Preferred Orientations in Polycrystals and Their Effect on Materials Properties; Cambridge University Press: Cambridge, UK, 2000; Available online: https://books.google.com/books?id=vkyU9KZBTioC (accessed on 19 August 2026).
- Sutton, M.A.; Orteu, J.J.; Schreier, H. Image Correlation for Shape, Motion and Deformation Measurements: Basic Concepts, Theory and Applications; Springer Science & Business Media: Berlin/Heidelberg, Germany, 2009. [Google Scholar]
- Glavicic, M.; Kobryn, P.; Bieler, T.; Semiatin, S. An automated method to determine the orientation of the high-temperature beta phase from measured EBSD data for the low-temperature alpha-phase in Ti–6Al–4V. Mater. Sci. Eng. A 2003, 351, 258–264. [Google Scholar] [CrossRef] [Scilit]
- Reynolds, A. Visualisation of material flow in autogenous friction stir welds. Sci. Technol. Weld. Join. 2000, 5, 120–124. [Google Scholar] [CrossRef] [Scilit]
- Seidel, T.U.; Reynolds, A.P. Visualization of the material flow in AA2195 friction-stir welds using a marker insert technique. Met. Mater. Trans. A 2001, 32, 2879–2884. [Google Scholar] [CrossRef] [Scilit]
- Zaefferer, S. A study of active deformation systems in titanium alloys: Dependence on alloy composition and correlation with deformation texture. Mater. Sci. Eng. A 2003, 344, 20–30. [Google Scholar] [CrossRef] [Scilit]
- Bridier, F.; Villechaise, P.; Mendez, J. Analysis of the different slip systems activated by tension in a α/β titanium alloy in relation with local crystallographic orientation. Acta Mater. 2005, 53, 555–567. [Google Scholar] [CrossRef] [Scilit]
- Williams, J.C.; Baggerly, R.G.; Paton, N.E. Deformation behavior of HCP Ti-Al alloy single crystals. Met. Mater. Trans. A 2002, 33, 837–850. [Google Scholar] [CrossRef]
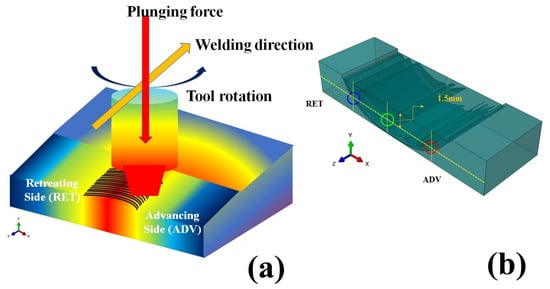
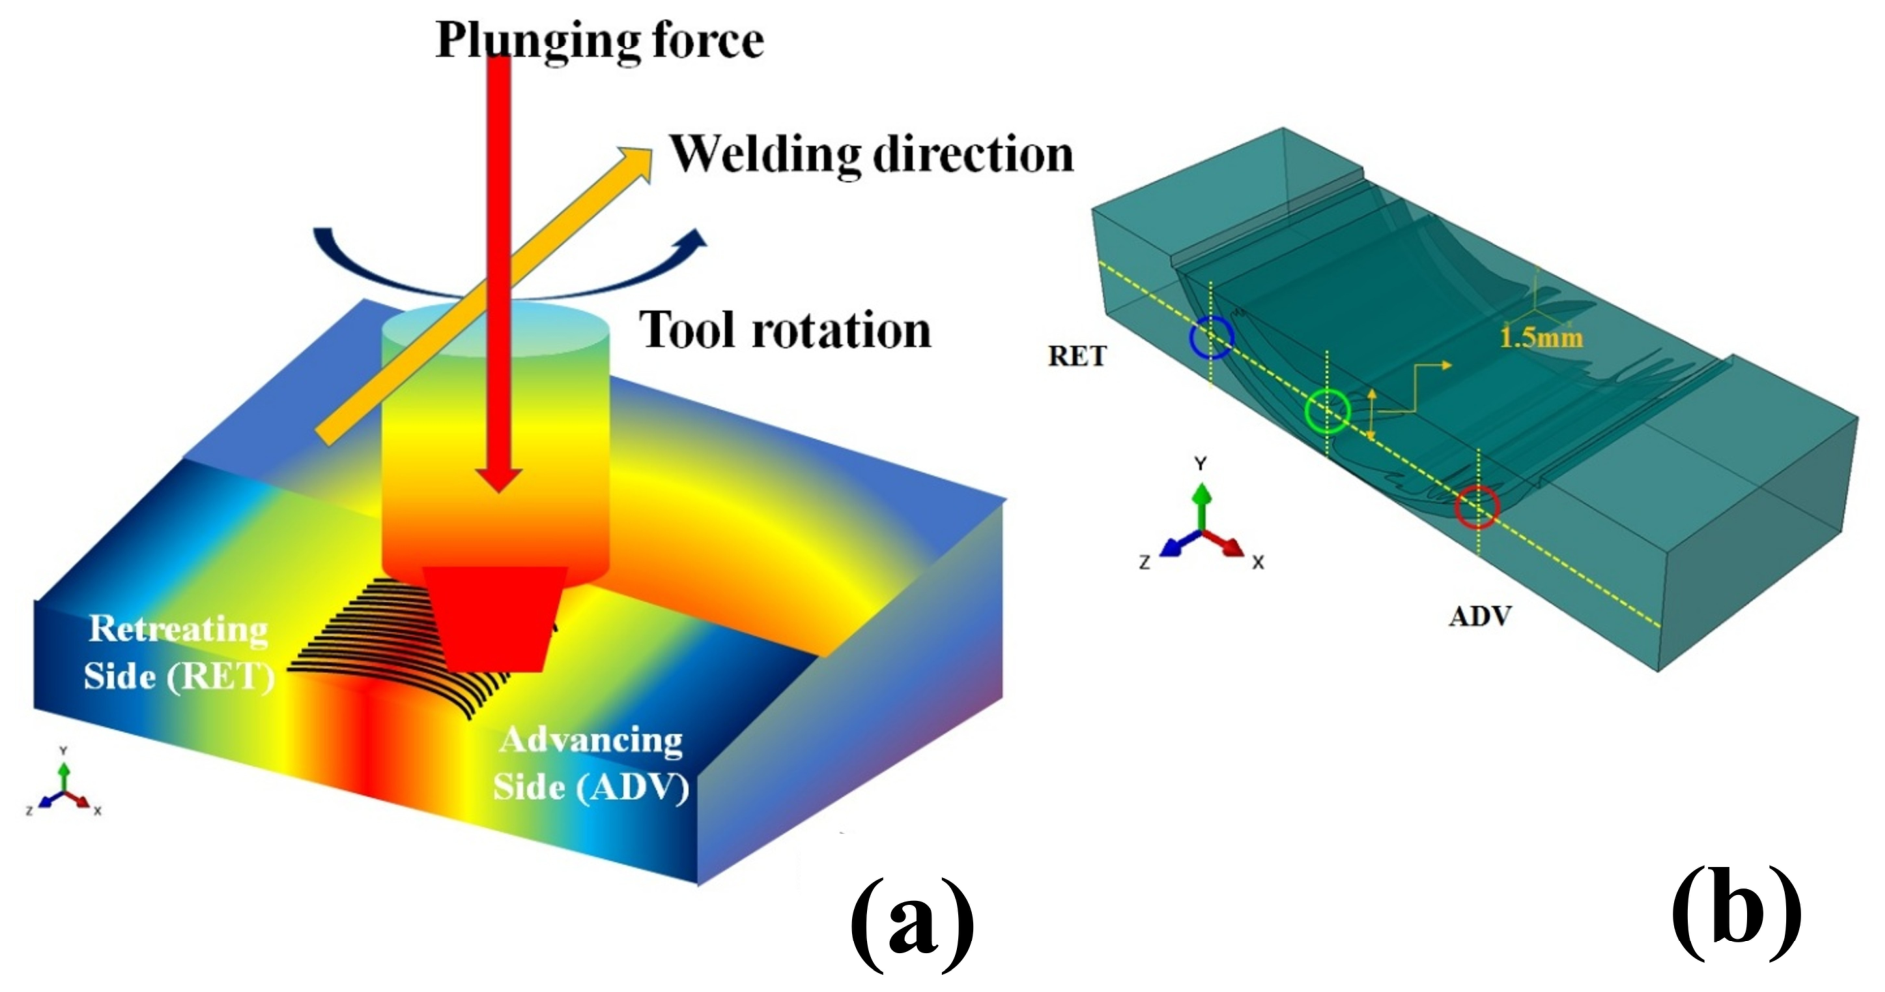


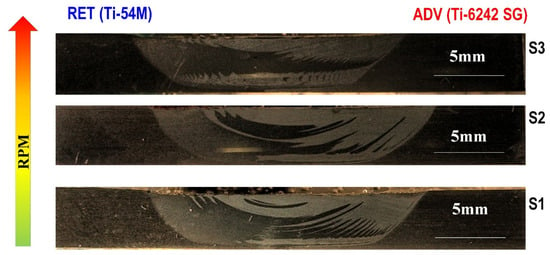
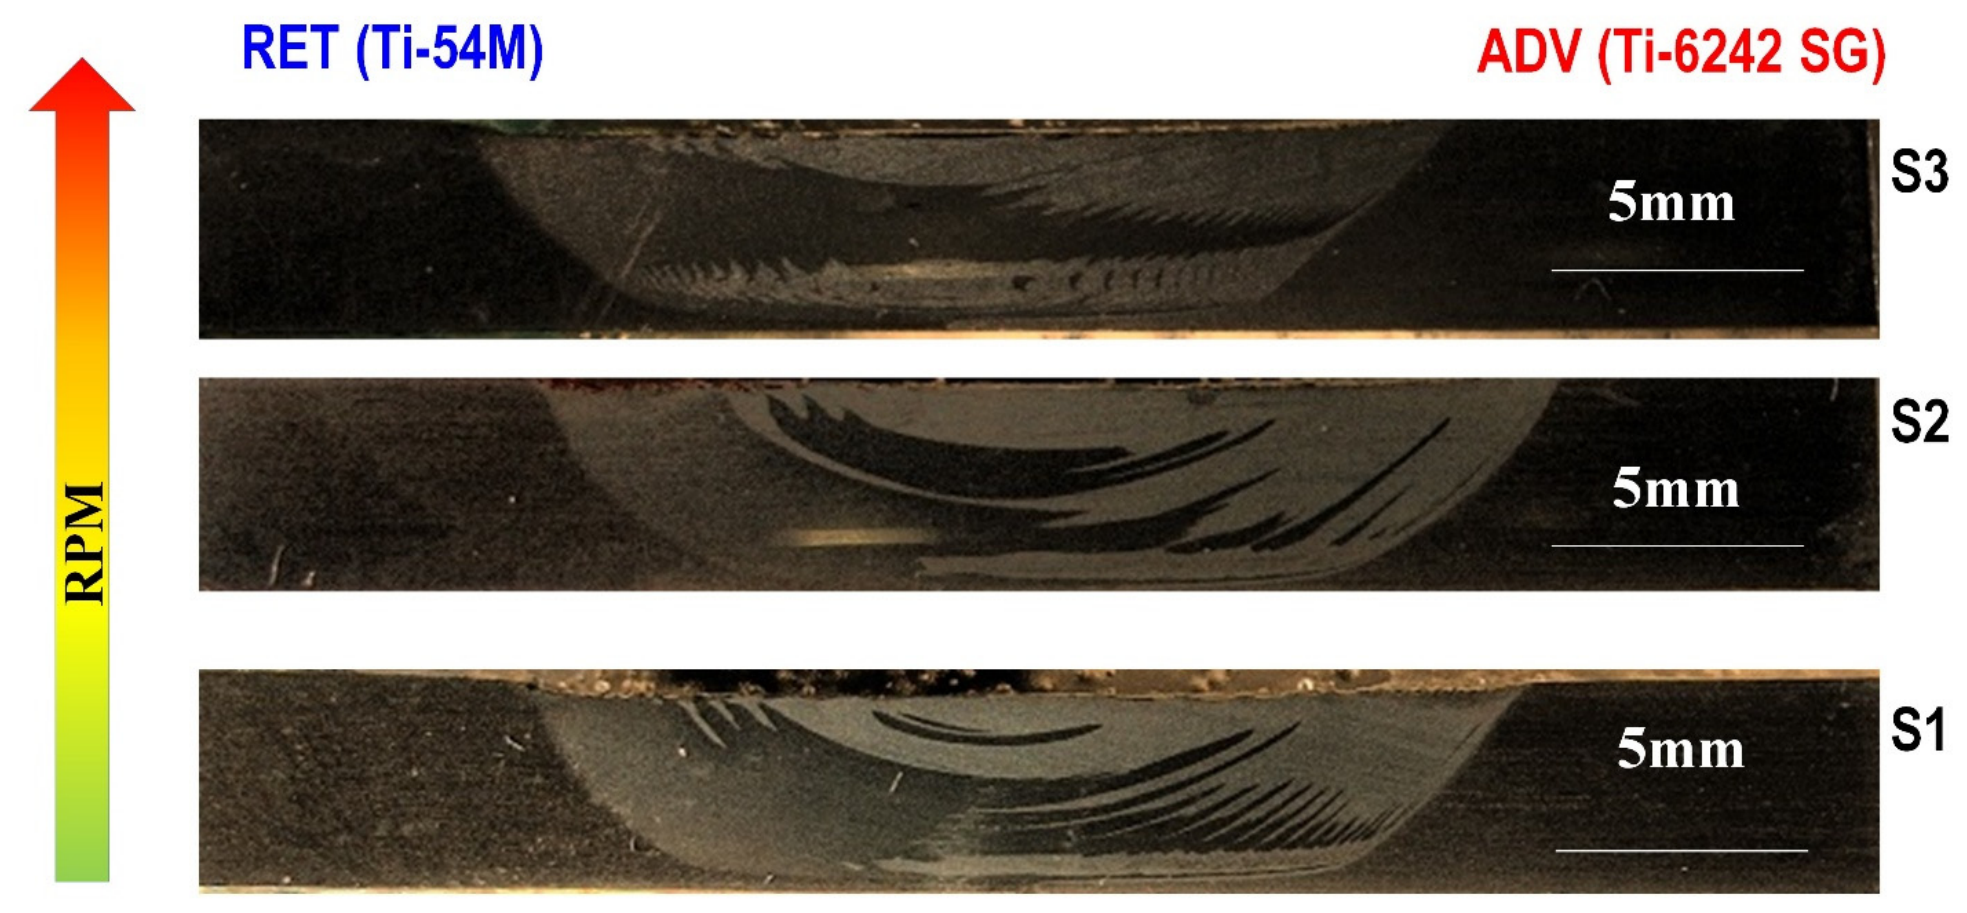
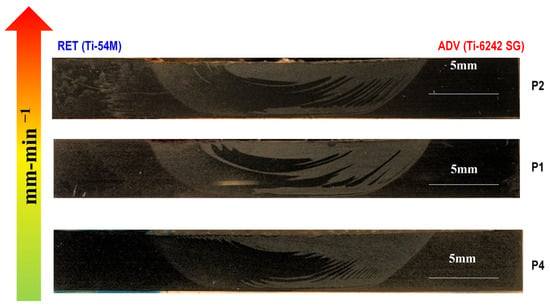
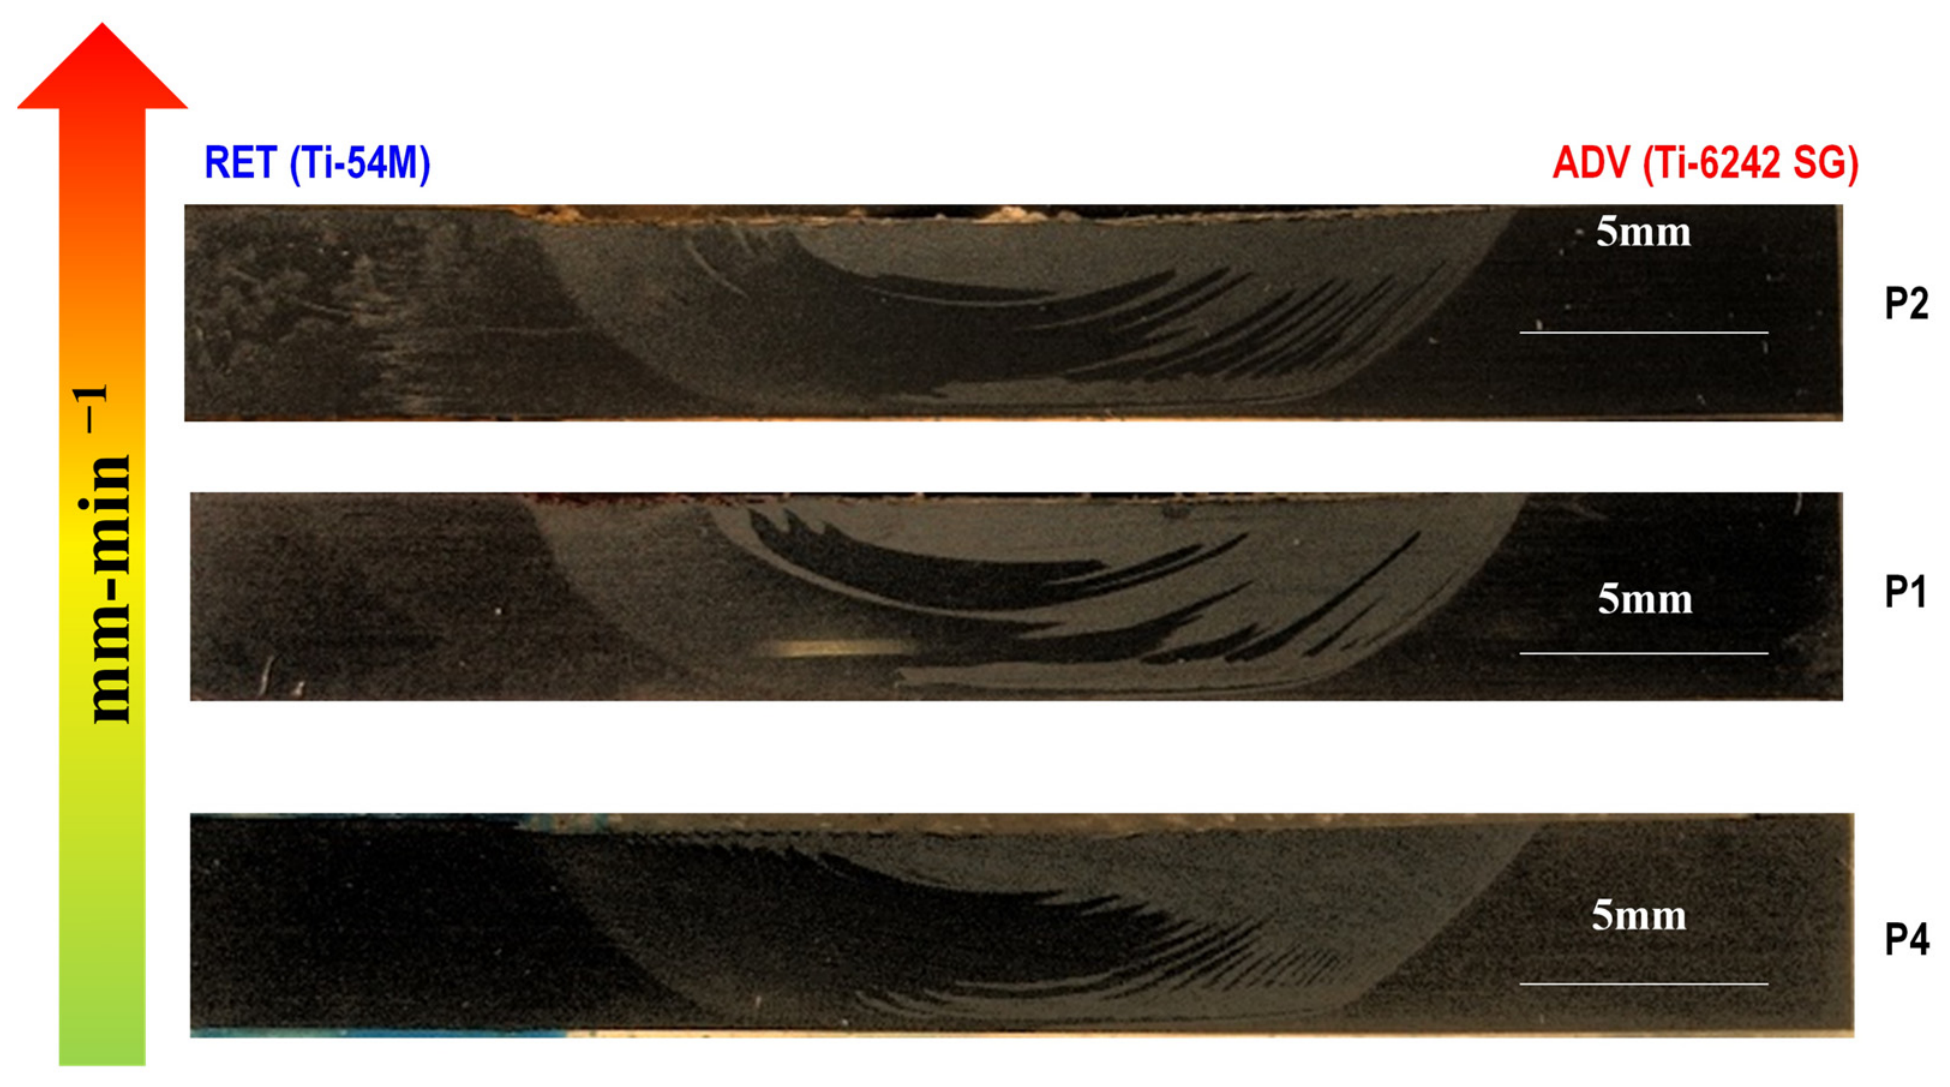
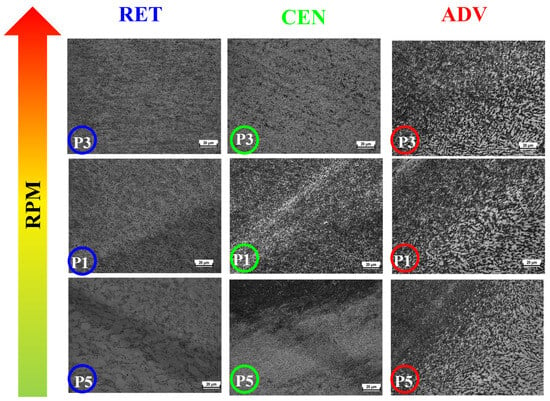
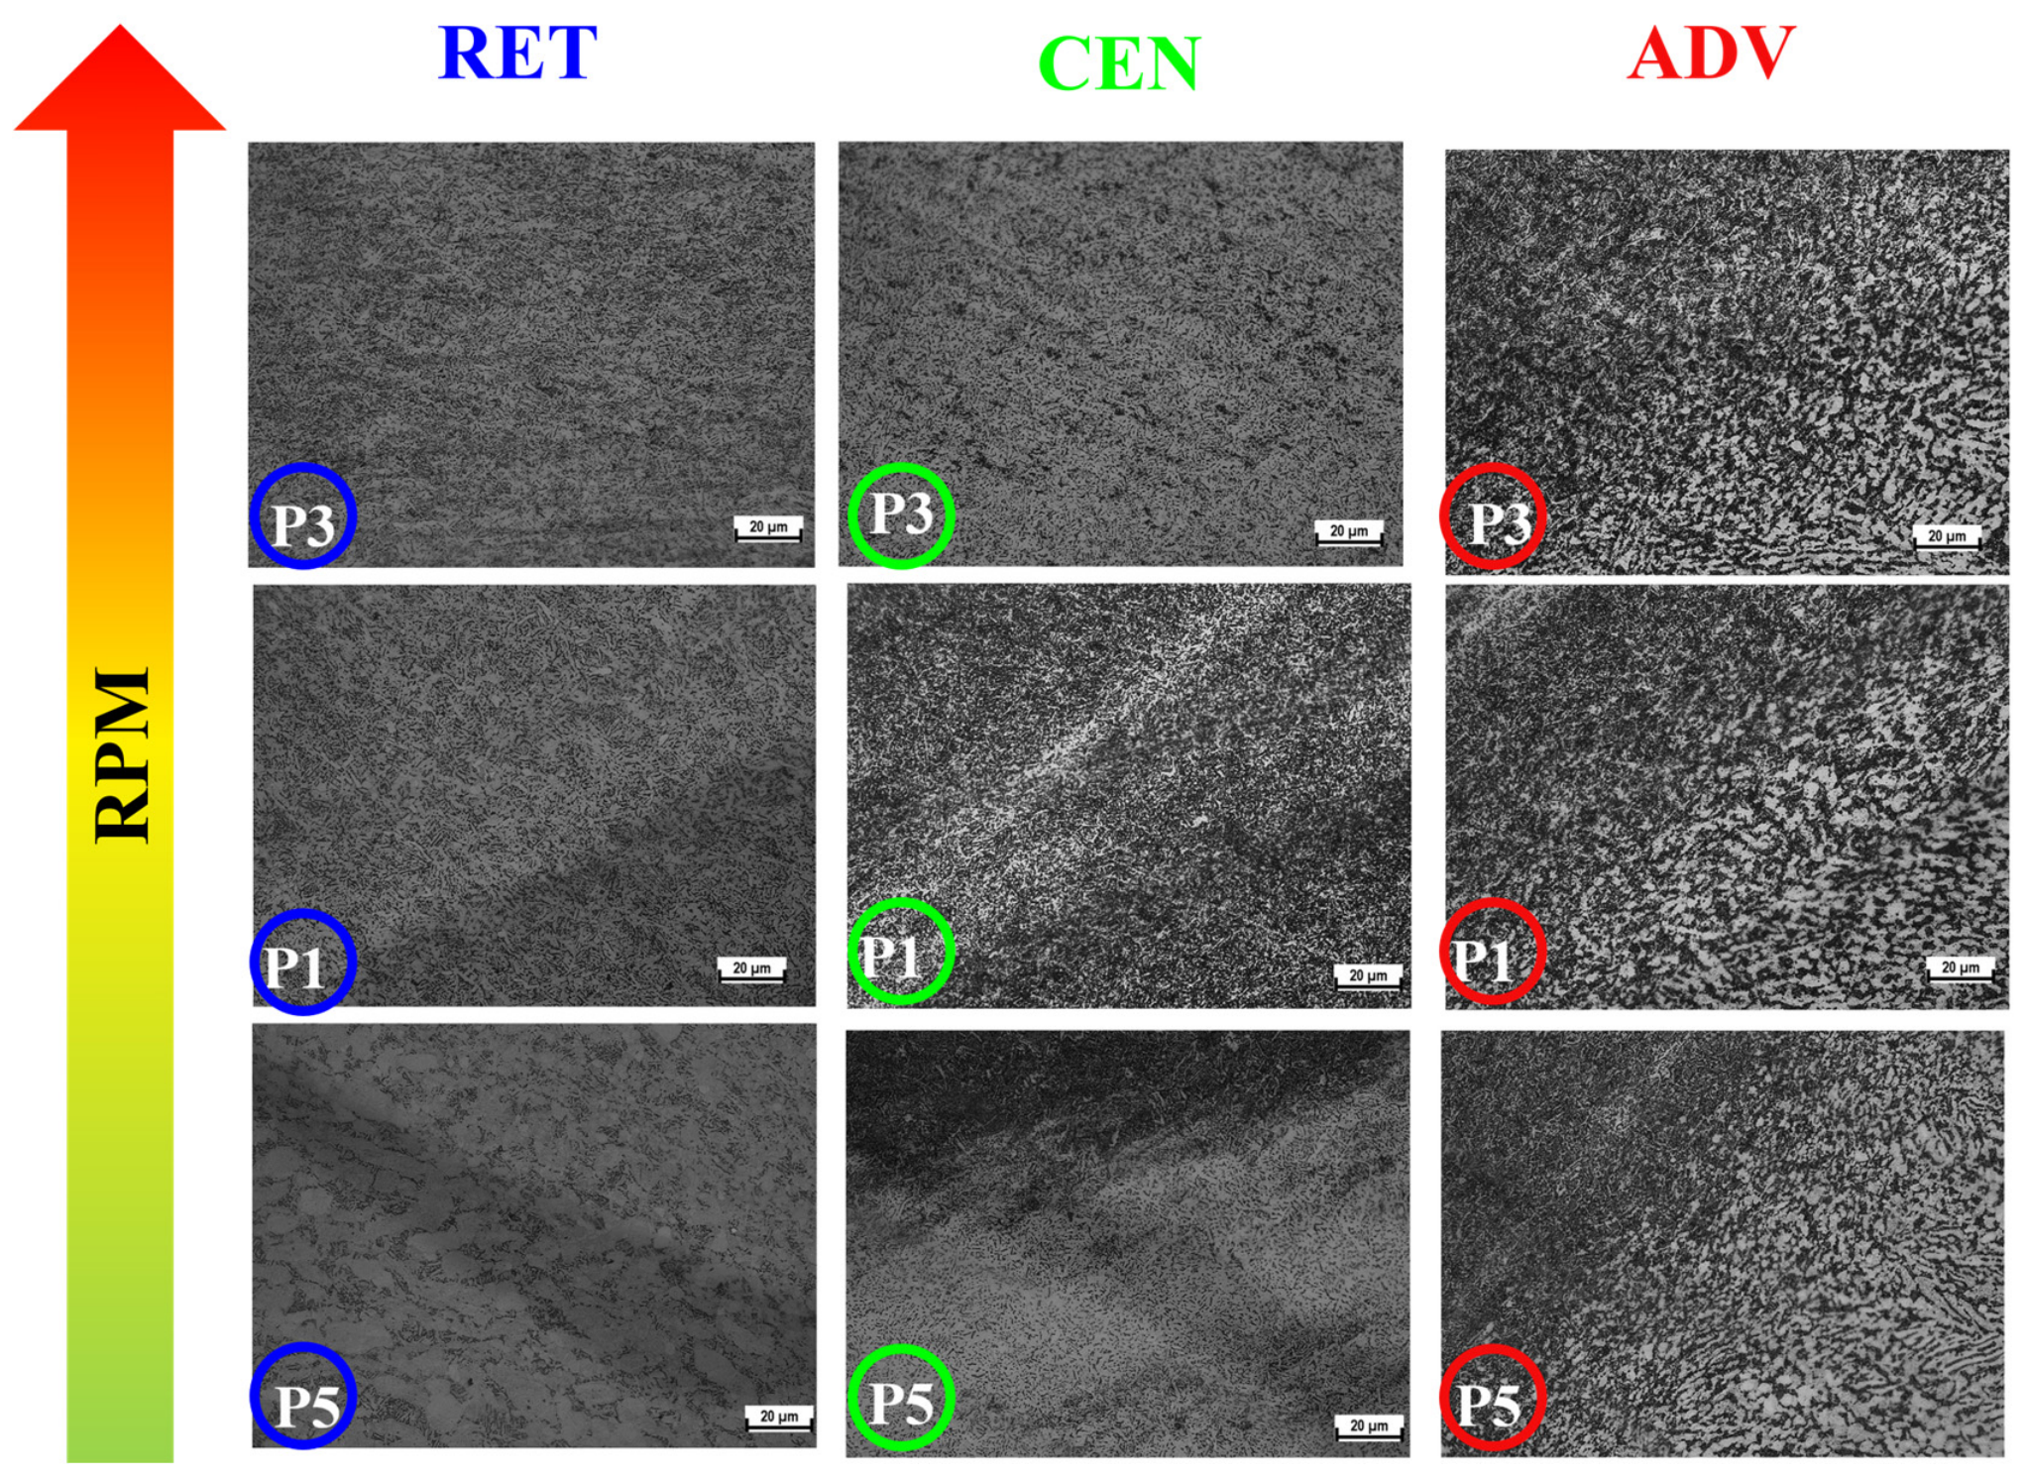
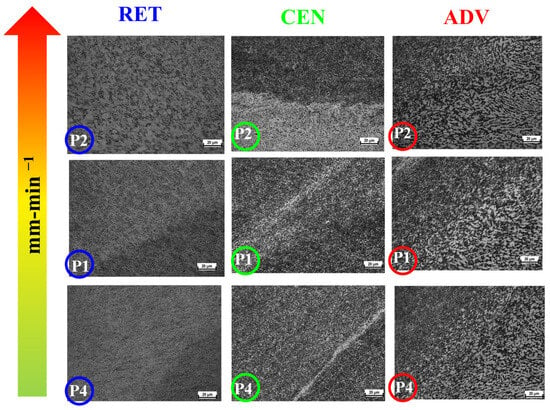
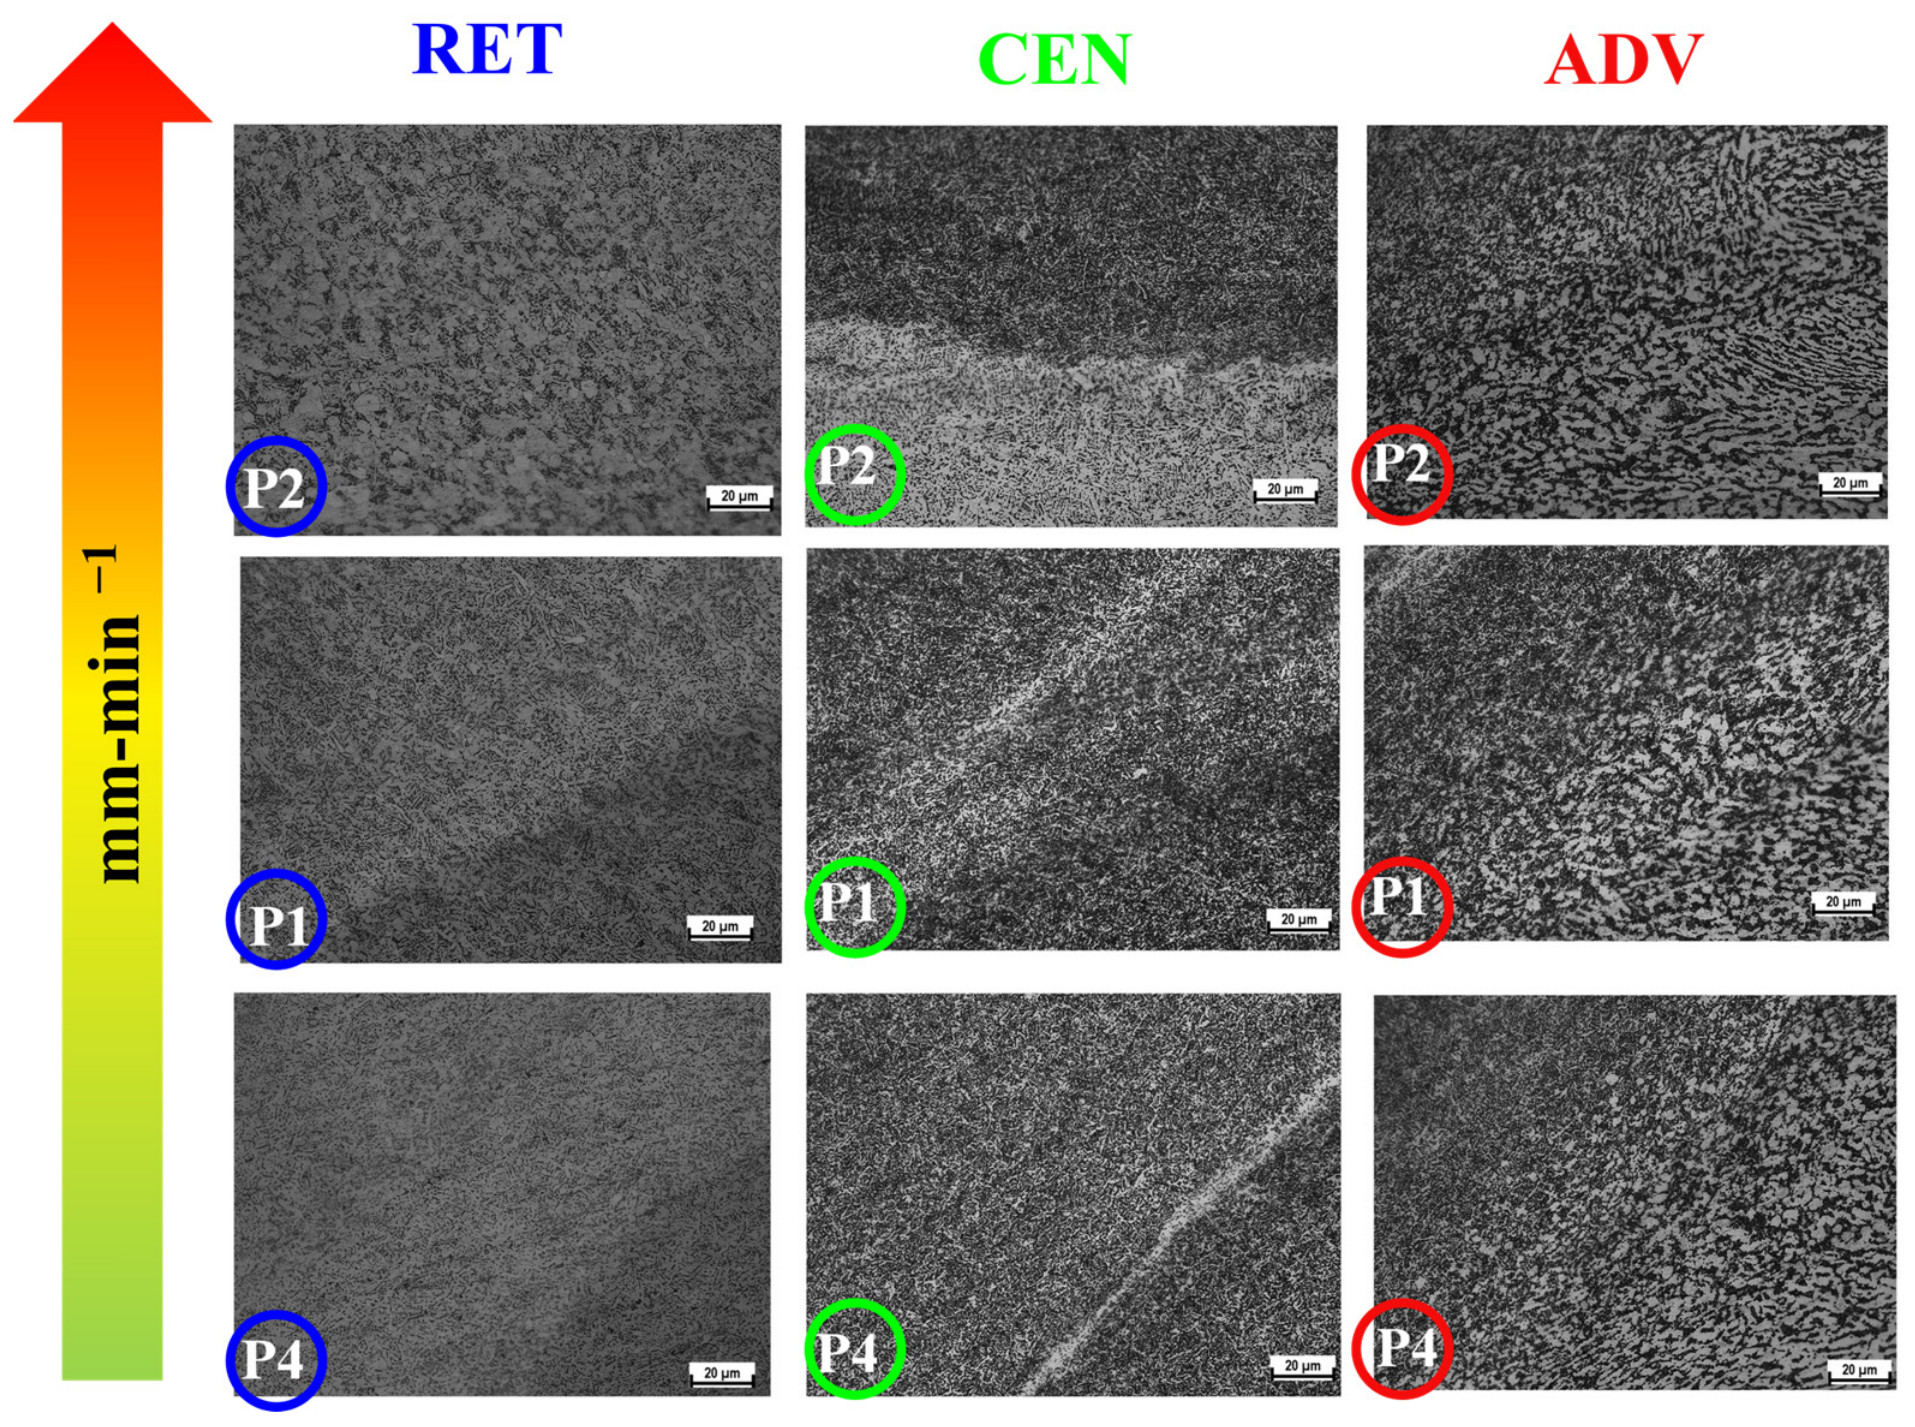
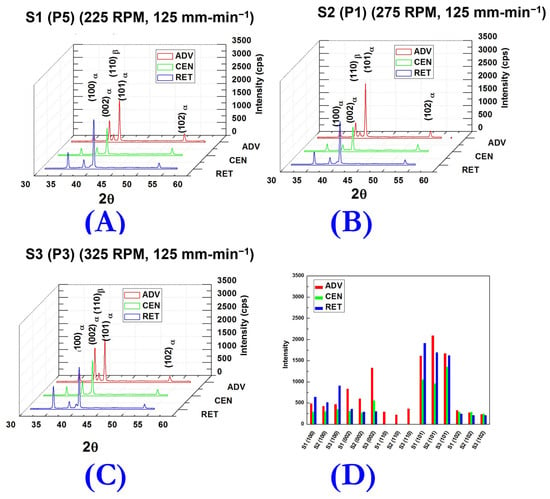
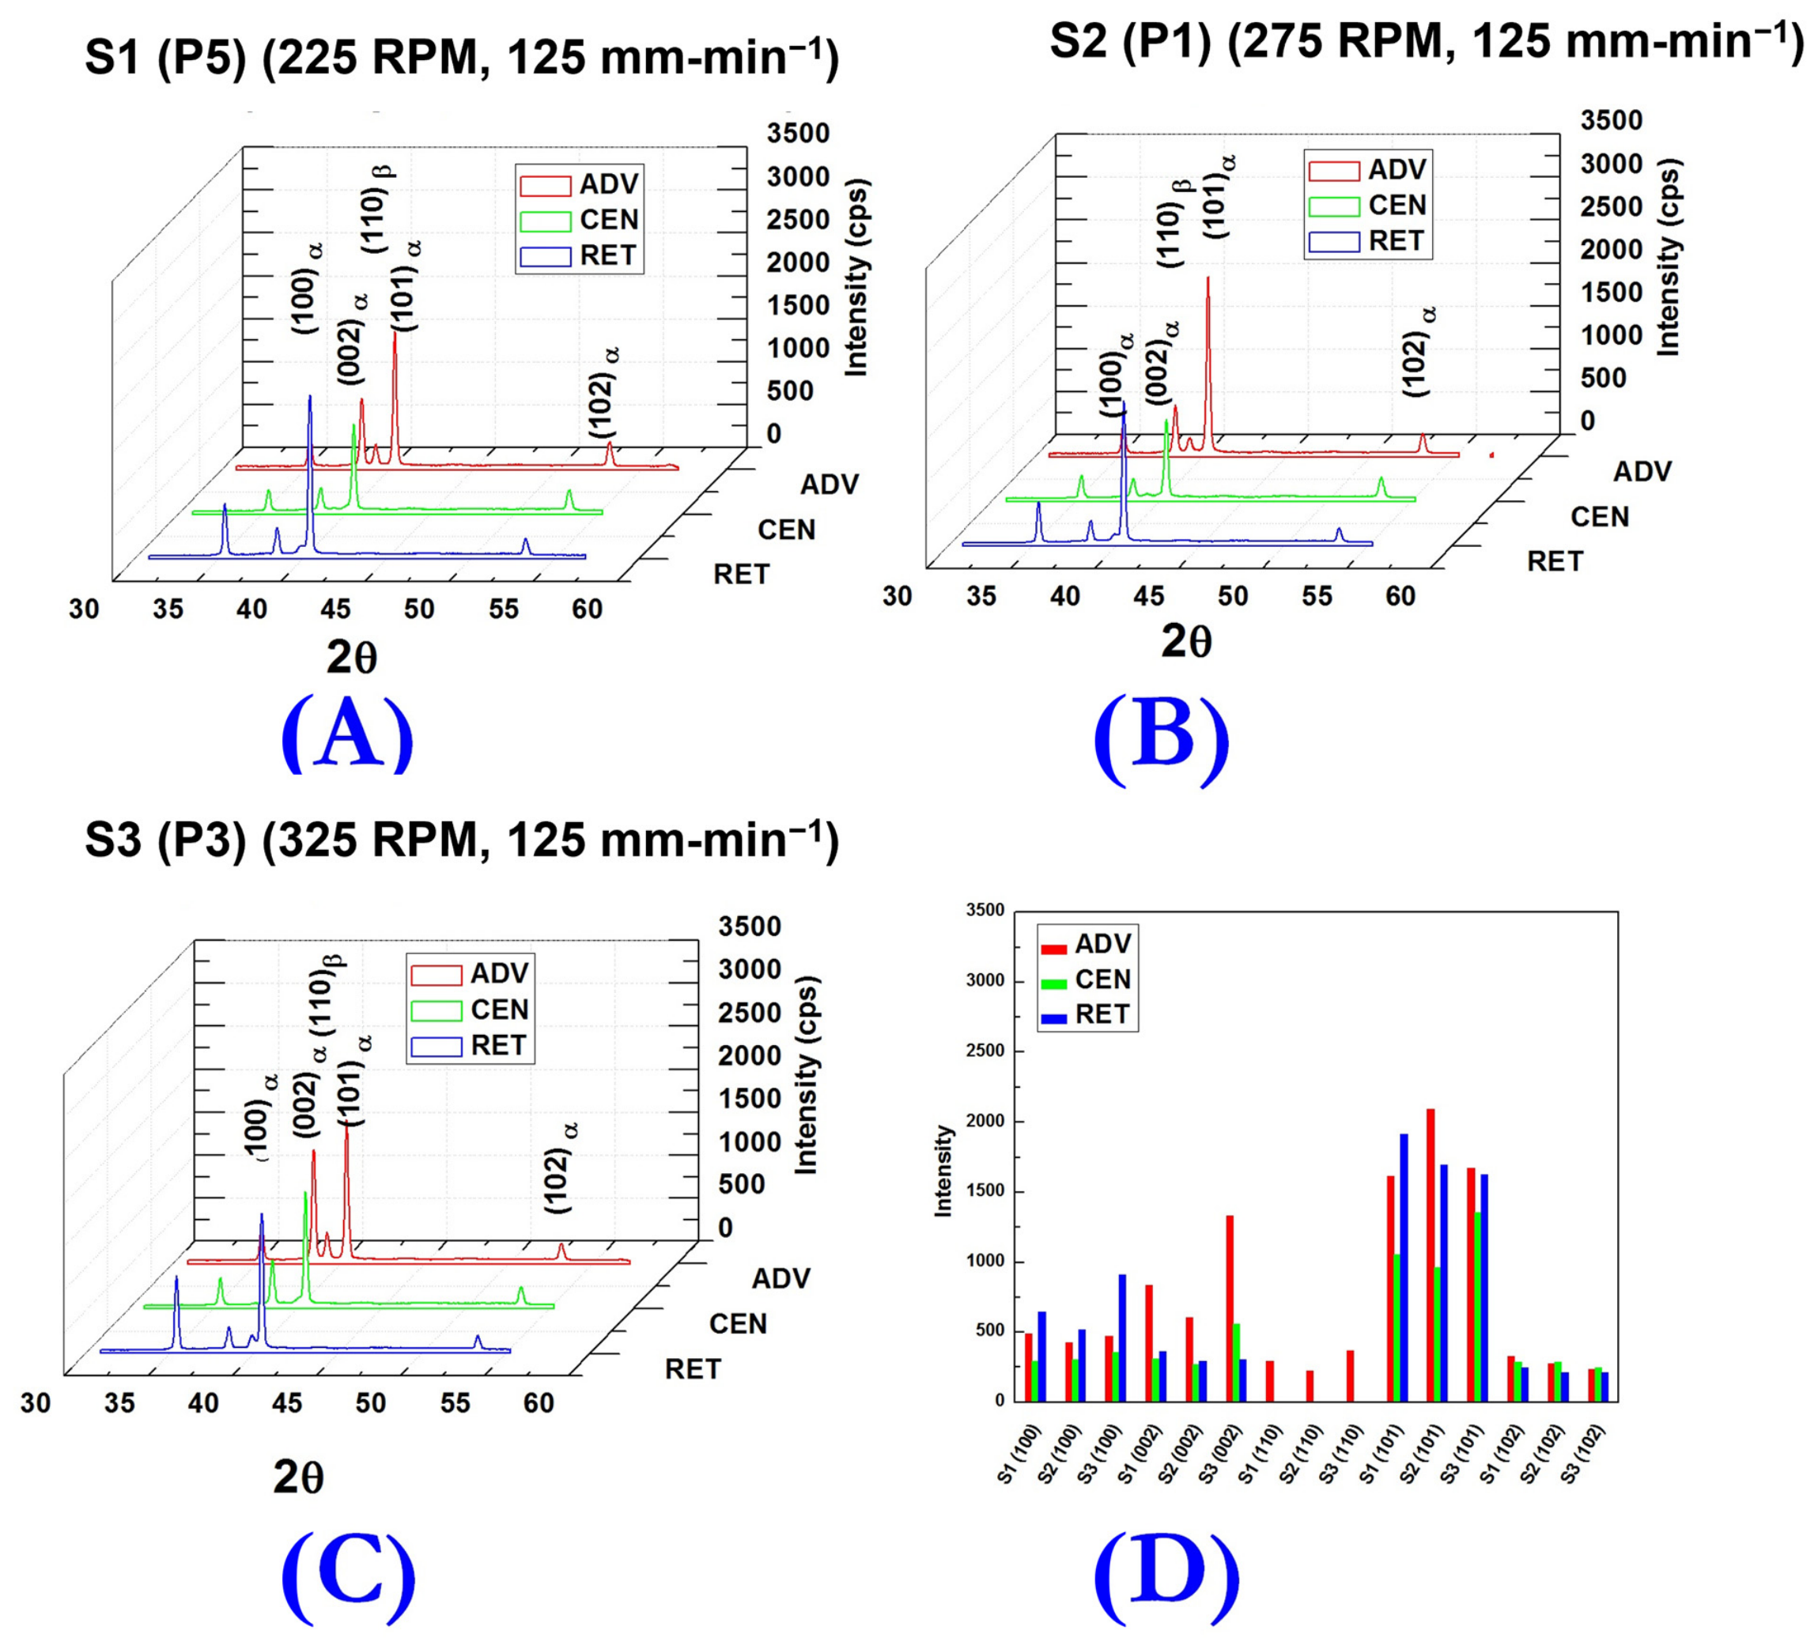
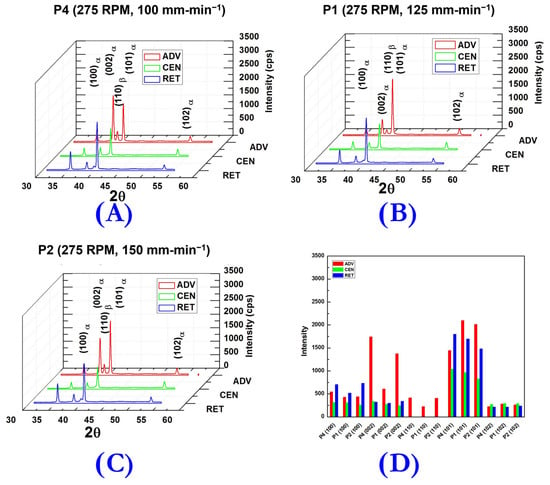
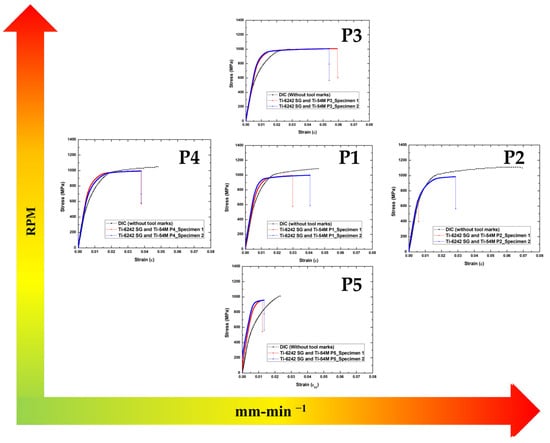
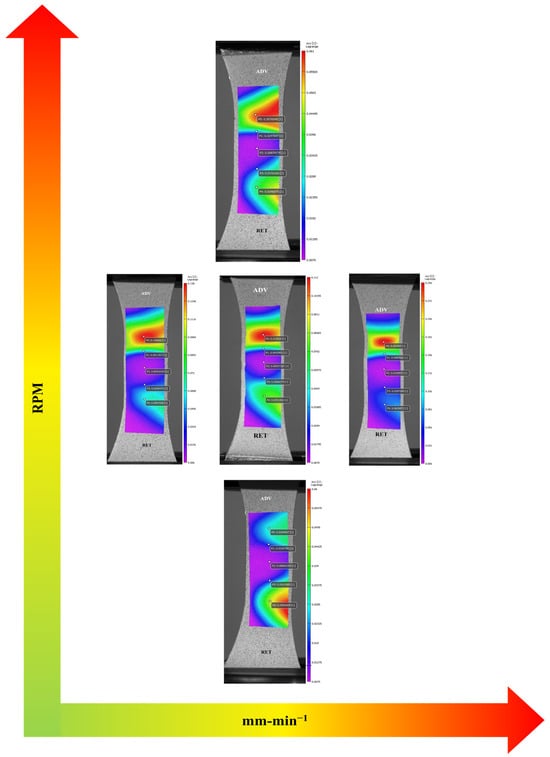
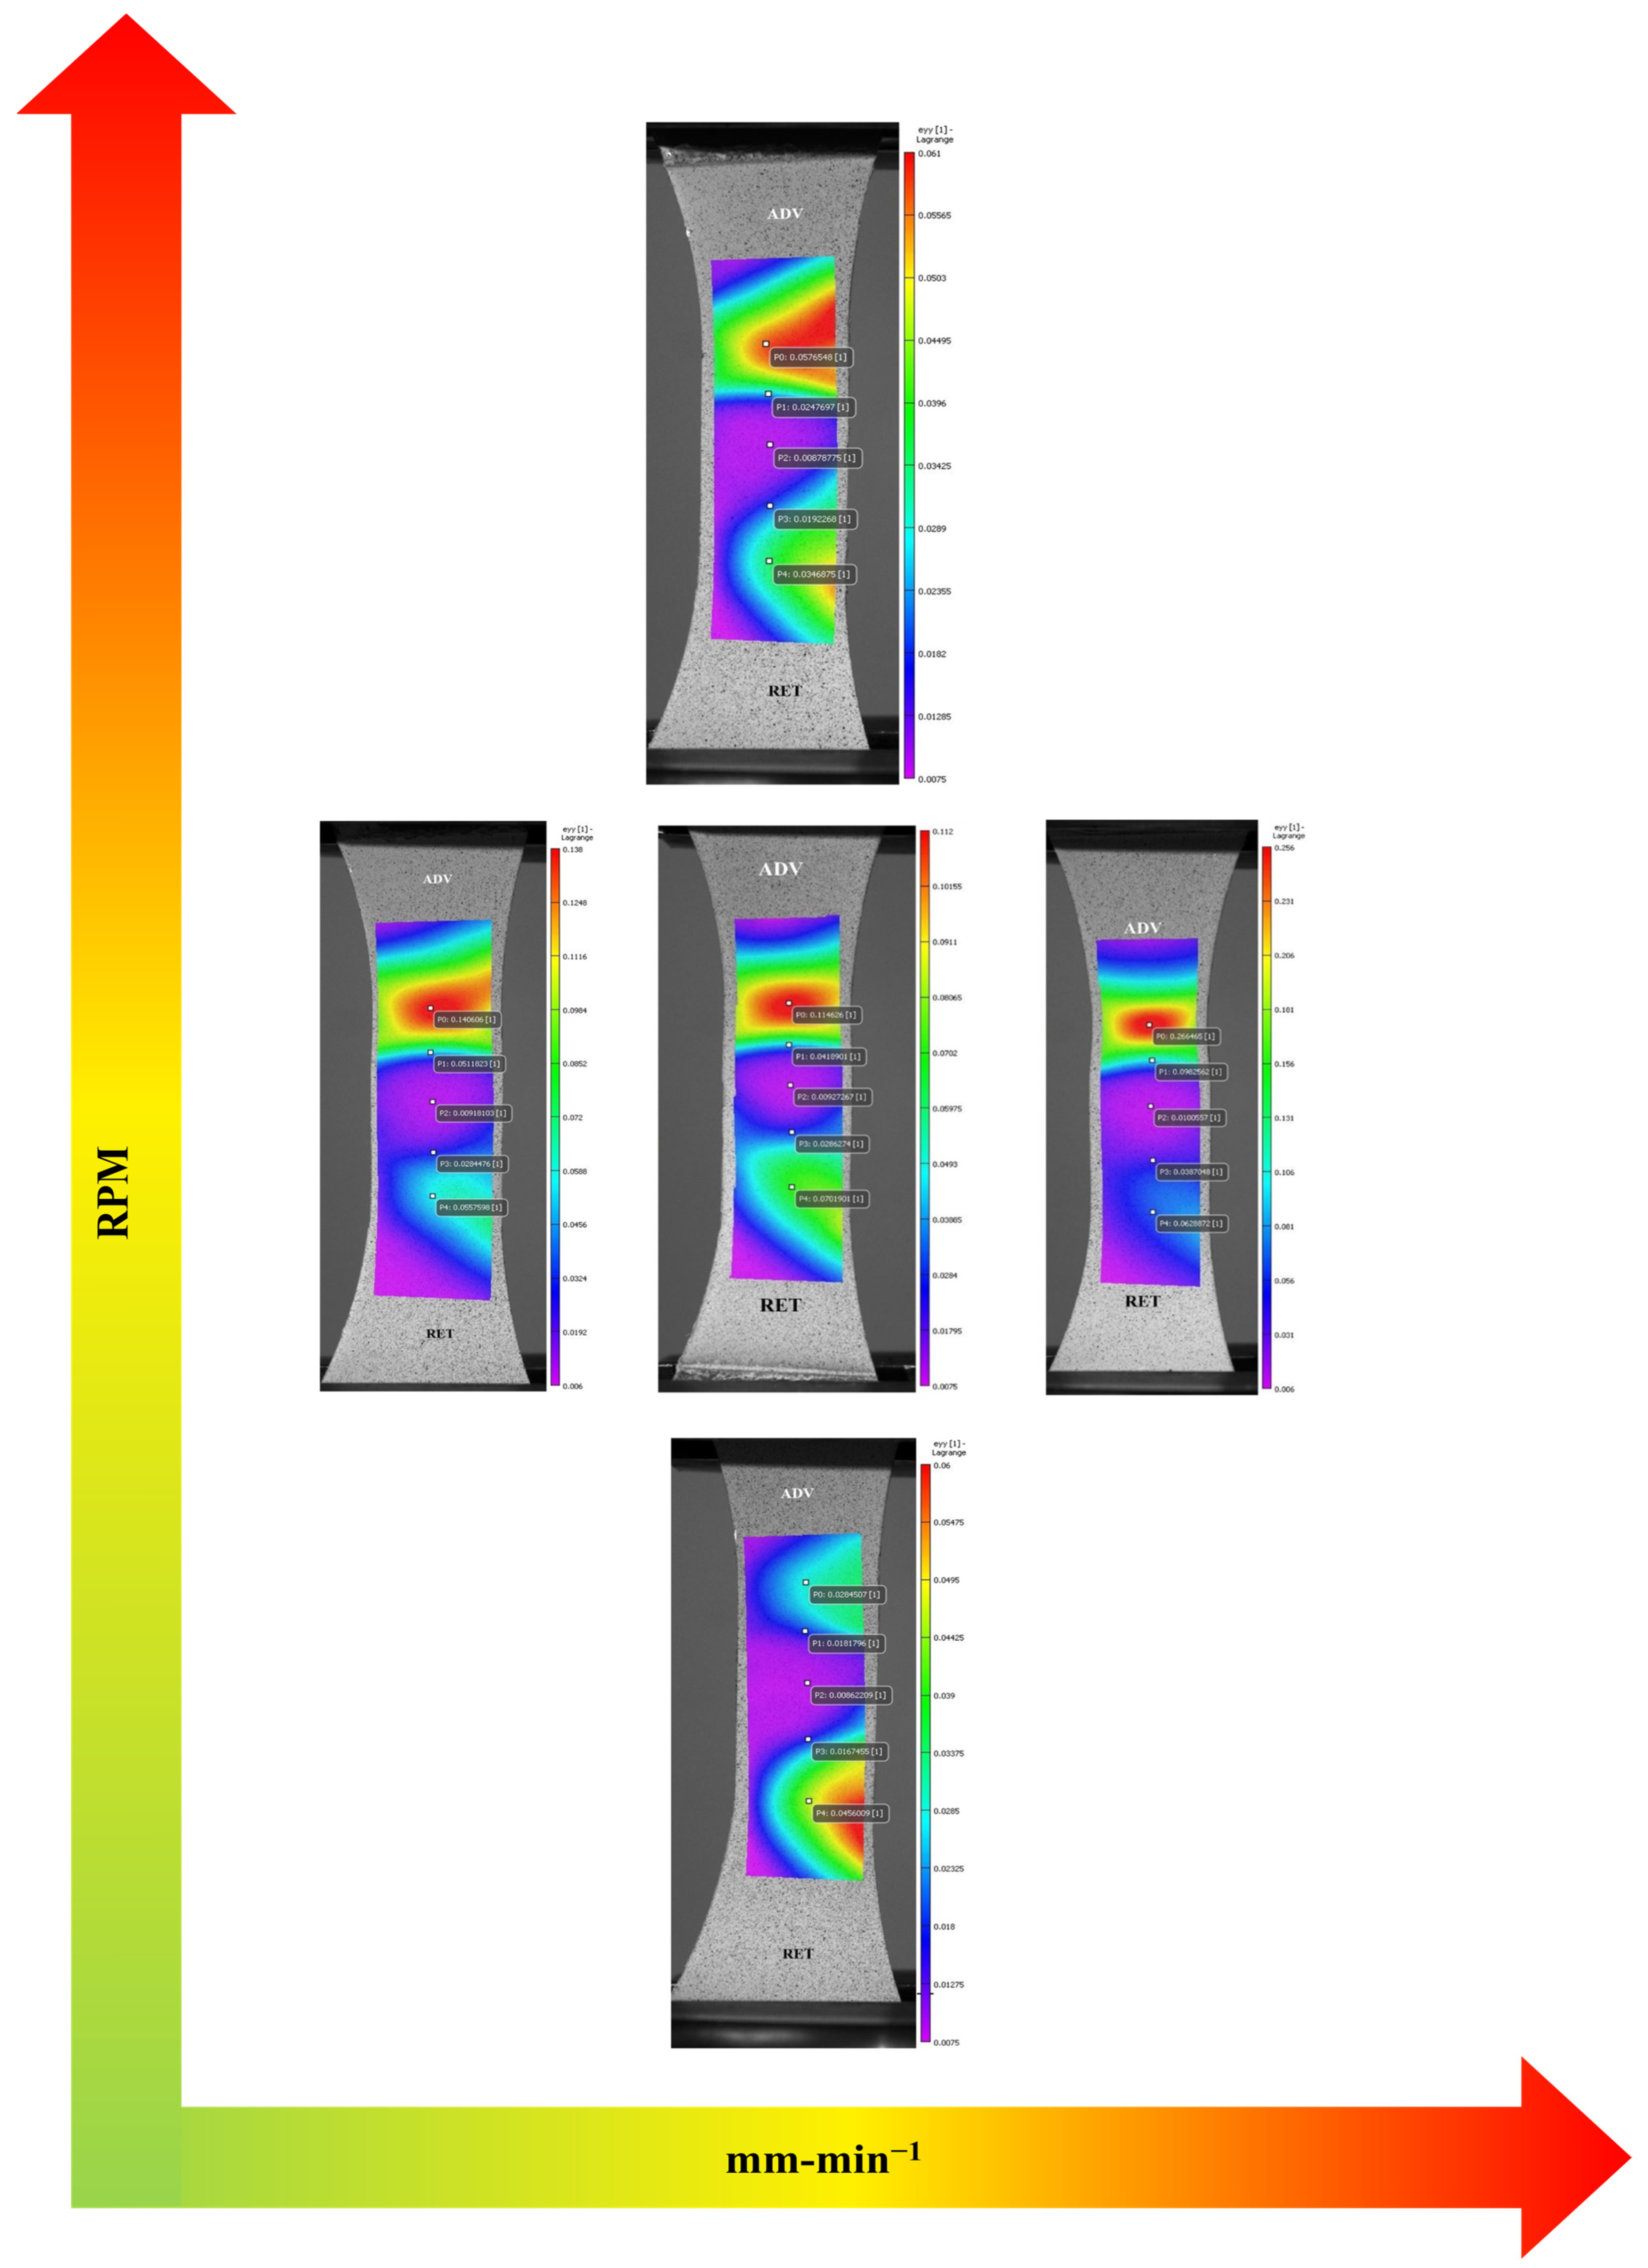
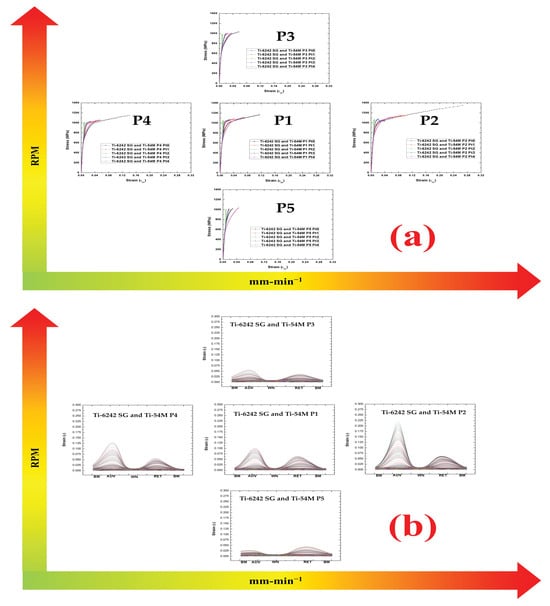
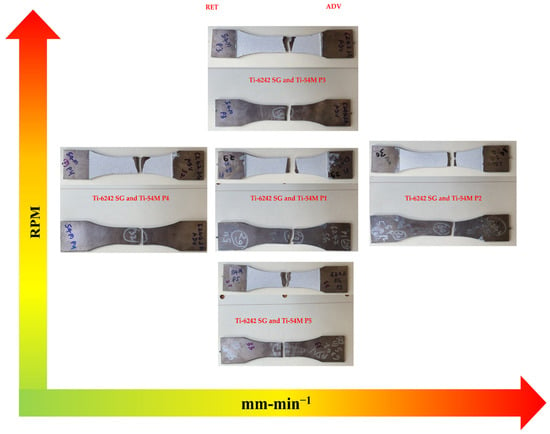
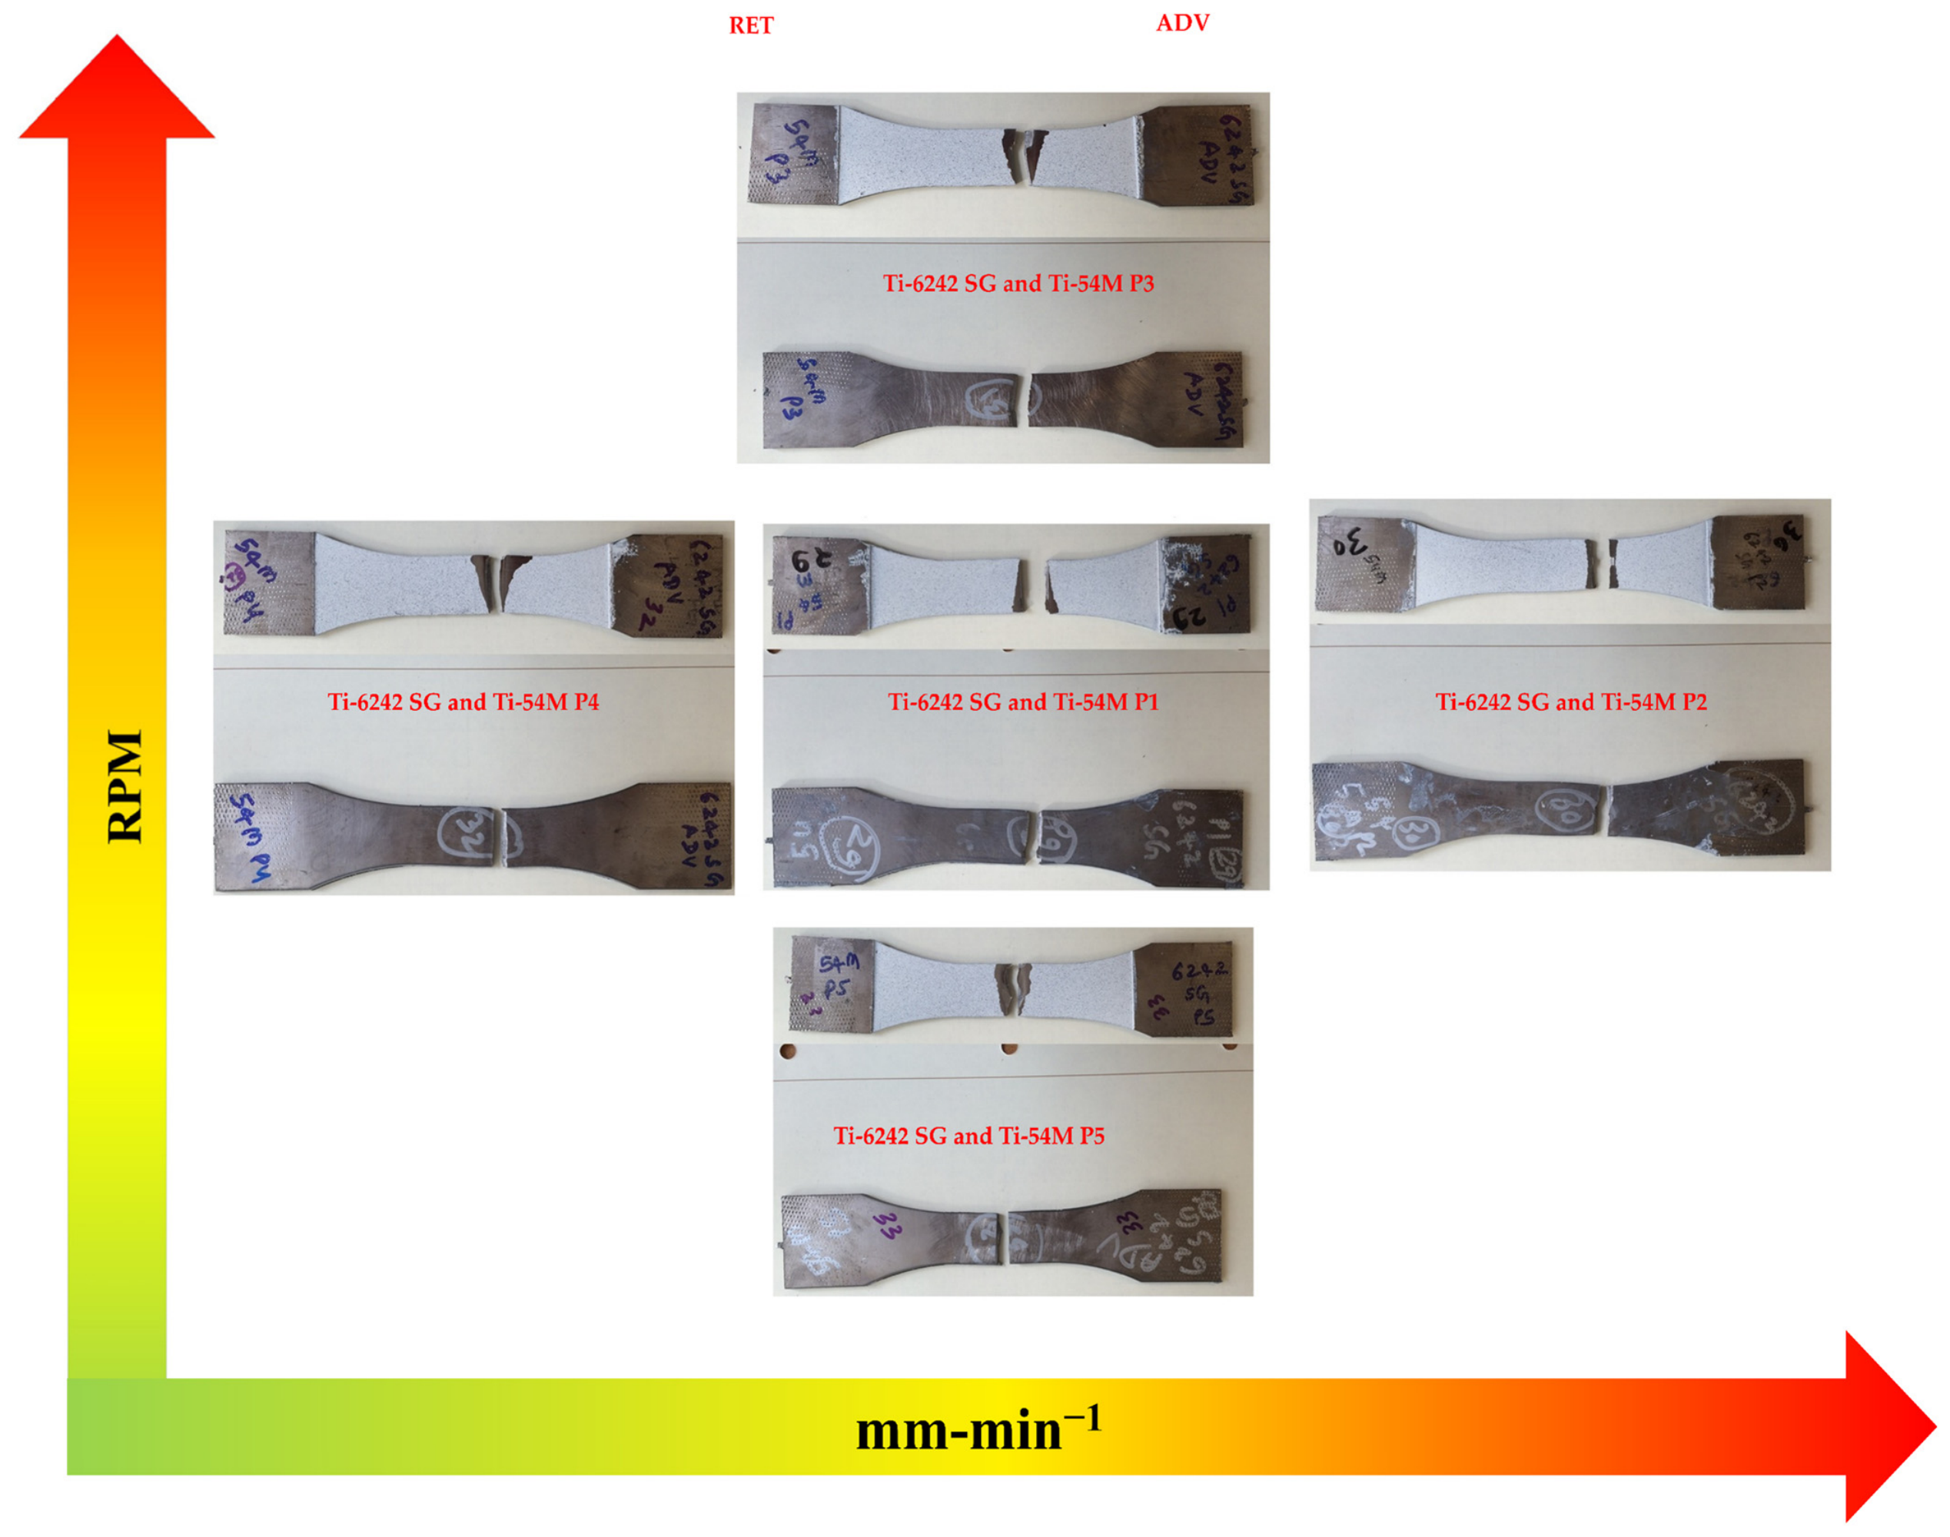
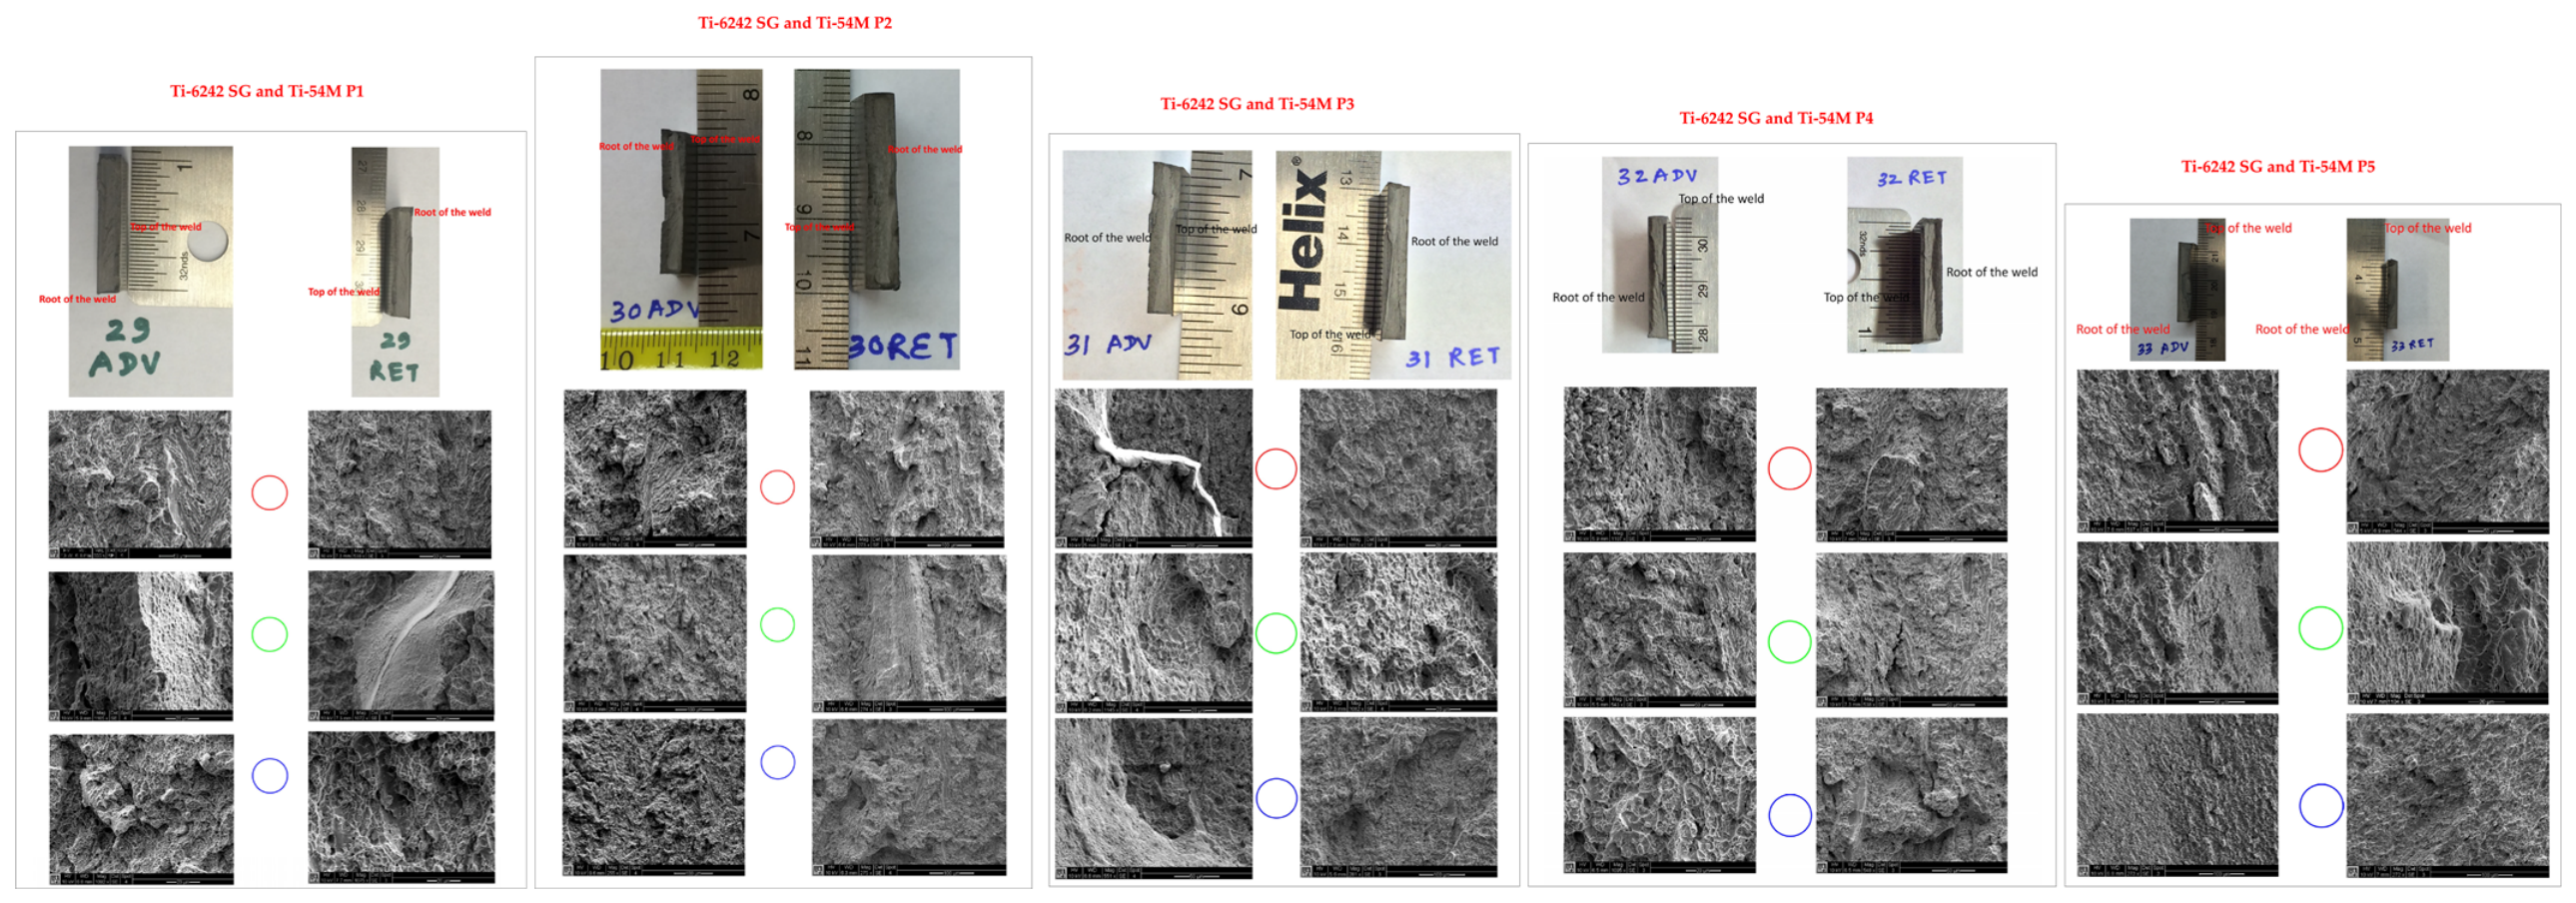

Disclaimer/Publisher’s Note: The statements, opinions and data contained in all publications are solely those of the individual author(s) and contributor(s) and not of MDPI and/or the editor(s). MDPI and/or the editor(s) disclaim responsibility for any injury to people or property resulting from any ideas, methods, instructions or products referred to in the content. |
© 2026 by the authors. Licensee MDPI, Basel, Switzerland. This article is an open access article distributed under the terms and conditions of the Creative Commons Attribution (CC BY) license.