


Abstract
A photogrammetry-based error compensation solution, comprising calibration, positioning compensation and accuracy validation methodologies, is presented to the aerospace sector, able to assist industrial robots in manufacturing new composite materials, offering versatility and reconfigurability at a lower cost than that resulting from the currently used milling machines. Against a ground truth measured by a laser tracker, it has boosted, in real time, the accuracy level from ±0.685 to ±0.203 mm, on average, and from ±1.621 to ±0.498 mm at peak, following the ISO 9283 standard, and from ±0.534 to ±0.080 mm, on average, and from ±1.804 to ±0.456 mm at peak, with a real part in a large volume under industrial operating conditions, taking into account occlusions and showing robustness against the impact of the payload, the waviness, and the backlash.
1. Introduction
The aerospace sector is progressively replacing traditional high-value-added metal parts with lighter and more efficient composite materials. These components are currently manufactured either manually or through the use of machining tools. Both methods lack competitive flexibility and require long processing times. Additionally, the former method is prone to errors that negatively impact productivity, even with operator guidance, and the latter only offers rigid configurations and requires a significant investment [1,2].
Industrial robots have emerged as a manufacturing alternative due to their inherent versatility, positional precision (±0.05 mm consistency of repeated measurements), and cost-effective efficiency [3,4]. They have the potential to provide greater adaptability to enable changes in production design and automation [5]. However, they provide an accuracy (closeness to true value) less than ±1.0 mm [6], which does not satisfy the tolerance requirements (±0.25 mm) for large-scale volumes in the aerospace sector [7]. To overcome this problem, three major techniques are commonly implemented: mechanical design, error compensation through mathematical models, and error compensation via external metrological tools.
The first two solutions, through either the mechanical design of the robot [8] or an implementation of a pre-calibrated error-compensation model [6,9], mitigate factors such as backlash, vibration dampening, kinematic errors, friction, thermal and payload effects, manufacturing tolerances, and structural deformations in machining. The latest achievements using this kind of solution have led to improvements in accuracy of up to ±0.3 mm [6,9]. However, this method suffers from a poor cost-effectiveness ratio, and is very dependent on the specific robot model, requiring recalibration whenever the machine is modified.
The third technique comprises the use of external metrological tools such as laser trackers (LTs) and portable optical coordinate measurement machines (CMMs) to enhance the robot’s accuracy using tracking trajectories. LTs are primarily used to calibrate robots, estimating their position in three degrees of freedom (3-DoF), but they suffer from a poor cost-effectiveness ratio [10,11]. Optical CMMs, instead, are widely employed to estimate the 6-DoF pose [12,13]. Both techniques can achieve the same level of accuracy as that of the first two solutions but lack versatility due to eventual occlusions between the sensor and the spherically mounted retroreflector (SMR).
In the context of this third approach, photogrammetry systems are emerging as competitive tools to enhance the accuracy of robots. This technology, thanks to retroreflective markers attached to the tracked elements, enables 6-DoF tracking with a richer cost-effectiveness ratio [10,14]. The most recent examples have achieved significant improvements, reducing measurement errors to approximately ±0.3 mm, but primarily in small working volumes (500 × 500 × 500 mm3) and non-industrial environments [15,16].
Recent studies have further highlighted the importance of accuracy-enhanced calibration and error-compensation strategies for industrial robots operating in large workspaces and under heavy payloads, including hybrid measurement systems for large-scale components [17,18].
In this paper, a photogrammetric system is integrated into an industrial robotic milling machine to boost its positioning accuracy. The system is deployed in a PPE-required industrial deburring/machining environment and tracks a 50 kg machining head, which significantly increases compliance and disturbance levels compared to the results for typical laboratory setups. The measuring error of the resulting solution is characterised by several standardised tests under severe industrial conditions and in large-scale volumes typical of aerospace sector, demonstrating its potential to fulfil the requirements of this sector. Effectively, the developed solution provides real-time compensation measurements of 6-DoF robot poses with an accuracy of approximately ±0.2 mm in a working volume of 4000 × 2500 × 1500 mm3, i.e., substantially larger than the sub-meter workspaces typically reported for photogrammetry-based robot-correction studies, making it versatile for a wide range of manufacturable parts. To achieve this, this work focuses on identifying the calibration processes associated with error compensation and defining a validation methodology, using an LT as ground truth, for an industrial robotic solution. This validation is performed across the full workspace and complemented with real-part aerospace trajectories, providing an application-level assessment beyond controlled laboratory demonstrations. The solution offers a practical implementation and a significantly lower-cost sensing alternative compared to those of laser-tracker-based solutions, while maintaining industrial usability in large workspaces. Its implementation is successfully demonstrated via a high technology-readiness level (TRL) fully operational and functional industrial robotic milling machine across its entire working volume.
2. Materials and Methods
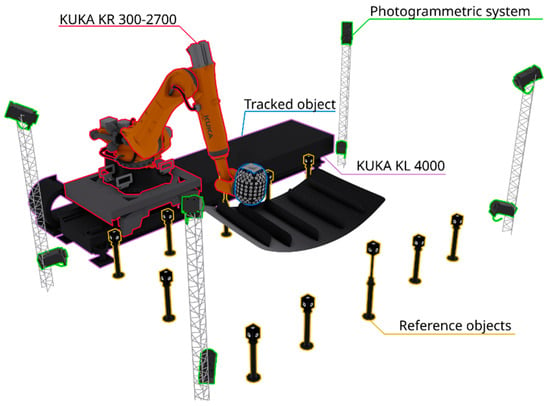
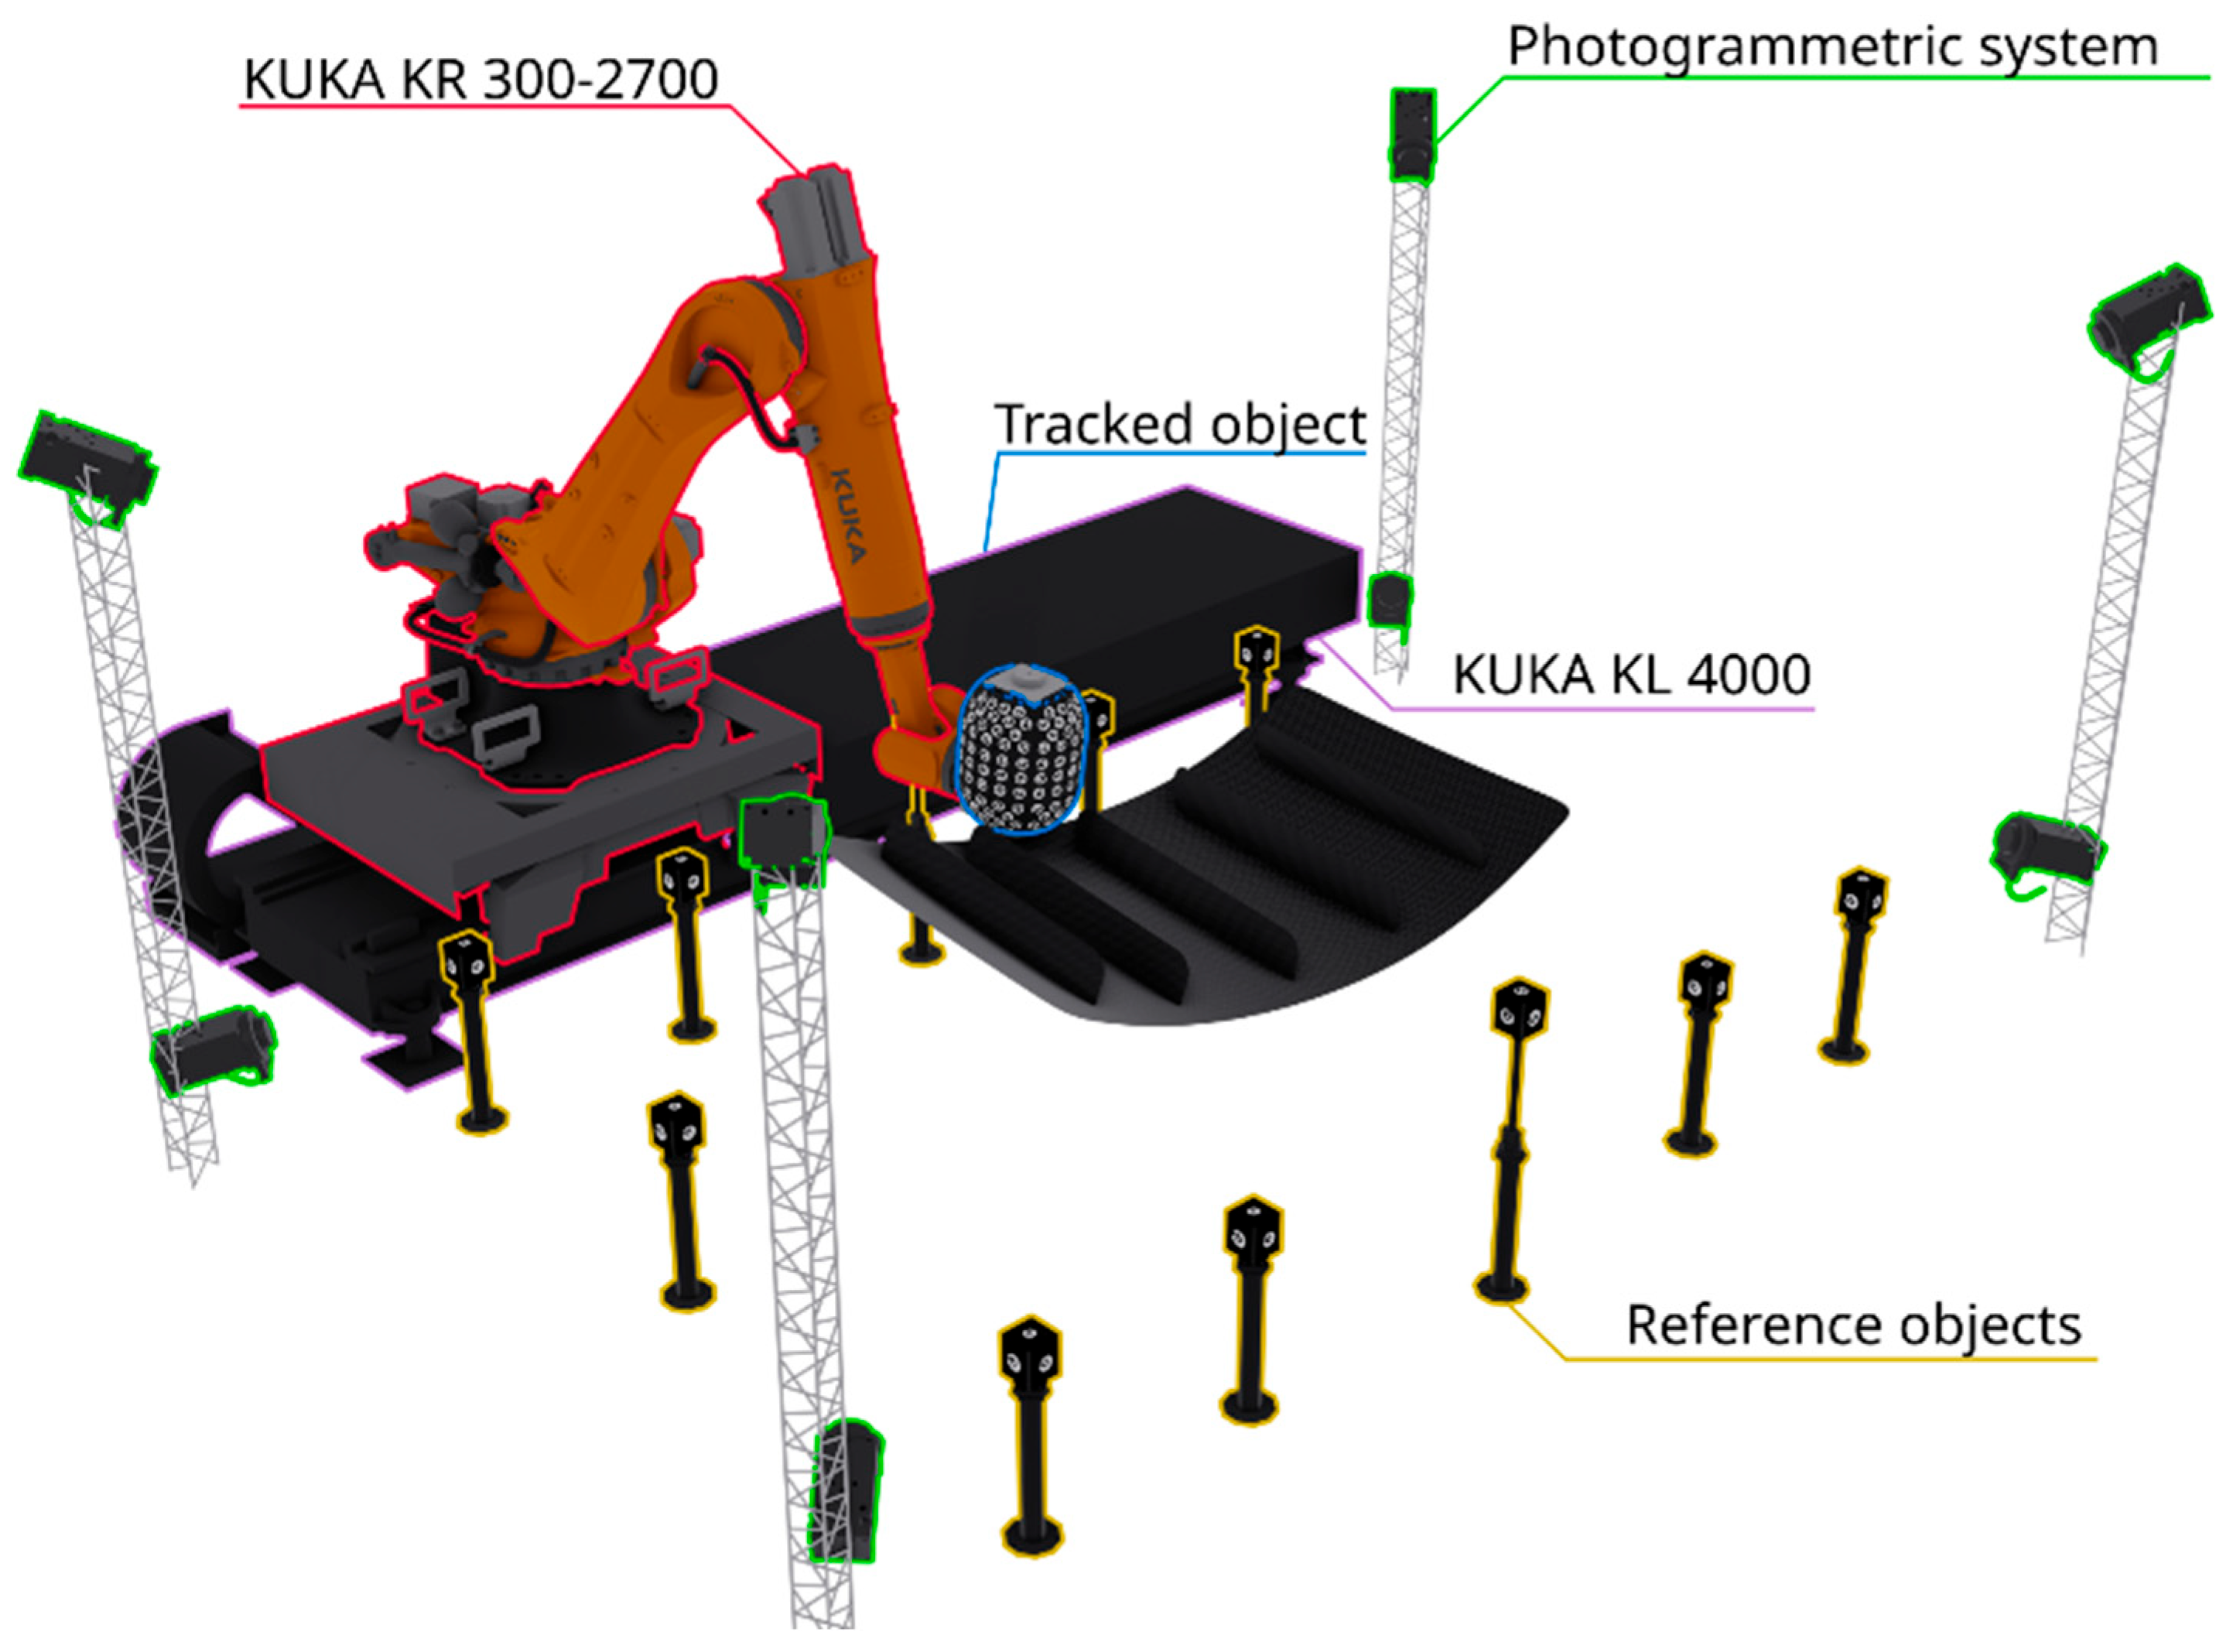
Figure 1 shows the robotic milling machine employed in this paper. It is composed of an industrial robot KUKA KR 300-2700 (Augburg, Germany), whose reach length is 2.7 m and pose repeatability is ±0.050 mm (according to ISO 9283 standards [19]), and an industrial track robot KUKA KL 4000 (Augburg, Germany), which spans 4 m and has a positioning precision of ±0.020 mm. We endow it with a photogrammetric system comprising eight industrial vision instruments. Each one is comprised of a 12.4-Mpx Teledyne DALSA Genie Nano 4020 camera (Waterloo, ON, Canada), a 16-mm Schneider Optics APO Xenoplan 2.8 lens (Kreuznach, Germany), and a DCM ALB0810A LED illumination (Ribarroja del Turia, Spain). These devices are enclosed in a protective housing specifically designed for hostile machining industrial environments (i.e., an industrial deburring/machining environment requiring PPE due to airborne chips and hazardous dust/aerosols). To link the robotic system and the photogrammetric system, an enclosure has specifically been designed with targets (tracked object, cf. Figure 1), mounted on the 50-kg machining head of the robot.
Figure 1.
Robotic milling machine employed in this paper.
2.1. Calibration Processes
Ensuring an accurately calibrated scene is fundamental to the performance of the photogrammetric system and hence, to the accuracy achievable by robotic operations, as demonstrated by [14].
The first stage of the calibration process consists of calibrating each vision system individually. The intrinsic parameters of the camera-lens sets are calculated following the procedure by [14].
Second, all fiducial markers placed in the scene (reference objects, cf. Figure 1) need to be initially measured, since the calculation of the extrinsic parameters of the cameras (rotation and translation) relies on them. To accomplish this, VSET© (Bergara, Spain), a portable photogrammetry tool, is employed, with an accuracy of ±0.05 mm + 0.02 mm/m according to the VDI 2634-part1 standard [20].
Third, the distance between the coordinate frame of the tool tip and the machine head, necessary to link the robotic system to the photogrammetric system, was measured using a Zoller Smile machine (Pleidelsheim, Germany), which has an accuracy of 0.002 mm.
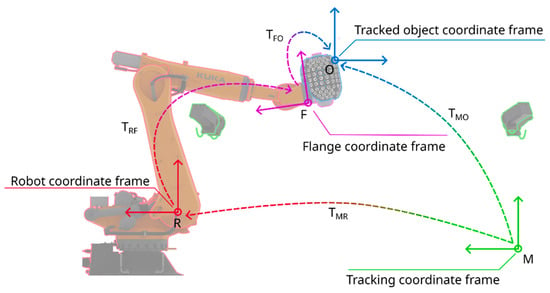
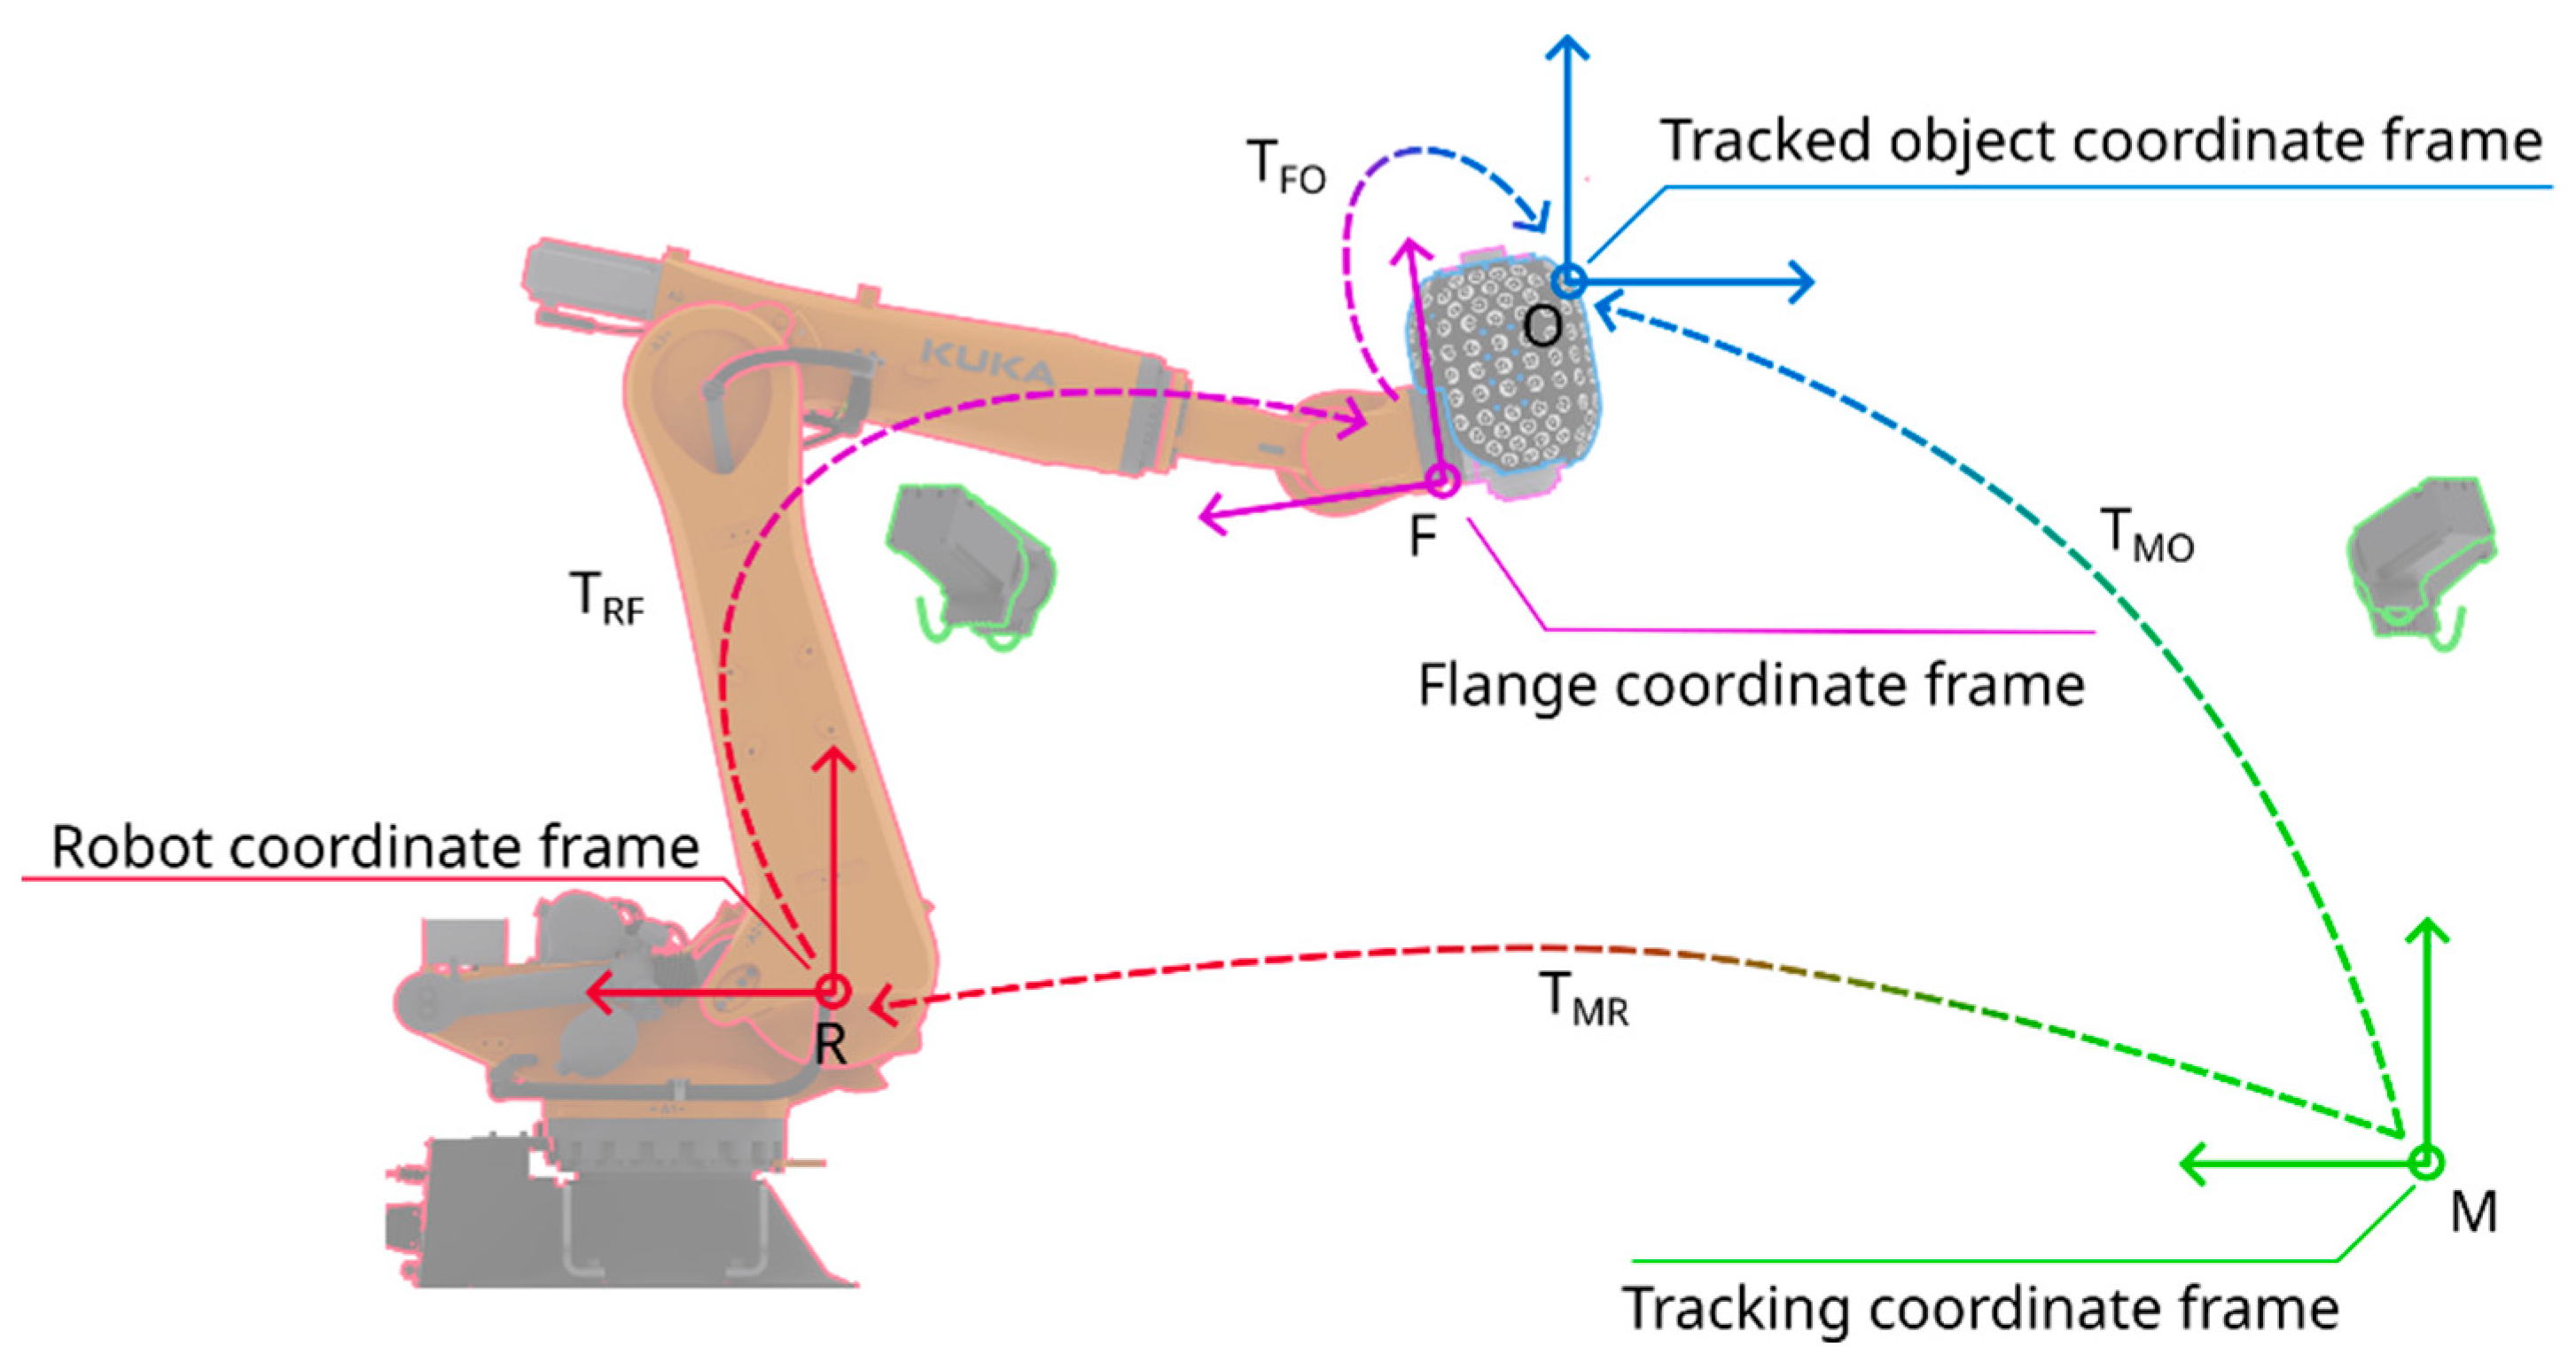
Finally, the hand–eye calibration is performed. The homogeneous transform convention is used here, which maps coordinates expressed in frame B into frame A. The calibration consists of determining the transformations that link the end effector to the photogrammetric system [21,22]. This relationship, sketched in Figure 2, is expressed for each pose as . The transformation matrices and at such position, the former known from the photogrammetric system and the latter from the robot control, are the transformations from photogrammetric system coordinate frame (M) to the tracked object coordinate frame (O) and from the robot coordinate frame (R) to the flange coordinate frame (F), respectively. The unknown matrices and , constant across all poses, represent the transformation between the flange coordinate frame to the tracked object coordinate frame and between the photogrammetric system coordinate frame to the robot coordinate frame, respectively.
Figure 2.
Representation of the transformation matrices involved in hand–eye calibration. Frames: M, photogrammetry measurement frame (green); O, tracked-object frame attached to the target enclosure (blue); R, robot base frame (red); F, robot flange frame (magenta). Using the convention (mapping coordinates from frame B to frame A), the known transforms are (measured by the photogrammetry system) and (reported by the robot controller), while and are the constant unknown transforms estimated by hand–eye calibration.
The hand–eye calibration process involves moving the robot to positions, with sufficiently large to reduce uncertainties, ensuring coverage across the entire workspace and maximizing orientation variations [21]. The unknown matrices and are estimated by nonlinear least squares over those poses by minimizing the stacked residuals between the measured and the predicted , using translational error and rotation error (Euler-angle error) stacked into a residual vector. To do so, and are parametrised with six degrees of freedom each (three Euler angles for rotation by the convention, without loss of generality, ZYX, fixed frame and right-handed); and three components for translation). The least-squares minimization problem for these 12 degrees of freedom was resolved iteratively by Powell’s dog leg algorithm [23], computing at each iteration the corresponding residual vector and associated Jacobian matrix.
A full analytical uncertainty propagation along the complete calibration chain is outside the scope of this work. Nevertheless, the repeatability of the nonlinear least-squares fitting residual provides a practical indicator of sensitivity to measurement noise in the hand–eye calibration. When repeating the hand–eye estimation under identical conditions, the RMS value of the least-squares residual is repeatable within approximately 0.010 mm. In addition, the repeatability of the multi-camera reference frame (scene/marker calibration) is approximately 0.100 mm. These experimentally observed repeatability levels are consistent with the residual limitations discussed later (e.g., the non-uniform marker calibration in Figure 12 and occasional occlusions) and help interpret the achievable compensated accuracy in the industrial environment.
2.2. Compensation Methodology
The closed-loop compensation for the robot is accomplished via the feedback given by the photogrammetric system, based precisely on the detection of the markers affixed to the machining head. During the machining process, the robot transmits in real time its estimated tool centre point (TCP) position expressed in its own frame (R, cf. Figure 2) to the controller software (KUKA System Software, KSS 8.7), where the position correction is calculated and applied by comparing it with the most recent 6-DoF photogrammetric-system measurement converted into the robot’s frame [24,25].
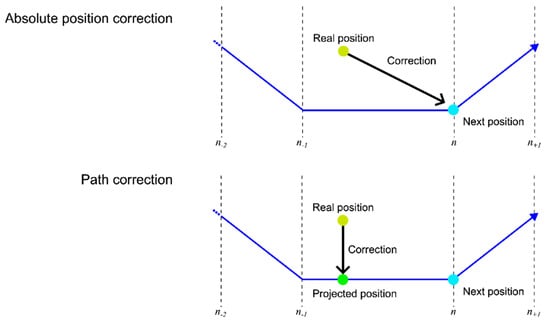
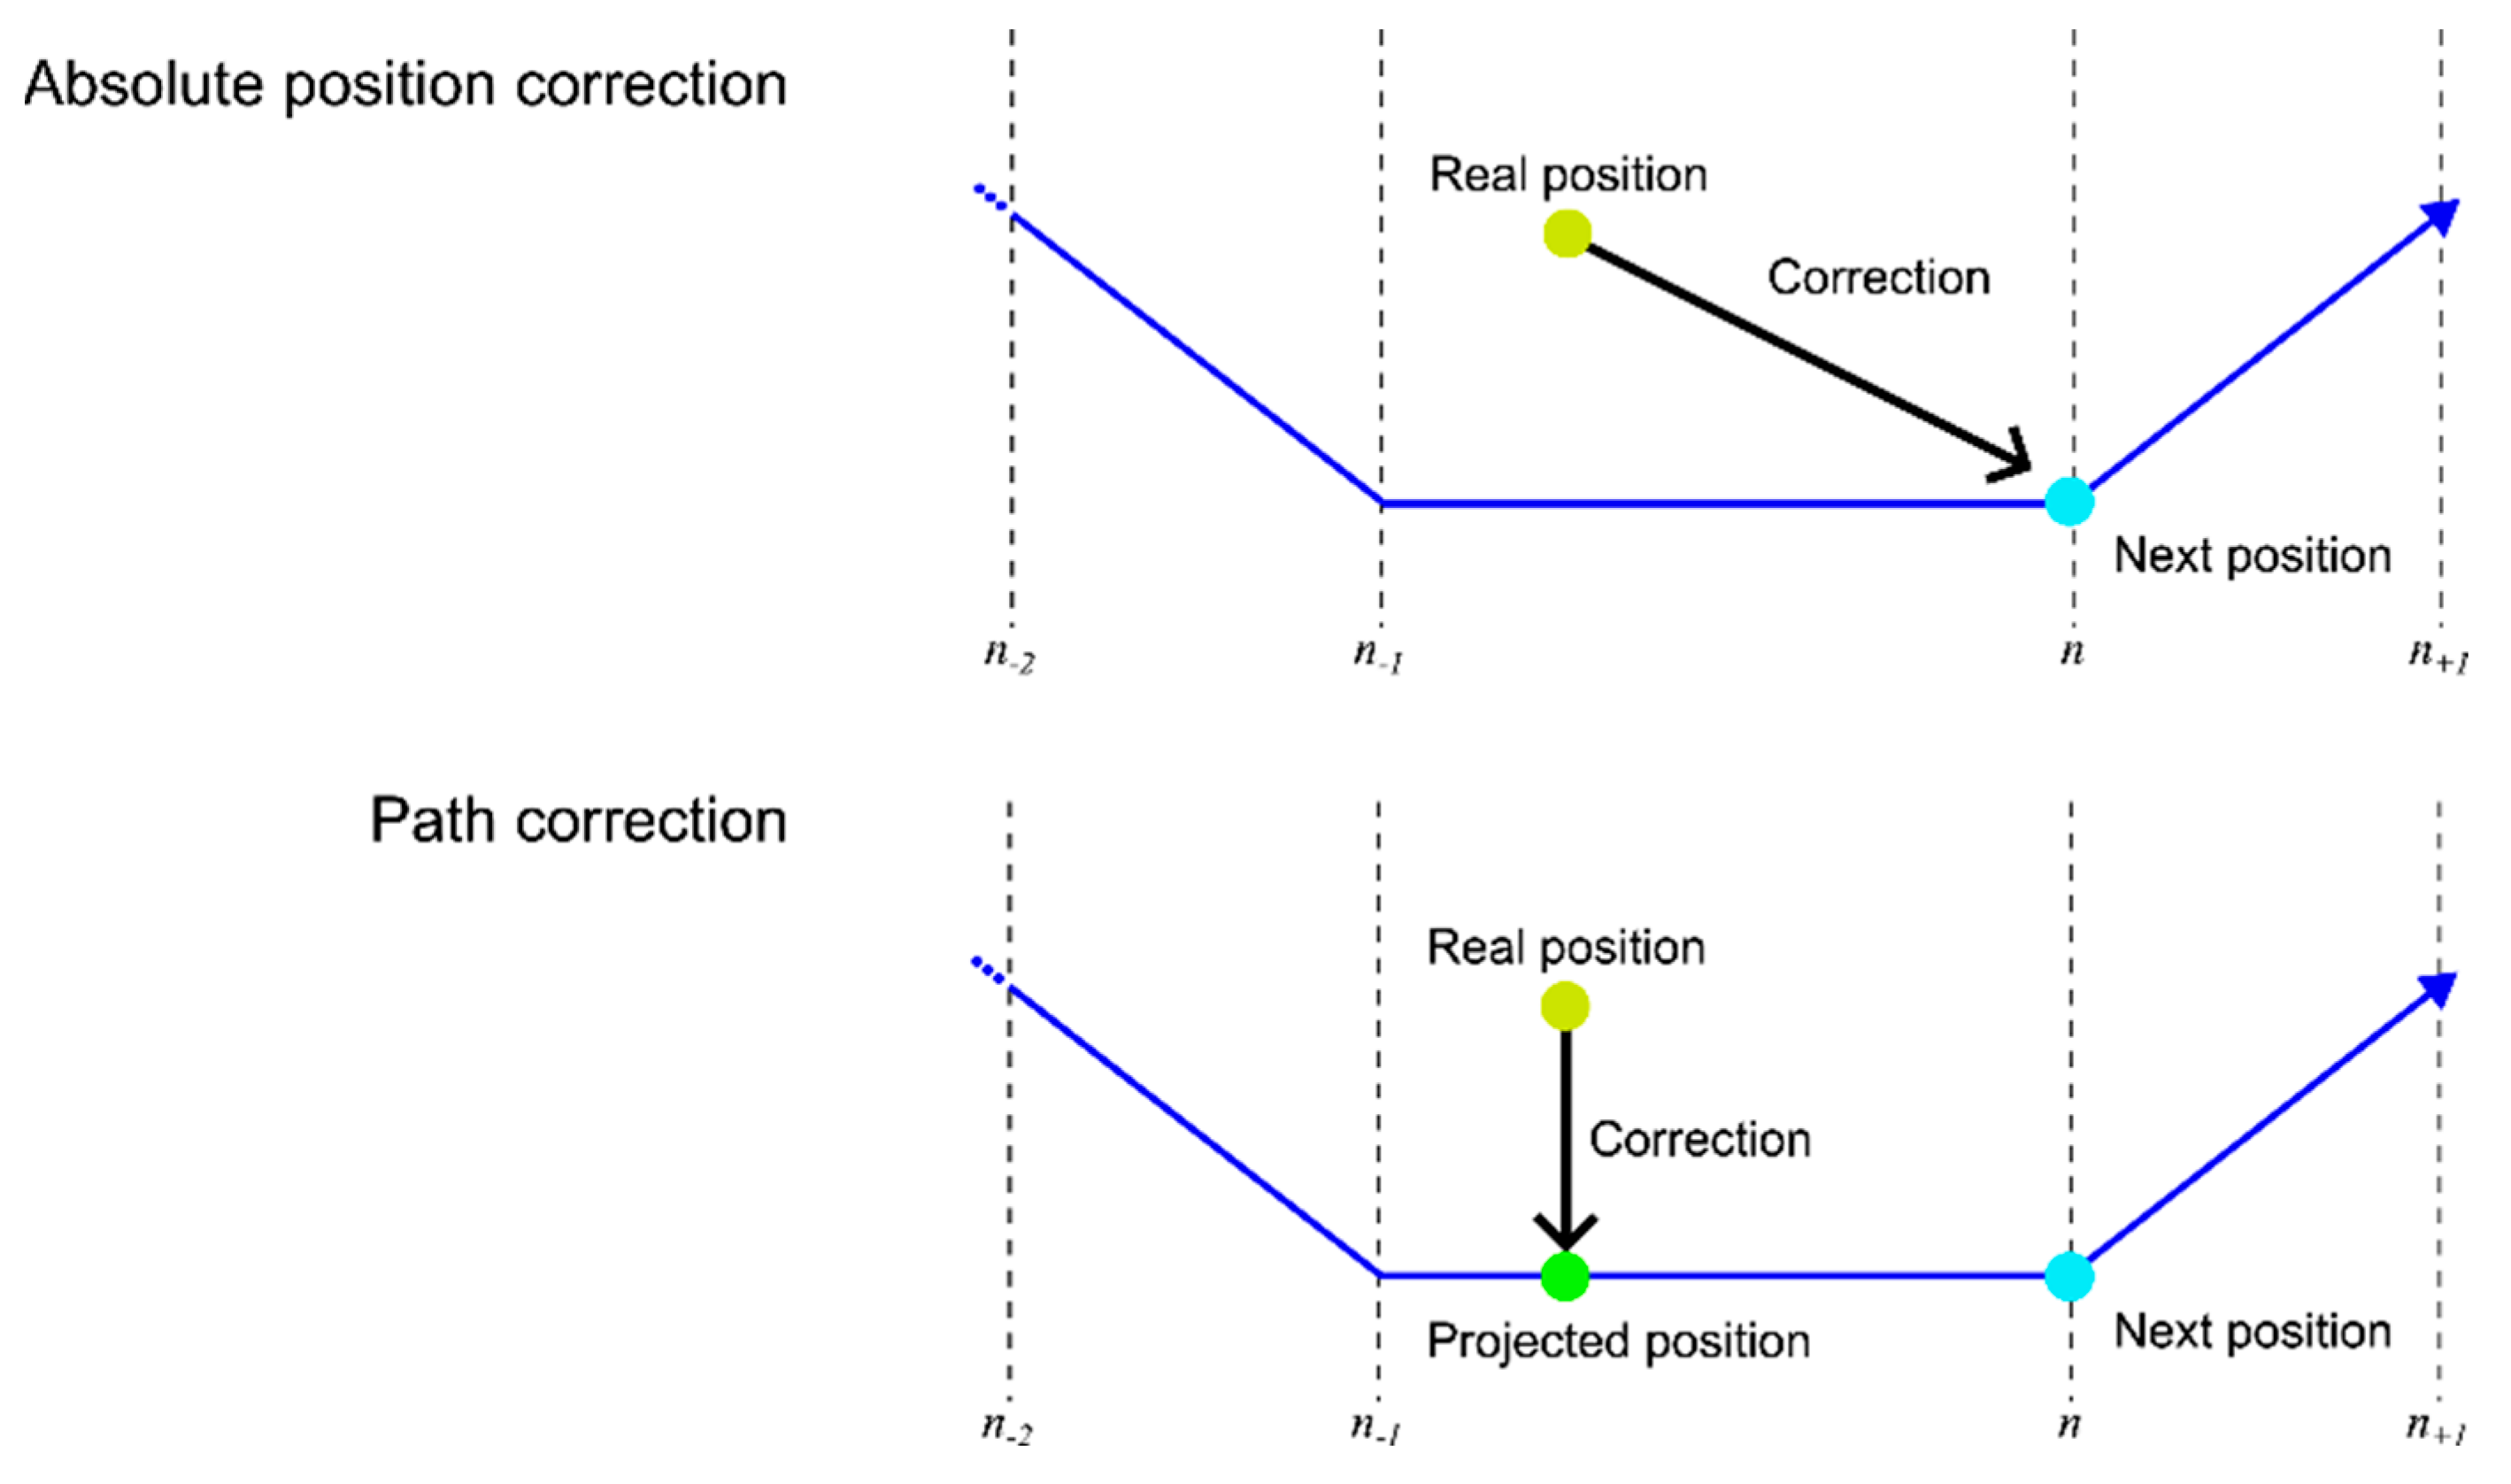
Since the robot controller and the photogrammetric system have independent and different update frequencies, namely 500 Hz and 4 Hz, respectively, it is not possible to apply an absolute positioning correction without the appearance of undesired jitter, which causes spurious oscillations in the control loops, especially at a high feed rate. For this reason, in this work, the path-correction technique developed by [25] is employed. Instead of defining the error as the difference between the measured and the current robot TCP position, the correction is computed with respect to the nominal robot trajectory (Figure 3). Let and denote two consecutive TCP positions reported by the robot controller, defining the local motion vector . Given the photogrammetric measurement expressed in the robot frame, the closest point on the trajectory segment is obtained by projecting onto : , where . The correction vector is then defined as the path-error vector , which is orthogonal to the direction of motion. This formulation removes synchronization-induced errors along the trajectory direction, significantly reducing jitter while preserving path accuracy. However, during abrupt changes in motion direction, the discrete nature of the photogrammetric measurements may momentarily reduce compensation effectiveness. Moreover, when the robot velocity falls below a predefined threshold, the controller reverts to absolute position correction to avoid numerical instability.
Figure 3.
Schematic comparison between absolute position correction and path correction. In path correction, the error is computed as the shortest distance between the measured TCP position and the nominal trajectory segment rather than as the instantaneous robot position.
It should be noted that the apparent latency associated with the photogrammetric update rate does not translate into an equivalent positioning error along the trajectory. In the path-correction formulation, latency-induced displacement occurs predominantly along the direction of motion and is therefore rejected by construction. As a result, the residual uncompensated error is limited to lateral deviations from the nominal path; for instance, at 1500 mm/min (25 mm/s) the TCP advances 6.25 mm between 4 Hz measurements, but this displacement is predominantly tangential and is largely rejected by construction, so the remaining lateral deviation stays within the machining tolerance (cf. Section 3.4), at the cost of not correcting the along-path component.
2.3. Validation Methodology
A calibrated 135 mm tool was developed for the machining head so that the SMR coincides with the exact machining contact point, if placed at its end. The comparison of the error between the nominal and reached positions of this point, measured here by a Laser Tracker AT960M (Heerbrugg, Switzerland) whose accuracy is ±0.020 mm, is used in this paper to validate the robotic solution, with and without compensation. We note that the laser tracker is used here as an independent ground-truth instrument for validation rather than as the compensation sensor. While using a laser tracker directly in the control loop can provide higher bandwidth and potentially, higher accuracy, it typically increases system cost and reduces operational robustness in industrial machining cells due to line-of-sight constraints and sensitivity to environmental disturbances; the present work therefore targets a lower-cost, multi-camera alternative with improved robustness to occlusions. To validate the proposed solution, four different tests have been devised to verify the accuracy across the entire working volume. These tests begin with static trials, progress to trials involving robot movement, and conclude with assessments to validate dynamic behaviour.
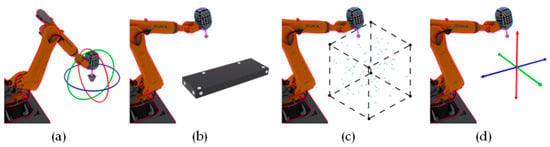
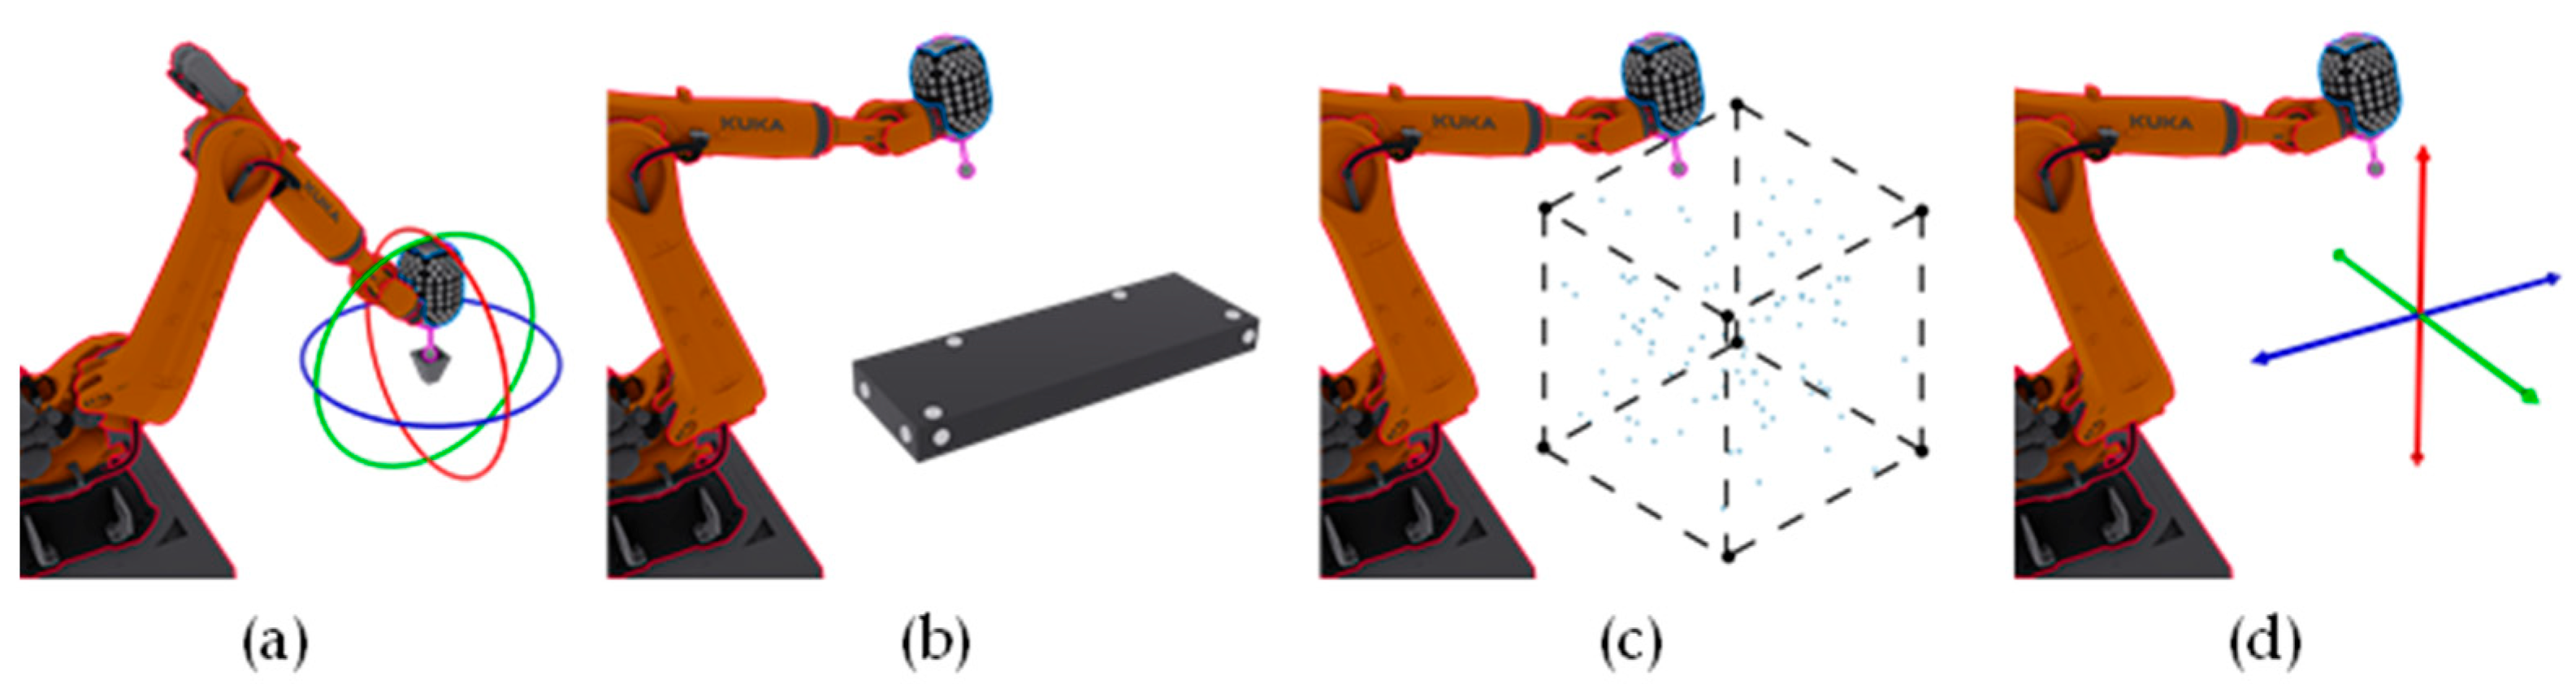
First, a pivoting test is performed in which the robot pivots around a defined position in 3-DoF, and the deviation from a fixed point is measured, with and without compensation, as illustrated in Figure 4a.
Figure 4.
(a) Rendering of the pivoting test. (b) Performance of the workpiece touch-probe. (c) Illustration of the discrete static cube test. (d) Depiction of the straightness in three axes test.
Second, the workpiece touch-probe test is conducted, which entails arranging 1.5-inch SMR nests within the workspace and running Siemens touch-probe cycles to obtain the coordinates of the 1.5-inch reference sphere’s centre (Figure 4b). It contacts the surface of the sphere, initially from the sides and subsequently from the top face, transmitting signals to the CNC controller to accurately determine its location. The touch-probe used to measure the sphere is the Renishaw RMP400.
Third, a test is conducted in a discrete static cube to calculate the positioning errors in a wide range of robot configurations randomly distributed in the entire workspace, as depicted Figure 4c. The sequence is as follows: the robot moves to a designated position, the LT measures the reflector’s position (without compensation pose), then the robot adjusts its position based on the information obtained from the photogrammetric system and finally, the LT measures the new position (compensation pose).
Finally, the straight line in three axes test is carried out, which consists of quantifying the straight-line error of linear trajectories along the X, Y, and Z axes (Figure 4d). Each trajectory has round-trip repetitions, and all of them are followed at different feed rates.
3. Results
3.1. Pivoting Verification
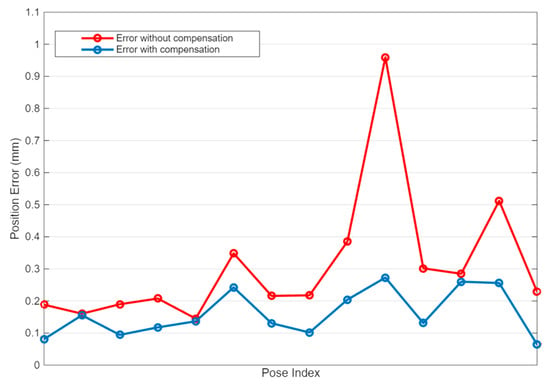
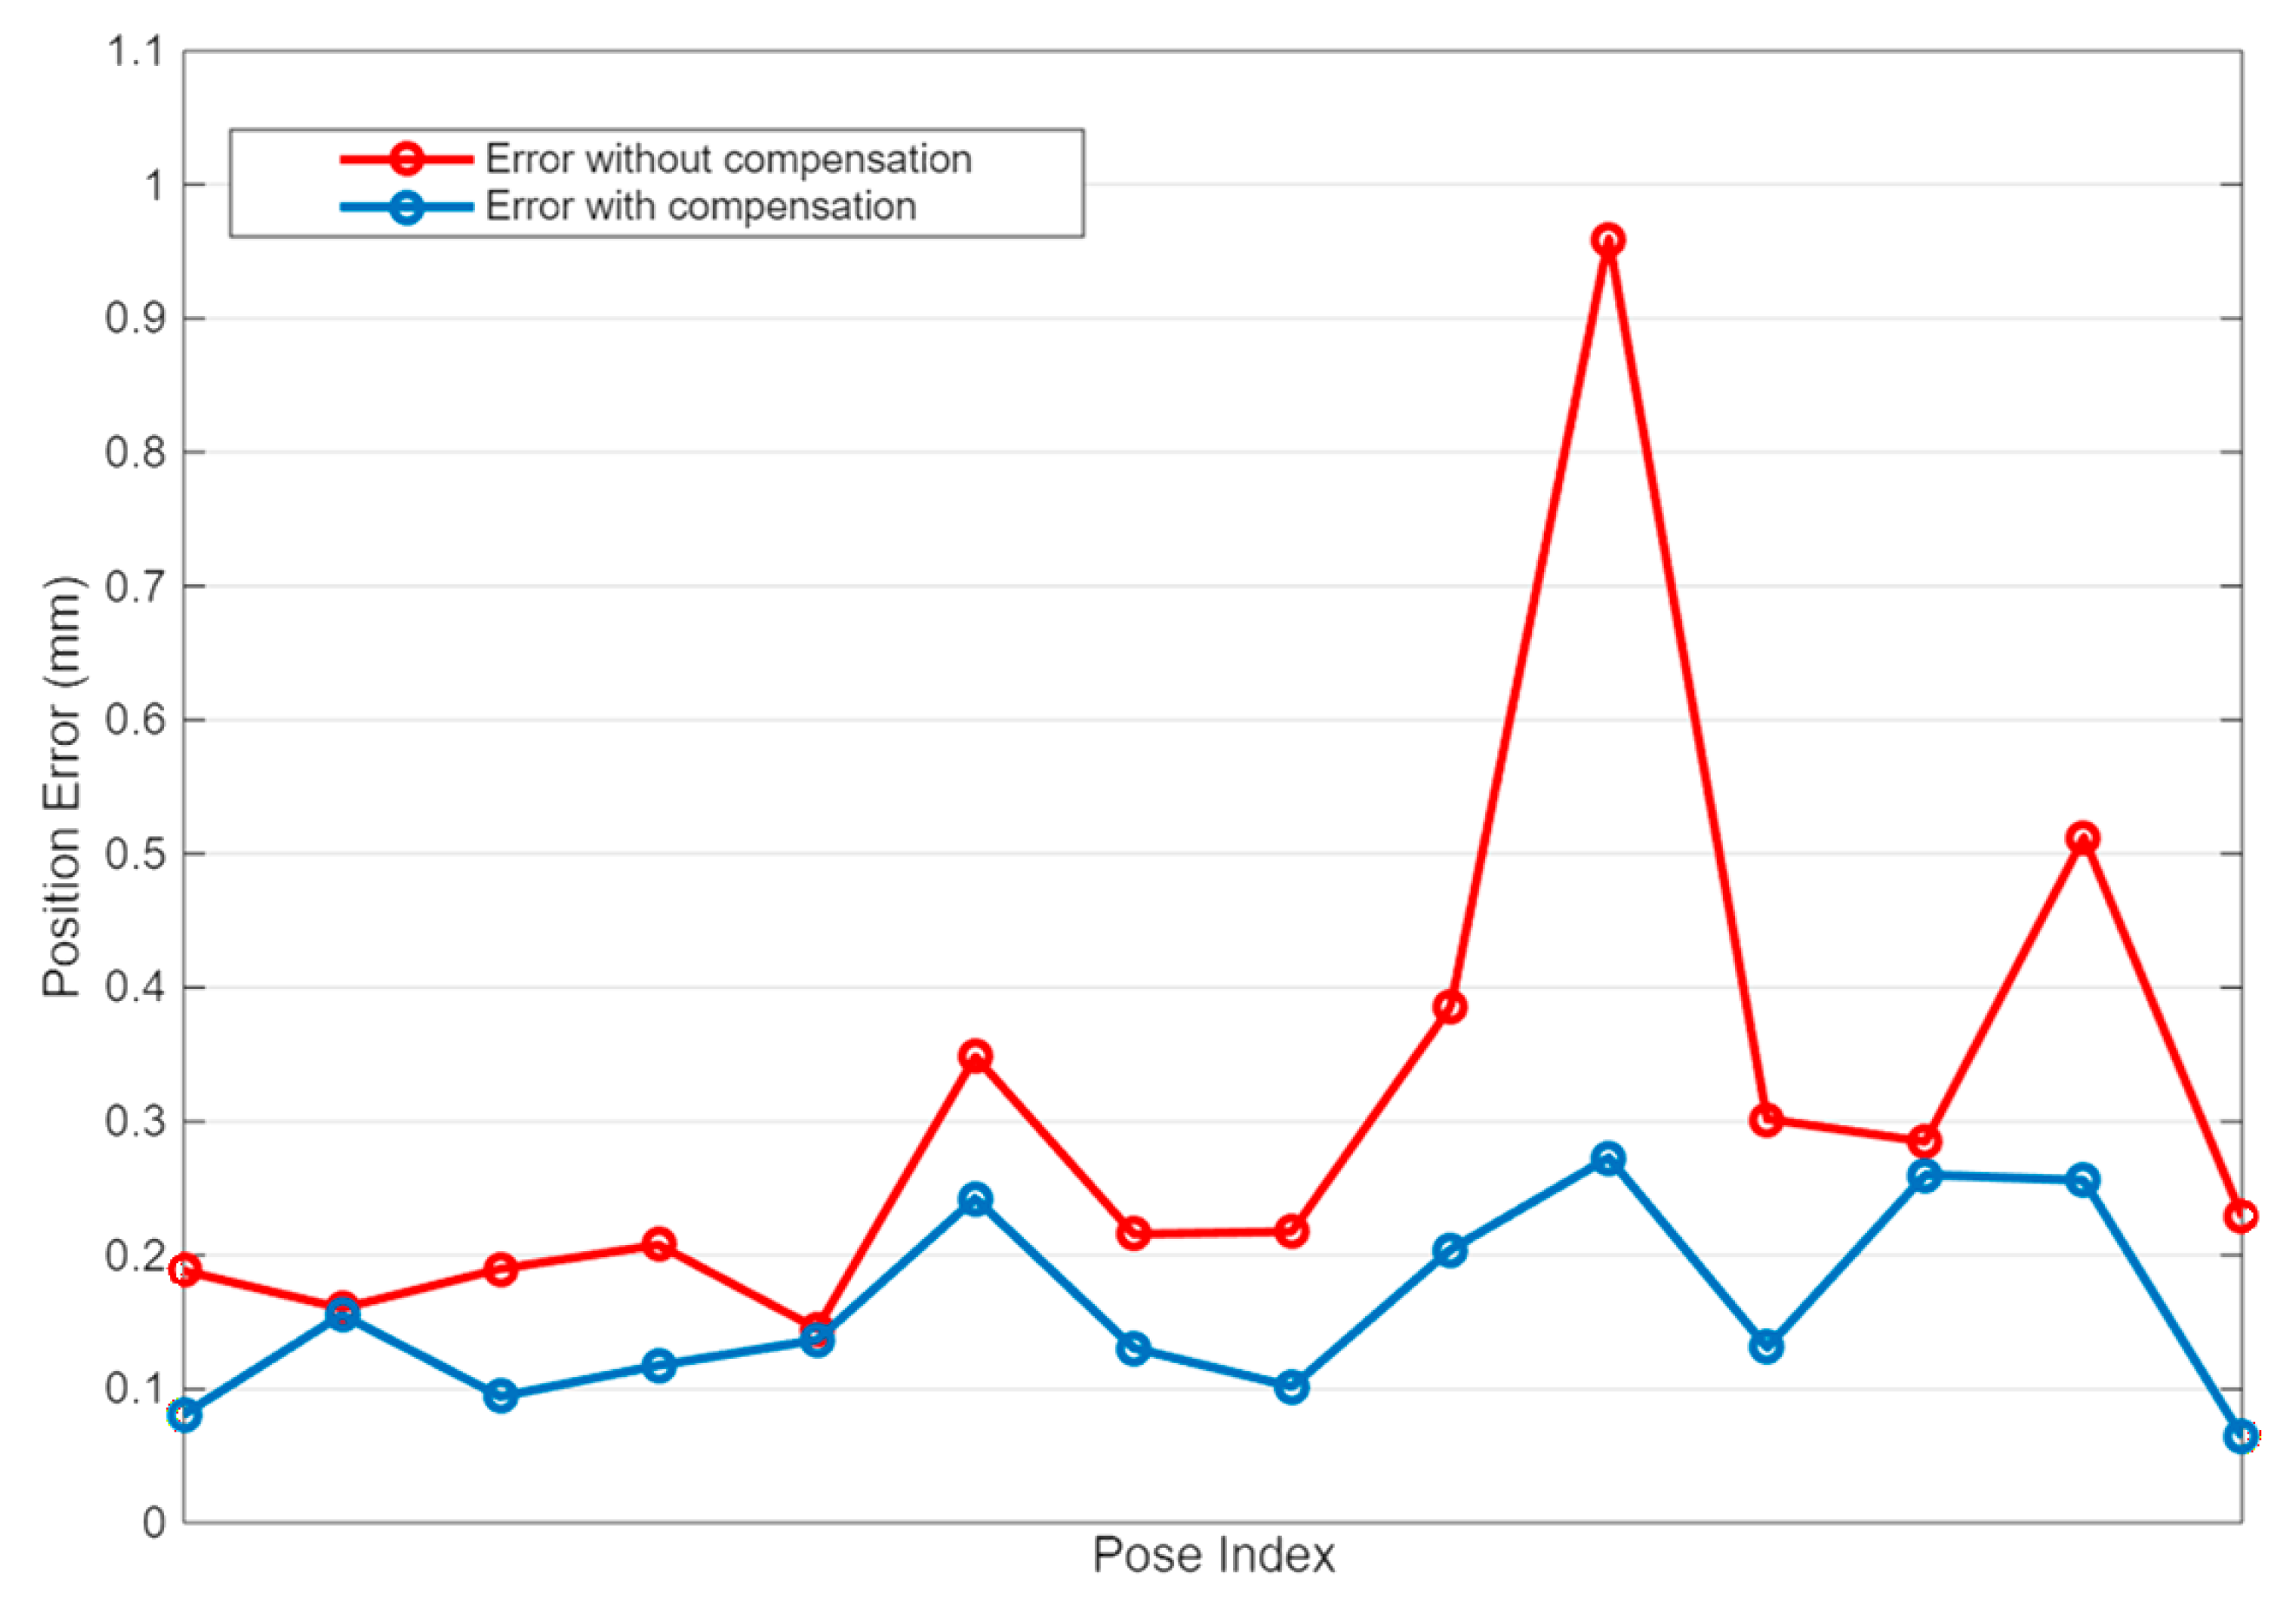
Pivoting the TCP around a position at the centre of the working volume involves coordinating angular movements along the A, B and C axes up to ±50 °, ±90° and ±15°, respectively. The comparison between the nominal TCP position and the position reached for each rotation is shown in Figure 5. An enhancement from ±0.310 to ±0.161 mm, on average, and from ±0.959 to ±0.273 mm at peak is observed. In addition to the reduction in mean and peak errors, the improvement is also reflected in robust distribution-based metrics. In particular, the 95th percentile error decreases from 0.669 mm to 0.265 mm, while the interquartile range is reduced from 0.143 mm to 0.127 mm, indicating a consistent accuracy improvement across the majority of configurations rather than results driven by outliers. The corresponding descriptive statistics are summarized in Table 1.
Figure 5.
Error between the nominal and the reached position, with (blue) and without (red) compensation.
Table 1.
Position error.
3.2. Touch-Probe Piece Verification
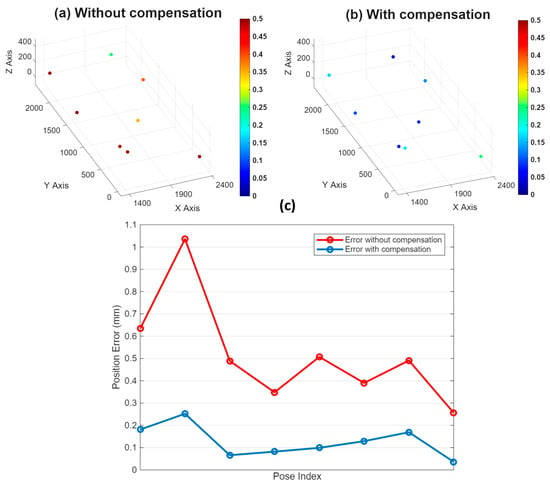
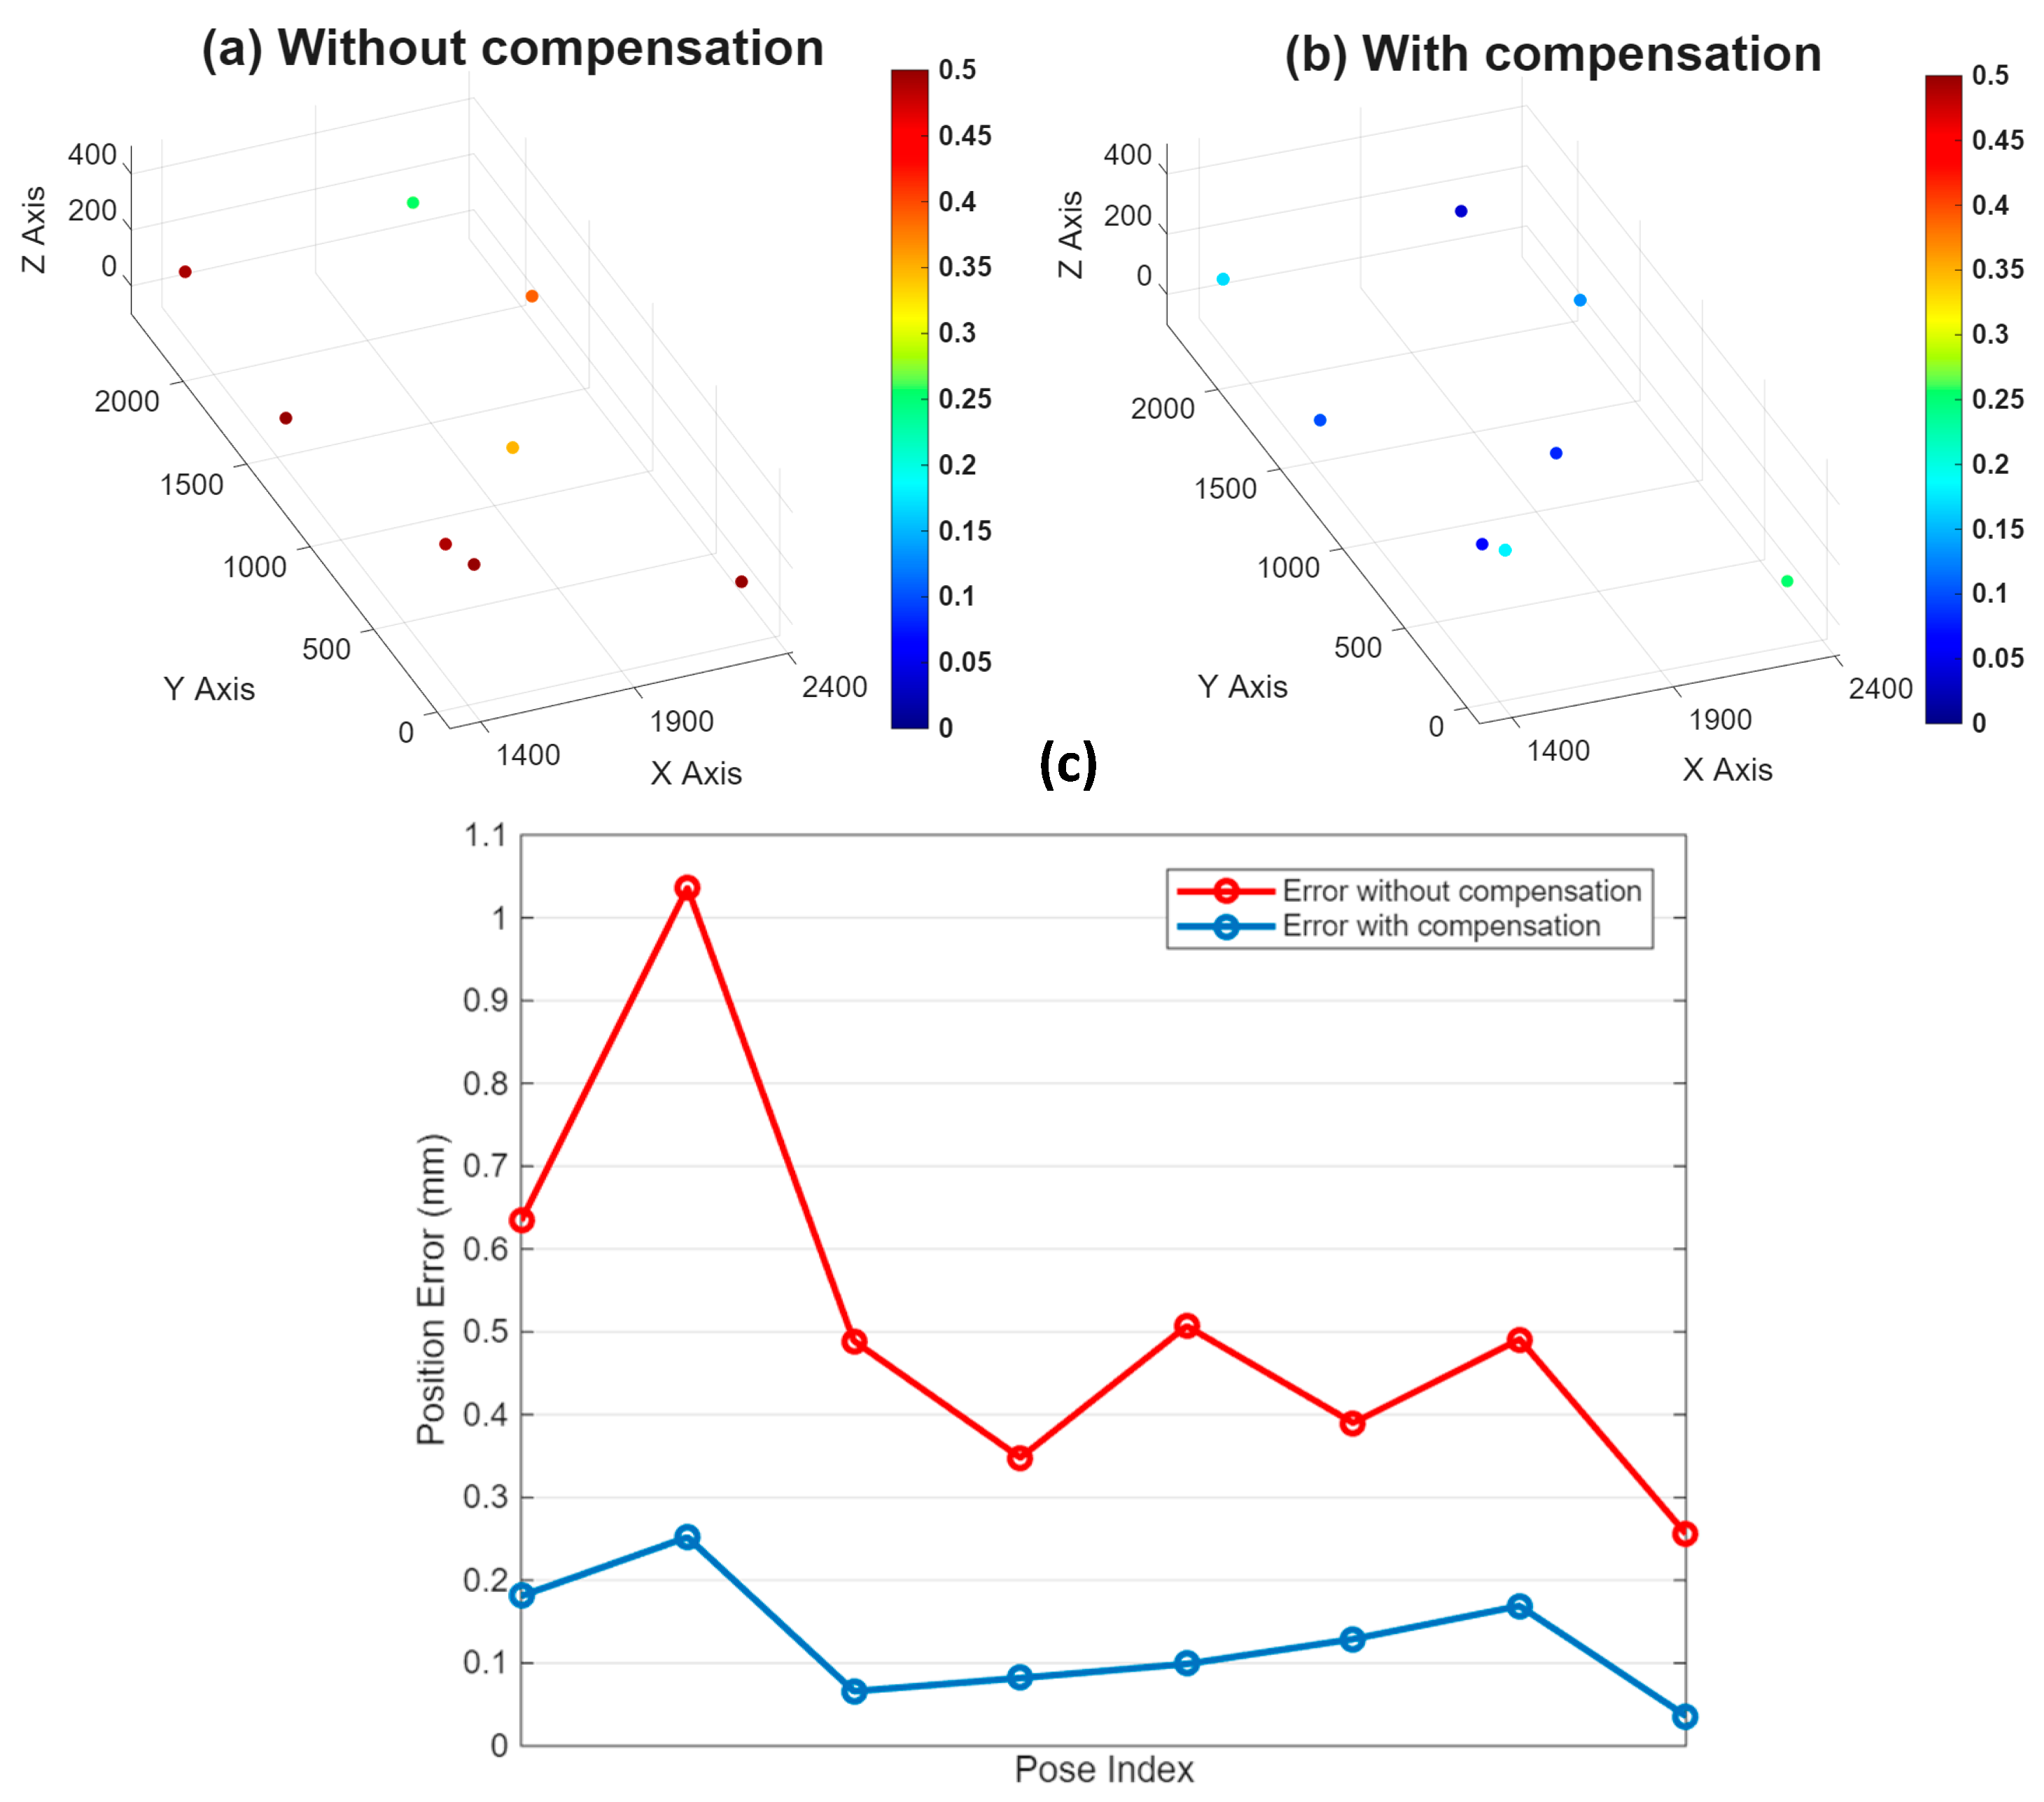
The workpiece touch-probe test comprises eight nests covering a volume of 2500 × 1000 × 400 mm3, comparing the error between nominal and reached positions of the sphere’s centre, both without (Figure 6a) and with (Figure 6b) compensation. An improvement from ±0.519 to ±0.127 mm, on average, and from ±1.036 to ±0.252 mm at peak is obtained (Figure 6c). This improvement is also reflected in distribution-based metrics, with a clear reduction in the median (from 0.490 mm to 0.114 mm), interquartile range (from 0.159 mm to 0.094 mm) and 95th percentile error (from 0.895 mm to 0.227 mm). The corresponding descriptive statistics are detailed in Table 2.
Figure 6.
(a) Error position without compensation; (b) error position with compensation; (c) error between the nominal and the reached position, with and without compensation.
Table 2.
Position error.
3.3. Discrete Static Cube Verification
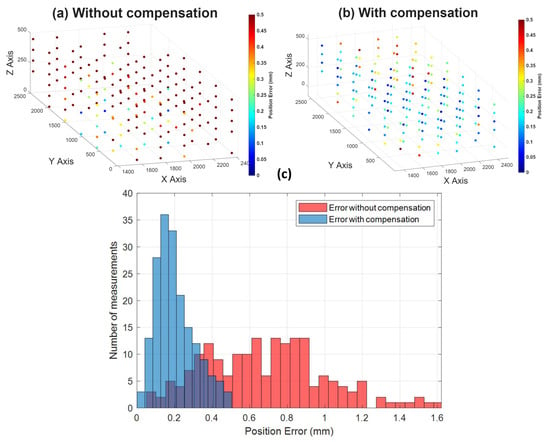
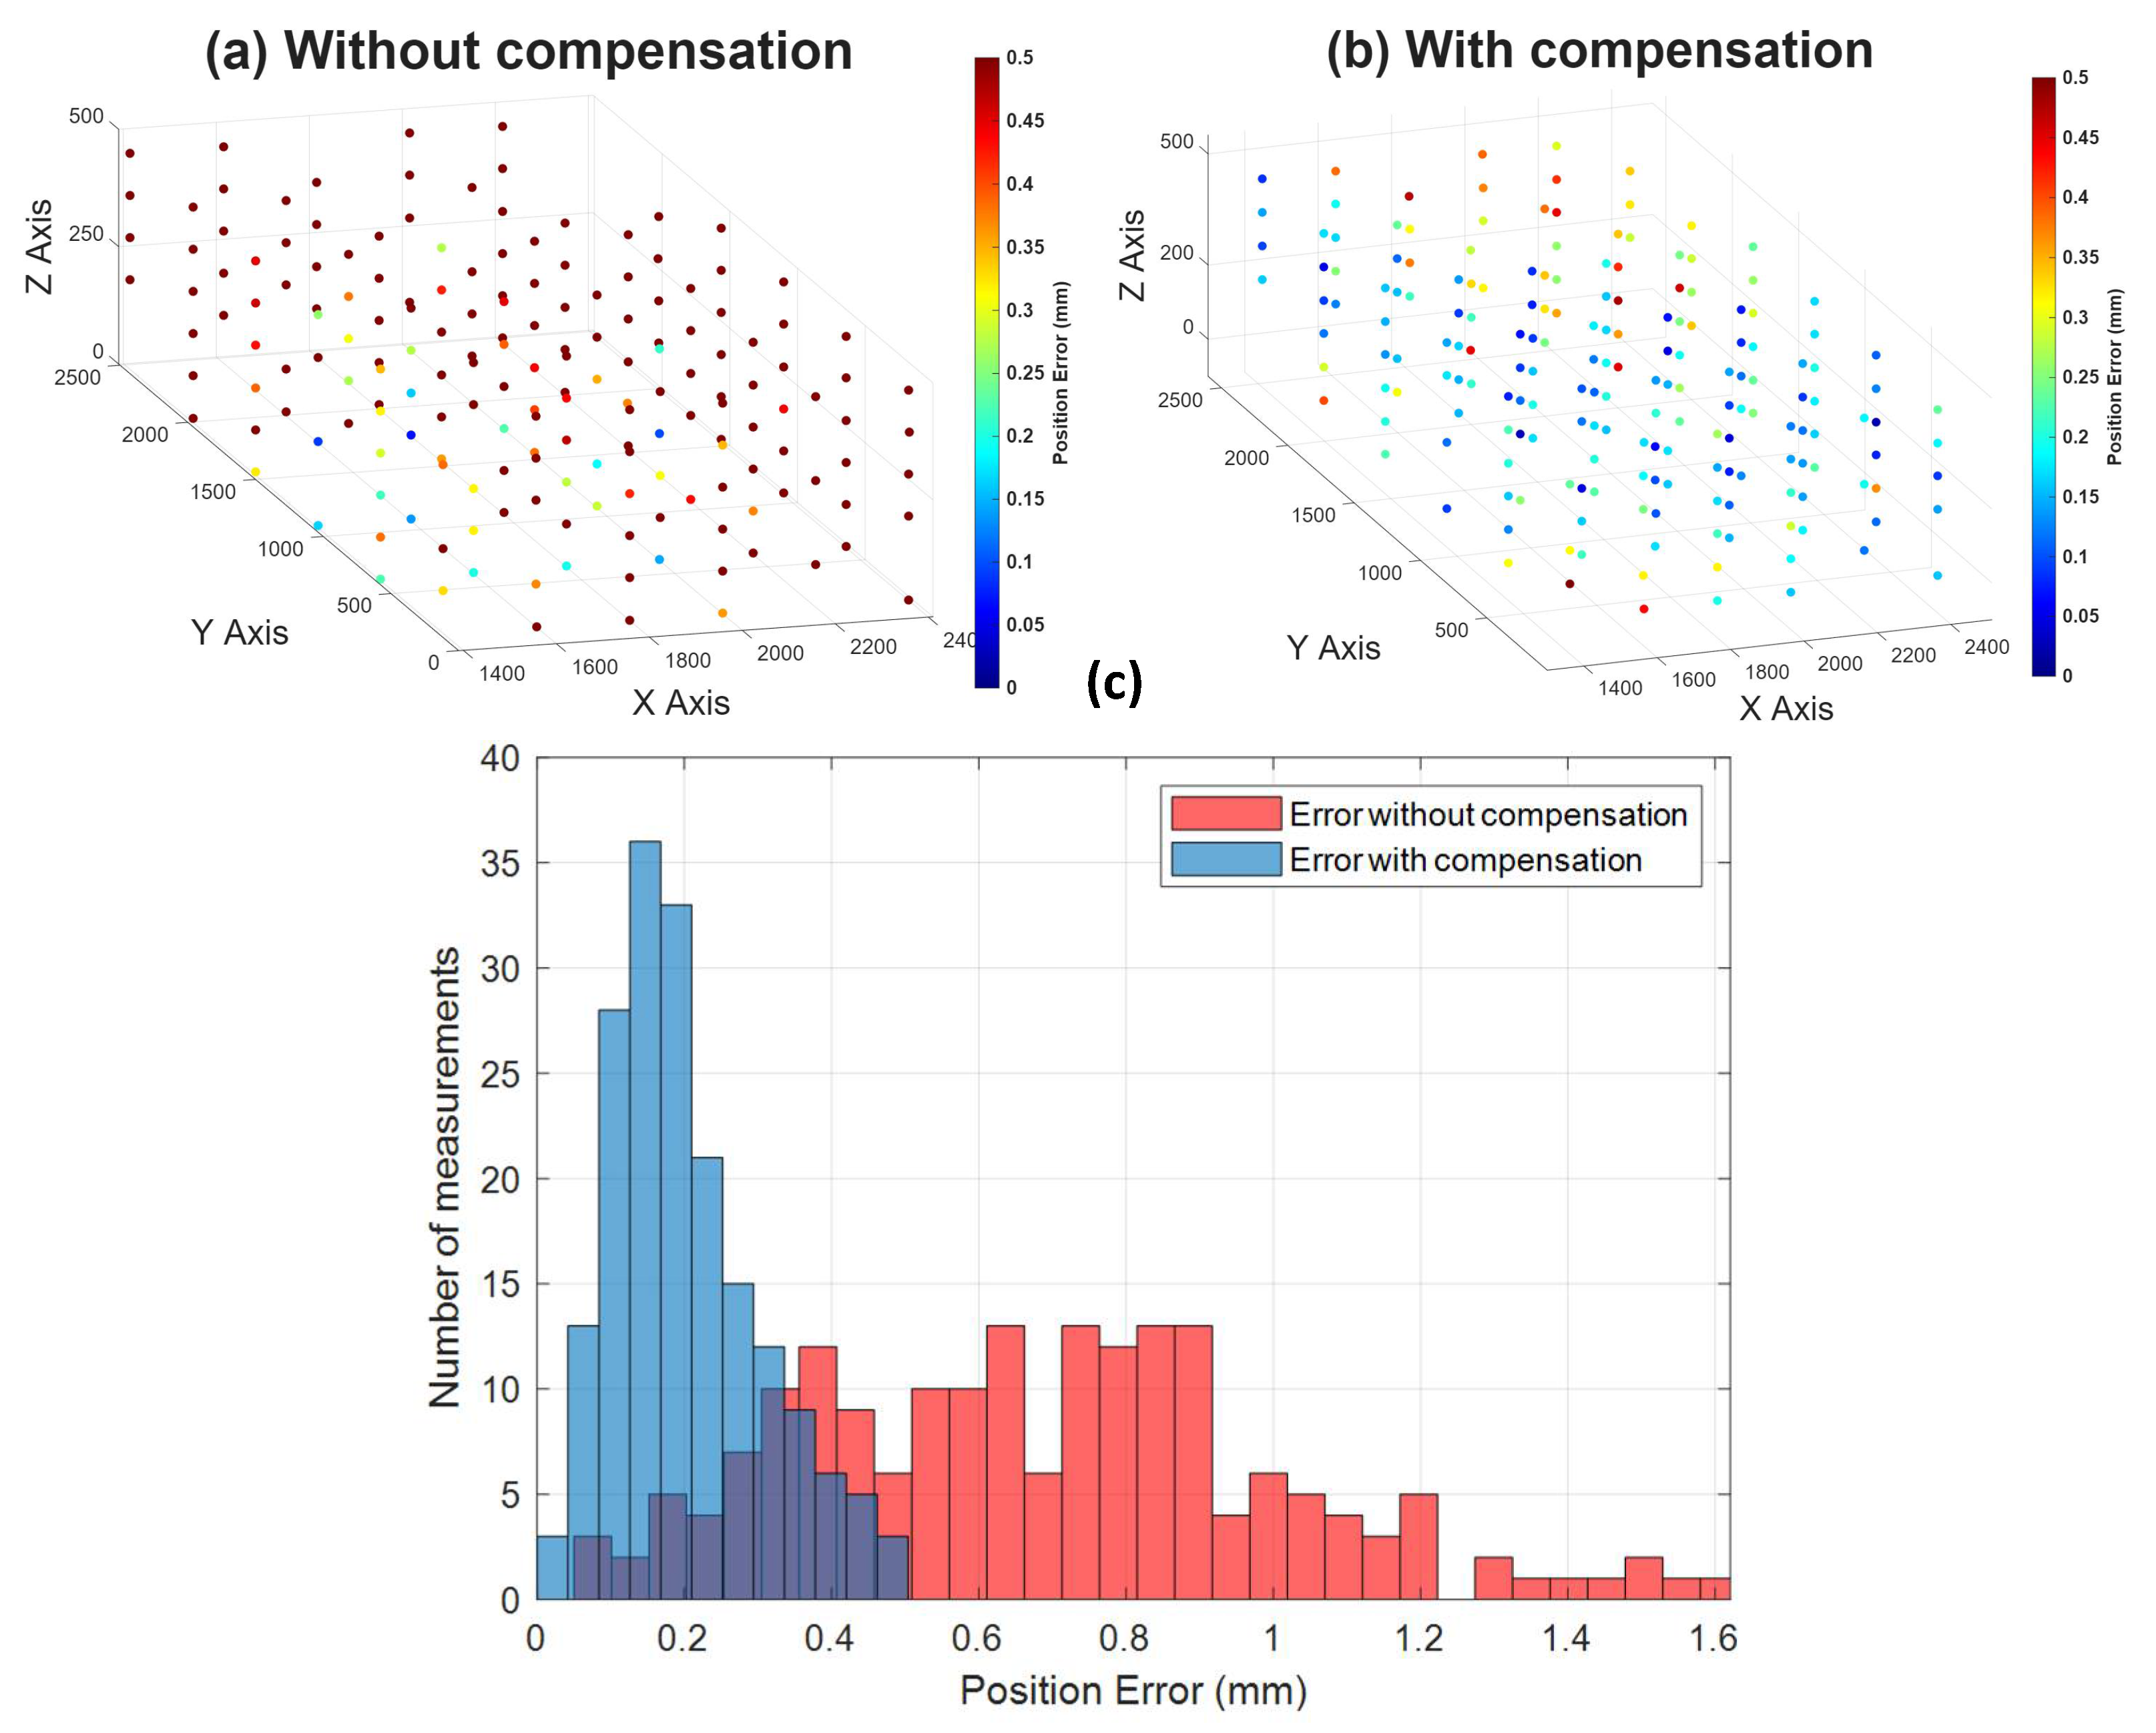
For this test, following the ISO 9283 standard [19], 185 robot configurations were obtained by randomly fluctuating ±20°, ±60° and ±15° through its axes A, B and C, respectively, within a workspace volume of 1000 × 2500 × 500 mm3. The resulting absolute positioning with respect to the world frame are shown in Figure 7a (without compensation) and Figure 7b (with compensation). The corresponding histogram is depicted in Figure 7c, whose descriptive statistics are summarized in Table 3. An improvement from ±0.685 to ±0.203 mm, on average, and from ±1.621 to ±0.498 mm at peak is attained. This improvement is consistently supported by robust distribution-based metrics, with a pronounced reduction in the median (from 0.669 to 0.181 mm), interquartile range (from 0.452 to 0.131 mm) and 95th percentile positioning error (from 1.216 to 0.412 mm) after compensation. In addition, a paired Wilcoxon signed-rank test was conducted between uncompensated and compensated measurements, indicating that the reduction in positioning error is statistically significant (Wilcoxon statistic = 16,949, p < 0.001).
Figure 7.
(a) Error position without compensation; (b) error position with compensation; (c) error between the nominal and the reached position, with and without compensation.
Table 3.
Position error.
3.4. Straight Line Verification
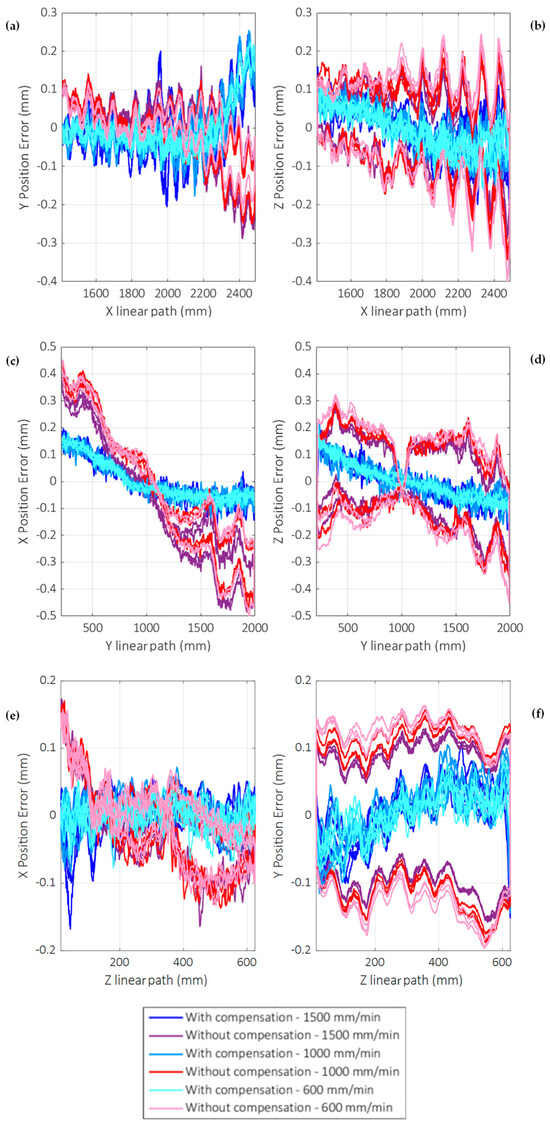
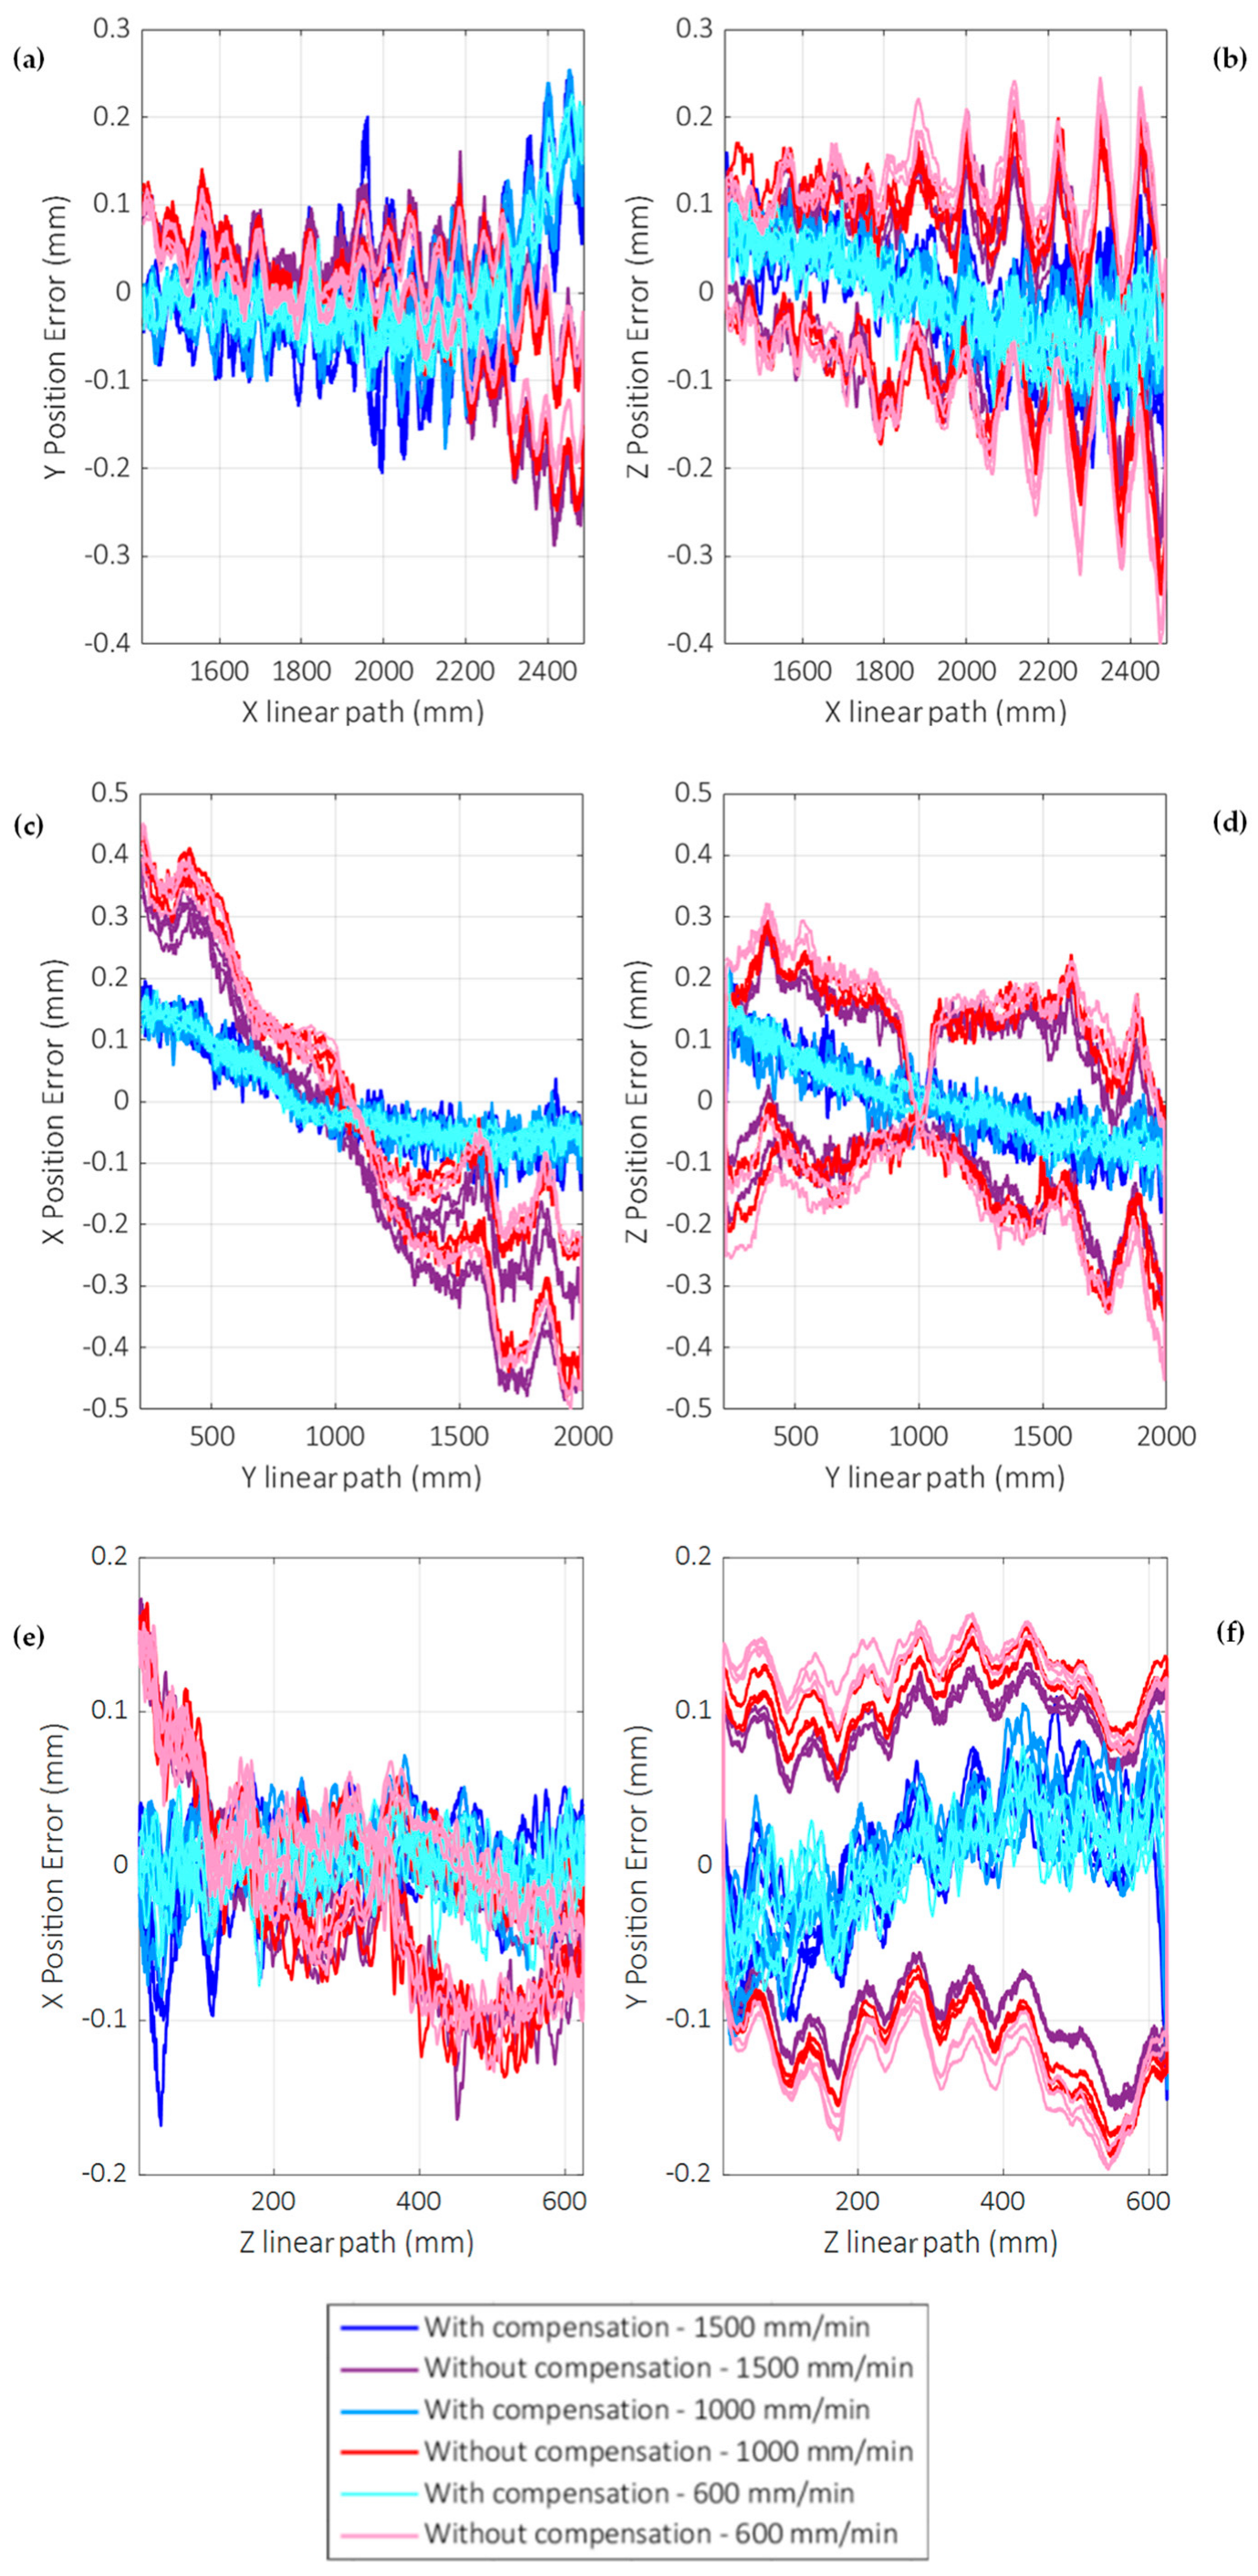
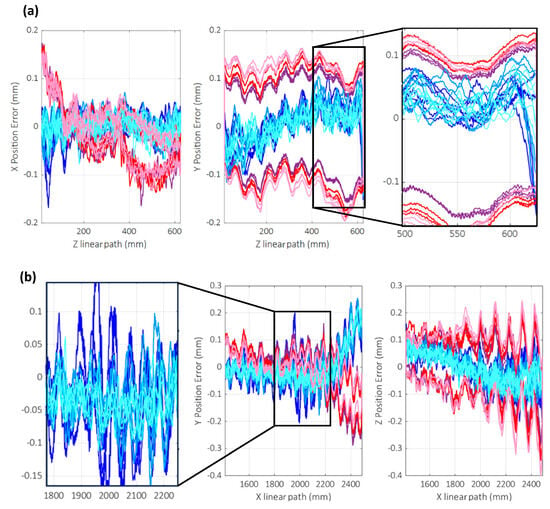
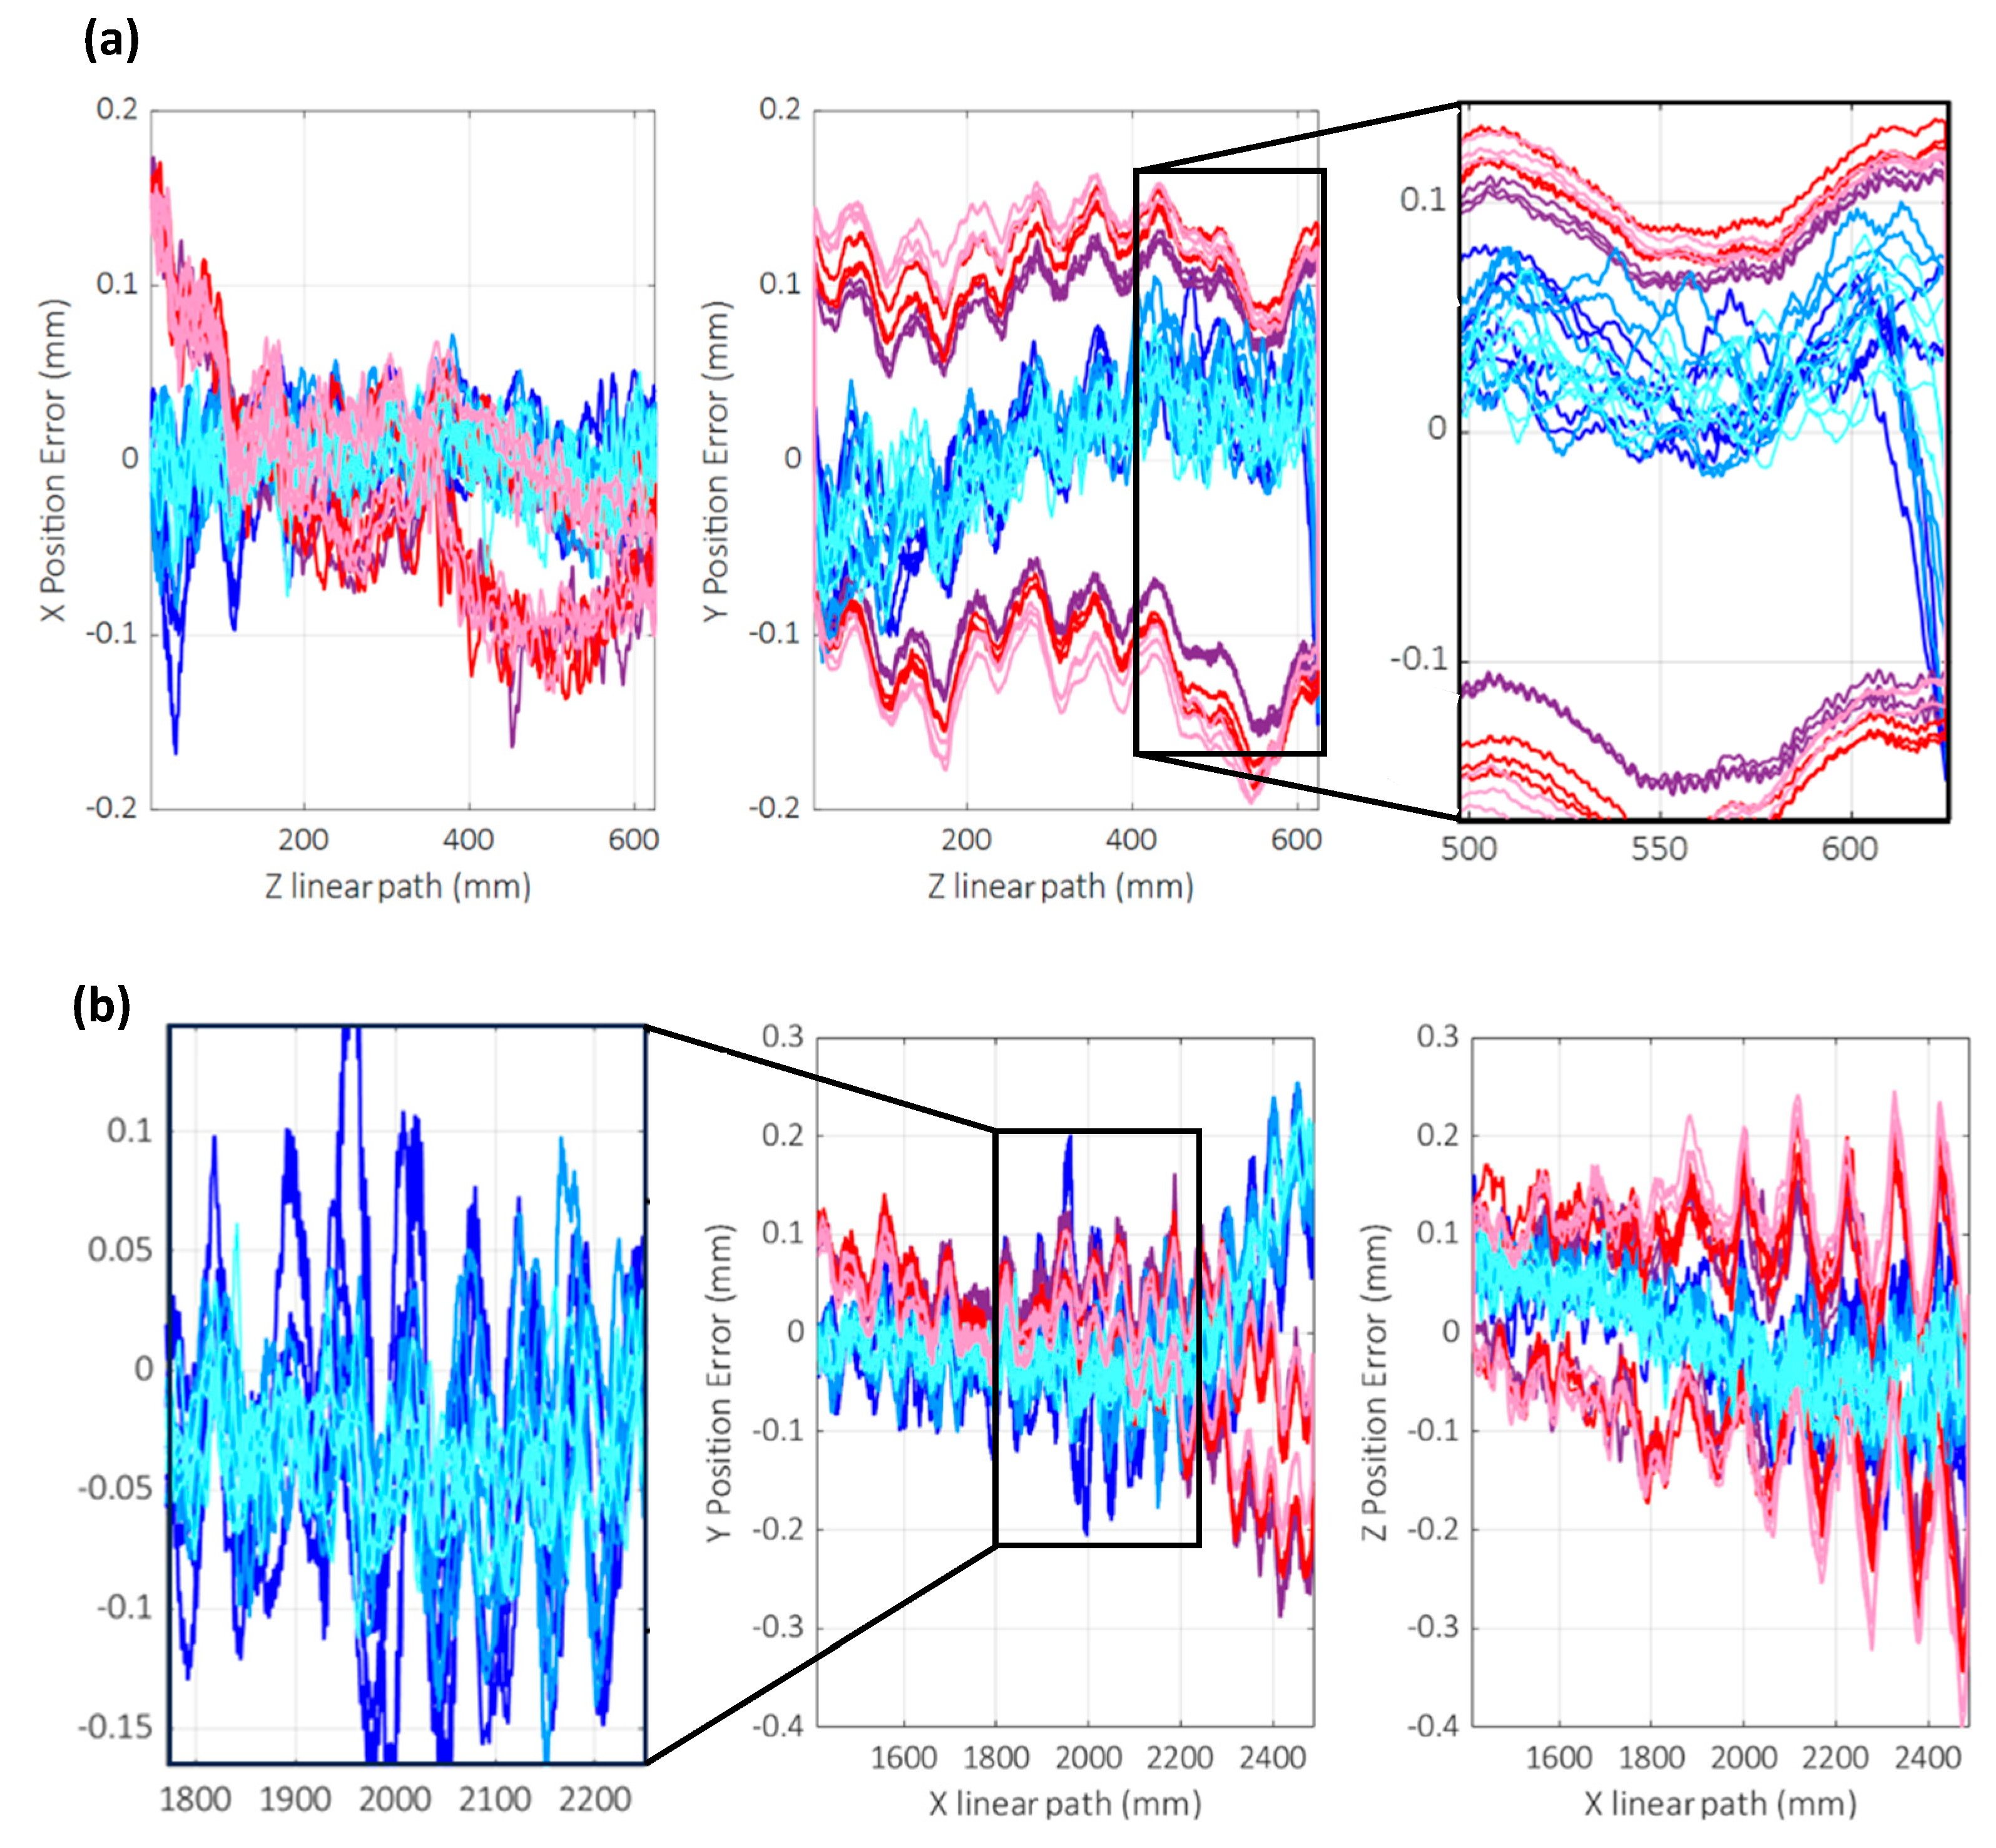
The robot describes linear trajectories along the X, Y and Z axes, with lengths of 1000 mm, 2000 mm and 600 mm, respectively, each one followed by three round-trip repetitions. Moreover, each test was done at feed rates of 600 mm/min, 1000 mm/min and 1500 mm/min. Positioning errors along the trajectories within the entire workspace are depicted in Figure 8, whereas the corresponding peak-to-peak straightness errors along the X, Y and Z axes are summarized in Table 4, Table 5, and Table 6, respectively. The results of the peak-to-peak errors show an improvement by a factor of more than 2, in general, except for the test along X-axis, which showed no improvement. The limited improvement observed along the X-axis can be attributed to the predominance of along-path dynamic effects and direction-change-induced backlash, which are less effectively compensated for by the current path correction strategy at the available 4 Hz update rate.
Figure 8.
(a) Position error in the Y–X plane along X-axis. (b) Position error in the Z–X plane along X-axis. (c) Position error in the X–Y plane along Y-axis. (d) Position error in the Z–Y plane along Y-axis. (e) Position error in the X–Z plane along Z-axis. (f) Position error in the Y–Z plane along Z-axis.
Table 4.
Peak-to-peak errors along X-path (mm).
Table 5.
Peak-to-peak errors along Y-path (mm).
Table 6.
Peak-to-peak errors along Z-path (mm).
3.5. Trajectory Verification of a Real Part
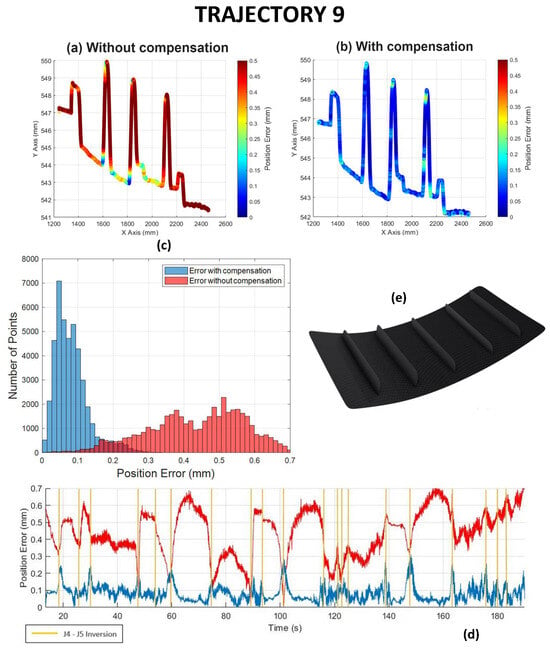
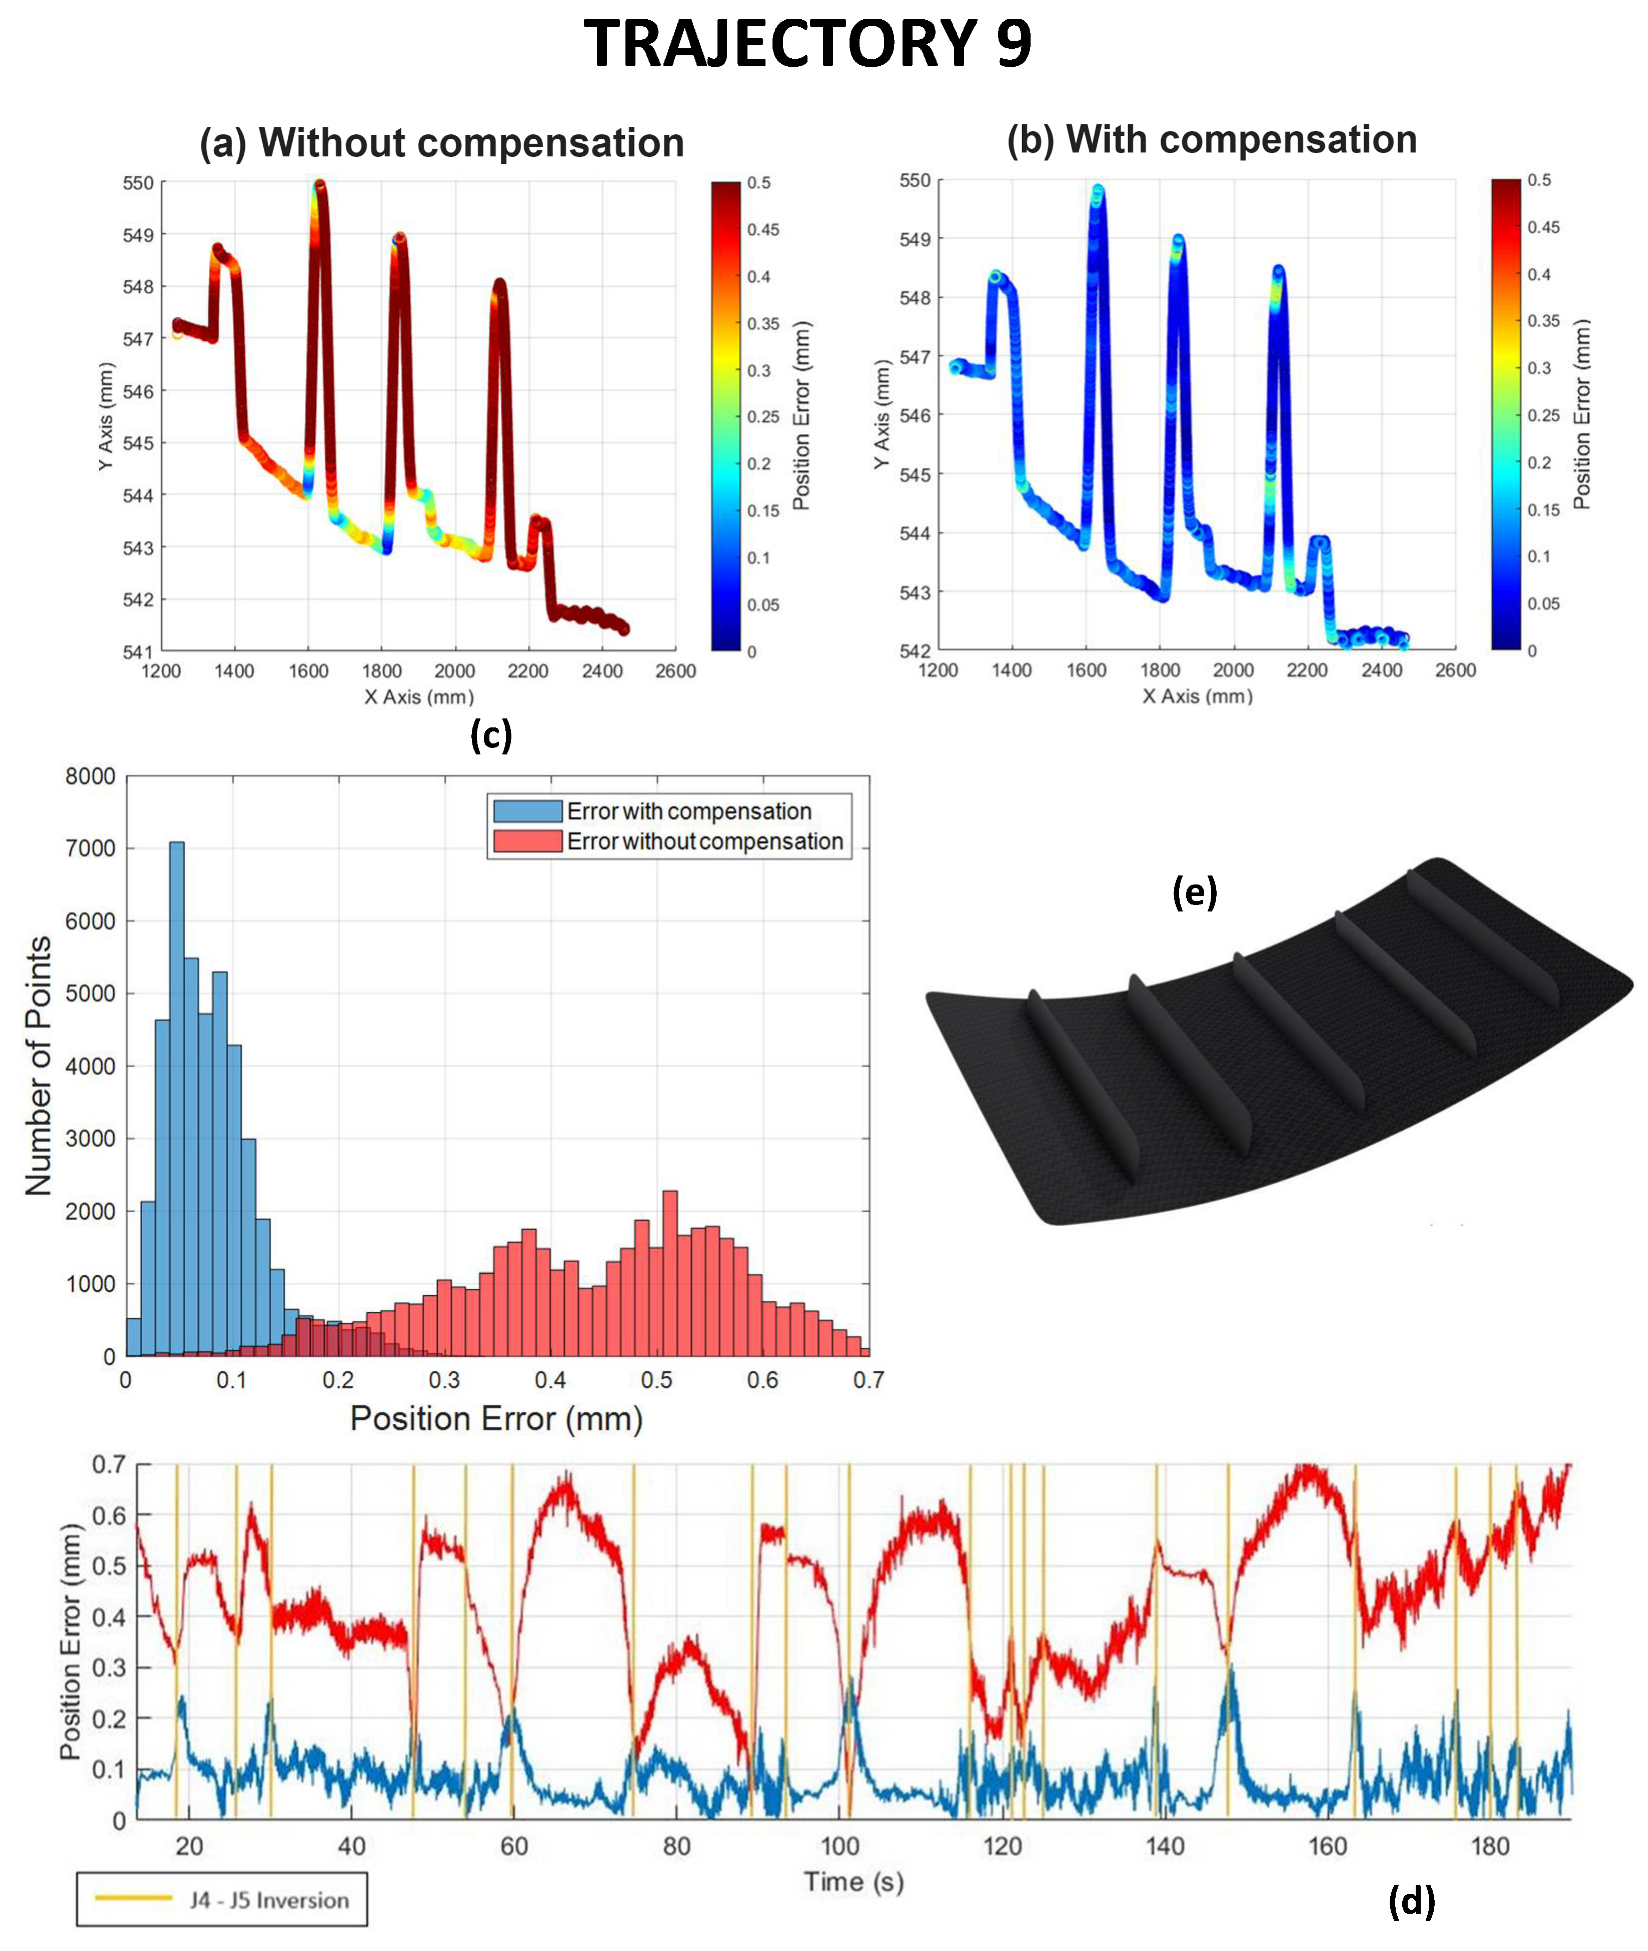
Finally, after the validation tests, the machining paths are executed for an aerospace sector part of 2000 × 700 × 400 mm3, according to ISO 9283 standard [19], with a tool feed of 600 mm/min (Figure 9e). Nine different machining trajectories are designed to follow all the surfaces of the parts. Since all the trajectories lead to similar outcomes, only the ninth is shown without (Figure 9a) and with (Figure 9b) compensation. In Figure 9c, the corresponding errors between the nominal and achieved position trajectories are compared. The descriptive statistics for all trajectories are summarized in Table 7. There, trajectory 4 corresponds to a more demanding machining segment (in terms of robot configuration and load), which explains the larger uncompensated error; nevertheless, the proposed compensation method still mitigates this increased error effectively. The general improvement resulted in a reduction from ±0.534 to ±0.080 mm, on average, and from ±1.804 to ±0.456 mm at peak. This trend is consistently confirmed by robust distribution-based metrics, showing a marked reduction in the median (from 0.517 mm to 0.073 mm), interquartile range (from 0.252 mm to 0.063 mm) and 95th percentile error (from 1.024 mm to 0.213 mm). A paired Wilcoxon signed-rank test between uncompensated and compensated trajectory errors further confirms that the improvement observed in the real-part case is statistically significant (p < 0.001), indicating a consistent reduction across the full trajectory samples.
Figure 9.
For trajectory 9: (a) error position without compensation; (b) error position with compensation; (c) error between the nominal and the reached position, with (blue) and without (red) compensation; (d) error-time signal, with (blue) and without (red) compensation with inversion. (e) Real part of aerospace sector used in Section 3.5.
Table 7.
Position error for all trajectories. The overall values are calculated as follows: the overall sample size is the sum of samples sizes; the overall mean is the grand mean of means (weighted by sample sizes); the overall standard deviation comes from the pooled variance of the variances (weighted by sample sizes); the maximum is the supremum of the maxima. Overall median, IQR, and 95th percentile values are calculated over aggregated samples from all trajectories.
4. Discussion
Our photogrammetry-based error compensation solution has been tested under working conditions emulating those of real industrial robotic machining lines in the aerospace sector.
The workspace volume is a key distinguishing factor between our research and previous studies. In effect, other researchers have carried out the discrete static cube test in volumes below 30% of that used in our study [12,26], as summarized in Table 8. However, these studies are not directly comparable as strict benchmarks, since they differ in regards to robot platform, metrology sensor configuration and bandwidth, test geometry, working environment (laboratory vs. industrial), whether the approach comprises offline calibration or online correction, and payload/end effector mass. For example, [12] report online pose correction using a commercial optical CMM on small-payload 6-DoF serial robots in a controlled setup, whereas [26] report offline absolute calibration of an ABB serial robot using a laser tracker under laboratory conditions and with a comparatively light end effector. In contrast, our system operates in an industrial robotic milling cell with a 50 kg machining head, where compliance, vibration and environmental disturbances are more significant. Accordingly, Table 8 is intended to contextualize the order of magnitude of achievable accuracy rather than to provide a strict performance comparison across heterogeneous platforms. In this context, our results suggest that, under our specific industrial setup and test conditions, comparable sub-millimetre accuracy can be achieved in a substantially larger workspace and under a heavier payload.
Table 8.
Discrete static cube (or equivalent) accuracy results reported in selected related studies and in this work (shown for context only; values depend on robot model, sensor type/bandwidth, test volume definition, environment, payload, and whether compensation is offline or online).
Beyond the numerical comparison, it is worth noting that large-volume operation in a PPE-required machining cell introduces practical constraints (e.g., occlusions, variable visibility/illumination, vibration, and compliance) that are not typically present in controlled laboratory studies. The following discussion analyses how these factors affect the uncompensated error and how the proposed system mitigates it.
For additional context, in their experimental setup, [15] report mean/maximum absolute position errors of 0.147/0.365 mm when calibrating a small 6-DoF robot using a laser tracker and 0.197/0.469 mm using a portable photogrammetry system in a much smaller workspace and under controlled conditions. More recently, [16] report, in their experimental setup, a trajectory-tracking control accuracy of ±0.07 mm (position) on a PUMA 200 using a photogrammetry sensor with an 80 Hz update rate and an advanced robust controller, again in a laboratory-scale setup. In contrast, our work demonstrates comparable sub-millimetre accuracy over a substantially larger workspace and in a PPE-required industrial machining environment with a 50 kg head, where occlusions, compliance and disturbances are more pronounced.
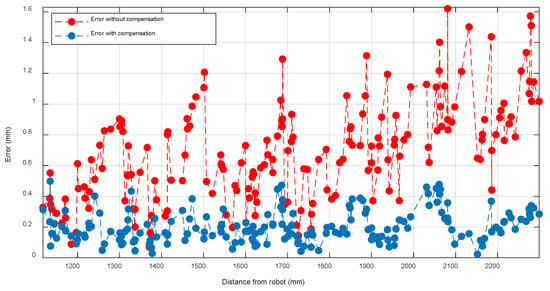
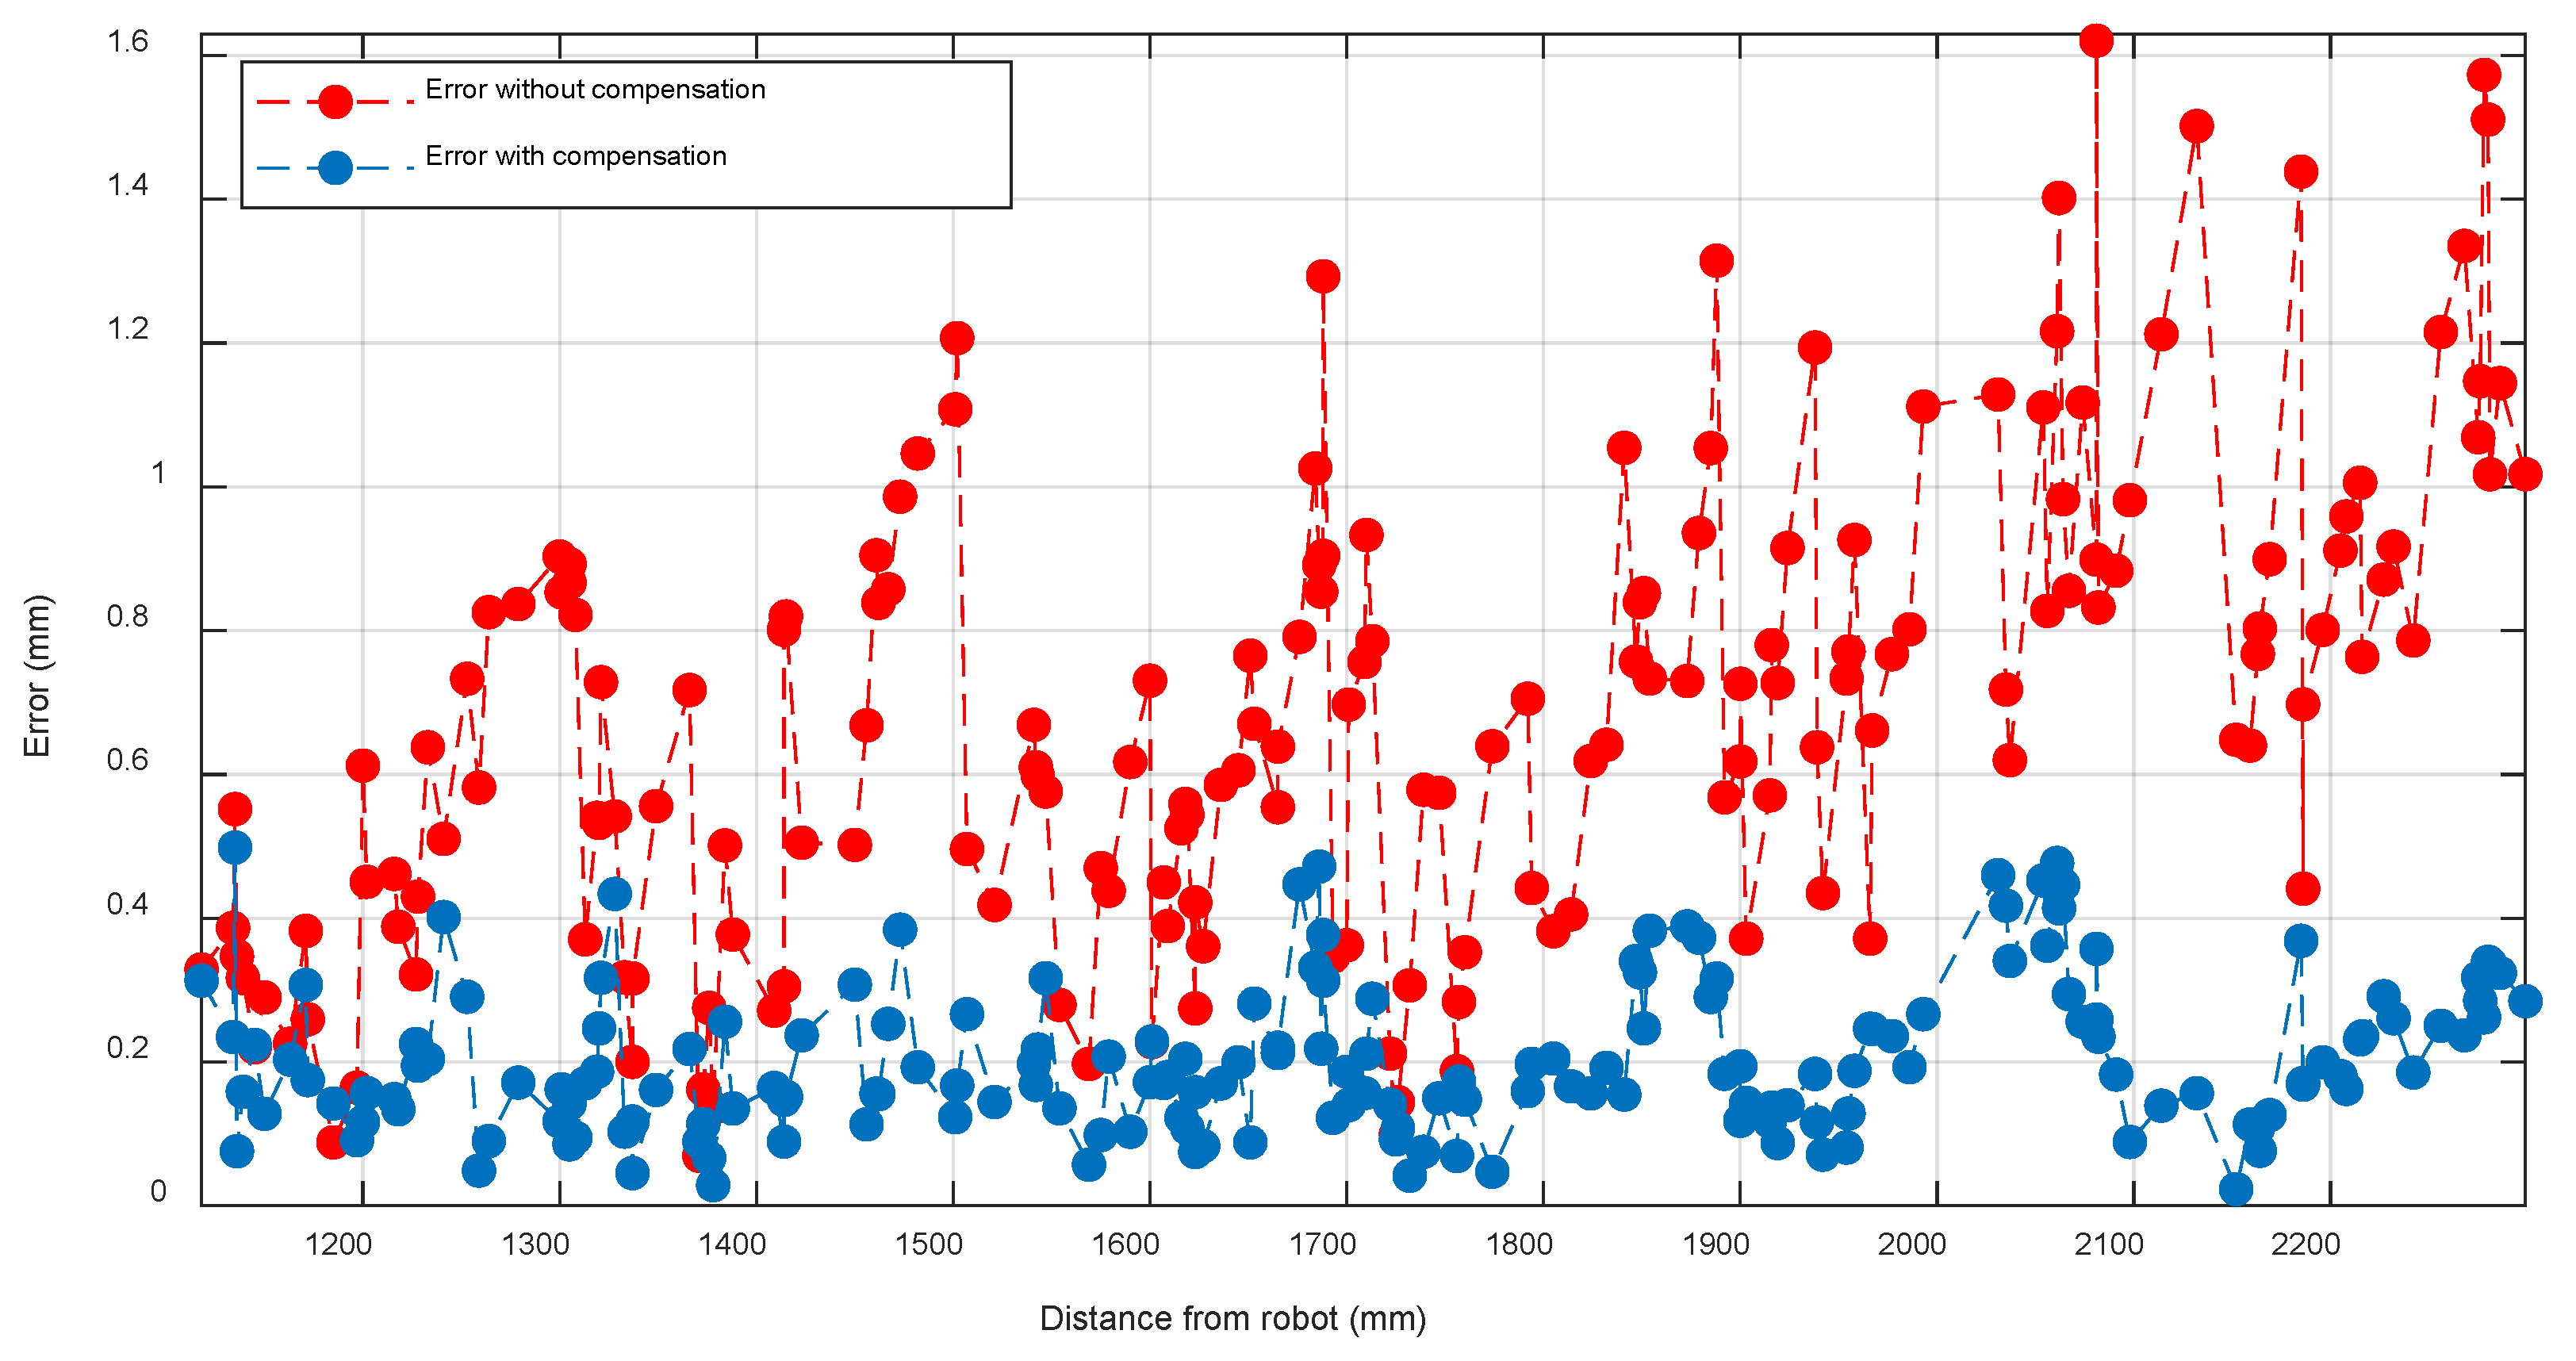
There are three main factors, which our photogrammetric system successfully faced, that have a negative impact on the uncompensated error committed by the robot under both static and dynamic working regimes. On the one hand, the payload adversely affects the accuracy of the most extended positions [27,28,29]. In our case, with a 50 kg machining head, this was noticeable in the discrete static cube test (Figure 7a). Figure 10 displays the error as a function of the distance from the origin of the robot, evincing the increasing trend of the uncompensated robot. In contrast, our photogrammetric system consistently corrects this systematic error, enhancing the accuracy at all distances, regardless of the load.
Figure 10.
Position errors ordered from retracted to extended positions.
On the other hand, Figure 8a–f manifests the existence of waviness and backlash. Our system could significantly compensate them across all axes, especially at lower speeds. Its efficacy is actually limited by its operating frequency (4 Hz), which should be increased to deal with a wider range of milling feed rates. In particular, the Figure 11a backlash effect stands out at the end of the trajectory, when the robot changes direction. The error peak increases with the speed due to angular deviations in the joint angles that cannot be compensated for by the robot in time [30,31,32]. Analogously, the increase in the effect of waviness with the feed rate is notable in Figure 11b. A fully quantitative separation of the individual contributions of occlusions, backlash and waviness would require dedicated experimental protocols and signal-level identification, which are beyond the scope of the present work focused on system-level validation under industrial conditions.
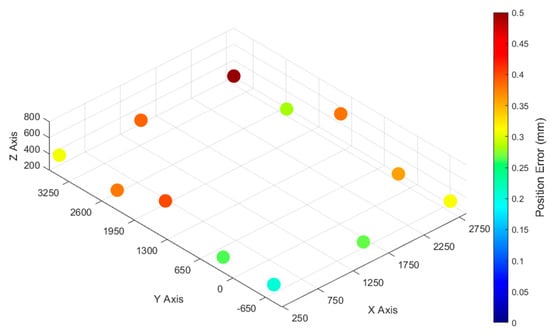
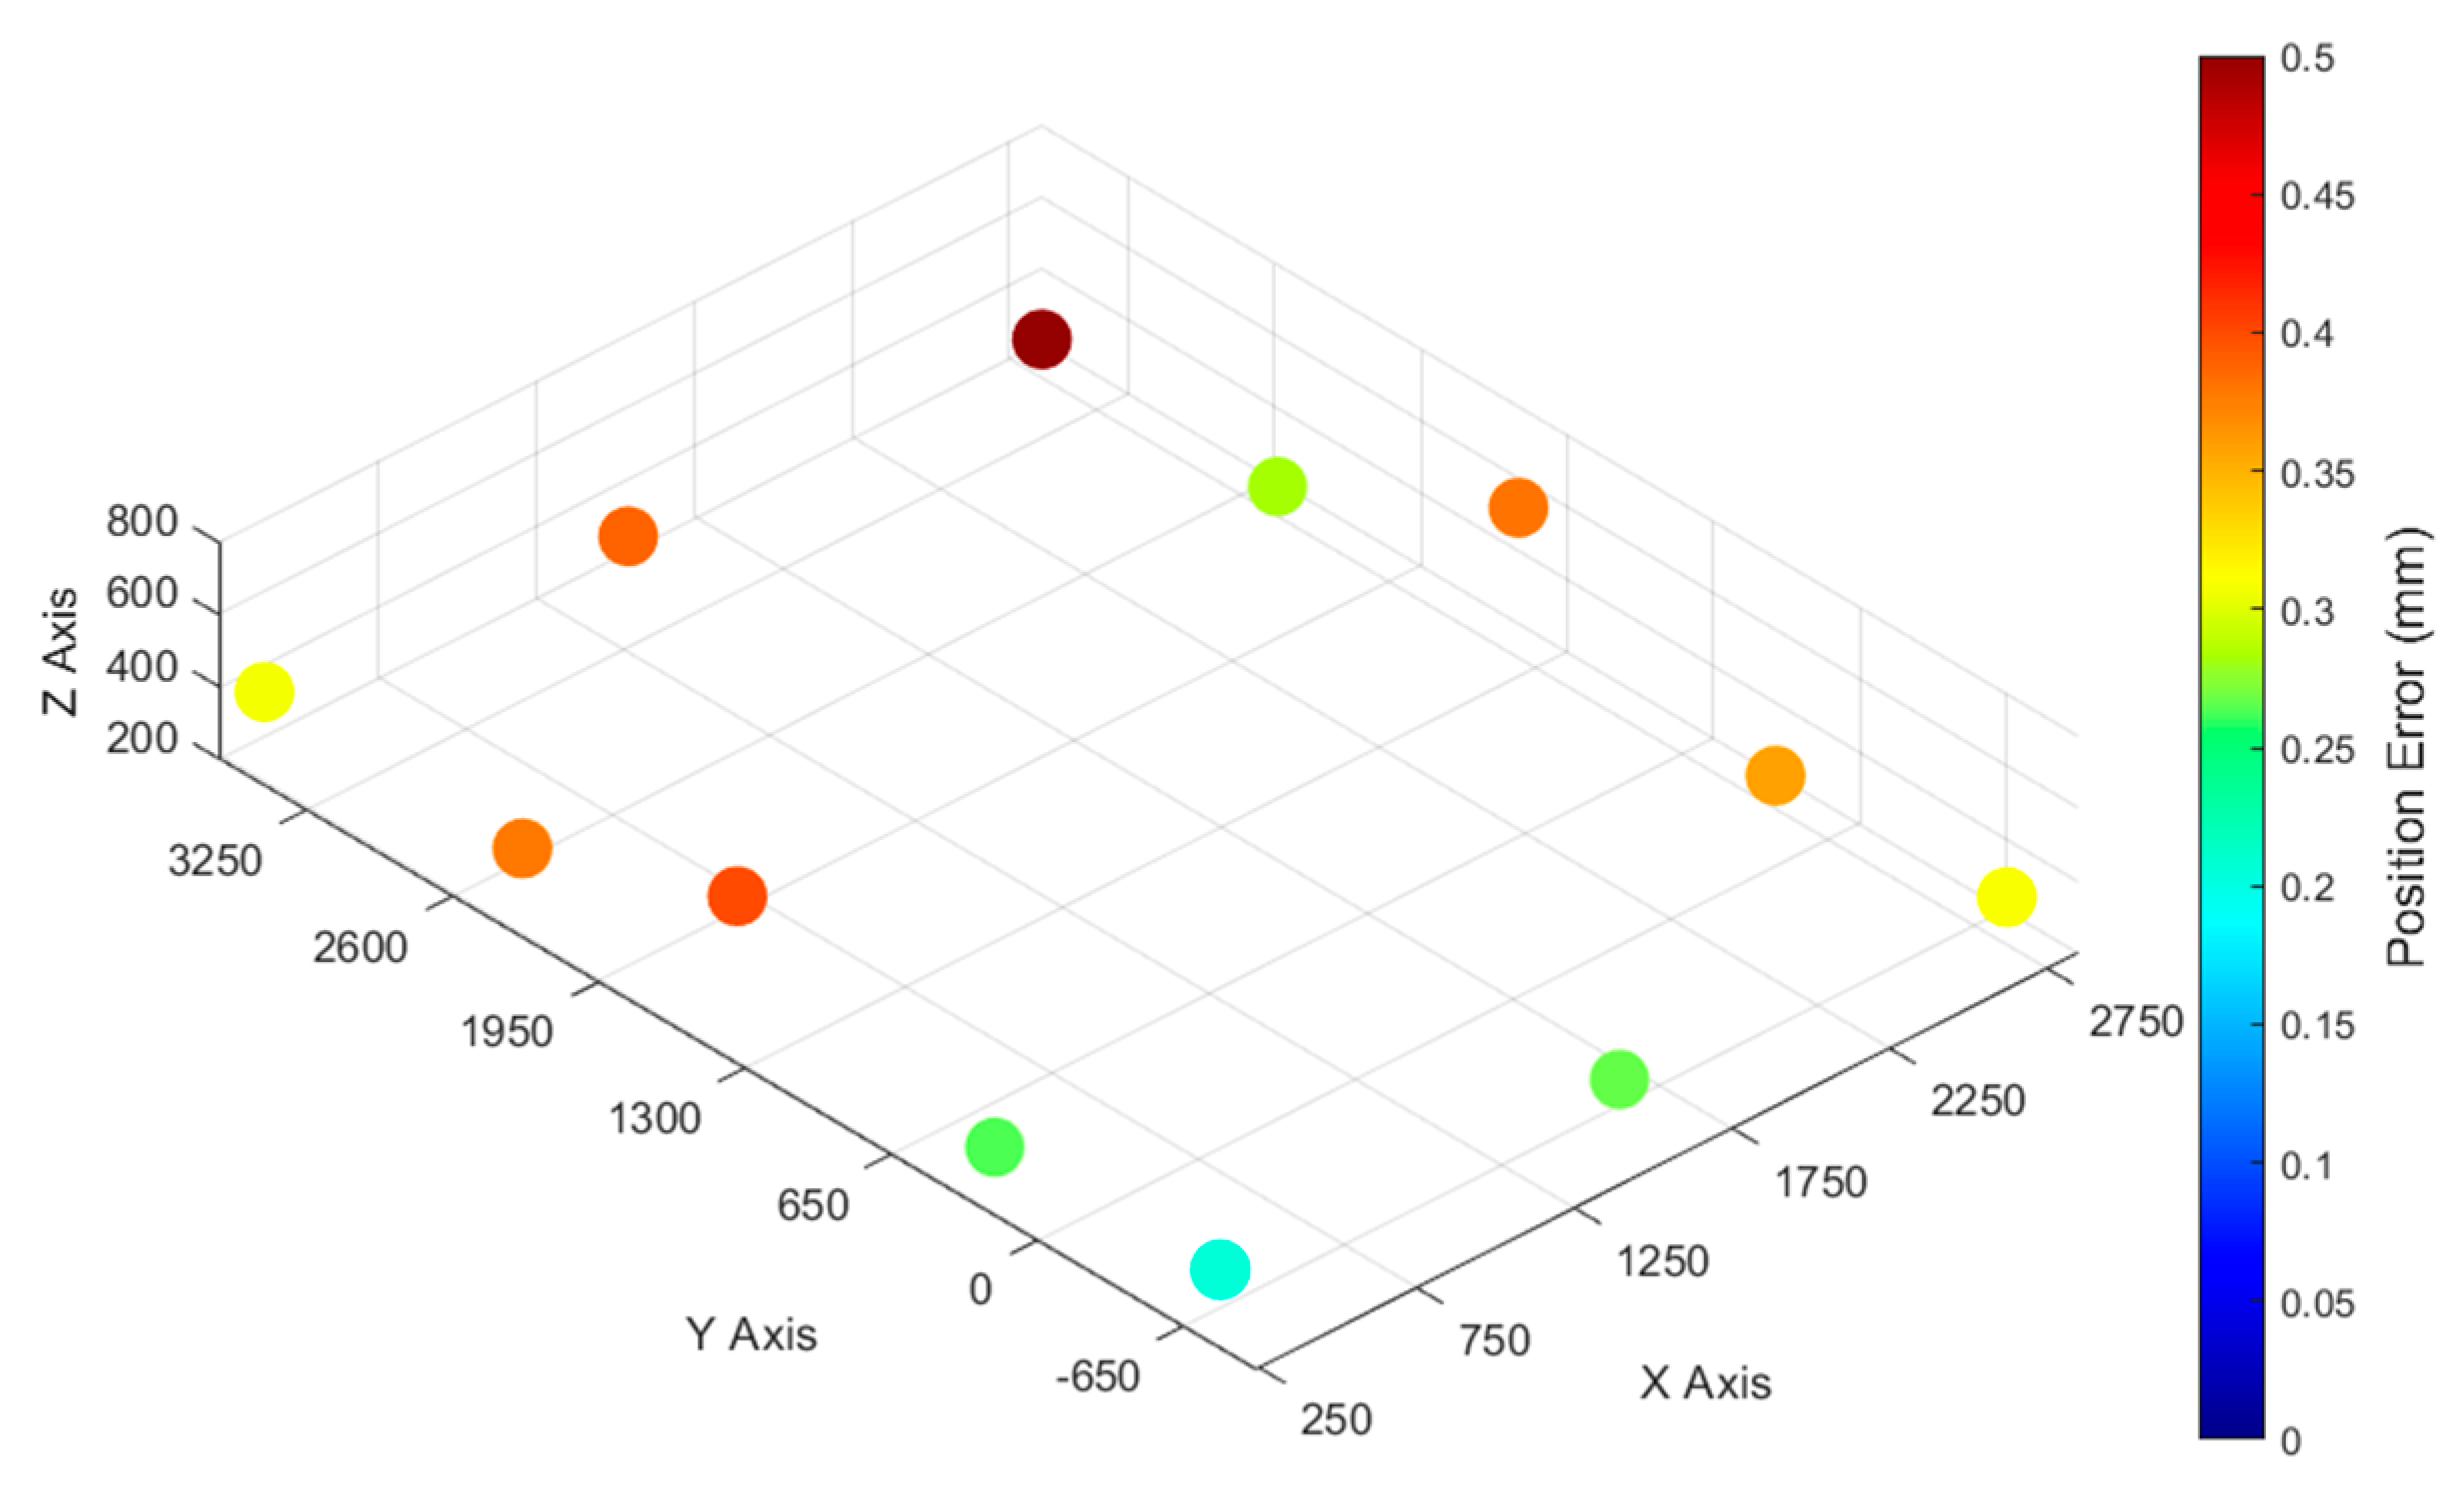
Our photogrammetric system has shown a minimal error level below which it cannot compensate. This can be clearly seen in the pivoting test (Figure 5), where, since the robot is not committing large positioning errors, the compensation improvement is, in relative terms, poorer than in the other tests, but in absolute terms, it remains comparable. This lower saturation of the attainable compensation depends on two factors. First, as mentioned in Section 2.1, a correct calibration of the reference markers is crucial, since the final accuracy of the photogrammetric system hinges upon them. Due to physical limitations, we could not uniformly calibrate all the reference markers (reference objects, cf. Figure 1), and the highest discrepancy between different calibrations was obtained in the top corner (Figure 12). The effect of this heterogeneous calibration is especially noteworthy in the static cube test, where the highest mean error occurs precisely at that corner (Figure 7b). Second, especially when the robot is fully extended, occlusions may arise because some cameras cannot accurately triangulate enough markers of the reference object, which lessens the accuracy of the photogrammetric system. This is the reason why, in Figure 8a, the robot error is not compensated for in the last third of the trajectory. By placing additional cameras, the problem of occlusion could be overcome. Overall, these two effects can be interpreted as setting a practical lower bound on the achievable compensated error, dominated by the repeatability of the multi-camera reference frame (≈0.100 mm) together with the RMS repeatability of the hand–eye least-squares residual (≈0.010 mm). This interpretation is consistent with the larger residual errors observed in regions affected by non-uniform marker calibration (Figure 12) and by partial occlusions (Figure 8a).
Figure 12.
Discrepancy between different scene calibrations.
From an implementation and deployment perspective, the proposed approach entails a modest online computational cost, as real-time compensation relies on lightweight geometric operations, while calibration procedures are performed offline. System scalability to larger workspaces is therefore primarily governed by sensor deployment and visibility considerations rather than by computational complexity, making the method amenable to industrial-scale extensions through increased sensing redundancy.
Finally, our photogrammetric error-compensation system was tested with a real part. Unlike all the validation tests, since a rotating tool was present, the SMR had to be placed on the spindle as close as possible to the tool, and hence, the level of accuracy of this test is not entirely comparable to that of the others, since the reflector location and operating conditions differ from those of the validation tests. It achieves an accuracy enhancement from ±0.534 to ±0.080 mm, on average, and from ±1.804 to ±0.456 mm at peak, which meets the tolerances of the aerospace sector.
5. Conclusions
We have proposed an error-compensation photogrammetry-based integral solution for the large-volume robotic milling machines of the aerospace sector. Through several tests, under both static and dynamic working regimes, we have shown that our solution meets the accuracy requirements of the sector under industrial operating conditions. Indeed, it has boosted the accuracy level from ±0.534 to ±0.080 mm, on average, and from ±1.804 to ±0.456 mm at peak in a large volume in the presence of occlusions. Moreover, it has been unaffected by the weight of the head, and it has mitigated the effects of waviness and backlash. Our system has shown that it can offer a lower saturation of the error compensation, relying on the calibration of the reference markers that can be reached, its operating frequency (waviness and backlash), and the redundancy in the number of cameras (occlusions). Therefore, in future work, we aim at developing a model to optimize the number and distribution of cameras and reference markers necessary to guarantee an acceptable degree of accuracy of our photogrammetric system across the entire working space, regardless of eventual occlusions and spatial restrictions.
Author Contributions
Conceptualization, R.A.; methodology, R.A. and J.L.d.Z.; validation, R.A.; formal analysis, R.A. and P.G.d.A.M.; investigation, R.A. and B.I.; writing—original draft preparation, R.A. and P.G.d.A.M.; writing—review and editing, P.G.d.A.M.; supervision, P.G.d.A.M.; project administration, I.L. and J.M.; funding acquisition, I.L. All authors have read and agreed to the published version of the manuscript.
Funding
This research was funded by project grants FIBREMACH (FTI 971442) of the European Union’s Horizon 2020 research and innovation programme.
Data Availability Statement
The original contributions presented in this study are included in the article. Further inquiries can be directed to the corresponding author.
Acknowledgments
We are thankful to our colleagues Iker Urresti, Asier Barrios and Imanol Herrera who provided expertise that greatly assisted the research.
Conflicts of Interest
The authors declare no conflicts of interest.
Abbreviations
The following abbreviations are used in this manuscript:
| DoF | Degrees of Freedom |
| CMM | Coordinate Measuring Machine |
| LT | Laser Tracker |
| SMR | Spherically Mounted Retroreflector |
| TRL | Technology Readiness Level |
| TCP | Tool Centre Point |
| PPE | Personal Protective Equipment |
| IQR | Interquartile Range |
References
- Ajay Kumar, J.K.; Srinivas, G. Recent trends in Robots Smart Material and its application in Aeronautical and Aerospace Industries. J. Phys. Conf. Ser. 2019, 1172, 012035. [Google Scholar] [CrossRef] [Scilit]
- Muelaner, J.E.; Wang, Z.; Maropoulos, P.G. Concepts for and analysis of a high accuracy and high capacity (HAHC) aerospace robot. Proc. Inst. Mech. Eng. Part B J. Eng. Manuf. 2011, 225, 1393–1399. [Google Scholar] [CrossRef] [Scilit]
- Pereira, B.; Griffiths, C.A.; Birch, B.; Rees, A. Optimization of an autonomous robotic drilling system for the machining of aluminum aerospace alloys. Int. J. Adv. Manuf. Technol. 2022, 119, 2429–2444. [Google Scholar] [CrossRef] [Scilit]
- Stanton, D. Fundamentals of manipulator calibration: B. W. Mooring, Z.S. Roth and M. R. Driels. Automatica 1993, 29, 1151–1153. [Google Scholar] [CrossRef] [Scilit]
- Möller, C.; Schmidt, H.C.; Koch, P.; Böhlmann, C.; Kothe, S.M.; Wollnack, J.; Hintze, W. Machining of large scaled CFRP-Parts with mobile CNC-based robotic system in aerospace industry. Procedia Manuf. 2017, 14, 17–29. [Google Scholar] [CrossRef] [Scilit]
- Chen, D.; Lü, P.; Xue, L.; Xing, H.; Lu, L.; Kong, D. Positional error compensation for aviation drilling robot based on Bayesian linear regression. Eng. Appl. Artif. Intell. 2024, 127, 107263. [Google Scholar] [CrossRef] [Scilit]
- Zhu, W.; Mei, B.; Yan, G.; Ke, Y. Measurement error analysis and accuracy enhancement of 2D vision system for robotic drilling. Robot. Comput. Integr. Manuf. 2014, 30, 160–171. [Google Scholar] [CrossRef] [Scilit]
- Klimchik, A.; Pashkevich, A. Robotic manipulators with double encoders: Accuracy improvement based on advanced stiffness modeling and intelligent control. IFAC-Pap. 2018, 51, 740–745. [Google Scholar] [CrossRef] [Scilit]
- Ginani, L.S.; Maurício, J.; Motta, S.T. Theoretical and Practical Aspects of Robot Calibration with Experimental Verification. J. Braz. Soc. Mech. Sci. Eng. 2011, 33, 15–21. [Google Scholar] [CrossRef] [Scilit]
- Puerto, P.; Leizea, I.; Herrera, I.; Barrios, A. Analyses of Key Variables to Industrialize a Multi-Camera System to Guide Robotic Arms. Robotics 2023, 12, 10. [Google Scholar] [CrossRef] [Scilit]
- Szybicki, D.; Obal, P.; Kurc, K.; Gierlak, P. Programming of Industrial Robots Using a Laser Tracker. Sensors 2022, 22, 6464. [Google Scholar] [CrossRef] [Scilit]
- Gharaaty, S.; Shu, T.; Joubair, A.; Xie, W.F.; Bonev, I.A. Online pose correction of an industrial robot using an optical coordinate measure machine system. Int. J. Adv. Robot. Syst. 2018, 15, 1729881418787915. [Google Scholar] [CrossRef] [Scilit]
- Liu, Y.; Li, Y.; Zhuang, Z.; Song, T. Improvement of robot accuracy with an optical tracking system. Sensors 2020, 20, 6341. [Google Scholar] [CrossRef] [Scilit] [PubMed]
- Leizea, I.; Herrera, I.; Puerto, P. Calibration Procedure of a Multi-Camera System: Process Uncertainty Budget. Sensors 2023, 23, 589. [Google Scholar] [CrossRef] [Scilit]
- Filion, A.; Joubair, A.; Tahan, A.S.; Bonev, I.A. Robot calibration using a portable photogrammetry system. Robot. Comput.-Integr. Manuf. 2018, 49, 1339–1351. [Google Scholar] [CrossRef] [Scilit]
- Zakeri, E.; Xie, W.F. Robust Photogrammetry Sensor-Based Real-Time Pose Control of Industrial Robots. IEEE/ASME Trans. Mechatron. 2024, 29, 3509–3521. [Google Scholar] [CrossRef] [Scilit]
- Meng, F.; Wei, J.; Feng, Q.; Dong, Z.; Kang, R.; Guo, D.; Yang, J.A.; Meng, F.; Wei, J.; Feng, Q.; et al. A Robot Error Prediction and Compensation Method Using Joint Weights Optimization Within Configuration Space. Appl. Sci. 2024, 14, 11682. [Google Scholar] [CrossRef] [Scilit]
- Zhou, Z.; Zhang, X.; Sun, X.; Xia, F.; Zeng, J. Accuracy-Enhanced Calibration Method for Robot-Assisted Laser Scanning of Key Features on Large-Sized Components. Sensors 2025, 25, 7518. [Google Scholar] [CrossRef] [Scilit] [PubMed]
- ISO 9283; Manipulating Industrial Robots—Performance Criteria and Related Test Methods. International Organization for Standardization: Geneva, Switzerland, 1998.
- Luhmann, T. Close range photogrammetry for industrial applications. ISPRS J. Photogramm. Remote Sens. 2010, 65, 558–569. [Google Scholar] [CrossRef] [Scilit]
- Đalić, V.; Jovanović, V.; Marić, P. Submillimeter-Accurate Markerless Hand–Eye Calibration Based on a Robot’s Flange Features. Sensors 2024, 24, 1071. [Google Scholar] [CrossRef] [Scilit]
- Tabb, A.; Ahmad Yousef, K.M. Solving the robot-world hand-eye(s) calibration problem with iterative methods. Mach. Vis. Appl. 2017, 28, 569–590. [Google Scholar] [CrossRef] [Scilit]
- Powell, M.J.D. A Hybrid Method for Nonlinear Equations. In Numerical Methods for Nonlinear Algebraic Equations; Rabinowitz, P., Ed.; Gordon and Breach, Science Publishers Ltd.: Philadelphia, PA, USA, 1970; pp. 87–161. Available online: https://archive.org/details/numericalmethods0000unse_z6j2/page/n11/mode/2up (accessed on 20 April 2026).
- Oh, J.Y.; Choi, S.J.; Kim, C.J.; Heo, S.; Lee, W. Estimation and compensation of cutting force induced position error in robot machining system. Precis. Eng. 2024, 86, 101–108. [Google Scholar] [CrossRef] [Scilit]
- Wang, Z.; Zhang, R.; Keogh, P. Real-Time Laser Tracker Compensation of Robotic Drilling and Machining. J. Manuf. Mater. Process. 2020, 4, 79. [Google Scholar] [CrossRef] [Scilit]
- Nubiola, A.; Bonev, I.A. Absolute calibration of an ABB IRB 1600 robot using a laser tracker. Robot. Comput.-Integr. Manuf. 2013, 29, 236–245. [Google Scholar] [CrossRef] [Scilit]
- Hsiao, J.C.; Shivam, K.; Lu, I.F.; Kam, T.Y. Positioning Accuracy Improvement of Industrial Robots Considering Configuration and Payload Effects Via a Hybrid Calibration Approach. IEEE Access 2020, 8, 228992–229005. [Google Scholar] [CrossRef] [Scilit]
- Ismail, A.R.; Hassan, A.; Shamsuddin, S.; Nuawi, M.Z.; Ab Rahman, M.N. The Performance Analysis of Industrial Robot Under Loaded Conditions and Various Distance. Int. J. Math. Models Methods Appl. Sci. 2008, 2, 277–284. [Google Scholar]
- Zhang, D.; Wei, B. Study on payload effects on the joint motion accuracy of serial mechanical mechanisms. Machines 2016, 4, 21. [Google Scholar] [CrossRef] [Scilit]
- Jaber, A.; Jaber, A.A.; Bicker, R. Industrial Robot Backlash Fault Diagnosis Based on Discrete Wavelet Transform and Artificial Neural Network. J. Math. Sci. Appl. 2016, 4, 21–31. [Google Scholar] [CrossRef]
- Tian, W. The problem in Accuracy Compensation of Industrial Robot. Int. Robot. Autom. J. 2017, 3, 282–283. [Google Scholar] [CrossRef] [Scilit]
- Zhang, R.; Wang, Z.; Bailey, N.; Keogh, P. Experimental assessment and feedforward control of backlash and stiction in industrial serial robots for low-speed operations. Int. J. Comput. Integr. Manuf. 2023, 36, 393–410. [Google Scholar] [CrossRef] [Scilit]

Disclaimer/Publisher’s Note: The statements, opinions and data contained in all publications are solely those of the individual author(s) and contributor(s) and not of MDPI and/or the editor(s). MDPI and/or the editor(s) disclaim responsibility for any injury to people or property resulting from any ideas, methods, instructions or products referred to in the content. |
© 2026 by the authors. Licensee MDPI, Basel, Switzerland. This article is an open access article distributed under the terms and conditions of the Creative Commons Attribution (CC BY) license.