


Abstract
Reliable property prediction in extrusion-based additive manufacturing remains challenging under extreme data scarcity (e.g., sample size of <50), particularly when experiments are constrained by designed studies such as Taguchi orthogonal arrays. In direct ink writing of lignocellulosic composites, limited experimental runs restrict the development of predictive models capable of guiding formulation and process optimization. This study introduces a physics-consistent data augmentation framework to enhance predictive reliability while preserving material-consistent behavior. Synthetic data are evaluated using four criteria: sensitivity to augmentation size, distributional consistency with experimental observations, stability with respect to boosting depth in regression modeling, and preservation of physics-consistent factor hierarchies through interpretability analysis. The framework is validated using compressive strength data from direct ink writing experiments conducted under an extremely small data regime. Results show that augmentation performance depends on the augmentation scale and model capacity. Variational autoencoder-based augmentation produced more stable and physically consistent predictions than conditional tabular generative adversarial networks in this application. Increasing predictive accuracy alone, or applying excessive augmentation, can distort material hierarchies and reduce physics consistency. The proposed evaluation framework supports reliable and interpretable property prediction in additive manufacturing when experimental data are severely limited.
1. Introduction
There is a growing interest in additive manufacturing (AM) for sustainable construction and advanced materials processing [1,2,3]. It facilitates customized and personalized designs [4] and is essential for modularity as well as vertical and horizontal integration in production systems; all of which are critical techno-functional principles of Industry 5.0 [5]. Among various AM techniques, direct ink writing (DIW) has attracted attention due to its versatility in fabricating composite systems with complex geometries. Recently, earthen-based DIW, often reinforced with natural fibers or biopolymers, has been explored as an environmentally friendly alternative to conventional cementitious systems [6,7,8,9,10]. Such slurries combine clay, sand, and geopolymers with additives such as cellulose nanocrystals (CNC), wood particles/fibers, plasticizers, e.g., glycerol, and biopolymers e.g., xanthan gum to improve rheology, shrinkage control, and mechanical performance [7,9,10,11]. However, the compressive strength of printed composites remains highly sensitive to slurry composition, thus making predictive modeling a critical tool for optimal slurry design [6]. Because these systems depend on small, labor-intensive datasets, progress increasingly requires ML models that remain accurate and interpretable under extreme data scarcity.
This study addresses the broader challenge that AM processes, particularly materials-focused DIW, suffer from: extremely limited experimental datasets [12,13]. Such a limitation results in optimization of mix design via multiple factors and numerous trial-and-error experiments [14]. Because of the relatively novel technology and specific experimental requirements, collecting big and diverse datasets is very difficult due to cost and time constraints [15,16,17]. Each printing and curing cycle is time- and resource-intensive, limiting studies to a very small number of samples. For example, the literature in DIW of fiber-reinforced soil-based systems often lacks systematic design of experiment (DOE), over-relying on trial and error for slurry optimization with datasets of <50 samples [6] compared to relatively larger datasets (~50–300) in polymer or concrete AM [15,18]. This scarcity prevents effective use of standard ML techniques, which traditionally assume large, balanced training datasets. Consequently, prediction of mechanical properties, such as 28-day compressive strength, remains uncertain, and opportunities for systematic slurry optimization are lost. While prior research has examined rheological behavior of slurry, shrinkage trend, and strength development in soil- and fiber-based composites [7,19,20], these studies offer a limited understanding of how ML models behave under extreme data scarcity. Few attempts have been made to introduce data augmentation into AM materials science [21], with a focus predominantly on process monitoring and defect detection [22,23,24] and scarce research on property prediction in 3D-printed metal [25] and concrete systems [26]. However, no studies have evaluated augmentation as a foundation for reliable predictive modeling in materials-centric DIW systems.
Generative modeling offers a promising opportunity to address the aforementioned knowledge gap. Algorithms such as the Conditional Tabular GAN (CTGAN) [27] and Tabular Variational Autoencoder (TVAE) [28] synthesize realistic tabular data by learning distributions of categorical and continuous variables. These models have shown potential in healthcare, finance, and other small-data contexts [29], but remain unexplored in AM. However, this requires the challenges associated with data augmentation to be addressed. While synthetic data may boost accuracy, they can also distort underlying feature relationships, producing misleading importance rankings that conflict with the known physics of composite systems [30,31]. Thus, augmentation must be evaluated not only on predictive accuracy but also on stability and physical plausibility. To our knowledge, no AM study has systematically evaluated generative augmentation under extremely small experimental datasets, nor examined whether synthetic data preserve factor hierarchies when used for property prediction. Existing ML studies rarely test whether augmentation distorts material relationships or integrate explainable ensemble models to benchmark synthetic data against experimental evidence. This creates a clear need for approaches that not only expand effective dataset size but also maintain stability and physical interpretability, which are essential requirements for trustworthy AI in AM.
To address the limitations highlighted above, this work introduces a framework for trustworthy AI and predictive modeling in direct ink writing (DIW) under extremely small data regimes. The framework is validated on a dataset acquired from DIW made of a wood–CNC–clay composite. The approach integrates synthetic data generation with a physics-aligned, explainable ensemble model. Two tabular generative models, CTGAN and TVAE, are used to expand a 32-run experimental dataset in controlled increments, while a TreeNet gradient boosting machine (GBM) serves as the predictive engine due to its strong performance on tabular materials data with inherent interpretability. The framework goes beyond conventional single-metric evaluation and incorporates several complementary criteria: (i) predictive accuracy (R2, MAPE) and its variation with augmentation size; (ii) robustness to boosting depth (model stability); (iii) preservation of factor hierarchy through XML (Pareto importance compared against ANOVA); (iv) distributional consistency between synthetic and real data; and (v) parsimony in augmentation size to avoid distortion of the underlying material relationships. These components establish a systematic method for determining whether augmentation enhances predictive modeling without compromising the physics of the process.
2. The Physics-Aligned Generative Augmentation Framework
We propose a physics-aligned generative augmentation framework for reliable predictive modeling in AM, which can be used specifically for ink fine-tuning for properties optimization. In addition, we propose a framework based on a multi-criteria selection procedure for optimal data augmentation and ML-based predictive modeling in AM projects. The proposed methodology is evaluated on a 32-run experimental dataset collected from the DIW of a clay composite.
2.1. Data Augmentation
Small datasets are split into training and test subsets, and augmentation is applied exclusively to the training set. Synthetic data are generated using two tabular generative models designed for mixed categorical–numeric data: the Conditional Tabular GAN (CTGAN) and the Tabular Variational Autoencoder (TVAE). Synthetic data generation and curation were implemented in Python 3.10 using the SDV library (CTGAN and TVAE models) together with NumPy, pandas, SciPy, and openpyxl for data processing, diagnostics, and Excel output generation.
2.1.1. Conditional Tabular GAN (CTGAN)
The CTGAN model consists of a generator and discriminator trained adversarially to learn the joint tabular distribution. Categorical variables are represented as discrete levels, and the continuous response variable is handled using mode-specific normalization to capture its empirical distribution. The two CTGAN configurations are shown in Table 1. Config A uses larger hidden layers to increase representational capacity, whereas Config B employs reduced layer sizes to constrain model complexity under small-data conditions. Training epochs are adjusted between configurations to examine sensitivity to effective model capacity. The hyperparameters were set by trial and error to represent models with high- and low-capacity configurations.
Table 1.
Conditional Tabular GAN (CTGAN) configurations.
2.1.2. Tabular Variational Autoencoder (TVAE)
The TVAE model is a latent-variable generative approach composed of encoder and decoder networks. The encoder maps each tabular row to a probabilistic latent representation, and the decoder reconstructs the original variables from this latent space. The training objective combines reconstruction loss with Kullback–Leibler divergence regularization to structure the latent distribution. Two TVAE configurations are evaluated, as shown in Table 2. Config A uses larger network layers and higher latent dimensionality to increase representational flexibility, whereas Config B employs reduced layer sizes and a compact latent embedding to constrain complexity under limited data.
Table 2.
Tabular Variational Autoencoder (TVAE) configurations.
2.2. Curation Pipeline
To avoid information leakage and distributional drift, generated rows should be curated before augmentation using the following steps: (1) Iterative over-generation: sample large batches (e.g., 500 rows per iteration) until enough valid rows remain after filtering; (2) Schema enforcement: enforce correct data types (categorical vs. numeric); (3) Categorical validity: drop rows containing unseen category levels; (4) Deduplication: remove duplicate rows within synthetic samples and between synthetic samples and the real training set; (5) Range clipping: restrict compressive strength to the observed training range [y_min, y_max]; (6) Distribution matching: downsample (if needed) to ensure categorical level proportions matched the real training distribution. Diagnostics included the Kolmogorov–Smirnov (KS) statistic for comparing model output distributions (real vs. synthetic) and total variation distance for categorical variables. Importantly, no tuning was done against the test set.
2.3. Augmentation Fine Tuning and Selection Criteria
For each CTGAN and TVAE configuration, curated training sets were generated at different augmentation sizes. For small training data (e.g., <50 sample size), the augmentation size of +25, +50, +75, +100, +150, and +200 rows can be tested and compared. Each augmented set was added to the real training rows, while the real test rows remained unchanged for all experiments. Random seeds and schema metadata stayed fixed for reproducibility. Both real-only and augmented datasets were then be used to train the ML-based predictive modeling. Under this framework, we propose explainable machine learning (XML) models. In specific, tree-based ensemble learning models such as gradient boosting machines could be practical choices due to their inherent interpretability, the ability to study the model performance against the boosting depth, and their success in handling small-sized structured data.
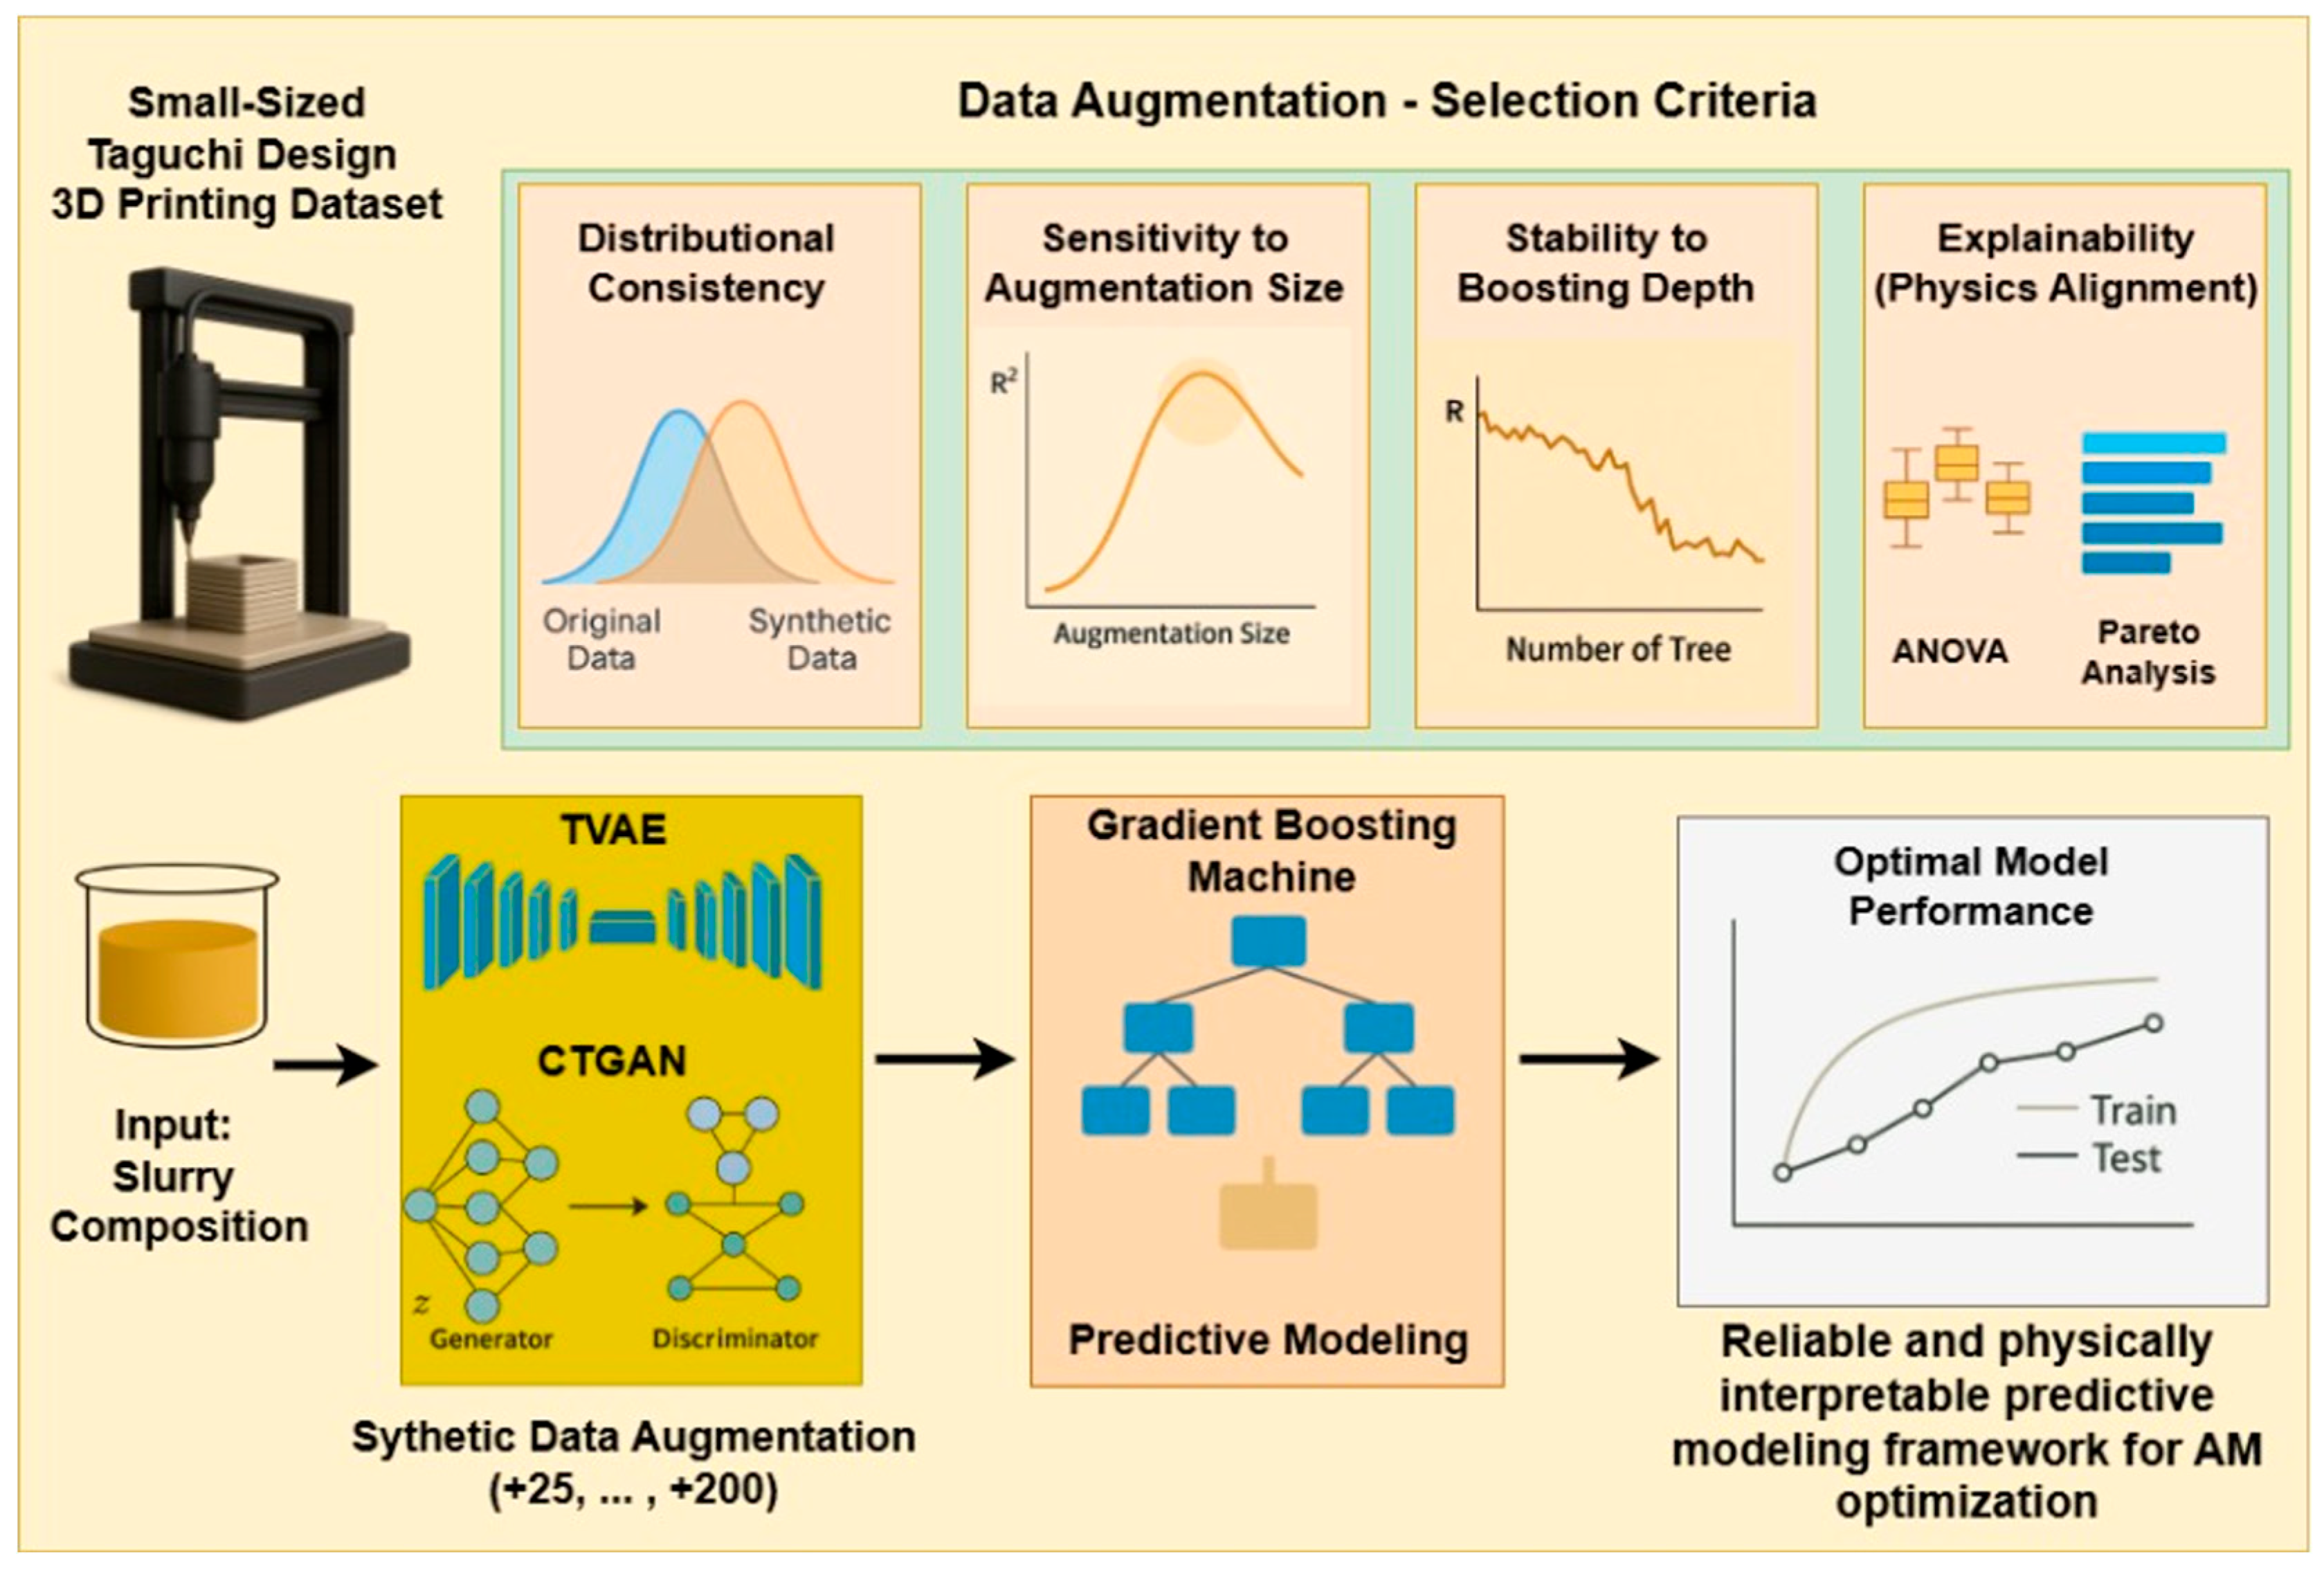
We are proposing four critical selection criteria for developing a physics-aligned generative augmentation framework:
- Distributional Consistency: Synthetic data must maintain the statistical distribution of the real experimental dataset, ensuring that augmentation does not introduce non-physical modes. A generative model is only trustworthy if the augmented dataset resembles the material system it claims to represent.
- Sensitivity to Augmentation Size: Augmentation must improve predictive power without overshooting into distortion; beyond a certain size, synthetic samples can dilute real physics and degrade model fidelity. Evaluating R2 vs. augmentation curves prevent blind “more data is better” assumptions.
- Stability to Boosting Depth: A reliable generative model should yield a predictive model whose performance is stable across boosting depth. If test R2 collapses as trees increase, the augmentation is injecting noise or unstable feature interactions.
- Explainability (Physics Alignment): Synthetic data must preserve the functional hierarchy of material factors—verified via Pareto importance consistent with ANOVA. If the augmented model reverses or corrupts known physics, it cannot be trusted, regardless of accuracy.
Figure 1 shows the flowchart of the proposed framework along with the listed four selection criteria.
Figure 1.
Physics-aligned generative augmentation and predictive modeling framework. A small 3D printing Taguchi dataset is expanded using CTGAN and TVAE, evaluated through four criteria—distributional consistency, augmentation sensitivity, boosting depth stability, and explainability—before training a gradient boosting machine model. The resulting workflow enables reliable and physically interpretable property prediction under extremely small data regimes in additive manufacturing (image partially enhanced using ChatGPT 5.2).
3. 3D Printing Experiments and Methods
The proposed framework is examined and validated using a small dataset generated from the DIW of wood–CNC-reinforced clay composite. The slurry composition is used as an input of the ML-based predictive model for compressive strength prediction. Compressive strength is a key performance indicator (KPI) of 3D printed clay composites. Thus, fine-tuning the slurry to achieve a maximum 28 days of compressive strength is a critical DIW objective. The small-sized experimental dataset was based on a L32 Taguchi design. CTGAN and TVAE were used for physics-aligned generative augmentation. The rest of the section explains details of the case study and the experiments.
3.1. Materials and Slurry Preparation
Wood particles from hardwood (Maple) and softwood (mix of white pine and ponderosa pine), purchased from American Wood Fibers, Columbia, MD, USA, were used. The size of the fibers was <250 microns, and the moisture content was 8%. The particle size distribution of the wood particles is as follows: hardwood (HW) grade (250 microns) consists of <0.36%, 180 microns: 0–15%, 150 microns: 0–45%, 125 microns: 0–9%, and balance pan: minimum 30%. Softwood (SW) grade (250 microns) consists of <0.36%, 180 microns: 0–5%, 150 microns: 0–35%, 125 microns: 0–40%, and balance pan: minimum 40%. The bulk density for the softwood grade is 8 lbs/cu.ft, while the hardwood grade has a bulk density of 11 lbs/cu.ft.
The relative density of clay used in this study is 2.6 g/cc with the following mineralogical composition: kaolinite (10–25 wt%), feldspar (10–25 wt%), crystalline silica- quartz (10–25 wt%), kaolin (10–25 wt%), talc–steatite (<2 wt%), titanium dioxide (<2 wt%), mica group (<2 wt%), and dolomite (<2 wt%), all mixed with tap water. The clay was purchased from Laguna Clay Company, City of Industry, CA, USA. Xanthan gum (XG) was used as a binder. Cellulose nanocrystal (CNC) was purchased from the University of Maine PDC Nanocellulose Store, Orono, ME, USA which was used as a rheology modifier and reinforcing nanofiller. The bulk density of the CNC used in this study is 1 g/cc. The CNC suspension had a solid concentration of 10.9 wt% in the supplied aqueous solution. Glycerol was supplied by Sigma-Aldrich, Petaling Jaya, Malaysia, and used as a plasticizer; the density of glycerol is 1.25 g/mL, with a molecular weight of 92.09 g/mol. The specimen preparation was carried out in two steps. In the first step, the solution was prepared by measuring the required quantity of xanthan gum, glycerol, CNC, and water, and blending them using a Ninja Professional Plus Blender (1400 Peak Watt, Model: BN701) at the highest speed, which was purchased from Amazon, manufactured by SharkNinja, Suzhou, China. In the second step, the measured quantity of clay and sawdust was manually mixed. The solution prepared in the first step was added to the mix of clay and wood particles. A spatula was used to mix the mixture for one minute and then the Hobart mixer (Model HL200)was used for 10 min at first gear (107 rpm) to make the homogenous slurry. The mixer was manufactured by Hobart, located in Troy, OH, USA. Next, the slurry was loaded into the tube for 3D printing.
3.2. Design of Experiment, 3D Printing, and Strength Measurement
The input parameters/variables in the study included type of wood species (softwood vs. hardwood), wood wt%, water content (WC) wt%, XG wt%, CNC wt%, and glycerol wt%. To calculate the wt% for each ingredient in the slurry, the total weight of clay and wood particles (C + W) was kept fixed. The wood particle was measured on the wt% of C + W. The required quantity of clay was weighted by deducting the calculated weight of wood particles (W) from the total weight of clay and wood particles (C + W). Likewise, XG, CNC, glycerol, and water were also measured on the wt% of the total weight of clay and wood particles (C + W). Table 3 shows the mix design used in this work. Taguchi Design of Experiment (DoE) was created to decrease the number of full factorial experiments. Input of six factors with mixed levels as shown in 3 resulted in 32 slurry compositions and printing conditions. Each mix design was printed with three replicates. 3D Potterbot 10 XL printer was used in this work. Additional information about the printer can be found in [9]. A prototype model of solid hollow cube was created in Fusion 360, and it was exported in .stl file which was then imported on Ultimaker Cura 5.7.1 software for slicing. During the slicing, the cube was made hollow with wall thickness of 12 mm. The printed hollow cubes had dimensions of 50 × 50 × 50 mm with a wall thickness of 12 mm and an internal void width of 26 mm. Printing was conducted at a speed of 20 mm/s using a nozzle diameter of 6 mm and a layer height of 1.8 mm. Based on the layer toolpath length (~304 mm per layer), the calculated bonding time interval between successive layers was approximately 15.2 s. The printed cubes were then left to cure at room temperature (25 °C).
Table 3.
Mix design used in DIW of wood–CNC reinforced clay composite.
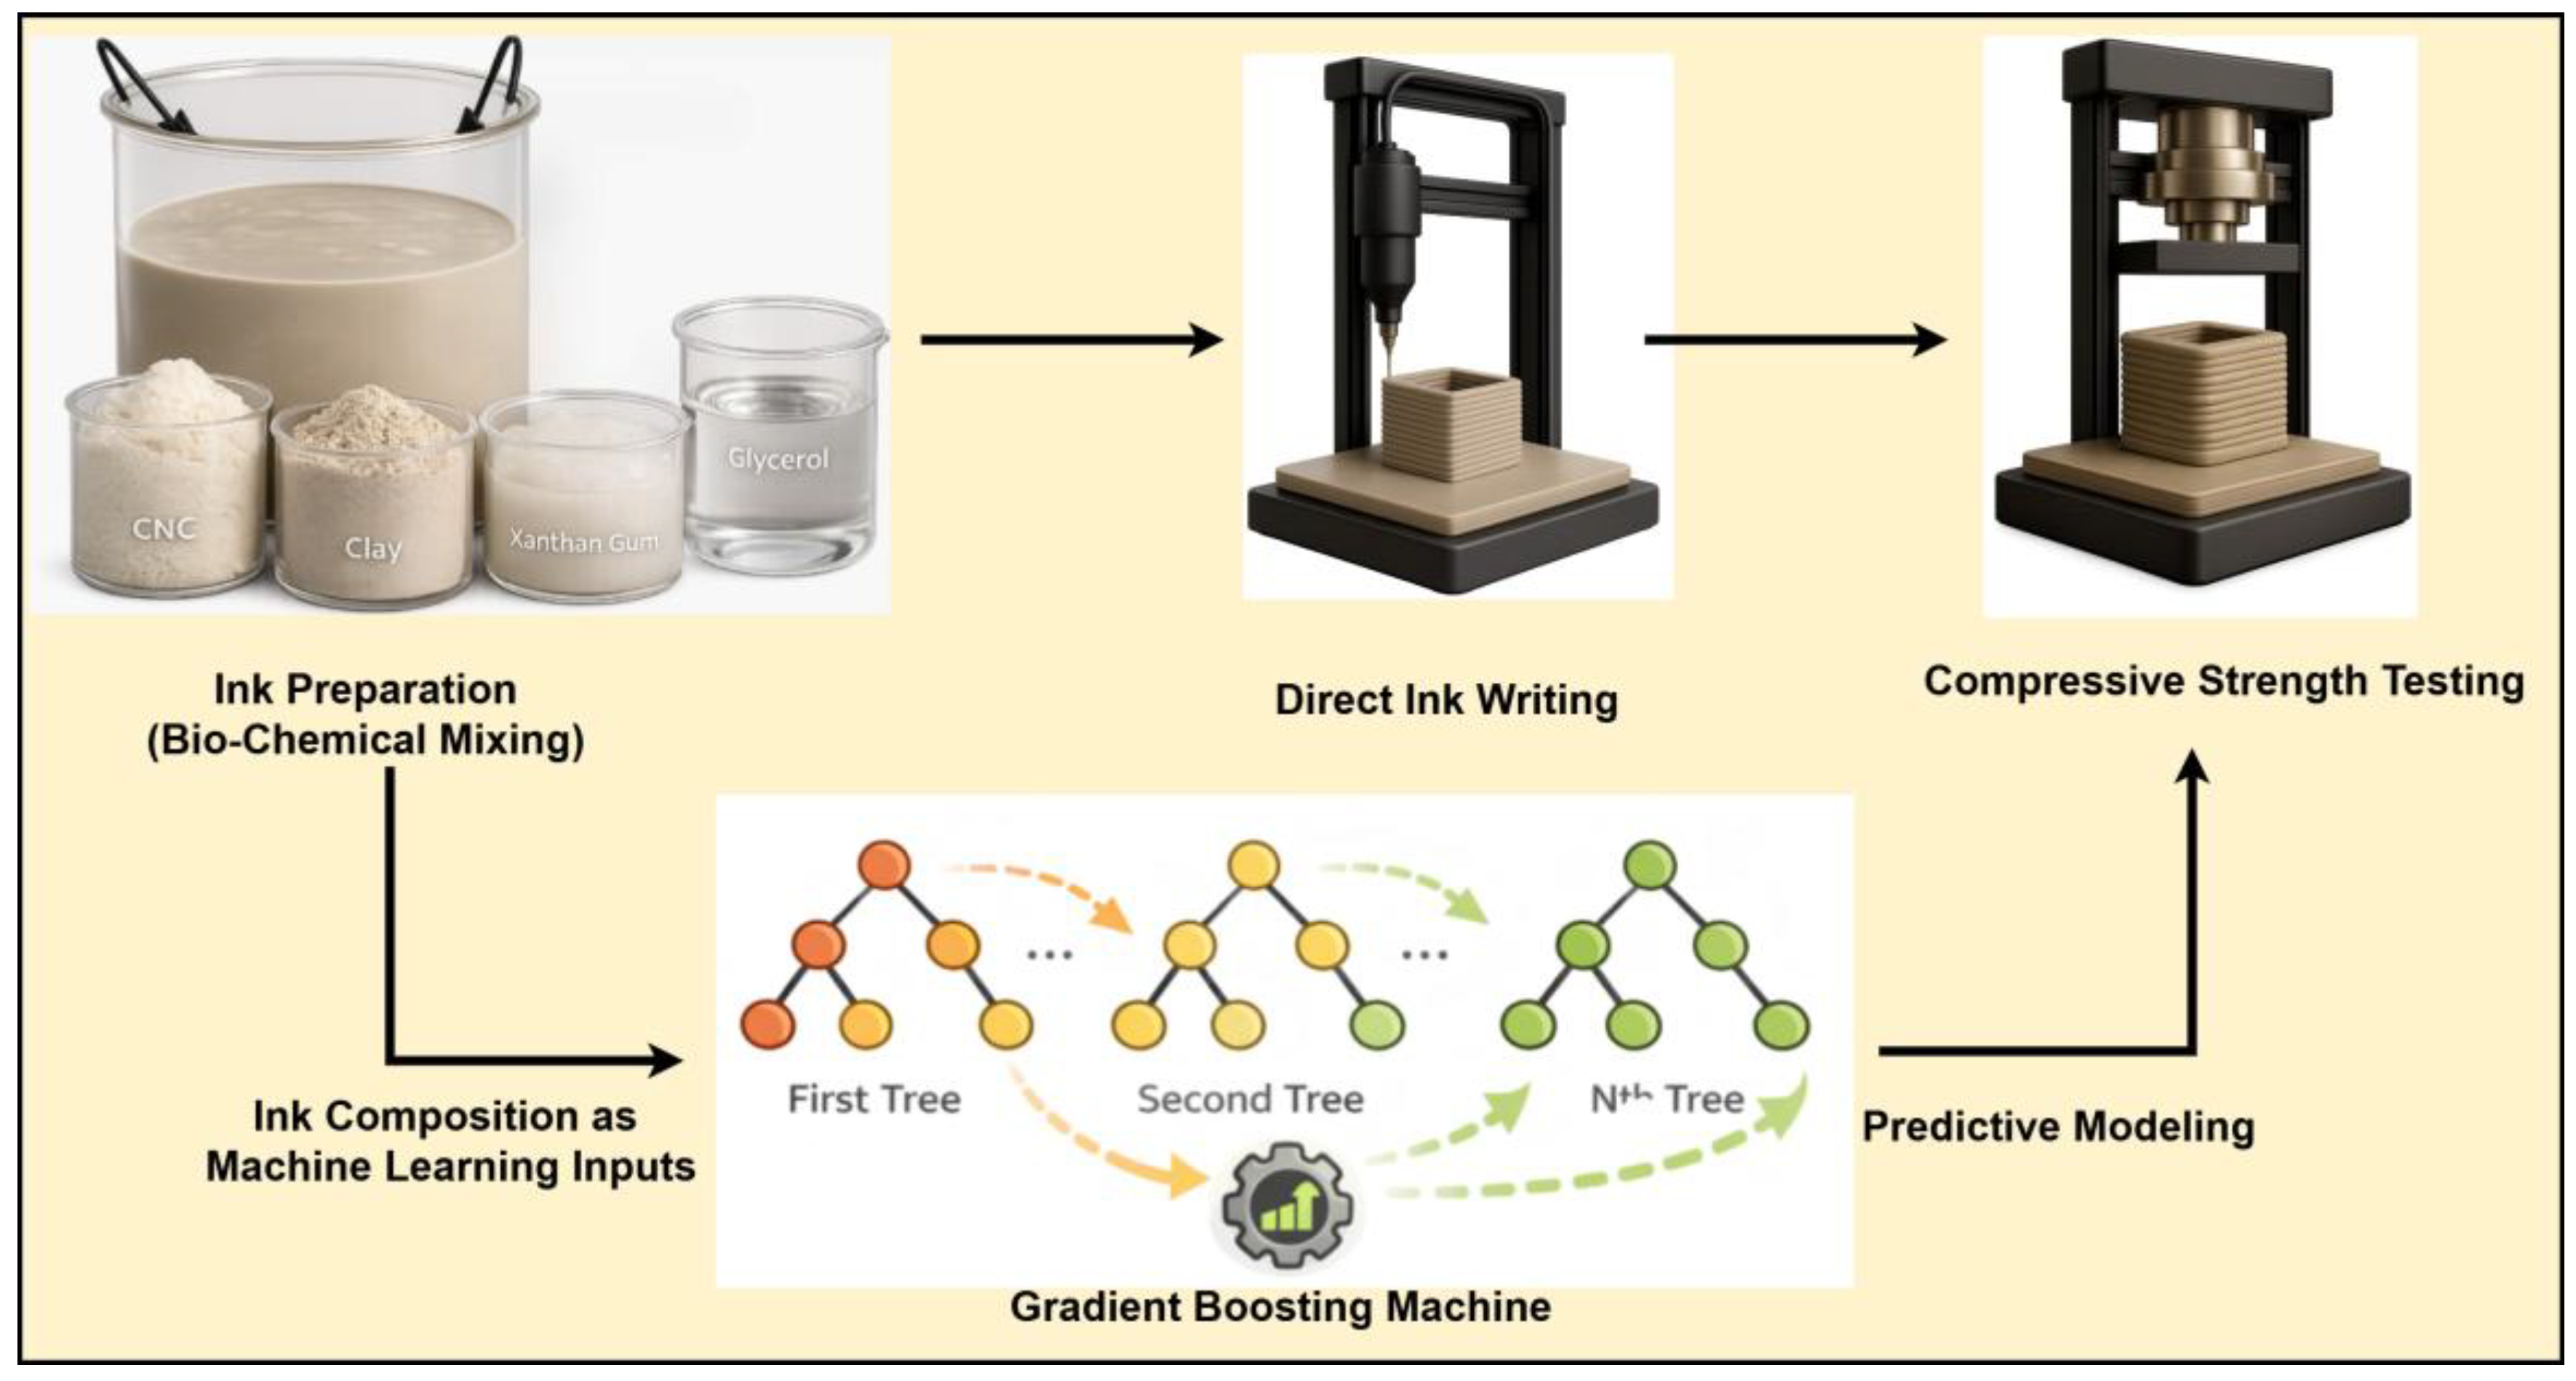
Humbolt unconfined compressive strength (UCS) testing machine was used to evaluate the compressive strength of the cubes. The test was conducted at a strain rate of 1 mm/min; linear time interval was used to record the data with logging value of 0.4 s. For this specific study, the 28-day strength of hollow cubes is selected. The compressive strength of the cubes was calculated according to the ASTM D5102/D5102M [32]. Each experiment was repeated 3 times, and the average values were reported. Figure 2 shows the 3D printing process and unconfined compressive strength test which is used to develop predictive models.
Figure 2.
Procedure of determining the compressive strength of 3D printed wood–CNC-reinforced clay composite (Image enhanced using ChatGPT 5.2).
3.3. Data-Driven Modeling
In this study, the model inputs are slurry composition variables; wood species (softwood vs. hardwood), sawdust content (wt%), xanthan gum (XG, wt%), water content (WC, %), glycerol (wt%), and cellulose nanocrystals (CNC, wt%). The response variable is the 28-day compressive strength (MPa). The significance of the slurry composition on the 28-day compressive strength was evaluated using Analysis of Variance (ANOVA). The ANOVA was performed using the general linear model in Minitab 21 to study the main effect of the slurry compositions on the 28-day compressive strength (at 95% confidence level for all intervals). Prior to the analysis, Box–Cox transformation was applied to the response data to help meet the ANOVA assumptions.
Of the 32 total observations from L32 Taguchi design, 24 records (75%) were used for model training/augmentation, and 8 records (25%) were held out as a fixed real-only test set for final evaluation. Data splitting was automatically done by Minitab 21 software with a comparable distribution between the training and test data. Only the training partition was expanded to improve model robustness while preserving an untouched test set. Data augmentation was done using CTGAN and TVAE with two configurations; A and B (Table 1 and Table 2). The original and expanded datasets were fed into the TreeNet gradient boosting machine (TreeNet GBM) for predictive modeling of 28-day compressive strength. Optimal model selection was based on the four established augmentation selection criteria explained in Section 2.3. To model the relationship between slurry composition and compressive strength, we employed the TreeNet GBM implemented in Minitab 21 software. It is an ensemble learning method based on Friedman’s gradient boosting framework [33], where successive regression trees are added to minimize the residual error of prior trees. This approach is well suited for small to medium-sized datasets [34] because it combines the interpretability of decision trees with the predictive accuracy of boosting and it can quantify predictor importance via relative influence measures.
In the TreeNet model, the loss function was the least square. The maximum number of trees was set to 300, with a minimum of three cases required per terminal node. The number of predictors considered for each split was set to the square root of the total number of predictors. Other hyperparameters were optimized through grid search. Specifically, the learning rate was tuned over {0.001, 0.01, 0.02, 0.04, 0.06, 0.08, 0.1, 0.15}, the subsample fraction over {0.2–0.8}, and the maximum number of terminal nodes per tree over {6, 8, 10, 12}. Candidate models were evaluated using training and test R2 with early stopping to prevent overfitting. The CART algorithm was employed for tree construction. This framework enabled not only predictive modeling of compressive strength but also sensitivity analysis (via learning curves against boosting depth—number of trees in the model) and feature importance assessment (via Pareto rankings of predictor influence), which together provided a physics-informed lens for interpreting the augmented models. The feature importance graph shows the ranking of predictors’ contribution to model improvement when splits are made on a predictor over the sequence of trees. The variable with the highest improvement score is ranked as the most important variable, and the other predictors are ranked accordingly.
4. Results and Discussion
4.1. Baseline Model Performance and Physical Consistency
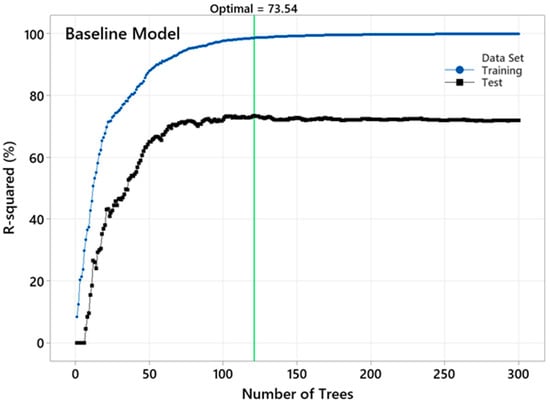
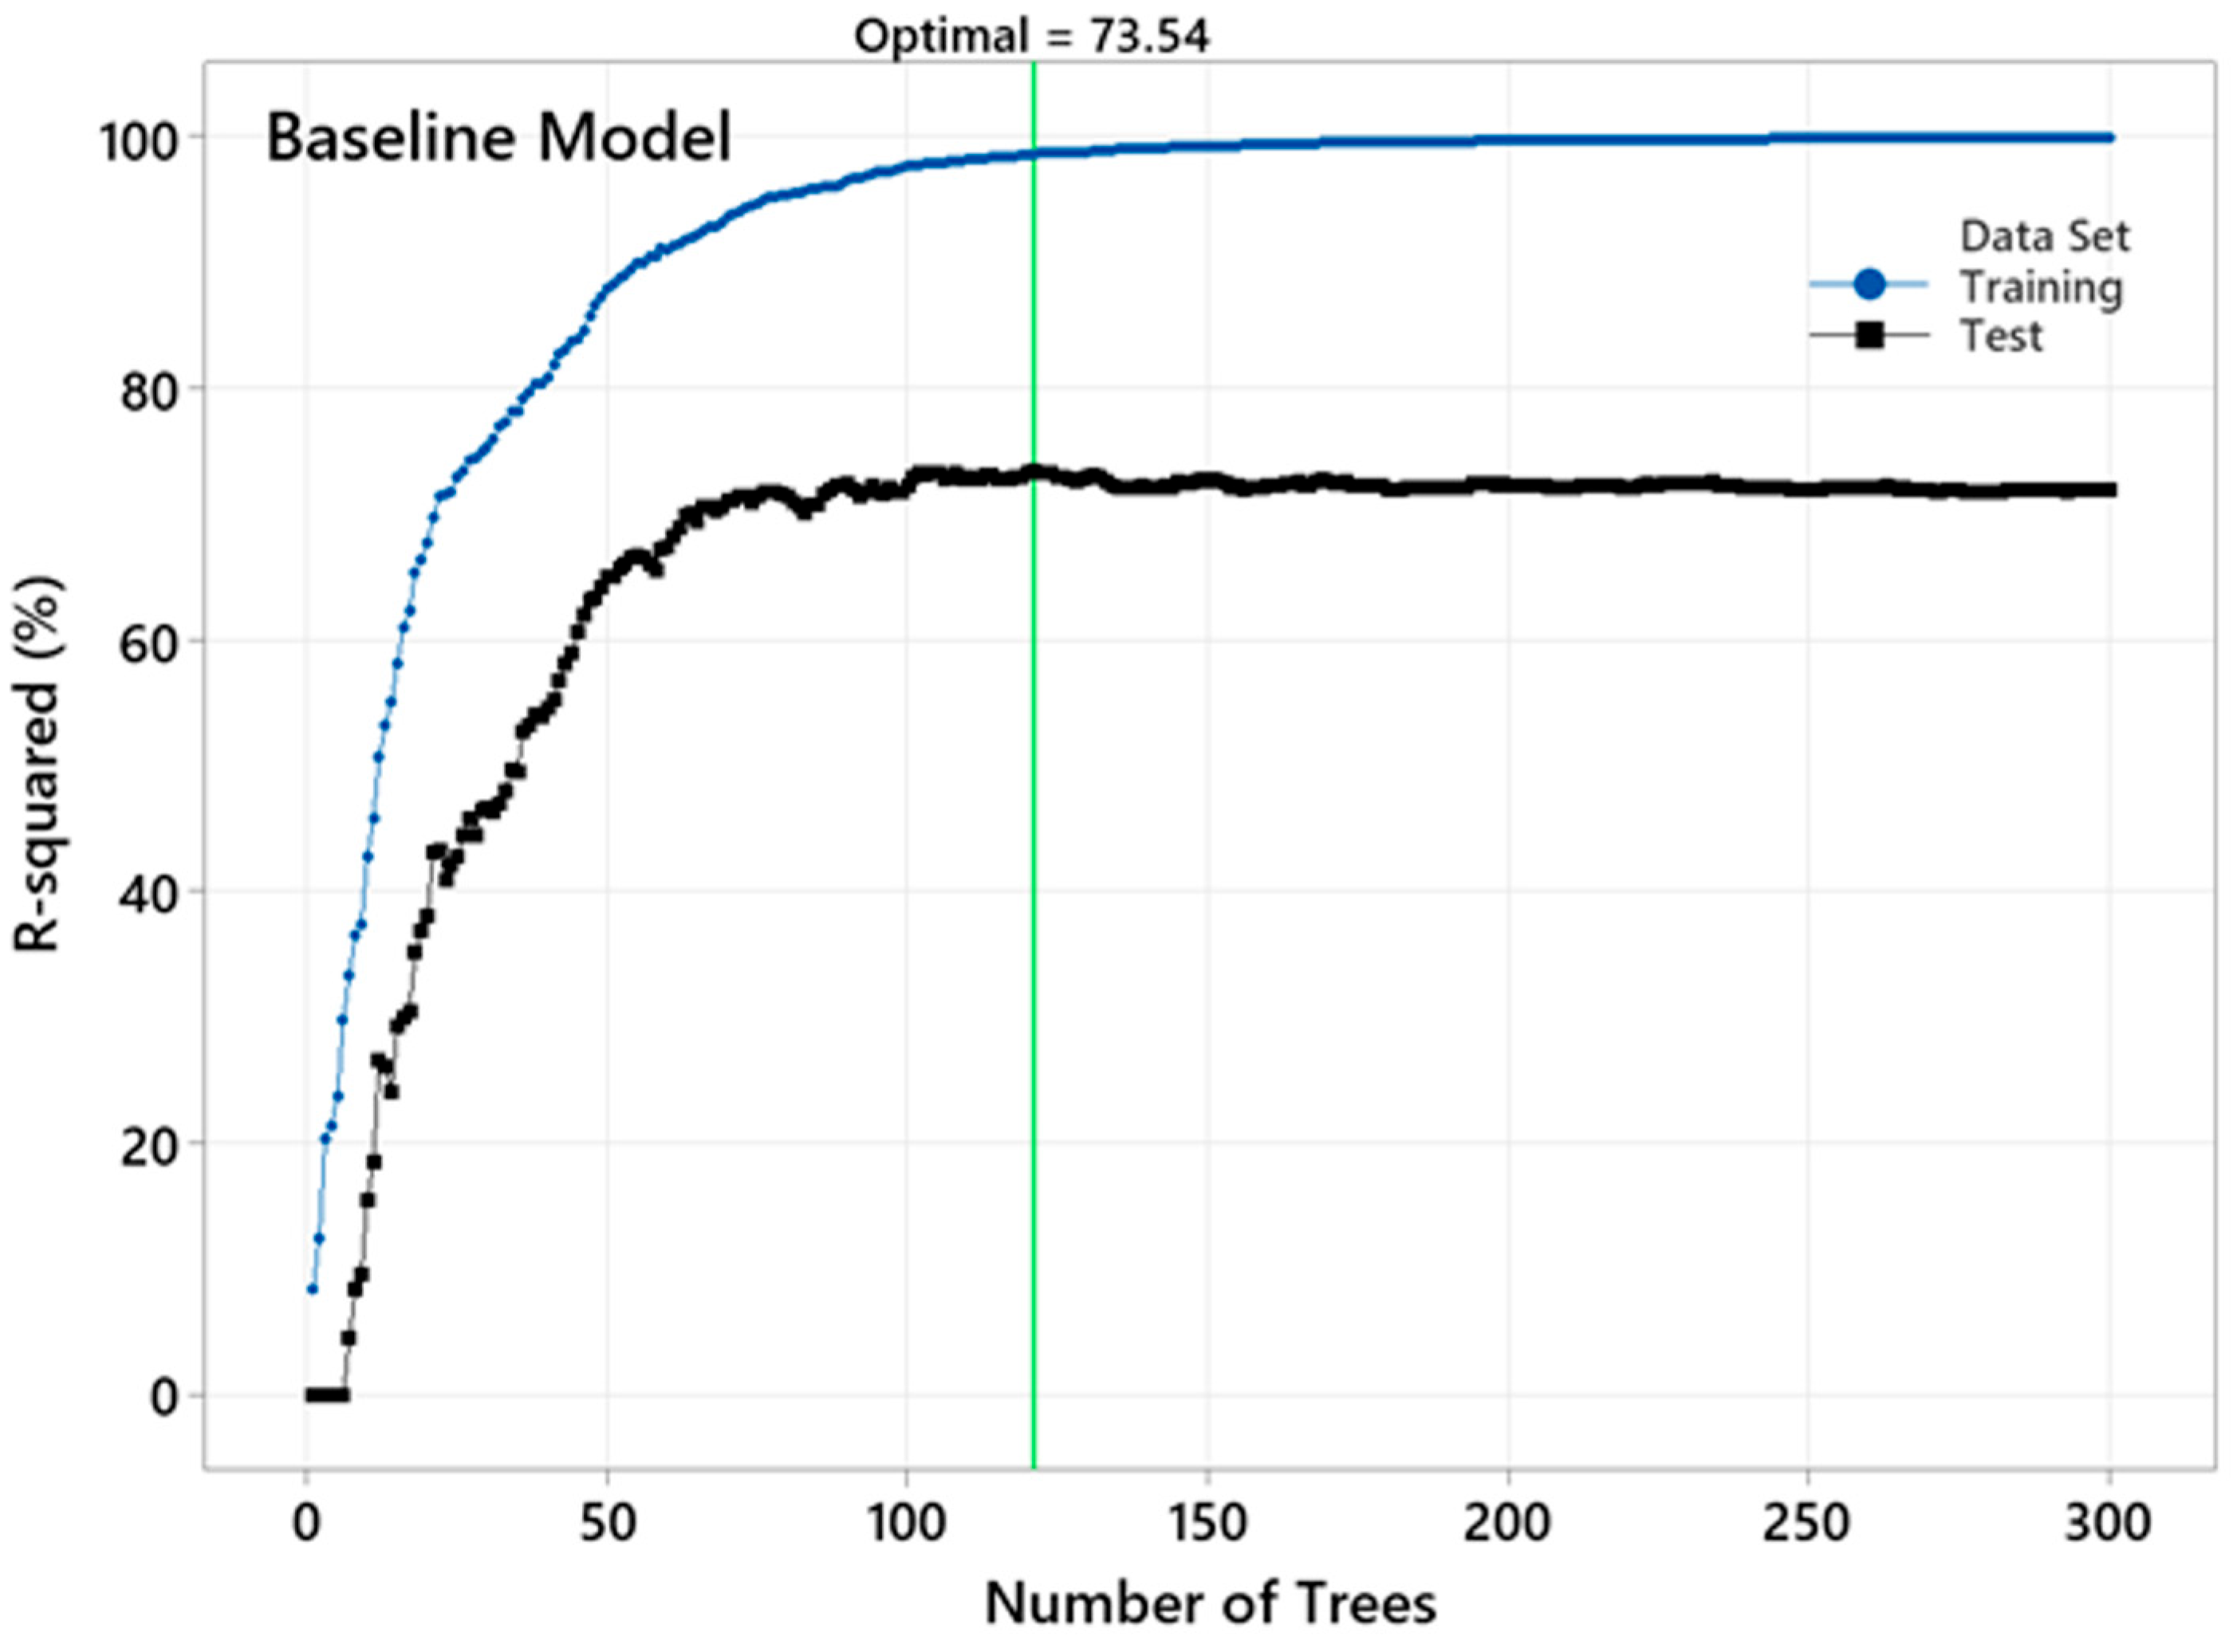
The baseline model (no augmentation) with optimal R2 had a learning rate of 0.08 and a subsample fraction of 0.6 with 121 decision trees. Typical to the small-data profile (Figure 3), training R2 increased monotonically toward 100%, but the test curve plateaued at ~73%. The persistent gap between curves confirmed strong overfitting, showing that the model memorized the limited training observations while struggling to generalize unseen data.
Figure 3.
Performance of the baseline dataset (no augmentation) versus the number of trees in the TreeNet model.
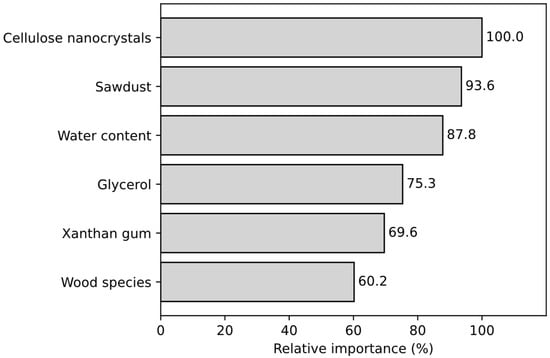
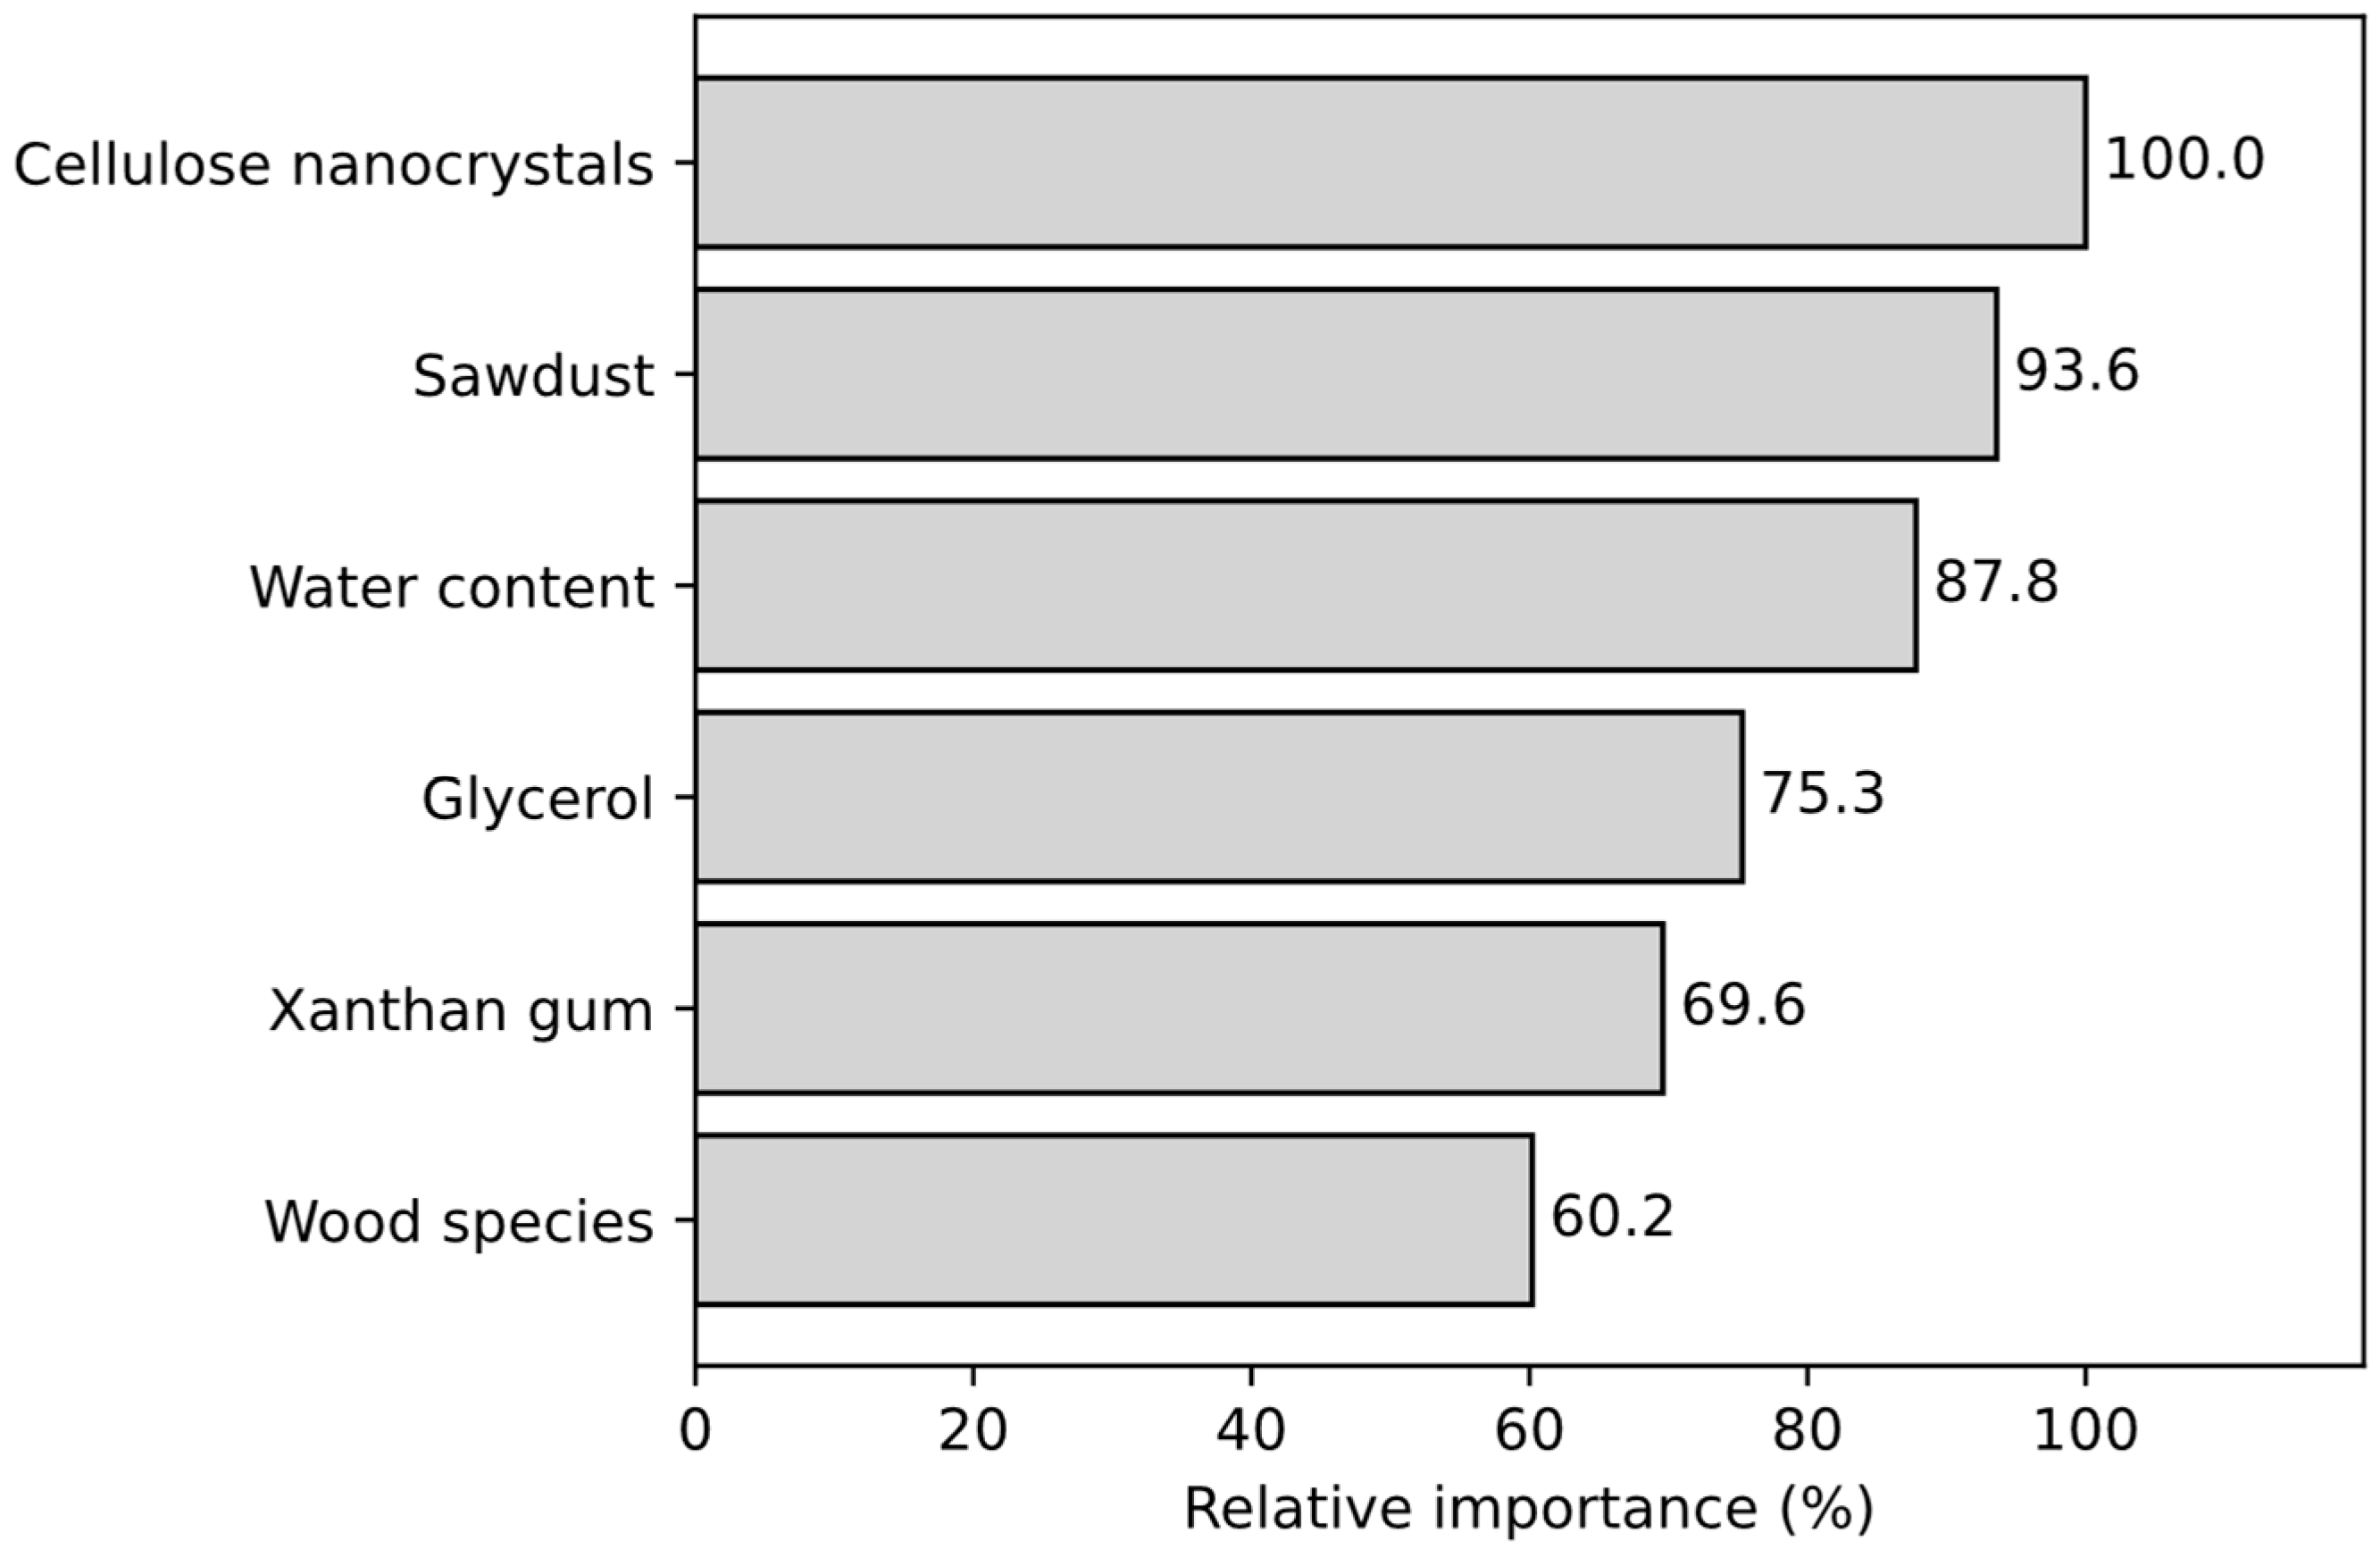
The Pareto chart (Figure 4) highlights CNC, sawdust, and water content as the dominant predictors of compressive strength, with glycerol and xanthan gum playing secondary roles and wood species having the weakest effect. This ranking is broadly consistent with the ANOVA results (Table 4), where sawdust (F = 12.83, p < 0.001), CNC (F = 12.59, p < 0.001), and water content (F = 9.74, p < 0.001) emerged as the most significant factors. Glycerol (F = 6.93, p < 0.001) and XG (F = 3.96, p = 0.015) were significant but of a relatively smaller influence, while wood species was only marginal (p = 0.089). The baseline thus confirms the expected physics of the slurry system, where fillers (CNC and sawdust) govern strength through reinforcement, water content influences drying-related defects, and binders and plasticizers fine-tune rheology and printability without dominating structural behavior.
Figure 4.
The Pareto chart shows the relative importance of slurry ingredients in TreeNet model for predicting the 28-day compressive strength.
Table 4.
ANOVA results show the significance of slurry ingredients on the 28-day compressive strength.
4.2. Criteria I: Distributional Consistency
Distributional consistency is the first fundamental requirement of a physics-aligned augmentation framework. Before considering accuracy or stability, synthetic data must replicate the statistical structure of the real experimental system. If augmentation distorts the material’s response distribution—mean, variance, or tails—then any downstream prediction may become physically meaningless. Table 5 summarizes training and test datasets and shows the distributional statistics of the baseline model and models with augmented training data using CTGAN and TVAE.
Table 5.
Distributional statistics of the baseline model (no augmentation) and models with augmented training data using CTGAN and TVAE.
The distributional statistics reveal that CTGAN introduces a systematic drift away from the baseline experimental distribution. The original training data show a mean compressive strength of ~3800 kPa with a standard deviation of ~868 kPa. In contrast, both CTGAN configurations produce augmented datasets whose means consistently shift above the baseline—typically 3400–4000+ kPa across augmentation sizes, with standard deviations that inflate far beyond the baseline (reaching ~900–1160 kPa). Even at the smallest augmentation level (+25), CTGAN A and B already generate higher upper quartiles and noticeably heavier tails, and this divergence persists across +50, +75, +100, +150, and +200. This upward tail inflation suggests distributional drift, where limited real samples cause the generator to overproduce rare high-strength combinations. The result is synthetic data that becomes increasingly detached from the true physical response envelope of the material system.
TVAE shows markedly better alignment with the baseline distribution. Across all augmentation sizes and both configurations, the mean compressive strength remains close to the original ~3800 kPa baseline (generally 3700–3850 kPa) and the standard deviation increases only moderately (~680–900 kPa) without producing unrealistic extremes. Also, quartiles, medians, and minima remain close to experimental values. Where CTGAN tends to overproduce the high-strength tail, TVAE preserves the central tendency and spread of the material’s true response. This is especially important for AM material design, where synthetic data must expand sample size without fabricating mechanical behaviors that the real system cannot achieve. These observations confirm that distributional fidelity is not guaranteed across generative models, especially in small-data AM scenarios. However, even a distributionally consistent model must be tested for how its predictive performance changes with augmentation size. This motivates the next criterion to evaluate the sensitivity to augmentation size and identify the point at which synthetic data begins to strengthen—or undermine—the predictive model.
4.3. Criteria II: Sensitivity to Augmentation Size
CTGAN performance (Table 6) showed a pronounced dependence on network design and augmentation size, with two distinct behaviors emerging. For Config A (larger generator/discriminator layers), the best result appeared at +75 synthetic rows (Test R2 = 86.2%, MAPE = 7.2%), although training fit remained modest (Train R2 = 57.2%). This divergence is consistent with an implicit regularization effect, where synthetic variability may have prevented TreeNet from memorizing the 24 real observations, thus reducing apparent training R2 while still improving generalization to unseen test data. The weak training performance could also signal a failure to capture structure, but here the test gain shows that augmentation injected useful diversity. However, the improvement was still fragile. Beyond +100 rows, performance dropped markedly (R2 = 64.5%) and collapsed at +150 (R2 = 24.2%), a pattern often reported for GANs on ultra-small datasets due to mode collapse and unstable adversarial dynamics [35,36].
Table 6.
The R2 (%) and Mean Absolute Percent Error (%) obtained from CTGAN models at different augmentation sizes.
For Config B (smaller network), the strongest result occurred at the smallest augmentation size, +25 rows (Test R2 = 82.15%, MAPE = 7.0%), and had a very high training fit (Train R2 = 94.6%). This reflects a balanced improvement mechanism in which modest augmentation reinforced both training and test performance without inducing under-training. The network proved brittle at larger sizes, with test R2 falling below 42% at +50 and collapsing at +150. Therefore, Config A (higher capacity) tolerated moderate augmentation but was unstable, while Config B (lower capacity) improved quickly at small augmentation but could not scale further. CTGAN therefore provided improvements in narrow windows but remained highly sensitive to hyperparameters.
TVAE robustness to augmentation size is shown in Table 7. Relative to CTGAN, TVAE delivered higher peak accuracy and broader robustness to augmentation size. For Config A (larger encoder/decoder, higher latent capacity), at +75 rows, TVAE A produced the optimal result (Test R2 = 88.7%, MAPE = 7.0%), while training fit remained modest (~57%). This resembles the “under-training paradox” seen in CTGAN A, where synthetic variability reduces training fit but improves generalization. However, the variational objective introduces KL regularization, which encourages smoother latent embeddings and reduces the collapse risk characteristic of GANs [37]. At smaller augmentation (+25 rows), TVAE A also showed a balanced improvement case (Test R2 ≈ 83.3%, Train R2 ≈ 95%), indicating that the model can succeed through either pathway depending on augmentation size.
Table 7.
The R2 (%) and Mean Absolute Percent Error (MAPE %) obtained from TVAE models at different augmentation sizes.
Config B (compact latent embedding, smaller layers) exhibited the broadest tolerance to augmentation. It achieved strong results even at +100 and +200 rows (Test R2 = 89.3%, MAPE ≈ 6.8–9.2%), despite modest training fits (43–60%). Here, we do not observe the rapid collapse seen in adversarial training. The compact latent embedding likely acted as an additional regularizer by compressing feature interactions, limiting overfitting while still enabling diverse synthetic sampling. Thus, CTGAN results depended strongly on architecture and augmentation size, producing either sharp but unstable gains (Config A) or small-scale balanced improvements (Config B). TVAE, in contrast, proved more resilient to augmentation size, where Config A succeeded at both small and moderate expansions, and Config B tolerated much larger expansions without immediate collapse. Later sections show that these numerical gains must also be cross-checked against sensitivity to boosting depth and agreement with physically meaningful factor hierarchies.
4.4. Criteria III: Stability to Boosting Depth
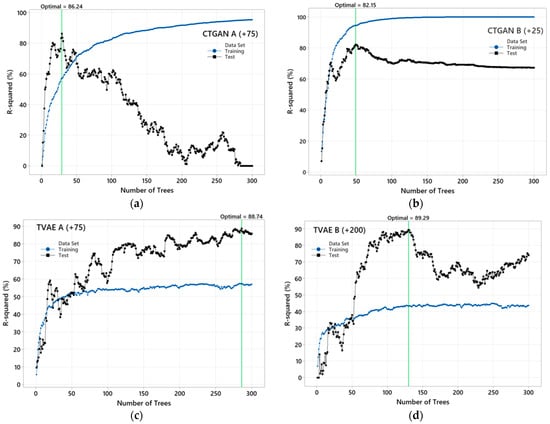
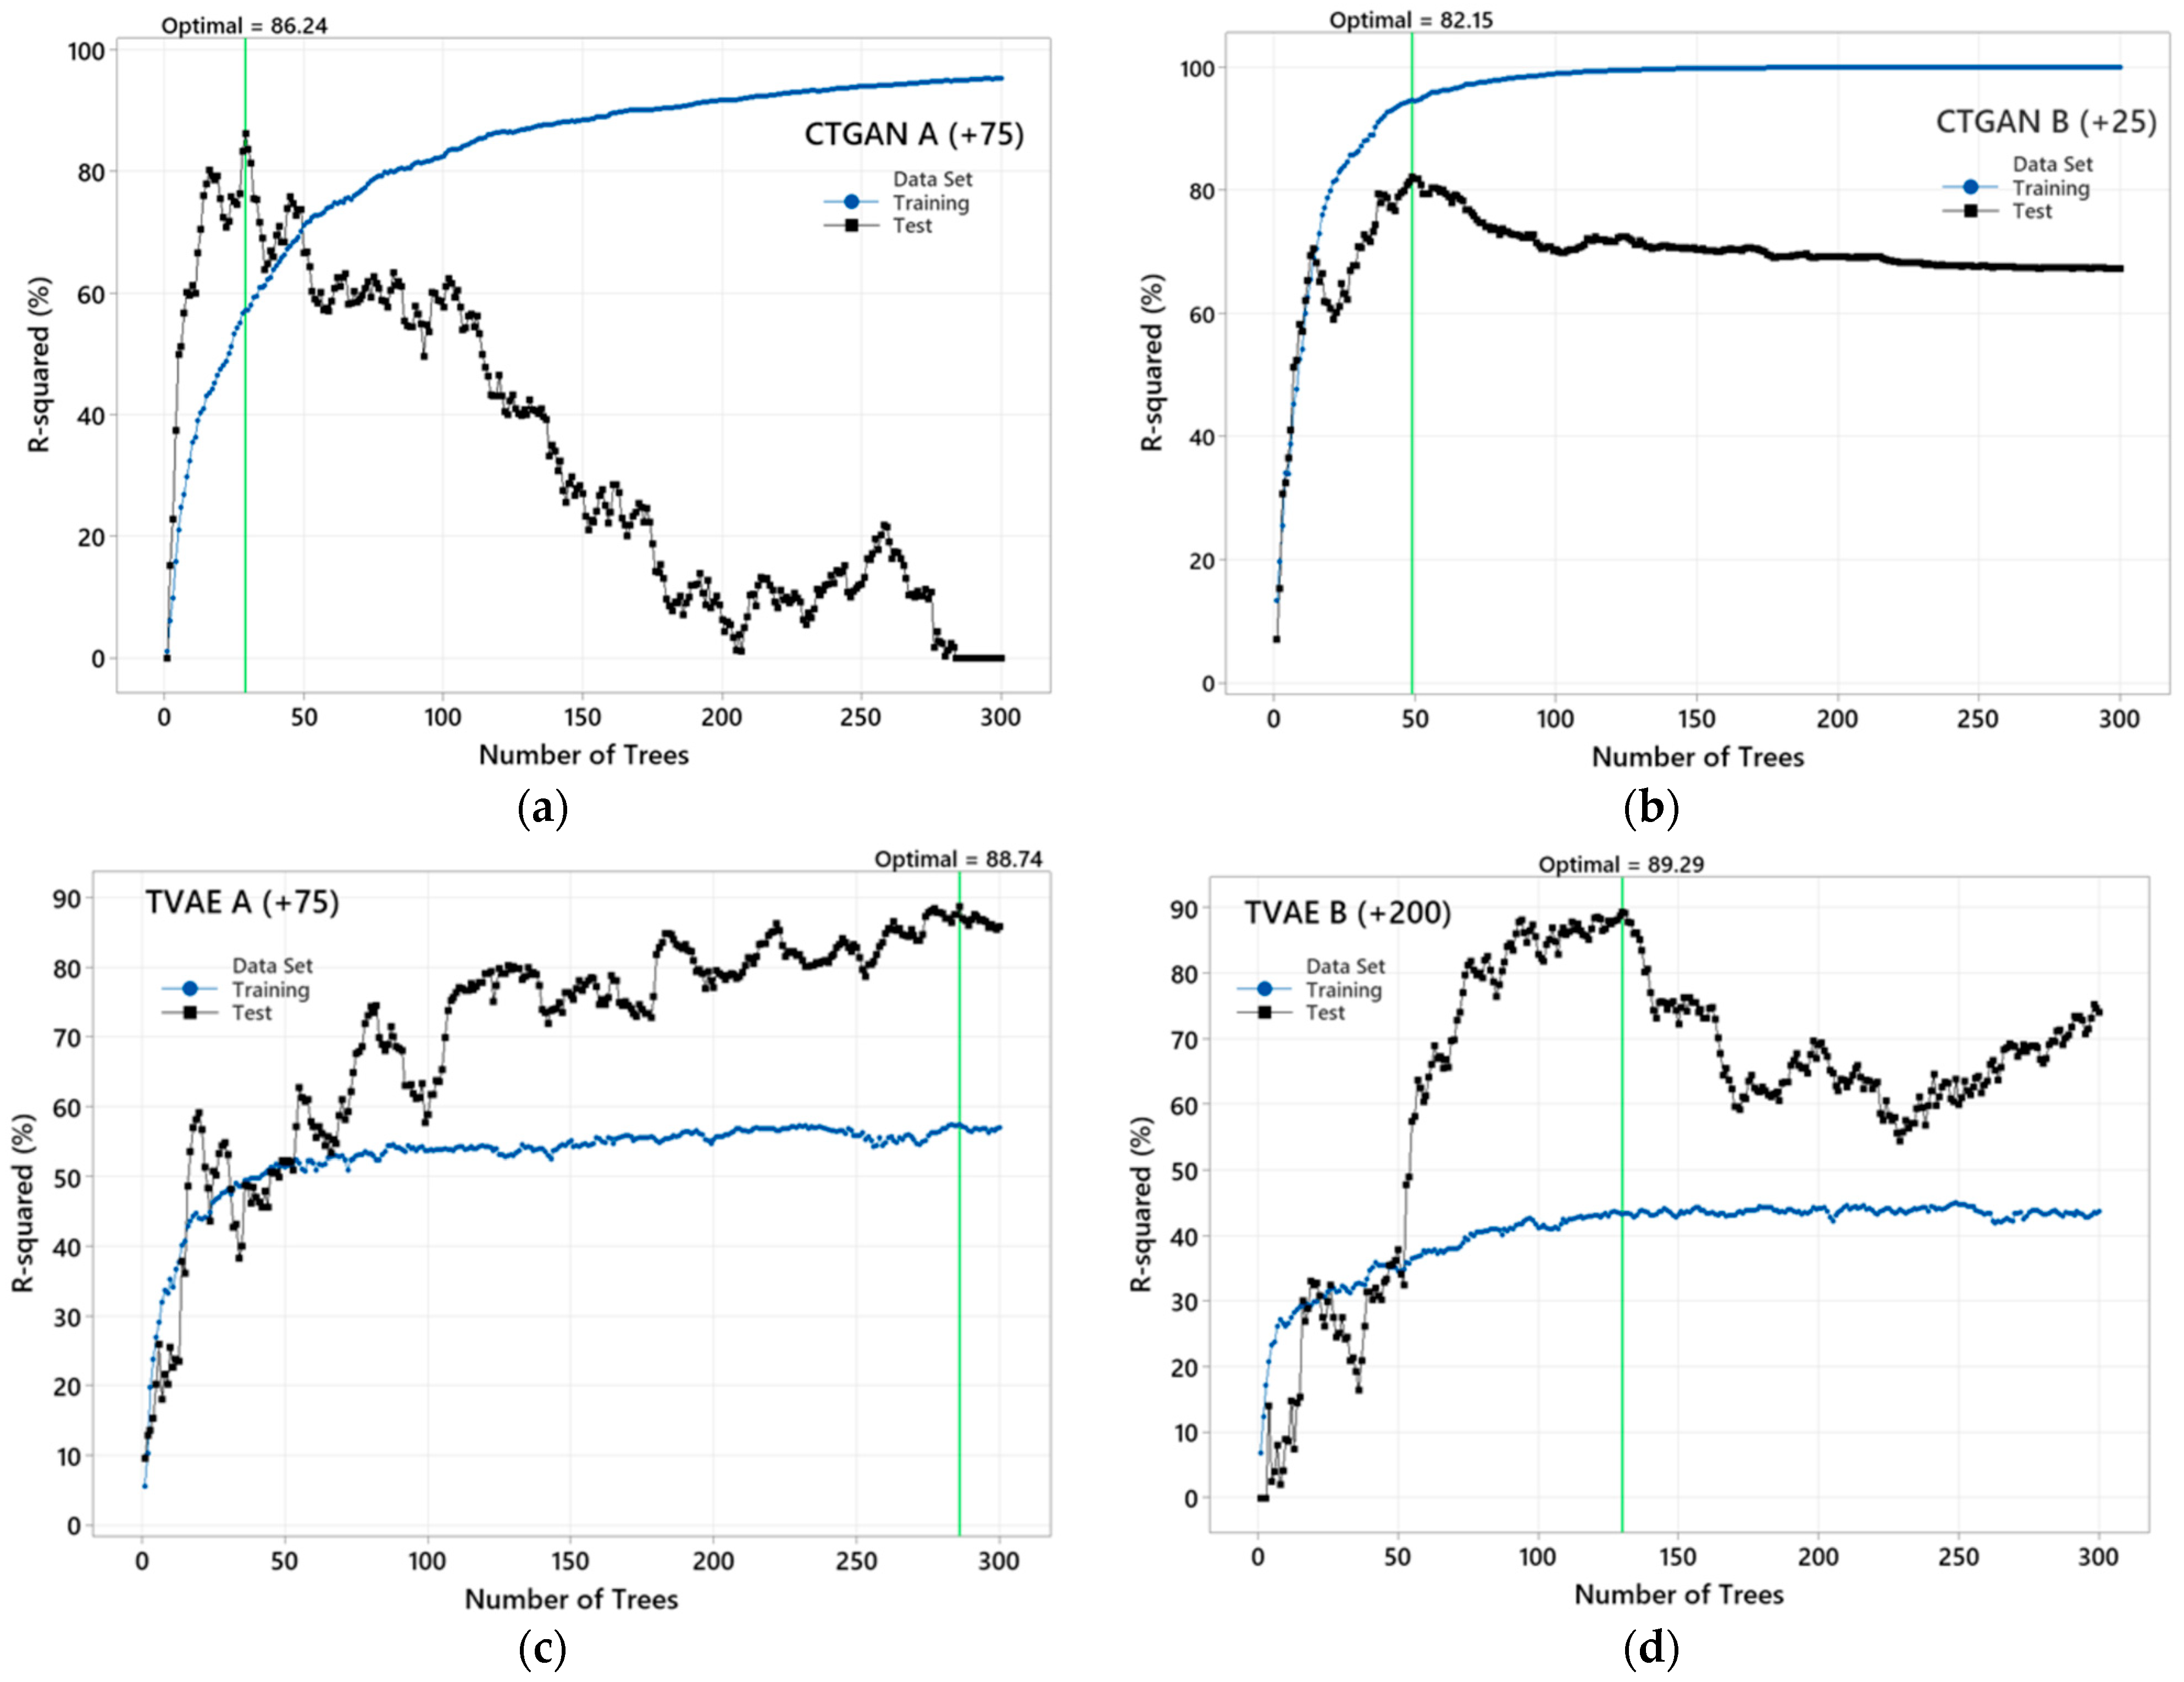
The sensitivity of performance for models with maximum test R2 (from Table 6 and Table 7) to boosting depth reveals how augmentation influences the stability of the predictive model. CTGAN Config A (+75 rows) achieved the highest test R2 among CTGAN models (86.2%) but with pronounced instability. The optimal model contained 29 decision trees, a learning rate of 0.15, a subsample fraction of 0.5, and maximum terminal nodes of 6. Figure 5 shows that despite the maximum test R2 of 86.2%, the training R2 remained modest (~57%), and the test curve exhibited sharp peaks followed by rapid decline as tree depth increased. This indicates that augmentation induced beneficial variability at one depth, but the synthetic distribution lacked robustness, making the model fragile to boosting iterations. CTGAN Config B (+25 rows) behaved differently. It had 49 decision trees in its network and achieved optimal performance, having a learning rate of 0.15, subsample fraction of 0.6, and maximum terminal nodes of 10. Figure 5 shows a very high training fit (~95%), with the test R2 reaching ~82%. More importantly, the test curve rose smoothly and maintained stability across a broader range of trees, declining only gradually at depth. This reflects a balanced improvement pathway where small-scale augmentation reinforced the original distribution without producing under-training.
Figure 5.
The sensitivity of CTGAN and TVAE models to boosting depth: (a) CTGAN A (+75); (b) CTGAN B (+25); (c) TVAE A (+75); (d) TVAE B (+200).
TVAE Config A (+75 rows) comprises 286 decision trees with a learning rate of 0.15, subsample fraction of 0.3 and maximum terminal nodes of 10. It produced one of the strongest test results (88.7%) with modest training fit (~57%). Unlike CTGAN-A, the test curve improved more steadily, though oscillations persisted. The variational latent manifold appeared to regularize augmentation, softening collapse but not eliminating depth sensitivity. TVAE Config B (+200 rows) achieved the highest nominal test R2 (89.3%), with 130 decision trees, a learning rate of 0.15, a subsample fraction of 0.2, and a maximum terminal node of 10. However, the model showed dramatic fluctuations in test R2 between ~50–90% depending on tree number. Training remained low (~53%), signaling underfitting, and the instability undermined reliability. Despite attractive peak values, this model’s dependence on boosting depth makes it difficult to trust in practice.
Across the four models that achieved the highest test R2 values, CTGAN-B (+25) demonstrated the strongest stability to boosting depth. Its test curve increased smoothly and remained flat over a wide range of boosting depth, with only gradual decline at higher depths—unlike the sharp collapses observed in CTGAN-A (+75) and TVAE-B (+200). This stability is consistent with its distributional behavior since CTGAN-B (+25) is the only CTGAN configuration whose augmented data retain a standard deviation close to the baseline (Table 5), avoiding the heavy tail inflation seen in larger augmentations. The tighter statistical spread appears to reduce the risk of over-amplifying rare or noisy patterns, producing a synthetic dataset that strengthens but does not distort the underlying material relationships. While CTGAN-B (+25) offers the most robust depth-insensitive performance, its final suitability must still be evaluated alongside the remaining criteria, particularly explainability and physics alignment.
4.5. Criteria IV: Explainability (Physics Alignment)
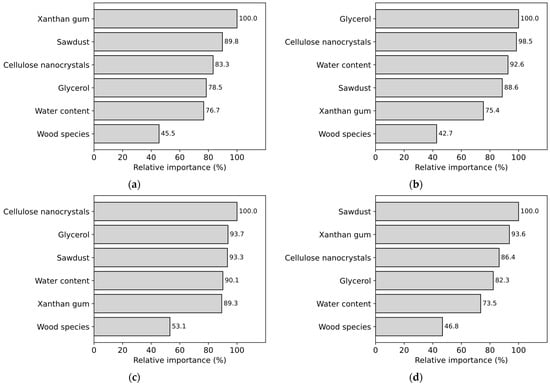
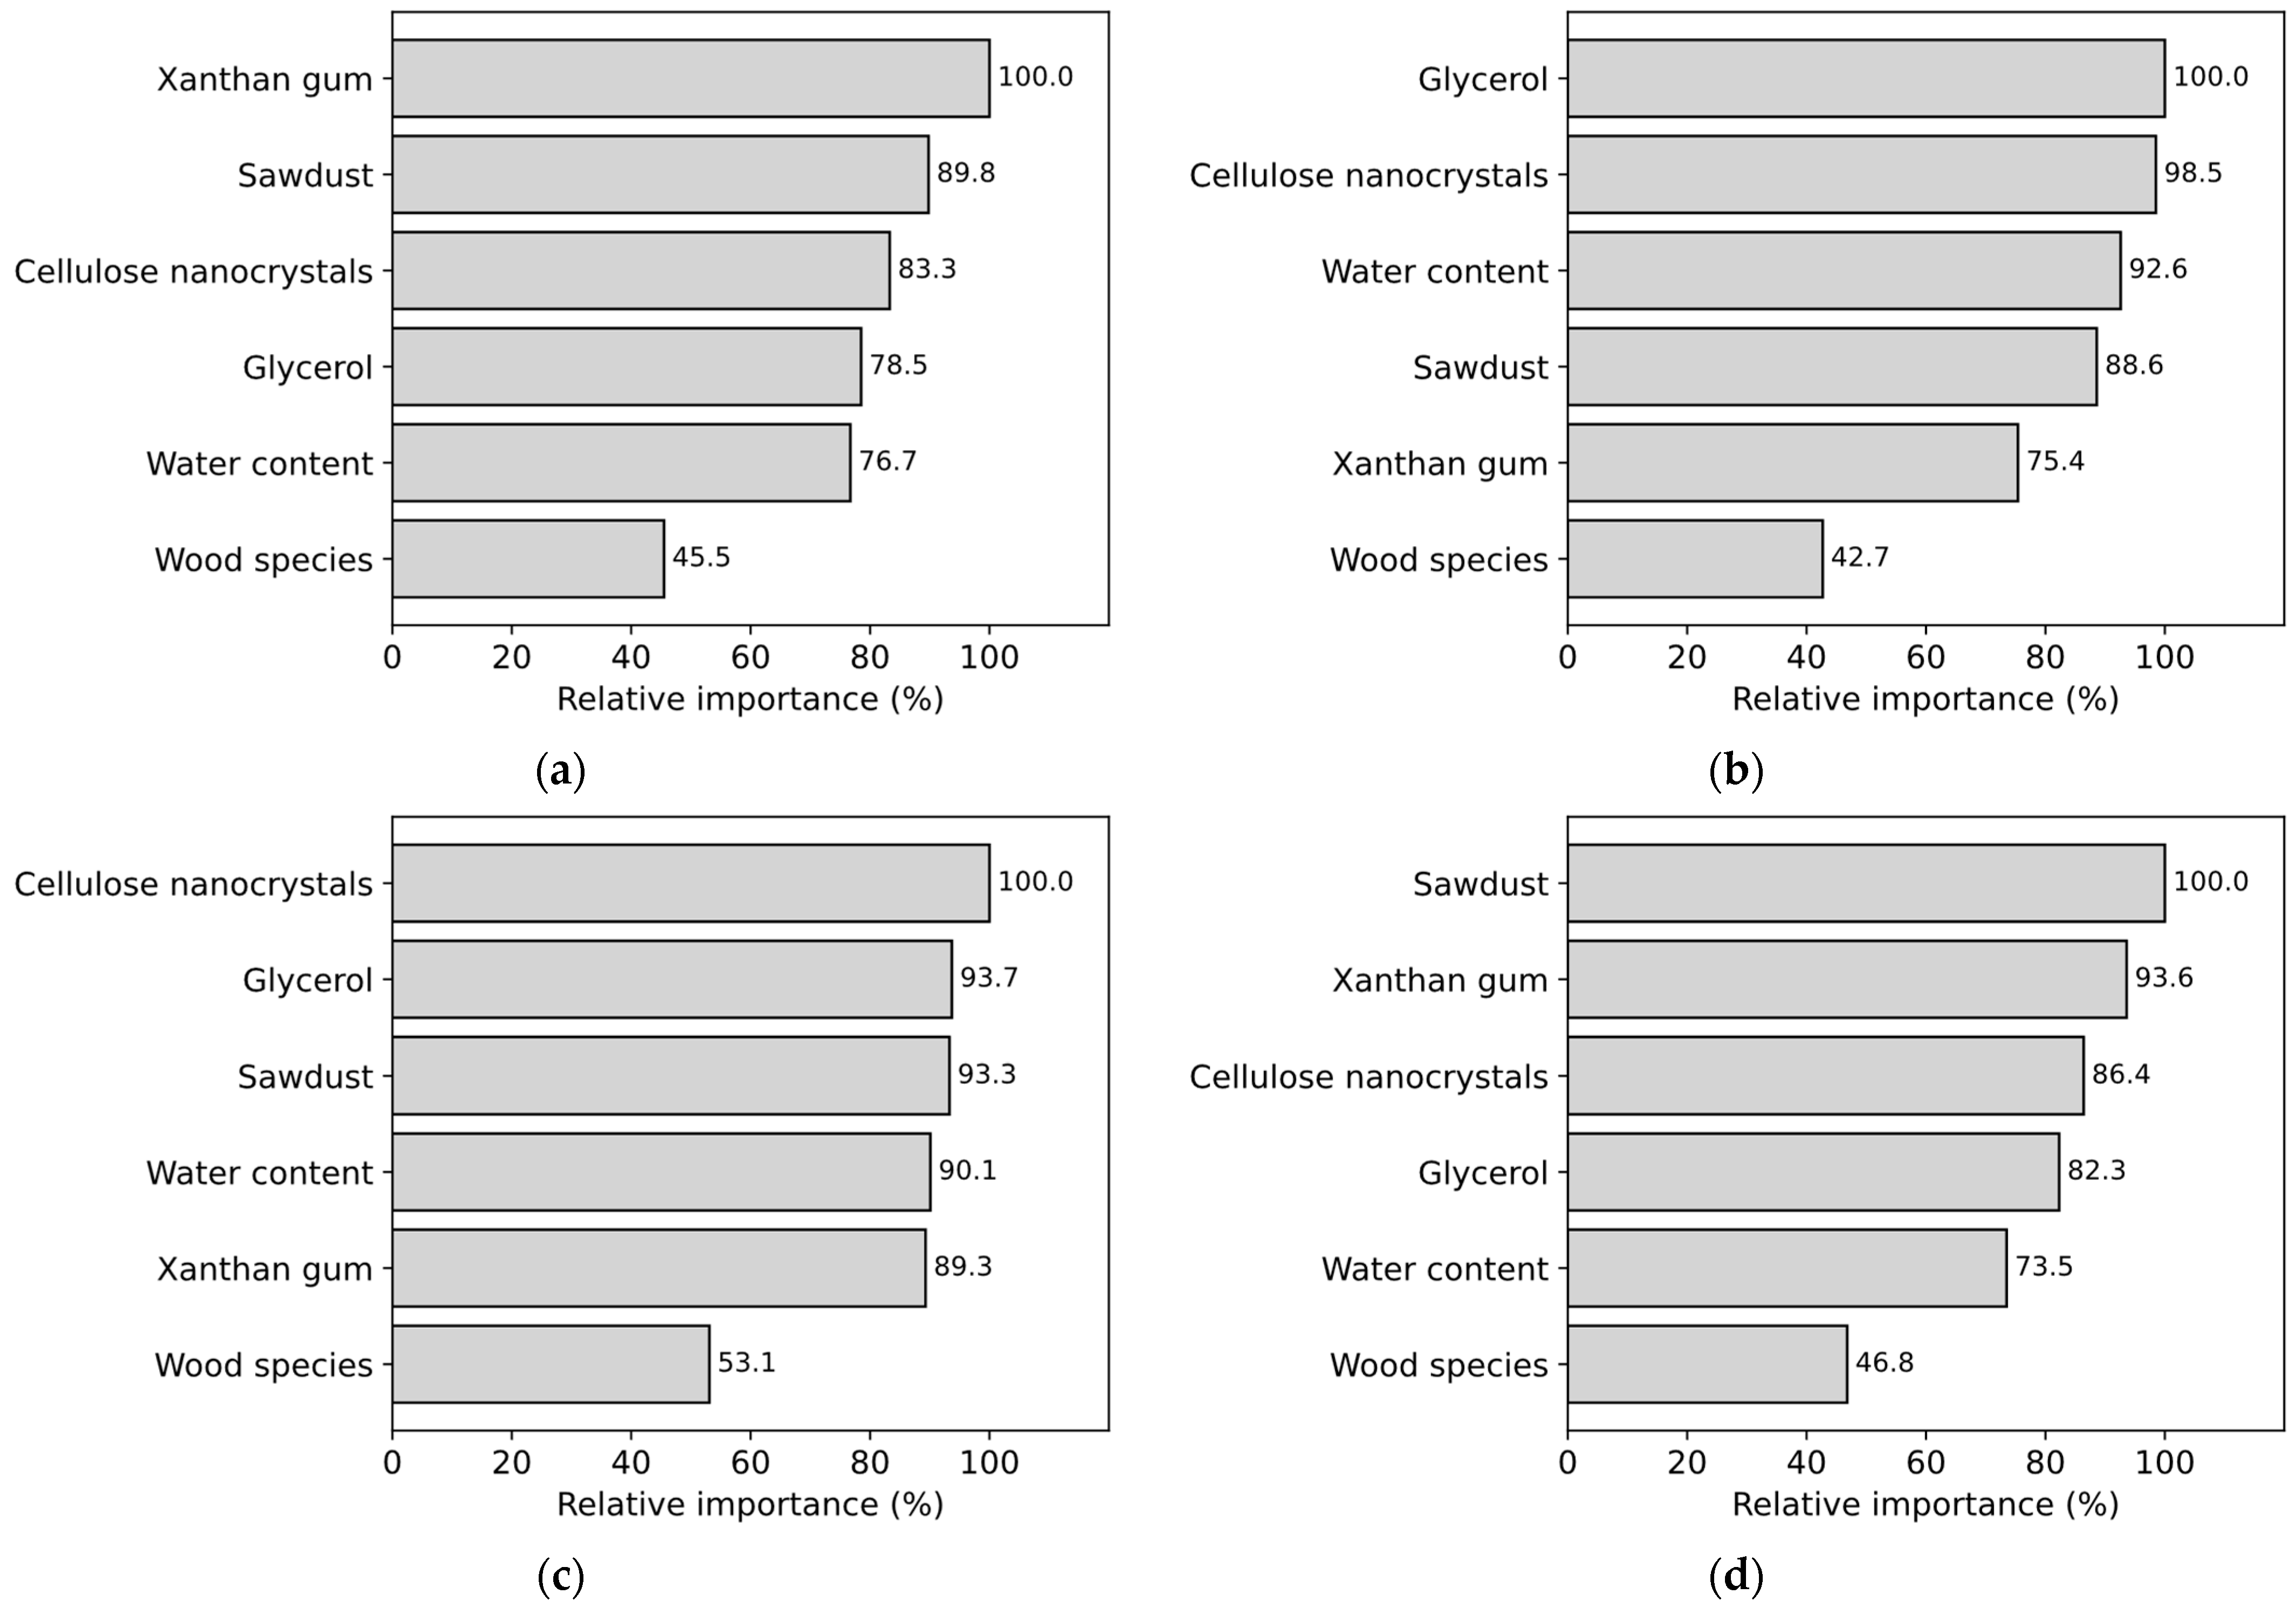
To assess whether augmentation enhances interpretability as well as accuracy, we compared TreeNet’s relative influence (Pareto) across the augmented datasets (Figure 6), and cross-checked rankings against ANOVA performed on the real experiments. As discussed in Section 4.1, the ANOVA provides a physics-grounded benchmark fillers (sawdust and CNC) dominate compressive strength by reinforcing the matrix; water content influences drying defects; xanthan gum modifies yield stress and interlayer bonding; glycerol softens the network while aiding printability; and wood speciescontribute only marginally (p ≈ 0.08) [38,39]. It was discussed that the baseline model and ANOVA were overall consistent. CTGAN altered this hierarchy in ways that conflicted with the understanding of the materials. In CTGAN-A (+75), XG rose to the top while CNC and sawdust dropped; also, CTGAN-B (+25) elevated glycerol. Both shifts contradict the ANOVA results that fillers are primary load-bearing agents. A likely explanation is GAN’s fragility on ultra-small datasets, in which adversarial training can overemphasize rare co-occurrence patterns (e.g., strong samples coinciding with high XG or glycerol) and under-sample other regions [40,41], as shown in Table 5. This may explain the observed sharp peaks and collapses in CTGAN learning curves, which suggest models that can achieve superficially high R2 yet distort variable importance.
Figure 6.
Feature importance ranking of the CTGAN models: (a) CTGAN A (+75); (b) CTGAN B (+25) and TVAE models: (c) TVAE A (+75); (d) TVAE B (+200) with highest test R2.
TVAE generally preserved the expected filler-driven signal but was not without distortion. At +75 rows, TVAE-A restored CNC and sawdust to high importance, which is consistent with ANOVA, but water content was ranked lower than expected while XG and glycerol were elevated, flattening the hierarchy and blurring contrasts between primary and secondary roles. At +200 rows, TVAE-B maintained sawdust as the top driver, yet placed XG and glycerol nearly on par with fillers, while water content dropped further, diverging from the experimental inference. These shifts suggest that while TVAE’s variational structure suppresses the extreme mode-collapse seen in CTGAN, it can still redistribute influence in ways that exaggerate binder/plasticizer effects at the expense of water and filler contrasts. Combined with the severe underfitting and tree-depth fluctuations observed at +200, this cautions against over-interpreting high peak R2 in isolation. Overall, TVAE A(+75)/B(+200) produced hierarchies that were closer to ANOVA than CTGAN; however, stability was not absolute, and interpretability remained contingent on augmentation size.
4.6. Multi-Criteria Optimal Model Selection
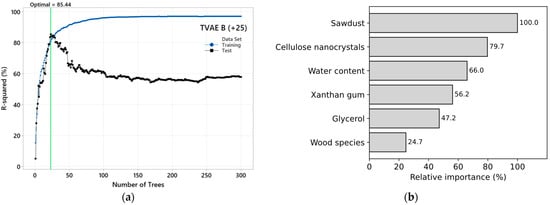
The evaluation of augmentation strategies was guided by four criteria: distributional consistency, predictive accuracy on the held-out real test set (R2 and MAPE) against augmentation size, stability with respect to boosting depth, and fidelity of the learned factor hierarchy to experimental evidence. Using these criteria, TVAE-B with +25 synthetic rows emerged as the most consistent solution. It improved baseline performance (R2 = 73.5%, MAPE = 11.8%) to approximately 85% R2 with a reduced error of ~7.8%, without introducing under-training (learning rate: 0.15, subsample fraction: 0.6, and maximum terminal node: 6). It also presents a distribution similar to baseline data. As shown in Figure 7a, the learning curve peaked at shallow boosting depth (23 decision trees) and declined gradually thereafter, displaying monotonic drift rather than the sharp oscillations observed in CTGAN-A (+75) or TVAE-B (+200). This indicates a low sensitivity once depth is tuned and highlights robustness against over-boosting. Equally important, the feature-importance ranking from this model (Figure 7b) aligned exactly with the ANOVA F-value hierarchy derived from the real experiments (sawdust > CNC > WC > XG > glycerol > wood species). This confirms that augmentation strengthened the physical signal rather than distorting it.
Figure 7.
(a) The performance of TVAE B (+25) as the optimal selected model against the boosting depth; (b) the feature importance ranking. This result matches the ANOVA results indicating TVAE B (+25) provided a model that was accurate, stable, and scientifically interpretable.
Higher-R2 alternatives were available, such as CTGAN-A (+75) (~86%) and TVAE-B (+200) (~89%), but both suffered from instability and reduced interpretability. CTGAN-A exhibited sharp R2 spikes followed by collapse and a shifted importance toward binder/plasticizer effects inconsistent with mechanics, while TVAE-B (+200) displayed large fluctuations in test R2 (50–90%) across boosting depth, indicative of fragility. Given the small-sample regime, stability and physics consistency were prioritized over marginal gains in variance explained. Overall, TVAE-B (+25) provided a model that was more accurate, stable, and scientifically interpretable than competing alternatives. This highlights a broader principle for small-data materials informatics, where the optimal augmentation is not necessarily the one that maximizes R2, but the one that simultaneously improves accuracy, maintains robustness to model depth, and preserves fidelity to experimentally validated mechanisms.
5. Conclusions, Limitations and Future Directions
In the current research, a systematic approach for the evaluation of generative data augmentation is proposed for cases with severely constrained experimental datasets—a situation that is rather common in additive manufacturing research. Instead of relying solely on synthetic data to enlarge the dataset, the proposed approach relies on a number of complementary evaluation metrics for the assessment of data augmentation. The results from the application of the proposed approach for the augmentation of the 32-run Taguchi dataset for direct ink writing of earthen composites indicate that augmentation can strengthen rather than compromise the material relationships that determine the compressive strength of the material.
Among the configurations that were evaluated in the current research, the TVAE-B model with a low level of augmentation (+25 samples) proved to be the most reliable. The R2 value for the test data increased from approximately 73% to approximately 85%, while the prediction error decreased by approximately 40%. Simultaneously, the hierarchy of material influences that is determined from the experimental dataset (sawdust > CNC > water > XG > glycerol > species) is preserved. However, predictive accuracy alone is insufficient for the evaluation of the results from the application of machine learning for the interpretation of material properties. Several models with high peak R2 values were found to fail the stability test.
One key concept that has come out of this work is that of physics-aligned augmentation. This means that synthetic data can be considered reliable if the resulting model continues to capture the physical relationships that were observed in the experimental system. This was accomplished in the present study by comparing the importance ranking of slurry components from TreeNet modeling against the factor ranking from ANOVA analysis of the experimental design. This helps in identifying any instances where augmentation may artificially improve the model’s performance while simultaneously altering material trends.
The present framework should be viewed as a case study for a DIW earthen composite material system rather than a general solution for all additive manufacturing systems. Its immediate utility is for exploratory materials work in early stages of development, where datasets are often limited by the fact that experimentally generating data for these systems is costly. In these cases, generative augmentation in combination with explainable machine learning can be used to improve prediction capabilities without sacrificing the interpretability of material effects. The model’s prediction results will be utilized to optimize the DIW slurry formula.
Despite these benefits, there are a number of limitations that must be taken into account. First, the present framework was tested on a DIW material system for a single response property (compressive strength). Therefore, while the present framework has shown promise for this one material system, it has yet to be tested on other additive manufacturing systems. In addition, the decision criterion for reliable augmentation is based on the expert interpretation of a number of evaluation criteria rather than a set of quantitatively defined criteria. Lastly, the dataset used was relatively limited in size; a larger dataset would help further validate the effectiveness of this method.
The future work will also seek to determine quantitative limits for accepting augmented datasets, incorporate physics-guided constraints into generative models, and expand the framework to other additive processes and materials. Possible extensions are the inclusion of cementitious materials, polymeric materials, bio-based materials extrusion processes, and multi-response predictions such as build height or dimensional stability. Validation of the results for diverse materials and process conditions is also important to assess the applicability of the method.
This study shows that generative data augmentation can be used reliably in small-data DIW research provided proper validation and interpretable models are applied. Under such circumstances, synthetic data do not just artificially inflate the dataset but act as a useful tool to enhance the predictive power of models, their stability, and scientific understanding in data-scarce additive manufacturing research.
Author Contributions
Conceptualization, V.N.; methodology, B.G. and V.N.; software, B.G. and V.N.; validation, B.G. and V.N.; formal analysis, B.G. and V.N.; investigation, B.G.; resources: P.A. and V.N., data curation, B.G. and V.N.; writing—original draft preparation, B.G. and V.N.; writing—review and editing, B.G., K.A. and V.N.; visualization, V.N.; supervision, V.N.; project administration, V.N.; funding acquisition, V.N. All authors have read and agreed to the published version of the manuscript.
Funding
This research was funded by supported by the Office of Research Advancement and the Center for the Future of Forests and Society at Oregon State University through the Transdisciplinary Research Seed Fund.
Data Availability Statement
This data is a part of ongoing research. Future requests can be sent to the corresponding author and will be considered on a case-by-case basis.
Acknowledgments
The authors would like to acknowledge the help received from research assistants, including Ashley J McCann, Kai Bentley, and Clare Socal, for their assistance in conducting experiments. ChatGPT was used as an assistant tool for improving figures, text polishing and proofreading. The authors have reviewed the content of this publication and take full responsibility for its findings.
Conflicts of Interest
There are no conflicts of interest associated with this research. The funders had no role in the design of the study; in the collection, analyses, or interpretation of data; in the writing of the manuscript; or in the decision to publish the results.
References
- Liu, J.; Nguyen-Van, V.; Panda, B.; Fox, K.; du Plessis, A.; Tran, P. Additive Manufacturing of Sustainable Construction Materials and Form-finding Structures: A Review on Recent Progresses. 3D Print. Addit. Manuf. 2022, 9, 12–34. [Google Scholar] [CrossRef] [Scilit]
- Rosario, M.D.L.A.O.D.; Medina, M.; Duque, R.; Ortega, A.A.J.; Castillero, L. Advancing Sustainable Construction: Insights into Clay-Based Additive Manufacturing for Architecture, Engineering, and Construction. In Developments in Clay Science and Construction Techniques; IntechOpen: London, UK, 2024. [Google Scholar] [CrossRef] [Scilit]
- Leles da Silva, M.D.; Silva, L.F.; Toralles, B.M.; Cardoso, F.A.R.; Corso, M.; Soto Herek Rezende, L.C. Building a sustainable future: The role of additive manufacturing in civil construction. Case Stud. Constr. Mater. 2024, 20, e02976. [Google Scholar] [CrossRef] [Scilit]
- Hasani, N.; Hosseini, A.; Ashjazadeh, Y.; Diederichs, V.; Ghotb, S.; Riggio, M.; Hansen, E.; Nasir, V. Outlook on human-centred design in industry 5.0: Towards mass customisation, personalisation, co-creation, and co-production. Int. J. Sustain. Eng. 2025, 18, 2486343. [Google Scholar] [CrossRef] [Scilit]
- Nasir, V.; Hosseini, A.; Binfield, L.; Hasani, N.; Ghotb, S.; Diederichs, V.; Fox, G.O.; McCann, A.J.; Riggio, M.; Chandler, K.D.; et al. Human-centric Industry 5.0 manufacturing: A multi-level framework from design to consumption within Society 5.0. Int. J. Sustain. Eng. 2025, 18, 2551000. [Google Scholar] [CrossRef] [Scilit]
- Gyawali, B.; Haghnazar, R.; Akula, P.; Alba, K.; Nasir, V. A review on 3D printing with clay and sawdust/natural fibers: Printability, rheology, properties, and applications. Results Eng. 2024, 24, 103024. [Google Scholar] [CrossRef] [Scilit]
- Bhusal, S.; Sedghi, R.; Hojati, M. Evaluating the Printability and Rheological and Mechanical Properties of 3D-Printed Earthen Mixes for Carbon-Neutral Buildings. Sustainability 2023, 15, 15617. [Google Scholar] [CrossRef] [Scilit]
- Carcassi, O.B.; Maierdan, Y.; Akemah, T.; Kawashima, S.; Ben-Alon, L. Maximizing fiber content in 3D-printed earth materials: Printability, mechanical, thermal and environmental assessments. Constr. Build. Mater. 2024, 425, 135891. [Google Scholar] [CrossRef] [Scilit]
- Gyawali, B.; Bentley, K.; Hosseini, A.; Haghnazar, R.; Roach, D.; Akula, P.; Alba, K.; Nasir, V. Predicting printing height in direct ink writing of wood-clay composites using explainable machine learning. Int. J. Adv. Manuf. Technol. 2025, 140, 197–213. [Google Scholar] [CrossRef] [Scilit]
- Bryson, Z.E.; Srubar, W.V.; Kawashima, S.; Ben-Alon, L. Towards 3D Printed Earth-and Bio-Based Insulation Materials: A Case Study on Light Straw Clay. In Proceedings of the 18th International Conference on Non-conventional Materials and Technologies, Virtual, 7–23 June 2022. Session 2B Paper 61. [Google Scholar]
- Rech, A.; Chiujdea, R.; Colmo, C.; Rossi, G.; Nicholas, P.; Tamke, M.; Thomsen, M.R.; Daugaard, A.E. Waste-based biopolymer slurry for 3D printing targeting construction elements. Mater. Today Commun. 2022, 33, 104963. [Google Scholar] [CrossRef] [Scilit]
- Goh, G.D.; Sing, S.L.; Yeong, W.Y. A review on machine learning in 3D printing: Applications, potential, and challenges. Artif. Intell. Rev. 2021, 54, 63–94. [Google Scholar] [CrossRef] [Scilit]
- Safdar, M.; Xie, J.; Zhao, Y.F. Advancing machine learning in additive manufacturing: Perspectives on data challenges, model development, and industrial adoption. Eng. Sci. Addit. Manuf. 2025, 1, 025040004. [Google Scholar] [CrossRef] [Scilit]
- Ali, A.; Riaz, R.D.; Malik, U.J.; Abbas, S.B.; Usman, M.; Shah, M.U.; Kim, I.H.; Hanif, A.; Faizan, M. Machine Learning-Based Predictive Model for Tensile and Flexural Strength of 3D-Printed Concrete. Materials 2023, 16, 4149. [Google Scholar] [CrossRef] [Scilit]
- Zhang, Y.; Cui, S.; Yang, B.; Wang, X.; Liu, T. Research on 3D printing concrete mechanical properties prediction model based on machine learning. Case Stud. Constr. Mater. 2025, 22, e04254. [Google Scholar] [CrossRef] [Scilit]
- Tamir, T.S.; Xiong, G.; Shen, Z.; Leng, J. Physics-Driven Data Collection in 3-D Printing: Traversing the Realm of Social Manufacturing. IEEE Trans. Comput. Soc. Syst. 2024, 11, 7909–7928. [Google Scholar] [CrossRef] [Scilit]
- Liu, X.; Mileo, A.; Smeaton, A.F. A Systematic Review of Available Datasets in Additive Manufacturing. arXiv 2024. [Google Scholar] [CrossRef] [Scilit]
- Zhu, R.; Egbe, K.J.I.; Salehi, H.; Shi, Z.; Jiao, P. Eco-friendly 3D printed concrete with fine aggregate replacements: Fabrication, characterization and machine learning prediction. Constr. Build. Mater. 2024, 413, 134905. [Google Scholar] [CrossRef] [Scilit]
- Maierdan, Y.; Zhao, D.; Chokshi, P.H.; Garmonina, M.; Kawashima, S. Rheology, 3D printing, and particle interactions of xanthan gum-clay binder for earth concrete. Cem. Concr. Res. 2024, 182, 107551. [Google Scholar] [CrossRef] [Scilit]
- Ferretti, E.; Moretti, M.; Chiusoli, A.; Naldoni, L.; de Fabritiis, F.; Visonà, M. Rice-Husk Shredding as a Means of Increasing the Long-Term Mechanical Properties of Earthen Mixtures for 3D Printing. Materials 2022, 15, 743. [Google Scholar] [CrossRef] [Scilit] [PubMed]
- Rossi, G.; Chiujdea, R.-S.; Hochegger, L.; Lharchi, A.; Harding, J.; Nicholas, P.; Tamke, M.; Thomsen, M.R. Statistically Modelling the Curing of Cellulose-Based 3d Printed Components: Methods for Material Dataset Composition, Augmentation and Encoding. In Proceedings of the Towards Radical Regeneration, DMS 2022; Gengnagel, C., Baverel, O., Betti, G., Popescu, M., Thomsen, M.R., Wurm, J., Eds.; Springer International Publishing: Cham, Switzerland, 2022; pp. 487–500. [Google Scholar] [CrossRef] [Scilit]
- Jutamulia, E.; Ankel, V.; Heifetz, A. Analysis of Defects in Metal Additive Manufacturing with Augmented Data Generation; Argonne National Laboratory (ANL): Argonne, IL, USA, 2022. [CrossRef] [Scilit]
- Chmielewski, S.; Roj, R.; Theiss, R.; Dultgen, P. Data Augmentation for Optical Inspection of Additively Manufactured Crimping Tools. In Proceedings of the Eleventh International Conference on Engineering Computational Technology; Topping, B.H.V., Iványi, P., Eds.; Civil-Comp Press: Edinburgh, UK, 2022. [Google Scholar] [CrossRef] [Scilit]
- Ahmmed, B.; Rau, E.G.; Mudunuru, M.K.; Karra, S.; Tempelman, J.R.; Wachtor, A.J.; Forien, J.-B.; Guss, G.M.; Calta, N.P.; DePond, P.J.; et al. Deep learning with mixup augmentation for improved pore detection during additive manufacturing. Sci. Rep. 2024, 14, 13365. [Google Scholar] [CrossRef] [Scilit]
- Horňas, J.; Běhal, J.; Homola, P.; Doubrava, R.; Holzleitner, M.; Senck, S. A machine learning based approach with an augmented dataset for fatigue life prediction of additively manufactured Ti-6Al-4V samples. Eng. Fract. Mech. 2023, 293, 109709. [Google Scholar] [CrossRef] [Scilit]
- Rehman, S.U.; Riaz, R.D.; Usman, M.; Kim, I.-H. Augmented Data-Driven Approach towards 3D Printed Concrete Mix Prediction. Appl. Sci. 2024, 14, 7231. [Google Scholar] [CrossRef] [Scilit]
- Xu, L.; Skoularidou, M.; Cuesta-Infante, A.; Veeramachaneni, K. Modeling Tabular data using Conditional GAN. In Proceedings of the Advances in Neural Information Processing Systems, Vancouver, BC, Canada, 8–14 December 2019. [Google Scholar]
- Machado, P.; Fernandes, B.; Novais, P. Benchmarking Data Augmentation Techniques for Tabular Data. In Proceedings of the Intelligent Data Engineering and Automated Learning–IDEAL 2022; Yin, H., Camacho, D., Tino, P., Eds.; Springer International Publishing: Cham, Switzerland, 2022; pp. 104–112. [Google Scholar] [CrossRef] [Scilit]
- Caliskan, H.; Yayla, O.F.; Genc, Y. A Comparative Analysis of Synthetic Data Generation with VAE and CTGAN Models on Financial Credit Loan Offer Data. In Proceedings of the 2023 8th International Conference on Computer Science and Engineering (UBMK), Burdur, Turkey, 13–15 September 2023; pp. 212–217. [Google Scholar] [CrossRef] [Scilit]
- Giles, O.; Hosseini, K.; Mingas, G.; Strickson, O.; Bowler, L.; Smith, C.R.; Wilde, H.; Lim, J.N.; Mateen, B.; Amarasinghe, K.; et al. Faking feature importance: A cautionary tale on the use of differentially-private synthetic data. arXiv 2022. [Google Scholar] [CrossRef] [Scilit]
- Šegota, S.B.; Lorencin, I.; Anđelić, N.; Mrzljak, V.; Gršković, A.; Ahel, J.; Smolić, K.; Markić, D. Data Synthetization and Feature Analysis: A Study in Bladder Cancer Recurrence Data. In Proceedings of the Human Systems Engineering and Design (IHSED2025): Future Trends and Applications; AHFE Open Access: Istanbul, Turkey, 2025. [Google Scholar] [CrossRef] [Scilit]
- ASTM D5102/D5102M; Standard Test Methods for Unconfined Compressive Strength of Compacted Soil-Lime Mixtures. ASTM International: West Conshohocken, PA, USA, 2024.
- Friedman, J.H. Greedy Function Approximation: A Gradient Boosting Machine. Ann. Stat. 2001, 29, 1189–1232. [Google Scholar] [CrossRef] [Scilit]
- Nasir, V.; Ali, S.D.; Mohammadpanah, A.; Raut, S.; Nabavi, M.; Dahlen, J.; Schimleck, L. Fiber Quality Prediction Using Nir Spectral Data: Tree-Based Ensemble Learning VS Deep Neural Networks. Wood Fiber Sci. 2023, 55, 100–115. [Google Scholar] [CrossRef] [Scilit]
- Moreno-Barea, F.J.; Jerez, J.M.; Franco, L. Improving classification accuracy using data augmentation on small data sets. Expert Syst. Appl. 2020, 161, 113696. [Google Scholar] [CrossRef] [Scilit]
- Zaman, A.; Bang, H.; Park, C.; Park, I.; Joung, S. Effect of GAN augmented dataset size on deep learning-based ultrasound bone segmentation model training. In Proceedings of the Medical Imaging with Deep Learning 2020 Conference, Montreal, QC, Canada, 6–9 July 2020. [Google Scholar]
- Srivastava, A.; Valkov, L.; Russell, C.; Gutmann, M.U.; Sutton, C. VEEGAN: Reducing Mode Collapse in GANs using Implicit Variational Learning. In Proceedings of the Advances in Neural Information Processing Systems; Curran Associates, Inc.: Red Hook, NY, USA, 2017. [Google Scholar]
- Gyawali, B. Evaluating the Mechanical Properties of 3D Printable Earthen Material Reinforced by Forest-Based Products. In Proceedings of the FPS-SWST Joint Convention, Fort Collins, CO, USA, 15–20 June 2025. [Google Scholar] [CrossRef]
- Gyawali, B.; McCann, A.J.; Wall, C.; Akula, P.; Alba, K.; Nasir, V. Rheological behavior of biopolymers in 3D printing of wood-reinforced earthen materials. In Proceedings of the International Conference on Wood Adhesives, Vancouver, BC, Canada, 22–24 October 2025. [Google Scholar]
- Roth, K.; Lucchi, A.; Nowozin, S.; Hofmann, T. Stabilizing Training of Generative Adversarial Networks through Regularization. In Proceedings of the Advances in Neural Information Processing Systems; Curran Associates, Inc.: Red Hook, NY, USA, 2017. [Google Scholar]
- Karras, T.; Aittala, M.; Hellsten, J.; Laine, S.; Lehtinen, J.; Aila, T. Training Generative Adversarial Networks with Limited Data. In Proceedings of the Advances in Neural Information Processing Systems; Curran Associates, Inc.: Red Hook, NY, USA, 2020; pp. 12104–12114. [Google Scholar]
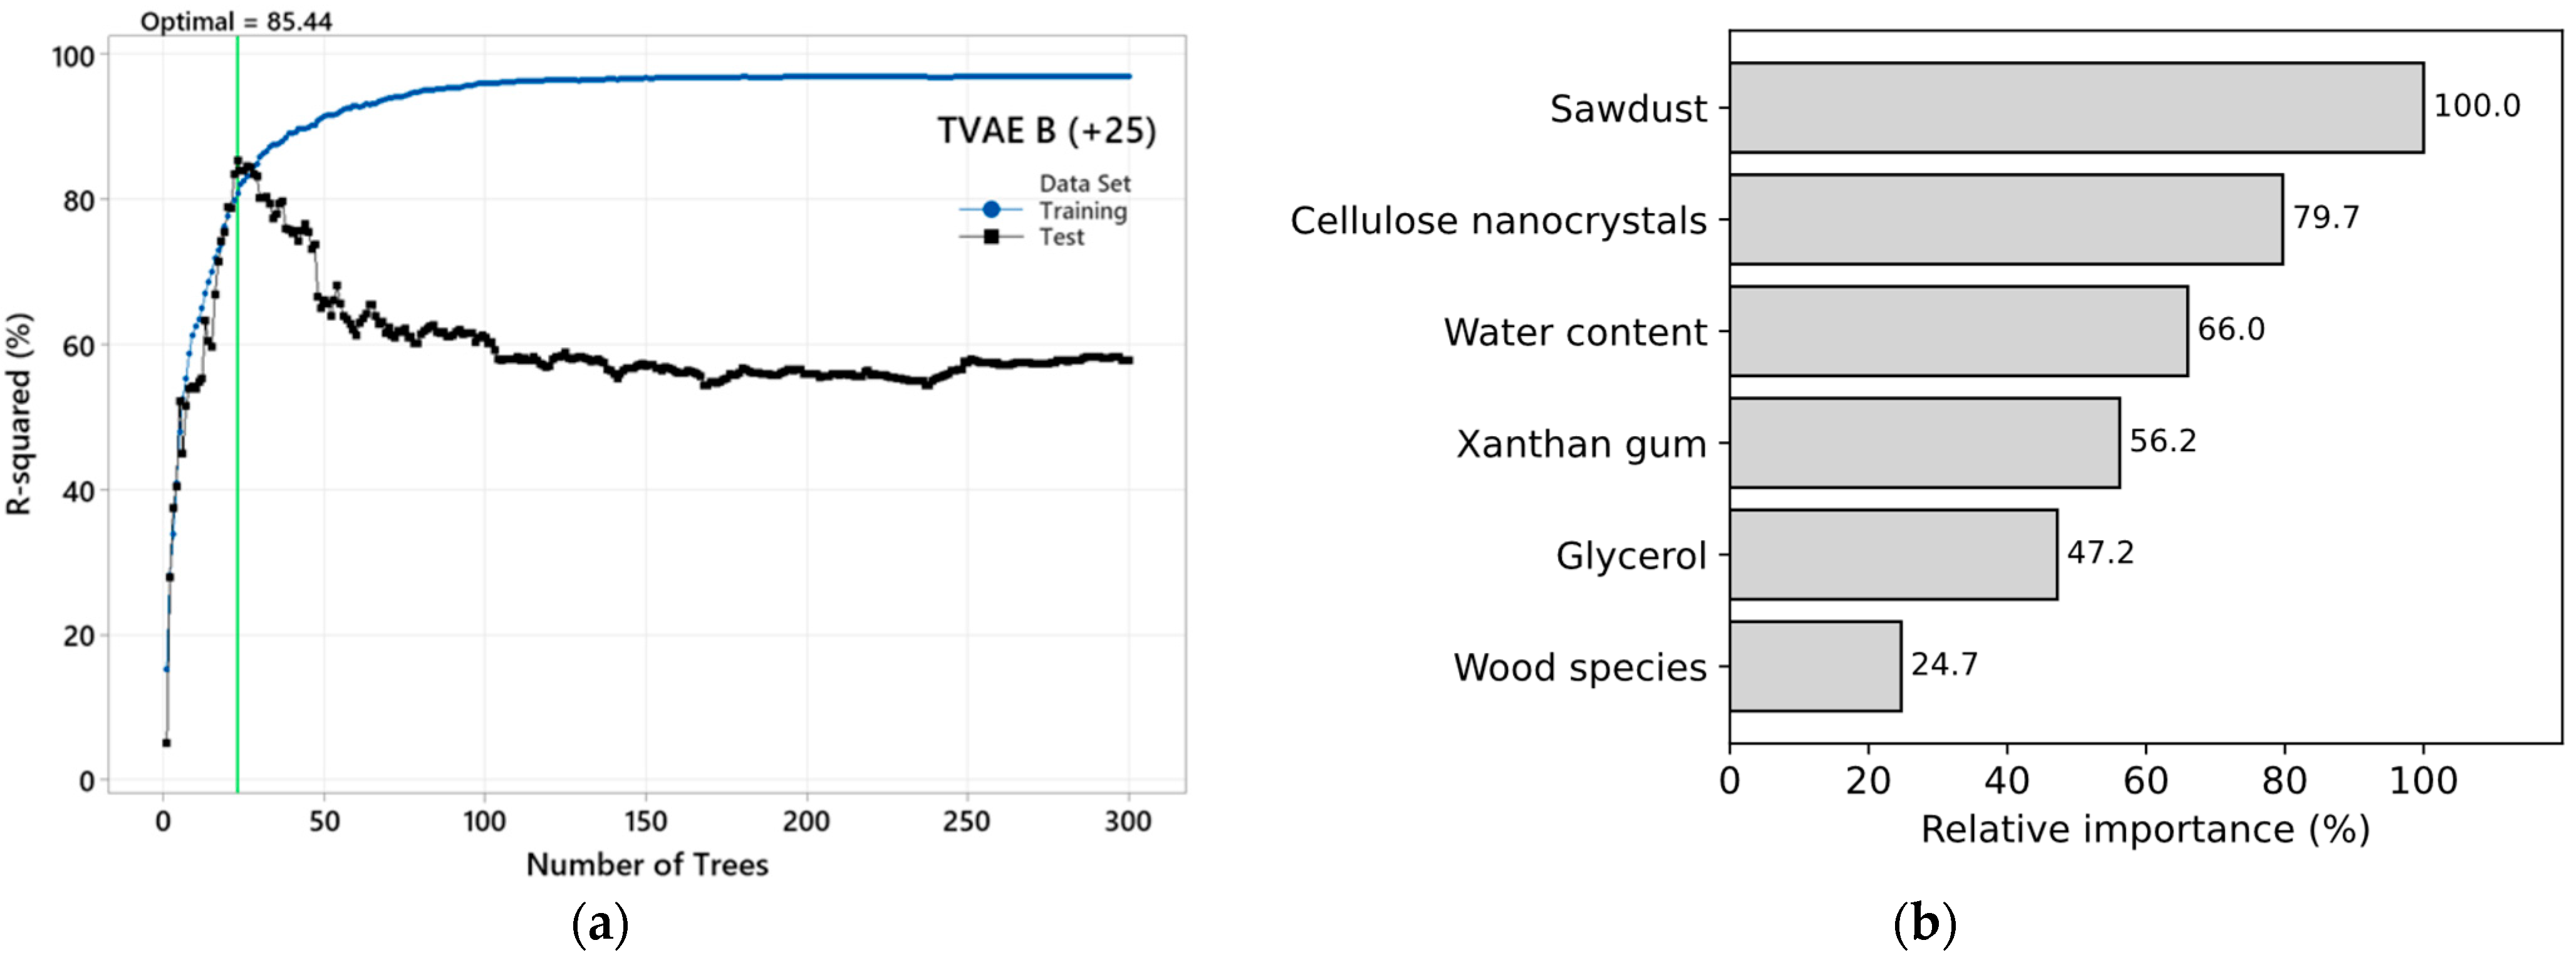

Disclaimer/Publisher’s Note: The statements, opinions and data contained in all publications are solely those of the individual author(s) and contributor(s) and not of MDPI and/or the editor(s). MDPI and/or the editor(s) disclaim responsibility for any injury to people or property resulting from any ideas, methods, instructions or products referred to in the content. |
© 2026 by the authors. Licensee MDPI, Basel, Switzerland. This article is an open access article distributed under the terms and conditions of the Creative Commons Attribution (CC BY) license.