


Abstract
Utilizing reactive extrusion additive manufacturing (REAM) to produce composite parts is a relatively unexplored area of research. The introduction and effectiveness of continuous fiber reinforcement in additive manufacturing requires a delicate balance of process parameters, including line spacing, layer height, deposition rate, and nozzle design. This study established the baseline parameters needed to produce REAM composite samples using two two-part reactive polymer resin systems and two reinforcing fibers. A venturi nozzle with internal agitation nodes was developed to introduce the continuous fiber to the REAM process and improve fiber wet-out. Material characterization revealed tensile modulus and strength increases of 1219% and 276%, respectively, for a composite containing 8.29% glass fiber—the highest fiber volume percentage achieved in this study. A basalt composite with 2.19% fiber and 13.2% voids by volume—the highest void percentage found—had a flexural strength of 35.3 MPa, a 233% increase compared to its unfilled resin system. Material characteristics, including fiber tow size, fiber sizing, resin viscosity, and resin gel time, contributed to overall composite and process performance. These findings and the processes developed in this study provide a foundation for future research aimed at improving the quality, performance, and complexity of REAM composites.
1. Introduction
Additive manufacturing is a rapidly growing manufacturing technique that allows for parts to be produced in an efficient manner with minimal tooling and manpower. Reactive extrusion additive manufacturing (REAM), or reactive resin 3D printing, is a new additive-manufacturing technique that is being established. REAM utilizes a multi-part reactive resin system that allows for parts to have higher mechanical properties and a low gel time, making for little-to-no postprocessing [1]. There is minimal research published on utilizing REAM with fiber reinforcement to form a composite material, thus making it an attractive research opportunity and the focus of this study.
1.1. Reactive Extrusion Additive Manufacturing
Reactive extrusion additive manufacturing is an additive-manufacturing technique that is able to produce parts with high performance at faster build rates than other processes. REAM utilizes a multipart resin system to create a rapidly gelled part. This rapid gelling process is referred to as in situ curing, meaning that the resin will gel in an ambient, room-temperature environment without the need of external energy [2]. REAM utilizes the mixing process to output a viscous resin material that holds its shape, allowing for more precise printing at higher deposition rates. Although the resin material is viscous enough to hold its shape, the resin is not fully cured, allowing for chemical crosslinking between layers as they are added to the part [2]. This increases the interlayer strength of the part and greatly reduces the possibility of interlaminar failure compared to other additive-manufacturing techniques. As subsequent layers are added to the part, the lower layers continue to gel, creating a rigid base capable of supporting additional layers.
Along with the faster build times, REAM is able to produce parts with better mechanical properties compared to other additive-manufacturing techniques. The use of thermoset materials in REAM compared to thermoplastics used in other additive-manufacturing processes, like fused filament fabrication (FFF) and continuous filament fabrication (CFF), is just one reason for the ability to produce higher performing materials. The crosslinking between layers in the REAM process allows for near isotropic mechanical properties [1]. Researchers at the University of Texas supported this claim and found that REAM parts had higher tensile strength and stiffness compared to acrylonitrile butadiene styrene (ABS), polylactic acid (PLA), and Nylon parts produced by FFF [1]. Researchers at PPG Industries also found that their REAM-produced parts had an increased shear modulus, while internal stresses were eliminated and bulk distortions were reduced compared to parts produced by other additive-manufacturing techniques [2].
1.2. Continuous Fiber Reinforcement
Common short and continuous fibers used to reinforce structural polymer matrix composites are glass, basalt, and carbon fiber. Glass fibers are attractive for a wide variety of applications, such as boat hulls, window frames, piping, and the aerospace and sporting goods industries [3]. The two glass fiber types most commonly used for structural composites are E-glass and S-glass [4]. Basalt fibers are formed from the melting of basalt rock and provide high temperature and chemical resistance. They also have a higher tensile strength than E-glass, a larger failure strain than carbon fibers, and a strong affinity to bond with other matrix materials [5,6,7]. Basalt fibers are commonly used to reinforce concrete but have also been used in many other applications, including acoustic and thermal insulations, electromagnetic shielding and automotive applications, and even household appliances [5,7,8].
The successful incorporation of such reinforcement fibers in REAM processes poses potential for improved mechanical performance. Short carbon fiber up to a 10% weight fraction has been shown to increase mechanical properties; however, introduction of chopped fibers to the REAM process proves challenging [9]. Continuous fiber tows like those used in thermoplastic continuous fiber additive manufacturing (CFAM) processes present a potential form factor that may be more suitable for REAM processes. However, the published literature regarding additive manufacturing of continuous fiber-reinforced thermosetting composites (CFRTCs) is limited. There is little other research accomplishing the reinforcement of REAM-printed specimens and overcoming processing hurdles ascribed to fast reaction times, build viscosity, and fiber introduction [10].
1.3. Venturi Injection
A common way to introduce a foreign substance into a fluid medium is utilizing the venturi effect. The venturi effect follows the Bernoulli Principal for smooth, steady-state laminar flow [11]. As the area of the medium decreases, the fluid pressure decreases, and the fluid velocity increases [11]. In the case of a venturi system, it becomes possible to introduce a foreign substance into a flow medium at the point after the low-pressure high velocity ends and the high-pressure low velocity begins.
For this research, a novel venturi nozzle was designed to introduce the continuous fiber into the mixed two-part resin system. This will be accomplished by introducing the fiber at the point of low pressure, allowing the fiber to integrate into the resin system without the loss of resin material leaving the nozzle prior to the exit orifice.
1.4. Fiber Wet-Out
Fiber wet-out refers to the impregnation of a fiber bundle with the resin or matrix material. Proper fiber wet-out occurs when each individual filament in the fiber tow becomes encompassed by the matrix, leading to improved mechanical strength performance [12]. This is due to the creation of interfacial bonds between the reinforcing fiber and matrix that allow for the transfer of load between the two without failures at their interface [13]. Conversely, when the matrix material insufficiently impregnates the fiber, the fiber tow becomes encapsulated. Composites with encapsulated fibers do not contain optimal interfacial bonds to transfer applied loads, leading to premature failures in the form of fiber pullout. One factor contributing to fiber wet-out is through physical displacement of the matrix material into the fiber tow. Another factor influencing fiber wet-out and the creation of the interfacial bonds between the fiber and matrix is the surface energy of the fiber and the conditions of the constituents when forming the interfacial bonds [13]. The venturi nozzle design presented here additionally incorporates novel internal agitation nodes to spread the continuous fiber tow thereby improving fiber wet-out.
In summary, the purpose of this study was to develop a REAM process that could produce both neat and continuous long fiber-reinforced thermoset specimens and to measure their performance. To accomplish this, the following objectives were identified:
- Develop a nozzle that can introduce continuous fiber into the matrix material.
- Develop REAM processing parameters that can successfully create thermoset composites with continuous fiber.
- Manufacture continuous fiber-reinforced composite structures.
- Evaluate and compare the mechanical properties of the produced composites.
2. Materials and Methods
2.1. Resin
Two unique two-part reactive resin systems were used to create REAM-produced specimens. Both two-part polyurea resin systems were proprietary to PPG Industries (PPG Industries, Inc., Pittsburgh, PA, USA) and formulated to be mixed at a 1:1 ratio by volume. The first resin system, distinguishable by its grey color, had a standard gel time of 15 s. The second resin system had a lower viscosity compared to the first formulation, was cream-colored, and had a 90-s gel time. As the two resin formulations and their nomenclature were undisclosed, color, as a physical property, was used to differentiate between them. Thus, the resin system with a 15-s gel time was denoted as the “grey resin”, and the 90-s-gel-time resin system was referred to as the “cream resin”.
2.2. Fiber
Basalt and glass fibers were used for the creation of REAM-produced composites with the two Polyurea resin systems. The basalt fiber utilized was Sudaglass BCF-800-13-1 (Sudaglass Fiber Technology, Inc., Houston, TX, USA), with a tex value of 264 g/km [14]. The glass fiber was Owens Corning Type 30 SE 1200 (Owens Corning, Toledo, OH, USA), with a tex value of 1100 g/km [15]. The mechanical properties of the basalt and glass fibers can be seen in Table 1 below [14,16].
Table 1.
Mechanical properties of basalt and glass fibers.
2.3. Sample Manufacturing
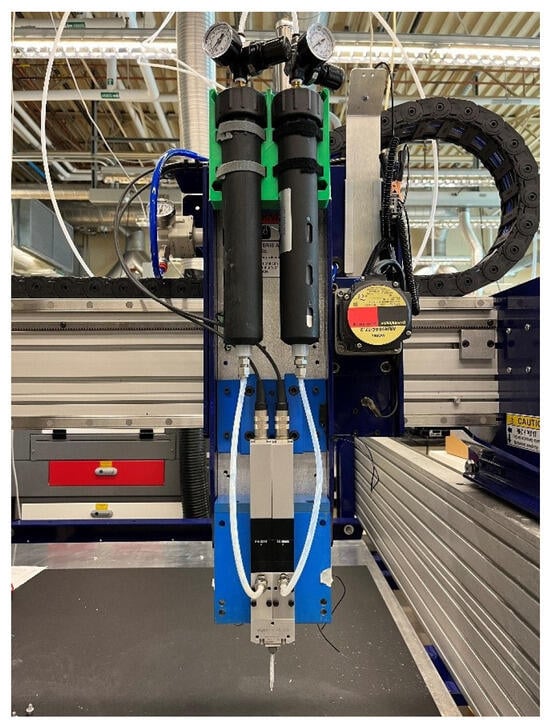
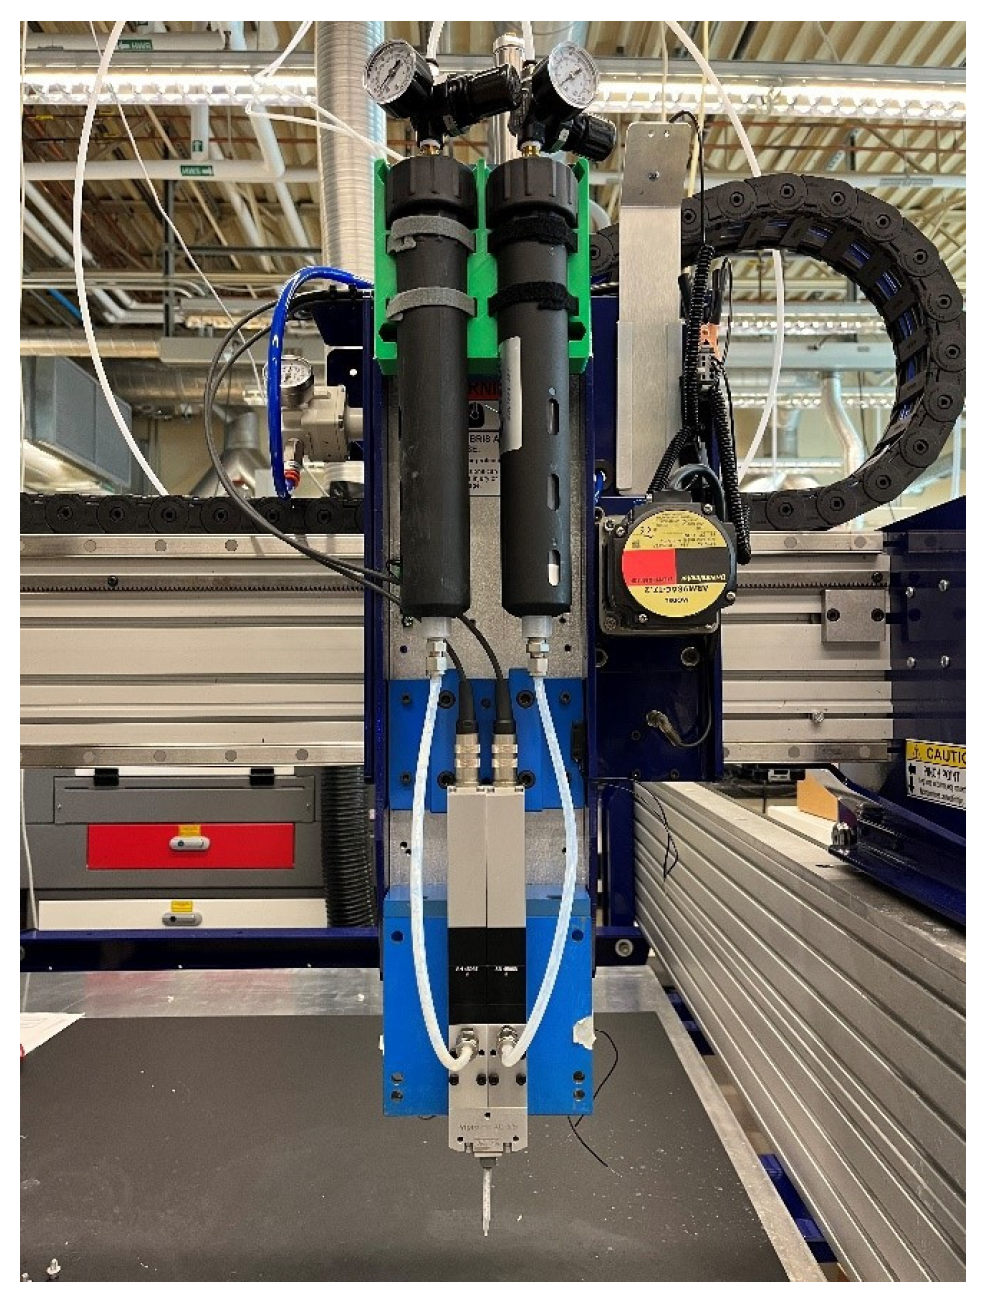
The REAM specimens were produced on a retrofitted ShopBot PRS Alpha CNC Machine (ShopBot Tools, Inc., Durham, NC, USA). The ShopBot provided a 900 by 900 mm print area for the production of test specimens. A Viscotec Vipro-HEAD 5/5 3D print head (ViscoTec Pumpen- u. Dosiertechnik GmbH, Töging am Inn, Germany) was mounted to the ShopBot to hold and dispense the resin systems. The Vipro-HEAD is a metered dispensing pump that facilitated an accurate 1:1 mix ratio by volume of the two-part resin systems. This REAM setup can be seen in Figure 1 below. Processing took place under ambient lab conditions, with temperatures ranging from 20 °C to 23 °C, and humidity levels of 30% to 50%.
Figure 1.
Reactive extrusion additive manufacturing (REAM) setup.
To mix the two-part resin systems, an 8-element static mixer (Adhesive Dispensing Ltd., Milton Keynes, United Kingdom) was attached to the Vipro-HEAD. This static mixer was also used as the dispensing nozzle for the unreinforced REAM-produced samples. In order to incorporate fiber and create REAM-produced composites, a venturi nozzle printed via stereolithography (SLA) was attached to the end of the 8-element static mixer with ultraviolet light-curable resin.
Straight-line printing trials were conducted to determine the processing parameters for REAM-produced specimens. For each specimen type, straight lines were printed by varying the resin flow rate, the nozzle z-height, and print speed. The straight lines were observed qualitatively for the determination of the previously mentioned processing parameters used for the production of test specimens. The bead geometry associated with the selected processing parameters was then used to determine the line spacing and initial layer heights of the test specimens.
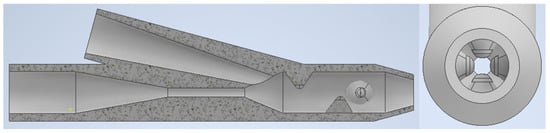
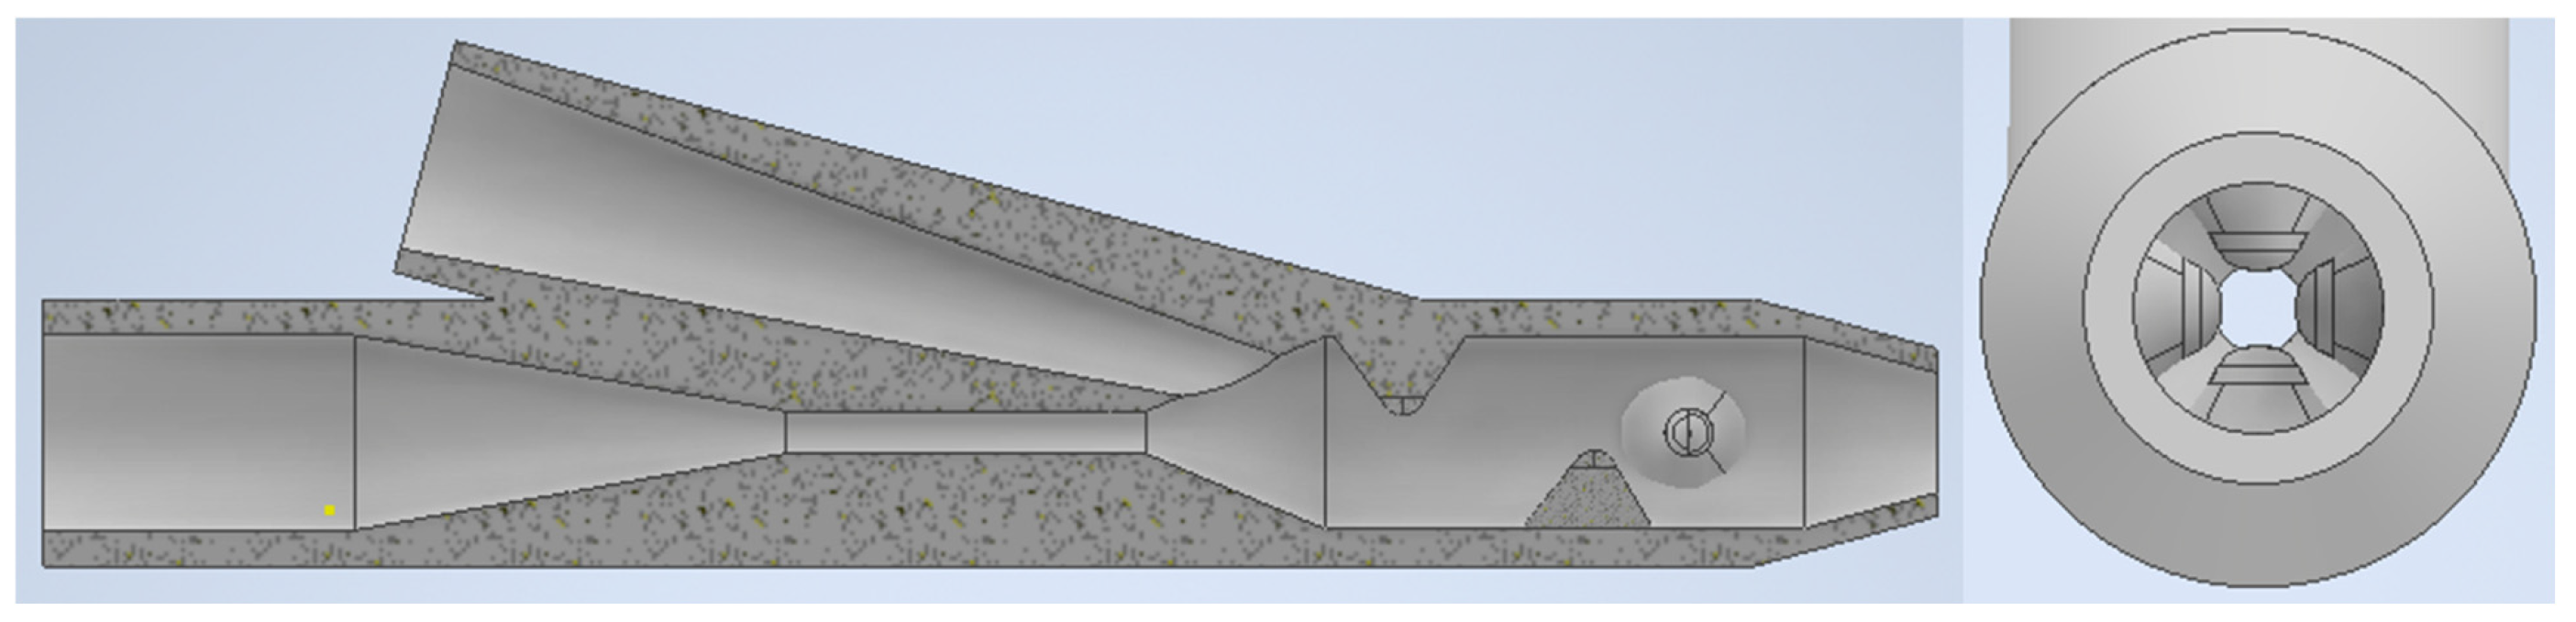
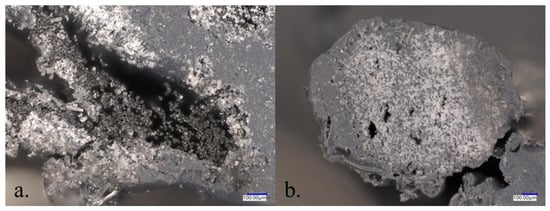
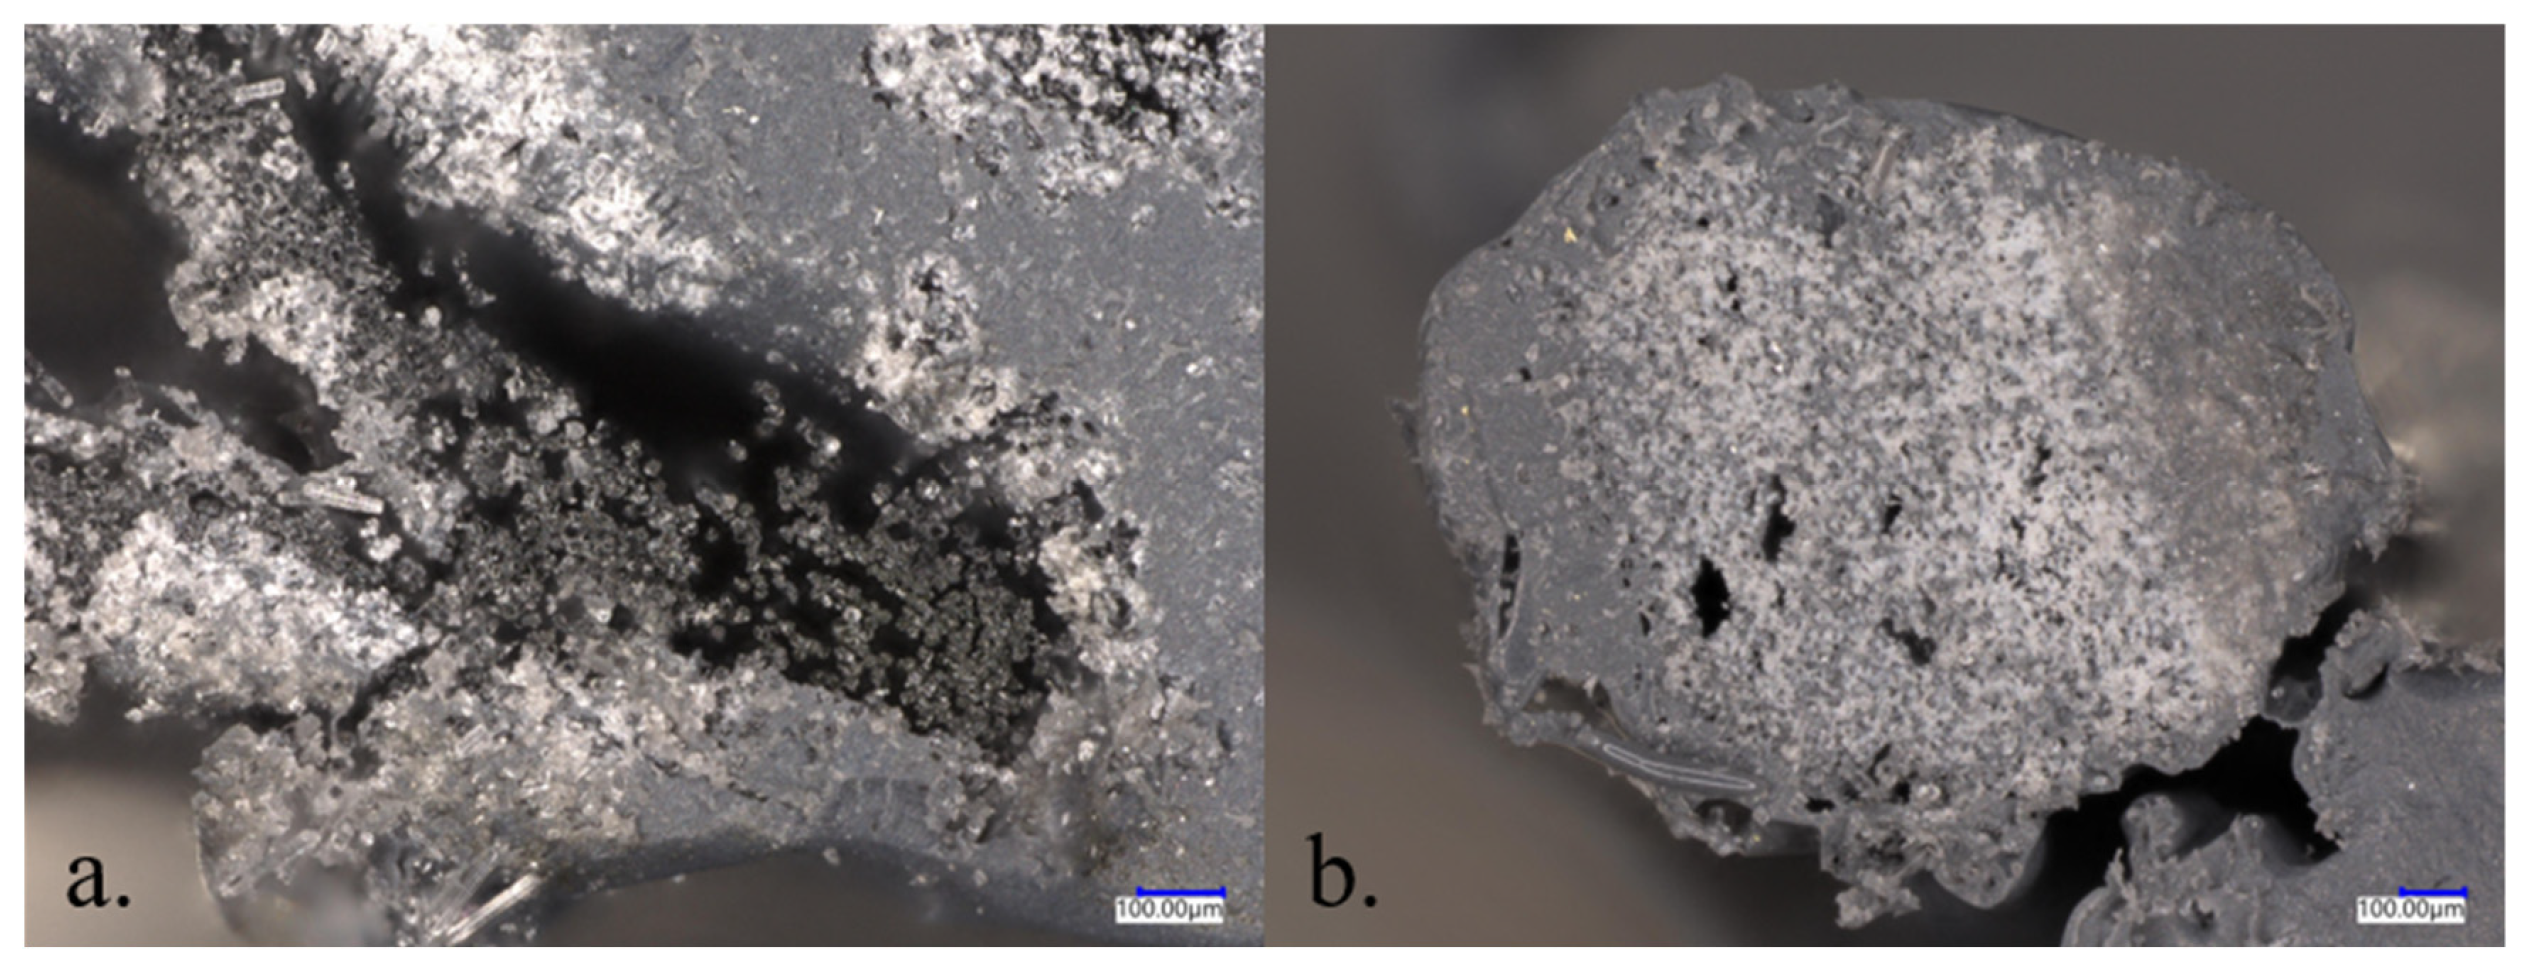
When qualitatively comparing the composite straight-line tests produced with the venturi nozzle design, it was observed, under a microscope, that the resin failed to penetrate in between the individual filaments of the fiber. Instead, the resin encapsulated the fiber tow. To combat this, four agitating nodes were introduced inside the venturi nozzle after the fiber injection point. These agitating nodes were centered 2 mm apart and rotated 90° about the center axis of the venturi nozzle. A cross-section following the mid-plane of the modified venturi nozzle and a view through its 3 mm orifice can be seen in Figure 2.
Figure 2.
New venturi nozzle design with agitating nodes.
The internal nodes were expected to agitate and spread the fiber tow as it passed through the nozzle and became integrated with the resin system. This would then allow the resin mixture to penetrate in between and better encompass the individual fiber filaments, leading to improved fiber wet-out. Figure 3 compares cross-sections of beads produced before and after the agitating nodes were included in the nozzle design. As seen in these images, the internal agitating nodes improved fiber wet-out. The REAM-produced composite test specimens utilized this venturi nozzle design with internal agitating nodes.
Figure 3.
Cross-sections of composite beads produced (a) without and (b) with agitating nodes.
From the straight-line tests, the optimal resin material flow rate was selected for ease of production and for fiber wet-out for the composites. The material flow rates used for the production of the neat, basalt-reinforced, and glass-reinforced test specimens can be found in Table 2.
Table 2.
Resin material flow rates for each sample type.
The bead geometries from the straight-line tests at the material flow rates given in Table 2 were used to create the test specimen G-Code. Neat specimens were produced as a continuous print using a print speed of 2500 mm/min, and the composite specimens were printed layer by layer. The neat specimens for both the cream and grey resin systems were produced with the same G-Code and utilized the spacing parameters outlined in Table 3. Each neat specimen consisted of three unidirectional layers with ten resin beads per layer.
Table 3.
Neat specimen bead spacing.
For the composite specimens, the number of lines and line spacing were consistent for all four fiber–resin combinations. Each specimen had four lines spaced 3 mm apart. A sample path of the G-Code used for the composite specimens can be seen in Figure 4, where the white circles represent the pivot point of the resin bead when taking 180° turns.
Figure 4.
Sample G-Code path used for REAM production of composite specimens.
For all specimen types, long samples were produced and cut down to size for testing. The neat resin specimens were produced in one continuous print compared to the composite specimens that were produced layer-by-layer. Due to the gel time of both of the resin systems, it was not possible to navigate 180° turns during the production of the unidirectional composite specimens without the fiber being dragged through the print. To achieve the 180° turns, nails were glued to the bed at the pivot points shown in Figure 4 to wrap the fiber around and hold it in place as the print head moved in the opposite direction. By printing the composites layer by layer, the loops that formed around the nails were able to be removed periodically, along with any excess resin buildup. This allowed the print head to move free of obstructions and resulted in a more consistent line placement as subsequent layers were added to the sample. The layer-by-layer printing of the composite specimens was also advantageous, as it allowed for the static mixer and venturi nozzle to be periodically replaced. Replacing the static mixer and nozzle prevented fouling or gelling of the resin inside the nozzle that would affect flow. Finally, the layer-by-layer printing of the composite material allowed the sample to be qualitatively inspected after each layer. In doing this, the layer height and print speed could be altered to fill in any large voids between lines due to any printing irregularities in previous layers.
2.4. Testing
Specimens were tested between 14 and 21 days after production using thermogravimetric analysis (TGA), differential scanning calorimetry (DSC), dynamic mechanical analysis (DMA), tensile testing, and flexural testing. This was done to provide a consistent post-cure of the REAM-produced specimens. Only in-plane unidirectional mechanical properties were measured during this study.
2.4.1. Thermogravimetric Analysis
TGA was conducted on neat resin samples for the cream and grey resin systems using a Discovery 500 thermogravimetric analyzer (TA Instruments, New Castle, DE, USA) in accordance with ASTM D3850 [17]. TGA was used to determine the carbonization ratio of the two resin systems. Five specimens from both the cream and grey neat resin prints were used for this testing. The specimens were subjected to a temperature ramp up of 10 °C/min from 20 °C to 600 °C. During the temperature ramp, the weight percentage of the sample was recorded. The carbonization ratio (CRm) of the two resin systems was calculated with Equation (1):
using the loss in weight of the specimen upon completion of the temperature ramp up.
CRm = 100% − Weight Percent Loss,
2.4.2. Density Measurement
The density of the produced samples was found by utilizing a water submersion test in accordance with ASTM D792 [18]. This test was conducted on five samples for each specimen type. To find the sample density, each specimen was cut to approximately 25 mm in length. A dry (md) and wet (mw) mass of the sample was found using an Ohaus Adventurer scale AR2140 (Ohaus Corporation, Parsippany, NJ, USA) and a Mettler Toledo Density Determination Kit 33360 (Mettler-Toledo International, Inc., Greifensee, Switzerland). The temperature of the water that the specimen was submerged in for the measurement of the wet mass was also recorded. This was done to determine the density of the water, ρw. These values were used to calculate the sample density, ρ, with Equation (2):
2.4.3. Burn Off
Burn off was conducted to determine the constituent content of the REAM-produced composite samples in accordance with ASTM D3171-22 Procedure H [19]. The burn off was conducted on the five samples used in the determination of the sample density in Section 2.4.2, for each specimen type. These samples were placed in a nitrogen-purged SNOL 7.2/900 oven (SnolTherm GmbH, Gießen, Germany) at 560 °C for six hours, for carbonization.
To determine the constituent content of the composite samples, the mass of the matrix material (Mm) had to be calculated. To do this, the mass of each sample was recorded before carbonization, Mi, and after carbonization, Md. The recorded masses and the carbonization ratio, CRm, obtained from the TGA test conducted in Section 2.4.1, were used in Equation (3),
to calculate the mass of the matrix material. The calculated matrix mass was then used in Equations (4) and (5), with the sample mass before carbonization and the density of the composite sample, Pc. These values were used with the density of the reinforcing fibers, Pr, given in Table 1, to calculate the fiber volume percentage (Vr) with Equation (4):
The matrix volume percentage, Vm, was calculated in Equation (5):
where Pm is the density of the neat resin system, again, found through the testing. Finally, the fiber and matrix volume percentage were then used to calculate the void volume percentage of the composite samples, denoted by Vv in Equation (6):
Vv = 100 − (Vr + Vm).
2.4.4. Differential Scanning Calorimetry
DSC was conducted in accordance with ASTM E2160 [20]. The DSC test was conducted on a Discovery DSC Q2000 machine (TA Instruments, New Castle, DE, USA), using three samples for each specimen type. Following the standard, the samples were subjected to a heat–cool–heat cycle to observe any exothermic reactions. Exothermic reactions would show any unreacted material, meaning that there was an insufficient mix and/or gel of the two-part resin system. The samples were heated from the ambient room temperature to 250 °C, cooled to 40 °C, and then heated to 250 °C again. During this process, the measured heat flow of the sample was recorded. Any spikes in the heat flow during the heating processes illustrated an exothermic reaction.
2.4.5. Dynamic Mechanical Analysis
In accordance with ASTM D5418, DMA was conducted on three samples for each specimen type, as well to find their glass transition temperatures (Tg) [21]. The DMA test was conducted using a dual cantilever beam on a Discovery DMA 550 machine (TA Instruments, New Castle, DE, USA). The sample was loaded into the dual cantilever fixture and cooled to −75 °C. The sample was then heated to 150 °C at a rate of 5 °C/min.
2.4.6. Tensile Testing
For tensile testing, an MTS Criterion Model 43 load frame (MTS Stystems Corporation, Eden Prairie, MN, USA) equipped with a 2.5 kN load cell was utilized. The tensile testing was carried out by referencing ASTM D638 [22]. Following the ASTM standard, a minimum of five samples for each specimen type were tested. To achieve this, samples were cut to 150 mm in length and placed into the grips to achieve a 75 mm gauge length. All specimens were equipped with a 25.4 mm extensometer to measure the strain during the elastic region of the tensile test. Due to the extreme elasticity of the material, the crosshead rate was set to 10 mm/min for the tensile test. A faster crosshead rate was chosen for the tensile test in order to prevent any relaxation of the specimen during the testing. The elastic modulus, ultimate tensile strength, and strain at failure were captured.
2.4.7. Flexural Testing
A three-point bending test was performed, in accordance with ASTM D790, for at least five samples for each specimen type [23]. An MTS Criterion Model 43 load frame (MTS Systems Corporation, Eden Prairie, MN, USA) equipped with a 2.5 kN load cell was used to conduct the flexural testing. The flexural test specimens were cut to achieve a 16:1 span-length-to-thickness ratio, with 10% overhang on each side of the supports, as called out in the ASTM standard. Per the standard, the Z value was set to 0.01 mm/mm/min for the composite test specimens and 0.1 mm/mm/min for the neat resin specimens. This difference in the Z value is due to the neat resin specimens not yielding before 5% strain, whereas the composite specimens did. Each specimen was tested until it achieved 5% strain to obtain the flexural stress, σf, and flexural modulus, Ef.
2.4.8. Statistical Analysis
The single-factor analysis of variance (ANOVA) has been utilized in many studies to determine the significance of the measured data [24,25,26,27,28]. For this research, ANOVA was used to determine the effectiveness of modifying a variable on the results [29]. The single-factor ANOVA used a null hypothesis that stated that the alteration of a parameter would not affect the mechanical performance of the produced REAM specimens. The primary parameters investigated included varying the reinforcement of specimens with the same resin system and varying the resin system with the same reinforcement. This was conducted at 5% significance level to determine if the null hypothesis was rejected.
3. Results
3.1. Carbonization Ratio
The average carbonization ratio for the cream and grey resin systems found using Equation (1) can be seen in Table 4. The cream resin had a much lower weight percent loss, leading to a carbonization ratio of 40.2% compared to the grey resin, which yielded a carbonization ratio of 11.5%. This was expected due to the presence of pigment additives that give the resin its light color, including Titanium Dioxide, that would not burn off.
Table 4.
Average carbonization ratio of each resin system.
3.2. Density
Density testing was conducted on the neat and fiber-reinforced samples for both resin types. Utilizing Equation (2), the average density for each specimen type was calculated, as well as the percentage change in the densities of the composite specimens when compared to the neat resin samples. The average density results can be seen in Table 5.
Table 5.
Average density of each specimen type.
Conventional theory would be that adding basalt or glass fibers, having densities of 2.75 g/cm3 and 2.62 g/cm3, into a less dense resin system would result in an increase in the specimen’s density. The average density of the grey basalt and grey glass specimens saw a slight increase of 1.83% and 5.15% when compared to the average density of 1.15 g/cm3 for the grey neat specimens. However, the cream basalt and cream glass specimens exhibited an average density decrease of 11.2% and 3.04% compared to the cream neat specimens, yielding an average density of 1.42 g/cm3. This would suggest that the results of the burn off test would show the presence of voids in the composite samples and relatively low fiber volume percentage when compared to traditional composites.
When comparing the basalt- and glass-reinforced samples for both resin types, it is seen that the average density of the glass specimens was higher than the basalt samples. Given this information and that the fiber density of the glass is lower than that of the basalt, it was hypothesized that glass-reinforced composite samples would yield a higher fiber volume percentage than the basalt-reinforced samples for the same resin type.
3.3. Volume Percentage
A burn-off test of the composite specimens used in the density testing was conducted. The average fiber, matrix, and void volume percentages of these specimens were calculated using Equations (4), (5), and (6), respectively, and are presented in Table 6.
Table 6.
Average constituent volume percentages of the composite specimens.
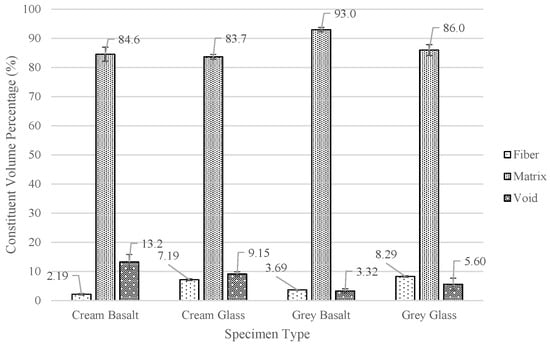
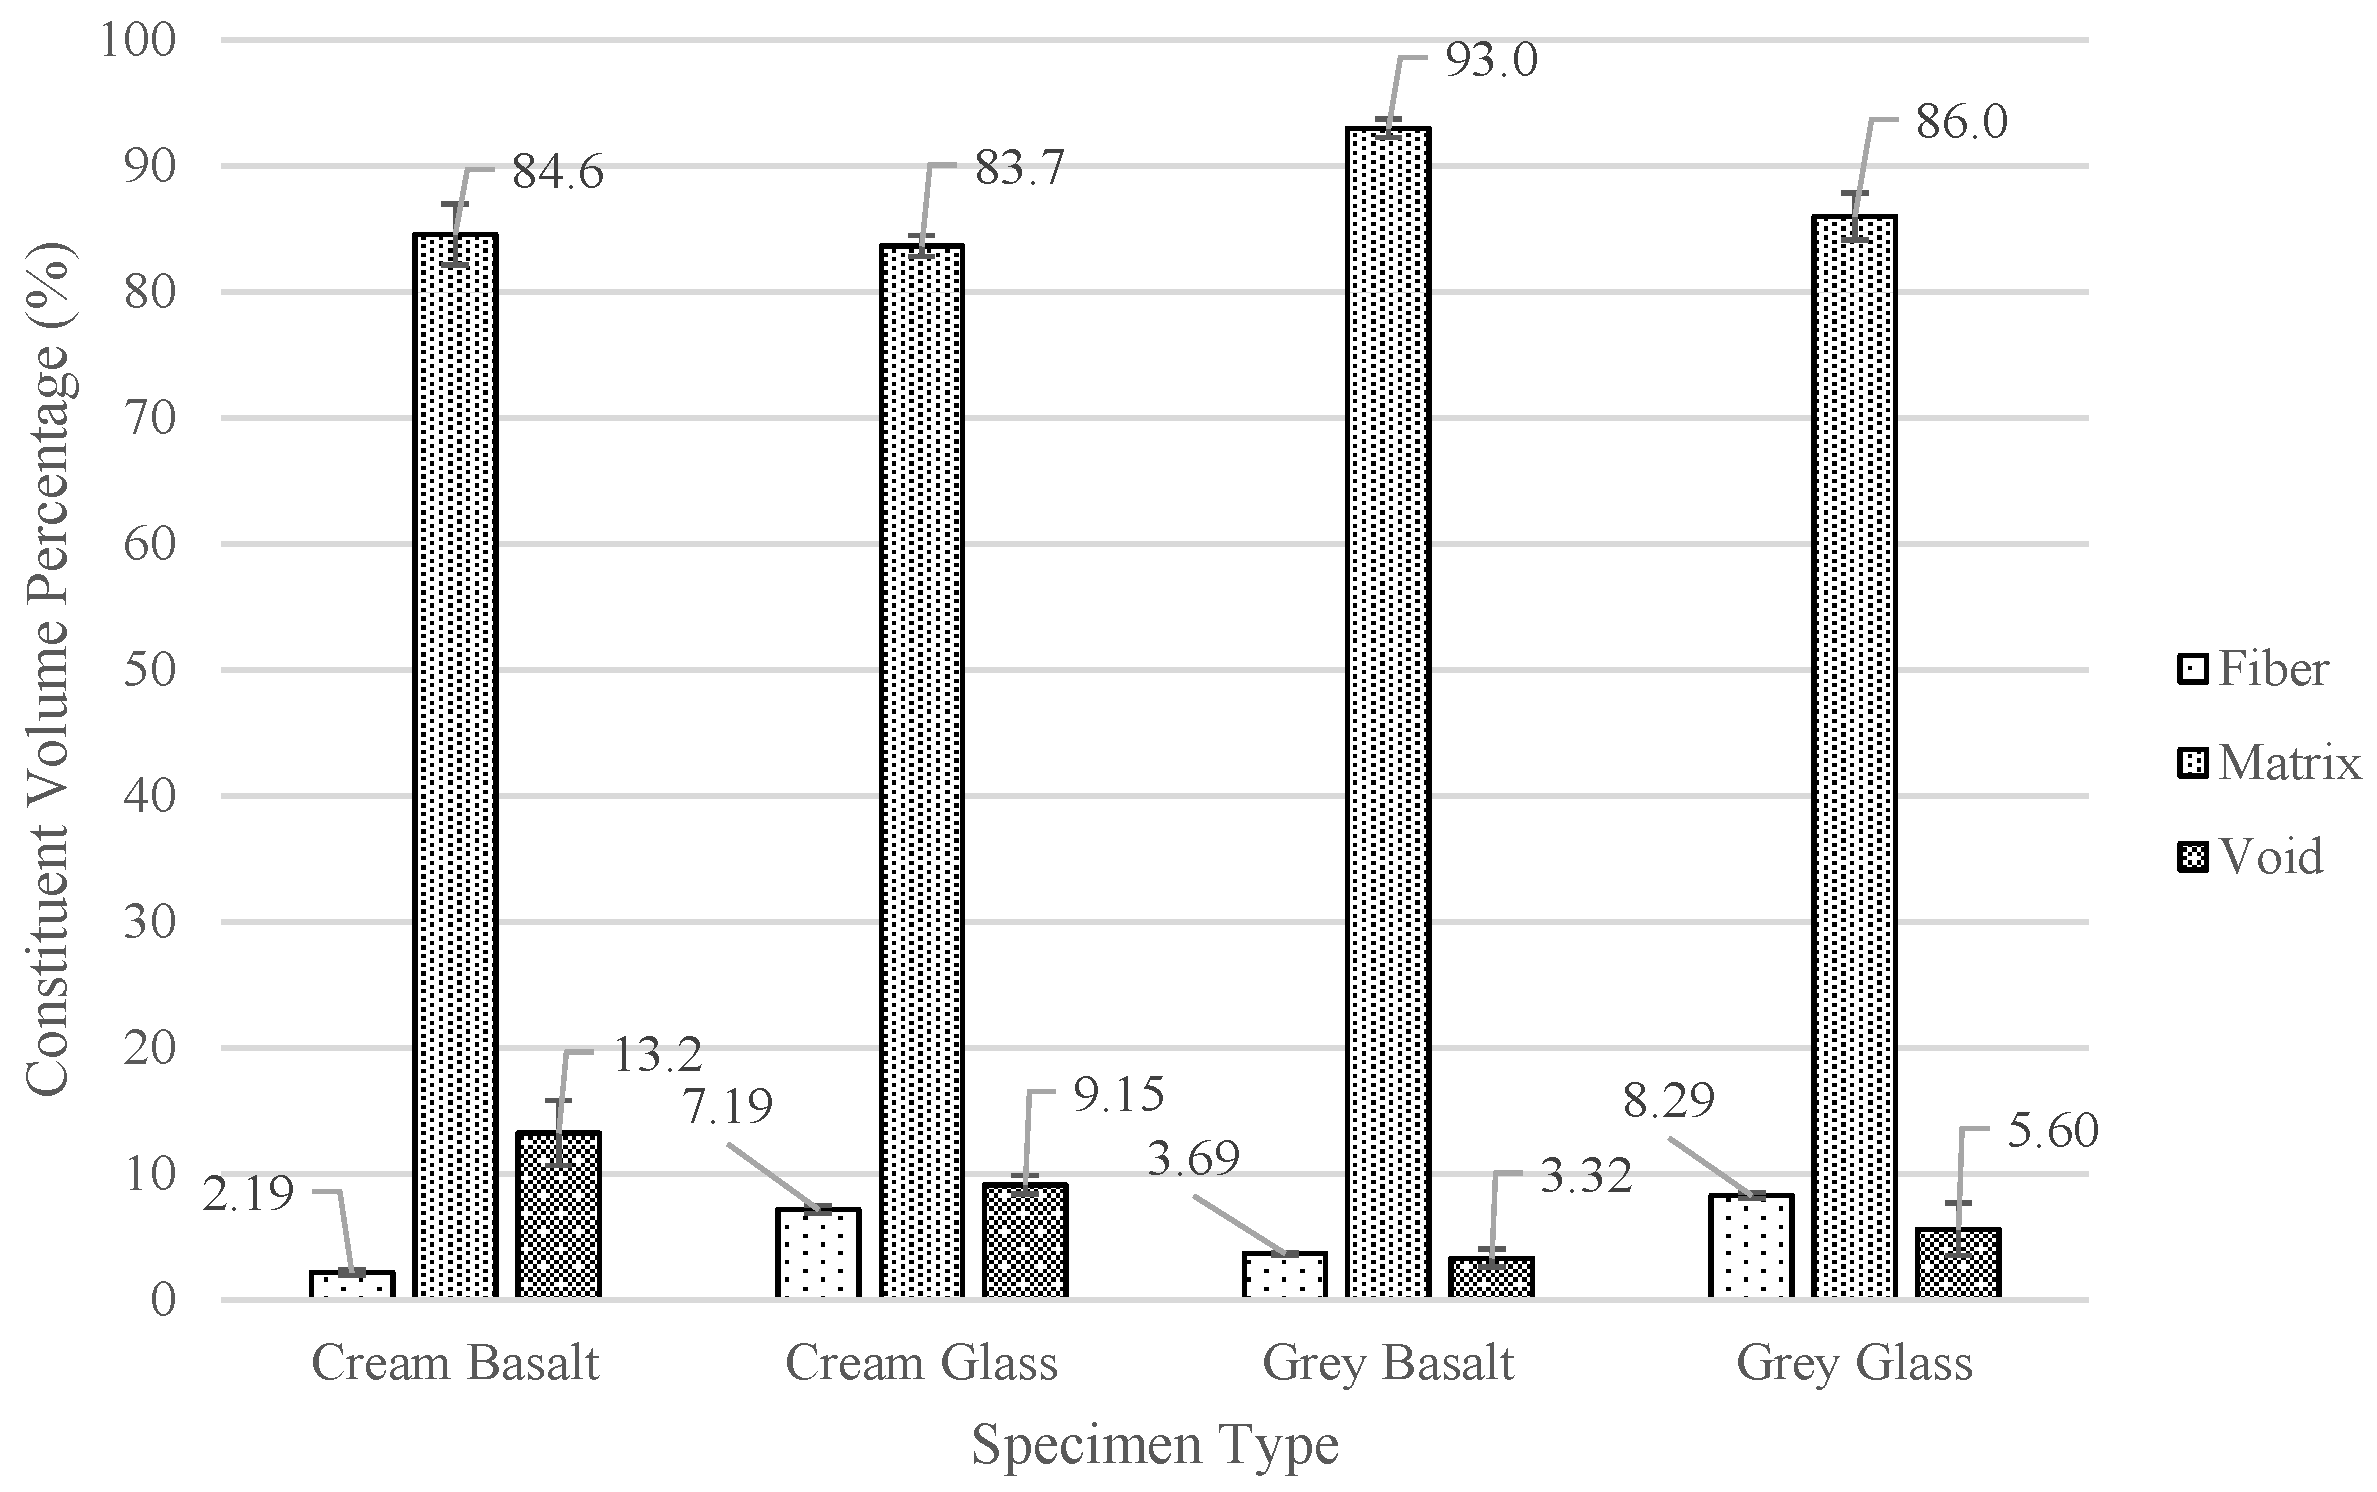
The results of the burn-off test confirmed the suggestions of the density test of the composite specimens having a relatively low fiber volume percentage and the presence of voids. The grey glass specimens exhibited the highest average fiber volume percentage of 8.29%, and the grey basalt specimens yielded the lowest average void percentage of 3.32%. The presence of voids, in part, is due to the inconsistency in which the fiber was laid on the print bed after taking the 180° turns around the nails.
When comparing the constituent percentages of the composite samples of the same resin, it was found that the fiber volume percentage was higher in the glass specimens than the basalt specimens. This is, in part, due to the fact that the basalt fiber had a smaller tow size than the glass fiber while maintaining a similar print bead size. Figure 5 illustrates the average constituent volume percentage of the four composite specimens.
Figure 5.
Average constituent volume percentage of composite specimens.
3.4. Degree of Cure
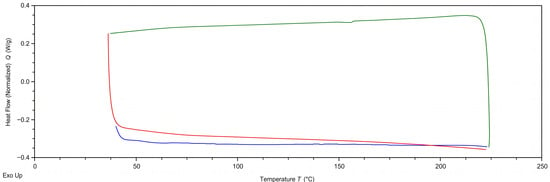
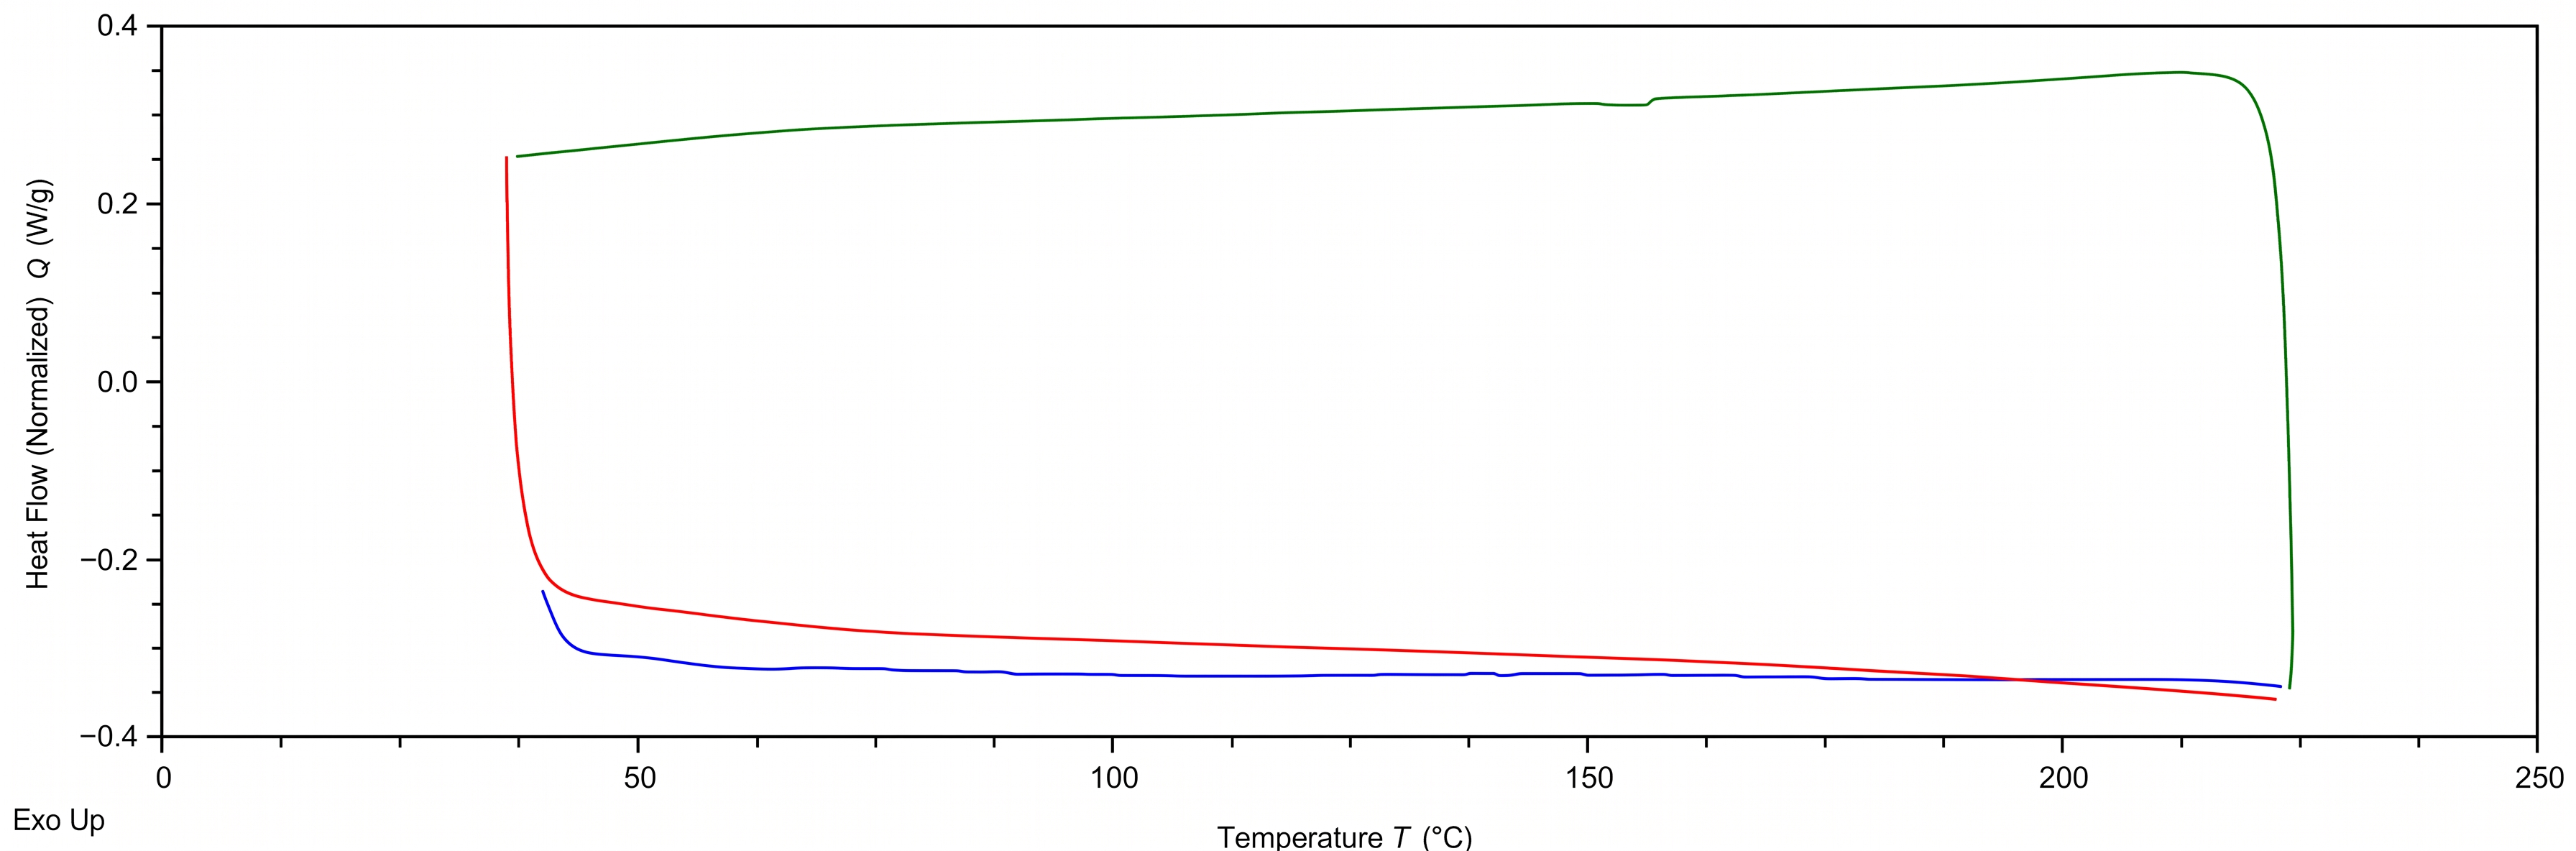
Differential scanning calorimetry was performed on three samples for the neat and composite specimens for both resin systems. The heat-flow-versus-temperature curve for the grey glass specimen 3 can be seen in Figure 6, showing no significant exothermic reactions or spikes in the heat flow of the specimen during the heating processes. This was consistent with all the samples of each specimen type, confirming a sufficient mix and gel of the two-part resin system during the printing process.
Figure 6.
Representative differential scanning calorimetry (DSC) curve of grey glass specimen 3: blue: first heat cycle, green: cool cycle, red: second heat cycle.
3.5. Glass Transition Temperature
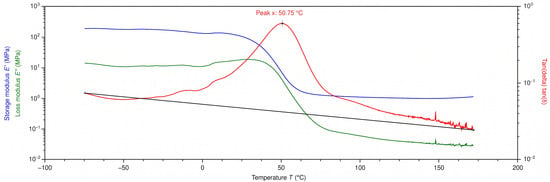
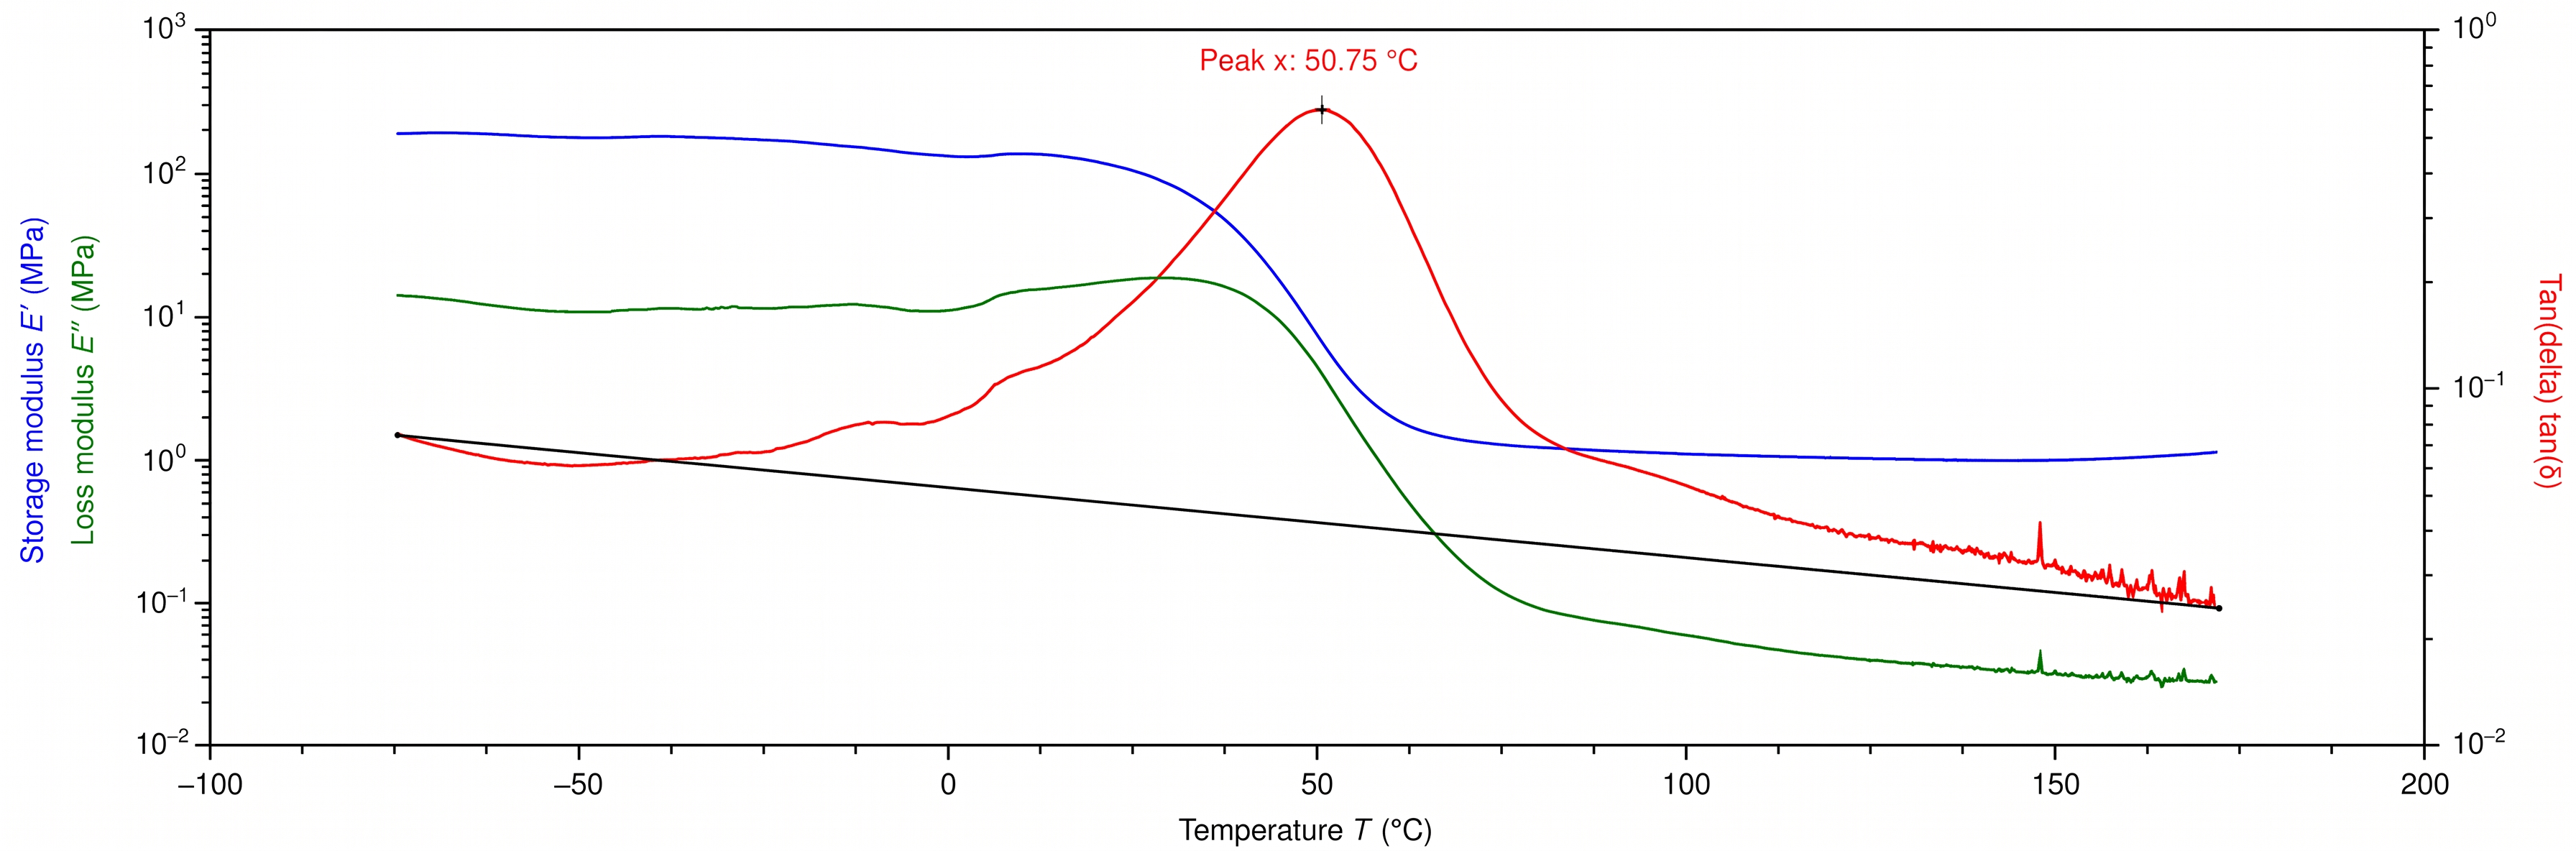
A dynamic mechanical analysis test was conducted on three neat, basalt-, and glass-reinforced samples for each resin system. During the heating process of the DMA test, the storage and loss modulus was recorded, and a tan(delta) was taken between those two values. An example of this plot can be seen in Figure 7 for neat cream specimen 1.
Figure 7.
Dynamic mechanical analysis (DMA) curve for neat cream specimen 1.
The glass transition temperature, Tg, was determined by the peak of the tan(delta) curve. The average Tg for each specimen type can be seen in Table 7. The plotted tan(delta) curve was determined by the ratio between the elastic, or storage modulus, over the viscous, or loss modulus, components of the material’s viscoelastic response. The peak tan(delta) occurs when the measured values of the storage and loss modulus are the closest, illustrating the point at which the samples are becoming more fluid and less plastic.
Table 7.
Average glass transition temperatures for each specimen type.
In most polymer matrix composite applications, it is common to see an increased Tg compared to the neat polymer [30]. This is especially seen when there is proper adhesion and wet-out of the fiber, leading to the creation of interfacial bonds at the interface [31]. This restricts the movement of the polymer chains resulting in an increased Tg [32,33,34,35]. However, it can be seen in Table 7 that there is a decrease in the Tg for the composite samples compared to the neat samples. One possible explanation for the drop in Tg for the composite samples would be the fiber and matrix interaction. With the basalt and glass fibers not being specifically sized with the polyurea resin systems used in this study, the fiber–matrix bonding and adhesion may not be optimal. This creates weaker interfacial bonds between the fiber and the matrix, leading to an earlier viscoelastic response, creating a wider tan(delta) curve for the composite specimens [36,37]. In conjunction with that, it has been found that polymer matrix composites with a low fiber content exhibit a reduced Tg. This is because the fiber acts as a plasticizer with the small amplitude of movements applied during the DMA test [35].
3.6. Tensile Strength
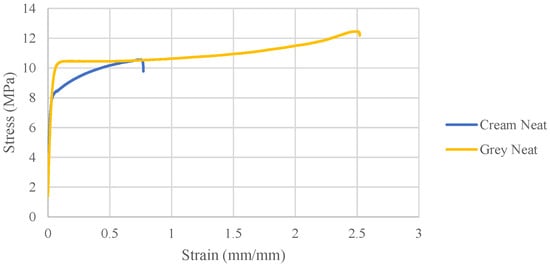
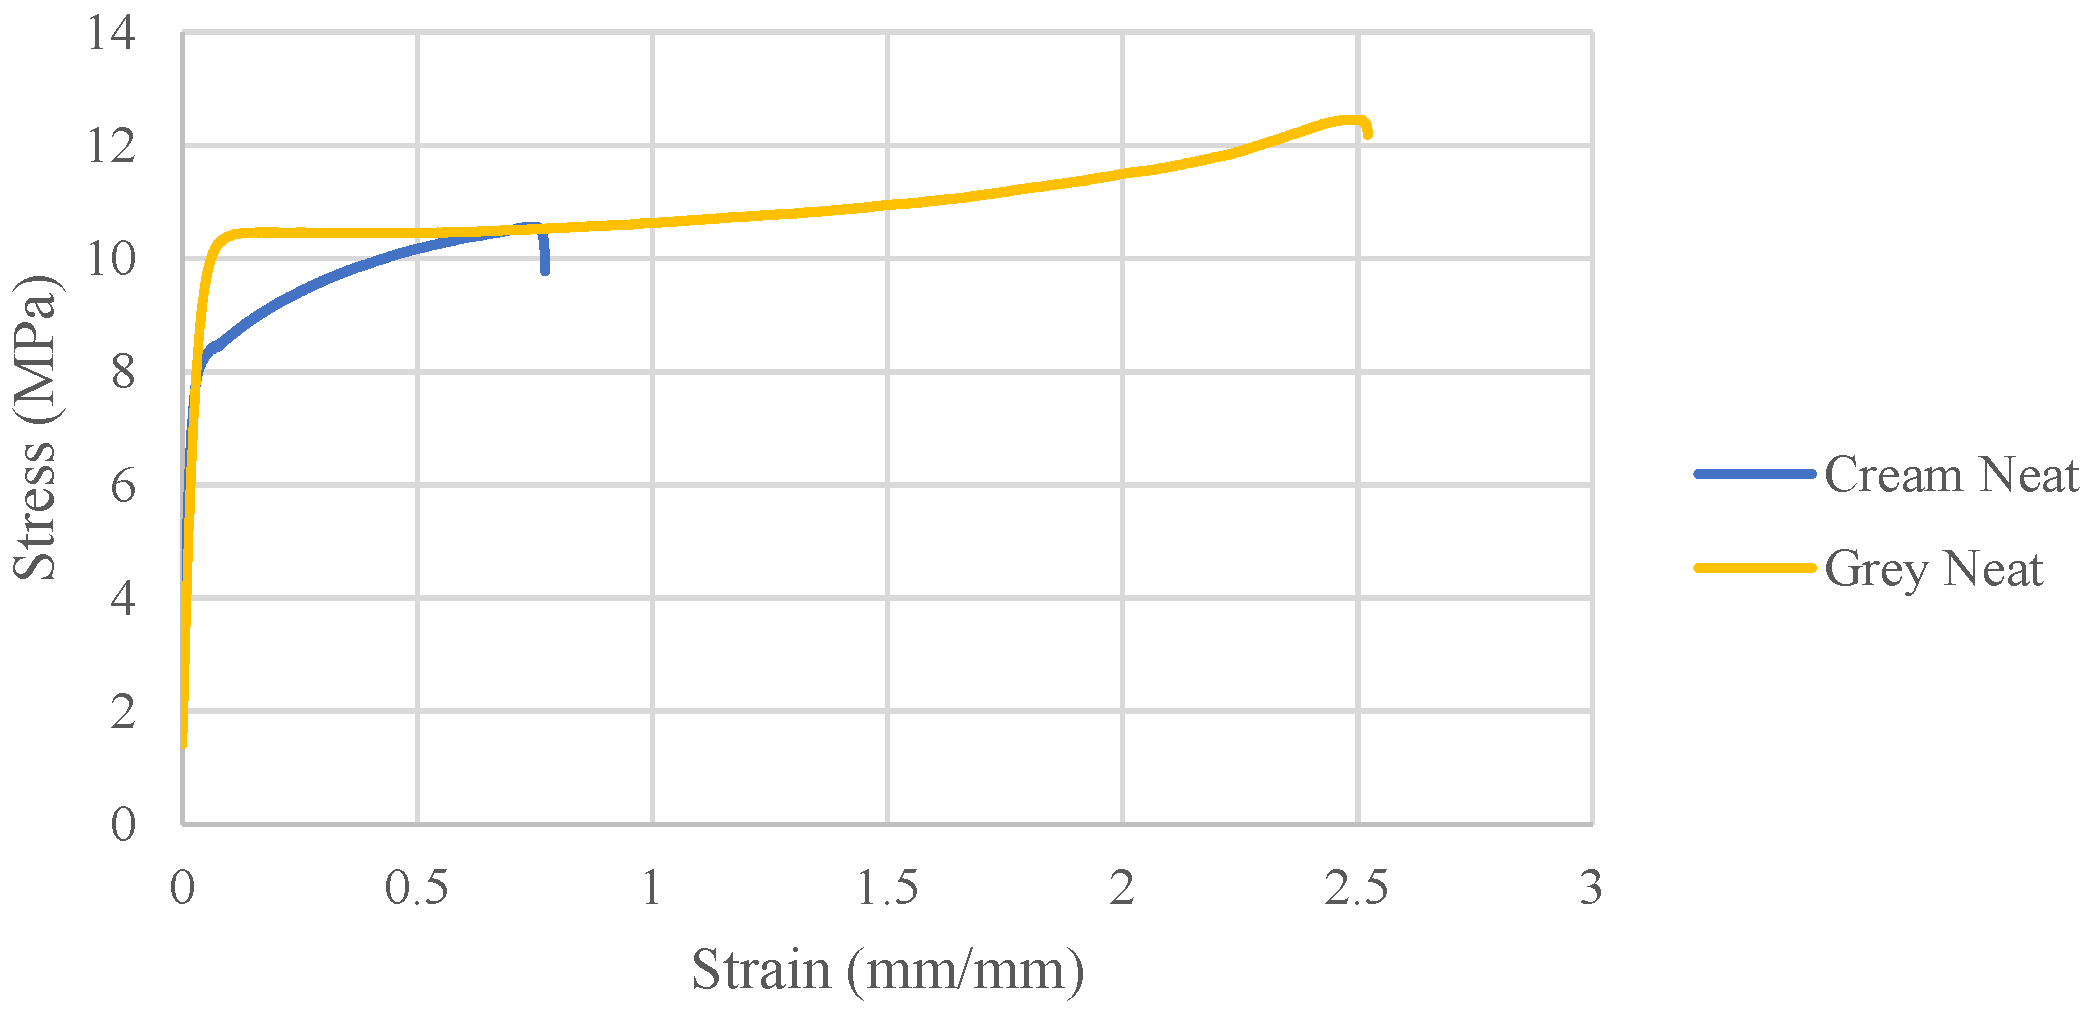
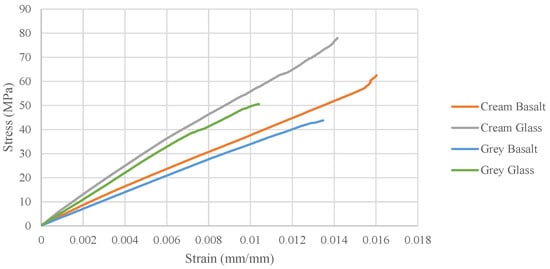
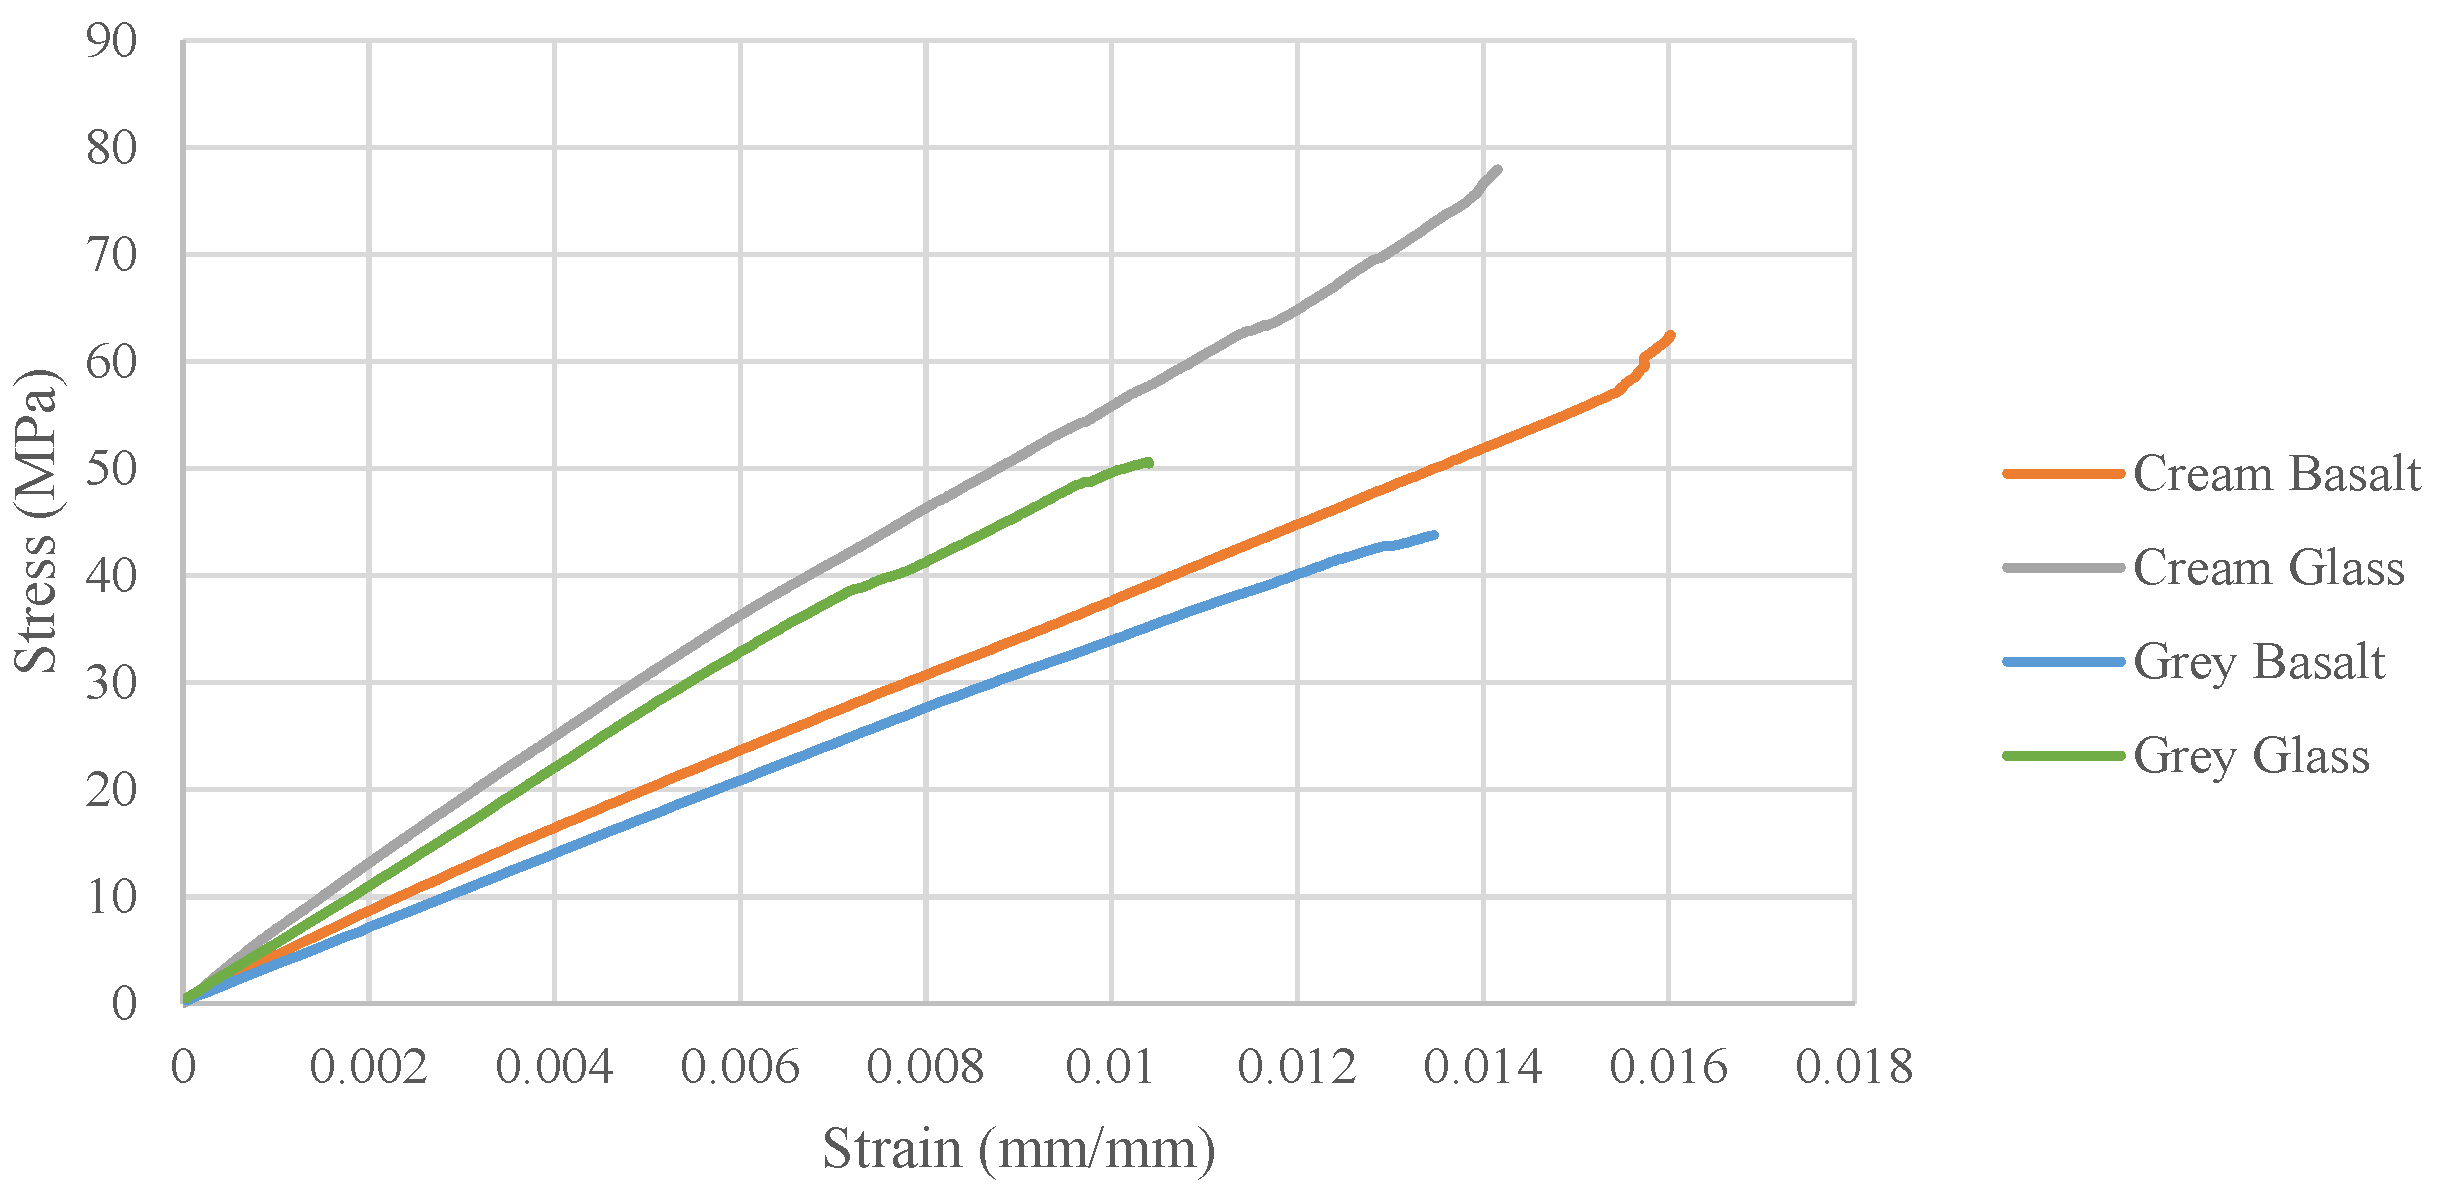
Tensile testing was conducted to determine the average elastic modulus, ultimate tensile strength, and strain at failure. Representative stress–strain curves can be seen in Figure 8 and Figure 9 for the neat and composite samples, respectively.
Figure 8.
Representative tensile stress–strain curves for the neat specimens.
Figure 9.
Representative tensile stress–strain curves for the composite specimens.
Observing the representative tensile stress–strain curves, it can be seen that the neat resin samples exhibited elastic tensile properties, and the addition of the basalt and glass fibers greatly increased the material’s strength and stiffness. Furthermore, it is seen in Table 8 that the average strain at failure percentage decreased nearly 100% for the composite samples compared to the neat samples.
Table 8.
Average tensile strain at failure for each specimen type.
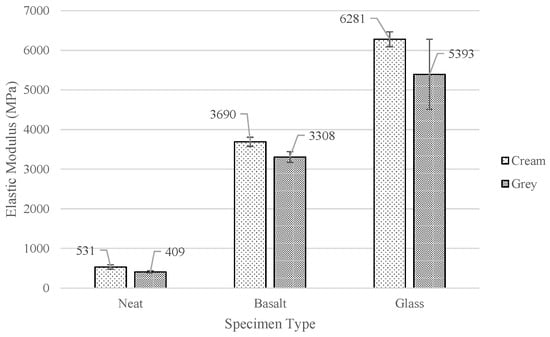
These calculated averages can be seen in Figure 10. For each resin type, the average elastic modulus increased significantly with fiber reinforcement compared to the neat resin samples. The basalt samples saw an increase in the elastic modulus of 595% and 709% for the cream and grey resin systems. Furthermore, the cream and grey glass samples exhibited even larger strength increases of 1083% and 1219%, respectively.
Figure 10.
Average elastic modulus.
When comparing the samples with the same reinforcement, but different resin systems, the cream samples exhibited a higher average elastic modulus than the grey samples. However, the single-factor ANOVA results in Section 3.8 revealed that the difference in the elastic modulus for the cream glass and grey glass samples was not significant.
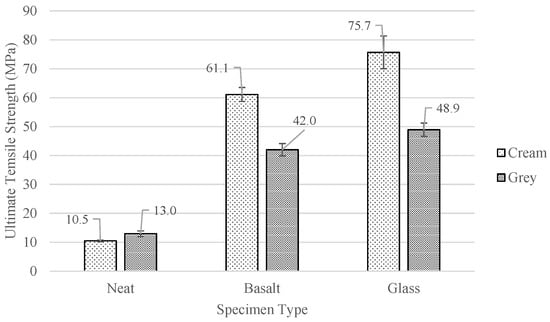
The average ultimate tensile strength for each specimen type is depicted in the bar chart presented in Figure 11. As was the case for the average elastic modulus, the average ultimate tensile strength increased from the neat to the basalt and then to the glass samples. The cream composite samples’ average ultimate tensile strength increased by 482% for the basalt and 621% for the glass from the neat specimen’s average. Additionally, the grey basalt and grey glass samples average ultimate tensile strength increased by 223% and 276%, respectively, compared to the grey neat specimens. Similar to what was observed with the elastic modulus, the cream composite specimens exhibited a higher average ultimate tensile strength than the grey composite specimens with the same fiber type. Conversely, the grey neat samples exhibited an average ultimate tensile strength of 13.0 MPa, which was higher than the 10.5 MPa exhibited by the cream neat samples.
Figure 11.
Average ultimate tensile strength.
A side-by-side comparison of each specimen type’s average elastic modulus and ultimate tensile strength is shown in Table 9. When comparing the average elastic modulus and ultimate strength between the two different reinforcing fiber types for each resin, it can be seen that the results are consistent with the fiber volume percentages. For both resin systems, the fiber volume percentage for the glass samples was more than two times that of the basalt samples, thus helping to explain the higher average elastic modulus and ultimate tensile strength that the glass samples exhibited in the tensile test.
Table 9.
Tensile properties’ comparison.
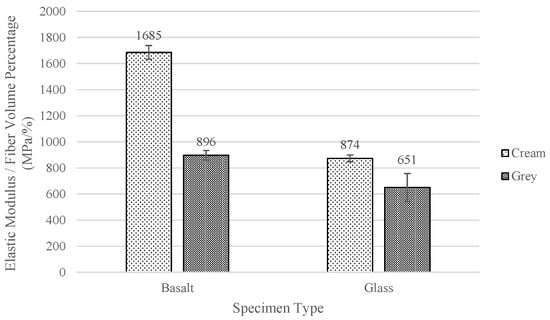
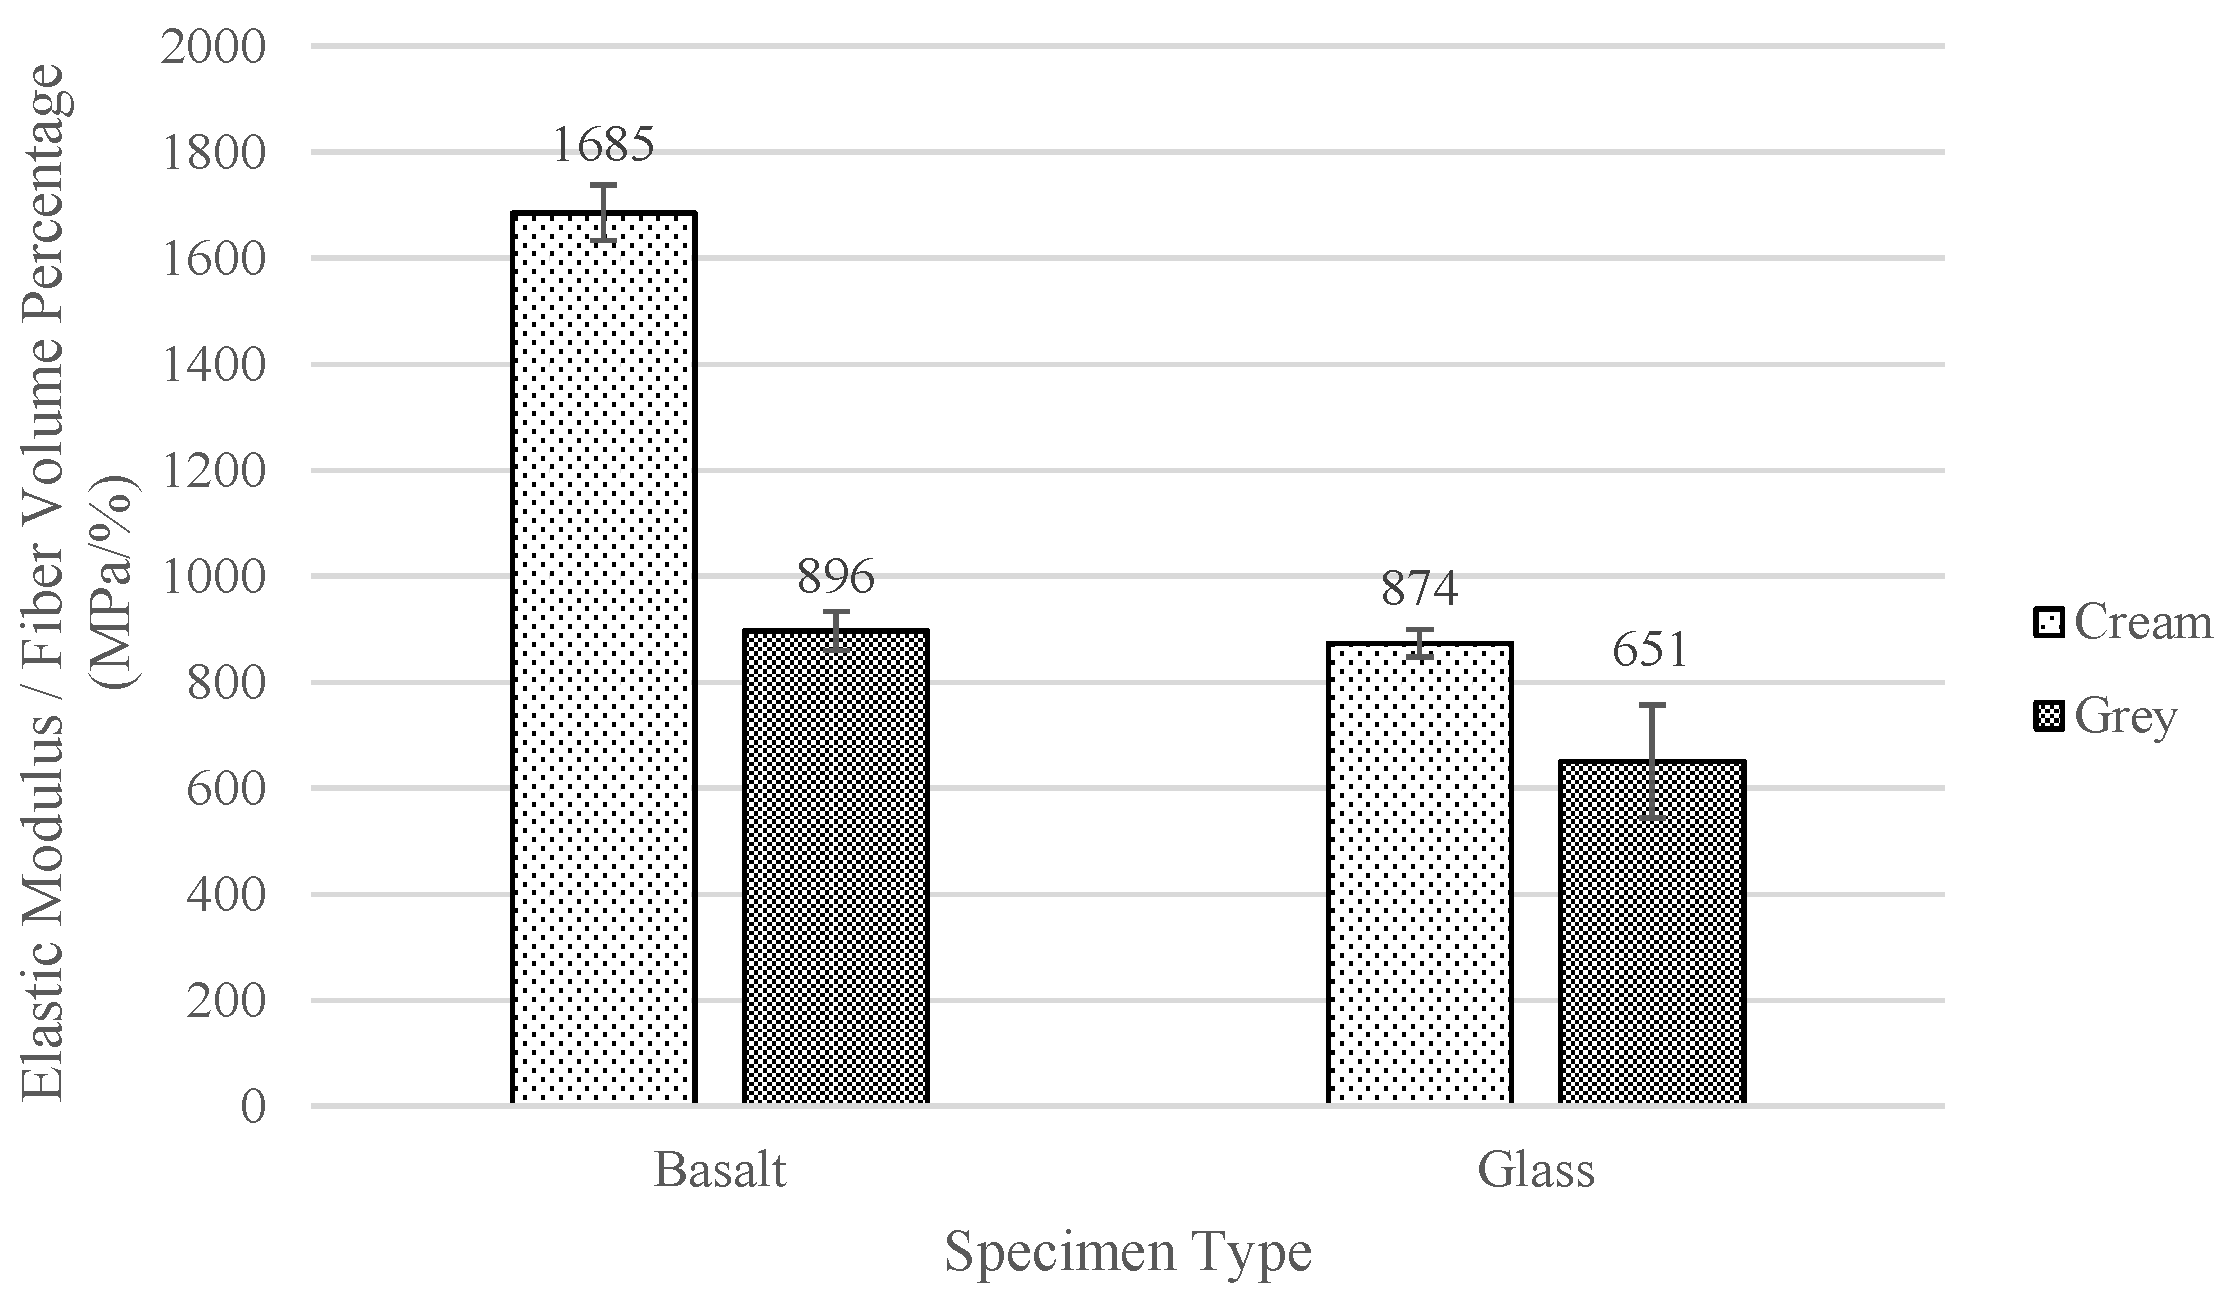
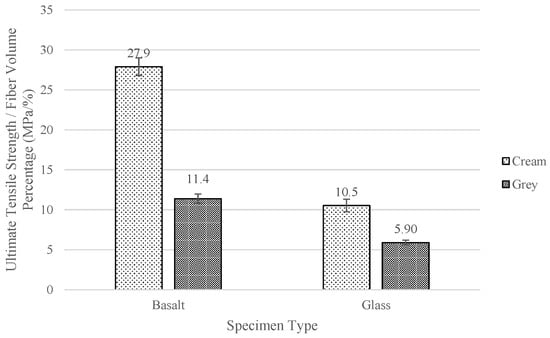
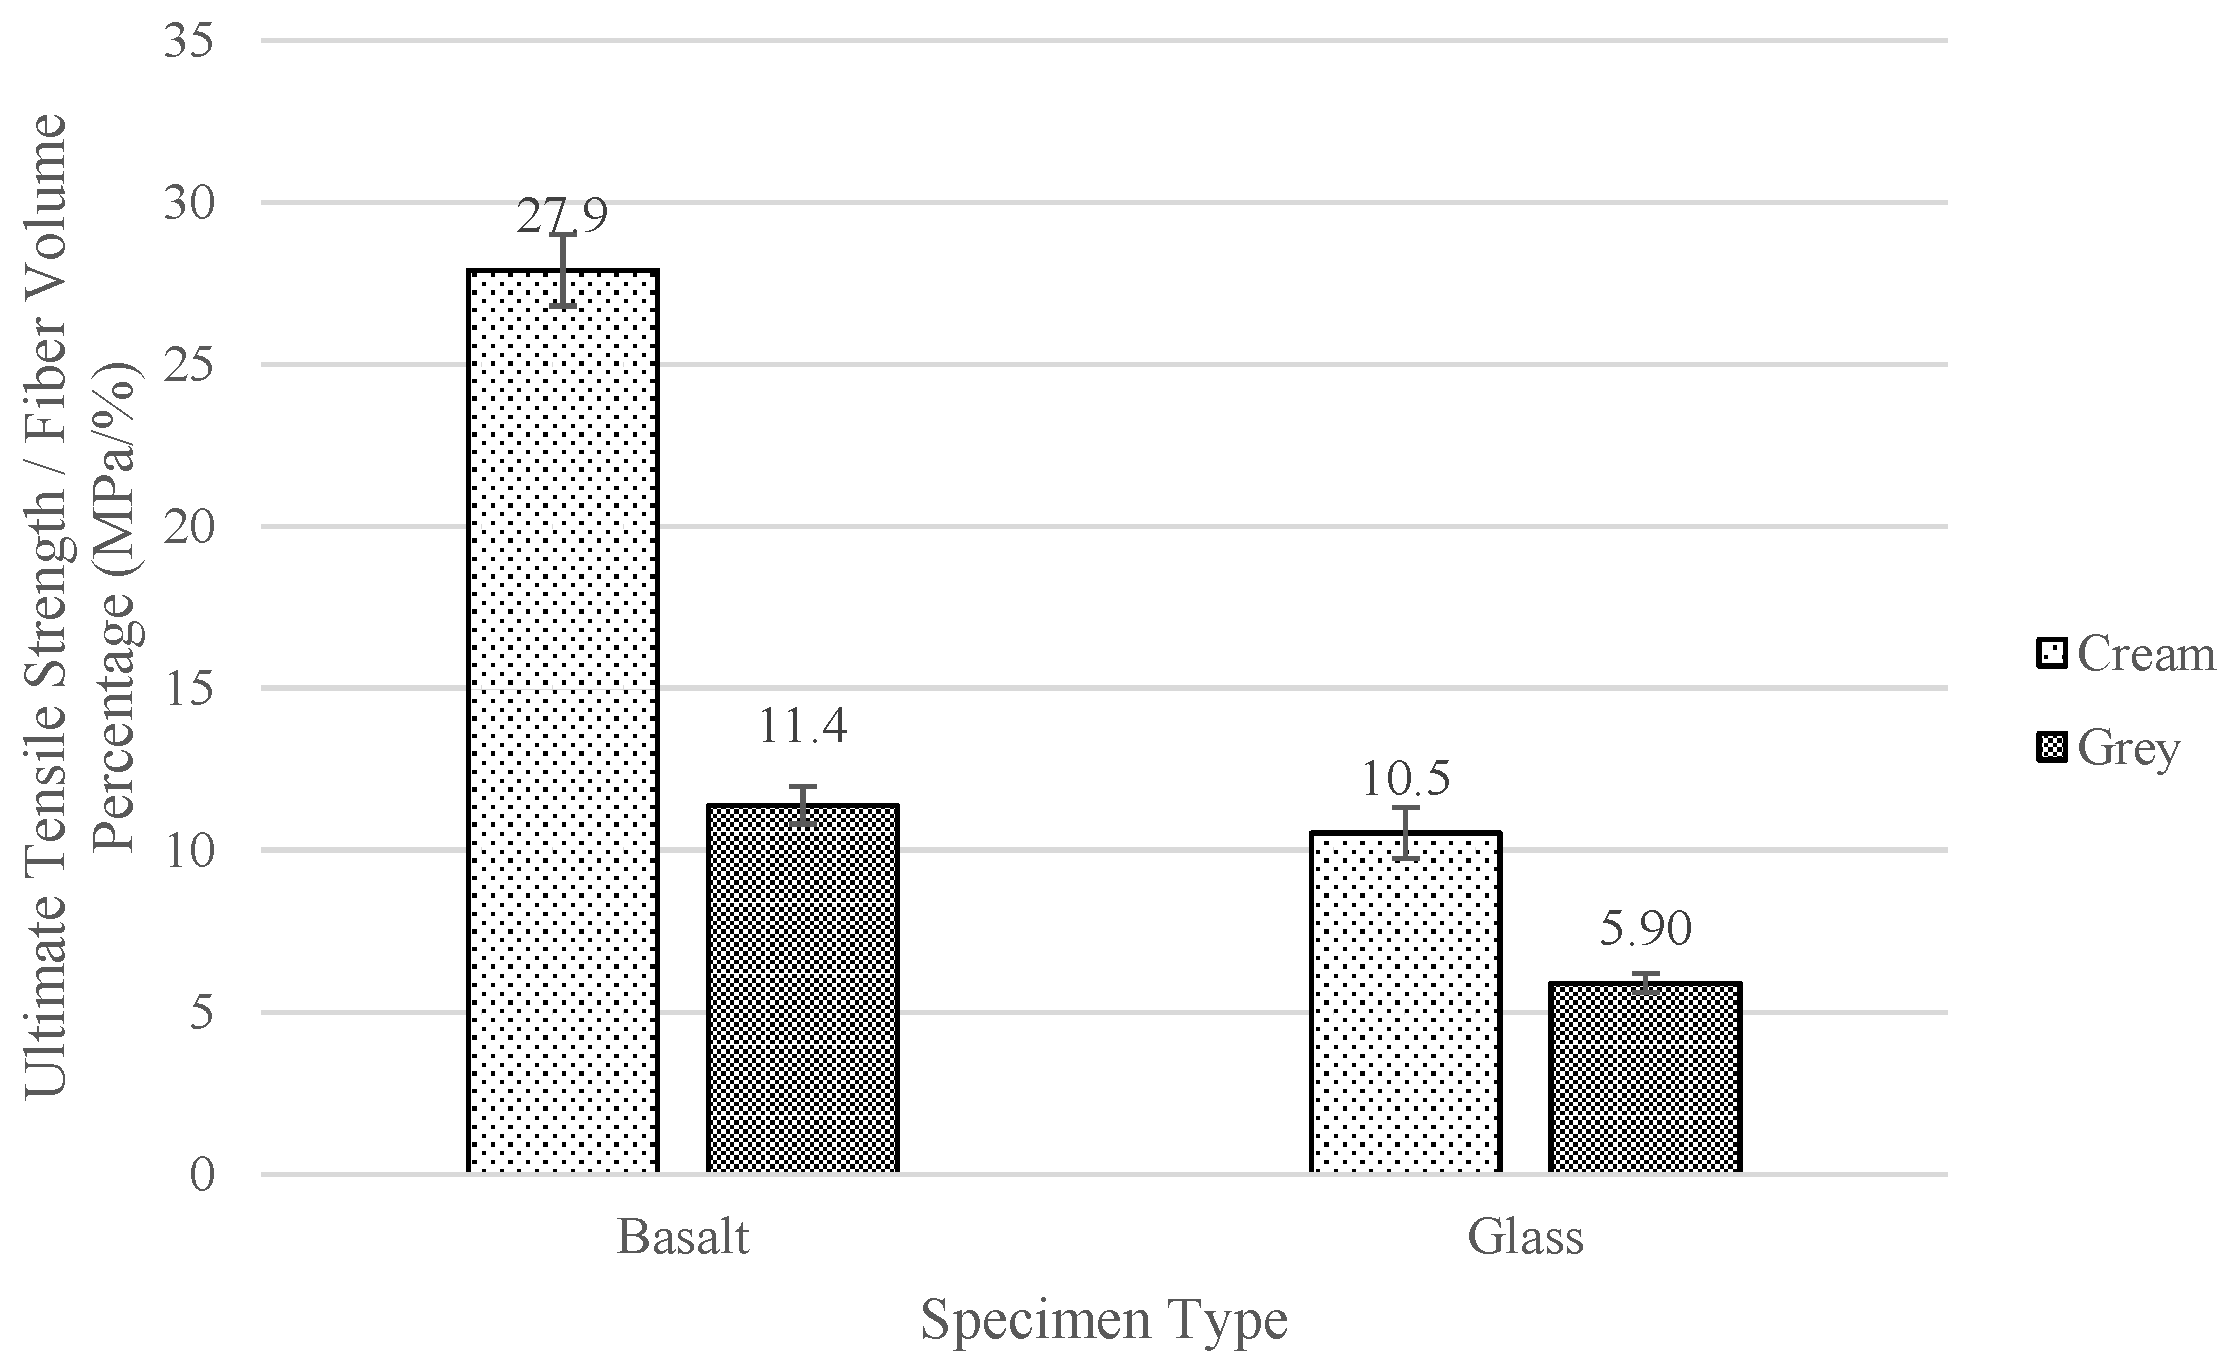
Conversely, when comparing the average elastic modulus and ultimate strength between the two resin systems for each reinforcing fiber, the results were not consistent with the fiber volume percentages. The cream basalt and glass samples’ average elastic modulus and ultimate tensile strength were greater than their grey resin counterparts, despite having a lower fiber volume percentage and a higher void percentage. This is especially evident when observing the normalized average elastic modulus and ultimate tensile strength in Figure 12 and Figure 13. The normalized values were calculated by dividing the average value for each property type by the corresponding average fiber volume percentage of the tested composite.
Figure 12.
Normalized average elastic modulus of composite specimens.
Figure 13.
Normalized average ultimate tensile strength of composite specimens.
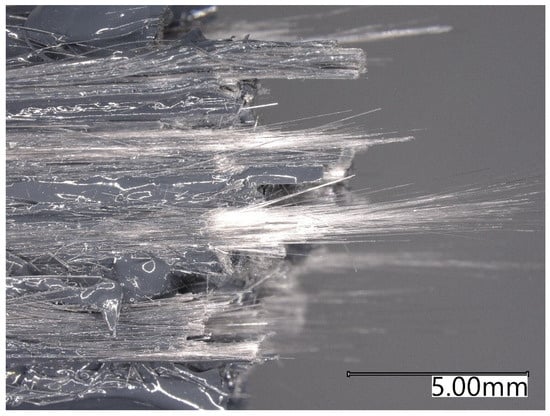
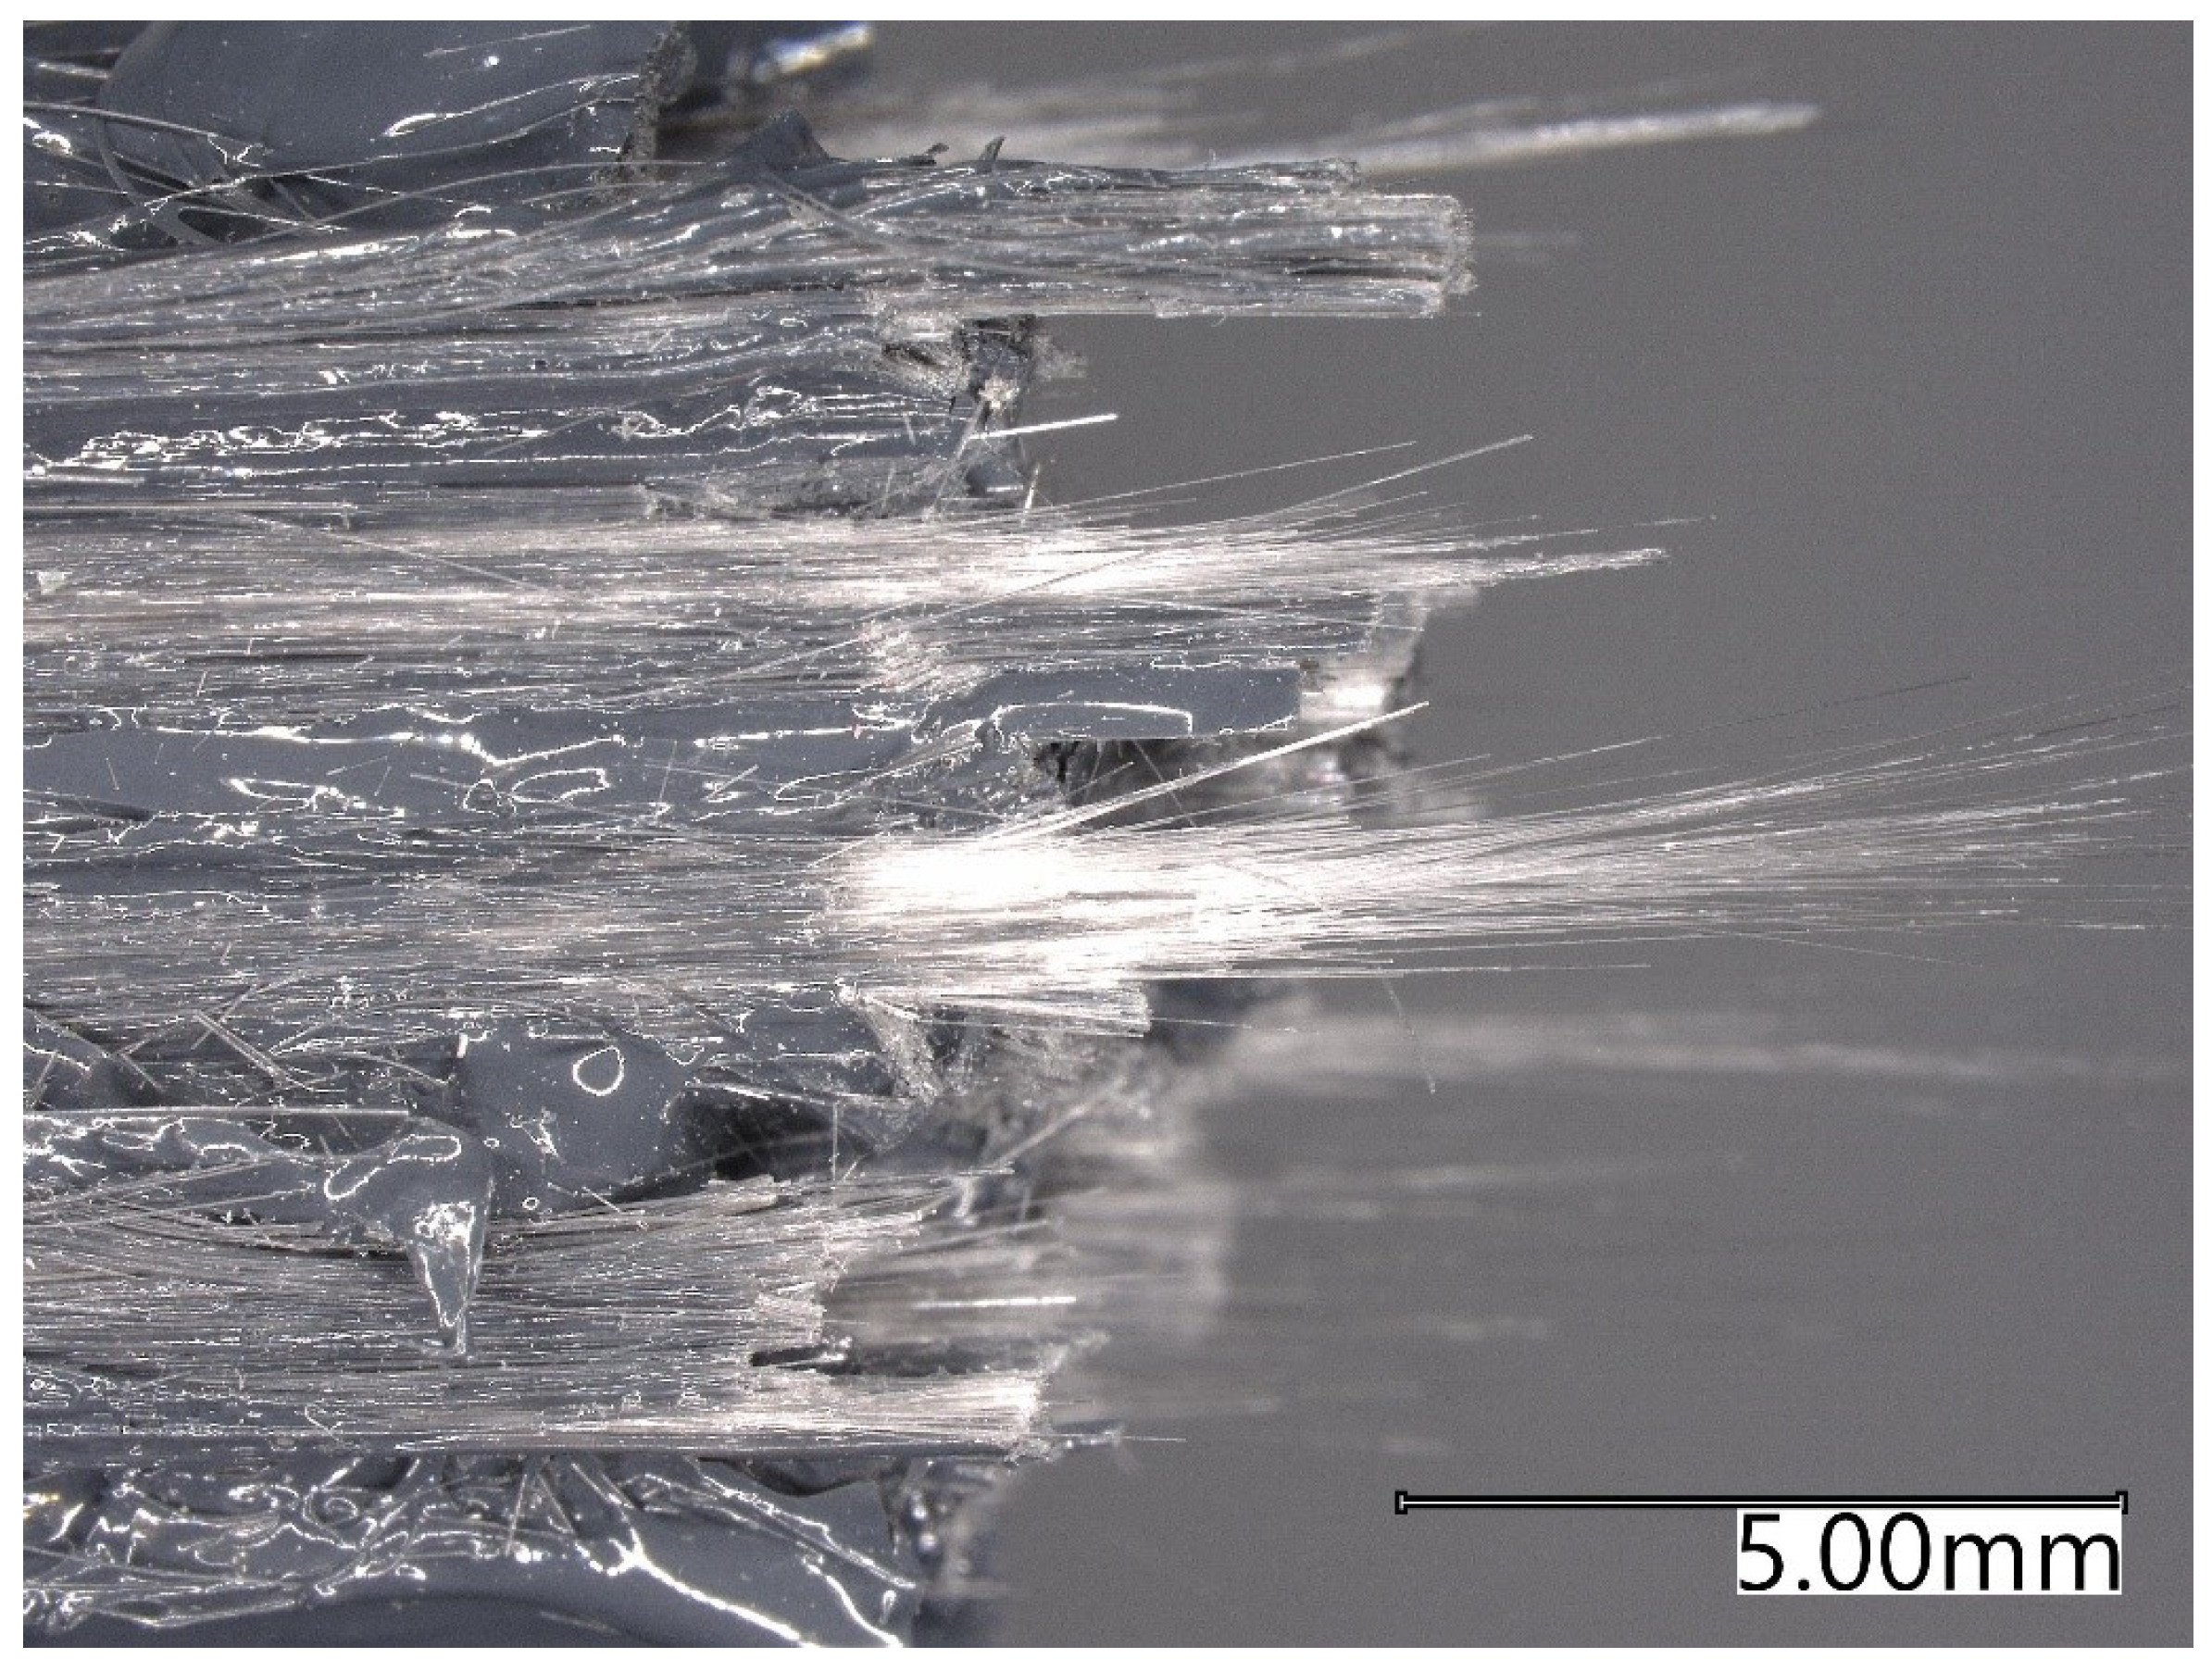
From these figures, it can be seen that the cream composite samples were able to strengthen the sample more efficiently than the grey composite samples. This can be attributed to the printability of the grey resin system. Due to the faster gel time and greater inconsistency in the printability of the grey resin, it was seen in the failure surfaces of the grey composite samples that there was a higher presence of dry fiber when compared to the cream composite samples. This led to more fiber pullout at failure, resulting in a decreased average ultimate tensile strength. The presence of dry fiber can be seen in Figure 14 when observing the tensile failure of a grey glass specimen.
Figure 14.
Dry fiber present in grey glass samples.
3.7. Flexural Strength
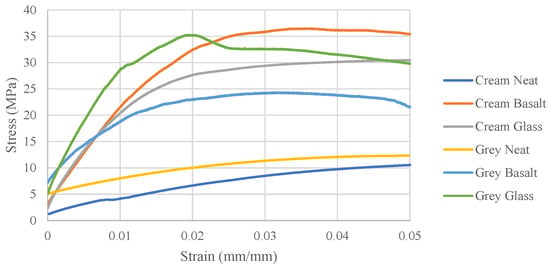
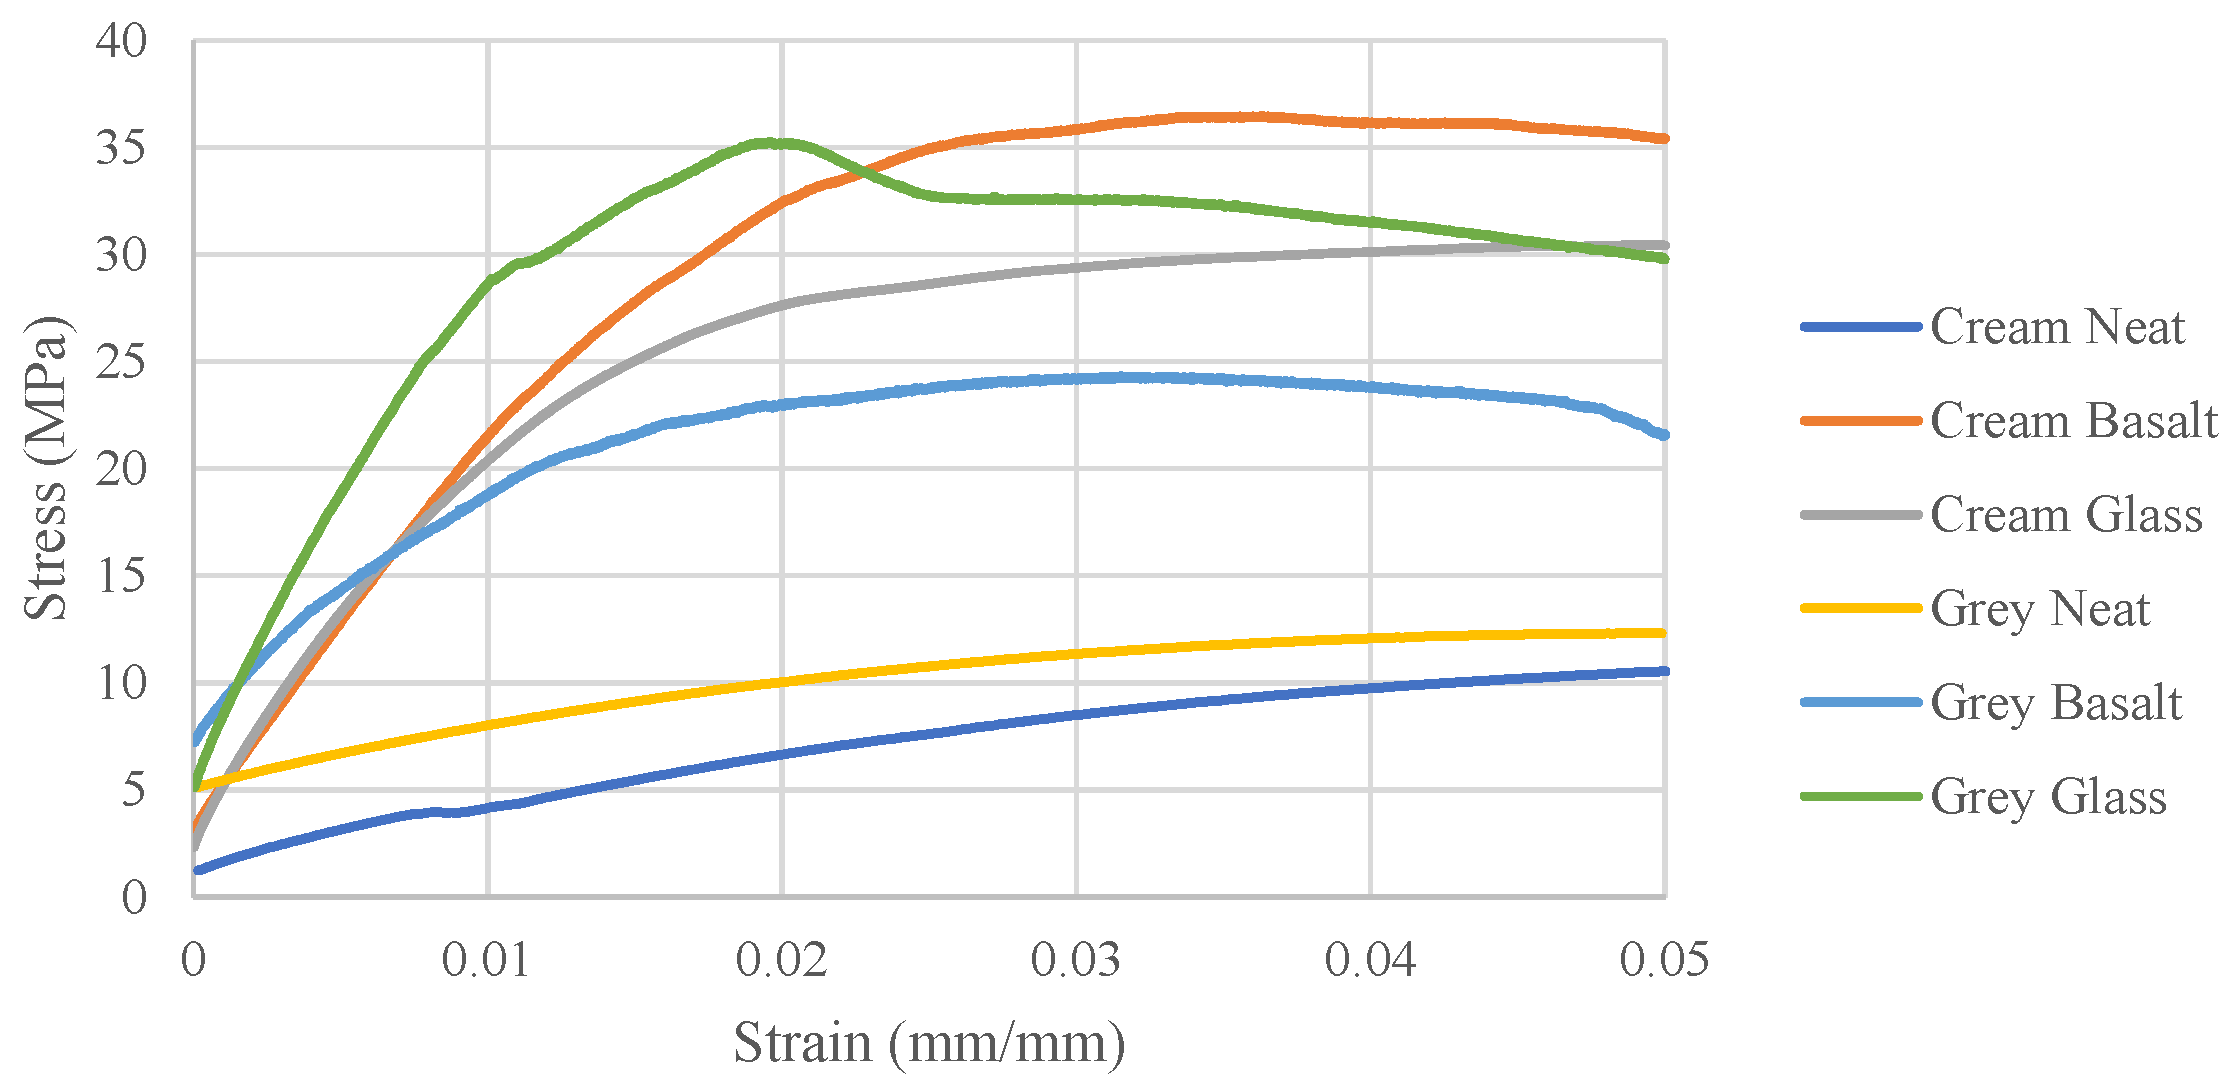
The results of the three-point bend test were used to determine the average flexural modulus and ultimate flexural strength for each sample type. Figure 15 shows a representative stress–strain curve of each sample type. Similar to the representative tensile stress–strain curves, the representative flexural stress–strain curves illustrate the improved flexural performance when the cream and grey resin systems are reinforced with fiber.
Figure 15.
Representative flexural stress–strain curves.
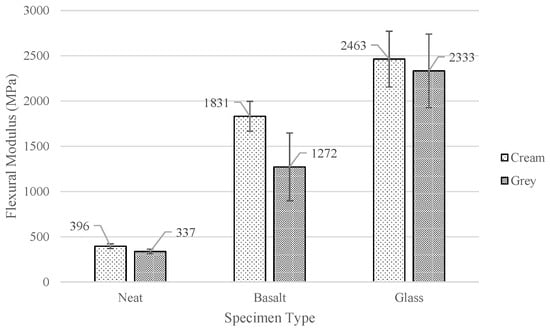
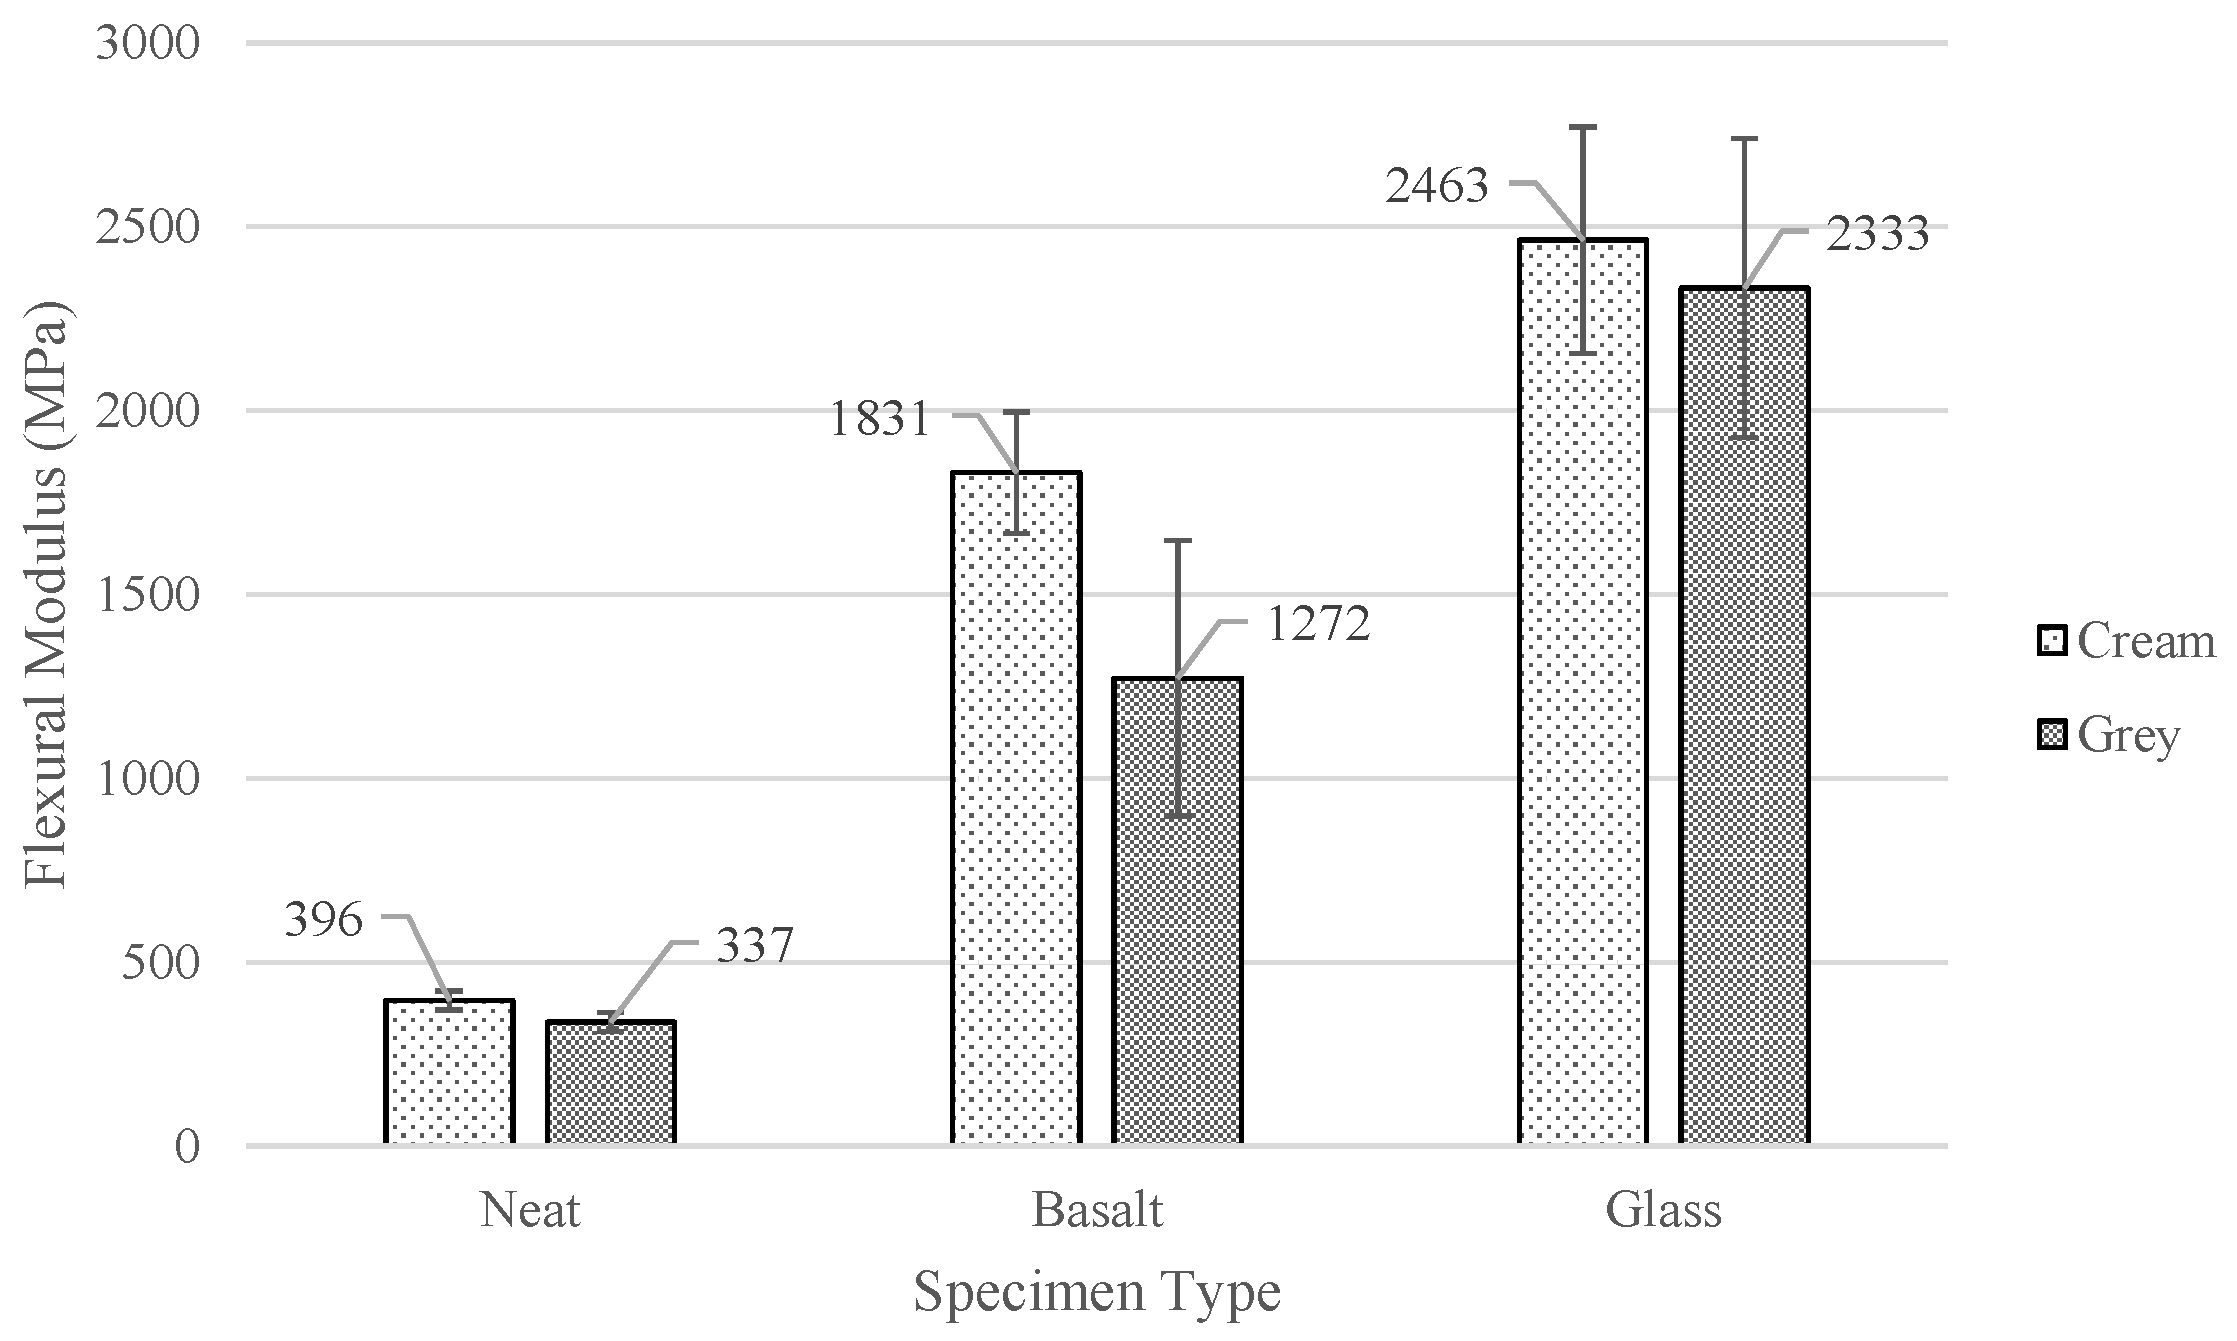
The average flexural modulus for each sample type was determined and is represented in Figure 16. Consistent to what was observed with the elastic modulus, the average flexural modulus exhibited a significant increase from the neat to the basalt, and then to the glass samples produced with the same resin system. The cream basalt and cream glass samples produced average ultimate flexural-strength improvements of 362% and 522% compared to the neat samples. For the grey composites, an increase of 227% and 592% in the average flexural modulus was observed for the basalt and glass specimens, respectively, compared to the grey neat specimens’ average. On average, when comparing the samples produced with varying resin systems and the same reinforcement, the cream samples exhibited a higher flexural modulus. This was also true for the glass samples, as the cream samples exhibited an average flexural modulus of 2463 MPa compared to the 2333 MPa of the grey glass samples.
Figure 16.
Average flexural modulus.
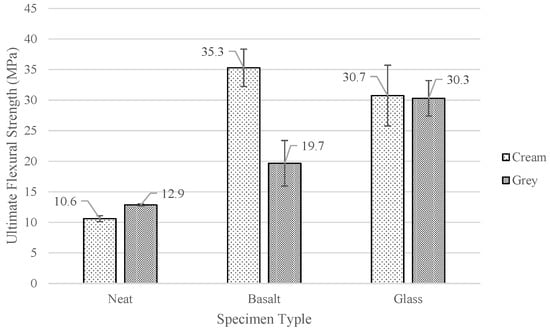
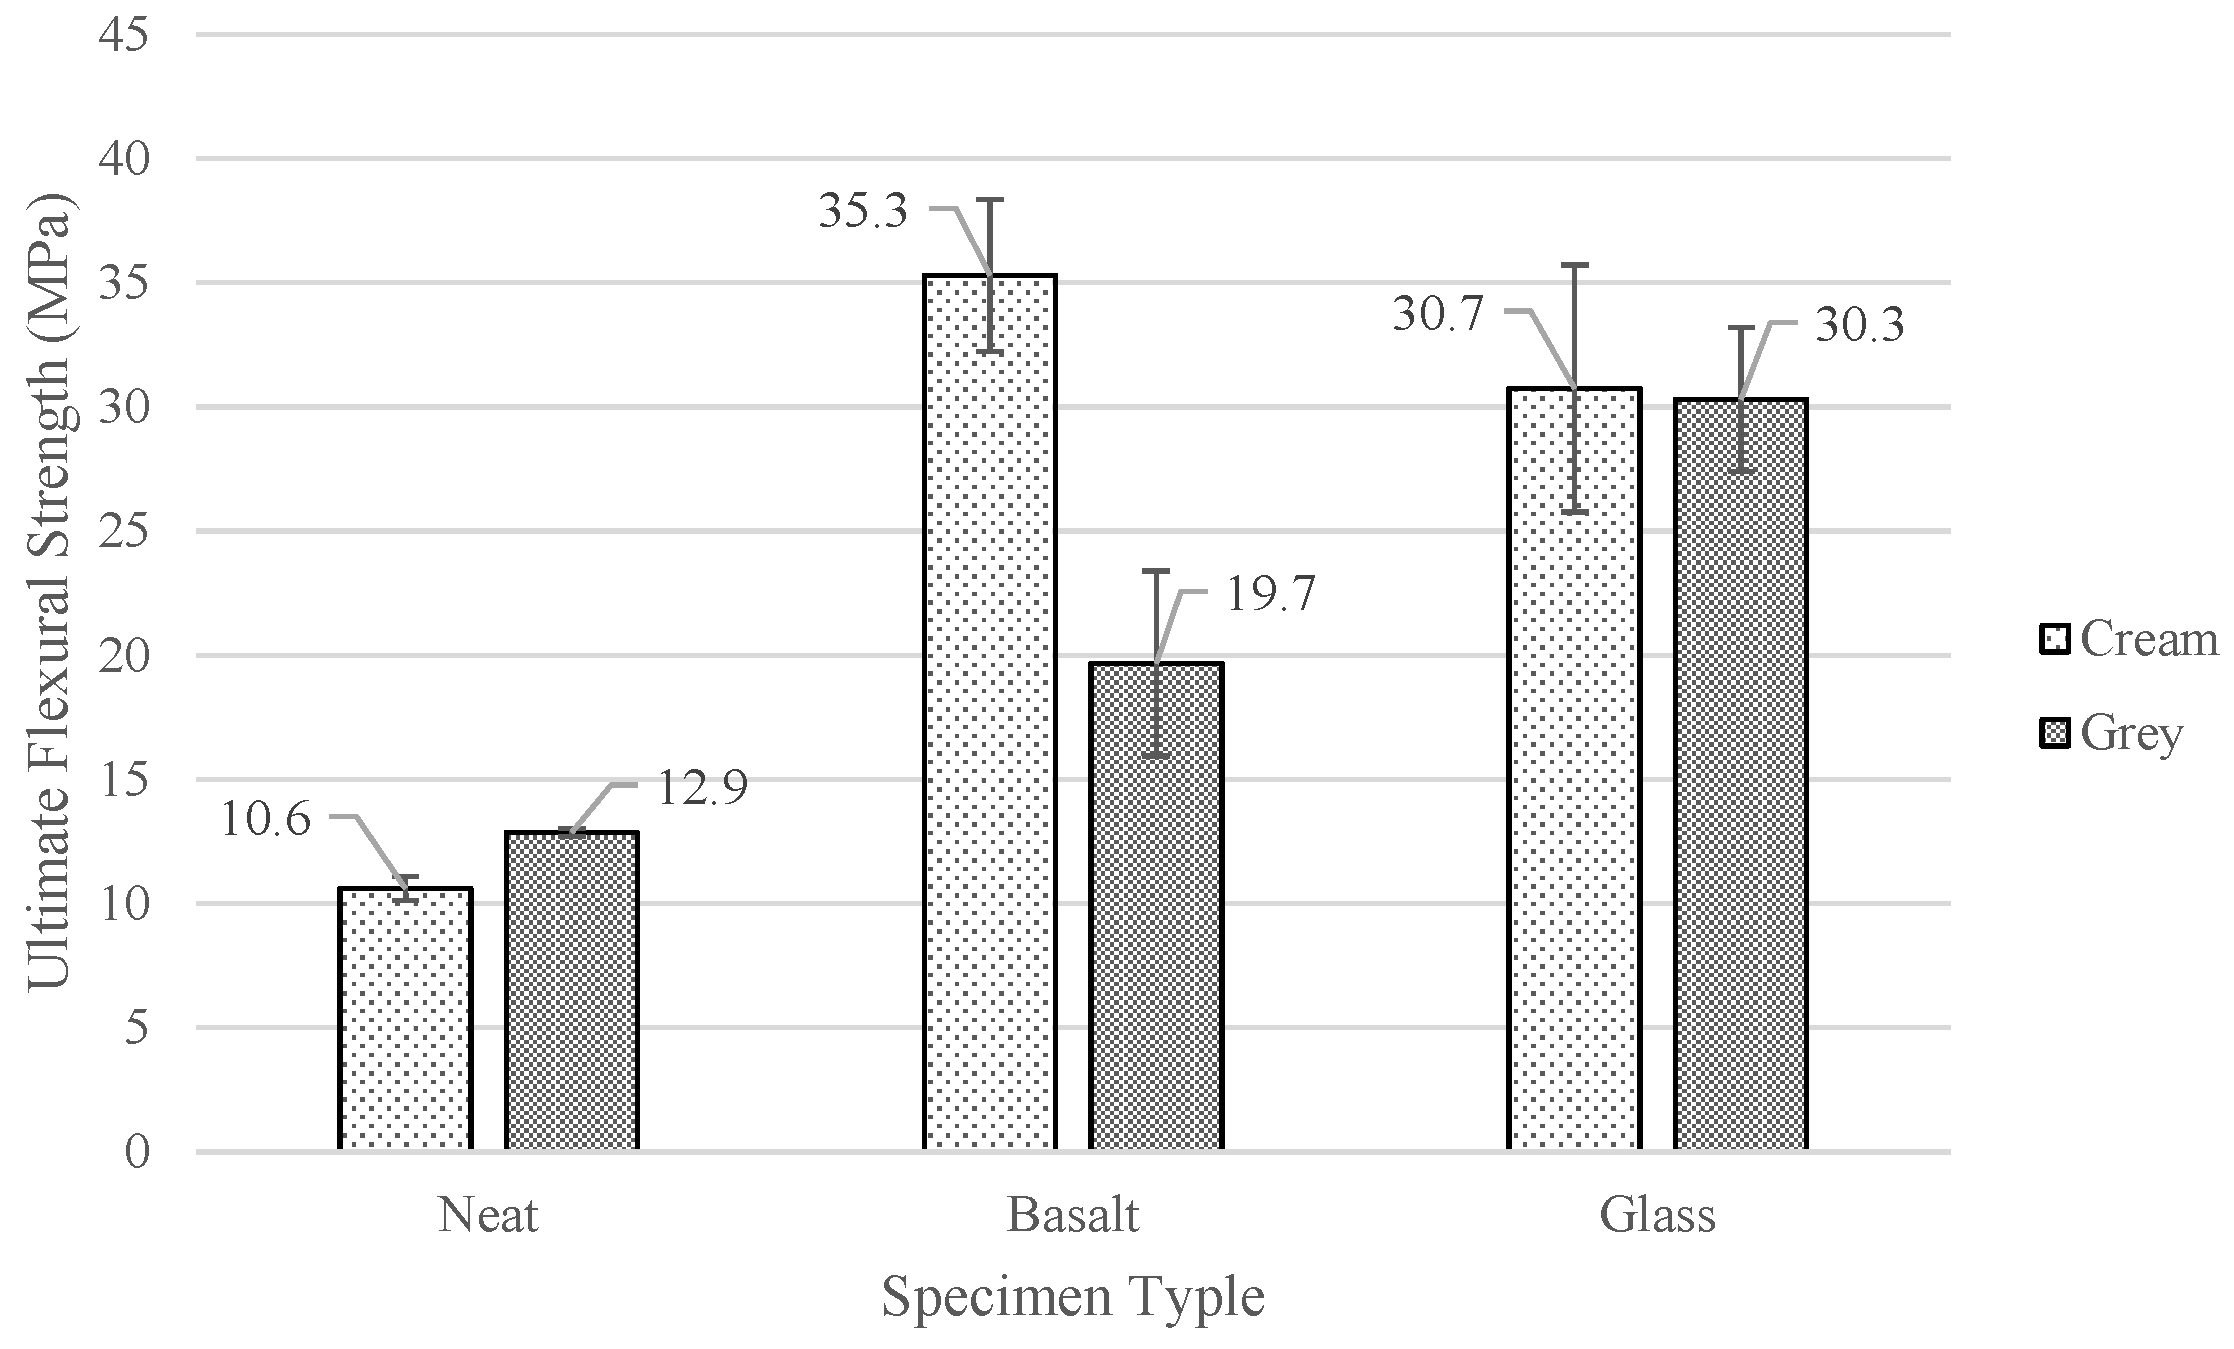
In Figure 17, the average ultimate flexural strength for each sample type is shown. As previously mentioned, the presence of the basalt and glass reinforcing fibers greatly increased the flexural strength of the specimens. The grey basalt and grey glass samples exhibited an average flexural strength increase of 52.7% and 135% from the neat samples. This follows the trend observed with the average flexural modulus, where the ultimate flexural strength significantly increased from the neat to the basalt samples and then again between the basalt and glass samples. The cream composite samples also saw a significant average flexural strength increase of 233% and 190% for the basalt and glass samples compared to the neat samples.
Figure 17.
Average ultimate flexural strength.
When comparing the average ultimate flexural strength between the samples of different resin systems and the same reinforcement, it is observed that the grey neat samples produced a higher ultimate strength than the cream samples. Conversely, for the cream basalt samples, the average ultimate flexural strength was significantly higher than that of the grey basalt samples. The glass specimens showed no statistical difference between the cream and grey resin systems, having average ultimate flexural strengths of 30.7 MPa and 30.3 MPa, respectively. A side-by-side comparison of the specimen’s average flexural modulus and average ultimate flexural strength, along with the percentage increase in the composite specimens, when compared to the neat samples, can be seen in Table 10.
Table 10.
Flexural properties comparison.
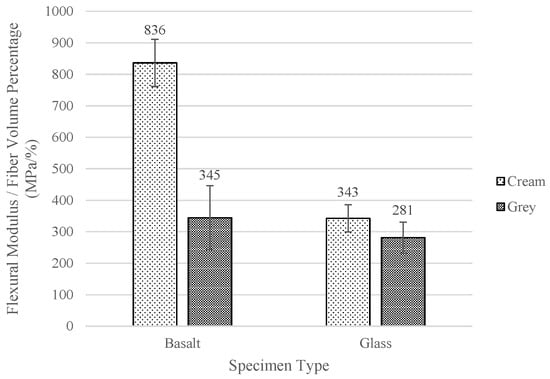
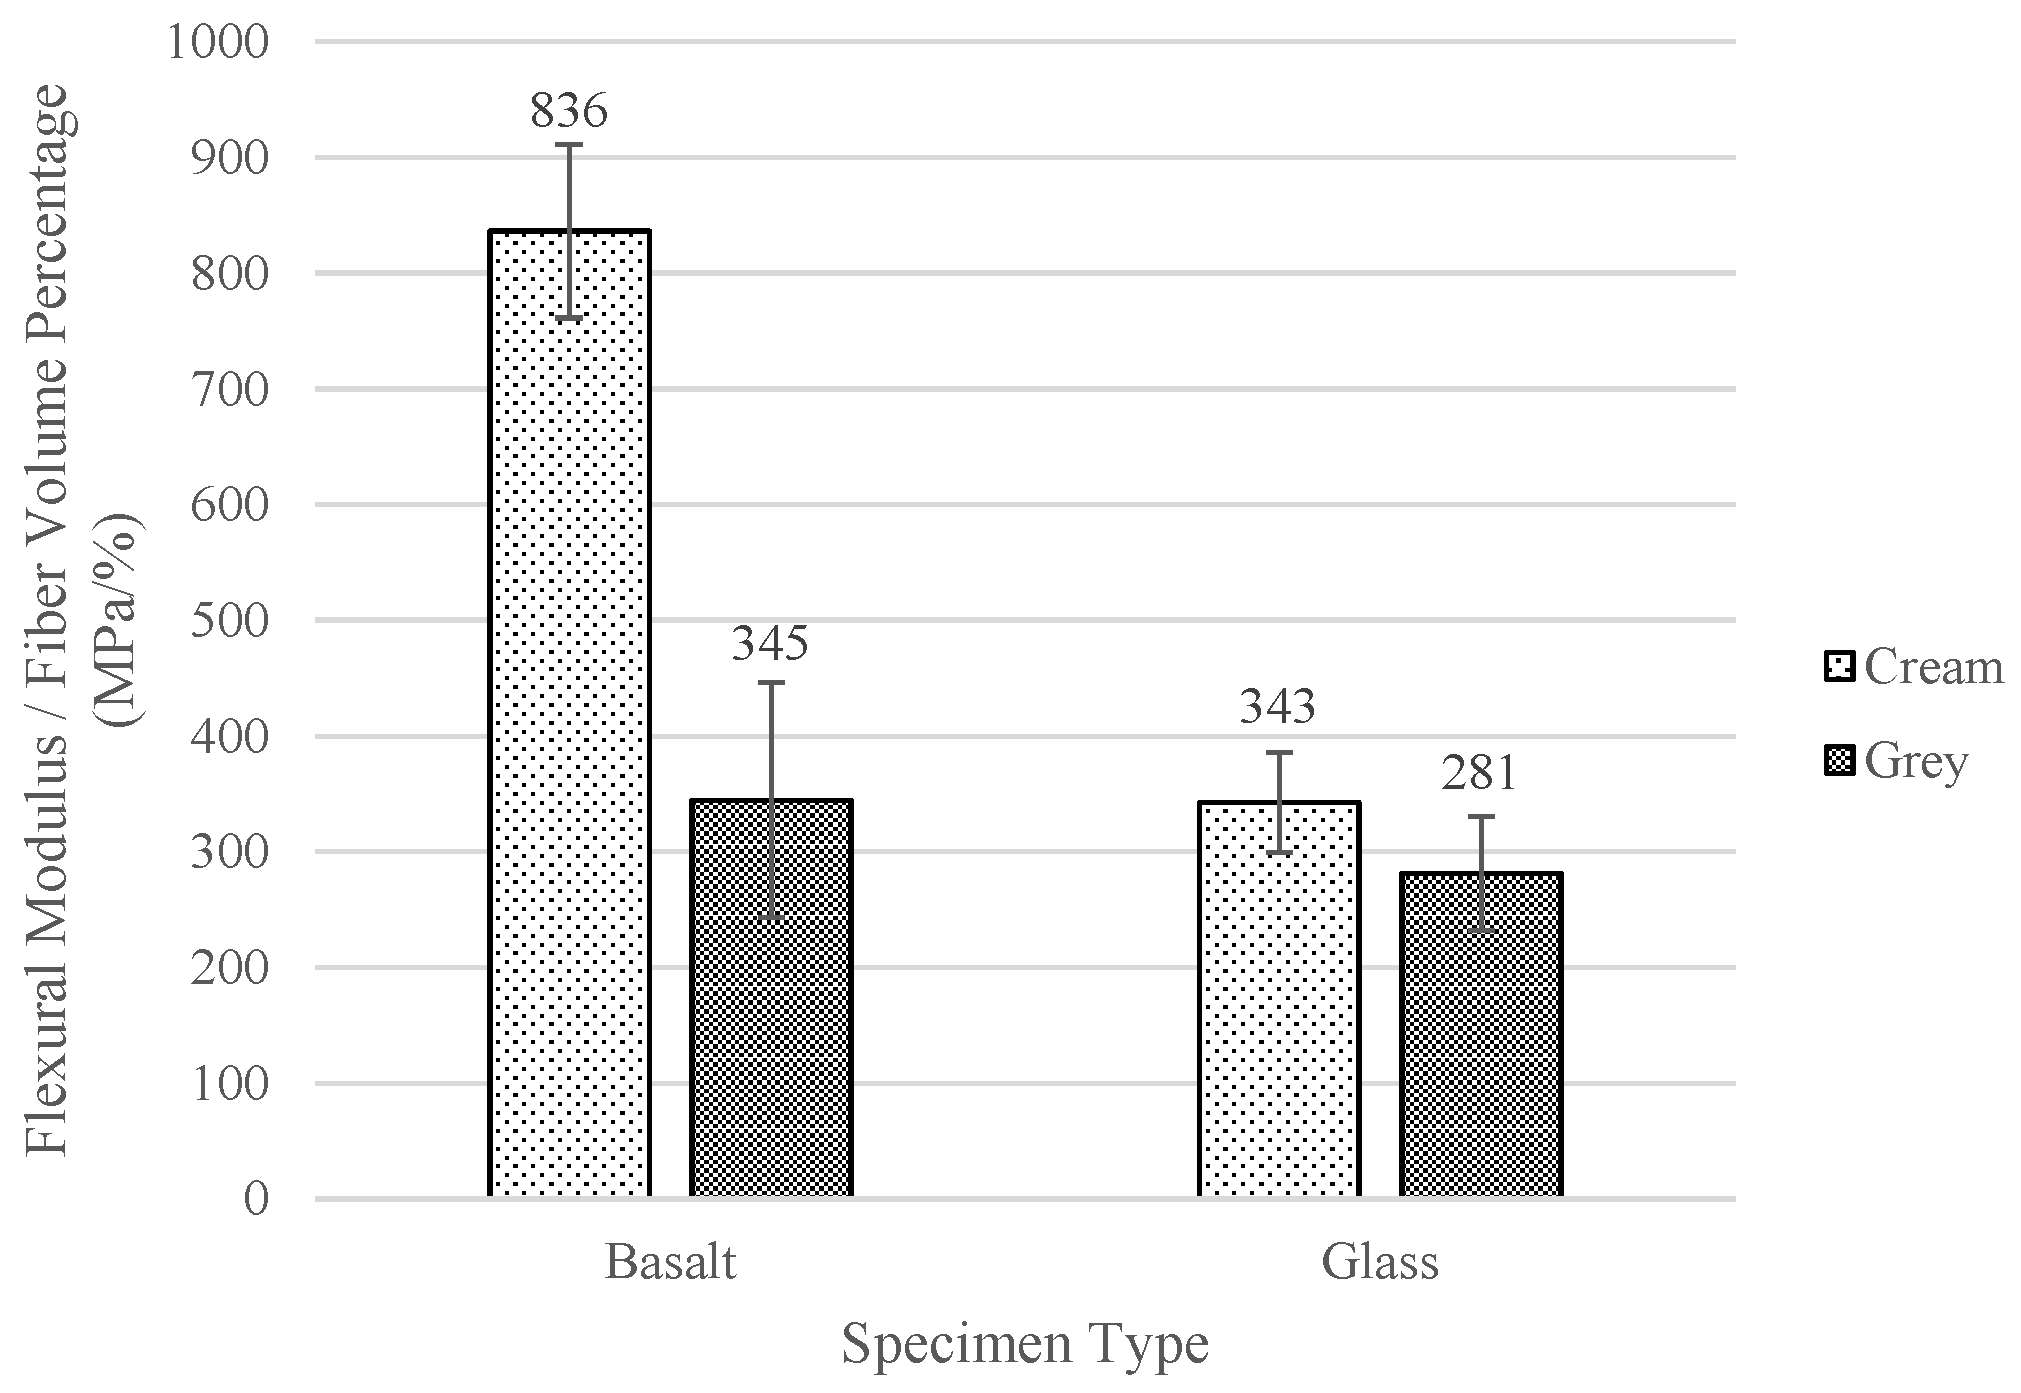
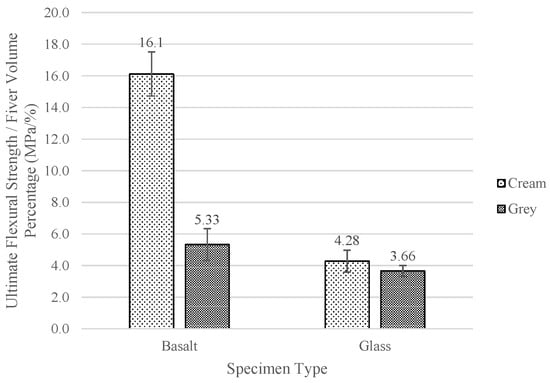
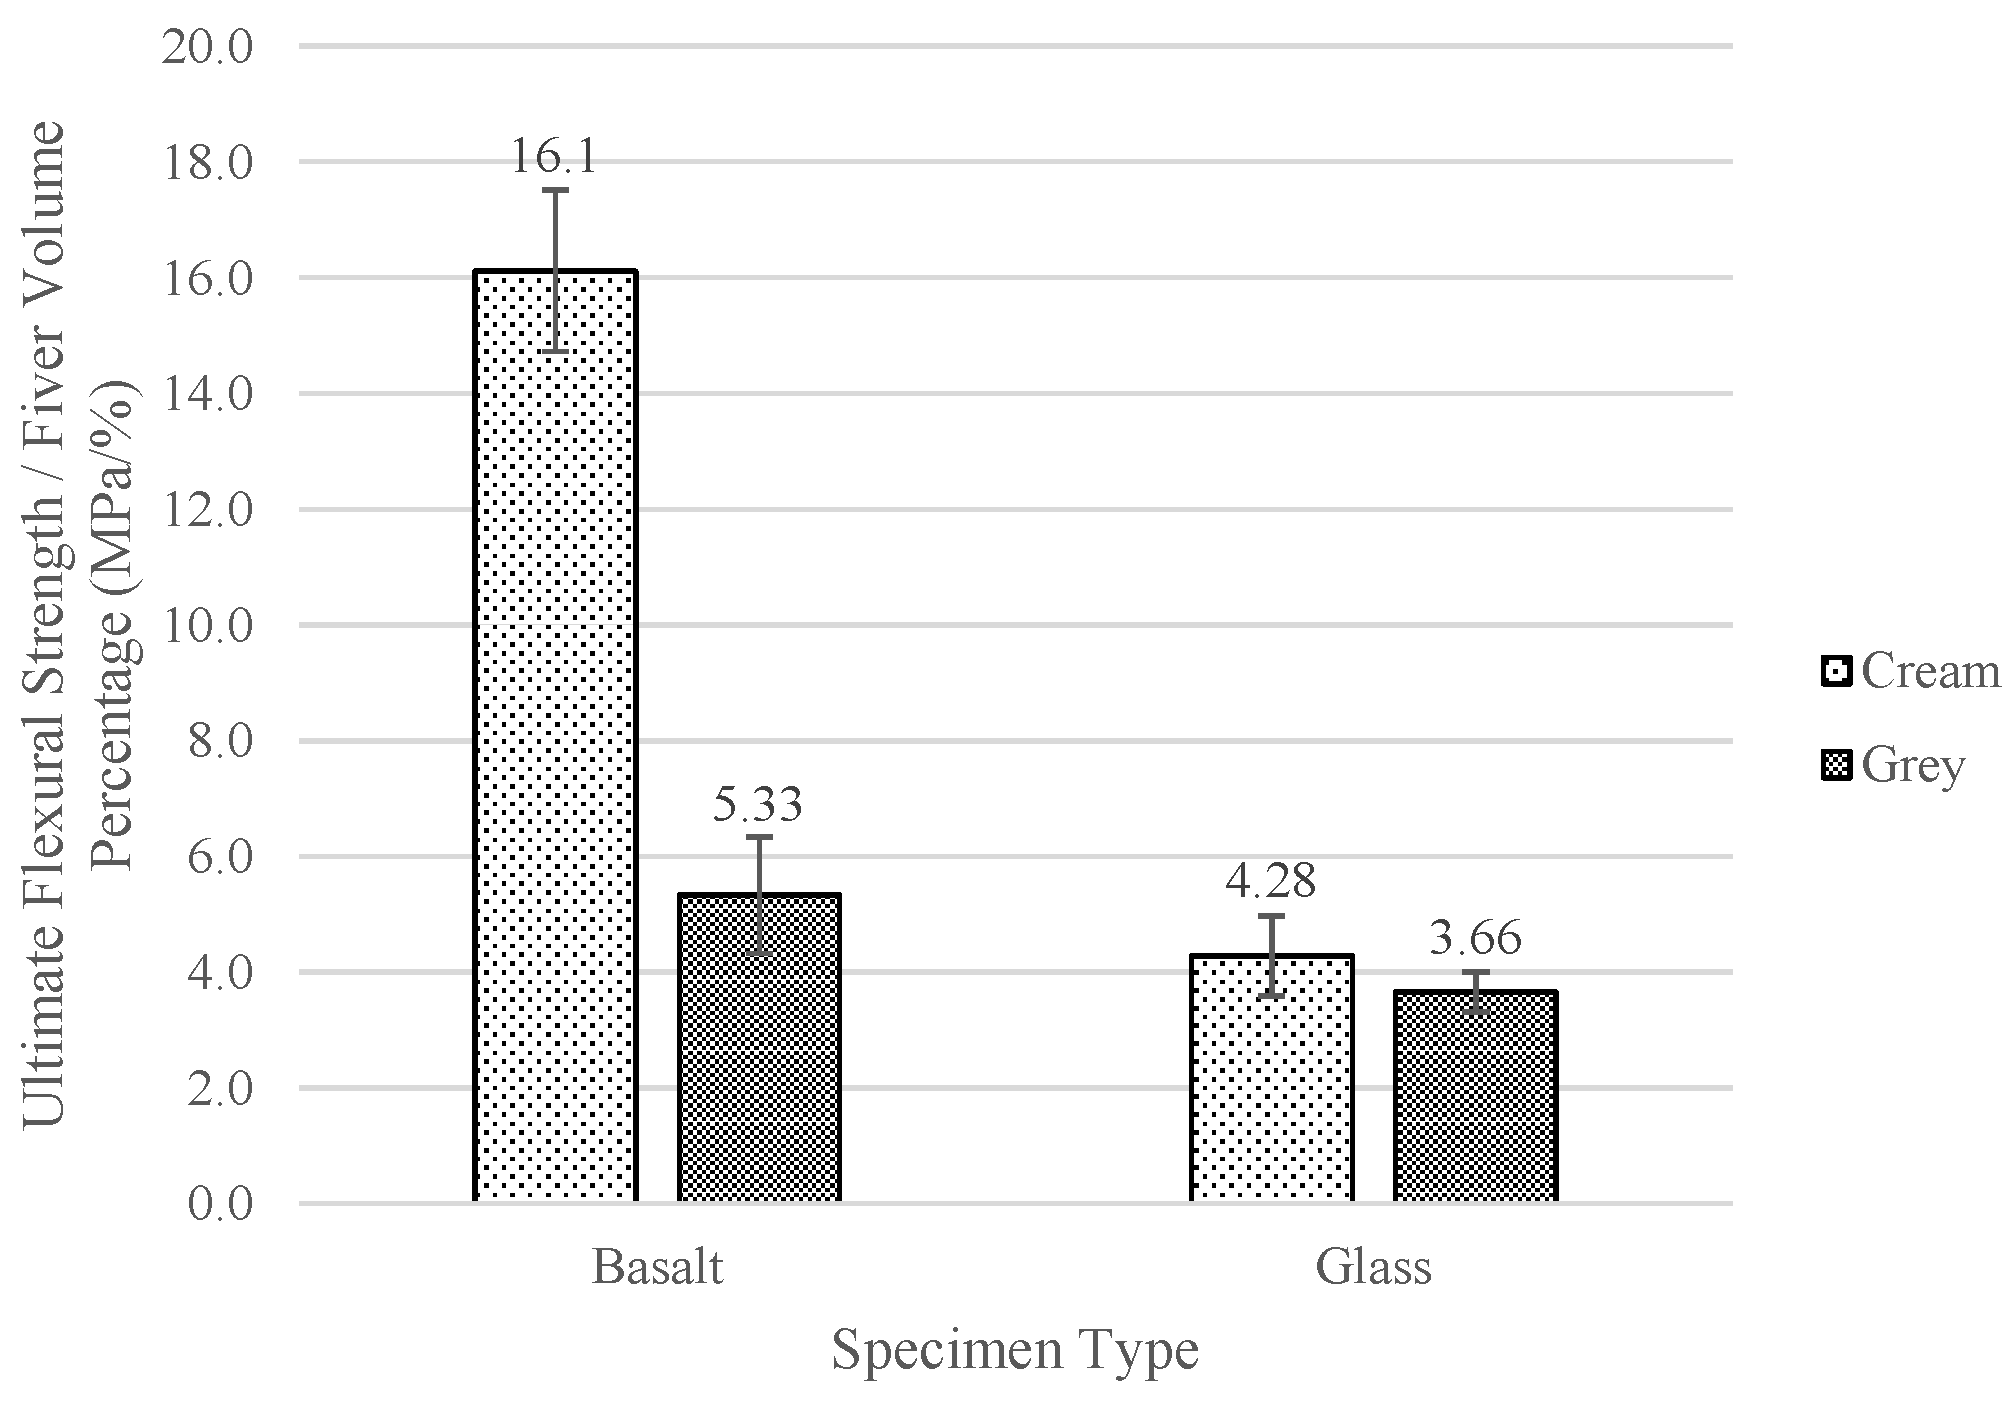
The average flexural modulus and ultimate flexural strength normalized with the sample types’ average fiber volume percentage further showed the strength improvements in the cream basalt samples and can be seen in Figure 18 and Figure 19. These samples exhibited a normalized average flexural modulus of 863 MPa/% and a normalized average ultimate flexural strength of 16.1 MPa/%. This is significantly higher than both the cream glass samples and the grey basalt samples. It has been shown that increasing the number of layers in a composite specimen can lead to an increase in the flexural strength of a composite sample [38,39]. In this case, the cream basalt specimens were produced with ten layers, double that of the cream glass specimens produced with five layers. This helps to explain the differences in the normalized flexural properties between cream composite specimens, especially when factoring in the average fiber volume percentages of those samples. The cream glass samples had an average fiber volume percentage of 7.19% compared to just 2.19% of the cream basalt samples, further showing the increased number of layers improved the strengthening efficiency of the cream basalt specimens. Similarly, the grey basalt specimens produced with six layers exhibited a higher normalized average ultimate flexural strength of 5.33 MPa/%, compared to the 3.66 MPa/% exhibited by the grey glass specimens produced with three layers. The normalized average flexural modulus was also higher in the grey basalt specimens.
Figure 18.
Normalized average flexural modulus of composite specimens.
Figure 19.
Normalized average ultimate flexural strength of composite specimens.
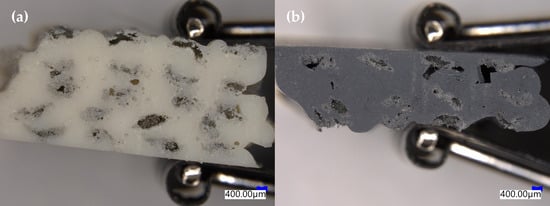
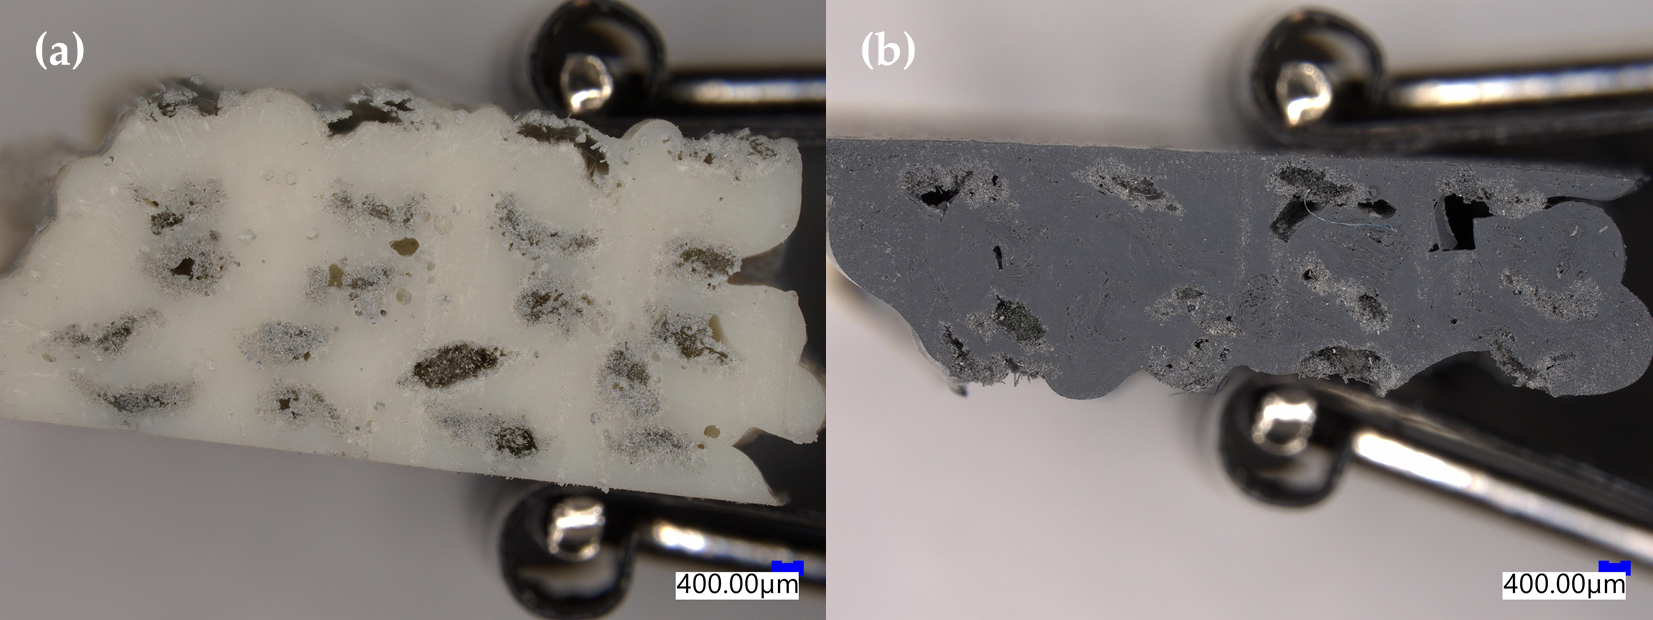
The inconsistent printing nature of the grey resin system was again seen in the quality of the specimens in the flexural test. Observing the geometry of the cream and grey glass specimens in Figure 20, it can be seen that the grey specimen had a much more uneven top surface than the cream specimen. With that, large pockets of voids can be seen in the grey specimen that are not present in the cream specimen. These impurities are, in part, due to the faster gel time of the grey resin system, making it harder for the subsequent layer to fill any voids. Although this did not have an effect on the flexural performance between the cream and grey glass specimens, it is important information in regard to the ability to create quality specimens.
Figure 20.
Comparison of glass composite specimens with (a) cream resin and (b) grey resin.
3.8. Statistical Significance
The ANOVA results of the measured tensile data are given in Table 11, and the results for the flexural data are provided in Table 12. Each group contained five samples, and the analyses used one degree of freedom between the groups and eight degrees of freedom within the groups. The critical F-value associated with a 5% significance level was 5.32.
Table 11.
Single-factor analysis of variance (ANOVA) results of tensile data.
Table 12.
ANOVA results of flexural data.
All but one of the fiber–resin combinations presented in Table 11 showed statistical significance, indicating that the tensile performance of these continuous fiber-reinforced composites is sensitive to fiber reinforcement and matrix alterations alike. The difference between the neat resins was most significant regarding the percent strain at failure. While the cream and grey resins had similar standard deviations, the grey matrix material exhibited greater elasticity, achieving a strain at failure percentage over double that of the cream matrix material. The high F-value related to the tensile modulus of the cream composites indicates a strong dependency on fiber type. A significant jump from 3690 MPa to 6281 MPa occurs when glass fiber is substituted for basalt fiber. However, this can be attributed to the different fiber and void volume percentages of the two composites. The cream basalt composite contained only 2.19% fiber by volume, with the highest void volume found at 13.2%, while the cream glass composite had respective fiber and void volumes of 7.19% and 9.15%. Only the tensile modulus data for the glass composites were found to be statistically insignificant, indicating that the stiffness of the glass fiber in both composites dominated over that of the matrix.
The ANOVA results for the flexural data showed a statistically significant difference in both flexural stiffness and strength for the neat matrix materials. The F-value of 101.3 shows that the difference in flexural strength is reflective of the matrix materials themselves, as the standard deviation within the groups was relatively low. There was no statistically significant difference in flexural modulus or strength for the glass composites, supporting the notion that the flexural performance of the composites is driven by the glass fiber.
4. Discussion
The purpose of this research was to first develop a baseline REAM process to easily produce test specimens. Two two-part reactive resin systems, distinguished by their cream and grey colors, with basalt and glass reinforcing fibers, were used in the comparison of material properties for both neat and composite parts. A venturi nozzle design was used to introduce the fiber into the two-part resin systems without back flow at the injection point. However, when producing the composite samples, it was found that the fiber became encapsulated with minimal wet-out due to the high viscosity of the mixed two-part resin systems. The venturi nozzle was redesigned to add four agitating nodes after the fiber injection point in order to spread the individual filaments of the fiber tow. By doing this, the resin was able to penetrate the fiber tow and drastically improve fiber wet-out. From the production of the test specimens, it was found that it was easier to produce both neat and composite parts with the cream resin system, as it exhibited a more forgiving reaction and longer gel time compared to the grey resin system.
Upon testing the produced specimens, it was found that the neat specimens exhibited very elastic properties. For example, during the tensile testing, the cream and grey resin systems exhibited average strain at failure percentages of 101% and 255%, respectively. As expected, the introduction of the basalt and glass fibers for the creation of composite specimens yielded large increases in mechanical strength compared to the neat specimens. However, the composite specimens exhibited undesirable characteristics as well. The grey glass specimens had the highest average fiber volume percentage of all the composite specimens at 8.29%, far below what would be considered viable to produce production parts. There was also a large presence of voids in the composite specimens, reaching up to 13.2% in the cream basalt samples. Each void is a defect in the composite with the potential to act as a crack nucleation site, causing premature failure of the composite that is presented through reduced mechanical performance. Although improved, the presence of the agitating nodes did not fully wet out the fiber in the composite specimens. This was especially seen by observing the dry fibers at the tensile failure of the grey glass specimens. While the reduction in glass transition temperature of the reinforced composites compared to their neat resin systems was not anticipated and could be attributed to the low fiber content of the composites or weak interfacial bonding, more evidence is required to support those speculations. A recommendation for future work would be to conduct a thorough post-failure investigation of the fracture surface with scanning electron microscopy.
5. Conclusions
The present research examined reactive extrusion additive-manufacturing techniques for the fabrication of polyurea composite samples containing glass and basalt fibers. The samples were then analyzed through TGA, density, burn off, DSC, DMA, tensile, and flexural tests. The following major conclusions can be drawn:
- Two resin systems were used to manufacture glass and basalt composites using a unique REAM process. This allowed for a systematic evaluation of the influence of process parameters, including material flow rate, nozzle z-height, and print speed on processability.
- The venturi nozzle used to introduce continuous glass and basalt fibers to the REAM process was limited in its ability to adequately wet out the fiber tow. Internal agitation nodes were incorporated, increasing the fiber surface area available for interfacial bonding. Improved fiber wet-out with the internal nodes was visibly noticeable.
- Density testing indicated a low fiber volume content in all composite samples and a significant presence of voids. This was confirmed with the results of TGA and burn-off testing. Fiber volume percentage ranged from 2.19% in the cream basalt composite sample to 8.29% in the grey glass sample. Void percentages spanned from 3.32% in the grey basalt sample to 13.2% in the cream basalt sample.
- Fiber volume percentages were higher in the glass specimens than the basalt specimens. This was attributed to the smaller tow size of the basalt fiber compared to the glass fiber while overall bead size was maintained.
- The composite samples showed significantly increased tensile modulus (595–1219%) and tensile strength (223–621%) values over the neat resin samples. The glass composites outperformed their basalt counterparts under tensile loading conditions, attributable to differences in fiber volume percentage and tow size.
- Basalt composites with a 15-s-gel-time resin system and produced with six layers exhibited a higher normalized average ultimate flexural strength of 5.33 MPa/% compared to 3.66 MPa/% exhibited by those produced with three layers.
- Despite positive increases in tensile and flexural strength and stiffness, all mechanical properties remained below the values expected of high-strength composites for commercial applications, indicative of shortcomings in the current REAM process, including high void percentages, low fiber content, and limited fiber wet-out.
- These findings highlight the potential for REAM composites to be used in high-strength applications while underscoring the importance of process optimization and material selection to minimize defects and reach the performance benchmarks set by more conventional structural composites containing 30–60% fiber by volume.
- Future work should prioritize further nozzle optimization and material compatibility to improve fiber wet-out and increase the fiber volume beyond 20%. Reducing the void volume percentage to less than 5% would additionally benefit this research area. Scanning electron microscopy should also be performed to conduct a more thorough post-failure analysis.
Author Contributions
Conceptualization, K.A.N., G.S., L.R.G. and C.A.U.; methodology, K.A.N. and L.R.G.; formal analysis, K.A.N. and G.S.; investigation, K.A.N. and G.S.; data curation, K.A.N. and G.S.; writing—original draft, K.A.N.; writing—review and editing, K.A.N., R.W., L.R.G. and C.A.U.; supervision, C.A.U.; project administration, C.A.U.; funding acquisition, C.A.U. All authors have read and agreed to the published version of the manuscript.
Funding
Authors would like to thank the US Army Ground Vehicle Systems Center (GVSC) for providing the funding to conduct this research through the National Center for Manufacturing Sciences (NCMS) 2022017-142125.
Data Availability Statement
The data presented in this study are available upon request from the corresponding author.
Conflicts of Interest
The authors declare no conflicts of interest.
Abbreviations
| ABS | Acrylonitrile butadiene styrene |
| ANOVA | Single-factor analysis of variance |
| CFAM | Continuous fiber additive manufacturing |
| CFF | Continuous filament fabrication |
| CFRTC | Continuous fiber-reinforced thermosetting composite |
| DSC | Differential scanning calorimetry |
| DMA | Dynamic mechanical analysis |
| FFF | Fused filament fabrication |
| PLA | Polylactic acid |
| REAM | Reactive extrusion additive manufacturing |
| SLA | Stereolithography |
| TGA | Thermogravimetric analysis |
References
- Uitz, O.; Koirala, P.; Tehrani, M.; Seepersad, C.C. Fast, low-energy additive manufacturing of isotropic parts via reactive extrusion. Addit. Manuf. 2021, 41, 101919. [Google Scholar] [CrossRef] [Scilit]
- Rios, O.; Carter, W.; Post, B.; Lloyd, P.; Fenn, D.; Kutchko, C.; Rock, R.; Olson, K.; Compton, B. 3D printing via ambient reactive extrusion. Mater. Today Commun. 2018, 15, 333–336. [Google Scholar] [CrossRef] [Scilit]
- Chawla, K.K. Composite Materials: Science and Engineering; Springer: New York, NY, USA, 2021. [Google Scholar]
- Hyer, M.W.; White, S.R. Stress Analysis of Fiber-Reinforced Composite Materials; DEStech Publications, Inc.: Lancaster, PA, USA, 2009. [Google Scholar]
- Zheng, Y.; Zhang, Y.; Zhuo, J.; Zhang, Y.; Wan, C. A review of the mechanical properties and durability of basalt fiber-reinforced concrete. Constr. Build. Mater. 2022, 359, 129360. [Google Scholar] [CrossRef] [Scilit]
- Sim, J.; Park, C.; Moon, D.Y. Characteristics of basalt fiber as a strengthening material for concrete structures. Compos. Part B Eng. 2005, 36, 504–512. [Google Scholar] [CrossRef] [Scilit]
- Li, Z.; Ma, J.; Ma, H.; Xu, X. Properties and applications of basalt fiber and its composites. In IOP Conference Series: Earth and Environmental Science; IOP Publishing: Bristol, UK, 2018; Volume 186, p. 012052. [Google Scholar]
- Dhand, V.; Mittal, G.; Rhee, K.Y.; Park, S.-J.; Hui, D. A short review on basalt fiber reinforced polymer composites. Compos. Part B Eng. 2015, 73, 166–180. [Google Scholar] [CrossRef] [Scilit]
- Koirala, P.; Pavlovic, R.; Aber, A.; Fogg, M.J.; Mensch, C.; Seepersad, C.C.; Tehrani, M. Reactive extrusion additive manufacturing of a short carbon fiber thermosetting composite via active mixing. Compos. Part A Appl. Sci. Manuf. 2024, 178, 107989. [Google Scholar] [CrossRef] [Scilit]
- Chen, C.; Wang, X.; Jiang, J.; Li, P.; Zhang, D. Additive Manufacturing of Continuous Fiber Reinforced Thermosetting Composites: Research Progress on Application Challenges, Process Exploration, Material Development, and Performance Tailoring. Polym. Sci. 2026, 64, 3687–3715. [Google Scholar] [CrossRef] [Scilit]
- Gallitto, A.A.; Zingales, R.; Battaglia, O.R.; Fazio, C. An approach to the Venturi effect by historical instruments. Phys. Educ. 2021, 56, 025007. [Google Scholar] [CrossRef] [Scilit]
- Cercone, L. Optimizing fiber wetout for composites manufacturing. Polym. Compos. 1991, 12, 81–86. [Google Scholar] [CrossRef] [Scilit]
- ASTM Committee D-30 on High Modulus Fibers, Interfaces in Composites; American Society for Testing & Materials: West Conshohocken, PA, USA, 1969.
- Sudaglass Fiber Technology. Comparative Technical Characteristics of Filament Made from E-Glass, Basalt and Silica. 2002. Available online: http://www.sudaglass.com/chars.html (accessed on 29 March 2023).
- SE1200 Type 30® Single-End Roving|Owens Corning Composites. SE1200 Type 30® Single-End Roving: Owens Corning Composites. Available online: https://www.owenscorning.com/en-us/composites/product/se1200#technical-information (accessed on 29 March 2023).
- 3B Fibreglass. SE 1200 Direct Rovings. Available online: https://3.imimg.com/data3/YN/ME/MY-3771747/roving-thermosets.pdf (accessed on 29 March 2023).
- ASTM D3850-19; Standard Test Method for Rapid Thermal Degradation of Solid Electrical Insulating Materials by Thermogravimetric Method (TGA). ASTM International: West Conshohocken, PA, USA, 2019.
- ASTM D792-20; Standard Test Methods for Density and Specific Gravity (Relative Density) of Plastics by Displacement. ASTM International: West Conshohocken, PA, USA, 2020.
- ASTM D3171-22; Standard Test Methods for Constituent Content of Composite Materials. ASTM International: West Conshohocken, PA, USA, 2022.
- ASTM E2160-22; Standard Test Method for Heat of Fusion and Melting Point of Organic Materials by Thermal Analysis. ASTM International: West Conshohocken, PA, USA, 2022.
- ASTM D5418-23; Standard Test Method for Plastics: Dynamic Mechanical Properties: In Flexure (Dual Cantilever Beam). ASTM International: West Conshohocken, PA, USA, 2023.
- ASTM D638-22; Standard Test Method for Tensile Properties of Plastics. ASTM International: West Conshohocken, PA, USA, 2022.
- ASTM D790-17; Standard Test Methods for Flexural Properties of Unreinforced and Reinforced Plastics and Electrical Insulating Materials. ASTM International: West Conshohocken, PA, USA, 2017.
- Reinholz, J.A. Effects of Processing Parameters and Thickness on Compression-Molded PET/GF Composites. Order No. 31148707. Master’s Thesis, North Dakota State University, Fargo, ND, USA, 2024. [Google Scholar]
- Jorgensen, A. The Processing Effects on Thick Section Compression Molded Comingled PET/E-Glass Composites. Order No. 31336628. Master’s Thesis, North Dakota State University, Fargo, ND, USA, 2024. [Google Scholar]
- Sapuan, S.M.; Leenie, A.; Harimi, M.; Beng, Y.K. Mechanical properties of woven banana fibre reinforced epoxy composites. Mater. Des. 2006, 27, 689–693. [Google Scholar] [CrossRef] [Scilit]
- Abdulmajeed, A.A.; Närhi, T.O.; Vallittu, P.K.; Lassila, L.V. The effect of high fiber fraction on some mechanical properties of unidirectional glass fiber-reinforced composite. Dent. Mater. 2011, 27, 313–321. [Google Scholar] [CrossRef] [Scilit] [PubMed]
- Thomaidis, S.; Kakaboura, A.; Mueller, W.D.; Zinelis, S. Mechanical properties of contemporary composite resins and their interrelations. Dent. Mater. 2013, 29, e132–e141. [Google Scholar] [CrossRef] [Scilit] [PubMed]
- Stahle, L.; Wold, S. Analysis of variance (ANOVA). Chemom. Intell. Lab. Syst. 1989, 6, 259–272. [Google Scholar] [CrossRef] [Scilit]
- Akil, H.M.; Mazuki, A.A.M.; Safiee, S.; Ishak, Z.A.M.; Bakar, A.A. Study on Dynamic Mechanical Properties of Pultruded Kenaf Fiber Reinforced Composites; TUE-SE03-07; Universiti Sains Malaysia: Penang, Malaysia; pp. 1–9.
- Sherif, G.; Chukov, D.I.; Tcherdyntsev, V.V.; Torokhov, V.G.; Zherebtsov, D.D. Effect of Glass Fibers Thermal Treatment on the Mechanical and Thermal Behavior of Polysulfone Based Composites. Polymers 2020, 12, 902. [Google Scholar] [CrossRef] [Scilit] [PubMed]
- Slapnik, J.; Liu, Y.; Kupfer, R.; Lucyshyn, T.; Nardin, B.; Pinter, G. Low-Temperature Fibre Direct Compounding of Cellulose Fibres into PA6. Materials 2022, 15, 6600. [Google Scholar] [CrossRef] [Scilit] [PubMed]
- Abdullah, S.A.; Iqbal, A.; Frormann, L. Melt mixing of carbon fibers and carbon nanotubes incorporated polyurethanes. J. Appl. Polym. Sci. 2008, 110, 196–202. [Google Scholar] [CrossRef] [Scilit]
- Qiao, L.; Yan, X.; Tan, H.; Dong, S.; Ju, G.; Shen, H.; Ren, Z. Mechanical Properties, Melting and Crystallization Behaviors, and Morphology of Carbon Nanotubes/Continuous Carbon Fiber Reinforced Polyethylene Terephthalate Composites. Polymers 2022, 14, 2892. [Google Scholar] [CrossRef] [Scilit] [PubMed]
- Pothan, L.A.; Oommen, Z.; Thomas, S. Dynamic mechanical analysis of banana fiber reinforced polyester composites. Compos. Sci. Technol. 2003, 63, 283–293. [Google Scholar] [CrossRef] [Scilit]
- Da-Peng, Z.; Hong, F. Mechanical and high-temperature properties of glass fibers reinforced phenolic composites. J. Reinf. Plast. Compos. 2008, 27, 1449–1460. [Google Scholar] [CrossRef] [Scilit]
- Wood, C.D.; Ajdari, A.; Burkhart, C.W.; Putz, K.W.; Brinson, L.C. Understanding competing mechanisms for glass transition changes in filled elastomers. Compos. Sci. Technol. 2016, 127, 88–94. [Google Scholar] [CrossRef] [Scilit]
- Brito, A.; Lopes, R.; Carvalho, R.F.; Gomes, O.D.F.M.; Dias, R. Effect of Number of Layers on Tensile and Flexural Behavior of Cementitious Composites Reinforced with a New Sisal Fabric. Textiles 2024, 4, 40–56. [Google Scholar] [CrossRef] [Scilit]
- Dong, C.; Davies, I.J. Mechanical properties of continuous glass fibre-reinforced composites made by material extrusion. Prog. Addit. Manuf. 2024, 9, 2131–2141. [Google Scholar] [CrossRef] [Scilit]



Disclaimer/Publisher’s Note: The statements, opinions and data contained in all publications are solely those of the individual author(s) and contributor(s) and not of MDPI and/or the editor(s). MDPI and/or the editor(s) disclaim responsibility for any injury to people or property resulting from any ideas, methods, instructions or products referred to in the content. |
© 2026 by the authors. Licensee MDPI, Basel, Switzerland. This article is an open access article distributed under the terms and conditions of the Creative Commons Attribution (CC BY) license.