


Highlights
What are the main findings?
- The LF-TF-CPO algorithm compressed the average maximum individual energy consumption to 665.64 kJ, preserving an adequate operational margin below the 950 kJ capacity limit while achieving a 31.30 min synchronous mission duration.
- A sub-second dynamic emergency recovery protocol stabilized post-failure peak loads safely below the capacity threshold across various hardware failure scenarios, mitigating cascading crash risks.
What are the implications of the main findings?
- Transitioning from traditional global energy minimization (Min-Sum) to a survivability-oriented Min–Max paradigm effectively suppresses localized overload bottlenecks with a marginal 0.4% total energy trade-off.
- By establishing a robust empirical sweet spot (λ = 0.05), the architecture, which exhibits low parameter sensitivity and empirically linear scaling up to 40 UAVs, minimizes the need for manual retuning. This inherent adaptability establishes a promising simulation-validated baseline for future rapid deployment and mitigating physical risks in time-critical autonomous swarm operations within complex topographies.
Abstract
Multi-UAV coverage planning in complex mountainous environments is often constrained by idealized energy modeling, the “wood barrel effect” of traditional global energy minimization paradigms, and a lack of dynamic fault tolerance. To address these limitations, this study proposes a survivability-oriented Min–Max optimization architecture driven by the novel Lévy–Flight Terrain-Following Constrained Planning Optimization (LF-TF-CPO) algorithm. Coupling a high-fidelity 3D topographical matrix with a nonlinear aerodynamic energy model, the framework prioritizes individual UAV safety. Monte Carlo simulations demonstrate that LF-TF-CPO compresses the average maximum individual energy consumption to 665.64 kJ, preserving an adequate operational margin below the 950 kJ physical redline to absorb unmodeled aerodynamic perturbations while ensuring a 31.30 min mission duration. Ablation studies verify the Min–Max objective mitigates localized overloads with a marginal 0.4% energy trade-off. Furthermore, an emergency recovery protocol validates dynamic resilience across simultaneous and cascading failures by consistently stabilizing post-failure peak loads within safe margins. Notably, statistical evaluations establish a robust empirical sweet spot (λ = 0.05), demonstrating the framework’s low sensitivity to parameter variations. By minimizing the need for manual retuning, this architecture serves as a promising simulation-validated planning framework for future rapid deployment in time-critical disaster responses.
1. Introduction
UAV swarms have become vital platforms in remote sensing and post-disaster rescue missions within mountainous terrain [1,2]. Benefiting from the collaborative operation mechanism, multi-UAV systems can perform full-coverage high-speed searches of large-scale complex mountain regions [3], which enhance both mission effectiveness and environmental responsiveness compared to single-UAV platforms. To satisfy the requirement of a complete coverage mission, currently, researchers have devised numerous classic path planning schemes to implement UAV swarms, many of them achieving fast mapping of an area and detection of the ground by employing raster scanning or geometric subdivision plans [4,5]. However, the discrepancy between the idealized planning model and the real flight environment frequently results in a significant mismatch between the predicted and observed energy usage, potentially leading to severe safety incidents such as UAV crashes caused by battery depletion [6].
Conventional UAV swarm path planning typically relies on the Min-Sum principle of reducing both the distance flown by a swarm and the energy consumed in the process [7]. Nonetheless, energy usage does not scale linearly with flight distance in rugged, mountainous areas. The shortest paths are not always less energy consuming. This uniform distribution of areas based on the Min-Sum principle introduces notable safety risks [8,9]. Some drones are assigned to steeper, more energy-intensive terrain, which exposes them to higher aerodynamic loads and drains their batteries significantly faster than others. This leads to a classic “wood barrel effect”. The underperformance of a single drone could ruin the efficiency and security of the whole swarm [10]. The failure of an overloaded drone may jeopardize the entire global search mission, which is particularly detrimental during life-saving emergency rescues. To ensure that the failure of one drone does not jeopardize the entire mission, the traditional optimization focus on “overall efficiency” should transition toward prioritizing the “safety limits of individual drones”.
To address these specific challenges, current multi-UAV path planning methods primarily rely on geometric strategies, learning-based models, and heuristic algorithms. However, these conventional approaches exhibit notable limitations when applied to survivability-oriented missions in mountainous terrain. Geometric methods execute rapid area mapping but lack the flexibility to dynamically adapt to varying aerodynamic energy constraints across complex topographies. Multi-agent reinforcement learning (MARL) methods possess strong adaptive capabilities, yet their heavy reliance on offline training presents adaptability challenges in entirely unknown post-failure environments without prior data coverage. While heuristic evolutionary algorithms offer strong global optimization capabilities, they frequently stagnate at local optima under strict energy constraints, failing to effectively constrain the safety limits of individual UAVs. More importantly, most existing planning architectures are restricted by fixed mission setups, with limited dynamic fault tolerance [11,12]. In the event of an unexpected UAV crash, these rigid systems struggle to seamlessly redistribute the unexplored regions, ultimately leading to mission failure [13,14].
To resolve the core limitations, we propose a survival-oriented decision-making architecture for UAV swarm full-coverage path planning in complex mountainous terrain, which is driven by a dedicated heuristic algorithm, namely, Lévy–Flight Terrain-Following Constrained Planning Optimization (LF-TF-CPO). Unlike conventional methods that often assume obstacle-free environments, the proposed architecture uses 10 m-resolution genuine elevation data from the Yunling Mountains and further builds a terrain-weighted task density map using high-fidelity 3D mountain terrain and nonlinear aerodynamic energy consumption maps. The terrain-adaptive planning module reads the density matrix and dynamically alters the step size of the search performed by UAVs, enabling them to avoid obstacles and perform fine searches in areas of high energy consumption due to steep slopes, and fast traversal in flat slopes. To ensure that the “wood barrel effect” is mitigated, the architecture makes explicit provision of a strict weighted Min–Max optimization framework that reduces the highest individual energy expenditure of the entire swarm to the level below the hardware safety limit. To prevent premature convergence when dealing with strict Min–Max restrictions, the algorithm is initiated based on tent map chaos pools so that the initial solution has enhanced spatial diversity. Additionally, to overcome the local optima trap of traditional heuristics, an elite Lévy mutation strategy is proposed to solve the optimization deadlock based on physical flight feasibility, which is verified by a strict energy feasibility rejection mechanism. The entire planning architecture is training-free and suggests potential applicability under similar terrain conditions.
Meanwhile, to support the continuity of the task in emergency conditions when an unmanned aerial vehicle suddenly fails, the proposed architecture has an emergency response plan at a millisecond level. Upon the failure of a UAV and its departure from the mission, the spatial greedy allocation mechanism immediately initiates for the high-speed re-partitioning of the open regions. The freshly segregated unassigned areas are assigned to the closest operational UAVs promptly, which reduces the additional flight expense, accommodates the large load variability, and preserves the per-UAV energy safety balance of the UAV swarm.
The main contributions of this work are as follows:
- (1)
- High-fidelity topographical–aerodynamic energy modeling—We developed a coupled model integrating high-fidelity 3D mountain terrain with the nonlinear aerodynamic energy consumption of multi-rotor UAVs. This model provides a reliable, physics-based estimation of energy drain in rugged topographies, effectively addressing the planning errors caused by the traditional substitution of energy use with linear path length.
- (2)
- Survivability-oriented Min–Max optimization framework—A weighted Min–Max optimization architecture is established, shifting the conventional paradigm from macroscopic energy greediness to individual bottleneck suppression. By constraining the maximum power consumption of all agents within a pre-defined hardware safety threshold, the framework mitigates the “wood barrel effect”, lowering the risk of severe battery depletion.
- (3)
- Robust heuristic solver (LF-TF-CPO)—We propose the LF-TF-CPO algorithm, a robust and adaptable solver exhibiting low parameter sensitivity. This algorithm establishes a dynamic map between the terrain task density and the UAV’s exploration step size, successfully overcoming the tendency of traditional meta-heuristics to stagnate at local optima when operating under strict energy constraints.
- (4)
- Dynamic fault-tolerant replanning mechanism—A history-aware emergency recovery protocol is developed to enable the rapid, millisecond-level reallocation of unexplored regions during unexpected UAV failures. This mechanism ensures seamless mission takeover and mitigates the risk of cascading swarm failures, providing robust resilience even during severe simultaneous or sequential hardware losses.
2. System Model and Problem Formulation
2.1. High-Fidelity 3D Mountain Terrain Modeling and Task Density Mapping
We construct the physical mission environment model using real-world measured satellite elevation data. Specifically, we use the ASTER GDEM V3 dataset, with the selected data tile ASTGTMV003_N25E099 covering the rugged Yunling Mountains in Yunnan Province, China. We selected a 3 km × 3 km core region (total area of 9 km2) as the target mission area. We reproject the raw geographic coordinate data (WGS84) to the Universal Transverse Mercator (UTM) 47 N projected coordinate system and resample it to a 300 × 300 high-fidelity elevation matrix with 10 m horizontal resolution using bilinear interpolation [15].
The raw data has a nominal vertical accuracy of ±20 m [16]. While this resolution is sufficient for macro-level spatial allocation, this inherent DEM uncertainty can affect local slope estimation, safe-altitude margins, and aerodynamic energy prediction. Consequently, ensuring operational survivability requires an adequate algorithmic energy margin (as established in Section 2.3) and the delegation of final micro-level collision avoidance to real-time onboard sensors. During preprocessing, we first identify invalid NoData pixels with the official fill value of −9999, and then fill these pixels using inverse distance weighted (IDW) interpolation based on 8-neighborhood valid elevation data to ensure the continuity of the terrain model [17]. We also apply a Gaussian smoothing filter to the filled elevation matrix to suppress high-frequency noise from the raw satellite data.
We set the swarm size to UAVs. Each drone is equipped with a 24 MP mapping camera, which has a nominal swath width of 120 m and a ground sampling distance (GSD) of 5 cm at a 100 m relative ground altitude. To ensure seamless full coverage, we set a minimum 20% side overlap ratio between adjacent flight lines and a minimum 60% forward overlap ratio for terrain mapping. Each UAV maintains a dynamic terrain-following altitude above the local ground level to maintain safe ground clearance in rugged terrain, which is determined as a function of the local slope as follows:
Here, = 80 m is the minimum safe flight altitude for a low-altitude UAV aerial survey specified in Chinese civil aviation regulations, and = 20 m is the slope compensation coefficient. This setting keeps the relative flight altitude between 80 m and 100 m, and limits the fluctuation of swath width and GSD within 20%, which satisfies the coverage overlap requirements.
Mountainous terrain inherently causes uneven energy consumption during flight. To quantify this physical effect, we extract two critical and independent topographical features from : terrain slope and surface roughness . We calculate the slope , which represents the maximum rate of elevation change, as follows:
To mitigate collinearity with the slope factor, we define surface roughness based on neighborhood elevation statistics to represent local topographical irregularity, as follows:
Here, and are the standard deviation and mean elevation values within a neighborhood, respectively. Since the mission area is located in the Yunling Mountains with a minimum elevation greater than 500 m, is strictly positive, which prevents division-by-zero errors in the calculation.
We normalize these two feature matrices to the range of using Min–Max normalization, denoted as and , to eliminate dimensional discrepancies. We then construct a terrain-weighted task density map to guide the spatial distribution of the swarm as follows:
The weighting coefficients were set in accordance with the Chinese specifications for aerial image surveying with unmanned aerial systems (CH/T 8021-2010) [18]. During mountainous flight operations, steep slopes exert a more pronounced influence on flight safety and aerodynamic loads than surface roughness. Therefore, a high weight is given to the slope factor (). The robustness of this weighting is verified in later experiments through a sensitivity analysis. This confirms that the algorithm performs stably within an appropriate weighting range. In addition, a reference density constant (corresponding to 10% of the standardized maximum density) is introduced. This ensures minimal effort even in flat areas and avoids areas with zero density, which would otherwise cause problems in the subsequent spatial segmentation.
If the mission space is divided into mutually exclusive sub-areas , the total spatial workload of the -th UAV is calculated as a double integral of the density map in the respective sub-area as follows:
In a comprehensive aerial survey, the trajectory length, the number of curves and the ascent/descent frequency for a sub-area correlate positively with the terrain-weighted mission density . A higher density indicates more complex terrain, which requires narrower trajectories and more frequent altitude adjustments and thus increases the aerodynamic energy consumption. Therefore, there is a strong positive correlation between the total workload and the actual flight energy consumption of the -th UAV, which critically influences the load distribution of the entire fleet.
The 3D mountainous terrain and the corresponding terrain-weighted mission density map we proposed are illustrated in Figure 1. The terrain-weighted mission density map we proposed departs from the assumption of a uniform spatial distribution adopted by traditional coverage planning methods and provides a clear spatial basis for subsequent nonlinear modeling of aerodynamic energy consumption and survivability-oriented Min–Max coverage optimization.
Figure 1.
Topographical modeling of the mission area in the Yunling Mountains. (a) The high-fidelity 3D digital elevation model resampled from authentic ASTER GDEM V3 data. (b) The corresponding terrain-weighted task density map , where brighter regions indicate rugged topologies with severe aerodynamic penalties.
2.2. Nonlinear Aerodynamic Energy Consumption Coupling Model for Multi-Rotor UAV Flight over Mountains
In recent years, a simplified assumption regarding linear energy consumption has been frequently used in coverage path planning (CPP) research [19]. This assumption is commonly expressed as . It reduces complex energy constraints to a single trajectory length constraint. This assumption is generally valid for agricultural and urban environments. However, when using multicopter drones to survey high-altitude areas, this assumption exhibits notable limitations. In rough terrain such as the Yunling Mountains, drones are forced to fly continuously at high rates of climb, which is the main cause of energy consumption in CPP missions in this area [20,21]. Our preliminary analysis shows that neglecting vertical aerodynamic work in areas with gradients of more than 30 degrees can lead to prediction errors of more than . Such large errors can significantly degrade the battery safety redundancy of the UAV swarms and make linear models inadequate in complex three-dimensional scenarios.
To establish a comprehensive, physics-based energy model, we analyzed the multi-rotor surveying UAVs. Based on the Blade Element Momentum Theory (BEMT) and its validated power consumption model, the instantaneous power consumption was decomposed into the following two main factors:
Here, represents the basic power required to maintain the avionics system and level flight. Under the operational conditions of a constant three-dimensional trajectory velocity ( = 8 m/s), the power fluctuations caused by minor changes in pitch angle are typically less than 5%, and this result has been supported by empirical flight data [22]. Therefore, it is reasonable to simplify as a constant. represents the additional aerodynamic power used to overcome gravity, and its model is , where is the thrust-to-weight work coefficient and is the flight climb angle. Notably, when the multi-rotor unmanned aerial vehicle is flying downhill (), the gravitational potential energy cannot be effectively recovered to the battery [22]. Therefore, the power consumption during the descent stage always takes as the lower limit. In the terrain-following mode, the flight trajectory is parallel to the ground contour, and thus a geometric equivalence relationship of exists. Based on these mechanisms, the total aerodynamic energy consumption along the three-dimensional trajectory can be expressed as follows:
As clearly shown in this integral form, the macroscopic terrain gradient is coupled to the instantaneous aerodynamic power cost (as summarized in Figure 2a,b).
Figure 2.
Nonlinear aerodynamic energy consumption coupling model for multi-rotor UAVs. (a) Kinematic geometry of terrain-following flight. (b) Aerodynamic power decomposition and the non-regeneration constraint. (c) Comparison of energy consumption between the nonlinear and linear models across varying slopes.
To ensure the engineering fidelity of the simulation, the core parameters are derived using testable benchmark points rather than arbitrary estimations. In particular, = 270 W is the base power and = 45 N is the work coefficient that matches the technical characteristics of a mid-size multi-rotor surveying UAV (e.g., as DJI Matrice 300 RTK with a light load). These parameters are consistent with the parameter settings and calibration results of recent peer-reviewed aerodynamic studies of simulations of mountainous surveying missions [21]. Furthermore, aerial photogrammetry operations impose strict kinematic constraints (). To maintain a stable ground sampling distance (GSD) and image overlap ratio over undulating terrain, the UAV must maintain a constant 3D trajectory speed = 8 m/s; from the perspective of the physical limits of the propulsion system, climbing maneuvers are constrained by the maximum climb angle, i.e., (in this study, ). Rather than classifying extreme steep slopes as no-fly zones, we integrate their corresponding high aerodynamic costs into a terrain-weighted task density map (see Section 2.1 for details). This mechanism ensures that traversing large uphill gradients is regarded as a high physical cost, while downhill flight does not need to bear the corresponding climbing power consumption, thereby naturally transferring local loads to the subsequent Min–Max load balancing architecture.
Through numerical projection, the difference between the nonlinear model proposed in this paper and the traditional linear approximation is clearly presented. Consider a mission zone of 1 km of horizontal projected distance in which the UAV will fly at a given rate of 8 m/s. On a level surface (), the time to complete the flight is approximately 125 s and the power consumption is around 33.75 kJ; when the slope reaches , the real 3D flight trajectory increases to around 1.414 km and the flight time increases to 176 s. More importantly, the instantaneous power peaks at around 524 W, leading to an overall power consumption of up to 92.2 kJ or 2.73 times the power consumed on level ground. When scaled linearly only with the length of the trajectory, the conventional framework will erroneously estimate the energy consumption at 47.7 kJ, which is an underestimation error of over 93 percent (note Figure 2c comparing energy consumption). Such a large discrepancy in aerodynamic expenses demonstrates the inherent limitation of the classical approach to optimization, which is known as Min-Sum (i.e., minimization of the global total energy consumption): high-relief mountainous areas frequently have continuous distributions of steep slopes, and in order to achieve the smallest possible cost of the total transition and the shortest possible total flight distance of the swarm, the pure Min-Sum strategy is likely to allocate consecutive high-energy-consuming terrain to the same UAV. In the absence of hard constraints on the battery capacity of individual UAVs, such local overload allocation is likely to cause individual UAVs to exceed the safety threshold and result in mission failure. To mitigate this systemic risk, the optimization paradigm should transition from global sum minimization to a survivability-oriented weighted Min–Max framework. This framework will be formally established in Section 2.3.
2.3. Formulation of the Survivability-Oriented Weighted Min–Max Optimization Problem
To realize the systematic allocation of task loads within UAV swarms, we transform the complex multi-UAV path planning problem into a mathematical model of continuous spatial division. We define the decision variables as a set of continuous coordinate seeds , corresponding to UAVs. Driven by the terrain-weighted task density map established in Section 2.1, the continuous mountainous environment is discretized into mutually exclusive sub-regions . This distance-based spatial allocation strategy ensures that each geographical grid is uniquely assigned to a specific UAV, laying a geometric foundation for the subsequent energy consumption assessment.
Once the mission space is partitioned into mutually exclusive sub-regions , a deterministic boustrophedon (zig-zag) scanning method is applied within each sub-region to generate the executable 2D coverage paths. To ensure full reproducibility, the sweep orientation within each sub-region is consistently aligned parallel to the X-axis, with the inter-transect step size advancing along the Y-axis according to the effective swath width to satisfy the predefined overlap requirements. Furthermore, to handle irregular subregion boundaries, the algorithm utilizes a discrete grid-masking approach; for each sweep row, the trajectory is strictly clipped between the minimum and maximum valid grid indices belonging to that specific sub-area. To implement terrain-following flight, these 2D paths are vertically projected onto the digital elevation model and elevated by the dynamic safe altitude , forming the final 3D flight trajectories. During this geometric mapping, the number of turns is explicitly counted as the U-turn maneuvers connecting adjacent parallel sweep lines. Consequently, the trajectory-level metrics, including the total 3D path length and the total aerodynamic energy , are deterministically computed by integrating the segment distances and applying the nonlinear energy model (Equation (7)) along these generated 3D waypoints. It should be noted that these reported metrics strictly quantify the intra-regional coverage maneuvers. Entry and exit flight segments (e.g., transit from a launch depot to the subregion boundary) are excluded to explicitly isolate and evaluate the actual terrain-following workload distributed by the spatial partitioning algorithm.
Considering the significant aerodynamic energy consumption caused by the steep terrain gradient (quantified in Section 2.2), the critical operational boundary that defines the safe flight limit of each UAV is the total aerodynamic energy consumption required by the -th UAV to handle the sub-region assigned to it. This value is strongly positively correlated with the total load defined in Section 2.1. To avoid accidents due to battery discharge during flight, the power consumption of each drone must be strictly below the safety capacity limit of its onboard battery. This defines the basic survival conditions . Any seed configuration that breaches this threshold indicates a localized overload and is classified as an infeasible solution.
In this study, rather than adopting the traditional “Min-Sum” optimization paradigm, we propose a weighted Min–Max optimization approach centered on system survivability [23,24,25]. The main optimization objective of this structure is to compress the “bottleneck energy” of the entire swarm. The mathematical formula is . While limiting the maximum energy consumption to enhance basic safety, the load distribution within the swarm is also important to improve the robustness of the overall system. A secondary objective is introduced to evaluate the load balance, which is represented by the standard deviation of the swarm’s energy distribution, where is the mean energy cost. Fusing these two dimensions, the comprehensive fitness function is constructed via weighted scalarization as , where acts as the scalar penalty weight. The statistical robustness of this specific weighting scheme will be rigorously validated through a large-sample sensitivity analysis in Section 4.
Integrating the spatial topology, aerodynamic mechanics, and the survivability logic, the ultimate path planning problem is formulated as the following constrained optimization model:
The model is mathematically non-convex NP-hard in large-dimensional continuous search spaces because the coupling between three-dimensional terrain gradients and stiffness limits results in nonlinear relationships. Conventional gradient solvers and standard heuristic algorithms often struggle with premature convergence to local optima in such rugged terrain. Consequently, solving this problem requires advanced heuristic solvers capable of terrain-responsive exploration. This necessity motivated the development of the LF-TF-CPO architecture, detailed in Section 3.
3. Proposed LF-TF-CPO Algorithm
As described in Section 2, the survivability-focused Min–Max optimization problem shows a highly non-convex fitness landscape. This landscape is characterized by extreme constraints on battery capacities, as well as complex changes in 3D landforms. Classical gradient-descent-based methods and the more recent meta-heuristics such as Particle Swarm Optimization or the recent Alpha Evolution (AE) algorithm tend to suffer from considerable stagnation around local optima in their exploration of the constrained search domain [26]. To address the limitations of these algorithms, we apply the Lévy–Flight Terrain-Following Constrained Planning Optimization (LF-TF-CPO) approach in the current paper. The proposed method avoids optimization stagnation by incorporating three mechanisms: a tent map chaos pool initialization scheme, a terrain-following adaptive planning (TF) module, and an elite Lévy mutation strategy (LF).
3.1. Tent Map Chaos Pool Initialization
Conventional pseudo-random initialization strategies show weaknesses in complex mountainous terrain with steep gradients and high-energy-consumption zones. Randomly generating initial coordinate seeds alone often leads to spatial clustering or directly placing individuals in severely penalized areas. This unguided initialization process often causes numerous individuals to immediately violate the safety threshold (defined in Section 2.3), leading to a sharp decline in spatial diversity in the initial iterations and a significant reduction in the number of feasible solutions.
The tent map chaotic sequence is used to address this limitation by providing the spatial coordinate seed [27,28]. The tent map is essentially a piecewise linear one-dimensional dynamic system with the following mathematical formula:
This chaotic sequence is projected on the 2N-dimensional continuous search boundaries using the inherent ergodicity and non-periodicity of the system. The tent map provides a much higher level of uniformity and coverage of the initial mission space than standard pseudo-random generators, which minimizes the likelihood of coordinate overlap.
Figure 3 shows the initialization architecture of the LF-TF-CPO algorithm. Rather than directly adopting the raw chaotic sequence as the starting population, a rigid elite selection mechanism is employed. Specifically, all chaotic candidates are evaluated using the weighted scalarized fitness function defined in Section 2.3. The top individuals with the lowest scores are then extracted to form the initial swarm, thereby bypassing extreme topographical hazards from the outset. This elite selection mechanism is intended as a deliberate, architecture-specific advantage of LF-TF-CPO to ensure initial feasibility in rugged environments. In contrast, to evaluate the native robustness of the proposed framework against established benchmarks, the baseline methods were implemented using their conventional pseudo-random initialization strategies as defined in their original literature. To ensure academic rigor, the comparison evaluates each method in its native configuration; the elite initialization is an integral part of the proposed architecture, and its computational overhead is fully included in the reported total execution time (as evaluated in Section 4.2).
Figure 3.
Initialization architecture of the LF-TF-CPO algorithm. (a) Tent map chaotic dynamics. (b) Comparison of the spatial distributions. (c) 2N-dimensional chaotic candidate pool. (d) Elite selection mechanism based on weighted Min–Max fitness.
3.2. Terrain-Following Adaptive Planning Module
Meta-heuristic algorithms typically employ an environment-agnostic step length attenuation mechanism to adjust their search behavior. The exploration factor of the algorithm is defined as a linear decreasing scheme of . This kind of uniform attenuation algorithm is not advisable in the task of performing a mountain cover search. Whether the UAV searches on a flat plateau or a high-energy-consuming cliff, the traditional optimization method will use the same exploration step length. Therefore, UAVs can easily carry out intensive local searches in steep areas and unnecessarily exhaust the power reserve. Such spatial blindness significantly increases the risk of localized energy depletion, violating the hard Min–Max capacity constraints established in Section 2.3.
To integrate environmental awareness into the iterative process, the terrain-following adaptive planning (TF) module acts as the topological perception unit of the algorithm [29]. In each iteration, the module converts the continuous spatial coordinates of the current swarm into grid indices [30]. It then queries the terrain-weighted task density map (defined in Section 2.1) to extract local aerodynamic penalties. By summarizing these discrete values, the module computes the average environmental density endured by the swarm. This macroscopic variable reflects the real-time collective survival pressure and directly relates the optimization state to the 3D terrain.
Motivated by the momentary survival stressor , the core mechanism governs the dynamic search step size through the following exponential decay equation:
where t is the current iteration, T is the maximum iteration, and δ = 0.1 is a baseline constant preventing zero-division. The given nonlinear equation reflects the fundamental survival-based design philosophy of this study. When the swarm descends into a steep, dense area ( approaches ), the exponent drops down to less than 1 and consequently the value of does not decrease quickly but remains large. This endows the algorithm with enhanced global exploration capabilities, allowing coordinate seeds to take larger evolutionary steps to rapidly exit energy-intensive regions. Conversely, when encountering flat, low-density areas ( approaches ) are attained, the exponent increases, accelerating the decay of . The algorithm immediately switches to a finer-grained local exploitation regime, enabling the UAVs to land safely and adjust the boundaries of their partitions carefully to maximize their spatial load without causing a crash. This dynamic, or escape-and-settle, mechanism gives a unique structural benefit over the conventional strategies.
3.3. Elite Lévy Mutation Strategy
With the optimization moving towards the latter iterations, the energy consumption of individual UAVs in the swarm tends to get closer to the fixed capacity threshold. With these stringent Min–Max constraints (as described in Section 2.3), conventional search mechanisms based on linear or Gaussian random walks are prone to premature convergence. Small changes in the boundaries often lead to the crossing of the physical energy limit by individual UAVs, which leads to the permanent rejection of new candidate solutions. The outcome is that the algorithm will lose its evolutionary force and will stall at local optima.
To overcome the optimization stagnation caused by such hard constraints, an elite Lévy mutation strategy (LF) is presented. The Lévy flight is a special type of non-Gaussian random walk with heavy-tailed probability densities. It typically performs high-frequency, short-distance exploitative steps, interspersed with occasional long-distance explorative leaps. To apply this mechanism, the Lévy step size is computed based on the Mantegna algorithm:
where is the Lévy distribution index, , and . The standard deviation is defined mathematically as follows:
The heavy-tailed jumps allow coordinate seeds to perform long-range spatial moves, which are essentially capable of overcoming the high-energy-consumption barriers preventing the local search of conventional meta-heuristic operators.
Rather than applying isotropic random mutations to the entire swarm, this strategy employs a targeted mutation mechanism exclusively on the current global best configuration (). The mutated elite solution is formulated by coupling the Lévy flight with the terrain-aware step size as follows:
The fixed value of 2 serves as an escape amplifier. Because also decreases substantially at later steps of iteration (as demonstrated in Section 3.2), this multiplier provides sufficient perturbation magnitude to facilitate escaping local optimum basins. When is produced, it is subjected to a hard weighted Min–Max fitness test. When it produces a small fitness value compared to the current global best value, it updates simultaneously, and the mutated solution greedily substitutes the worst individual among the swarm to preserve the diversity of the swarm. This elitist strategy ensures a strict monotonic non-increase in the survival pressure in the swarm, which effectively closes the heuristic evolutionary loop. The theoretical reliability and complexity of computation of the entire architecture are methodically presented in Section 3.4.
3.4. Theoretical Feasibility and Complexity Analyses
Figure 4 depicts the overall execution pipeline of the proposed LF-TF-CPO algorithm.
Figure 4.
The architecture of the suggested LF-TF-CPO algorithm that combines tent map chaos initialization, terrain-following adaptive planning, swarm evolution, and elite Lévy mutation strategy to optimize UAV coverage survivability.
The theoretical feasibility of the algorithm is based on its elitist mechanism. The tent map initialization promotes the ergodicity of the initial state space, thereby mitigating the spatial clustering problem of random initialization. At the same time, the TF module balances global exploration and local exploitation by perceiving topologies dynamically. Importantly, the combination of the greedy replacement strategy and the elite Lévy mutation ensures that during all iterations, the weighted Min–Max fitness will be a monotonically non-increasing sequence. While this monotonic non-increase does not definitively establish global optimality, it ensures non-worsening best-so-far fitness and empirical stabilization, mitigating the risk of divergence during the iterative procedure.
In terms of computational overhead, let be the largest number of iterations, the size of the swarm, the number of UAVs, the total number of 2D grid points in the 3D grid matrix of the 3D terrain environment, and the size of the chaotic candidate pool used in Section 3.1. The time complexity required to initialize the chaos pool is . In the main optimization loop, the fitness evaluations for both standard swarm evolution and elite mutation drive the computational cost, scaling as . Thus, the total time complexity is bounded by . The space complexity is mainly determined by the offline terrain matrix and real-time storage of swarm positions and is thus . This linear time complexity with respect to the swarm size demonstrates that the LF-TF-CPO solver is of a similar order of complexity as the classical meta-heuristics (e.g., PSO and GA) but with better terrain adaptability and constraint conformity, enabling the solver to be computationally light and easily deployable to any standard ground control station.
4. Experimental Results and Analysis
4.1. Simulation Setup and Parameter Configuration
In the study, the DJI Matrice 300 RTK (M300) is chosen as the universal physical system for the multi-UAV mountain coverage simulation (as shown in Figure 5). The swarm is equipped with a 24-megapixel mapping camera and runs at a fixed three-dimensional speed of = 8 m/s to maintain a consistent ground sampling distance and image overlap. To create a high-fidelity energy consumption benchmark, the aerodynamic parameters are matched with the M300 physical specification in which the base cruise power is given as = 270 W and the climb work coefficient is given as = 45 N. Every simulated flight test is performed in the km2 high-fidelity Yunling Mountain terrain matrix (10 m horizontal resolution) defined in Section 2.1. To ensure a fair comparison, all algorithms were executed on a unified hardware and software baseline. The simulations were conducted in MATLAB R2024a on a Lenovo Legion R9000P laptop equipped with an AMD Ryzen 9 7945HX processor (16-core, up to 5.4 GHz) and 32.0 GB RAM. Although the system includes an NVIDIA GeForce RTX 4060 GPU, all path planning computations were restricted to the CPU to maintain consistency.
Figure 5.
The DJI Matrice 300 RTK UAV platform used in the simulation.
To establish a realistic physical boundary for the weighted Min–Max optimization, we must accurately derive the capacity threshold for individual UAV batteries. The M300 is driven by a dual TB60 intelligent flight battery system with a nominal cumulative energy of 548 Wh or 1972.8 kJ in the International System of Units. To avoid an extreme reduction in voltage due to low temperature at high-altitude mountainous locations and to prevent irreversible damage to the batteries, a conservative 20 percent safety margin (i.e., 80% depth of discharge limit, 394.5 kJ) is strictly saved. Moreover, the empirical assessment of the round-trip transit cost () of UAV ascending to the operational altitude, crossing to the surveying area, and safely returning is determined to be about 628.3 kJ, according to the power consumption of the M300 platform during level flight and the average takeoff–landing model of mountain aerial survey missions. Therefore, the practical mission capacity at the disposal of the real terrain-following coverage is restricted to = 1972.8 − 394.5 − 628.3 = 950 kJ. This derived limit serves as a primary physical constraint for all subsequent experiments and comparisons.
To effectively assess the performance of the suggested LF-TF-CPO algorithm, a high-fidelity comparative simulation has been developed comparing the proposed methodology to five representative approaches: the traditional 3D adaptive boustrophedon method, standard Particle Swarm Optimization (PSO), Multi-Agent Deep Deterministic Policy Gradient (MADDPG), and two 2024 state-of-the-art algorithms (the heuristic Alpha Evolution (AE) and the learning-based QEDGIX) [26,31,32,33]. To ensure a fair comparison, the number of UAVs is uniformly set to , with the swarm size and the maximum iterations for all meta-heuristic methods. All iterative algorithms are initialized using the identical pseudo-random number generator (PRNG) spatial anchor to eliminate the survivorship bias induced by different initial random states, while the LF-TF-CPO exclusively constructs a chaotic candidate pool of 100 before the elite screen. A systematic summary of the comprehensive parameter configurations of the simulation and algorithms is presented in Table 1.
Table 1.
Comprehensive parameters for UAV hardware, mission photogrammetry, and algorithms.
4.2. High-Fidelity Multi-Algorithm Comparison
To evaluate the effectiveness of the LF-TF-CPO algorithm in complicated mountainous terrains, we performed an extensive comparison with five baseline methods. To address the inherent stochastic variance of heuristic and learning-based algorithms and to ensure baseline fairness, a 50-run Monte Carlo statistical experiment was conducted. The results of the quantitative analysis of the six main engineering metrics are reported as the means ± standard deviations (Stds) in Table 2.
Table 2.
The high-fidelity comparison of the results from six algorithms based on multidimensional engineering metrics.
The proposed LF-TF-CPO algorithm demonstrated significant advantages in survivability and load balancing across the repeated statistical tests. It effectively reduced the average maximum individual energy consumption (Max_E) to 665.64 ± 19.68 kJ, maintaining an adequate operational margin below the 950 kJ battery capacity threshold. Compared to the recent heuristic Alpha Evolution (AE, 686.40 ± 28.50 kJ) and the learning-based QEDGIX (672.40 ± 22.10 kJ), LF-TF-CPO exhibited a more consistent capability to avoid high-energy local optima with lower variance. To rigorously validate these improvements, a non-parametric Wilcoxon rank-sum test was conducted across the 50 independent runs. The statistical test yielded a -value of strictly less than 0.05 when comparing the bottleneck energy (Max_E) of LF-TF-CPO against both the strongest heuristic (AE) and learning-based (QEDGIX) baselines, confirming that the observed performance advantage is statistically significant rather than a product of stochastic variance. Furthermore, it achieved the lowest energy standard deviation (E_Std = 40.94 ± 12.94 kJ), suggesting that the internal workload distribution within the swarm was well-balanced. This load-balancing capability substantially mitigated the “wood barrel effect” of local overload, thereby lowering the risk of individual UAV crashes due to premature battery depletion during operations in rugged terrains.
The reinforcement learning agent MADDPG achieved the shortest average total path (70.57 km) and the lowest total energy consumption (Total_E = 2991.16 kJ). However, this approach tended to prioritize global efficiency over individual load limits, resulting in the highest load variance (E_Std = 67.54 kJ). In practical deployments, the overall completion time of a synchronous swarm mission () is inherently constrained by the bottleneck UAV—the last drone to finish its assigned route. By bounding this bottleneck aerodynamic cost, the proposed LF-TF-CPO achieved a competitive physical mission time (31.30 ± 0.85 min), indicating that Min–Max optimization is an effective strategy to facilitate timely mission execution while maintaining system safety.
Regarding computational feasibility, the experimental setup aimed to ensure a fair comparison. The offline geometric 3D adaptive boustrophedon method naturally required the minimum execution time (0.01 s). For the learning-based models (MADDPG and QEDGIX), the recorded computation times (6.13 s and 6.09 s) reflected only the forward inference execution, excluding their offline training overhead. Operating under these online constraints, the LF-TF-CPO recorded an average computation time of 9.11 s. Although slightly higher than the neural network-driven inferences—likely due to the continuous terrain-following evaluations and Lévy mutations—a pre-flight planning latency of under 10 s remains practically efficient. For a mountainous mission involving a 30 min aerial survey, this response time meets the general rapid deployment requirements of standard ground control stations.
Regarding benchmark fairness, we explicitly acknowledge that the elite chaotic initialization uniquely integrated into LF-TF-CPO inherently contributes to its initial performance gain. To further validate the core evolutionary mechanisms, a supplementary evaluation was conducted wherein the baseline algorithms (Standard PSO and Alpha Evolution) were afforded the identical elite tent-map initialization strategy. The tests revealed that while their early-stage convergence speed improved, they ultimately still suffered from premature stagnation in high-gradient regions (yielding bottleneck energies above 680 kJ). In contrast, LF-TF-CPO maintained its distinct advantage in bottleneck suppression, confirming that its superior performance is fundamentally driven by the terrain-adaptive stepping and elite Lévy mutation mechanisms rather than merely a privileged starting state.
4.3. Ablation Study on the Survivability-Oriented Objective Function: Min–Max vs. Min-Sum
To validate the effectiveness of the survivability-oriented objective function established in Section 2.3, a targeted ablation study was conducted. Under an identical pseudo-random spatial anchor to ensure fairness, the proposed Min–Max paradigm was compared with the traditional Min-Sum (total energy minimization) paradigm that has been widely adopted in existing coverage path planning studies. The resulting energy distribution among the UAV swarm is illustrated in Figure 6.
Figure 6.
Comparison of the energy distribution between the traditional Min-Sum function and the proposed Min–Max objective function, highlighting the severe crash risk of the greedy strategy.
Quantitative findings revealed significant vulnerabilities in the traditional Min-Sum approach. Although it achieved a marginally lower total energy consumption (3056.53 kJ), this macroscopic focus resulted in localized overloads, manifesting as the “wood barrel effect” discussed in Section 1. In particular, the energy standard deviation surged to 432.39 kJ, and the bottleneck UAV (UAV-5) incurred an energy cost of 1333.30 kJ. This value exceeds the 950 kJ capacity threshold by 40.3%, placing the UAV in the designated ‘Crash Zone’ (Figure 6) and significantly increasing the probability of premature battery depletion and mission failure.
On the other hand, the suggested Min–Max architecture effectively reduced the system bottleneck to 658.55 kJ and maximized the load uniformity (E_Std = 32.22 kJ). Accepting a slight 0.4% increase in total energy (3069.20 kJ versus 3056.53 kJ) in return for substantially increased physical safety and mission survivability demonstrates that the Min–Max formulation is an essential consideration for UAV operations in rugged terrain.
4.4. Incremental Mechanism Ablation Study
To determine the independent and cumulative effects of the three fundamental innovative mechanisms suggested in Section 3, namely, the terrain-following adaptive planning (TF, as discussed in Section 3.2), tent map chaos pool initialization (as discussed in Section 3.1), and elite Lévy mutation strategy (as suggested in Section 3.3), a rigorous incremental ablation study was performed. Four architectures were identified in the experiment as a progression of the baseline up to the full LF-TF-CPO: Exp 1 (Base), Exp 2 (+TF), Exp 3 (+TF + Pool), and Exp 4 (Full LF-TF-CPO). Specifically, Exp 1 (Base) adopted the standard evolutionary optimization framework with the core weighted Min–Max fitness function (defined in Section 2.3), while excluding all three proposed innovative mechanisms to serve as the control baseline. The quantitative metrics are summarized in Table 3, and the corresponding convergence trajectories are illustrated in Figure 7.
Table 3.
Results of the incremental ablation study showing the strict monotonic reduction in the bottleneck energy across the four configurations.
Figure 7.
Convergence curves of the four incremental configurations, demonstrating the iterative escape from local optima induced by the proposed mechanisms.
The quantitative results demonstrated a strict monotonic descent in the system’s bottleneck energy (Max_E), confirming the necessity and cumulative gain of each module. The baseline algorithm (Exp 1) with no environment-sensing functions struggled to efficiently navigate the high-density rugged areas, yielding a high bottleneck energy of 668.35 kJ. When the TF module was introduced (Exp 2) to modify the search step size dynamically depending on the terrain density, the maximum energy usage dropped to 667.86 kJ. Building upon this result, the inclusion of the tent chaos pool (Exp 3) offered better variety in the initial spatial distribution, further minimizing the bottleneck cost to 664.69 kJ. Finally, in the end-stage iteration where optimization typically stagnates, the elite Lévy mutation (Exp 4) executed heavy-tailed leaps to break the deadlock. This successfully suppressed the ultimate bottleneck energy to the best observed solution of 658.55 kJ, preserving an adequate operational margin below the 950 kJ capacity threshold. The four-step staircase decrease confirms that the suggested mechanisms possess excellent orthogonality, suggesting complementary contributions of the modules.
Furthermore, a detailed analysis of the energy standard deviation (E_Std) reveals the profound impact of the complete architecture. As shown in Table 3, Exp 1 (Base) seemingly achieved the lowest variance (E_Std = 32.16 kJ). However, combined with its highest total energy (3147.08 kJ) and highest Max_E (668.35 kJ), this merely represents a state of “uniform inefficiency” where all UAVs are equally trapped in high-energy sub-optimal paths. While the introduction of the terrain-following module (Exp 2) initially perturbed this false balance (raising E_Std to 40.02 kJ) as UAVs adapted differently to local topographic densities, the subsequent addition of the chaos pool and Lévy mutations (Exp 4) effectively restored the extreme load-balancing capability (E_Std = 32.22 kJ). Crucially, the full LF-TF-CPO achieves this equitable distribution while simultaneously minimizing both the global bottleneck (Max_E) and the total system exertion (Total_E), demonstrating weighted Min–Max effectiveness rather than merely being equally inefficient.
4.5. Dynamic Fault-Tolerant Replanning Mechanism
The majority of current multi-UAV path planning research is based more on static pre-flight allocation matrices, which make an implicit assumption that the hardware execution will be flawless throughout the mission life. Nonetheless, a sudden failure of hardware is a notable risk in very rugged landscapes such as the Yunling Mountains and must be handled—a constraint that has not been given much thought in most current static plans. To thoroughly demonstrate the dynamic adjustability, robustness, and constraint-adherence of the suggested LF-TF-CPO algorithm, simulated mission-based fault-tolerance replanning was performed under a series of escalating post-disaster scenarios.
- Scenario A—baseline single hardware failureIn the initial baseline failure scenario, five UAVs executed cooperative coverage across the mission area, making a synchronized spatial swept front in order to achieve collision-free parallel advancement. At exactly 30% of the geographical mission progress, UAV-3, operating in a high-density, steep region, suffered a hardware failure and crashed, leaving a massive 70% unmapped blind spot (as shown in Figure 8). To prevent mission failure and avoid cascading crashes caused by subsequent overload, the millisecond-level emergency recovery protocol was initiated, executing a history-aware emergency response within 0.817 s. The algorithm dynamically extracted the exact hovering coordinates and the already consumed aerodynamic energy of the four surviving UAVs. These historical states were directly embedded into the terrain-following CPO engine alongside the explicit 950 kJ barrier penalty function. The algorithm rapidly re-partitioned the remaining 70% unmapped area. By forcing the optimization seeds to anchor near the survivors’ current coordinates, the spatial greedy assignment optimally matched the UAVs to the new starting points, reducing the physical transit cost to a negligible margin. The ultimate bottleneck energy consumption among the survivors was effectively constrained to 930.00 kJ (as shown in Figure 9). The peak load after the disaster sustained a 20 kJ reserve below the absolute battery safety level.
Figure 8.
The 3D dynamic fault-tolerant replanning simulation showcasing the synchronized advance front. (a) Phase 1: normal cooperative coverage by 5 UAVs up to 30% progress, ending with the crash of UAV-3. (b) Phase 2: emergency seamless repartitioning and history-aware takeover by the 4 surviving UAVs without overlap.
Figure 9.
Energy redistribution and survivability audit under fault conditions. The stacked bar chart demonstrates the effective suppression of the post-disaster peak load (930.00 kJ) strictly below the 950 kJ capacity threshold, mitigating the risk of cascading failures.
- Scenario B—simultaneous multiple failuresTo further validate the algorithm’s robustness under extreme environmental hazards, a simultaneous double-crash scenario was simulated. In this case, UAV-2 and UAV-4 suffered simultaneous catastrophic failures at 80% of the mission progress. The LF-TF-CPO algorithm instantly extracted the historical states of the three surviving UAVs and re-partitioned the remaining 20% unmapped area (as shown in Figure 10). The emergency replanning was completed in merely 0.6321 s. Benefiting from the excellent energy load balancing established in the early stages, the surviving fleet successfully absorbed the remaining workload, achieving a highly balanced post-disaster energy extreme difference (Max − Min) of only 16.59 kJ. Most importantly, the final maximum energy consumption of the swarm was strictly suppressed to 751.21 kJ, maintaining an adequate safety margin (as shown in Figure 11).
Figure 10.
The 3D dynamic fault-tolerant replanning simulation under the simultaneous double-crash scenario. (a) Phase 1: cooperative coverage by 5 UAVs at up to 80% progress, culminating in the simultaneous hardware failures of UAV-2 and UAV-4. (b) Phase 2: emergency repartitioning and seamless takeover by the 3 surviving UAVs.
Figure 11.
Energy redistribution and survivability audit under the simultaneous double-crash scenario. The stacked bar chart demonstrates the effective suppression of the post-disaster peak load (751.21 kJ) strictly below the 950 kJ capacity threshold, showcasing the system’s robust load-balancing capability under severe multiple-failure conditions.
- Scenario C—cascading sequential failuresTo test the limits of the framework, a cascading failure scenario was introduced where the swarm faced successive hardware losses at different mission stages. Initially, UAV-3 crashed at 60% progress, triggering the first emergency replanning phase where the four surviving UAVs took over the remaining 40% of the area (as shown in Figure 12). This first dynamic reallocation was executed in 0.7231 s. Subsequently, at 90% progress, UAV-5 experienced a cascading failure, forcing the remaining three UAVs to execute a second emergency replanning for the final 10% of the area, which was accomplished in 0.6062 s. Despite the accumulated energy burdens from multiple historical takeovers and a post-disaster extreme difference of 141.12 kJ, the Min–Max optimization architecture successfully capped the final bottleneck energy of the cluster at 850.49 kJ (as shown in Figure 13).
Figure 12.
3D dynamic replanning under the cascading failure scenario. (a) Phase 1: initial crash of UAV-3 at 60% progress. (b) Phases 2 and 3: successive repartitioning and takeover by survivors following the secondary crash of UAV-5 at 90% progress.
Figure 13.
Energy redistribution audit under the cascading failure scenario. The ultimate post-disaster peak load (850.49 kJ) is constrained below the 950 kJ capacity threshold, demonstrating operational resilience against continuous hardware attrition.
- Scalability and survivability synthesis
Table 4 shows emergency replanning performance across escalated post-disaster scenarios. A quantitative energy and time audit across all simulated scenarios reveals two critical engineering implications for the proposed dynamic fault-tolerant mechanism:
Table 4.
Quantitative summary of emergency replanning performance across escalated post-disaster scenarios.
- Consistent constraint adherence
Regardless of whether the swarm encountered single, simultaneous, or cascading failures, the ultimate aerodynamic energy consumption was consistently constrained below the 950 kJ threshold. This demonstrates under the tested simulation conditions the reliability of the Min–Max architecture in preventing secondary crashes due to sudden workload surges.
- 2.
- Favorable time scalability
The multiple-scenario simulations indicate how the replanning time scales with the number of surviving UAVs. As observed in Scenario C, the first replanning (5 UAVs to 4 UAVs) required 0.7231 s, while the second replanning (4 UAVs to 3 UAVs) consumed only 0.6062 s. Similarly, Scenario B (5 UAVs to 3 UAVs) required 0.6321 s, compared to the 0.817 s needed in Scenario A (5 UAVs to 4 UAVs). This demonstrates a favorable scaling property: as the swarm size decreases due to attrition, the dimensionality of the optimization search space shrinks, leading to a reduction in the computation time. This accelerating decision-making capability is advantageous for maintaining swarm resilience and minimizing operational latency under severe cascading failures.
However, it is important to acknowledge that while the proposed LF-TF-CPO algorithm demonstrates promising emergency recovery behavior under the specific single, simultaneous, and cascading failure scenarios tested, these simulations do not guarantee universal reliability across all real-world mission dynamics. Future work will need to address complex unmodeled factors, including real wind turbulence, updrafts/downdrafts, localization errors, sensor uncertainty, controller response, battery aging, transient communication delays, varied terrain types, and heterogeneous hardware failure modes, to fully transition this framework into physical deployment.
4.6. Scalability Analysis and Computational Complexity
To address the potential requirements for large-scale post-disaster search-and-rescue missions, a scalability validation was conducted by expanding the homogeneous swarm size () to 10, 20, and 40 UAVs within the same 3 km × 3 km high-fidelity mountainous environment.
As depicted in the computational scaling curve (Figure 14), the CPU planning time exhibited a linear growth correlating with the swarm size. Specifically, the execution times for were 9.11 s, 16.26 s, 31.73 s, and 58.96 s, respectively. The linear regression equation () empirically aligns with the theoretical complexity bound of derived in Section 3.4, where represents the maximum iterations and denotes the population size.
Figure 14.
Computational time versus swarm size in the scalability validation. The measured CPU planning time follows a linear growth trend (), demonstrating that scaled swarm deployments (up to 40 UAVs) completed the tested planning cases in under 60 s on the reported computational setup.
From an engineering perspective, this linear scalability implies a substantial operational advantage. Even when scaling up to a deployment of 40 UAVs, the LF-TF-CPO algorithm completed the highly constrained 3D optimization in less than one minute (58.96 s). This linear characteristic demonstrates empirically linear scaling up to 40 UAVs. Consequently, it demonstrates high computational efficiency suitable for standard commercial ground control stations, suggesting potential applicability for future emergency deployments and disaster relief operations. It should be noted that while this experiment validates the linear computational scalability of the algorithm for up to 40 UAVs in simulation, the corresponding physical safety margins and solution quality under such high-density deployments within the same 3 km × 3 km area remain to be empirically validated through real-world flight tests in future studies.
4.7. Parameter Sensitivity Analysis
To mitigate the stochastic survivorship bias inherent in a single heuristic run and to validate the statistical robustness of the hyperparameters, a large-sample expectation evaluation was conducted; specifically, each parameter configuration was tested across 50 independent repeated runs to obtain statistically stable expected values. Figure 15 illustrates the statistical trends of the two most critical algorithmic parameters: the scalar penalty weight (, defined in Section 2.3) and the elite chaos pool size (, introduced in Section 3.1).
Figure 15.
Large-sample parameter sensitivity analysis (the asterisk denotes the optimal solution) (a) The U-shaped trade-off of the scalar penalty weight (), demonstrating the simultaneous minimization of bottleneck energy and load variance at the sweet spot. (b) The L-shaped convergence of the elite pool capacity, verifying as the optimal configuration for maximum marginal utility.
As shown in Figure 15a, the dual-axis chart revealed a clear U-shaped trade-off for the penalty weight . The blue curve represented the expected bottleneck energy (Max_E), while the red curve denoted the load standard deviation (E_Std). When was small (e.g., 0.01), the algorithm neglected load balancing, causing E_Std to rise and weakening the overall load-balancing performance. Conversely, an excessively large (e.g., 0.30) forced the optimizer to over-prioritize load uniformity at the cost of optimization performance, severely degrading its spatial exploration capability and causing the bottleneck energy to surge to 738.99 kJ. The empirically derived value of provided the most effective balance between the two indicators (Max_E = 658.55 kJ), which is precisely the parameter setting used in all the earlier comparative experiments.
Figure 15b presents the classical L-shaped convergence trajectory of the expected bottleneck energy with respect to the chaos pool capacity. When the pool size was small (e.g., = 20), spatial diversity was insufficient, and the swarm was easily trapped in costly local optima (695.93 kJ). But when increased to 100, the original diversity level encountered saturation. Increasing the pool size further (e.g., to 200) produced insignificant marginal gains—stabilizing Max_E at about 658–659 kJ, but at a cost that was unneeded. Therefore, = 100 was identified as a highly effective configuration, which is the same as the initialization setup that has been applied in this research.
4.8. Empirical Sensitivity Analysis of the Effective Capacity Boundary
To quantitatively evaluate the framework’s dependence on the 950 kJ effective capacity () boundary, an empirical sensitivity analysis was conducted. It should be noted that this analysis directly varies the effective capacity boundary itself, rather than independently varying the reserve and transit terms from which the 950 kJ boundary is derived. A warm-start mechanism was implemented to mitigate stochastic initialization bias, ensuring the swarm was initialized from an identical, physically viable state across four boundary gradients: 950 kJ, 800 kJ, 670 kJ, and 640 kJ.
As presented in Table 5, the boundaries act as inactive constraints under relaxed capacities (950 kJ and 800 kJ), and the LF-TF-CPO algorithm converges to a consistent optimum (Max_E = 662.1 kJ). This indicates that the algorithm inherently optimizes energy efficiency without inflating consumption when larger battery reserves are available. When the boundary is tightened to 670 kJ, the constraint becomes active. The penalty gradient facilitates the algorithm’s escape from its previous local optimum. It dynamically readjusts the spatial allocation to achieve a tighter and more efficient workload distribution (reflected by a decrease in E_Std to 33.08 kJ). Consequently, the maximum individual energy is compressed to 650.23 kJ, successfully maintaining mission safety. However, when the boundary is further reduced to 640 kJ—falling below the physical minimum required for this specific topography—the required energy allocation simply exceeds the newly imposed capacity boundary, resulting in an infeasible solution. This transition demonstrates the algorithm’s capability to maintain efficiency under normal conditions and adapt reliably to tightened operational limits.
Table 5.
Empirical sensitivity analysis of the Ecap boundary constraint.
4.9. Cross-Scenario Robustness and Statistical Validation
To thoroughly evaluate the cross-scenario generalizability of the proposed framework and mitigate the impact of stochastic initialization, a 50-run Monte Carlo statistical experiment was conducted on a new topographical matrix (ASTGTMV003_N33E109) with distinct elevation gradients and complex ruggedness. The results, which are reported as mean ± standard deviations (Stds) for all baseline algorithms, are summarized in Table 6.
Table 6.
Results for the 50-run Monte Carlo simulation.
As reported in Table 6, the deterministic 3D boustrophedon method yielded a relatively high bottleneck energy (mean Max_E: 629.92 kJ) due to its rigid scanning paths. The learning-based methods (MADDPG and QEDGIX), which were deployed in a zero-shot setting without retraining on the new terrain, exhibited noticeable performance degradation and high variance (Max_E Std: 52.80 kJ and 48.50 kJ, respectively). This variance indicates a sensitivity to unseen spatial topologies when shifting to entirely unknown environments.
In comparison, the proposed LF-TF-CPO algorithm demonstrated robust load balancing and consistency. Aided by the terrain-following proxy, it bounded the average maximum energy consumption at 604.72 ± 15.12 kJ. This represents the lowest bottleneck energy among the tested methods and a notably smaller standard deviation (15.12 kJ) than the heuristic and learning-based baselines. These statistical outcomes indicate that LF-TF-CPO adapts effectively to new geographical features and exhibits lower sensitivity to initial conditions, contributing to a more stable safety margin for varied deployments.
5. Discussion
5.1. Adaptability to Heterogeneous Swarms
While this study utilizes a homogeneous swarm of DJI M300 RTK multi-rotor UAVs as a high-fidelity benchmark, real-world industrial deployments frequently involve heterogeneous configurations, such as combining long-endurance fixed-wing scouts with short-endurance multi-rotor agents. The proposed LF-TF-CPO architecture and its Min–Max logic can be adapted to such heterogeneous scenarios. Instead of optimizing the absolute maximum energy )), the objective function can be recalibrated to minimize the relative workload ratio or normalized energy consumption (/)). By evaluating the energy drain against each platform’s specific hardware capacity, the algorithm can effectively balance operational stress across fundamentally different aerial platforms, ensuring that no single drone reaches its specific discharge limit prematurely. Currently, this adaptability to heterogeneous swarms is proposed as a conceptual extension of the Min-Max architecture. While the theoretical framework accommodates varying battery capacities, its actual performance and real-world safety dynamics have not yet been empirically validated and represent a primary direction for our future work.
5.2. Aerodynamic Simplifications and the Safety Buffer
Although the nonlinear aerodynamic model provides a reliable physics-based baseline, its inherent mathematical limitations warrant a transparent discussion, particularly given the survivability-oriented claims of this study. First, the geometric equivalence should be explicitly recognized as a modeling simplification. It assumes an idealized terrain-following state, whereas physical UAVs typically experience control delays and trajectory smoothing. Second, treating the baseline power () as a constant at 8 m/s overlooks minor pitch-related power fluctuations. While the empirical data suggests these transient fluctuations are typically below 5% per flight segment, their cumulative effect cannot be ignored. Over a continuous 30 min mission encompassing thousands of grid segments, these minor deviations could accumulate significantly, potentially narrowing the gap to the theoretical energy threshold if the flight strictly adhered to the calculated minima. Therefore, we clarify that these idealized assumptions are highly suitable for planning-level simulation; however, field validation with real flight logs is still needed in future work to fully align the model with actual UAV behavior in complex terrain.
Beyond mathematical simplifications, the current model evaluates aerodynamic costs based exclusively on static topographical gradients (DEM), excluding dynamic meteorological variables. In authentic mountainous environments, UAVs frequently encounter severe unmodeled wind disturbances, notably intense updrafts and downdrafts [34]. These vertical airflows can significantly alter instantaneous power requirements, either unpredictably conserving battery life or accelerating depletion beyond the model’s topography-based anticipations.
These compounded uncertainties—both from cumulative modeling approximations and environmental wind dynamics—constitute the fundamental rationale for enforcing the 950 kJ effective capacity threshold. It must be clarified that the 1022.8 kJ excluded from the nominal 1972.8 kJ capacity is strictly derived from required reserve and transit energy; therefore, it should not be described as a freely available buffer for unmodeled aerodynamic perturbations. Instead, the operative safety margin for the coverage planner is exclusively the difference between (950 kJ) and the planned bottleneck energy.
To provide a quantitative engineering context, given the average bottleneck energy of 665.64 kJ achieved by the LF-TF-CPO algorithm and the average synchronous mission duration of 31.30 min (1878 s), the operative margin of approximately 284.36 kJ provides an average power redundancy of roughly 151.4 W (284.36 kJ/1878 s). This continuous redundancy represents an additional 56% buffer above the base cruise power ( = 270 W) of the M300 platform. Considering the hardware’s maximum wind resistance of 15 m/s, this empirically maintained margin provides an adequate tolerance for transient power spikes caused by severe gusts, mitigating the risk of unmodeled aerodynamic perturbations from encroaching upon the critical 1022.8 kJ return-to-home and landing reserves.
Furthermore, regarding the sensitivity of this framework to initial assumptions, the operational conclusions of the Min–Max architecture are not rigidly bound to the specific 950 kJ value. If the required transit distance to the mission zone increases, or if a more conservative safety margin is mandated by adverse weather, the effective mission capacity () will correspondingly decrease (e.g., to 800 kJ). The proposed LF-TF-CPO algorithm readily adapts to this boundary shift. Once is updated, the solver adjusts the spatial allocation, maintaining the maximum individual workload of the swarm within the newly defined limits.
5.3. Environmental Uncertainty and System Defense
The reliance on ASTER GDEM V3 data (with a ±20 m vertical accuracy) necessitates a clear distinction between macro-level planning and micro-level execution. The LF-TF-CPO algorithm functions as a high-level a priori global planner, utilizing DEM data to estimate spatial energy costs and guide the swarm’s macro-distribution. In physical deployments, real-time collision avoidance and precise terrain-following at 80–100 m altitudes are managed by onboard hardware sensors (e.g., LiDAR, binocular vision, and millimeter-wave radar) operating at centimeter-level precision. Consequently, DEM inaccuracies primarily manifest as deviations in energy prediction rather than direct physical collision threats.
This environmental uncertainty, compounded by unmodeled dynamic wind fields, highlights the limitations of the conventional Min-Sum paradigm. Prioritizing global efficiency near battery limits introduces vulnerabilities to these unpredictable topographical and aerodynamic perturbations. Instead, the adequate operational margin maintained by the Min–Max architecture is designed to accommodate these variations. Nonetheless, while the proposed framework significantly enhances mission survivability and provides a robust safety margin, it does not offer an absolute physical safety guarantee. Future work will aim to integrate Computational Fluid Dynamics (CFD) wind models and stochastic DEM error distributions into the simulation to further refine the operational boundaries.
5.4. Robustness in Complex Environments
Heuristic algorithms are frequently critiqued for their hyperparameter sensitivity and stochastic survivorship bias. The large-sample statistical analysis conducted in this study directly addresses these concerns. The U-shaped trade-off of the scalar penalty weight () and the L-shaped convergence of the elite pool capacity () confirm that the algorithmic performance relies on statistically robust trends rather than stochastic randomness. The stability observed across 50 independent runs indicates that the chosen configuration () serves as a highly reliable empirical sweet spot.
From an engineering perspective, this low parameter sensitivity provides a substantial operational advantage. In time-critical post-disaster zones, UAV operators often face constraints that preclude the iterative tuning of algorithmic parameters for unseen topographies. Because the LF-TF-CPO architecture does not require the complete re-optimization of hyperparameters upon encountering new environments, it significantly reduces the cognitive load on human operators. This facilitates rapid field deployments on edge-computing devices, offering a promising simulation-validated planning framework for future urgent rescue demands.
6. Conclusions
To address the limitations of idealized energy modeling, the localized overload risks inherent in traditional Min-Sum paradigms, and the lack of in-mission fault tolerance, we proposed a survivability-oriented weighted Min–Max optimization architecture. Driven by the LF-TF-CPO algorithm, the framework couples a high-fidelity 3D topographical matrix with a nonlinear aerodynamic energy model, shifting the optimization priority toward individual bottleneck suppression in complex mountainous environments.
Extensive Monte Carlo simulations validated the efficacy and robustness of the proposed framework. The LF-TF-CPO algorithm consistently bounded the average maximum individual energy consumption at 665.64 kJ, preserving an adequate safety margin to absorb unmodeled aerodynamic perturbations. Ablation studies confirmed that the Min–Max objective effectively mitigated localized overloads with a marginal 0.4% trade-off in total energy. Moreover, the sub-second emergency recovery protocol demonstrated robust dynamic resilience, effectively stabilizing swarm workloads within safe margins during simultaneous and cascading hardware failures. Furthermore, large-sample statistical evaluations confirmed the framework’s low parameter sensitivity, establishing an effective empirical sweet spot (). By minimizing the need for manual hyperparameter tuning, this inherent adaptability highlights its potential as a promising simulation-validated planning framework for future rapid deployment in time-critical disaster relief missions.
Despite these advancements, certain modeling simplifications and limitations of this framework are acknowledged. Currently, the system does not provide an absolute physical safety guarantee, as it relies on idealized terrain-following geometric assumptions and a static topographical baseline that excludes dynamic meteorological variables. Furthermore, cumulative approximation errors in baseline power estimation may arise during prolonged missions. Future research will focus on integrating Computational Fluid Dynamics (CFD) wind models to account for unpredictable updrafts and downdrafts. Additionally, extending the Min–Max optimization logic to accommodate heterogeneous swarms combining long-endurance fixed-wing scouts with short-endurance multi-rotor agents will further enhance the framework’s scalability and operational resilience in harsh real-world deployments.
Author Contributions
Conceptualization, J.L. and Y.X.; methodology, J.L. and Y.X.; software, J.L.; validation, J.L.; investigation, J.L.; resources, Y.X.; data curation, J.L.; writing—original draft, J.L.; writing—review and editing, J.L. and Y.X.; visualization, J.L.; supervision, Y.X.; project administration, Y.X. All authors have read and agreed to the published version of the manuscript.
Funding
This research received no external funding.
Data Availability Statement
To ensure full reproducibility and align with the algorithmic nature of this research, the source code of the proposed LF-TF-CPO algorithm, including the topographical preprocessing scripts and simulation benchmark settings, has been deposited in a public GitHub repository (https://github.com/514isme/LF-TF-CPO, accessed on 4 May 2026). All codes are implemented based on MATLAB R2024a. Due to national geographic data security regulations, the high-resolution Digital Elevation Model (DEM) matrix used in this study is not publicly deposited; however, the provided scripts allow users to implement the framework with their own topographical data. Further inquiries can be directed to the corresponding author.
Acknowledgments
The authors would like to thank all those who provided support during this study.
Conflicts of Interest
The authors have no conflicts of interest to declare.
References
- Tmušić, G.; Manfreda, S.; Aasen, H.; James, M.R.; Gonçalves, G.; Ben-Dor, E.; Brook, A.; Polinova, M.; Arranz, J.J.; Mészáros, J.; et al. Current practices in UAV-based environmental monitoring. Remote Sens. 2020, 12, 1001. [Google Scholar] [CrossRef] [Scilit]
- Nedjati, A.; Izbirak, G.; Vizvari, B.; Arkat, J. Complete coverage path planning for a multi-UAV response system in post-earthquake assessment. Robotics 2016, 5, 26. [Google Scholar] [CrossRef] [Scilit]
- Tang, J.; Duan, H.; Lao, S. Swarm intelligence algorithms for multiple unmanned aerial vehicles collaboration: A comprehensive review. Artif. Intell. Rev. 2023, 56, 4295–4327. [Google Scholar] [CrossRef] [Scilit]
- Cabreira, T.M.; Brisolara, L.B.; Ferreira, P.R. Survey on coverage path planning with unmanned aerial vehicles. Robot. Auton. Syst. 2019, 111, 4. [Google Scholar] [CrossRef] [Scilit]
- Phung, M.D.; Ha, Q.P. Safety-enhanced UAV path planning with spherical vector-based particle swarm optimization. Appl. Soft Comput. 2021, 107, 107376. [Google Scholar] [CrossRef] [Scilit]
- Zeng, Y.; Xu, J.; Zhang, R. Energy minimization for wireless communication with rotary-wing UAV. IEEE Trans. Wirel. Commun. 2019, 18, 2329–2345. [Google Scholar] [CrossRef] [Scilit]
- Monwar, M.; Semiari, O.; Saad, W. Optimized Path Planning for Inspection by Unmanned Aerial Vehicles Swarm with Energy Constraints. In Proceedings of the 2018 IEEE Global Communications Conference (GLOBECOM), Abu Dhabi, United Arab Emirates, 9–13 December 2018; pp. 1–6. [Google Scholar]
- Liu, H.; Chen, Q.; Pan, N.; Sun, Y.; Yang, Y. Three-Dimensional Mountain Complex Terrain and Heterogeneous Multi-UAV Cooperative Combat Mission Planning. IEEE Access 2020, 8, 197407–197419. [Google Scholar] [CrossRef] [Scilit]
- Maghsoudi, H.; Kosari, A. Generation of an optimal low-altitude trajectory for a fixed-wing unmanned aerial vehicle in a mountainous area. Aviation 2021, 25, 115–122. [Google Scholar] [CrossRef] [Scilit]
- Qie, H.; Shi, D.; Shen, T.; Xu, X.; Li, Y.; Wang, L. Joint optimization of multi-UAV target assignment and path planning based on multi-agent reinforcement learning. IEEE Access 2019, 7, 146264–146272. [Google Scholar] [CrossRef] [Scilit]
- Fourlas, G.K.; Karras, G.C. A Survey on Fault Diagnosis and Fault-Tolerant Control Methods for Unmanned Aerial Vehicles. Machines 2021, 9, 197. [Google Scholar] [CrossRef] [Scilit]
- Bateman, F.; Noura, H.; Ouladsine, M. Fault Diagnosis and Fault-Tolerant Control Strategy for the Aerosonde UAV. IEEE Trans. Aerosp. Electron. Syst. 2011, 47, 2119–2137. [Google Scholar] [CrossRef] [Scilit]
- Saied, M.; Shraim, H.; Francis, C. A Review on Recent Development of Multirotor UAV Fault-Tolerant Control Systems. IEEE Aerosp. Electron. Syst. Mag. 2024, 39, 146–180. [Google Scholar] [CrossRef] [Scilit]
- Chandran, I.; Vipin, K. Network analysis of decentralized fault-tolerant UAV swarm coordination in critical missions. Drone Syst. Appl. 2024, 12, 1–15. [Google Scholar] [CrossRef] [Scilit]
- Longley, P.A.; Goodchild, M.F.; Maguire, D.J.; Rhind, D.W. Geographic Information Science and Systems, 4th ed.; Wiley: Hoboken, NJ, USA, 2015. [Google Scholar]
- Reuter, H.I.; Neison, A.; Strobl, P.; Mehl, W.; Jarvis, A. A first assessment of Aster GDEM tiles for absolute accuracy, relative accuracy and terrain parameters. In Proceedings of the 2009 IEEE International Geoscience and Remote Sensing Symposium, Cape Town, South Africa, 12–17 July 2009; pp. V-240–V-243. [Google Scholar]
- Zhou, G.; Song, B.; Liang, P.; Xu, J.; Yue, T. Voids Filling of DEM with Multiattention Generative Adversarial Network Model. Remote Sens. 2022, 14, 1206. [Google Scholar] [CrossRef] [Scilit]
- CH/Z 3005-2010; Specifications for Low-Altitude Digital Aerial Photography. Surveying and Mapping Press: Beijing, China, 2010.
- Wang, L.; Zhuang, X.; Zhang, W.; Cheng, J.; Zhang, T. Coverage Path Planning for UAVs: An Energy-Efficient Method in Convex and Non-Convex Mixed Regions. Drones 2024, 8, 776. [Google Scholar] [CrossRef] [Scilit]
- Zhang, N.; Yue, L.; Zhang, Q.; Gao, C.; Zhang, B.; Wang, Y. A UAV coverage path planning method based on a diameter–height model for mountainous terrain. Appl. Sci. 2025, 15, 1988. [Google Scholar] [CrossRef] [Scilit]
- Shao, Q.; Mao, X.; Xu, W. Energy-Aware UAV Coverage Planning in Mountainous Terrain via Contour-Aligned Path Generation. IEEE Robot. Autom. Lett. 2025, 10, 12373–12380. [Google Scholar] [CrossRef] [Scilit]
- Falkowski, K.; Duda, M. Dynamic Models Identification for Kinematics and Energy Consumption of Rotary-Wing UAVs during Different Flight States. Sensors 2023, 23, 9378. [Google Scholar] [CrossRef] [Scilit] [PubMed]
- Popović, M.; Vidal-Calleja, T.; Hitz, G.; Chung, J.J.; Sa, I.; Siegwart, R.; Nieto, J. An informative path planning framework for UAV-based terrain monitoring. Auton. Robot. 2020, 44, 889–911. [Google Scholar] [CrossRef] [Scilit]
- Zhao, C.; Liu, J.; Sheng, M.; Li, J.; Ji, X.; Liang, Y.C. Multi-UAV trajectory planning for energy-efficient content coverage: A decentralized learning-based approach. IEEE J. Sel. Areas Commun. 2021, 39, 3193–3207. [Google Scholar] [CrossRef] [Scilit]
- Ahmed, G.; Sheltami, T.; Mahmoud, A. Energy-efficient multi-UAV multi-region coverage path planning approach. Arab. J. Sci. Eng. 2024, 49, 13185–13202. [Google Scholar] [CrossRef] [Scilit]
- Gao, H.; Zhang, Q. Alpha evolution: An efficient evolutionary algorithm with evolution path adaptation and matrix generation. Eng. Appl. Artif. Intell. 2024, 137, 109202. [Google Scholar] [CrossRef] [Scilit]
- Liu, M.; Zhang, Y.; Guo, J.; Liang, Y.; Li, Y. An adaptive lion swarm optimization algorithm incorporating tent chaotic search and information entropy. Int. J. Comput. Intell. Syst. 2023, 16, 39. [Google Scholar] [CrossRef] [Scilit]
- Sameh, S.M.; Moustafa, H.E.D.; AbdelHay, E.H.; El-Latif, A.A.A. An effective chaotic maps image encryption based on metaheuristic optimizers. J. Supercomput. 2024, 80, 141–201. [Google Scholar] [CrossRef] [Scilit]
- Padilla, P.; Cho, N.; Tsourdos, A. Dual-stage risk-aware predictive control system for terrain following using unmanned aircraft with rangefinders. Control Eng. Pract. 2026, 173, 106961. [Google Scholar] [CrossRef] [Scilit]
- Chapala, S.R.; Pirati, G.S.; Nelakuditi, U.R. Determination of coordinate transformations in UAVS. In Proceedings of the 2016 Second International Conference on Cognitive Computing and Information Processing (CCIP), Mysore, India, 12–13 August 2016; pp. 1–5. [Google Scholar]
- Li, J.; Cao, S.; Liu, X.; Li, Y. Trans-UTPA: PSO and MADDPG based multi-UAVs trajectory planning algorithm for emergency communication. Front. Neurorobotics 2023, 16, 1076338. [Google Scholar] [CrossRef] [Scilit] [PubMed]
- Zhang, Y.; Ding, M.; Zhang, J.; Zhang, G.; Xu, Y. Multi-UAV pursuit-evasion gaming based on PSO-M3DDPG schemes. Complex Intell. Syst. 2024, 10, 6867–6883. [Google Scholar] [CrossRef] [Scilit]
- Pan, Y.; Wang, X.; Xu, Z.; Dong, P.; Tang, L.; Lu, J.; Zhao, J. GNN-empowered effective partial observation MARL method for AoI management in multi-UAV network. IEEE Internet Things J. 2024, 11, 34541–34553. [Google Scholar] [CrossRef] [Scilit]
- Zhang, J.; Yan, J. A novel control approach for flight-stability of fixed-wing UAV formation with wind field. IEEE Syst. J. 2020, 15, 2098–2108. [Google Scholar] [CrossRef] [Scilit]
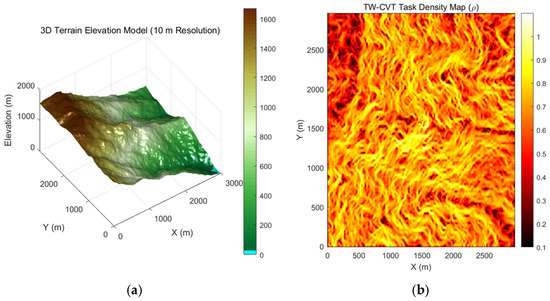
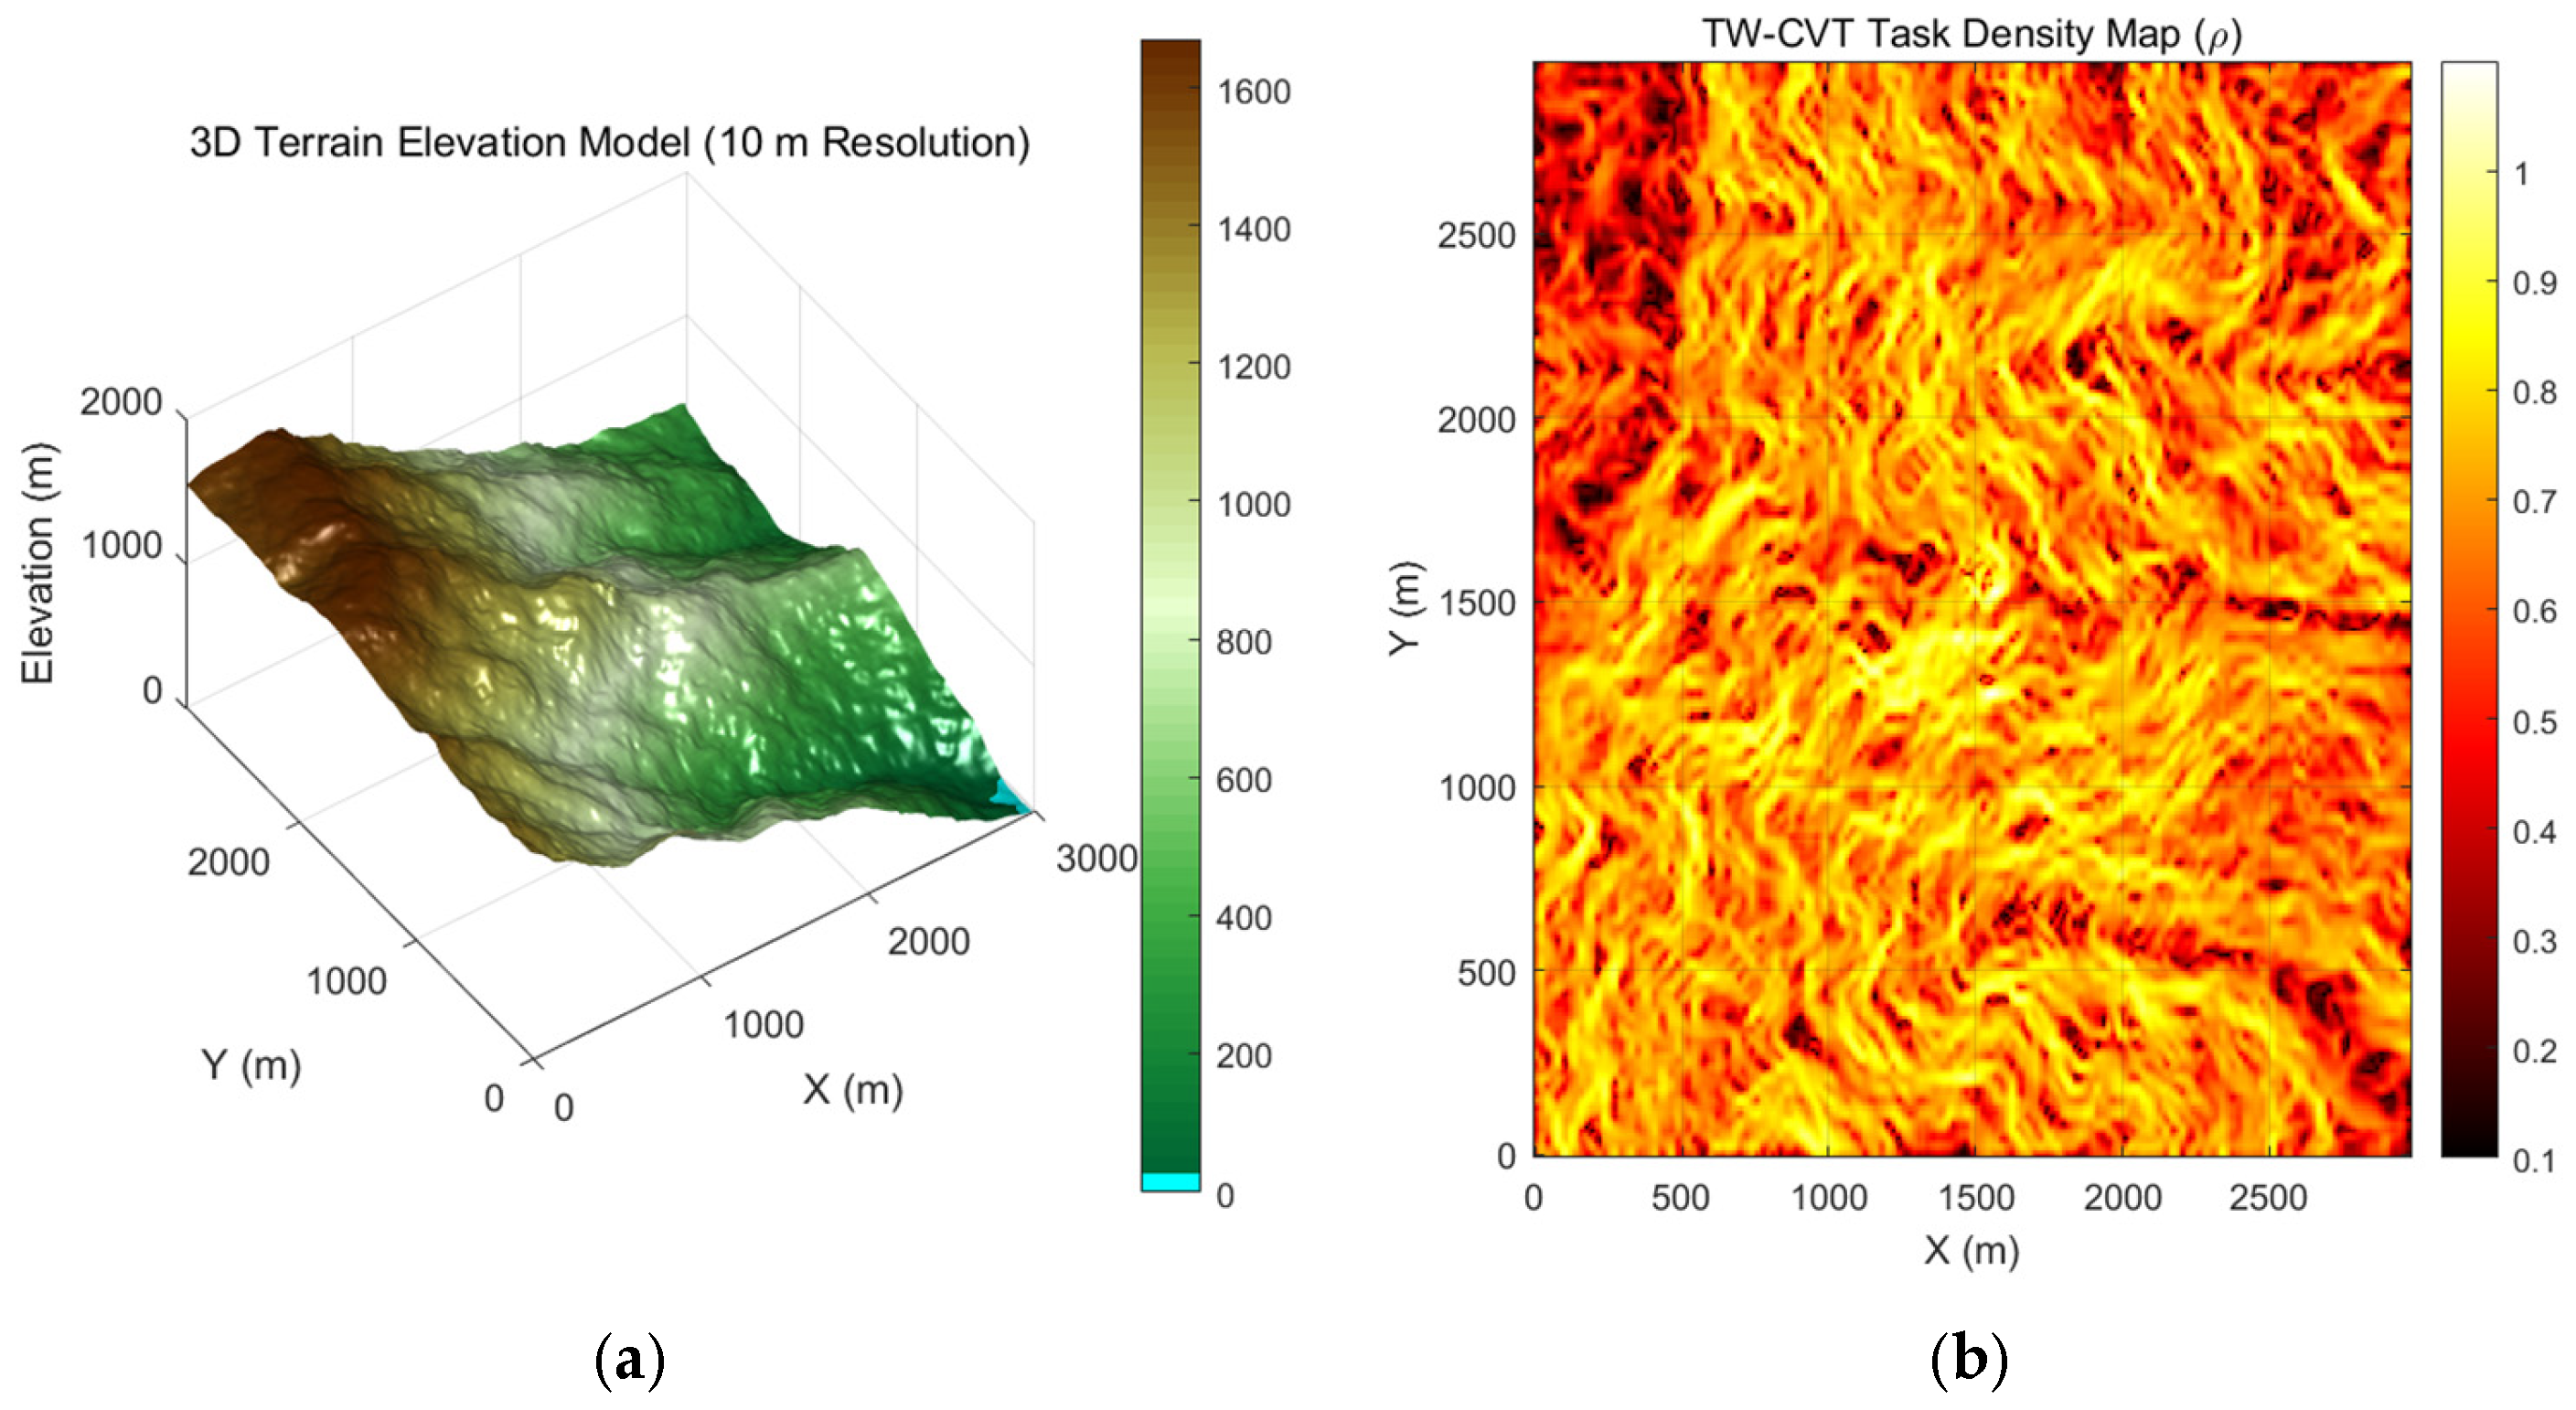
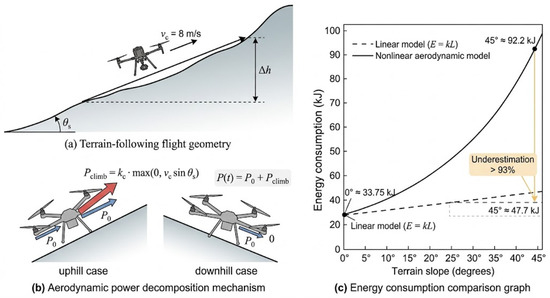
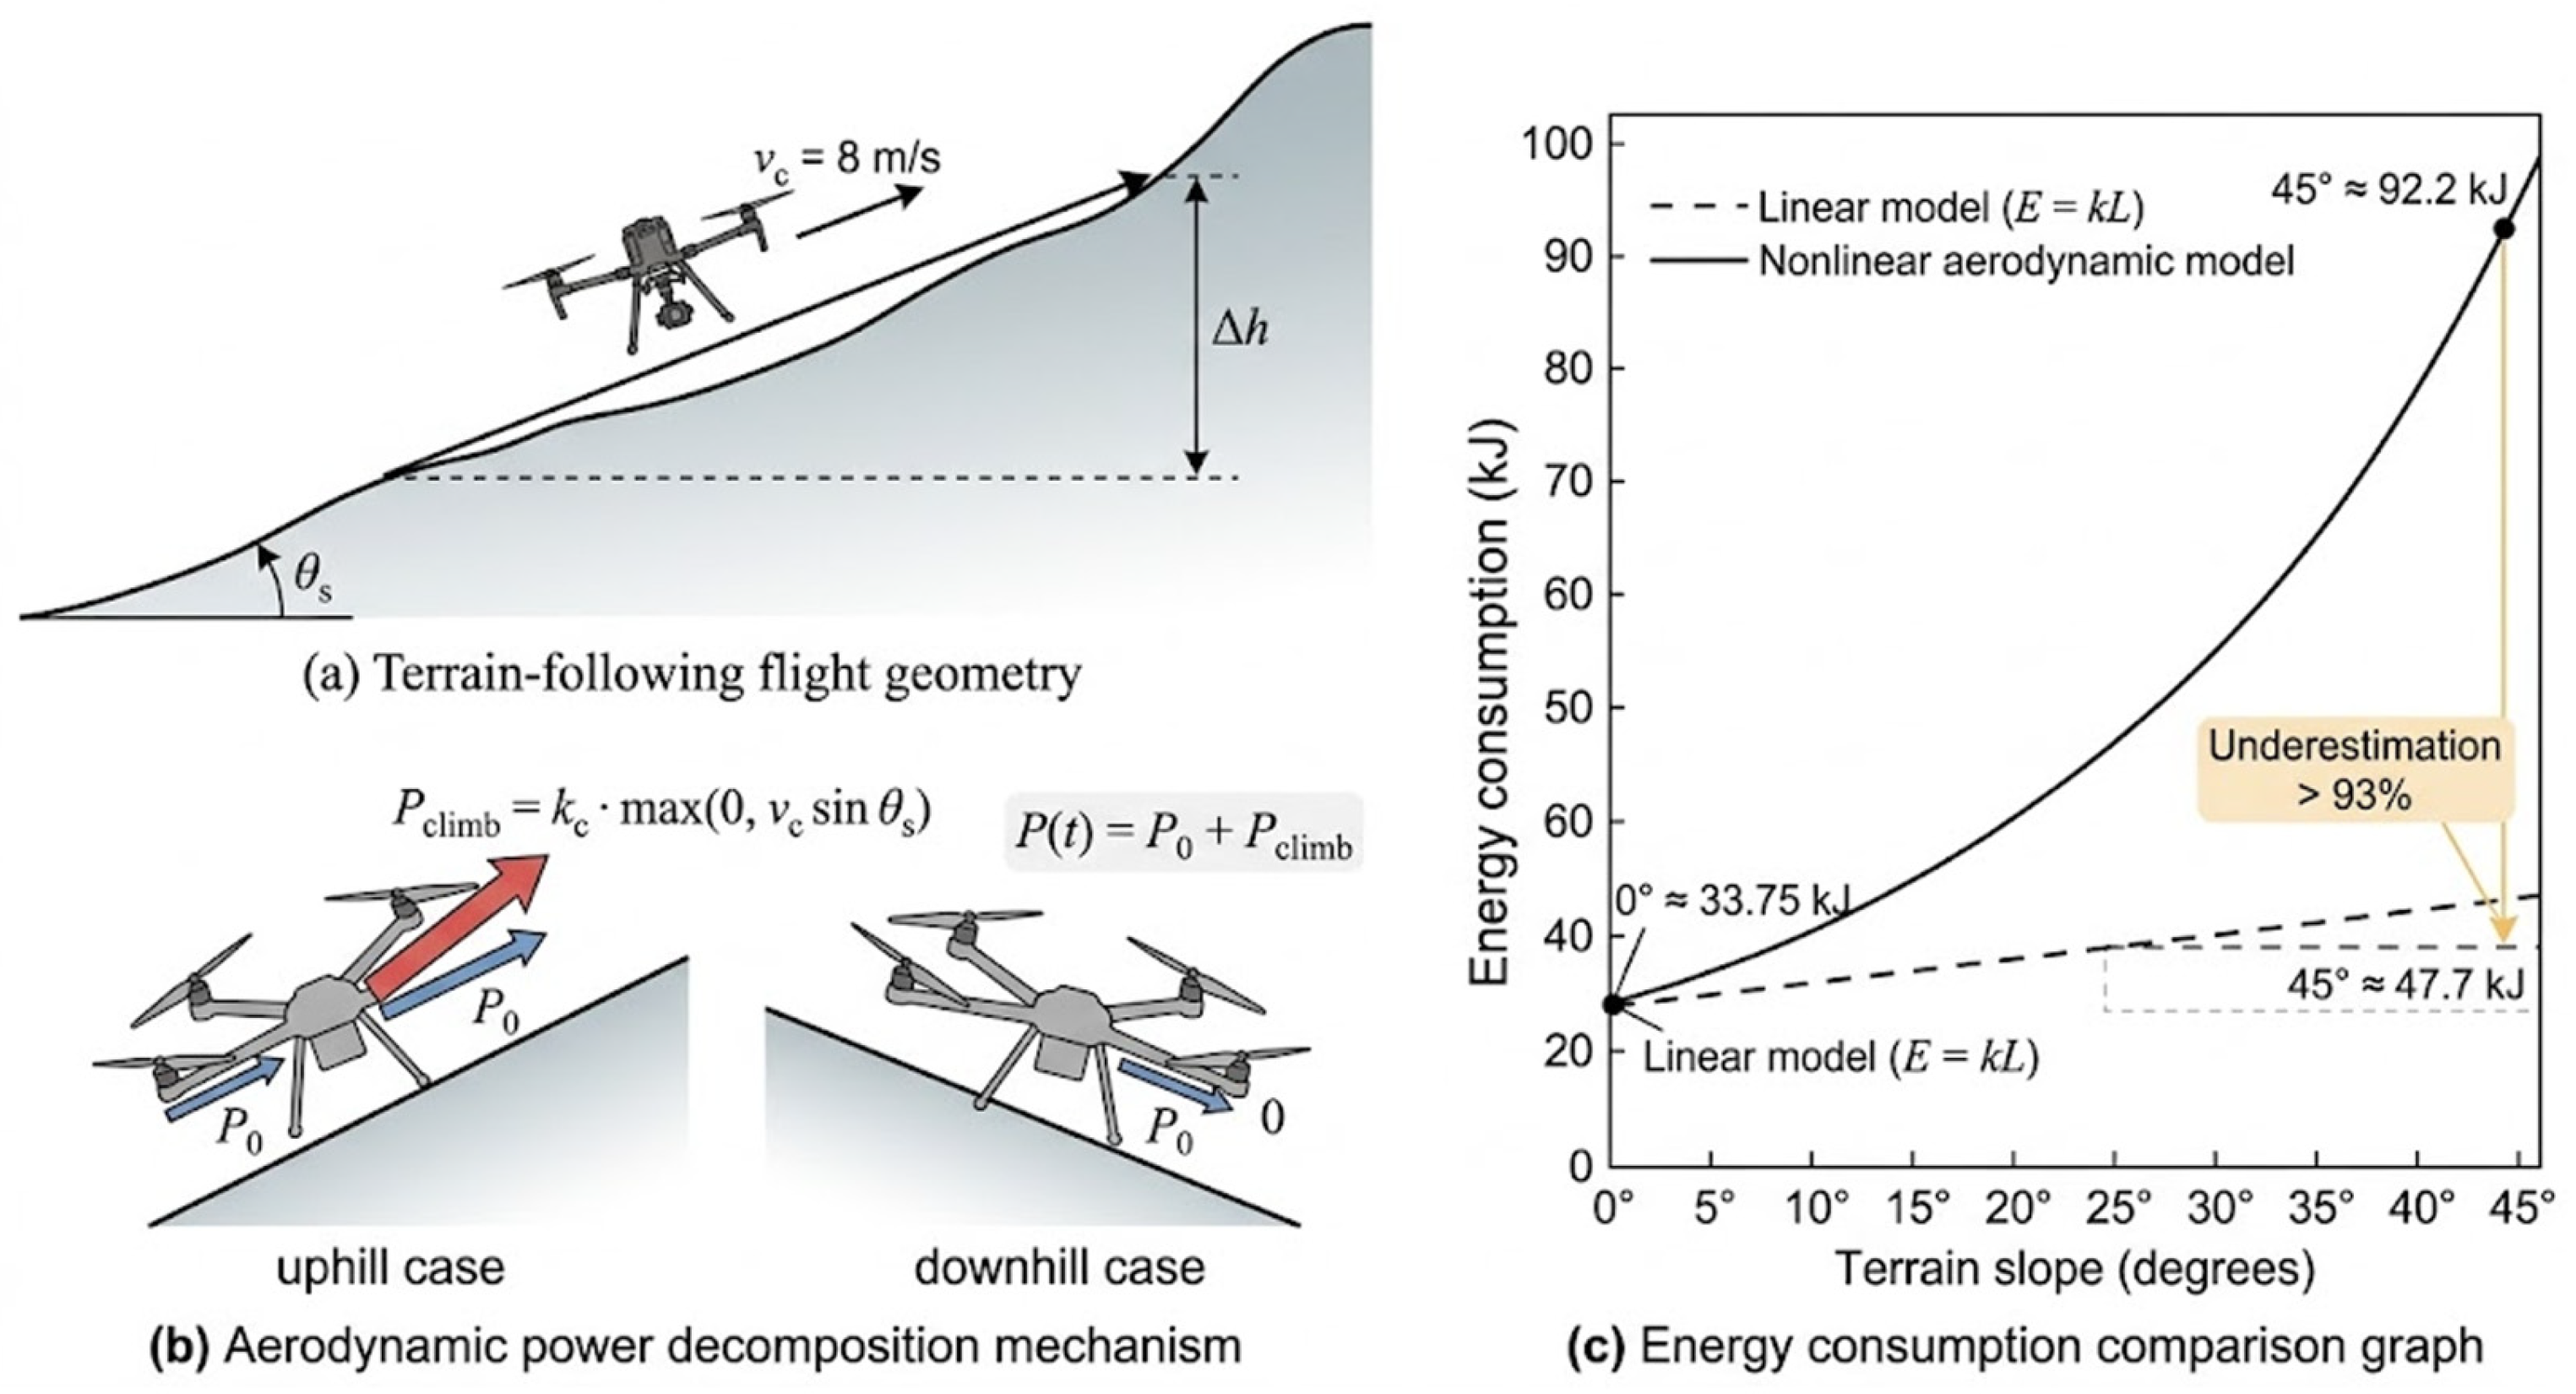
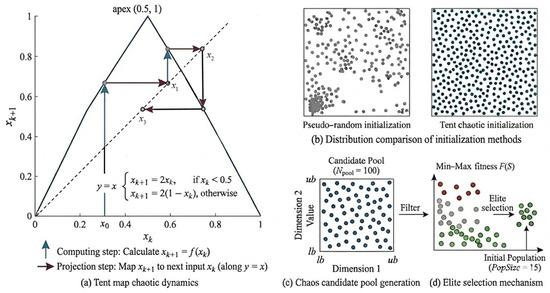
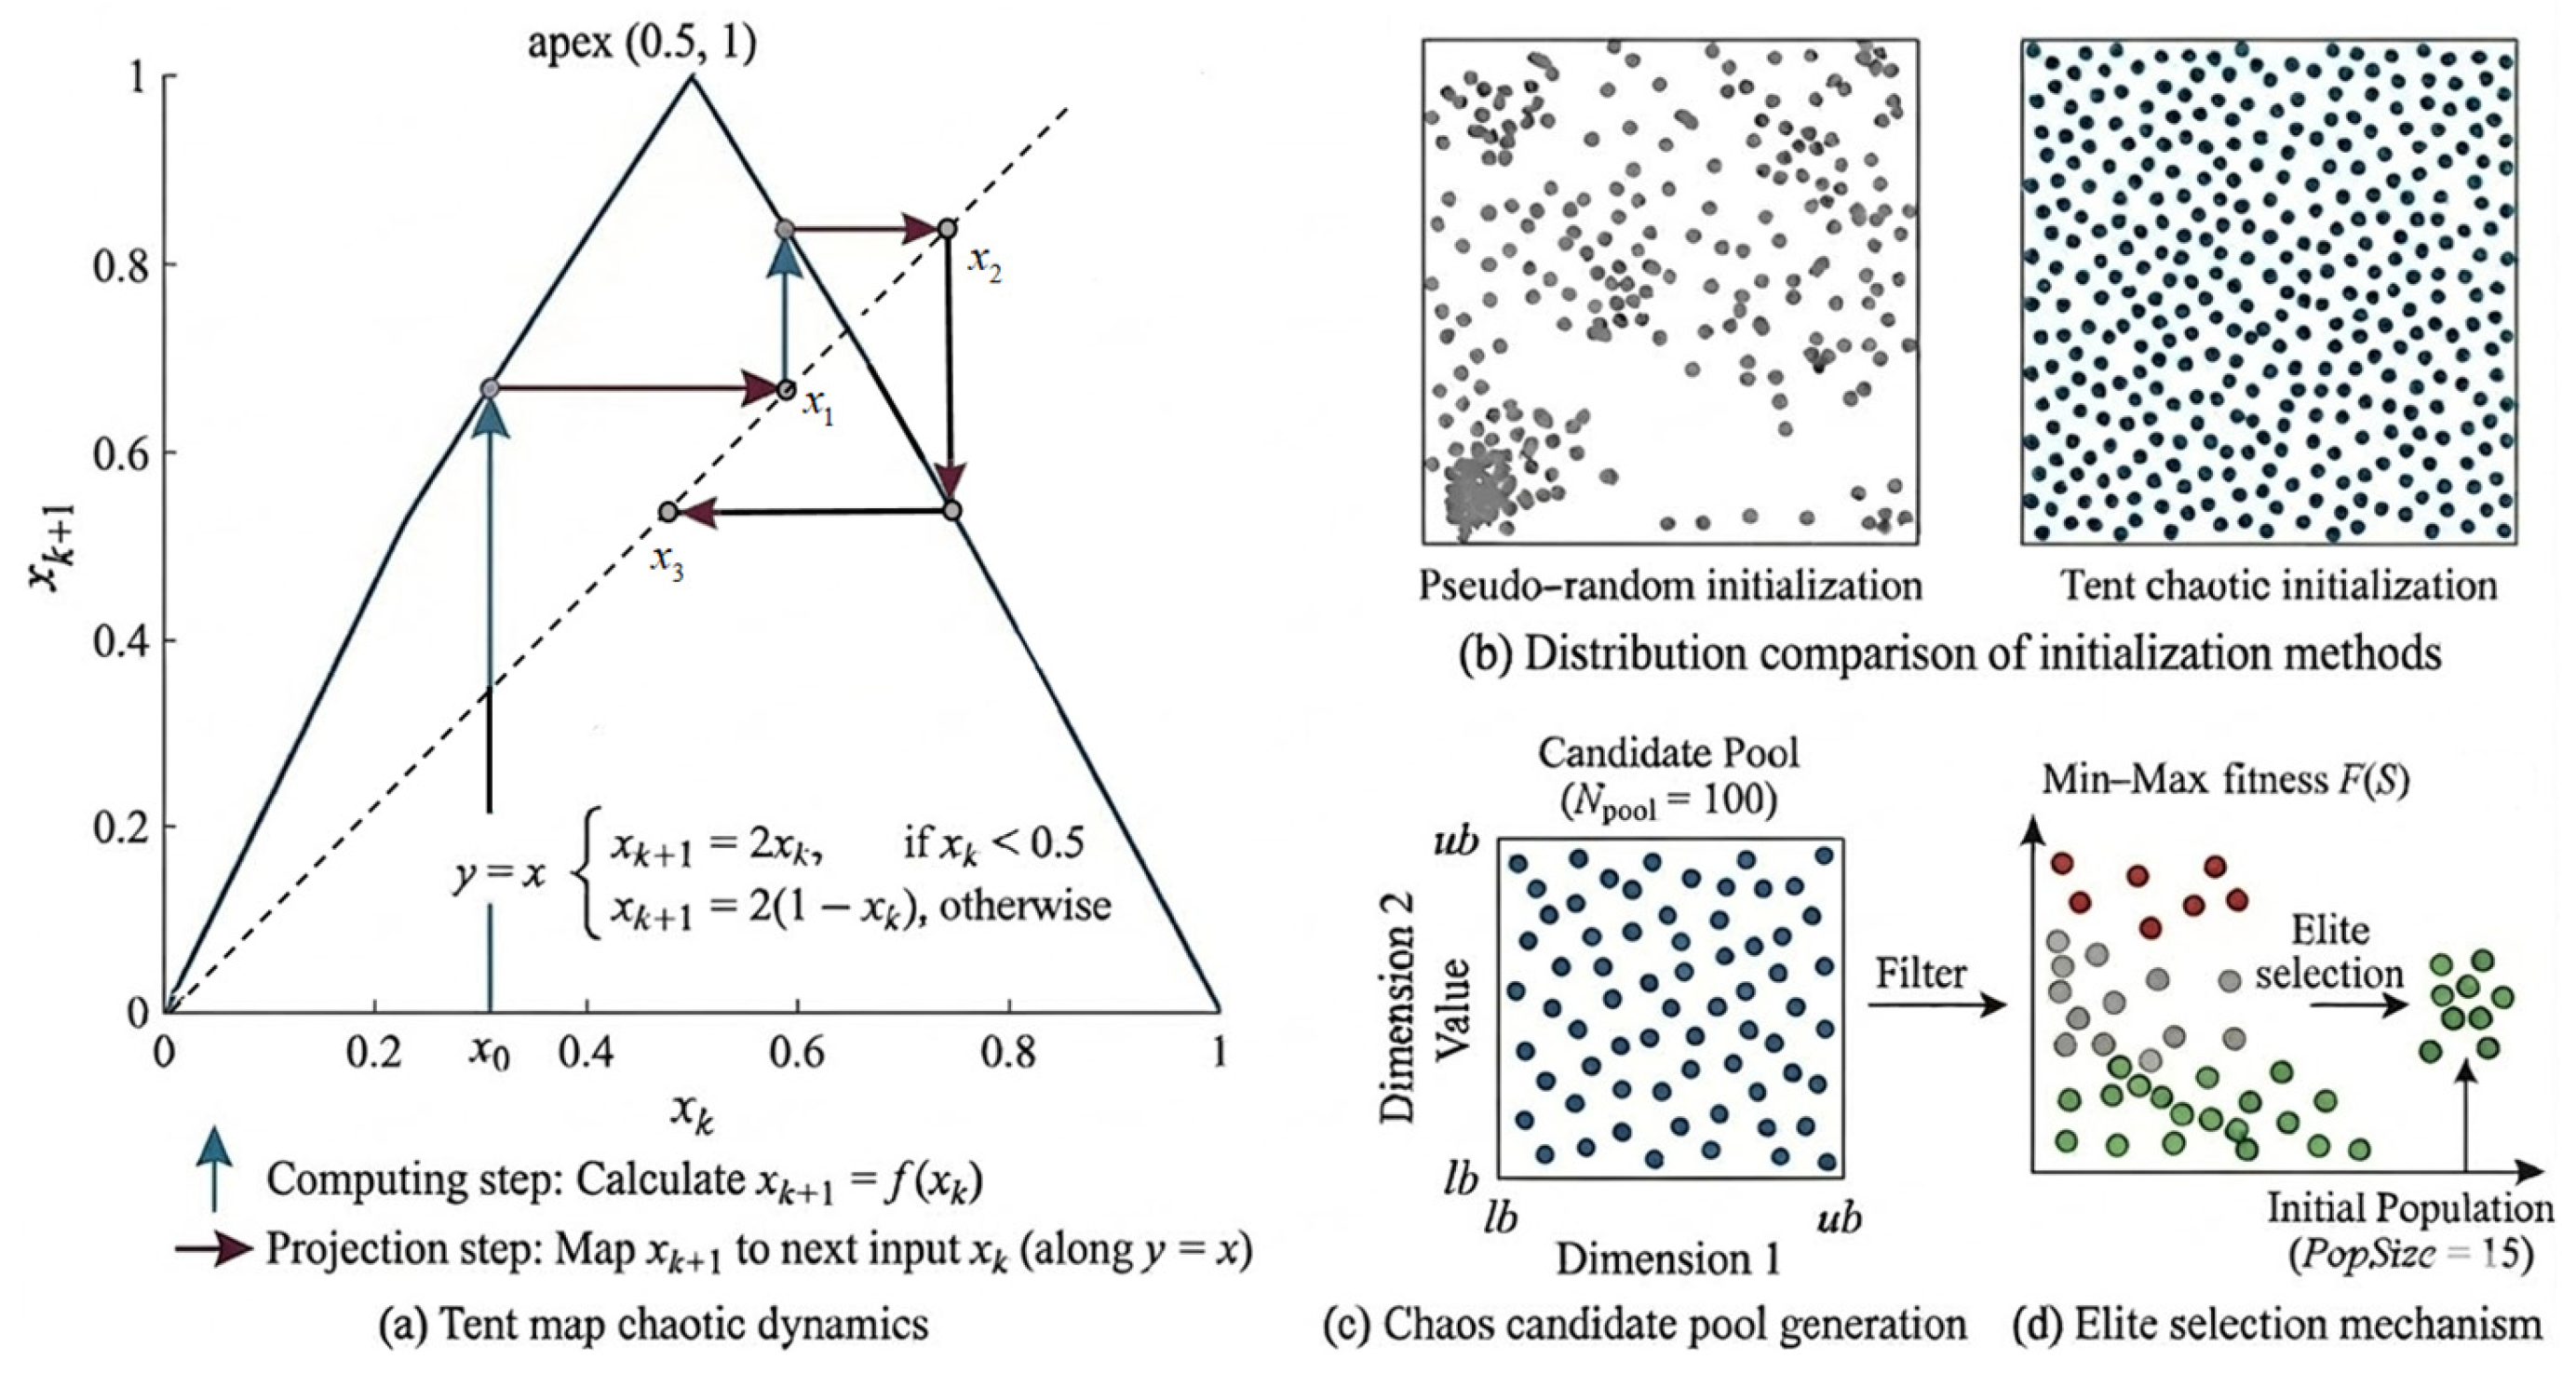
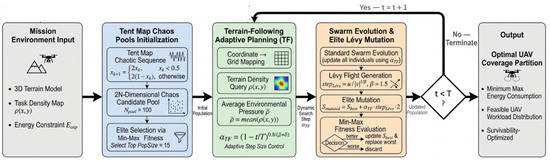
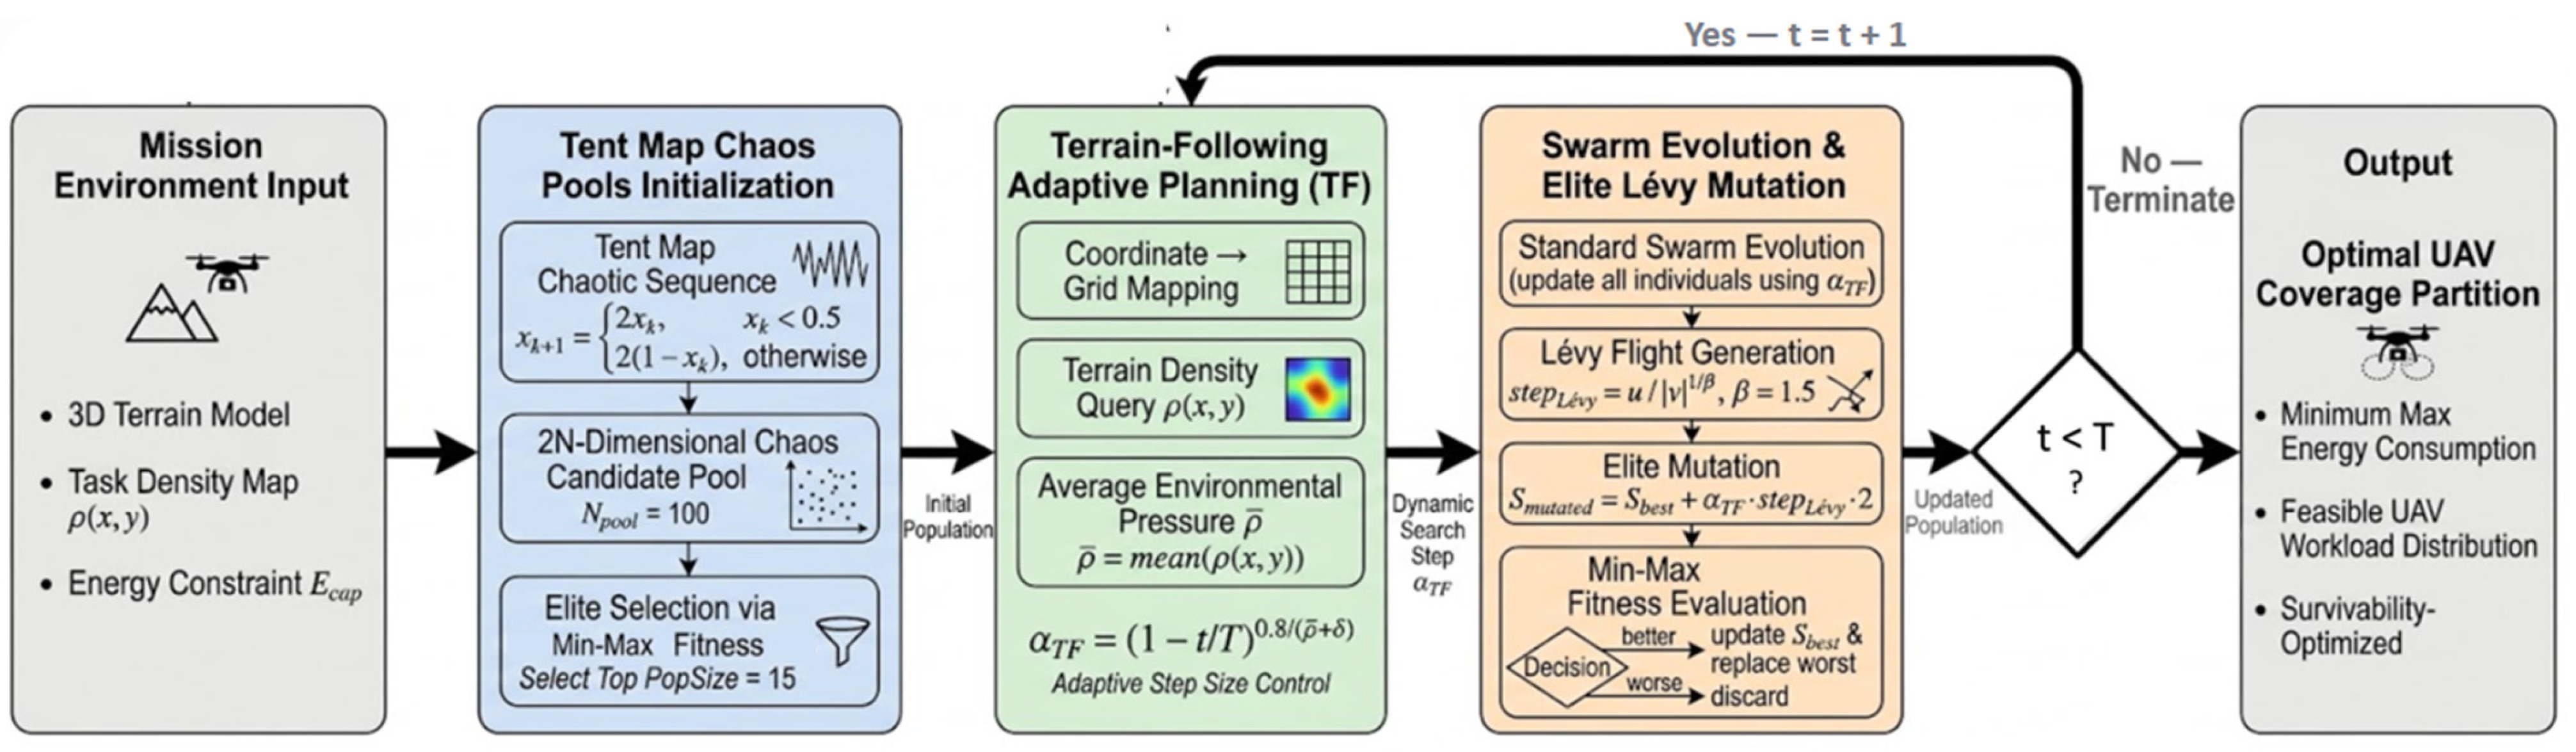
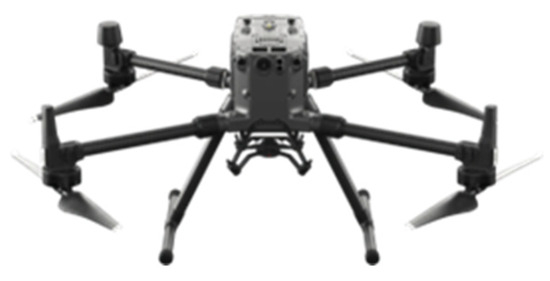
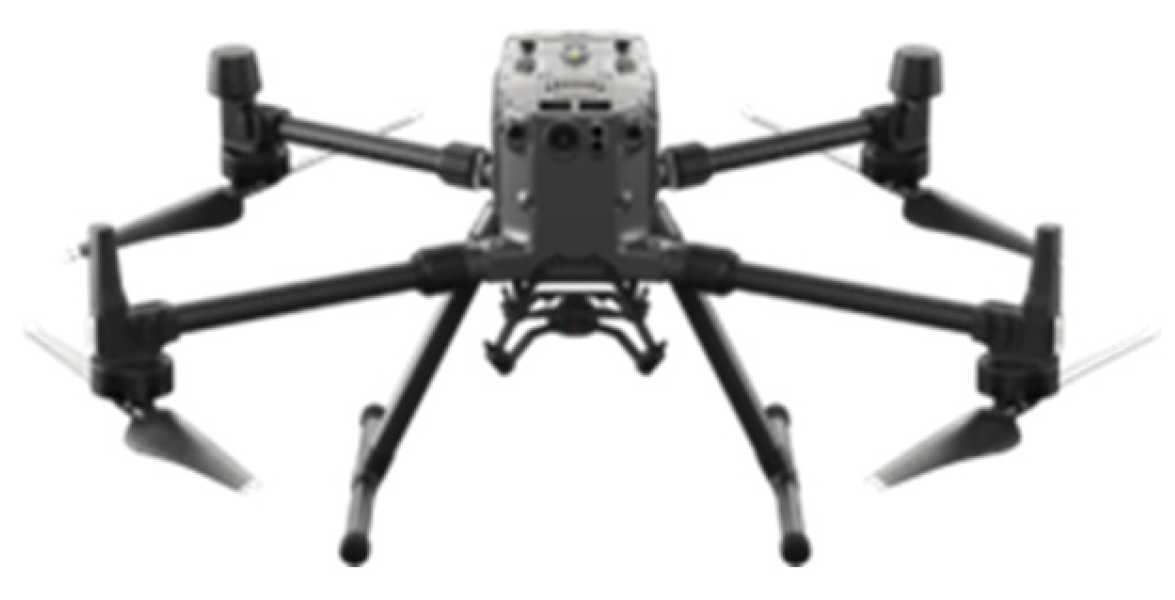
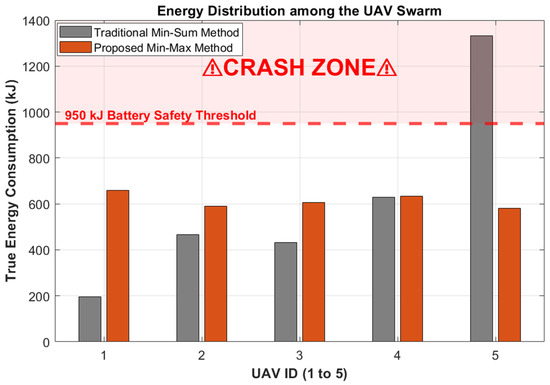
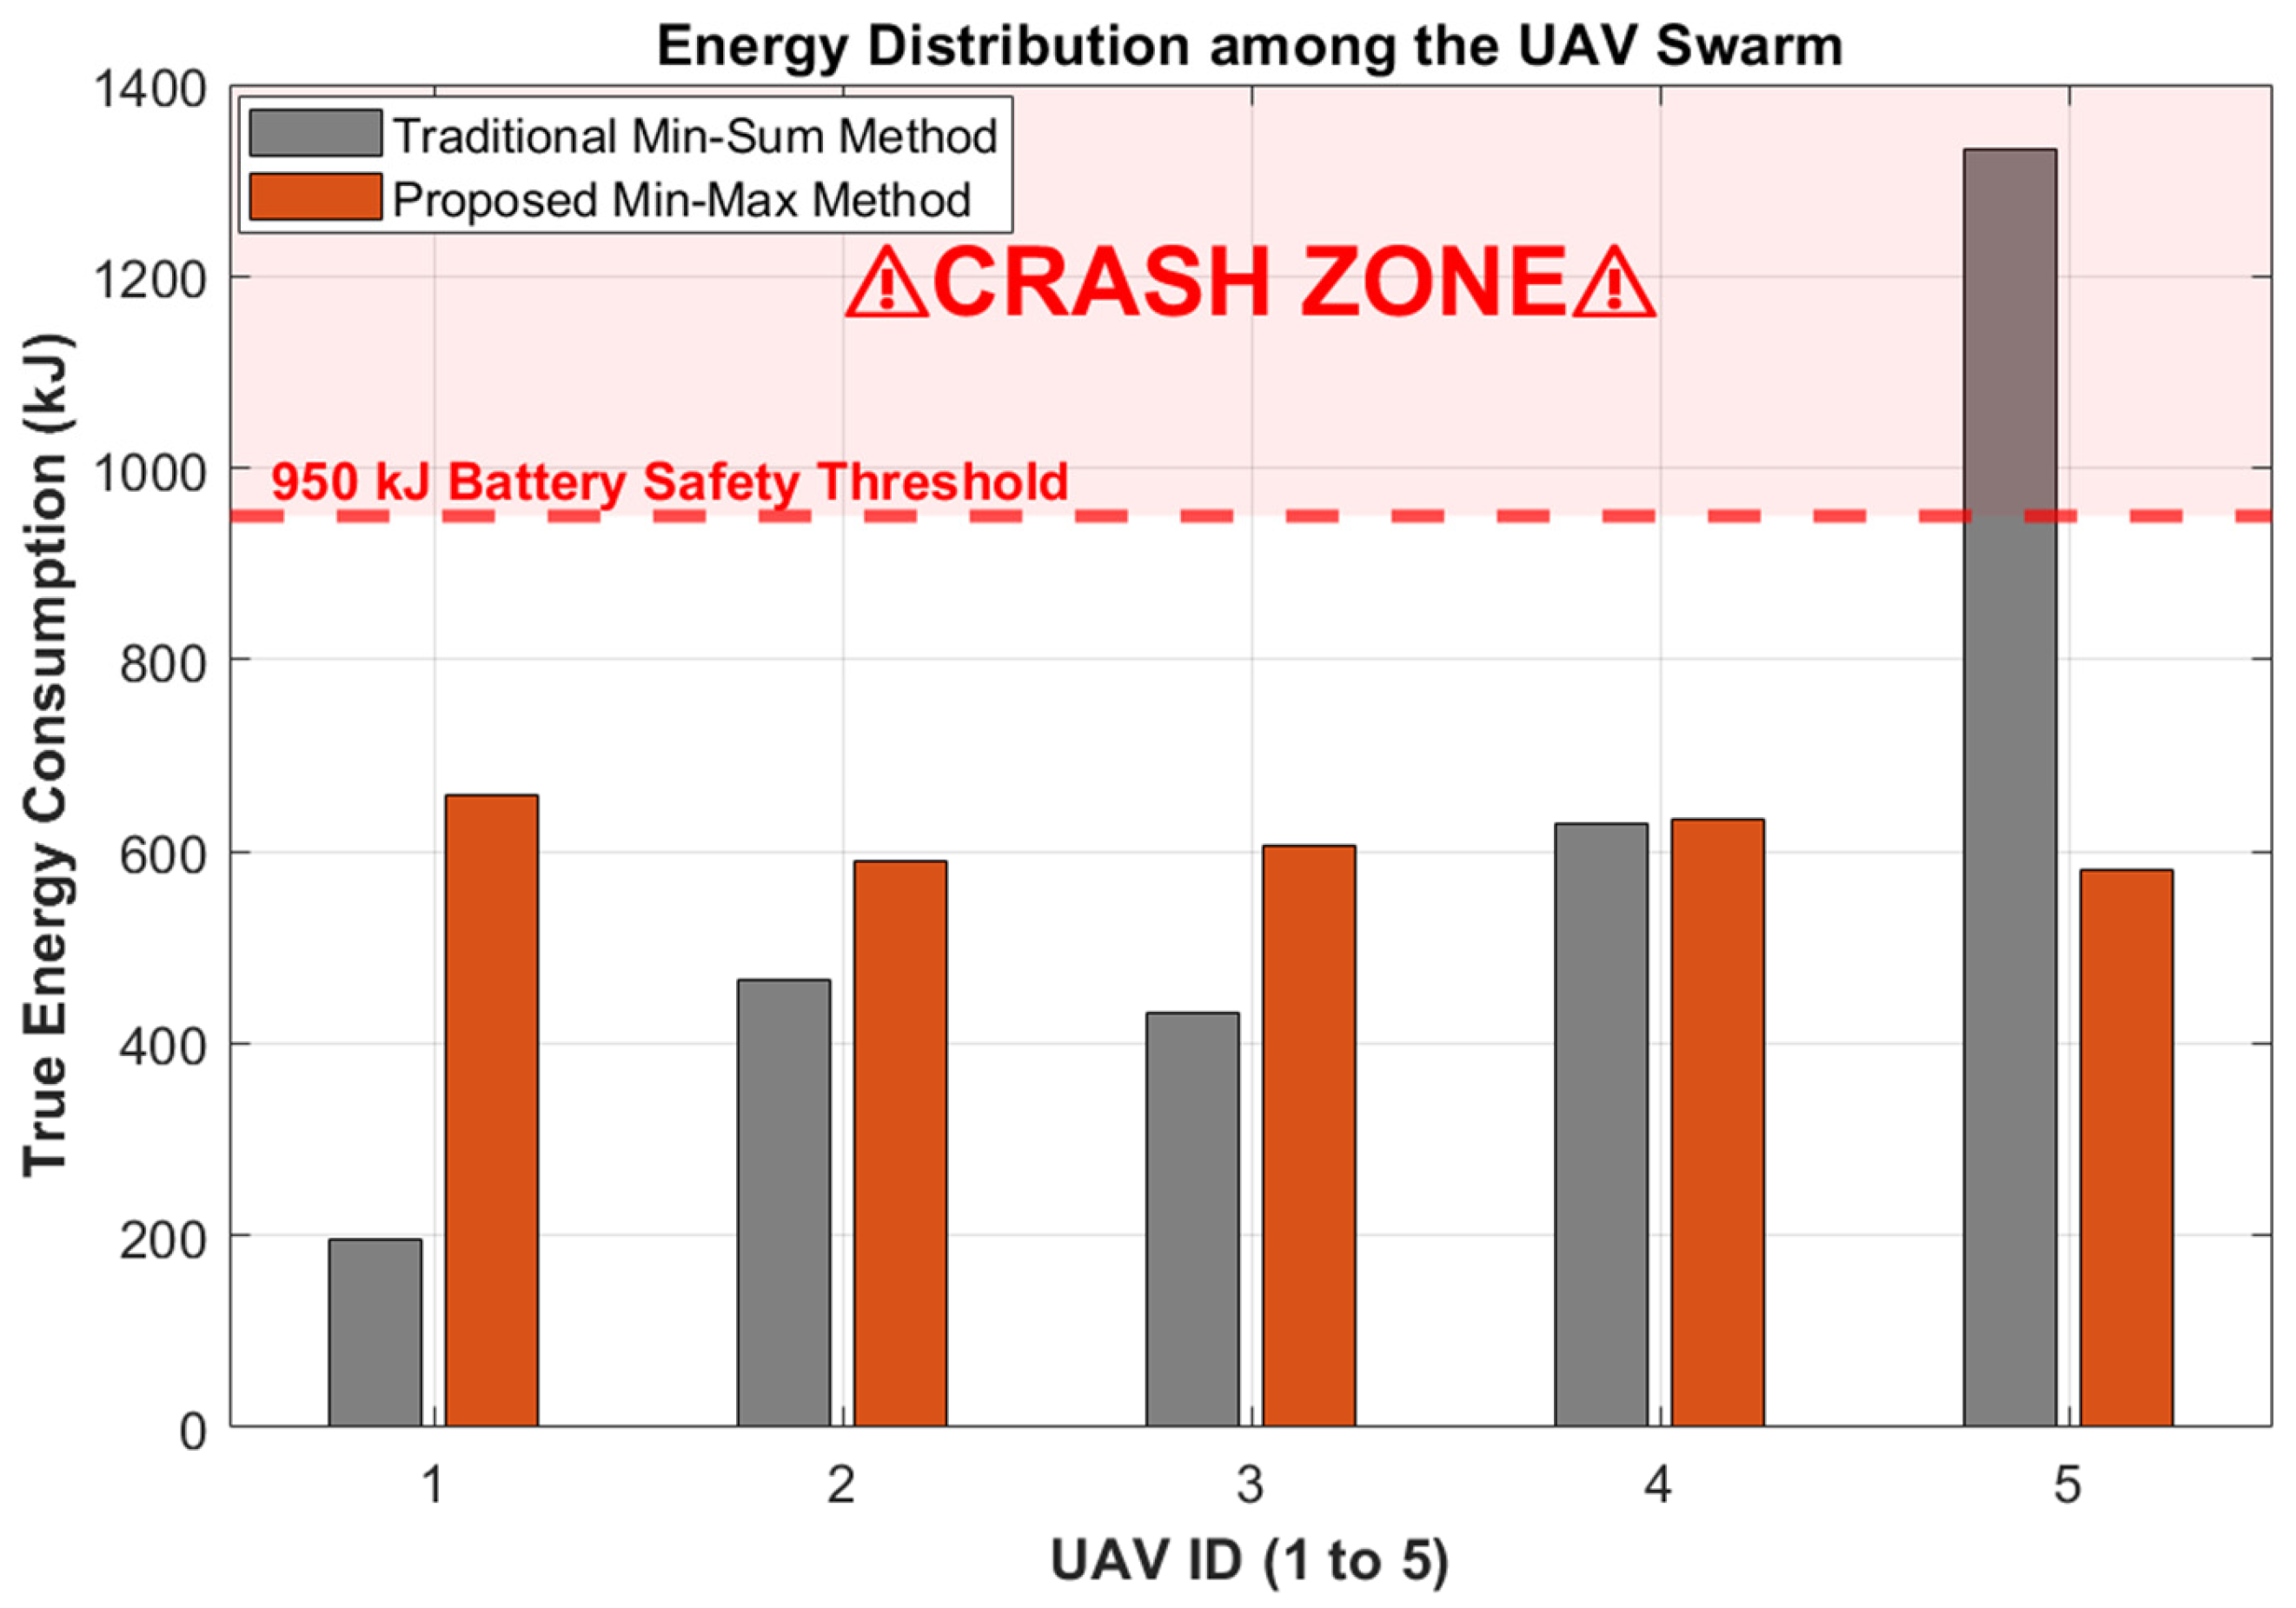
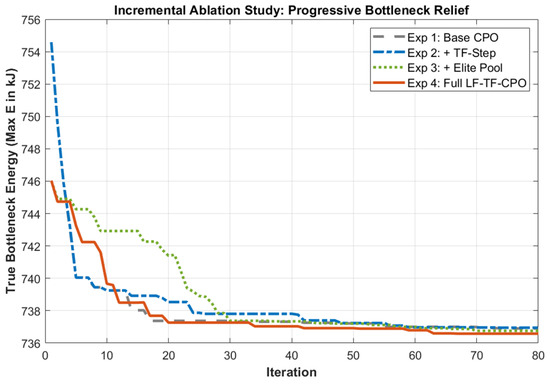
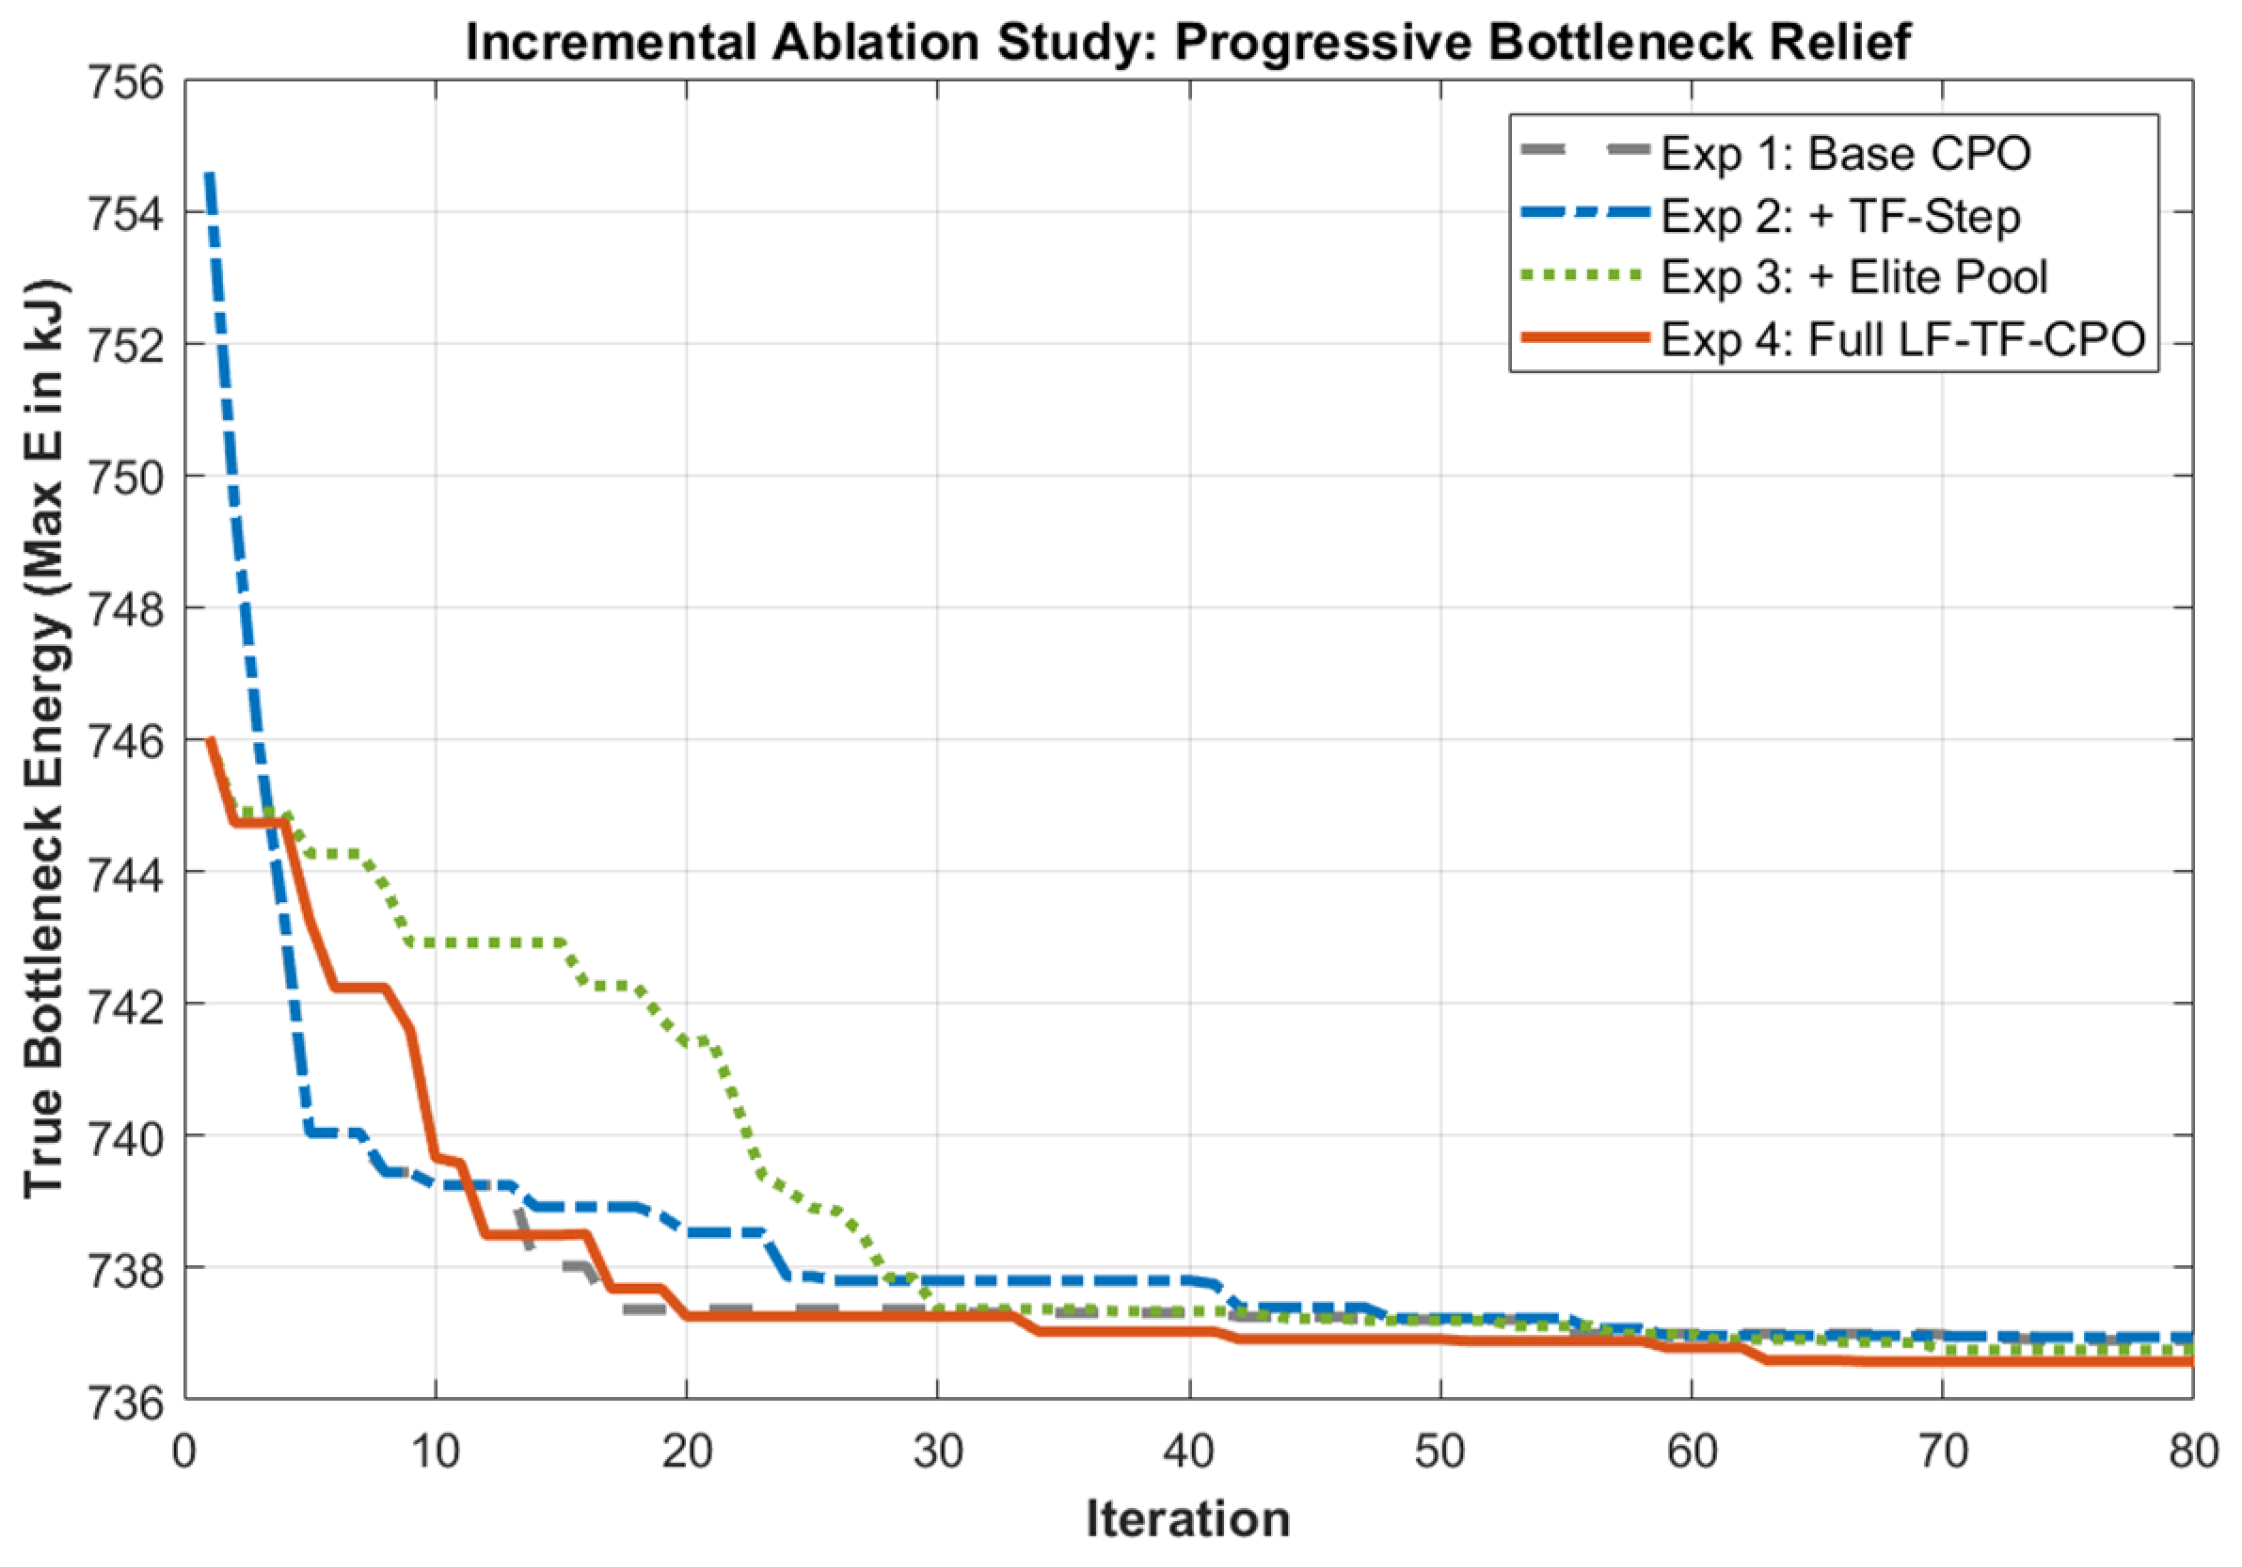
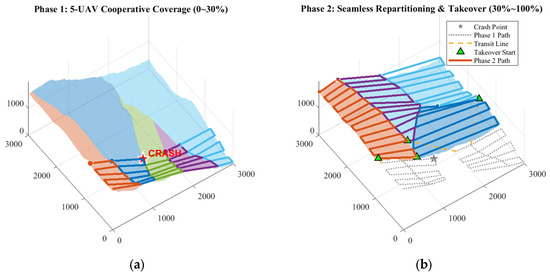
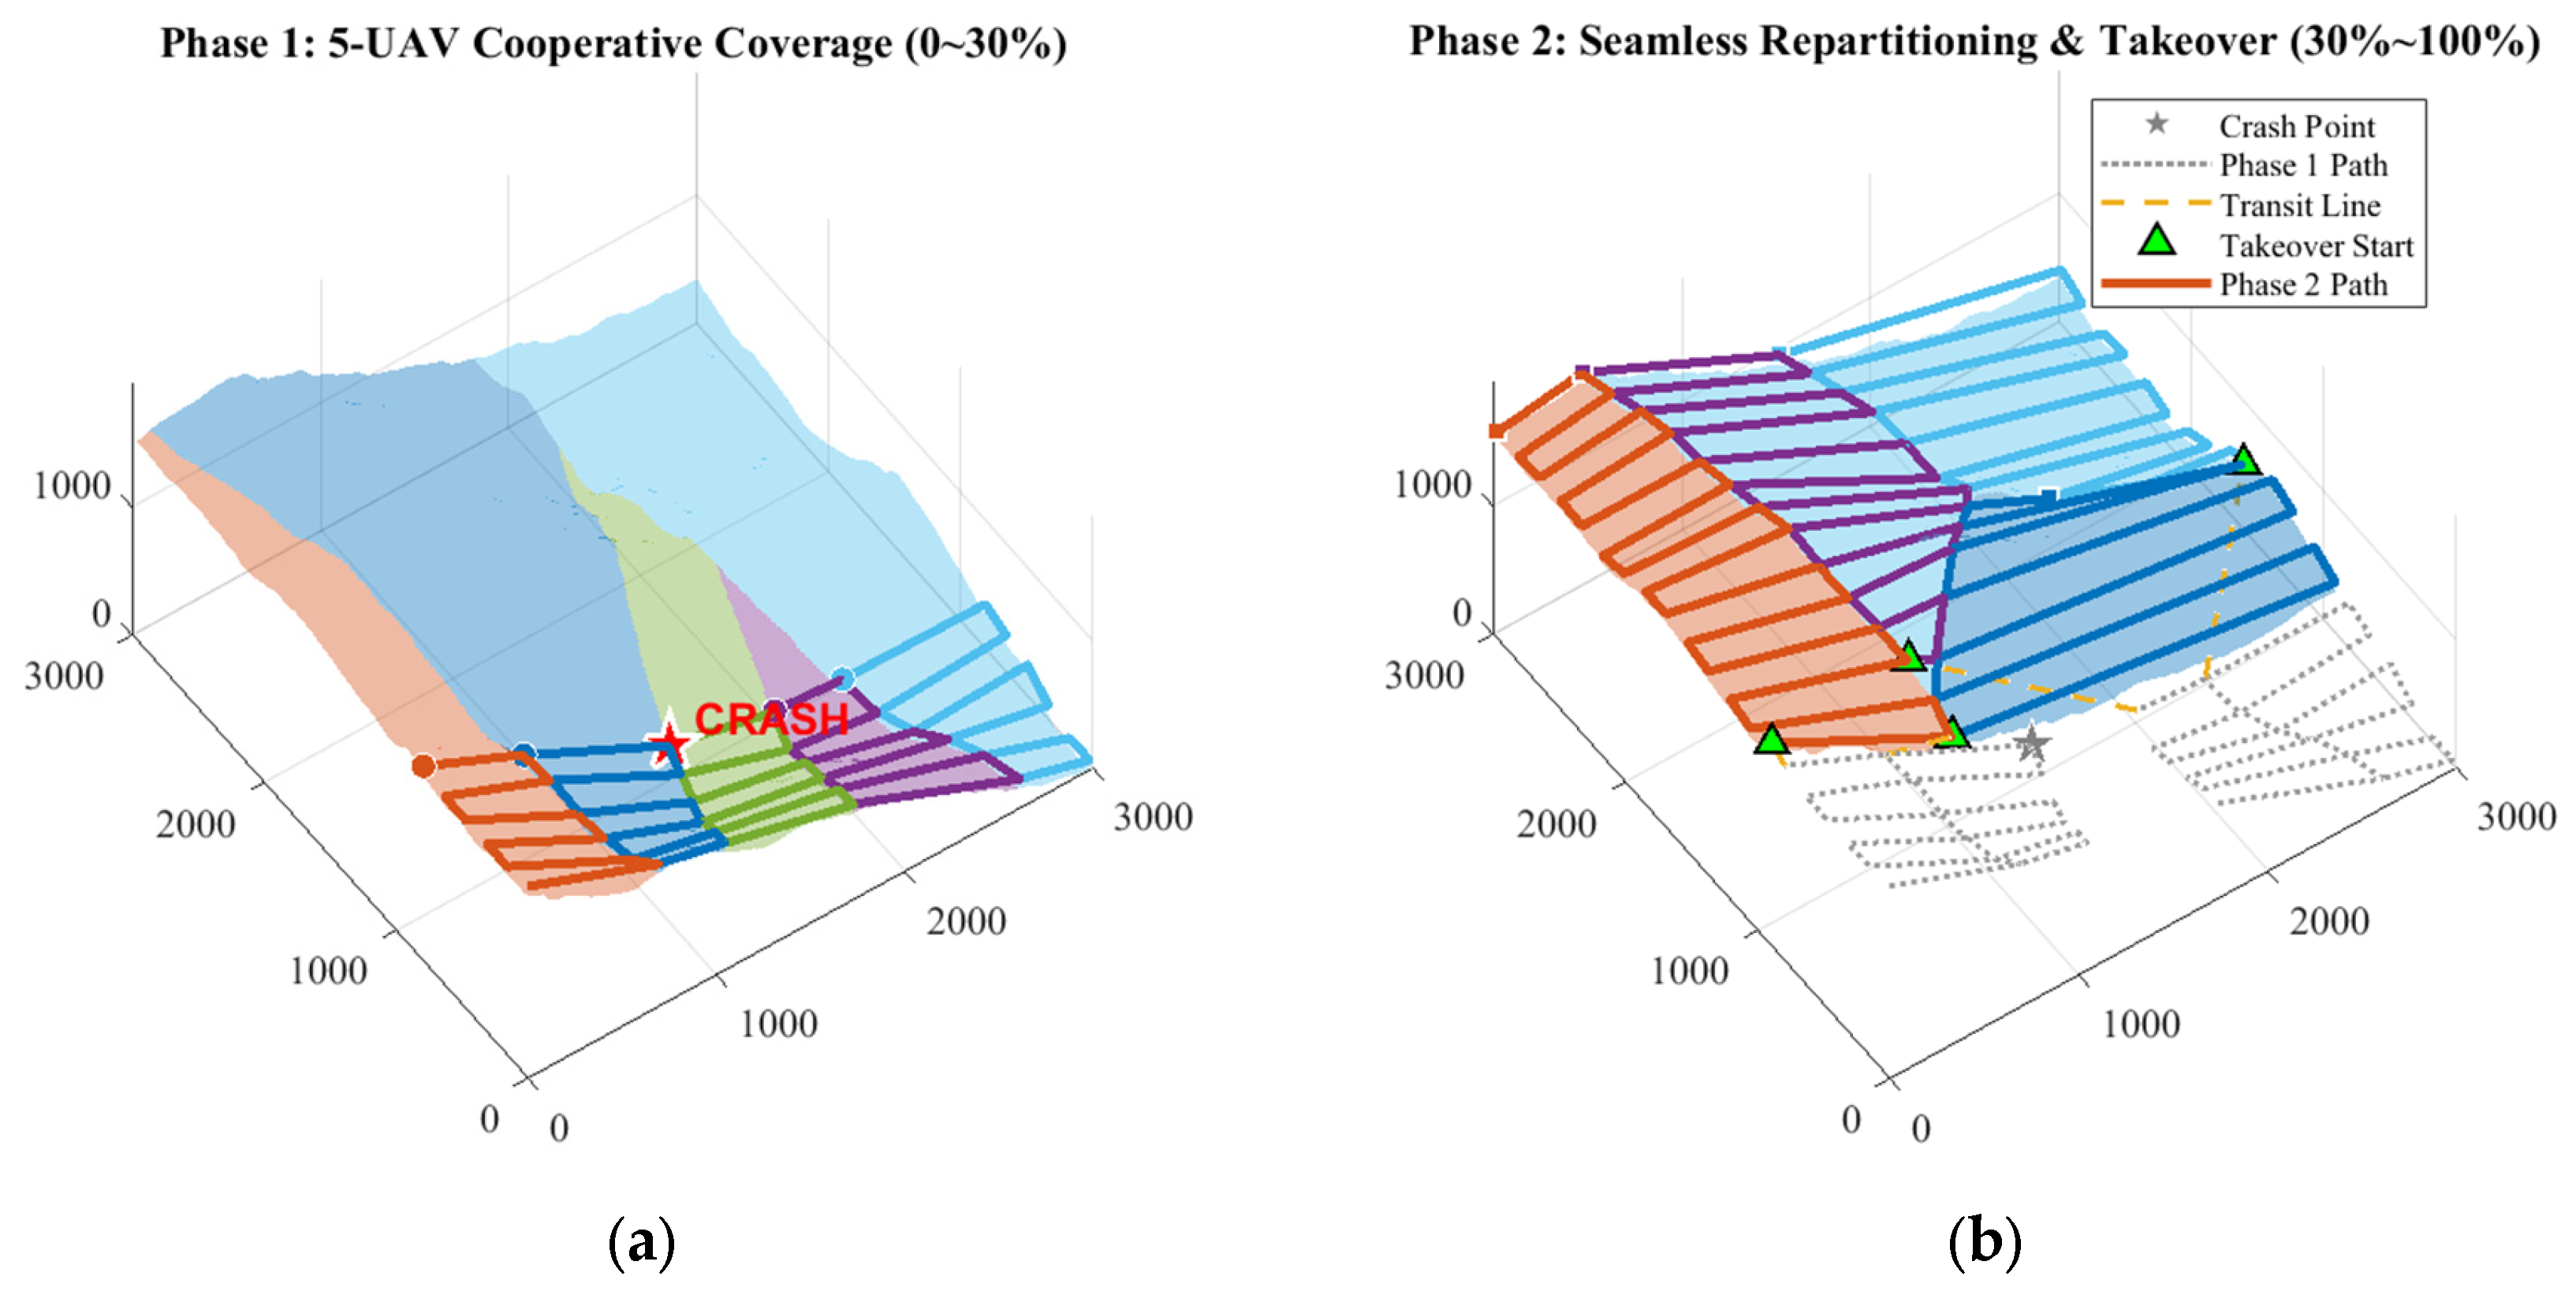
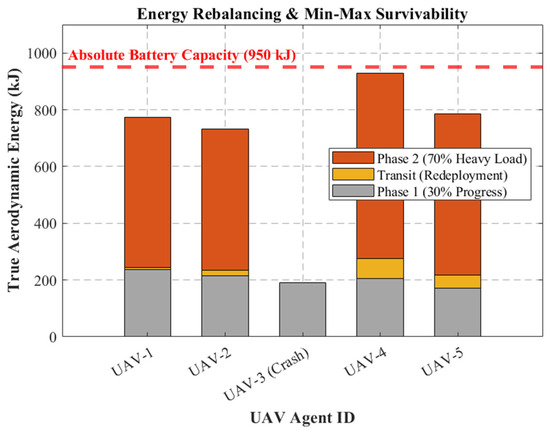
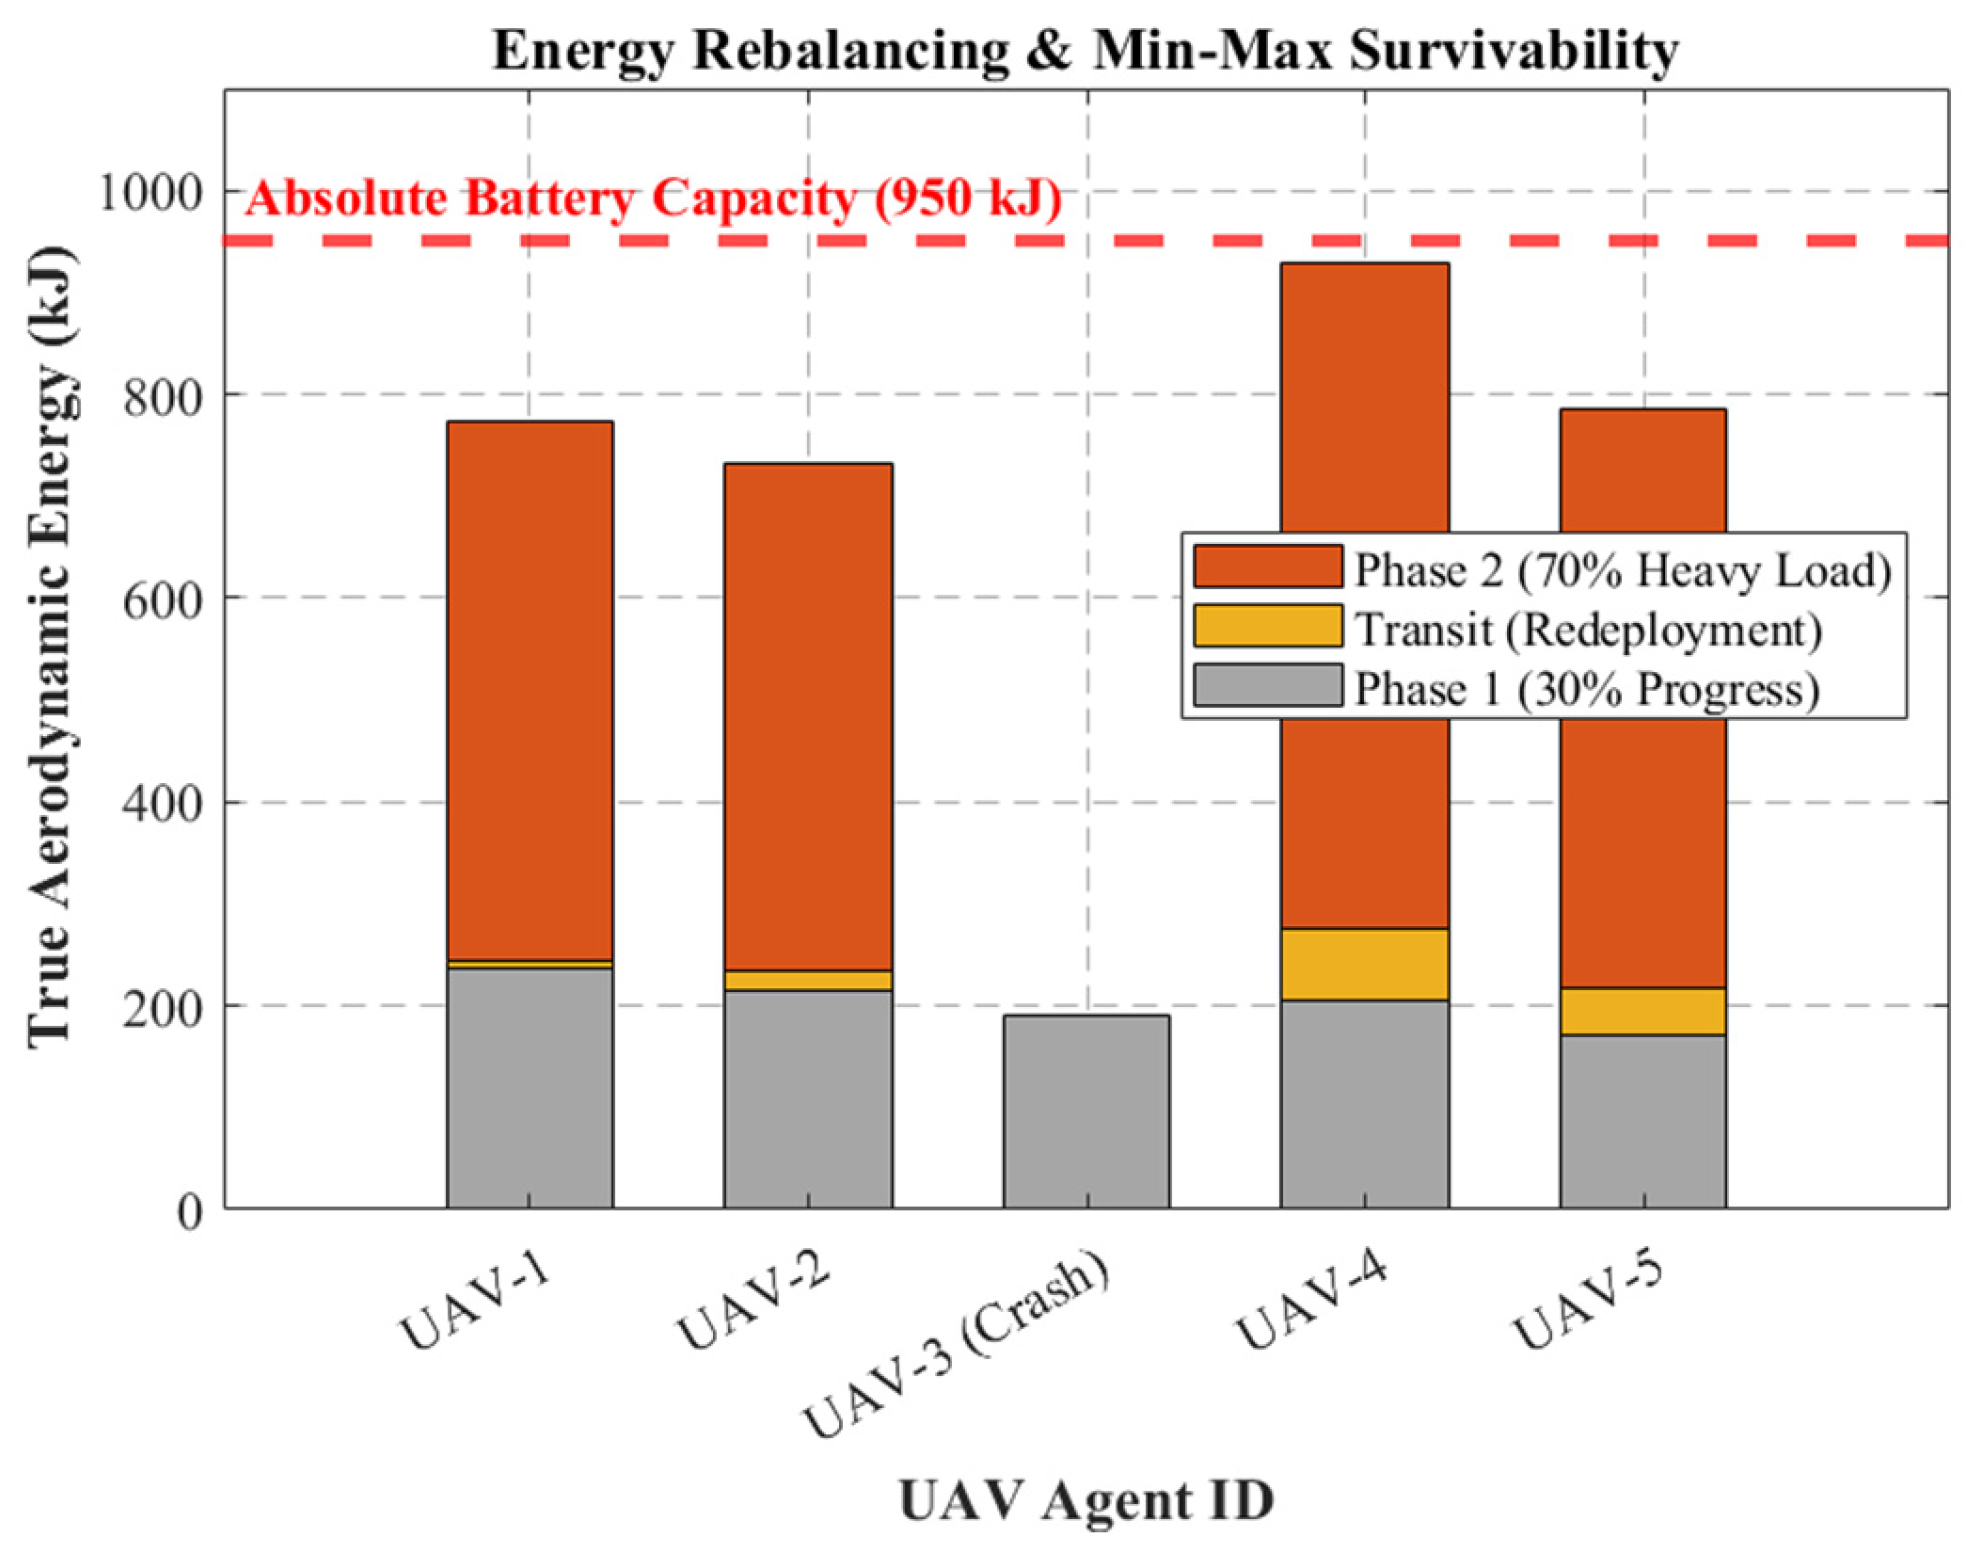
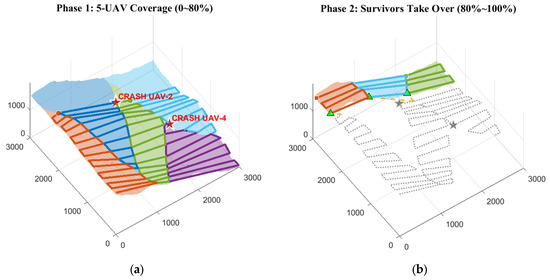
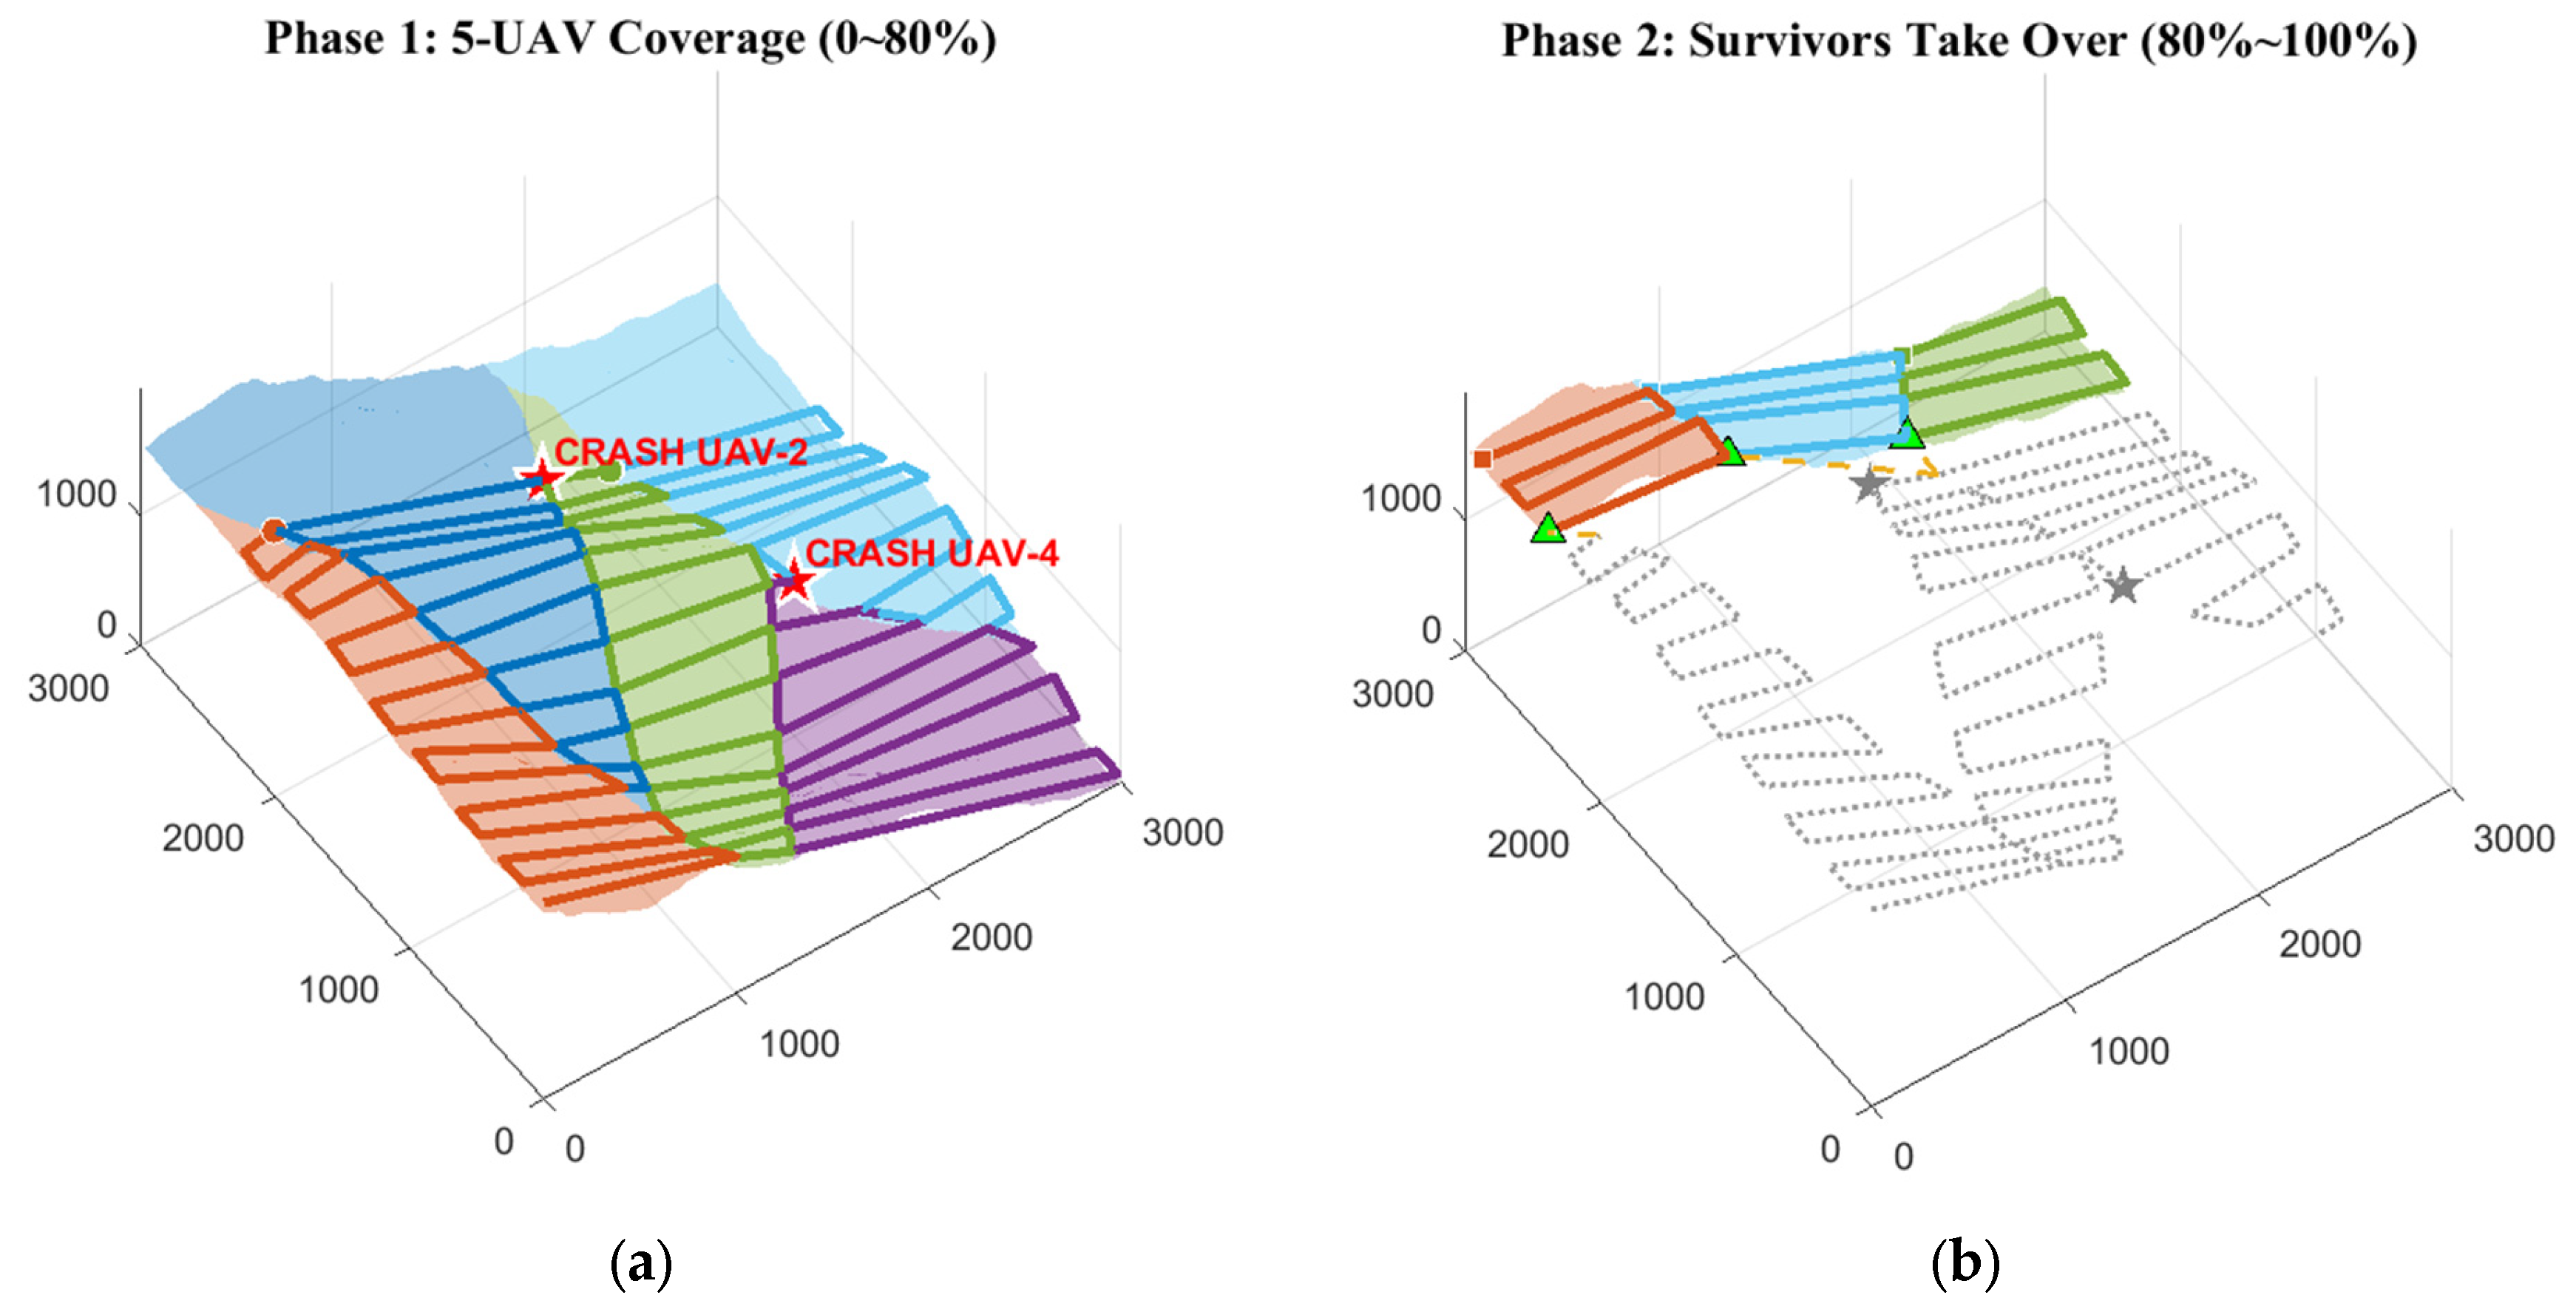
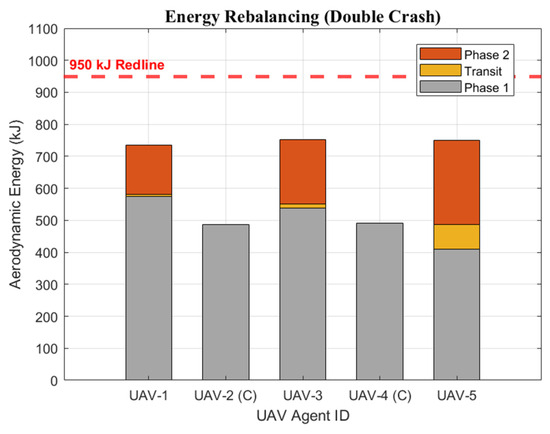
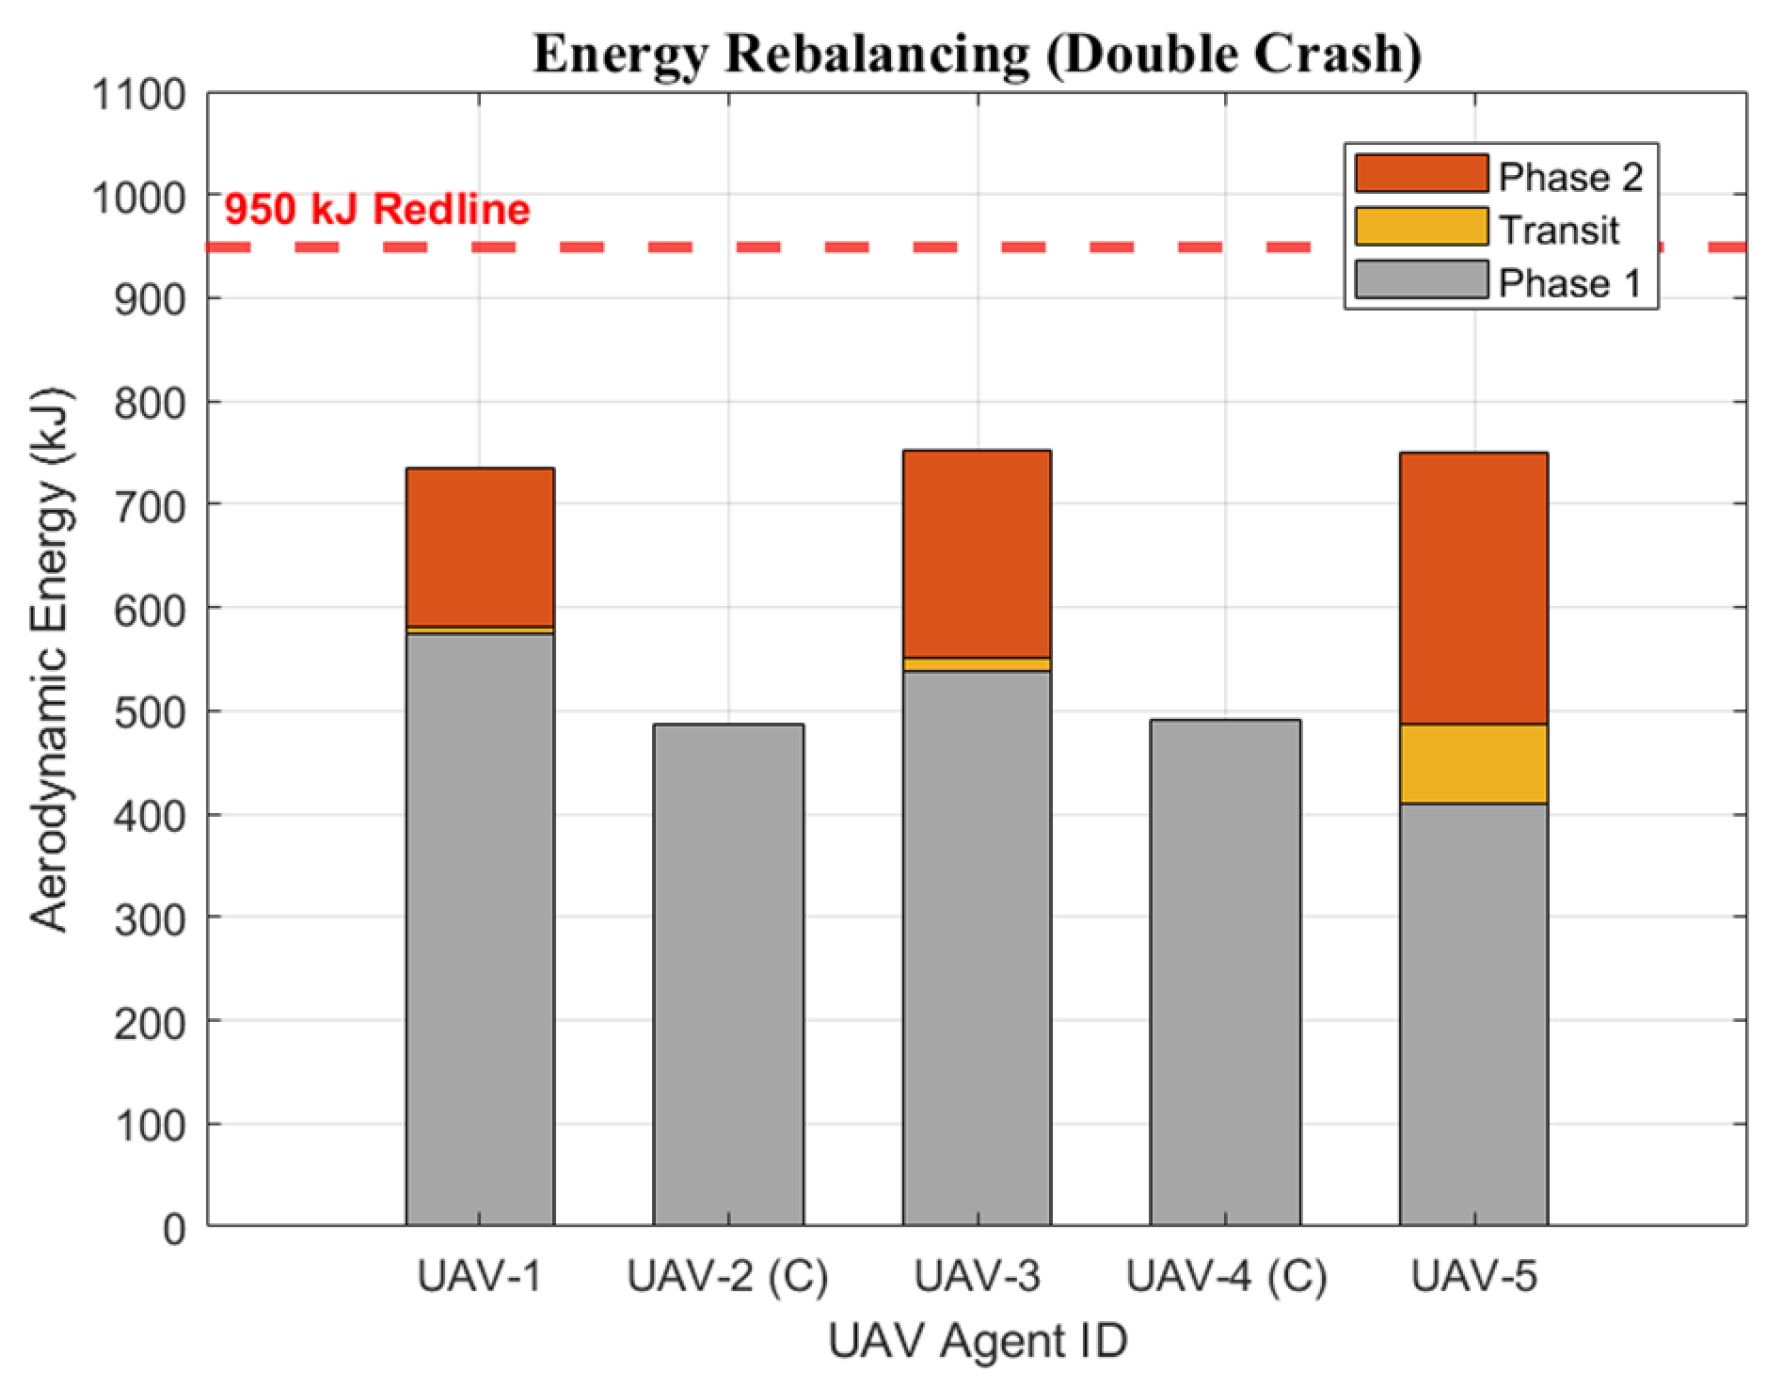
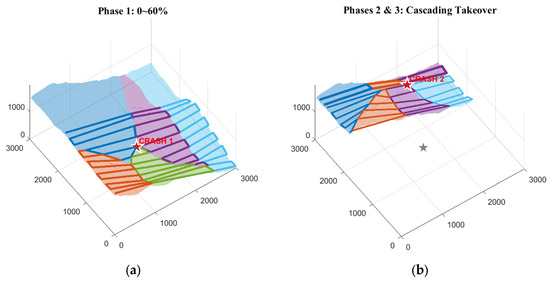
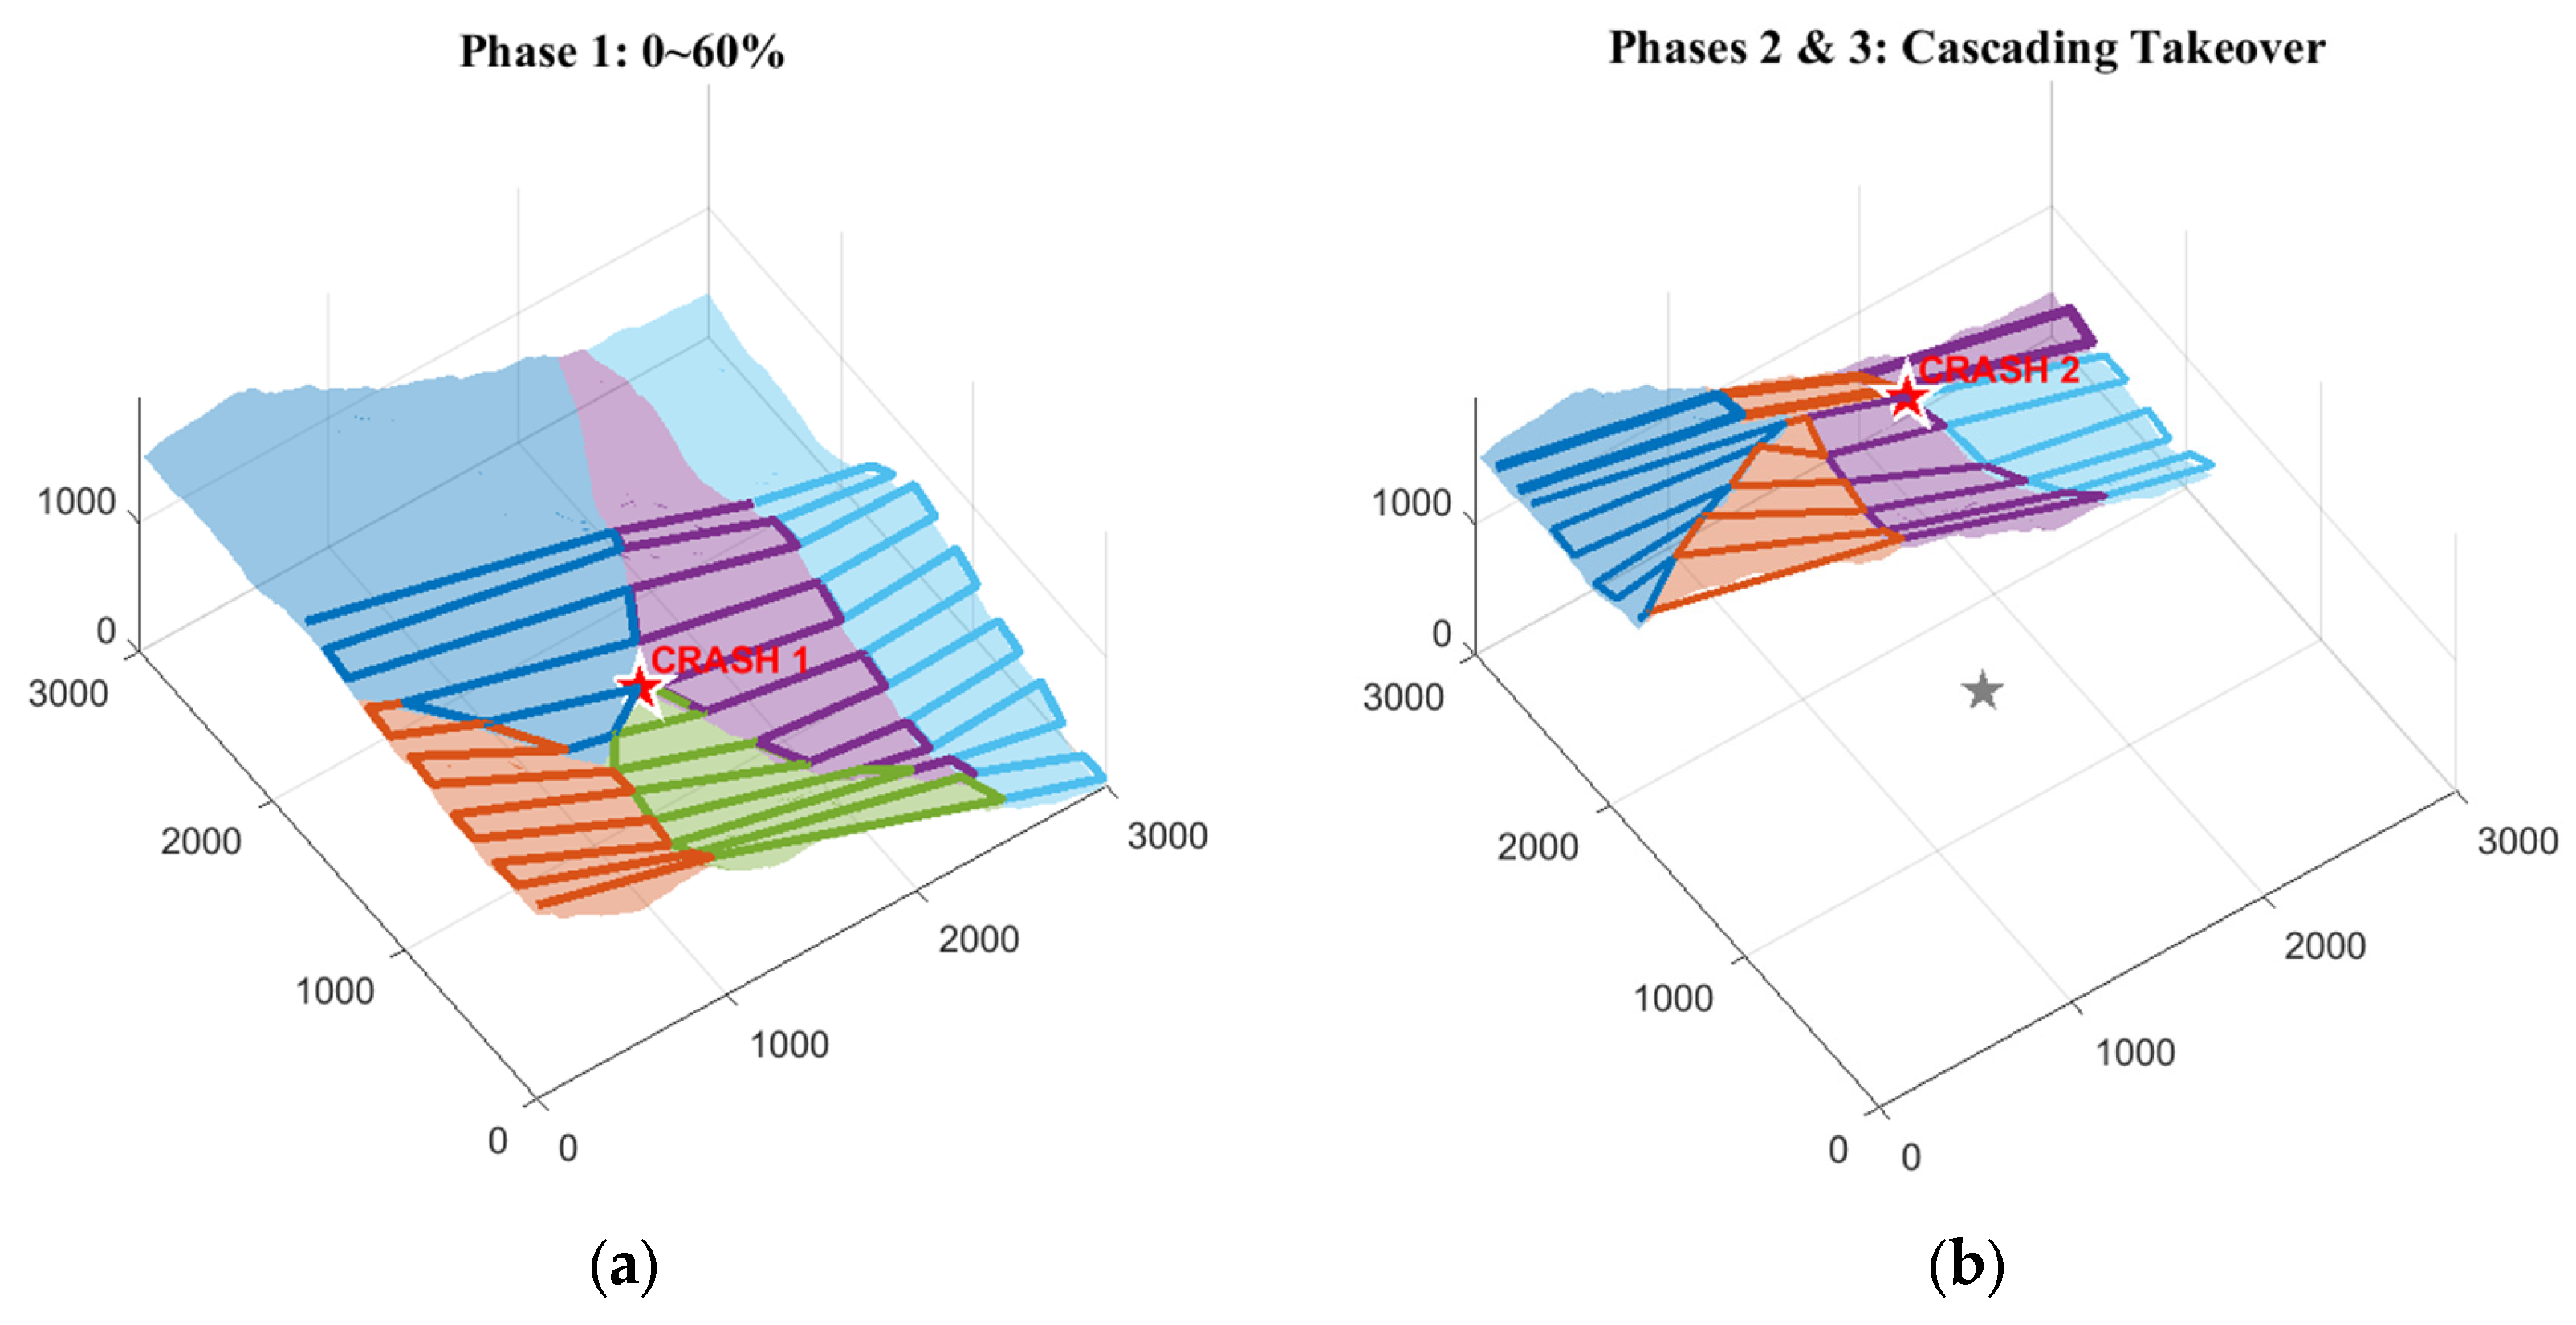
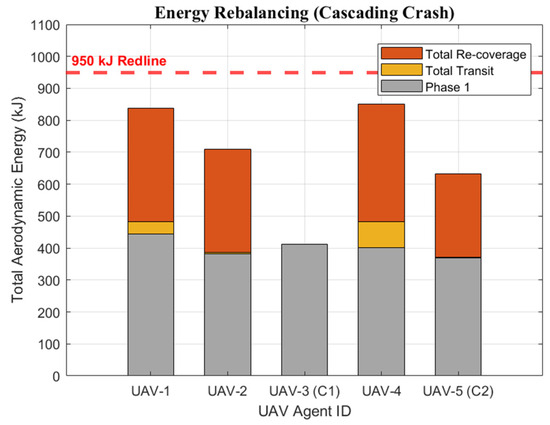
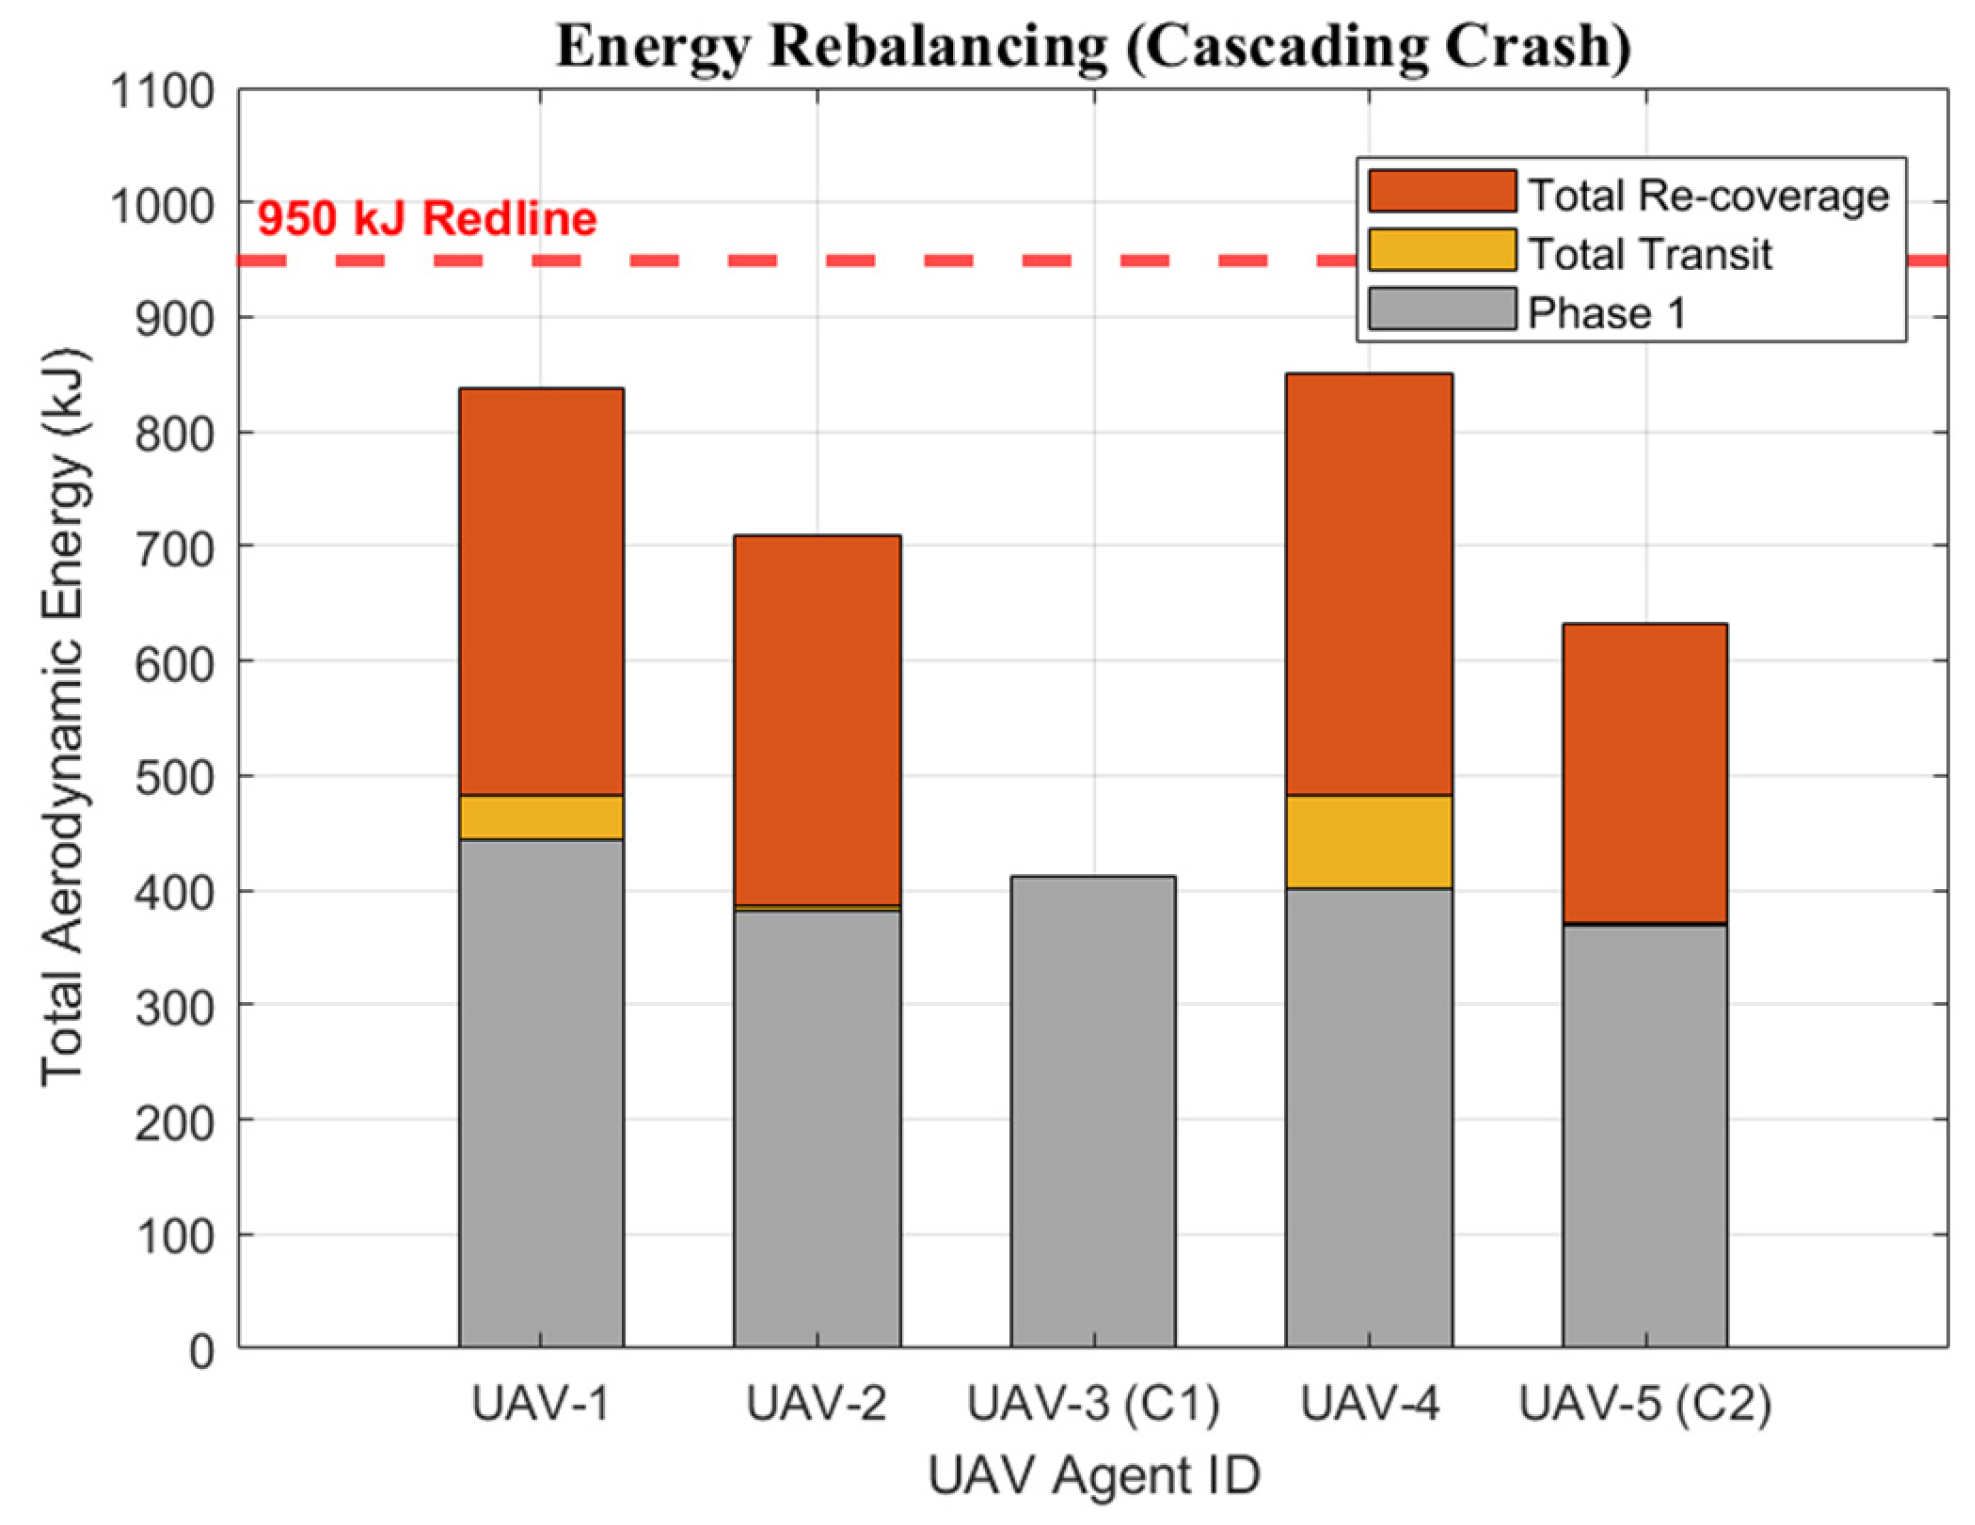
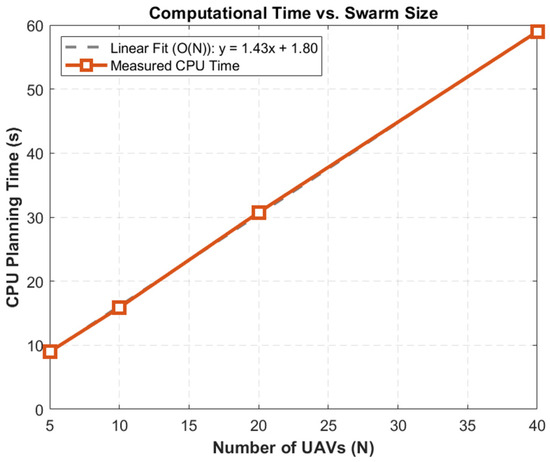
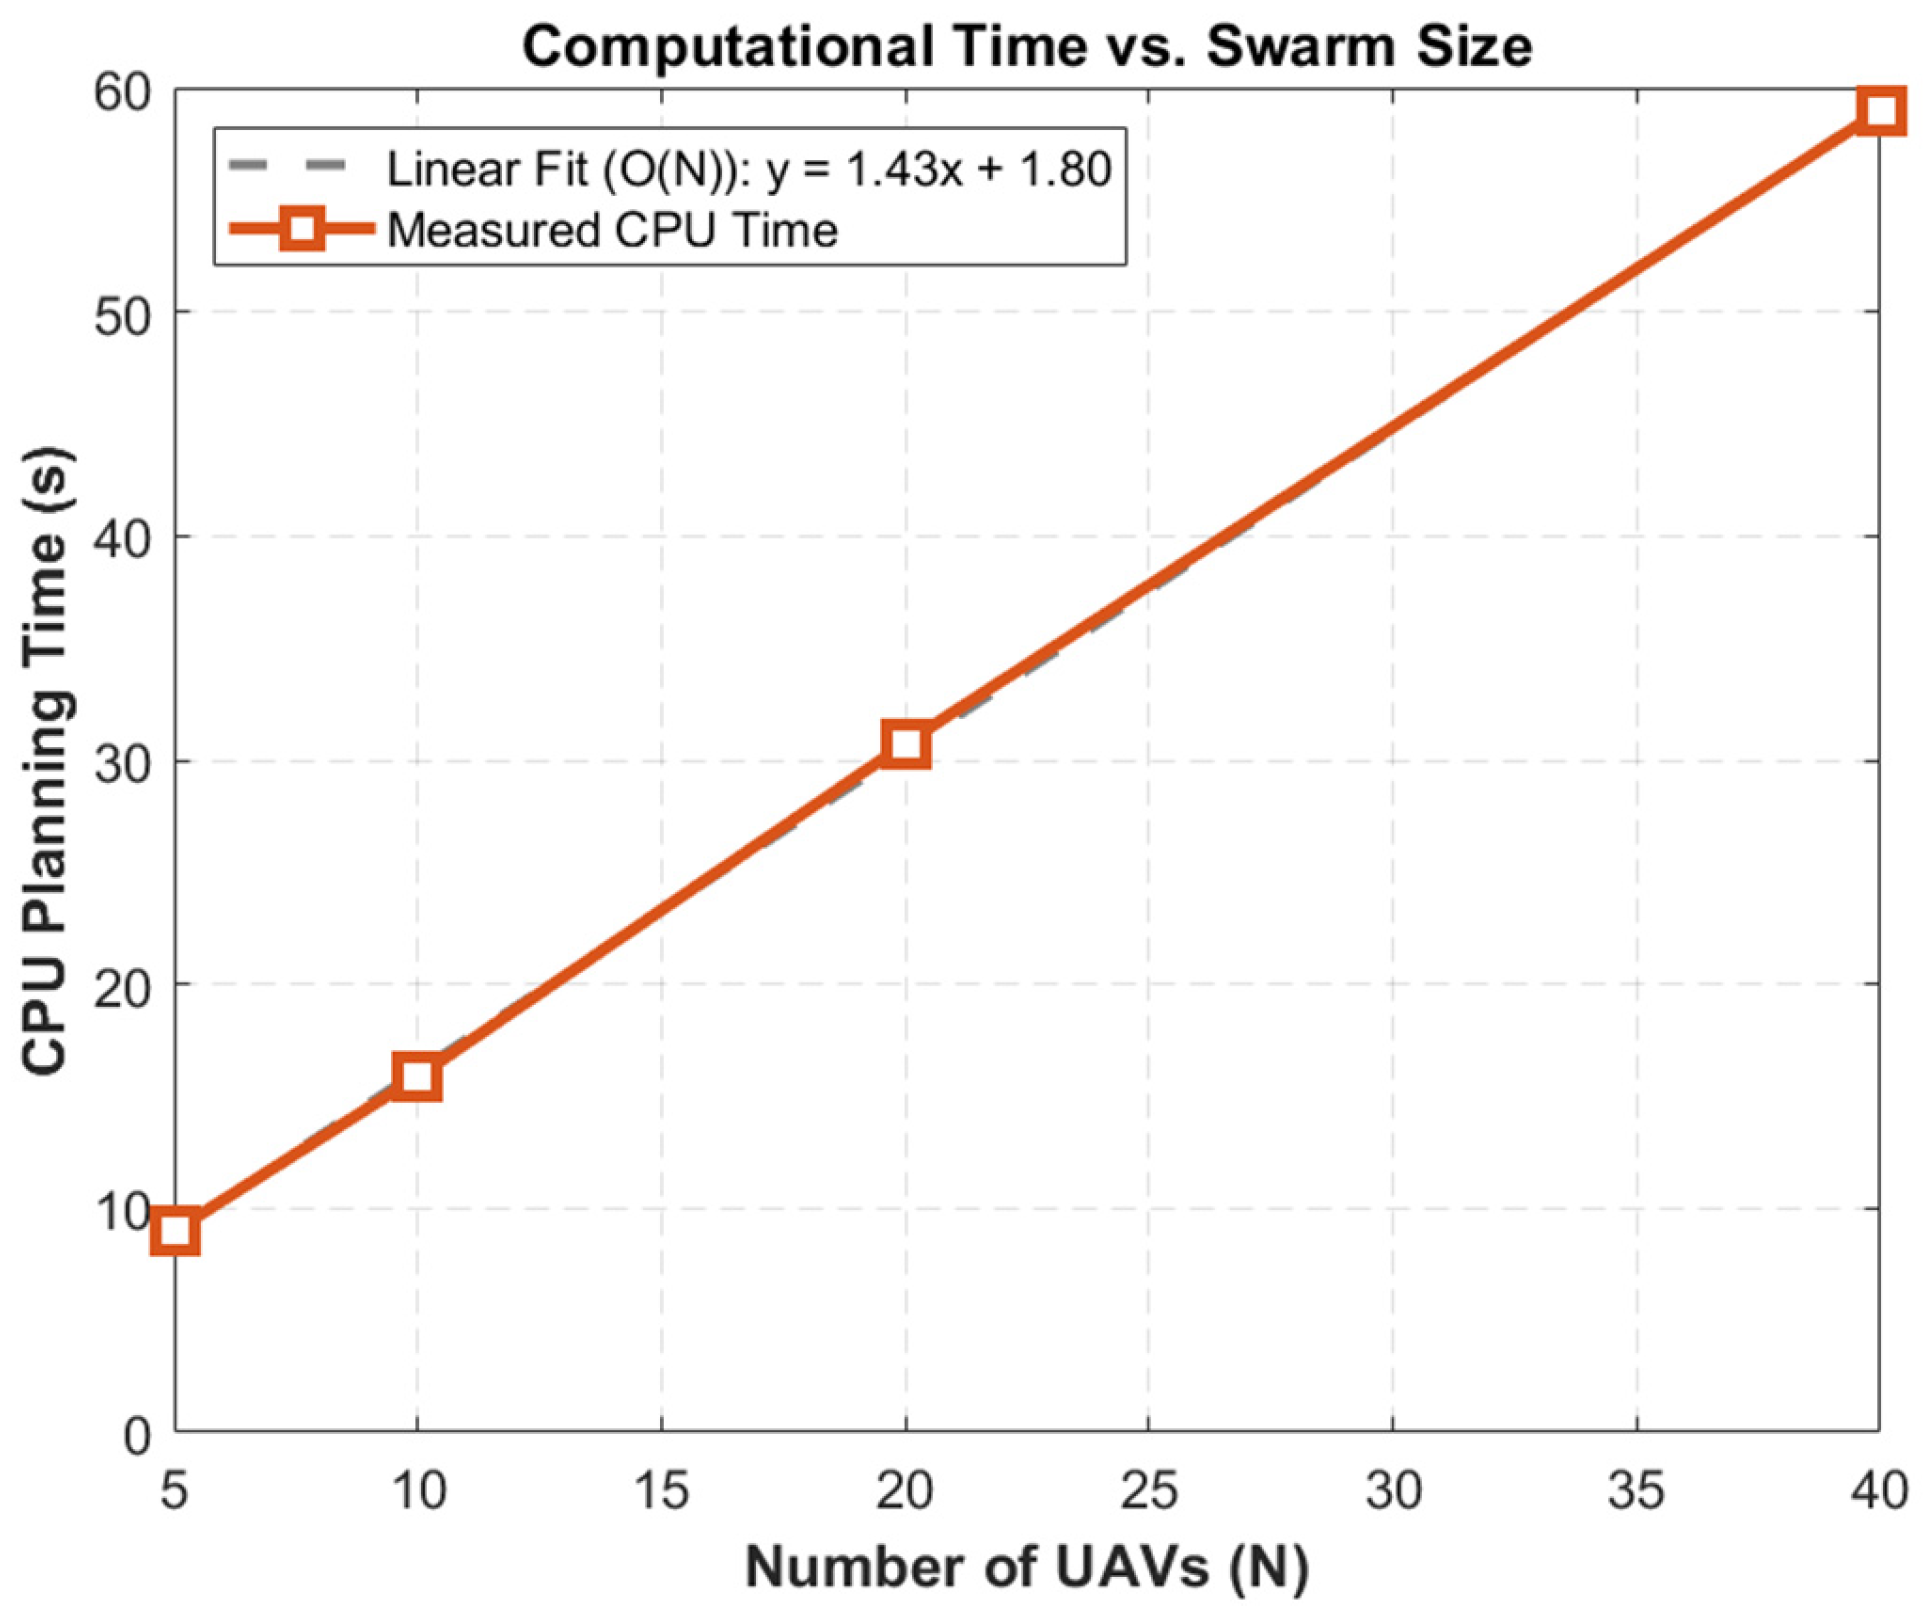
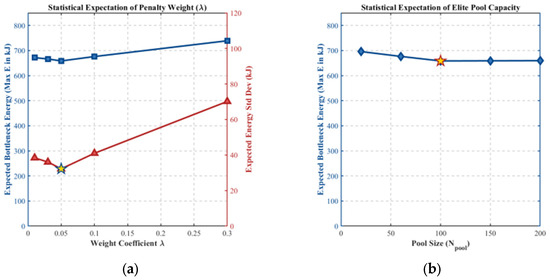
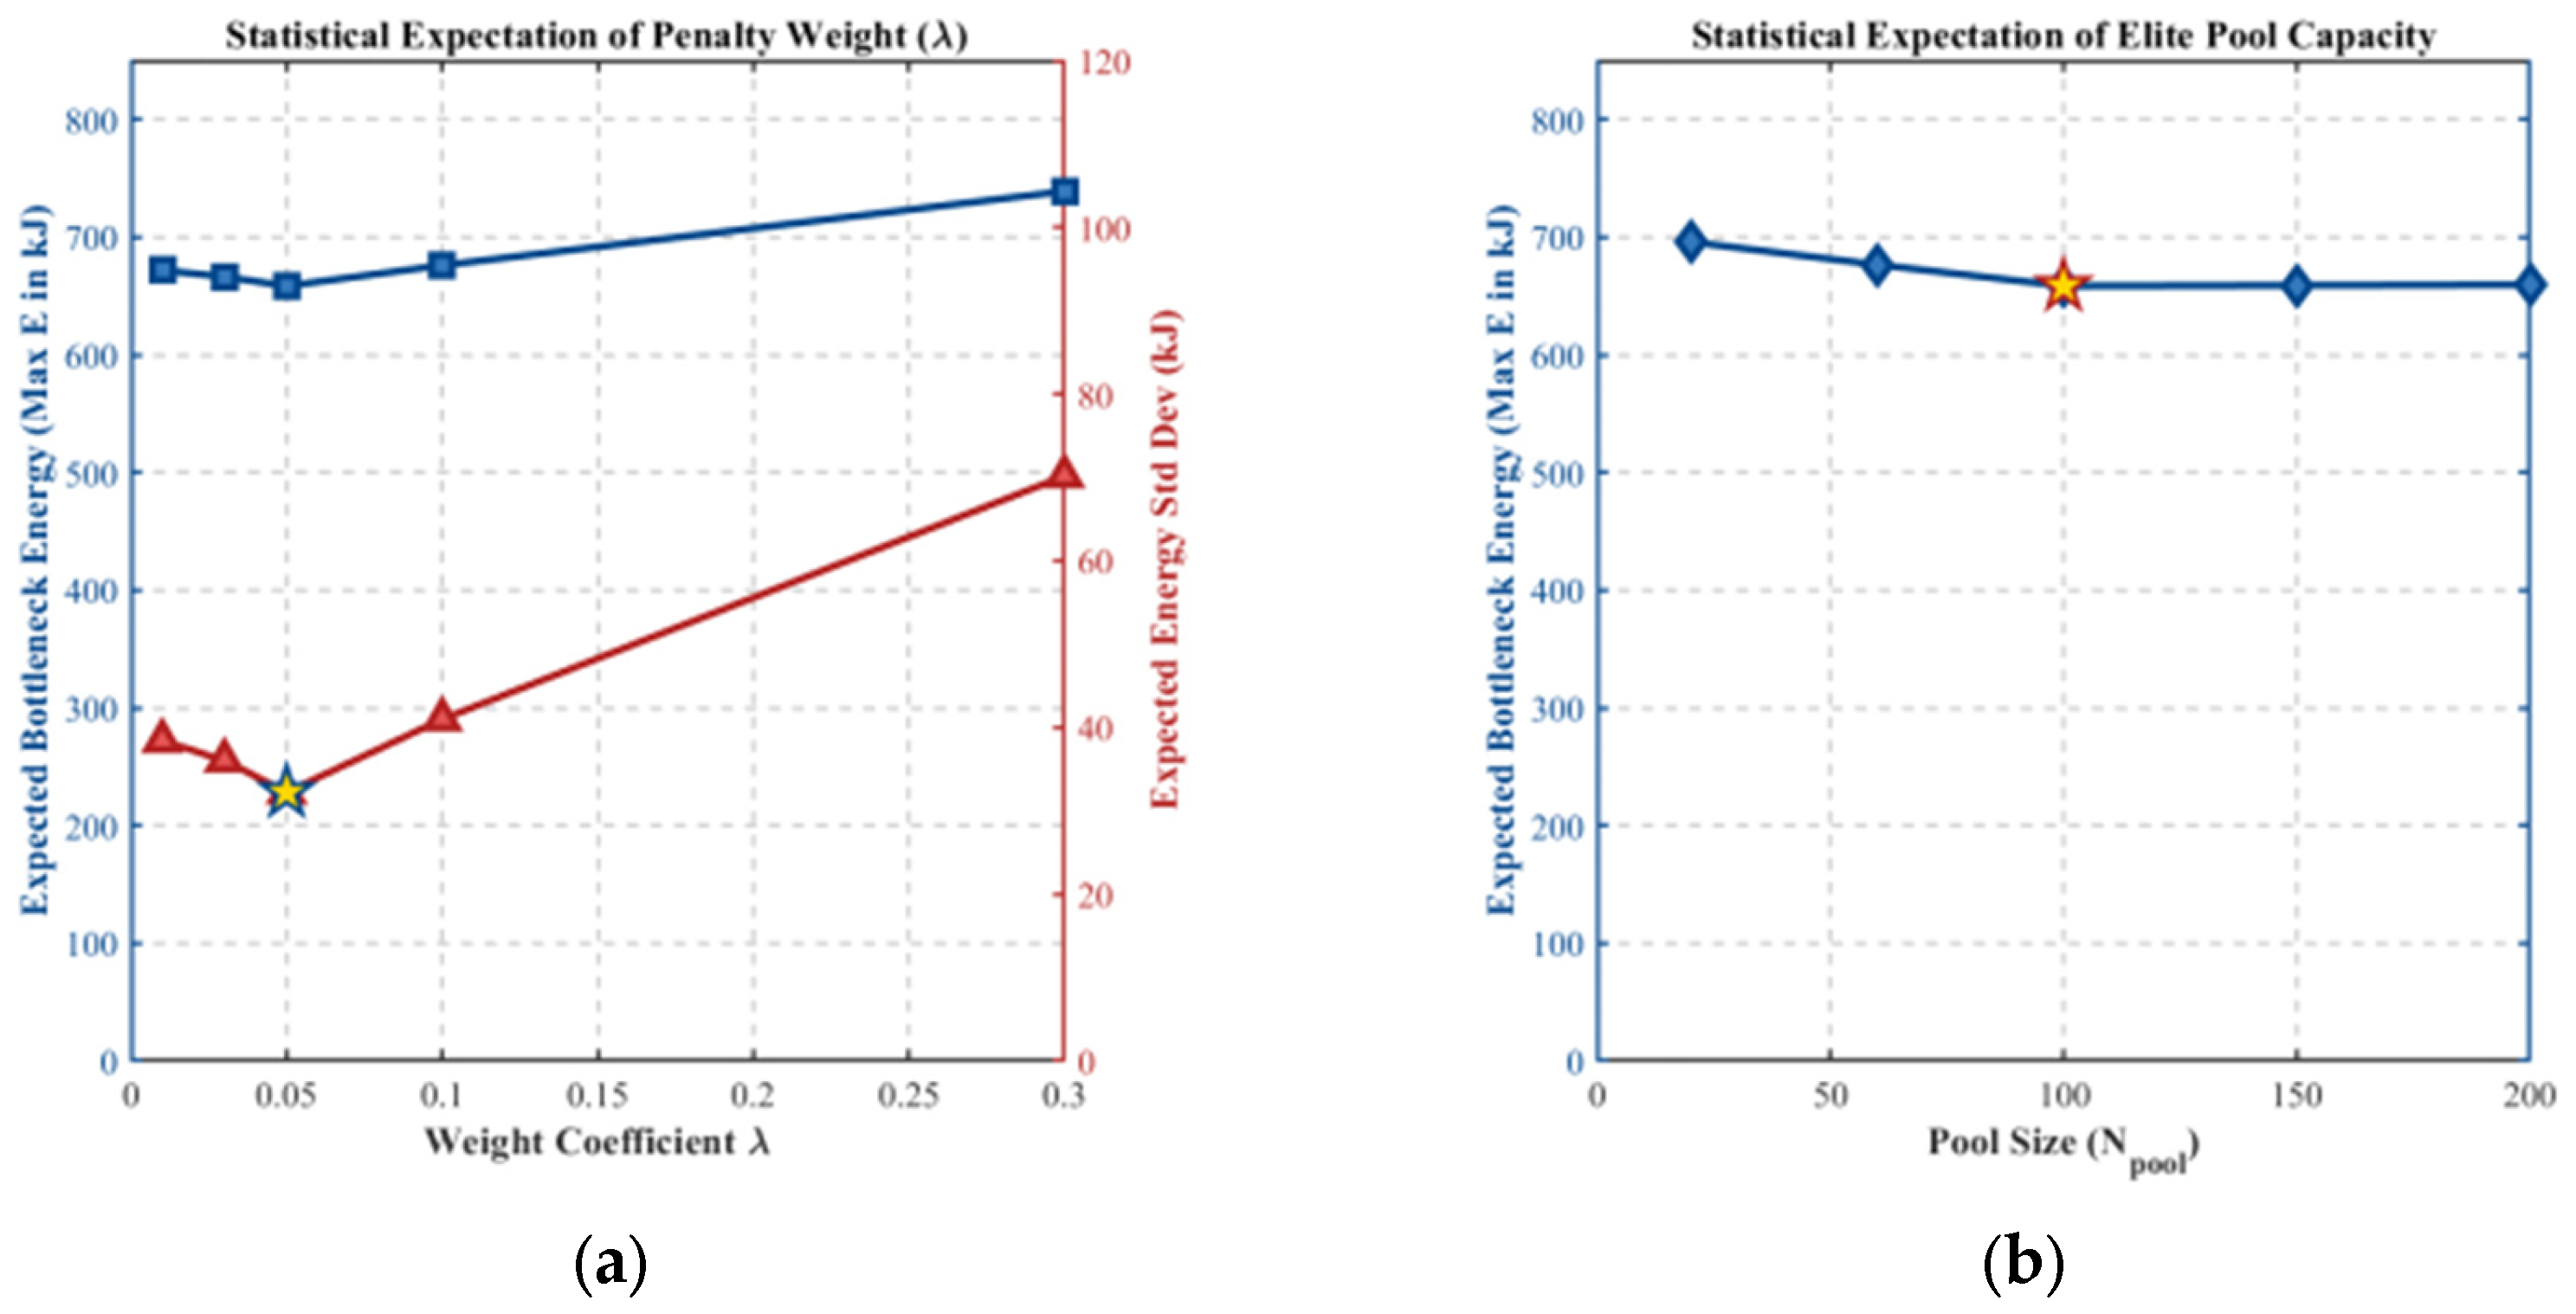

Disclaimer/Publisher’s Note: The statements, opinions and data contained in all publications are solely those of the individual author(s) and contributor(s) and not of MDPI and/or the editor(s). MDPI and/or the editor(s) disclaim responsibility for any injury to people or property resulting from any ideas, methods, instructions or products referred to in the content. |
© 2026 by the authors. Licensee MDPI, Basel, Switzerland. This article is an open access article distributed under the terms and conditions of the Creative Commons Attribution (CC BY) license.