


Highlights
What are the main findings?
- Multi-site experiments demonstrate that parameter calibration significantly influences the visual quality of 2D reconstructions for linear infrastructures, such as pavement.
- The implementation of Smart Oblique Capture does not yield a statistically significant improvement within the context of linear infrastructures, despite incurring higher computational costs and requiring a larger number of image acquisitions.
What are the implications of the main findings?
- The proposed calibration framework provides a practical and reproducible mission-planning baseline for municipal-scale Unmanned Aerial Vehicle pavement surveys.
- This method enables high-fidelity, sub-centimeter scale 2D reconstructions while minimizing redundant image capture and unnecessary computational overhead.
Abstract
The rapid deterioration of road infrastructure requires accurate and efficient methods for detecting pavement distresses. Unmanned Aerial Vehicles (UAVs) have emerged as a reliable alternative to conventional inspection techniques, enabling high-resolution data acquisition and improved operational safety. This study investigates the application of the Smart Oblique Capture (SOC) technique for pavement inspection through a systematic calibration of UAV flight parameters, including Ground Sample Distance (GSD), frontal and lateral overlap, camera tilt angle, and flight pattern. A structured experimental campaign was conducted, comprising 135 parameter combinations evaluated across three independent scenarios, resulting in a total of 405 UAV flights. The analysis focused on assessing the impact of these parameters on the visual quality of two-dimensional pavement reconstructions and processing efficiency. The results show that a configuration consisting of a 0.5 cm/pixel GSD, 70% frontal overlap, 80% lateral overlap, and a 70° camera tilt angle achieves the best balance between reconstruction quality and computational cost. Furthermore, the findings indicate that Smart Oblique Capture does not provide a statistically significant improvement in reconstruction quality for linear infrastructure compared to conventional oblique configurations, despite requiring a higher number of images and longer processing times. Overall, the results demonstrate that flight parameter calibration plays a more critical role than the adoption of advanced acquisition strategies such as Smart Oblique Capture. This study provides practical and reproducible guidelines for UAV-based pavement inspection, supporting efficient data acquisition while minimizing redundant information and unnecessary computational costs in infrastructure monitoring workflows.
1. Introduction
Pavement infrastructure constitutes a fundamental component of global transportation networks, supporting economic development and societal connectivity. However, these critical assets are continuously exposed to degradation caused by traffic loads, environmental conditions, and aging. This leads to a wide range of surface pathologies, such as cracks, potholes, rutting, and irregularities, that compromise road safety and performance [1]. Therefore, timely and accurate detection and characterization of these defects are essential for effective maintenance planning and decision-making [2].
Conventional pavement inspection methods, including manual visual surveys and vehicle-mounted systems, remain widely used [3]. However, these techniques are labor-intensive, time-consuming, potentially hazardous, and often yield subjective or inconsistent results [4]. The adoption of Unmanned Aerial Vehicles (UAVs) has emerged as a transformative approach for infrastructure monitoring, offering rapid, cost-effective, and high-resolution data collection [5]. Their integration into pavement assessment workflows, particularly through high-quality photogrammetry, has opened new possibilities for comprehensive surface analysis [6].
While nadir photography has been the standard for orthomosaic generation, it often fails to capture the intricate volumetric details of complex pavement pathologies, such as pothole depth and edge delamination [7]. UAV platforms equipped with digital imaging sensors allow the generation of two-dimensional (2D) orthomosaics and three-dimensional (3D) models through Structure-from-Motion (SfM) and Multiview Stereo (MVS) photogrammetry, facilitating detailed characterization of surface deformations and defect geometries [8]. Consequently, alternative imaging strategies are being explored to improve data acquisition beyond conventional nadir photography, advancing model reconstruction of pavement pathologies for inspection.
Among UAV imaging techniques, oblique image acquisition, capturing surfaces from multiple angled perspectives, provides significantly richer visual information than traditional nadir imagery [9]. This is especially relevant for quantifying complex surface features, such as crack depths or pothole volumes [7]. However, the effectiveness of UAV-based surveys for quantitative pathology analysis hinges on the precision and reliability of data acquisition [10]. Issues such as lens distortion, inaccurate flight trajectories, and improper sensor alignment can severely degrade the quality of 3D reconstructions, leading to unreliable defect measurements [11]. These challenges are further amplified in oblique imaging due to varying Ground Sample Distance (GSD) and occlusion risks.
To fully exploit the potential of UAV for pavement pathology inspection, optimizing flight parameters tailored for oblique capture is therefore essential and requires further empirical investigation, such as flight altitude, overlaps, camera angles, and flight pattern [12]. For example, research indicates that while lowering altitude improves GSD, it exponentially increases the number of images, thereby extending computational processing times and battery consumption [13]. Furthermore, the introduction of oblique angles significantly enhances the reconstruction of 3D digital twins, but it also introduces distortions that must be mitigated through precise parameter optimization [14]. While some work has developed systematic approaches for calibrating UAV flight parameters for pothole 3D reconstruction [7], a comprehensive calibration methodology that explicitly addresses oblique imaging requirements on quality and efficiency remains lacking.
In parallel, Smart Oblique Capture (SOC) techniques have emerged as a promising solution to enhance the quality of aerial imaging and increase the efficiency of pavement pathology detection [15]. Unlike traditional orthogonal or vertical captures, SOC allows UAV to capture images at oblique angles, providing multiple perspectives of the pavement surface. This improves the detection of subtle pathologies, such as edge cracks or wear patterns, which may not be visible in top-down images. Furthermore, when combined with high-resolution imaging and automated processing tools, SOC facilitates a more comprehensive and detailed analysis of pavement conditions, reducing the need for ground-based inspections [16].
Despite the increasing use of UAV in road condition monitoring, there remains a critical gap in the literature concerning the calibration of UAV flight parameters and imaging systems tailored specifically for SOC photogrammetry in pavement inspection. In this paper, we propose a robust and adaptive calibration framework designed to optimize SOC for the precise inspection of pavement pathologies. The methodology considers dynamic flight conditions and sensor configurations to enhance the visual quality of model reconstructions. This research aims to advance intelligent infrastructure monitoring by providing a reliable approach for UAV-based pavement assessment, improving both processing efficiency and visual interpretability.
2. Related Works
2.1. Unmanned Aerial Vehicle (UAV) in Pavement Pathology Inspection
The use of UAV in pavement pathology inspection has expanded rapidly, enabling non-disruptive monitoring of high-traffic roads and hard-to-reach infrastructure, such as airport runways and bridge decks [17]. Building upon traditional manual and vehicle-based inspection methods, UAV-based approaches offer significant improvements in safety, efficiency, and image resolution [14]. Studies have demonstrated that photogrammetry-derived data from UAV could provide information on par with, or even superior to, traditional methods, particularly for local and collector roads [18].
Early UAV applications primarily focused on demonstrating their feasibility for infrastructure monitoring, enhancing safety and reducing inspection time compared to traditional visual surveys [4]. Eisenbeiss and Sauerbier (2011) [19] used low-cost UAV for photogrammetric mapping, laying the foundation for high-resolution road surface imaging. Tong et al. (2015) demonstrated how georeferenced UAV data could support spatial analysis and Pavement Management Systems [20]. In recent years, sensor fusion has also emerged as an important trend, particularly for detecting subsurface conditions. Recent studies on flexible pavements have demonstrated that UAV can identify crack locations with a 96% accuracy rate [21].
The development of sophisticated flight planning software has enabled systematic data collection with precise overlaps, crucial for generating high-quality orthophotos and 3D models of pavement surfaces through photogrammetry [22]. These 2D and 3D models provide a robust foundation for interpreting road damage and even measuring the dimensions of distresses without requiring on-site inspections [23]. For example, recent work demonstrated a UAV photogrammetry-based method for accurately measuring pothole size, shape, and location, offering a more efficient alternative to traditional field methods [24]. These 3D approaches are especially valuable for calculating volumetric characteristics that inform repair prioritization and maintenance planning.
Moreover, UAV imagery processing combined with machine vision techniques is increasingly common in recent studies [25]. Chen et al. [6] proposed a systematic UAV inspection framework in which flight planning, data acquisition, and deep learning-based crack detection are tightly integrated, improving practicality and effectiveness in operational deployment. Zhang et al. [14] extended UAV systems via binocular vision and edge detection to quantify crack widths without pre-set distances, achieving robust crack detection and localization performance. A benchmark dataset with more than 11,000 pavement distress images was collected by Yan et al. [26] using UAV, supporting the development of deep learning models capable of detecting multiple distress types. Furthermore, research indicates that most current UAV inspection studies still rely on offline processing workflows, with limited real-time detection capability, and are unevenly distributed across pavement types, with flexible asphalt pavements dominating the literature [27].
More recent efforts have focused on developing autonomous UAV workflows, optimizing flight paths, incorporating real-time processing, and even embedding edge computing capabilities for onboard analysis. Nevertheless, several challenges remain, such as coping with variable lighting conditions, occlusions, diverse pavement materials, and regulatory constraints. Importantly, most current UAV-based studies rely on nadir imagery and do not fully exploit the advantages of oblique image capture. Moreover, few address the critical role of flight parameter calibration in ensuring high-fidelity model reconstructions and accurate pathology quantification. These gaps motivate the present research, which explores a SOC approach with a tailored calibration framework for UAV-based pavement inspection.
2.2. SOC for UAV
Unlike traditional nadir aerial or ground-based imaging, Oblique Capture (OC) provides richer 3D information, revealing structural details and complex scene geometries, and complex scene geometries that are obscured from a purely vertical viewpoint. For example, Diaz et al. (2022) [28] investigated the use of UAV with oblique capture techniques for collecting flood-sensitive data and obtaining accurate measurements. Khoramshahi et al. (2023) [29] coupled OC detector with clustering methods through the photogrammetric intersection of space rays.
SOC refers to advanced techniques designed to acquire imagery from non-nadir perspectives, often leveraging intelligent automation, computational photography, and multi-sensor integration, with UAV playing a pivotal role. For example, Yan et al. (2025) [30] combined UAV and SOC with refocusing technique to detect small power components in images. Gao et al. (2025) [31] integrated UAV Smart Oblique photography, high-resolution images, and Building Information Modelling to improve data accuracy and consistency and 3D visualization. Bi et al. (2025) [32] proposed a method was developed for accurate point cloud generation of SOC for sun-view geometry in high spatial-resolution UAV multi-spectral imagery.
The “smart” aspect implies the use of intelligent algorithms for optimal data acquisition, processing, and subsequent analysis, moving beyond mere manual or pre-programmed flight paths to adaptive and context-aware capture strategies. For example, Lopez et al. (2025) [33] placed ground control points on ground to generate virtual tours for 3D models of archaeological castle remains in SOC. Bolkas et al. (2024) [34] reported that the superior performance of the photogrammetric Smart Oblique feature with high accuracy and the data gaps were caused by limitation of key points identification.
This approach has become increasingly vital in applications such as 3D city modelling, urban planning, cultural heritage documentation, infrastructure inspection, and disaster assessment. For example, SOC was implemented by Molina et al. (2024) [35] on bridge inspection and bridge components were inspected accurately in the visual 3D models, while soft clustering methods were used by Tan and Li (2019) [36] on UAV oblique photogrammetry-derived 3D road models to improve distress detection performance on overlapping pavement features and subtle surface variations. Kjellander et al. (2024) [37] applied SOC to capture images simultaneously in two directions at 60° forward and backward to halve the number of flights. Kim et al. (2023) [38] compared the SOC technique with conventional and terrain-based aerial acquisition methods on drone mapping of the target area. SOC was also applied to generate 3D models of unknown infrastructure with less requirements on manual flights by Bartlett et al. (2023) [39].
Despite these advantages, several challenges remain in computational demands, data management, and semantic understanding persist. Ongoing research and the integration of artificial intelligence promise even more intelligent, efficient, and comprehensive oblique capture systems in the future, further blurring the lines between the physical and digital worlds. Specifically, significant gaps remain in the calibration of optimal UAV flight parameters for SOC-based photogrammetry in pavement inspection, and thus it is investigated in this research.
2.3. UAV Flight Parameters in the Literature
The efficacy and quality of UAV photogrammetric surveys are intrinsically linked to the understanding and optimization of various flight parameters. These parameters directly dictate the resolution, accuracy, completeness, and overall efficiency of the acquired data and the subsequent photogrammetric products [40]. Key considerations during the flight preparation phase include the selection of appropriate sensors, determination of flight altitude and GSD, management of flight speed, configuration of image overlap settings, planning of the flight pattern and direction, and specification of the viewing angle [41].
Table 1 summarizes multiple UAV flight parameters considered in SOC-based UAV surveys in previous studies, such as flight altitude, frontal overlap, vertical overlap, angles of cameras, and speeds.
Flight altitude refers to the UAV’s height above ground level during a survey operation, while GSD quantifies the real-world size of each pixel in a drone-captured image, typically expressed in centimeters per pixel (cm/px) [42]. These two parameters exhibit a directly proportional relationship: as the flight altitude increases, the GSD also increases, resulting in a reduction of image resolution and detail, while flying at a lower altitude yields a smaller GSD, thereby capturing more detailed images [43]. The scope of the captured scene is influenced by both GSD and flight altitude. Therefore, GSD was selected in this study as the parameter representing flight altitude.
Image overlap indicates the shared area between consecutive images captured by the UAV. For example, frontal overlap denotes the overlap between images captured along the flight line, while vertical overlap describes the overlap between images in adjacent flight lines [44]. Sufficient overlap is paramount for the photogrammetric software to accurately align images, identify corresponding points, and reconstruct detailed 2D maps and 3D models [45]. Therefore, frontal and lateral overlaps are commonly investigated in the literature.
The camera and sensor specifications are fundamental to the quality and characteristics of the captured imagery. For instance, camera angle directly influences the field of view and magnification of the images [46]. It is a critical parameter for accurately calculating 3D models and ensuring the accuracy of mapping outputs in oblique capture approaches, and the choice of camera angles has a direct impact on mission efficiency and data quality [47]. A wider range of camera angles captures a larger area in a single shot, leading to fewer images, shorter flight times, and faster processing, while this often comes with a trade-off of potentially less detail per image [48].
Flight speed defines the velocity at which the UAV traverses the survey area, and it directly impacts both the area that can be covered during an operation and the number of captured images [49]. However, a previous study indicates that flight speed is not a significant parameter for the accuracy of UAV image capture, and a slower speed does not improve the accuracy [50]. Therefore, flight speeds were defined automatically at the default recommended values in the control system of UAV platform, according to GSD, frontal overlap, and flight pattern, to ensure the flight efficiency and quality.
Table 1.
Researches and parameters using Smart Oblique Capture (SOC) technique.
2.4. Calibration of UAV Flight Parameters
UAV flight calibration is a multifaceted process encompassing sensor-level tuning, control algorithm optimization, environmental adaptation, and mission-specific flight configurations [59]. In terms of control systems, the tuning of Proportional-Integral-Derivative controllers has seen improvements through optimization algorithms such as genetic programming and adaptive control methods that adjust parameters in real-time based on dynamic conditions, as indicated by Say et al. (2021) [60] and Huang et al. (2021) [61].
Early studies in UAV calibration primarily focused on tuning flight control systems, particularly Proportional-Integral-Derivative controllers based on trial-and-error methods, as demonstrated by Hartzer et al. (2022) [62]. More recent efforts have transitioned toward model-based calibration techniques. For example, researchers have proposed sing system identification techniques, such as Least Squares Estimation and Extended Kalman Filters, to estimate aerodynamic coefficients and dynamic parameters from flight data, as shown in Eckenhoff et al. (2020) [63]. A recent study by Lemus-Romani et al. (2025) [12] investigated the calibration of UAV flight parameters to balance orthomosaic visual quality and operational efficiency, and results showed that calibrated image overlap improves spatial accuracy without generating redundant data.
More dynamic aspects of flight calibration involve adapting to environmental conditions and payload variability, which can alter a UAV’s center of gravity or aerodynamic profile. Robust control strategies and online estimation techniques have been proposed to mitigate these effects by Satici et al. (2013) [64] and Du et al. (2025) [65]. Another crucial aspect of UAV flight parameter calibration is related to propeller and motor characteristics. Propulsion system calibration, especially motor-propeller dynamics, also influences flight stability and energy efficiency, with studies emphasizing static thrust testing and aerodynamic modelling by Ito et al. (2022) [66] and Ning et al. (2017) [67].
Specifically for oblique image capture, several recent studies have begun addressing the need for precise flight parameter calibration. Moraes and Silva (2024) [68] evaluated the effects of varying image overlap and camera tilt angles, recommending 70%–80% overlap and 45° oblique angles to optimize 3D model quality. Sun et al. (2025) [69] found that a 45° tilt at an altitude of 20 m outperformed nadir-only datasets in Machine Learning-based pathology classification. Similarly, Hu et al. (2024) [70] identified optimal altitudes and angles based on reconstruction accuracy, suggesting oblique photography at 40 m height yielding the highest reconstruction accuracy.
More recently, SOC has been investigated as a framework for optimizing UAV flight parameter calibration. A more comprehensive approach was proposed by Maes (2025) [41], who examined sensor selection, flight height, overlap, and image acquisition settings for SOC approach in multiple spectral ranges, producing guidelines for RGB, multispectral, and thermal applications. Different combinations of parameters were applied by Spierenburg (2024) [53] for 9 SOC flights leading to 14 flight protocols, and a higher point density and completeness were obtained with a flight height of 100 m and a sideway overlap of 80%. Kunnapuu et al. [57] investigated the efficiency and time requirements of SOC considering the large amount of data processing, indicating that an overlap of 70% and an inclination angle at 70° were efficient to reduce the number of aerial images and processing time.
These studies highlight a growing recognition of the critical role that flight calibration plays in the success of UAV-based modelling and pathology inspection using SOC techniques. However, the literature remains fragmented, and a standardized, adaptive calibration framework tailored to UAV-based pavement pathology identification is still lacking. Therefore, this study aims to address that gap by proposing a systematic methodology for optimal UAV flight parameter calibration under SOC scenarios.
3. Methodology
The proposed methodology consists of three main stages: (i) automated UAV flight planning under different parameter configurations, (ii) photogrammetric reconstruction of pavement models, and (iii) multi-criteria evaluation of the resulting products based on model reconstruction quality and processing efficiency.
3.1. Definition of the Study Area
The experiments were conducted south of the Macul district in Santiago, Chile, as shown in Figure 1. The study area comprised several streets within the San Joaquín Campus of the Pontificia Universidad Católica de Chile. These streets were divided into three segments, which were defined as independent experimental sites.
Figure 1.
Definition of flight areas from Google Maps (v2025).
UAV flight missions were designed to be conducted during periods of minimal vehicle and pedestrian traffic in order to reduce safety risks and avoid potential privacy concerns during flight operations.
After defining the study area, UAV missions were planned to collect high-resolution images of pavement surfaces for subsequent model reconstruction. The flights were carried out between 11:00 and 13:00 during December 2025 and January 2026 (summer season), when solar illumination is high and shadow effects are minimized.
Environmental conditions were verified prior to each UAV takeoff to ensure stable flight operations. Only windless and sunny days in Santiago were selected to guarantee optimal image acquisition conditions.
The differences in data acquisition conditions across the three experimental sites are primarily related to variations in the surrounding environment along the road corridors. All study areas correspond to asphalt pavements with two-lane bidirectional roads; however, the presence of vegetation and built structures varies significantly between sites.
As shown in Figure 1, experimental site 1 is characterized by an open environment with minimal obstructions, where almost no trees or buildings are present along the road. This condition allows for relatively unobstructed image acquisition. In contrast, experimental site 2 includes a higher presence of roadside vegetation, with multiple trees located along the corridor. These elements partially obstruct the field of view and introduce localized shadowing effects. Experimental site 3 presents the highest level of environmental complexity, with both trees and buildings located adjacent to the road. This configuration increases the degree of visual obstruction and shadow generation compared to the other sites. These variations in environmental conditions are expected to influence image acquisition and photogrammetric reconstruction processes, particularly in terms of visibility and illumination consistency.
3.2. Selection of UAV Flight Parameters
As shown in Table 1, the reviewed studies investigated several aspects of SOC-based UAV missions depending on their flight objectives and tasks. Based on this literature review and the technical specifications of the sensor, a set of flight parameters was defined for the experimental campaign.
A series of experiments was conducted to collect pavement pathology data using different combinations of flight parameters. The objective was to determine the optimal configuration that optimize the visual quality of pavement model reconstruction. The parameters analyzed in this study included GSD, frontal overlap, lateral overlap, camera angle, and flight pattern.
To systematically evaluate the performance of the SOC method, a comprehensive parametric sweep including 135 unique flight configurations was executed. The accuracy of the processed datasets was compared across all parameter combinations in order to identify robust flight settings for SOC missions. The complete list of flight configurations is presented in Table 2, Table 3 and Table 4.
Table 2.
135 combinations of flight parameters—Part 1.
Table 3.
135 combinations of flight parameters—Part 2.
Table 4.
135 combinations of flight parameters—Part 3.
Parallel experiments were conducted across the three experimental sites to assess the consistency of the results obtained from the 135 parameter combinations. This approach increased the reliability of the calibration process for identifying optimal UAV flight parameters.
The parameter ranges were derived from both the reviewed literature (Table 1) and the technical capabilities of the UAV platform. In contrast to many previous studies, GSD was selected as the primary independent variable to ensure constant spatial resolution. Flight altitude was therefore adjusted accordingly, ranging from 18.6 m to 37.2 m.
Three GSD values were evaluated: 0.5 cm/px, 0.75 cm/px, and 1 cm/px, corresponding to flight altitudes of 18.6 m, 27.9 m, and 37.2 m, respectively. These altitudes remain well below the maximum permitted flight altitude of 120 m established by the Chilean aviation authority (Dirección General de Aeronáutica Civil, DGAC).
Frontal overlaps were set at 60%, 70%, and 80%, while lateral overlaps were defined within the same range, based on recommendations from previous studies.
Oblique camera angles were introduced to capture images of the pavement surface from different perspectives. Four camera angles were evaluated (60°, 70°, 80°, and 90°) in order to determine the optimal range for accurate oblique image acquisition of pavement surfaces.
Flight patterns were also investigated to analyze the performance of the SOC mode compared with conventional oblique image capture. In this study, SOC missions were executed using different GSD values and overlap combinations, while the camera angles were automatically adjusted during flight. Because SOC dynamically controls the camera orientation, predefined oblique camera angles were not required.
The flight speed was automatically determined based on the selected flight altitude and overlap configuration in order to maximize processing efficiency during data acquisition. Although flight speed is discussed in the literature as a relevant parameter, it was not considered an independent variable in this investigation. Instead, it was treated as a dependent outcome of the selected flight parameters and later analyzed in terms of time and cost efficiency.
Interactive effects of flight parameters and the default recommended flight speed in UAV control system were also observed, as indicated in Table 2, Table 3 and Table 4. In general, the recommended flight speed increased with the GSD value but not related to the camera tilt angle. Meanwhile, the speed decreased with the frontal overlap but not influenced by the lateral overlap. Moreover, the recommended speeds in SOC flights were lower than those in normal, and it could be attributed to the different capturing patterns.
Each flight plan was identified using a structured nomenclature that encodes the selected parameters: experimental site (1, 2, 3), GSD (GSD05, GSD075, GSD1), frontal overlap (TF60, TF70, TF80), lateral overlap (TL60, TL70, TL80), camera angle (A60, A70, A80, A90), and flight pattern (Normal or SOC).
For example, the code “1-001-GSD05-8080-A90” corresponds to the first flight conducted at experimental site 1 with a GSD of 0.5 cm/px, 80% frontal overlap, 80% lateral overlap, a 90° camera angle, and a normal flight pattern. Similarly, the code “3-135-GSD1-6060-A90-SOC” represents the final flight conducted at experimental site 3 with a GSD of 1 cm/px, 60% frontal overlap, 60% lateral overlap, and SOC flight mode.
Other UAV settings were kept constant throughout the experiments to isolate the effects of the investigated parameters. The collection mode was set to Orthophoto, as pavement surfaces can be considered planar objects. The altitude mode was configured as ALT to maintain a constant flight altitude relative to the takeoff point, ensuring a stable GSD throughout the mission.
Additionally, the photography mode was configured to capture images using a distance-based interval, ensuring that photographs were acquired at regular spatial intervals along the flight trajectory and guaranteeing consistent forward overlap regardless of flight speed variations.
3.3. SOC Flights
A DJI Matrice 4 Enterprise UAV (DJI Inc. Shenzhen, Guandong, China) was used in this study to conduct both conventional oblique and SOC flights over the experimental road sections. The UAV platform is equipped with a 20 MP micro four-thirds CMOS sensor and multiple lenses with equivalent focal lengths of 24 mm, 70 mm, and 168 mm, which directly influence image resolution and Ground Sample Distance (GSD) during data acquisition. The camera system incorporates a mechanical shutter, minimizing motion-related distortions and improving photogrammetric reconstruction quality. In addition, pre-calibrated lens distortion correction ensures residual distortion below 2 pixels, supporting geometric reliability in orthomosaic generation. The system also enables high-frequency image acquisition (minimum interval of 0.5 s), which is essential for achieving the required overlap configurations. Furthermore, the UAV supports multi-directional oblique image capture, which is directly aligned with the SOC strategy implemented in this study.
The UAV is equipped with a rotatable camera system that supports five-directional oblique image acquisition. Its 3-axis gimbal enables the camera to rotate automatically and capture images from multiple viewing angles during a single flight mission.
The SOC function allows automated flight grid planning based on a predefined mission area. Using an initial rough model of the study area, the system intelligently generates optimized flight paths to support high-quality model reconstruction through the SOC workflow.
Lens distortion is a common issue in photogrammetric imaging. To address this, the DJI processing software includes built-in distortion correction, providing high-precision in-camera calibration with residual distortion errors below two pixels.
All flight missions were planned using Dronelink (v2025) software, which allowed the polygonal boundary of the study area to be defined and automatically configured the selected parameter combinations. During the planning stage, the software estimated flight time and the expected number of photographs, which were later compared with the actual values recorded during field operations.
The UAV positioning system relies on a Global Navigation Satellite System (GNSS) integrating GPS and Real-Time Kinematics (RTK) to improve the accuracy of flight trajectories. The hovering accuracy of the UAV is ±0.1 m, while RTK positioning provides horizontal accuracy of 1 cm + 1 ppm and vertical accuracy of 1.5 cm + 1 ppm.
SOC flights were then performed at the three experimental sites using the 135 parameter combinations defined in the experimental design, as shown in Figure 2. Once the positioning system was initialized and environmental conditions were confirmed to be suitable, the UAV was launched by the operator. The flight missions were executed automatically using the remote controller, allowing the drone to take off and ascend to the predefined altitude and speed specified in the flight plan.
Figure 2.
Diagram of SOC flight.
Flight altitude and velocity were monitored in real time on the controller interface during the missions. Overlap parameters and image capture intervals were preconfigured to ensure constant image acquisition rates and consistent spacing between flight paths.
During SOC missions, the UAV automatically adjusted the grid flight paths over the experimental area according to the predefined mission parameters and altitude. Camera orientations were dynamically modified during the flight to optimize the image acquisition geometry for model reconstruction. The integrated GNSS and RTK systems continuously calibrated the drone’s position and altitude, ensuring accurate navigation and data acquisition.
Processing data from each flight were compiled into a structured database that included variables such as flight duration, aero-triangulation time, orthophoto time, and number of photos captured. Processing time was calculated as the sum of aero-triangulation time and orthophoto time. This allowed the processing efficiency of each parameter configuration to be evaluated.
The images collected during each mission were organized according to the predefined parameter combinations and stored in individual folders following the standardized flight nomenclature. This procedure ensured full traceability and consistency throughout the processing workflow.
Image processing was performed on a workstation equipped with Windows 11, an Intel Xeon E5-2680 v4 processor (Intel Inc. Santa Clara, CA, USA) (28 threads), 128 GB of RAM (2400 MHz), 2 TB of storage, and an NVIDIA RTX 3060 graphics card (NVIDIA Inc. Santa Clara, CA, USA) (12 GB VRAM).
3.4. 2D Model Reconstruction
In this study, the photogrammetric reconstruction process was performed using a consistent workflow across all experiments in order to isolate the effects of UAV flight parameters on the final model quality. The methodology is therefore centered on analyzing how variations in data acquisition influence the quality of the reconstructed products under controlled processing conditions. This approach ensures methodological consistency and allows the observed differences in the results to be directly attributed to the flight parameter configurations.
2D reconstruction of the pavement surfaces was performed using Bentley ContextCapture, a widely used photogrammetric software based on SfM and MVS techniques for converting 2D imagery into visually consistent 2D models.
The reconstruction workflow consisted of four main stages: (1) image alignment and camera pose estimation, (2) dense point cloud generation and surface reconstruction, (3) texture mapping and model refinement, and (4) generation of analytical products.
During the image alignment stage, key points were automatically detected and matched across overlapping UAV images. Camera intrinsic parameters and exterior orientations were simultaneously estimated through bundle adjustment. The inclusion of oblique imagery improved the spatial distribution of tie points across multiple viewing directions, resulting in a more robust camera network and improved reconstruction of pavement surface irregularities. The output of this stage was a sparse point cloud representing the global geometry of the surveyed pavement surface.
Subsequently, a dense point cloud was generated using MVS algorithms, which reconstructed detailed surface geometry from the aligned image set. The dense point cloud provided a high-resolution representation of pavement surface features and pathologies.
From the dense point cloud, a triangular mesh surface model was constructed to represent the continuous pavement geometry. Minor noise filtering and mesh refinement procedures were applied to remove outliers while preserving sharp features associated with surface pathologies. Special care was taken to avoid excessive smoothing that could alter the characteristics of cracks, potholes, or other pavement defects.
Texture mapping was then applied to the reconstructed mesh using the original RGB images captured during the UAV flights. This process enhanced the visual realism of the 2D models and facilitated the qualitative interpretation of pavement pathologies.
The final outputs included georeferenced dense point clouds, textured meshes, and high-resolution orthophotos derived from the UAV imagery. These products supported both qualitative visualization and quantitative analysis of pavement surface conditions.
For each of the 135 flight configurations, an independent 2D model was generated. The resulting models were organized in folders following the standardized flight nomenclature described previously, allowing direct association between the reconstructed models, the flight parameter configurations, and the corresponding evaluation metrics.
All reported experiments were conducted using identical configurations and parameters within ContextCapture (v24.1.7.5020) software. This ensures that the observed variations are due to the variables studied, such as flight parameter or image density, and not to inconsistencies in the algorithmic processing.
In addition, the value of this study lies not in the software itself, but in evaluating how capture parameters affect the final product. Maintaining the software under constant control allows the results to provide a solid foundation for understanding the relationship between data acquisition and reconstruction quality. These findings are transferable in terms of trends and principles to other photogrammetry platforms.
3.5. Evaluation of Visual Quality
Because pavement surfaces have unique geometric configurations that present distinct challenges compared to surveying large areas, the central objective and scope of this work is not to validate the visual interpretability of the system, but rather to specifically evaluate the visual quality obtained by applying the SOC approach in the context of linear infrastructure projects. Moreover, the ultimate goal of these captures is the interpretability of the data for pavement pathology identification, where visual quality is the critical factor for the success of a technical inspection. Therefore, a visual quality indicator is used in this study as the most representative and relevant evaluation metric.
In this investigation, a control target was used to quantitatively and objectively evaluate the visual quality obtained for each combination of UAV flight parameters, as shown in Figure 3 [12]. The target consisted of a 20 cm × 20 cm black-and-white grid composed of patterns of decreasing sizes, including 10 cm, 5 cm, 2.5 cm, and 1.25 cm. Therefore, the sharpness of the reconstructed pavement model could be assessed according to the smallest distinguishable pattern, reflecting the level of visual detail and spatial resolution.
Figure 3.
Diagram of control target.
For each experimental site, three control targets were placed near the pavement pathologies, as shown in Figure 4, Figure 5 and Figure 6. The visual detail of pavement pathologies was evaluated by identifying the smallest clearly distinguishable subdivision of the control targets in the reconstructed models.
Figure 4.
Three targets in Experiment 1 (circled in red).
Figure 5.
Three targets in Experiment 2 (circled in red).
Figure 6.
Three targets in Experiment 3 (circled in red).
Based on the smallest clearly distinguished pattern size, a quantitative rating scale of 0 to 5 was applied:
- -
- 0: The target is not distinguishable, it is invisible in the image, incomplete, cut off, or totally obstructed by some obstacle, as shown in Figure 7a.Figure 7. Examples of visual detail on the target: (a) The target is not distinguishable; (b) Only the general outline distinguishable; (c) 10 cm × 10 cm pattern distinguishable; (d) 5 cm × 5 cm pattern distinguishable; (e) 2.5 cm × 2.5 cm pattern distinguishable; (f) 1.25 cm × 1.25 cm pattern distinguishable.
- -
- 1: Only the general outline of the target is distinguishable, as shown in Figure 7b.
- -
- 2: The 10 cm subdivision is clearly distinguishable, as shown in Figure 7c.
- -
- 3: The 5 cm subdivision is clearly distinguishable, as shown in Figure 7d.
- -
- 4: The 2.5 cm subdivision is clearly distinguishable, as shown in Figure 7e.
- -
- 5: The 1.25 cm subdivision is clearly distinguishable, as shown in Figure 7f.
For each flight configuration, the average rating value of the three control targets was calculated to represent the overall visual quality obtained in the reconstruction. The visual quality assessment was performed by a single expert evaluator, who is the lead author of this study, in order to ensure a consistent and uniform rating criterion across all 405 flight samples. This approach minimizes variability in qualitative judgment and provides a stable basis for comparative analysis.
This evaluation scale enabled a systematic comparison of the visual detail achieved by different combinations of GSD, frontal overlap, lateral overlap, camera angle, and flight pattern.
4. Results and Discussion
After completing the quantification process, a statistical analysis was conducted on 405 UAV flights, considering both the Quality Indicator (QI) obtained from the generated orthophotographs and the associated operational variables, including the number of captured photographs, flight time, aero-triangulation time, orthophoto generation time, and total processing time.
The results for these 405 flights are summarized in Table 5, Table 6, Table 7, Table 8, Table 9, Table 10, Table 11, Table 12 and Table 13. Through evaluation of 135 parameter combinations based on QI value and processing efficiency in three experimental sites, the analysis identified an optimal configuration: 0.5 cm/px GSD, 70% frontal overlap, 80% lateral overlap, and 70° camera tilt. Because it delivers the best compromise between visual interpretability, photogrammetric reconstruction quality, and computational efficiency.
Table 5.
Results of 135 UAV flights in Experiment 1—Part 1.
Table 6.
Results of 135 UAV flights in Experiment 1—Part 2.
Table 7.
Results of 135 UAV flights in Experiment 1—Part 3.
Table 8.
Results of 135 UAV flights in Experiment 2—Part 1.
Table 9.
Results of 135 UAV flights in Experiment 2—Part 2.
Table 10.
Results of 135 UAV flights in Experiment 2—Part 3.
Table 11.
Results of 135 UAV flights in Experiment 3—Part 1.
Table 12.
Results of 135 UAV flights in Experiment 3—Part 2.
Table 13.
Results of 135 UAV flights in Experiment 3—Part 3.
The mean QI values at experimental sites 1, 2, and 3 were 2.54, 2.63, and 2.08, respectively. Based on the physical conditions described in Section 3.1, this analysis demonstrates that visual quality depends not only on structures adjacent to linear works but also on a complex interaction of multiple environmental and capture factors.
Specifically, the variability of lighting, along with shadows and occlusions generated by road elements, reduces image consistency and obscures fine pavement details, directly impacting the QI. Likewise, differences in surface texture affect the robustness of feature matching algorithms, which are essential for accurate photogrammetric alignment and reconstruction. Consequently, these results underscore the need for a comprehensive understanding of these environmental influences to optimize pavement inspection using UAV.
Another important outcome is the consistency of the calibration behavior across the evaluated experimental sites. Despite variations in pavement texture and scene composition, the selected parameter configuration showed stable QI performance and reproducible reconstruction quality. This suggests that the proposed calibration logic can potentially be transferred to similar inspection scenarios, provided that comparable operational constraints and quality-control procedures are maintained.
This section presents a comparative analysis of the flight campaigns, focusing on the relationships among data acquisition effort, computational cost, and the resulting QI values, with particular attention to the differences between SOC and conventional (non-SOC) flight strategies. For clarity, the analysis is structured into several subsections, each addressing a specific group of variables and their corresponding graphical representations.
First, we analyze the relationship between acquisition effort and computational cost. Next, we compare SOC and non-SOC strategies using both graphical trends and the Wilcoxon–Mann–Whitney results. Finally, we examine how overlap configuration and capture angle relate to flight time, number of captured images, and the QI measured from orthophotographs.
4.1. Acquisition Effort, Processing Cost, and Quality Indicator
Figure 8 indicates that processing time increases with the number of captured images. Flights with a higher number of images are generally associated with lower GSD values (i.e., lower flight altitudes), although some overlap across altitude levels with comparable processing times is still observed.
Figure 8.
Number of photos vs. processing time, colored by Ground Sample Distance (GSD).
This relationship becomes clearer in Figure 9, where the data are represented according to the QI value using color and marker size. Under this representation, the overlap among QI levels becomes more evident, suggesting that additional parameters must be considered to achieve higher QI values while reducing both acquisition effort and processing time.
Figure 9.
Number of photos vs. processing time, colored by Quality Indicator (QI).
A similar pattern emerges when flight time is analyzed instead of image count. As shown in Figure 10 and Figure 11, the relationship between acquisition effort and computational cost remains consistent with the previous observations. Moreover, Figure 12 highlights the strong linear relationship and high correlation between flight time and the number of captured images.
Figure 10.
Flight time vs. processing time, colored by GSD.
Figure 11.
Flight time vs. processing time, colored by QI.
Figure 12.
Number of photos vs. flight time, colored by QI.
4.2. SOC vs. Non-SOC Comparison and Statistical Support
Figure 13 and Figure 14 show that SOC flights follow a pattern similar to that observed in the overall dataset, with both processing time and flight time increasing as the number of captured images grows. When considering only SOC flights, Figure 15 confirms that the relationship between QI values and acquisition configuration follows the same general trend, with no distinct behavior attributable specifically to the SOC strategy.
Figure 13.
Number of photos vs. processing time, grouped by SOC and non-SOC flights, with marker size by QI.
Figure 14.
Number of photos vs. flight time, grouped by SOC and non-SOC flights, with marker size by QI.
Figure 15.
Number of photos vs. flight time for SOC flights only, colored by QI.
When the analysis is restricted to flights with a capture angle (Figure 16), lower GSD values (corresponding to lower flight altitudes) are associated with higher QI values and relatively better performance for SOC flights. However, Figure 17, Figure 18 and Figure 19 indicate that SOC configurations generally require a larger number of captured images and lead to higher computational costs. According to Table 14, the observed improvements in QI value and flight time are not statistically significant, whereas differences in processing time and number of images are statistically significant. Figure 20 also shows that the results of SOC flights were similar to those of the normal-based configuration.
Figure 16.
GSD vs. QI for flights with capture angle, comparing SOC and non-SOC flights.
Figure 17.
GSD vs. processing time, comparing SOC and non-SOC flights.
Figure 18.
GSD vs. number of photos, comparing SOC and non-SOC flights.
Figure 19.
GSD vs. flight time, comparing SOC and non-SOC flights.
Table 14.
p-value by Wilcoxon–Mann–Whitney Test.
Figure 20.
Examples of results without and with SOC configuration: (a) Normal result in site 1; (b) SOC result in site 1; (c) Normal result in site 2; (d) SOC result in site 2; (e) Normal result in site 3; (f) SOC result in site 3.
A central finding in this study is the statistical analysis result that the SOC strategy did not yield a statistically significant improvement on the visual quality and flight time, within the context of linear infrastructure pavement surface. Meanwhile, the SOC approach significantly required a larger number of photos and more processing time, compared to conventional oblique configurations. Therefore, it is recommended to apply the flight parameters considering both the computational costs and visual quality required for pavement inspection, and thus the SOC strategy is not the optimal trade-off between high-resolution quality and processing demands in this context.
4.3. Overlap Configuration Effects
Figure 21 shows that flight time increases with overlap density. When the results are stratified by GSD (Figure 22 and Figure 23), lower-altitude flights exhibit a wider distribution of flight times. Figure 24 and Figure 25 display broadly similar QI distributions, although a clear improvement in QI values is observed at lower altitudes.
Figure 21.
Frontal overlap vs. flight time, colored by lateral overlap.
Figure 22.
Frontal overlap vs. flight time, stratified by GSD.
Figure 23.
Lateral overlap vs. flight time, stratified by GSD.
Figure 24.
Frontal overlap vs. QI, stratified by GSD.
Figure 25.
Lateral overlap vs. QI, stratified by GSD.
Meanwhile, the synergistic effects of GSD and image overlap on reconstruction quality and processing efficiency were also investigated to conduct an in-depth investigation of the interactive effects between parameters. As shown in Figure 22 and Figure 23, to achieve a lower flight time, it is more possible to apply a lower frontal overlap, a lower lateral overlap, and a higher GSD. As Figure 24 and Figure 25 indicate, to obtain a higher quality indicator, it is more recommended to use a higher frontal overlap, a higher lateral overlap, and a lower GSD. The reversal synergistic effects of flight parameters on reconstruction quality and processing efficiency aligned with the correlation analysis between flight time and quality indicator, as discussed in Section 4.1.
The experimental results demonstrate a critical trade-off between image overlap, reconstruction quality, and computational burden. Although increasing overlap generally improves the density of feature-matching and the abundance of tie points, this study reveals that such increases do not yield proportionate improvements in the QI value once a certain threshold is met. Specifically, overlap values exceeding the identified optimum (70% frontal and 80% lateral) introduced a significant processing penalty without substantially enhancing the final digital products. These findings challenge the heuristic assumption that more data is always better, confirming that calibrated overlap thresholds are essential for controlling project costs and turnaround times in large-scale engineering projects.
4.4. Capture Angle Effects
Finally, Figure 26 shows that flight altitude again influences QI values: as the camera tilt angle increases, QI values decrease slightly. This effect is not reflected in the number of captured images, as illustrated in Figure 27.
Figure 26.
GSD vs. QI, colored by capture angle.
Figure 27.
GSD vs. number of photos, colored by capture angle.
Moreover, the synergistic effects of camera tilt angle and GSD on reconstruction quality and processing efficiency were also analyzed, to investigate the interactive effects between parameters. It can be observed from Figure 26 that to get a higher quality indicator, a lower camera tilt angle and a lower GSD are more suggested. Meanwhile, Figure 27 illustrates that to utilize a lower number of photos, it is more advised to define a higher GSD while the camera title angle shows little influence. The observation on the synergistic effects on reconstruction quality and processing efficiency were also consistent with the correlation analysis on the number of photos and quality indicator, as analyzed in Section 4.1.
4.5. Limitations and Further Study
The consistency of the optimal parameter configuration across the experimental scenarios suggests that the proposed calibration framework can be transferable to similar UAV pavement inspection applications. However, factors such as lighting conditions, pavement texture, UAV platforms, and camera sensors may influence photogrammetric reconstruction performance. Therefore, local validation is recommended when applying the framework to new operational environments. GCP was not studied in this investigation because the geometric quality was not assessed in visual quality, and it is suggested to be investigated in the further study.
From a methodological perspective, this work contributes by integrating literature-based parameter ranges with systematic field experimentation and QI-based performance evaluation. Rather than relying on heuristic flight settings, the proposed framework establishes a reproducible calibration process that can be adapted to different UAV platforms, sensors, and inspection objectives in future research.
In practical terms, the proposed calibration improves the reliability and efficiency of UAV-based pavement inspection, supporting the transition from subjective visual surveys to standardized, data-driven monitoring workflows. By ensuring consistent photogrammetric quality while controlling acquisition and processing costs, the framework facilitates more scalable deployment of UAV technologies in infrastructure management, such as large-scale municipal road networks and machine-learning-based defect detection and semantic segmentation in further investigation.
While the findings of this study provide a robust baseline based on a representative industrial-grade UAV, the proposed optimal parameter configuration is fundamentally governed by GSD and sensor geometry. This suggests that the framework can be extended to other UAV platforms operating under comparable acquisition conditions, including both consumer-grade and alternative industrial systems. However, platform-specific validation remains necessary due to potential variations in hardware characteristics and photogrammetric processing performance. To further support the universality and consistency of these findings, future research should include comparative experiments across diverse UAV platforms and photogrammetry software, supported by rigorous statistical analysis to identify potential performance differences.
5. Conclusions
The experimental results elucidate an intrinsic trade-off between visual fidelity and computational overhead. While increased overlap levels bolster data redundancy and reconstruction stability, these gains follow a trajectory of diminishing returns. Beyond a specific threshold, higher image density fails to yield proportional improvements in the visual QI of orthomosaics, instead precipitating a sharp rise in processing latency. Consequently, GSD acts as the primary determinant of the granular detail achievable in photogrammetric products. Finer GSD values are essential for capturing high-frequency pavement textures, which is reflected in superior QI values, yet this precision dictates a heavier operational burden in terms of flight duration and hardware requirements. Crucially, the performance of these configurations is not governed by isolated parameters but by the synergistic interaction of acquisition variables. Results indicate that parameters such as capture angle and overlap cannot be optimized in a vacuum, as their efficacy is intrinsically linked to the selected GSD and the specific geometry of the scene.
Regarding the SOC strategy, the inclusion of additional viewing angles did not yield statistically significant improvements in visual QI or flight efficiency relative to conventional oblique configurations. Within the evaluated conditions, the SOC approach consistently resulted in higher image volumes and prolonged processing stages, suggesting that the integration of multiple perspectives may increase the operational burden without providing commensurate gains in visual performance. Furthermore, the influence of environmental conditions remains a non-linear mediator of product quality. The variability observed across experimental sites confirms that the relationship between acquisition settings and output quality is context-dependent, driven by a complex interplay of lighting, surface reflectance, and visual obstructions.
Based on these findings, this study establishes three guiding principles for UAV mission planning in infrastructure management. First, image overlap must be managed to avoid excessive redundancy that escalates costs without enhancing quality. Second, GSD must be calibrated strictly according to the specific resolution requirements of the inspection task to maintain operational efficiency. Third, acquisition parameters must be evaluated as a coupled system rather than through individual optimization. The selection of capture strategies should be evaluated based on the balance between acquisition benefits and associated processing costs, rather than assuming direct improvements in the quality of the final product.
Ultimately, the proposed methodological framework, grounded in the systematic evaluation of parameter interplay, provides a robust and replicable foundation for diverse operational contexts. The value of this work transcends the identification of a single optimal configuration by providing actionable, data-driven criteria to support strategic decision-making in digital infrastructure management, ensuring that photogrammetric workflows remain both scientifically rigorous and industrially viable.
Author Contributions
Conceptualization, J.L.-R. and E.J.R.; Methodology, J.L.-R.; Software, J.L.-R.; Validation, E.G.-R., J.L.-R. and J.L.; Formal analysis, J.L.-R., J.L., M.B.-R. and E.G.-R.; Investigation, J.L.-R., E.J.R. and J.L.; Resources, J.L.-R. and E.J.R.; Data curation, J.L.-R., E.J.R. and J.L.; Writing—original draft preparation, J.L.; Writing—review and editing, E.J.R., J.L., J.L.-R., M.B.-R. and E.G.-R.; Visualization, J.L.-R., J.L. and E.G.-R.; Supervision, J.L.-R.; Project administration, J.L.-R.; Funding acquisition, M.B.-R. and E.G.-R. All authors have read and agreed to the published version of the manuscript.
Funding
Jingwei Liu is supported by Postdoctoral Grant in Pontificia Universidad Católica de Chile: PD2024-597.
Data Availability Statement
The data presented in this study are available upon request from the corresponding author.
Acknowledgments
The authors are grateful to the editor and anonymous reviewers for their constructive comments and valuable suggestions to improve the quality of the article.
Conflicts of Interest
The authors declare no conflicts of interest.
Abbreviations
The following abbreviations are used in this manuscript:
| DGAC | Dirección General de Aeronáutica Civil |
| GCP | Ground Control Points |
| GNSS | Global Navigation Satellite System |
| GSD | Ground Sample Distance |
| MVS | Multiview Stereo |
| QI | Quality Indicator |
| RTK | Real-Time Kinematics |
| SfM | Structure-from-Motion |
| SOC | Smart Oblique Capture |
| UAV | Unmanned Aerial Vehicle |
| 2D | Two-Dimensional |
| 3D | Three-Dimensional |
References
- Zhang, A.; Wang, K.C.P.; Fei, Y.; Liu, Y.; Tao, S.; Chen, C.; Li, J.Q.; Li, B. Deep learning–based fully automated pavement crack detection on 3D asphalt surfaces with an improved CrackNet. J. Comput. Civ. Eng. 2018, 32, 04018041. [Google Scholar] [CrossRef] [Scilit]
- Bakalos, N.; Katsamenis, I.; Doulamis, A.; Doulamis, N.; Kalogeras, D.; Bimpas, M. Improved Robotic Platform to Perform Maintenance and Upgrading Roadworks: The HERON Approach. Technical Report, SOCIETAL CHALLENGES—Smart, Green And Integrated Transport. 2024. Available online: https://cordis.europa.eu/project/id/955356 (accessed on 1 October 2025).
- Ou, X.; Tang, C.; Qu, T.; Xu, S.; Zhou, Y.; Tian, J. Towards digitalized maintenance of operating tunnels: A text documents-based defect evaluation and visualization. Tunn. Undergr. Space Technol. 2025, 157, 106345. [Google Scholar] [CrossRef] [Scilit]
- Małek, A. Assessment of the use of unmanned aerial vehicles for road pavement condition surveying. Roads Bridg. Drog. I Mosty 2023, 22, 331–345. [Google Scholar] [CrossRef] [Scilit]
- Garilli, E.; Roncella, R.; Hafezzadeh, R.; Giuliani, F.; Autelitano, F. UAV Photogrammetry for Monitoring the Cold Asphalt Patching Pothole Repairs. In Proceedings of the 10th International Conference on Maintenance and Rehabilitation of Pavements; Paulo, P., Pais, J., Eds.; Springer Nature: Cham, Switzerland, 2024; pp. 284–294. [Google Scholar]
- Chen, X.; Liu, C.; Chen, L.; Zhu, X.; Zhang, Y.; Wang, C. A Pavement Crack Detection and Evaluation Framework for a UAV Inspection System Based on Deep Learning. Appl. Sci. 2024, 14, 1157. [Google Scholar] [CrossRef] [Scilit]
- Atencio, E.; Plaza-Muñoz, F.; Rivera, F.M.L.; Lozano-Galant, J.A. Calibration of UAV flight parameters for pavement pothole detection using orthogonal arrays. Autom. Constr. 2022, 143, 104545. [Google Scholar] [CrossRef] [Scilit]
- Romero-Chambi, E.; Villarroel-Quezada, S.; Atencio, E.; Rivera, F.M.L. Analysis of optimal flight parameters of unmanned aerial vehicles (UAVs) for detecting potholes in pavements. Appl. Sci. 2020, 10, 4157. [Google Scholar] [CrossRef] [Scilit]
- Jiang, S.; Jiang, W. Uav-Based Oblique Photogrammetry for 3D Reconstruction of Transmission Line: Practices and Applications. Int. Arch. Photogramm. Remote Sens. Spat. Inf. Sci. 2019, XLII-2/W13, 401–406. [Google Scholar] [CrossRef] [Scilit]
- Parente, D.C.; Felix, N.C.; Picanço, A.P. Use of unmanned aerial vehicle (UAV) in the identification of surface pathology in asphalt pavement. Rev. ALCONPAT 2017, 7, 160–171. [Google Scholar] [CrossRef] [Scilit]
- Wei, Y.; Chu, H.; Guo, Q.; Liao, Y. Three-Dimensional Modeling and Accuracy Evaluation Based on Unmanned Aerial Vehicle Oblique Photogrammetry. In Proceedings of the 3rd International Conference on Computer, Artificial Intelligence and Control Engineering; Association for Computing Machinery: New York, NY, USA, 2024; pp. 441–445. [Google Scholar] [CrossRef] [Scilit]
- Lemus-Romani, J.; Rueda, E.J.; Becerra-Rozas, M.; Cabrera, C.; Liu, J.; Astorga, G. Optimization of UAV Flight Parameters for Urban Photogrammetric Surveys: Balancing Orthomosaic Visual Quality and Operational Efficiency. Drones 2025, 9, 753. [Google Scholar] [CrossRef] [Scilit]
- Inzerillo, L.; Acuto, F.; Pisciotta, A.; Mantalovas, K.; Mino, G.D. Detection of distress in rural road pavements: An analysis of UAV altitude variations. In Proceedings of the International Archives of the Photogrammetry, Remote Sensing and Spatial Information Sciences—ISPRS Archives; International Society for Photogrammetry and Remote Sensing: Hannover, Germany, 2025; Volume 48, pp. 139–146. [Google Scholar] [CrossRef] [Scilit]
- Zhang, J.; Xia, H.; Li, P.; Zhang, K.; Hong, W.; Guo, R. A Pavement Crack Detection Method via Deep Learning and a Binocular-Vision-Based Unmanned Aerial Vehicle. Appl. Sci. 2024, 14, 1778. [Google Scholar] [CrossRef] [Scilit]
- Arroyo-Mora, J.P.; Kalacska, M.; Roghani, A.; Lucanus, O. Assessment of UAS Photogrammetry and Planet Imagery for Monitoring Water Levels around Railway Tracks. Drones 2023, 7, 553. [Google Scholar] [CrossRef] [Scilit]
- Molina, A.L.A.; Huang, Y. Using Unmanned Aircraft Systems for Construction Verification, Volume Calculations, and Field Inspection. Ph.D. Thesis, East Carolina University, Greenville, NC, USA, 2023. [Google Scholar]
- Fernandes, R.T.V.; Cabral, A.F.; Dantas, G.C.B.; Tinoco, V.N.V.; da Silveira, B.D.A.; Junior, A.M.S. Mapeamento de manifestações patológicas em pavimento asfáltico por meio de uso de drones. Rev. ALCONPAT 2021, 11, 61–72. [Google Scholar] [CrossRef] [Scilit]
- Rengifo, D.M.O.; Salinas, J.C.; Caicedo, J.A.P.; Manzano, M.A.R. Unmanned Aircraft Systems in Road Assessment: A Novel Approach to the Pavement Condition Index and VIZIR Methodologies. Drones 2024, 8, 99. [Google Scholar] [CrossRef] [Scilit]
- Eisenbeiss, H.; Sauerbier, M. Investigation of uav systems and flight modes for photogrammetric applications. Photogramm. Rec. 2011, 26, 400–421. [Google Scholar] [CrossRef] [Scilit]
- Tong, X.; Liu, X.; Chen, P.; Liu, S.; Luan, K.; Li, L.; Liu, S.; Liu, X.; Xie, H.; Jin, Y.; et al. Integration of UAV-Based Photogrammetry and Terrestrial Laser Scanning for the Three-Dimensional Mapping and Monitoring of Open-Pit Mine Areas. Remote Sens. 2015, 7, 6635–6662. [Google Scholar] [CrossRef] [Scilit]
- Aburqaq, I.S.; Naimi, S.; Saedi, S.; Shahin, M.A. Assessment of UAV Usage for Flexible Pavement Inspection Using GCPs: Case Study on Palestinian Urban Road. Sustainability 2025, 17, 8129. [Google Scholar] [CrossRef] [Scilit]
- Nthaga, T.M.E.; Nyomboi, T.; Mwaniki, M. An Integrated Remote Sensing and GIS Road Condition Assessment Framework: Applying Geospatial Techniques to Improve Pavement Condition Analysis. Eng. Technol. Appl. Sci. Res. 2025, 15, 21021–21028. [Google Scholar] [CrossRef] [Scilit]
- Astor, Y.; Nabesima, Y.; Utami, R.; Sihombing, A.V.R.; Adli, M.; Firdaus, M.R. Unmanned aerial vehicle implementation for pavement condition survey. Transp. Eng. 2023, 12, 100168. [Google Scholar] [CrossRef] [Scilit]
- Darmawan, M.A.H.; Mukti, S.N.A.; Tahar, K.N. Pothole Detection Based on UAV Photogrammetry. Rev. Int. Géomat. 2025, 34, 21–35. [Google Scholar] [CrossRef] [Scilit]
- Feitosa, I.; Santos, B.; Almeida, P.G. Pavement Inspection in Transport Infrastructures Using Unmanned Aerial Vehicles (UAVs). Sustainability 2024, 16, 2207. [Google Scholar] [CrossRef] [Scilit]
- Yan, H.; Zhang, J. UAV-PDD2023: A benchmark dataset for pavement distress detection based on UAV images. Data Brief 2023, 51, 109692. [Google Scholar] [CrossRef] [Scilit] [PubMed]
- Liu, J.; Lemus-Romani, J.; Rueda, E.J.; Becerra-Rozas, M.; Astorga, G. Identification of Pathologies in Pavements by Unmanned Aerial Vehicle (UAV): A Systematic Literature Review. Drones 2026, 10, 90. [Google Scholar] [CrossRef] [Scilit]
- Diaz, N.D.; Highfield, W.E.; Brody, S.D.; Fortenberry, B.R. Deriving First Floor Elevations within Residential Communities Located in Galveston Using UAS Based Data. Drones 2022, 6, 81. [Google Scholar] [CrossRef] [Scilit]
- Khoramshahi, E.; Näsi, R.; Rua, S.; Oliveira, R.A.; Päivänsalo, A.; Niemeläinen, O.; Niskanen, M.; Honkavaara, E. A Novel Deep Multi-Image Object Detection Approach for Detecting Alien Barleys in Oat Fields Using RGB UAV Images. Remote Sens. 2023, 15, 3582. [Google Scholar] [CrossRef] [Scilit]
- Yan, Z.; Chen, C.; Wu, S.; Wang, Z.; Li, L.; Sun, S.; Yang, B.; Fu, J. RF-DET: Refocusing on the small-scale objects using aggregated context for accurate power transmitting components detection on UAV oblique imagery. ISPRS J. Photogramm. Remote Sens. 2025, 220, 692–711. [Google Scholar] [CrossRef] [Scilit]
- Gao, R.; Yan, G.; Wang, Y.; Yan, T.; Niu, R.; Tang, C. Construction of a Real-Scene 3D Digital Campus Using a Multi-Source Data Fusion: A Case Study of Lanzhou Jiaotong University. ISPRS Int. J. Geo-Inf. 2025, 14, 19. [Google Scholar] [CrossRef] [Scilit]
- Bi, K.; Niu, Y.; Yang, H.; Niu, Z.; Hao, Y.; Wang, L. Multi-Spectral Point Cloud Constructed with Advanced UAV Technique for Anisotropic Reflectance Analysis of Maize Leaves. Remote Sens. 2025, 17, 93. [Google Scholar] [CrossRef] [Scilit]
- López-Herrera, J.; López-Cuervo, S.; Pérez-Martín, E.; Ángel Maté-González, M.; Izquierdo, C.V.; Peñarroya, J.M.; Herrero-Tejedor, T.R. Evaluation of 3D Models of Archaeological Remains of Almenara Castle Using Two UAVs with Different Navigation Systems. Heritage 2025, 8, 22. [Google Scholar] [CrossRef] [Scilit]
- Bolkas, D.; Guthrie, K.; Durrutya, L. sUAS LiDAR and Photogrammetry Evaluation in Various Surfaces for Surveying and Mapping. J. Surv. Eng. 2024, 150, 4023021. [Google Scholar] [CrossRef] [Scilit]
- Molina, A.A.; Huang, Y.; Zhu, Z.; Namian, M. Comparing the Accuracy between UAS Photogrammetry and LiDAR in Bridge Inspections. In Construction Research Congress 2024; American Society of Civil Engineers: Reston, VA, USA, 2024; pp. 227–237. [Google Scholar] [CrossRef] [Scilit]
- Tan, Y.; Li, Y. UAV Photogrammetry-Based 3D Road Distress Detection. ISPRS Int. J. Geo-Inf. 2019, 8, 409. [Google Scholar] [CrossRef] [Scilit]
- Kjellander, P.; Rumiano, F.; Månsson, J.; Norström, A. En Standardiserad Inventeringsmetod för att Uppskatta Skador på gröda. 2024. Available online: https://publications.slu.se/?file=publ/show&id=132677 (accessed on 1 October 2025).
- Kim, S.S.; Suk, J.W.; Lim, E.T.; Jung, Y.H.; Koo, S. Quality Asessment of Three Dimensional Topographic and Building Modelling using High-performance RTK Drone. J. Korea Acad. Ind. Coop. Soc. 2023, 24, 11–19. [Google Scholar] [CrossRef] [Scilit]
- Bartlett, B.; Trslic, P.; Santos, M.; Manduhu, M.; Riordan, J.; Dooly, G. Automated Close-Quarter, High-Resolution Inspection and 3D Reconstruction of Unknown Infrastructure. In Proceedings of the OCEANS 2023—Limerick; IEEE: Piscataway, NJ, USA, 2023; pp. 1–6. [Google Scholar] [CrossRef] [Scilit]
- Zaman, A.A.U.; Abdelaty, A. Effects of UAV imagery overlap on photogrammetric data quality for construction applications. Int. J. Constr. Manag. 2025, 25, 1901–1916. [Google Scholar] [CrossRef] [Scilit]
- Maes, W.H. Practical Guidelines for Performing UAV Mapping Flights with Snapshot Sensors. Remote Sens. 2025, 17, 606. [Google Scholar] [CrossRef] [Scilit]
- Janoušek, J.; Jambor, V.; Marcoň, P.; Dohnal, P.; Synková, H.; Fiala, P. Using UAV-Based Photogrammetry to Obtain Correlation between the Vegetation Indices and Chemical Analysis of Agricultural Crops. Remote Sens. 2021, 13, 1878. [Google Scholar] [CrossRef] [Scilit]
- Galvez, J.; Alvarez, F.V.; Gonzalez, L.; Flannery, D. A Review of Current Approaches for UAV Autonomous Mission Planning for Mars Biosignatures Detection. In 2020 IEEE Aerospace Conference; IEEE: Piscataway, NJ, USA, 2020. [Google Scholar] [CrossRef] [Scilit]
- Mokhtar, M.; Matori, A.; Yusof, K.W.; Chandio, I.; Duong, V.; Dano, D.U.L. A Study of Unmanned Aerial Vehicle Photogrammetry for Environment Mapping: Preliminary Observation. Adv. Mater. Res. 2012, 626, 440–444. [Google Scholar] [CrossRef] [Scilit]
- de Lima, R.S.; Lang, M.; Burnside, N.G.; Peciña, M.V.; Arumäe, T.; Laarmann, D.; Ward, R.D.; Vain, A.; Sepp, K. An Evaluation of the Effects of UAS Flight Parameters on Digital Aerial Photogrammetry Processing and Dense-Cloud Production Quality in a Scots Pine Forest. Remote Sens. 2021, 13, 1121. [Google Scholar] [CrossRef] [Scilit]
- Tsouros, D.; Bibi, S.; Sarigiannidis, P. A Review on UAV-Based Applications for Precision Agriculture. Information 2019, 10, 349. [Google Scholar] [CrossRef] [Scilit]
- Karthigesu, J.; Owari, T.; Tsuyuki, S.; Hiroshima, T. UAV Photogrammetry for Estimating Stand Parameters of an Old Japanese Larch Plantation Using Different Filtering Methods at Two Flight Altitudes. Sensors 2023, 23, 9907. [Google Scholar] [CrossRef] [Scilit]
- Chodura, N.; Greeff, M.; Woods, J. Evaluation of Flight Parameters in UAV-based 3D Reconstruction for Rooftop Infrastructure Assessment. arXiv 2025. [Google Scholar] [CrossRef] [Scilit]
- Zhang, S. Development and Challenges of UAV Technology in Civil Engineering Surveying and Mapping. Appl. Comput. Eng. 2025, 122, 50–54. [Google Scholar] [CrossRef] [Scilit]
- Raczyński, R. Accuracy Analysis of Products Obtained from UAV-Borne Photogrammetry Influenced by Various Flight Parameters. 2017. Available online: https://www.semanticscholar.org/paper/Accuracy-analysis-of-products-obtained-from-by-Raczy%C5%84ski/fba287d0c9197dbc27d760b869e555ee529a477f (accessed on 1 October 2025).
- Hastings, N.M. Evaluation of Unmanned Aerial Vehicle Flight Parameters That Impact Stockpile Volume Computations. Ph.D. Thesis, Brigham Young University, Provo, UT, USA, 2023. [Google Scholar]
- Boström, B. Jämförelse av fotogrammetri och laserskanning med drönare: Jämförelse av höjdresultat mellan DJI Zenmuse P1 och L2, med punkter mätta med totalstation som referens. Ph.D. Thesis, Novia University of Applied Sciences, Vaasa, Finland, May 2025. [Google Scholar]
- Spierenburg, I.B. The Use of UAV Photogrammetry Compared to LiDAR for Forest Reconstruction: A Comparison of Different UAV Photogrammetry Protocols. 2024. Available online: https://edepot.wur.nl/654330 (accessed on 1 October 2025).
- Han, S.; Han, D. Enhancing Direct Georeferencing Using Real-Time Kinematic UAVs and Structure from Motion-Based Photogrammetry for Large-Scale Infrastructure. Drones 2024, 8, 736. [Google Scholar] [CrossRef] [Scilit]
- Linck, R.; Stele, A.; Schimmer, C. Statistical Evaluation of the Accuracy of Consumer Drone Photogrammetry at a Romanesque Church in Eastern Bavaria (Germany). NDT 2024, 2, 76–86. [Google Scholar] [CrossRef] [Scilit]
- Tamimi, R.; Toth, C. Experiments with Combining LiDAR and Camera Data Acquired by UAS and Smartphone to Support Mapping. Int. Arch. Photogramm. Remote Sens. Spat. Inf. Sci. 2024, XLVIII-1-2024, 619–627. [Google Scholar] [CrossRef] [Scilit]
- Künnapuu, R.; Kokamägi, K.; Liba, N. Accuracy of waste stockpile volume calculations based on UAV Photogrammetry. Agron. Res. 2023, 21, 1186–1198. [Google Scholar]
- Kersten, T.; Wolf, J.; Lindstaedt, M. Investigations into the Accuracy of the Uav System Dji Matrice 300 Rtk with the Sensors Zenmuse p1 and l1 in the Hamburg Test Field. 2022. Available online: https://repos.hcu-hamburg.de/handle/hcu/877 (accessed on 1 October 2025).
- Avola, D.; Cinque, L.; Foresti, G.L.; Lanzino, R.; Marini, M.R.; Mecca, A.; Scarcello, F. A Novel Transformer-Based IMU Self-Calibration Approach through On-Board RGB Camera for UAV Flight Stabilization. Sensors 2023, 23, 2655. [Google Scholar] [CrossRef] [Scilit]
- Say, M.F.Q.; Sybingco, E.; Bandala, A.A.; Vicerra, R.R.P.; Chua, A.Y. A Genetic Algorithm Approach to PID Tuning of a Quadcopter UAV Model. In 2021 IEEE/SICE International Symposium on System Integration (SII); IEEE: Piscataway, NJ, USA, 2021; pp. 675–678. [Google Scholar] [CrossRef] [Scilit]
- Huang, T.; Huang, D.; Wang, Z.; Dai, X.; Shah, A. Generic Adaptive Sliding Mode Control for a Quadrotor UAV System Subject to Severe Parametric Uncertainties and Fully Unknown External Disturbance. Int. J. Control Autom. Syst. 2021, 19, 698–711. [Google Scholar] [CrossRef] [Scilit]
- Hartzer, J.; Saripalli, S. Online Multi Camera-IMU Calibration. In 2022 IEEE International Symposium on Safety, Security, and Rescue Robotics (SSRR); IEEE: Piscataway, NJ, USA, 2022; pp. 360–365. [Google Scholar] [CrossRef] [Scilit]
- Eckenhoff, K.; Geneva, P.; Huang, G. MIMC-VINS: A Versatile and Resilient Multi-IMU Multi-Camera Visual-Inertial Navigation System. arXiv 2020, arXiv:2006.15699. [Google Scholar] [CrossRef] [Scilit]
- Satici, A.C.; Poonawala, H.; Spong, M.W. Robust Optimal Control of Quadrotor UAVs. IEEE Access 2013, 1, 79–93. [Google Scholar] [CrossRef] [Scilit]
- Du, Z.; Yang, Y.; Zhu, J.; Lyu, Y. Online Parameter Estimation for Fixed-Wing UAV Based on DREM Method and Adaptive Control. IEEE Trans. Aerosp. Electron. Syst. 2025, 61, 1363–1376. [Google Scholar] [CrossRef] [Scilit]
- Ito, T.; Funada, R.; Mochida, S.; Kawagoe, T.; Ibuki, T.; Sampei, M. Design and experimental verification of a hoverable quadrotor composed of only clockwise rotors. Adv. Robot. 2023, 37, 667–678. [Google Scholar] [CrossRef] [Scilit]
- Ning, Z.; Wlezien, R.W.; Hu, H. An Experimental Study on Small UAV Propellers with Serrated Trailing Edges. In Proceedings of the 47th AIAA Fluid Dynamics Conference, Denver, CO, USA, 5–9 June 2017. [Google Scholar] [CrossRef] [Scilit]
- de Moraes, F.R.; da Silva, I. Assessment of Submillimeter Precision via Structure from Motion Technique in Close-Range Capture Environments. arXiv 2024, arXiv:2409.15602. [Google Scholar] [CrossRef] [Scilit]
- Sun, F.; Chen, D.; Li, L.; Zhang, Q.; Yuan, X.; Liao, Z.; Xiang, C.; Liu, L.; Zhou, J.; Shrestha, M.; et al. Machine Learning Models Based on UAV Oblique Images Improved Above-Ground Biomass Estimation Accuracy Across Diverse Grasslands on the Qinghai–Tibetan Plateau. Land Degrad. Dev. 2025, 36, 585–598. [Google Scholar] [CrossRef] [Scilit]
- Hu, C.; Xie, F.H.; Zhou, X.; Cai, L.; Yang, X.; Wang, J.G.; Fan, Y.D. Accuracy Analysis of Substation 3D Model Based on Oblique Photography. In Proceedings of the 2023 4th International Symposium on Insulation and Discharge Computation for Power Equipment (IDCOMPU2023); Dong, X., Cai, L., Eds.; Springer Nature: Singapore, 2024; pp. 323–331. [Google Scholar]
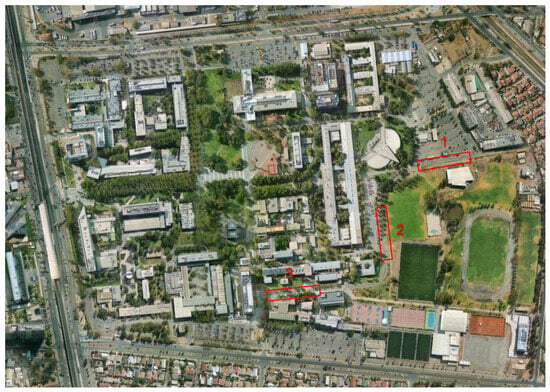
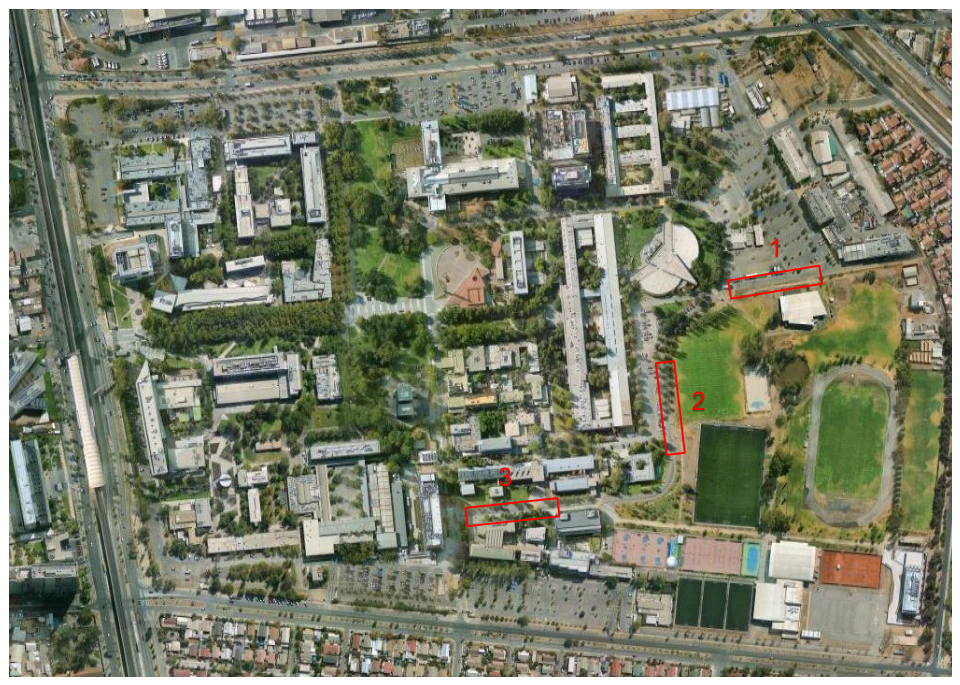
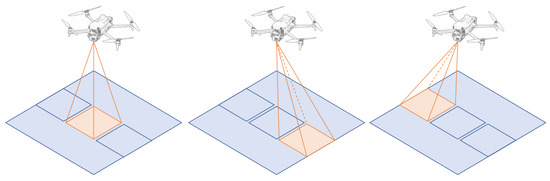
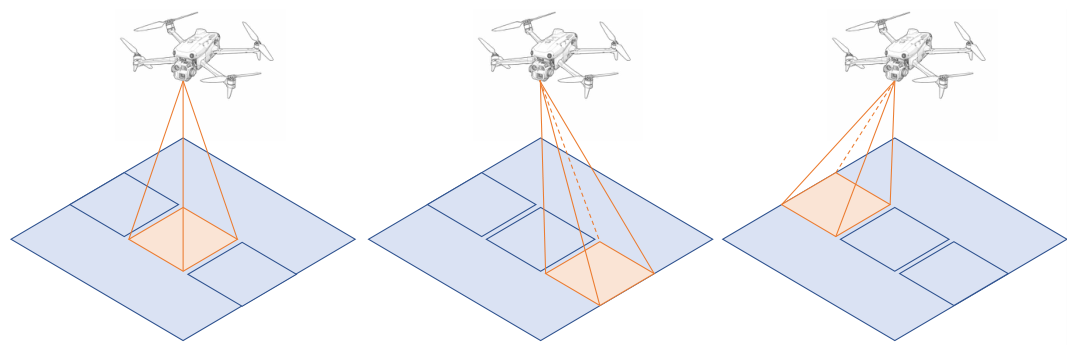
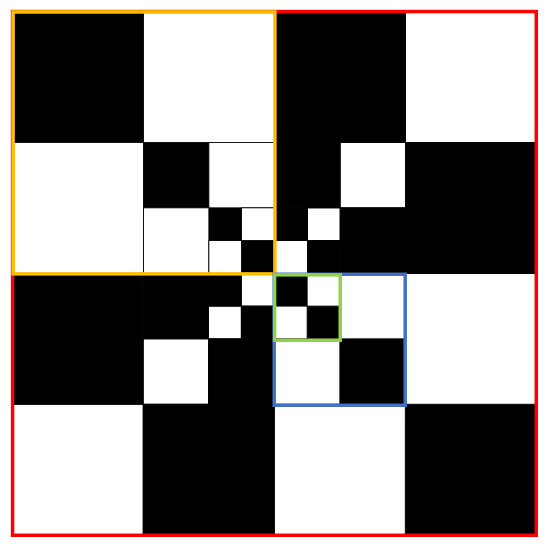
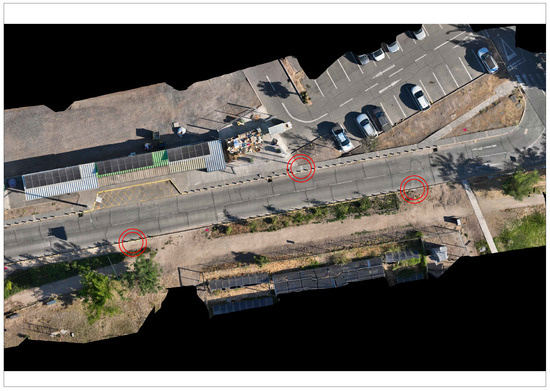
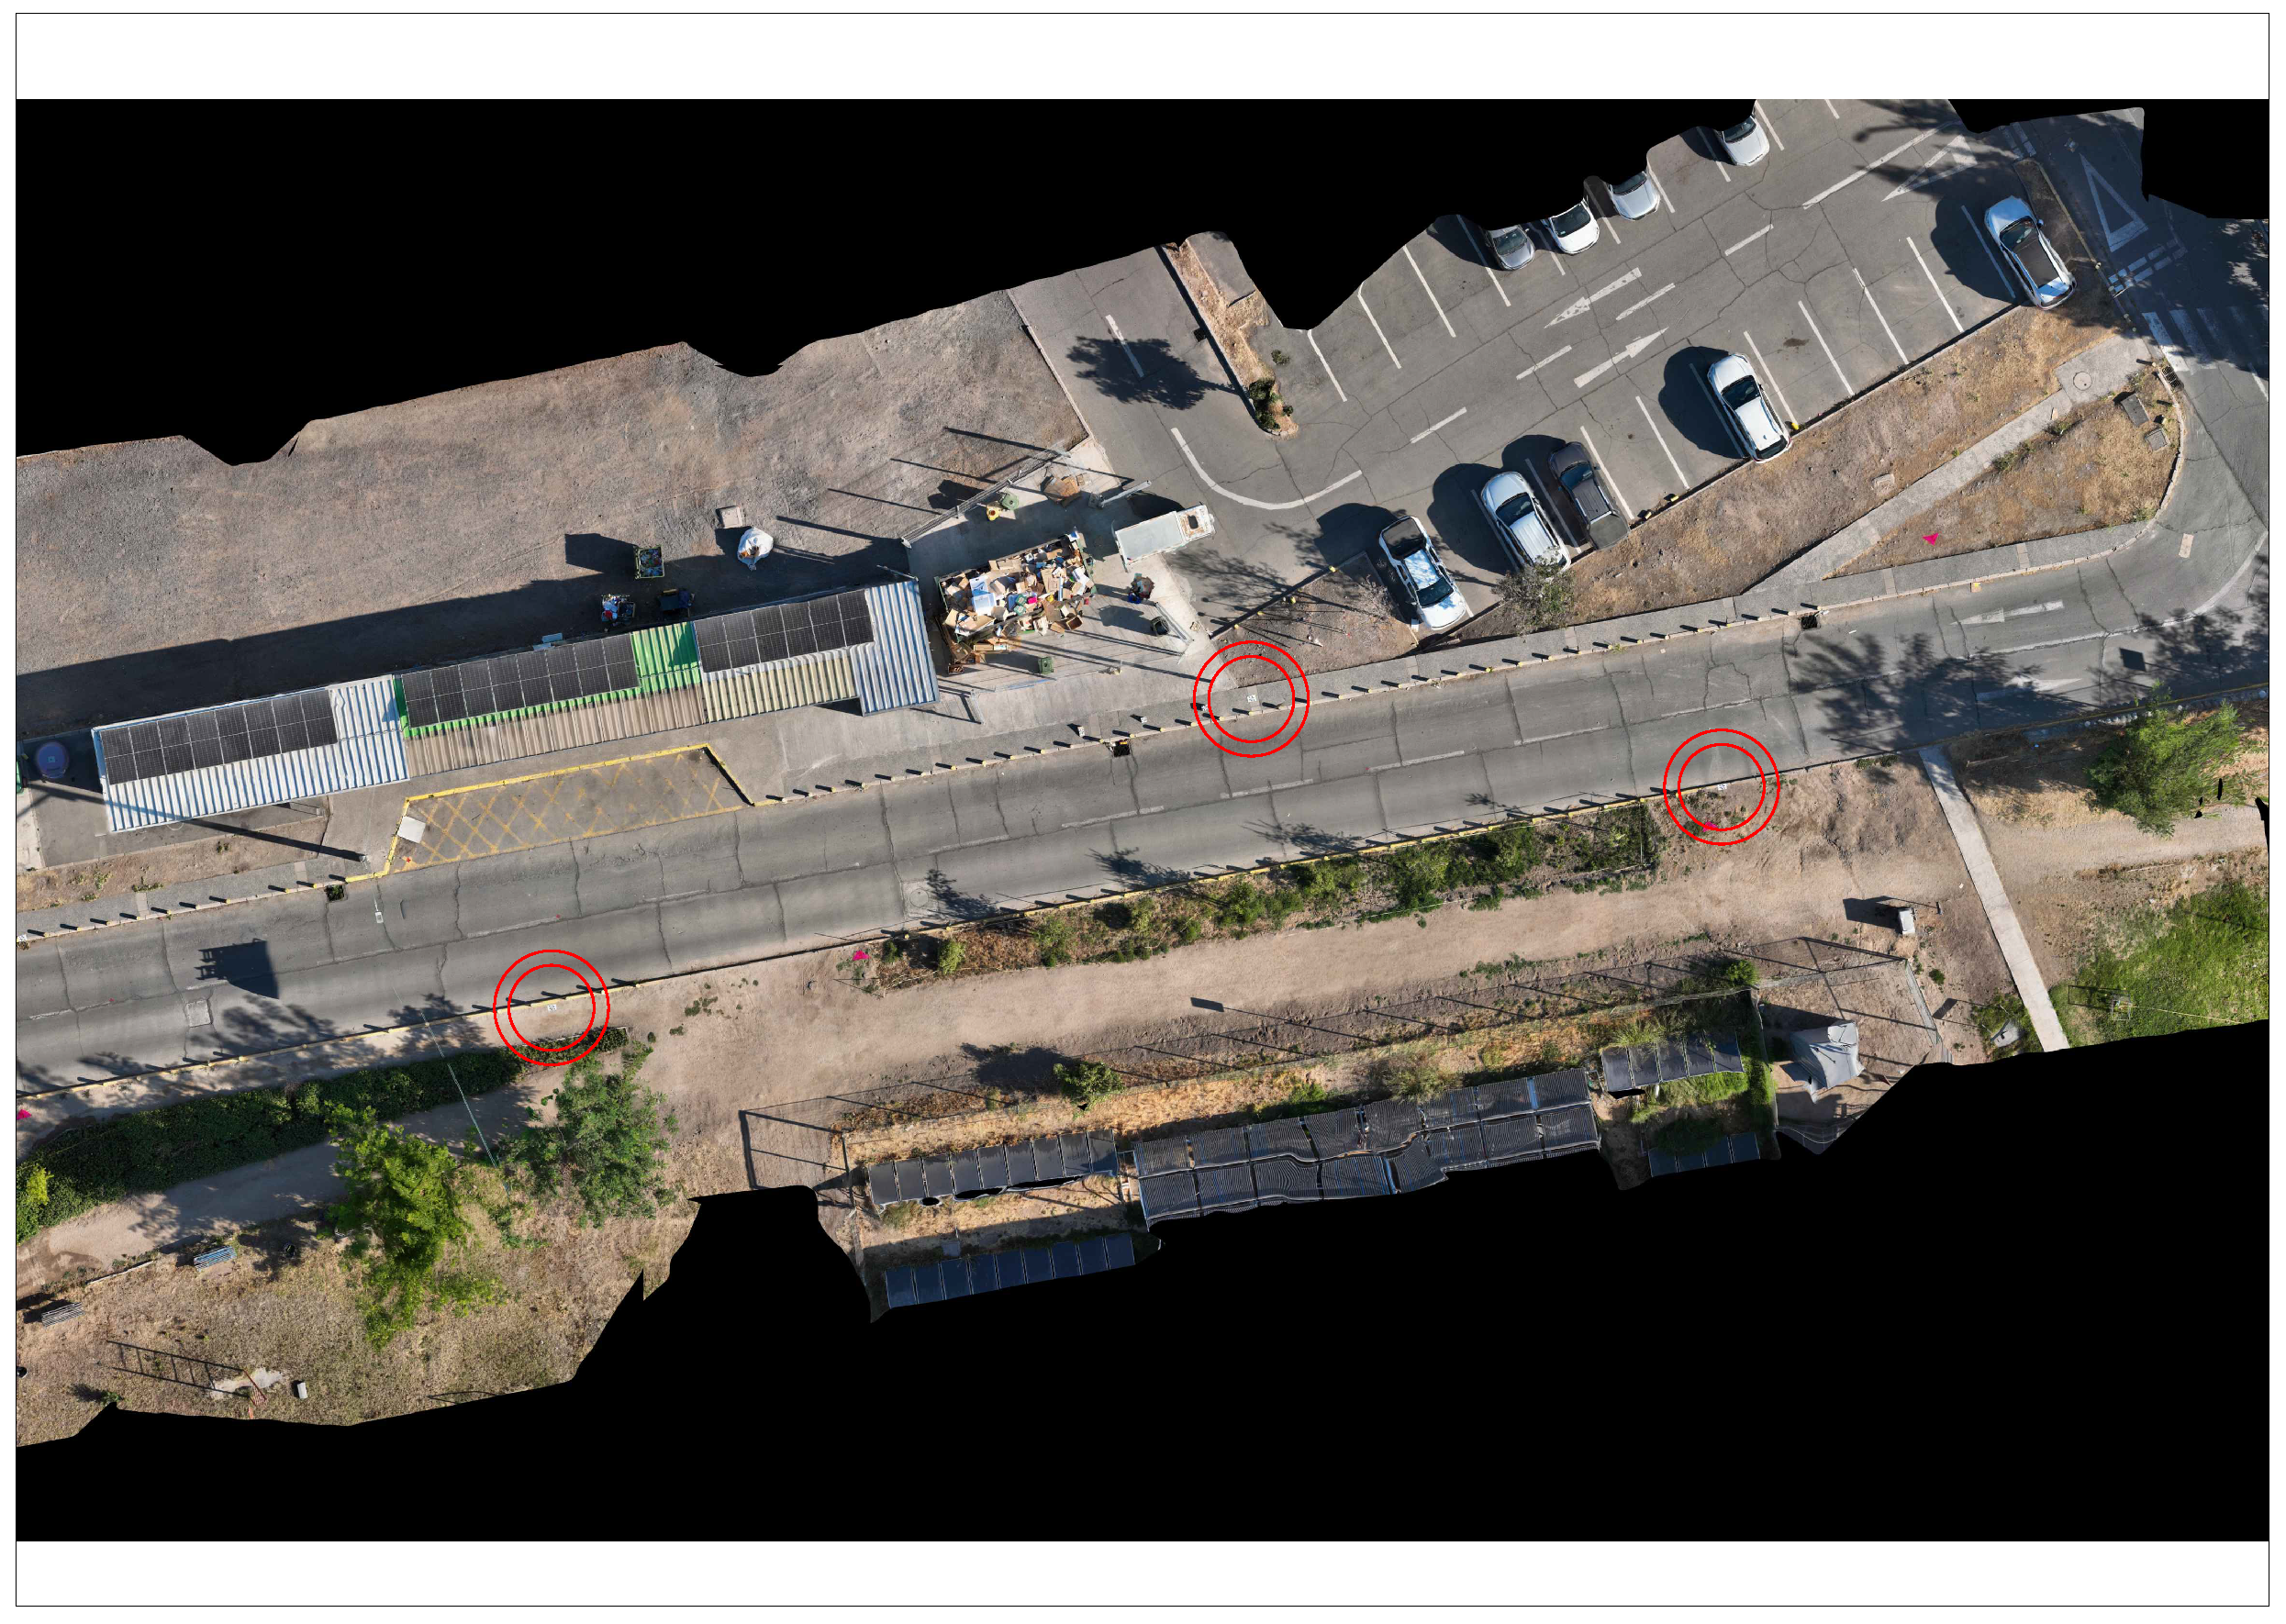
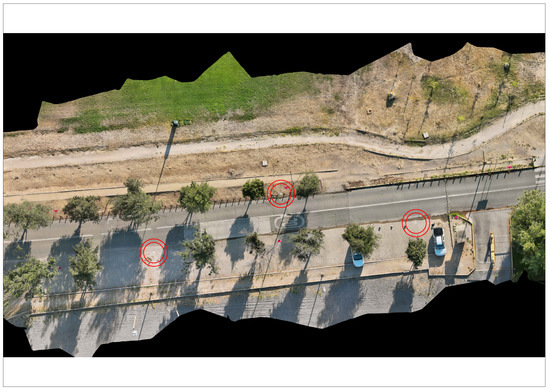
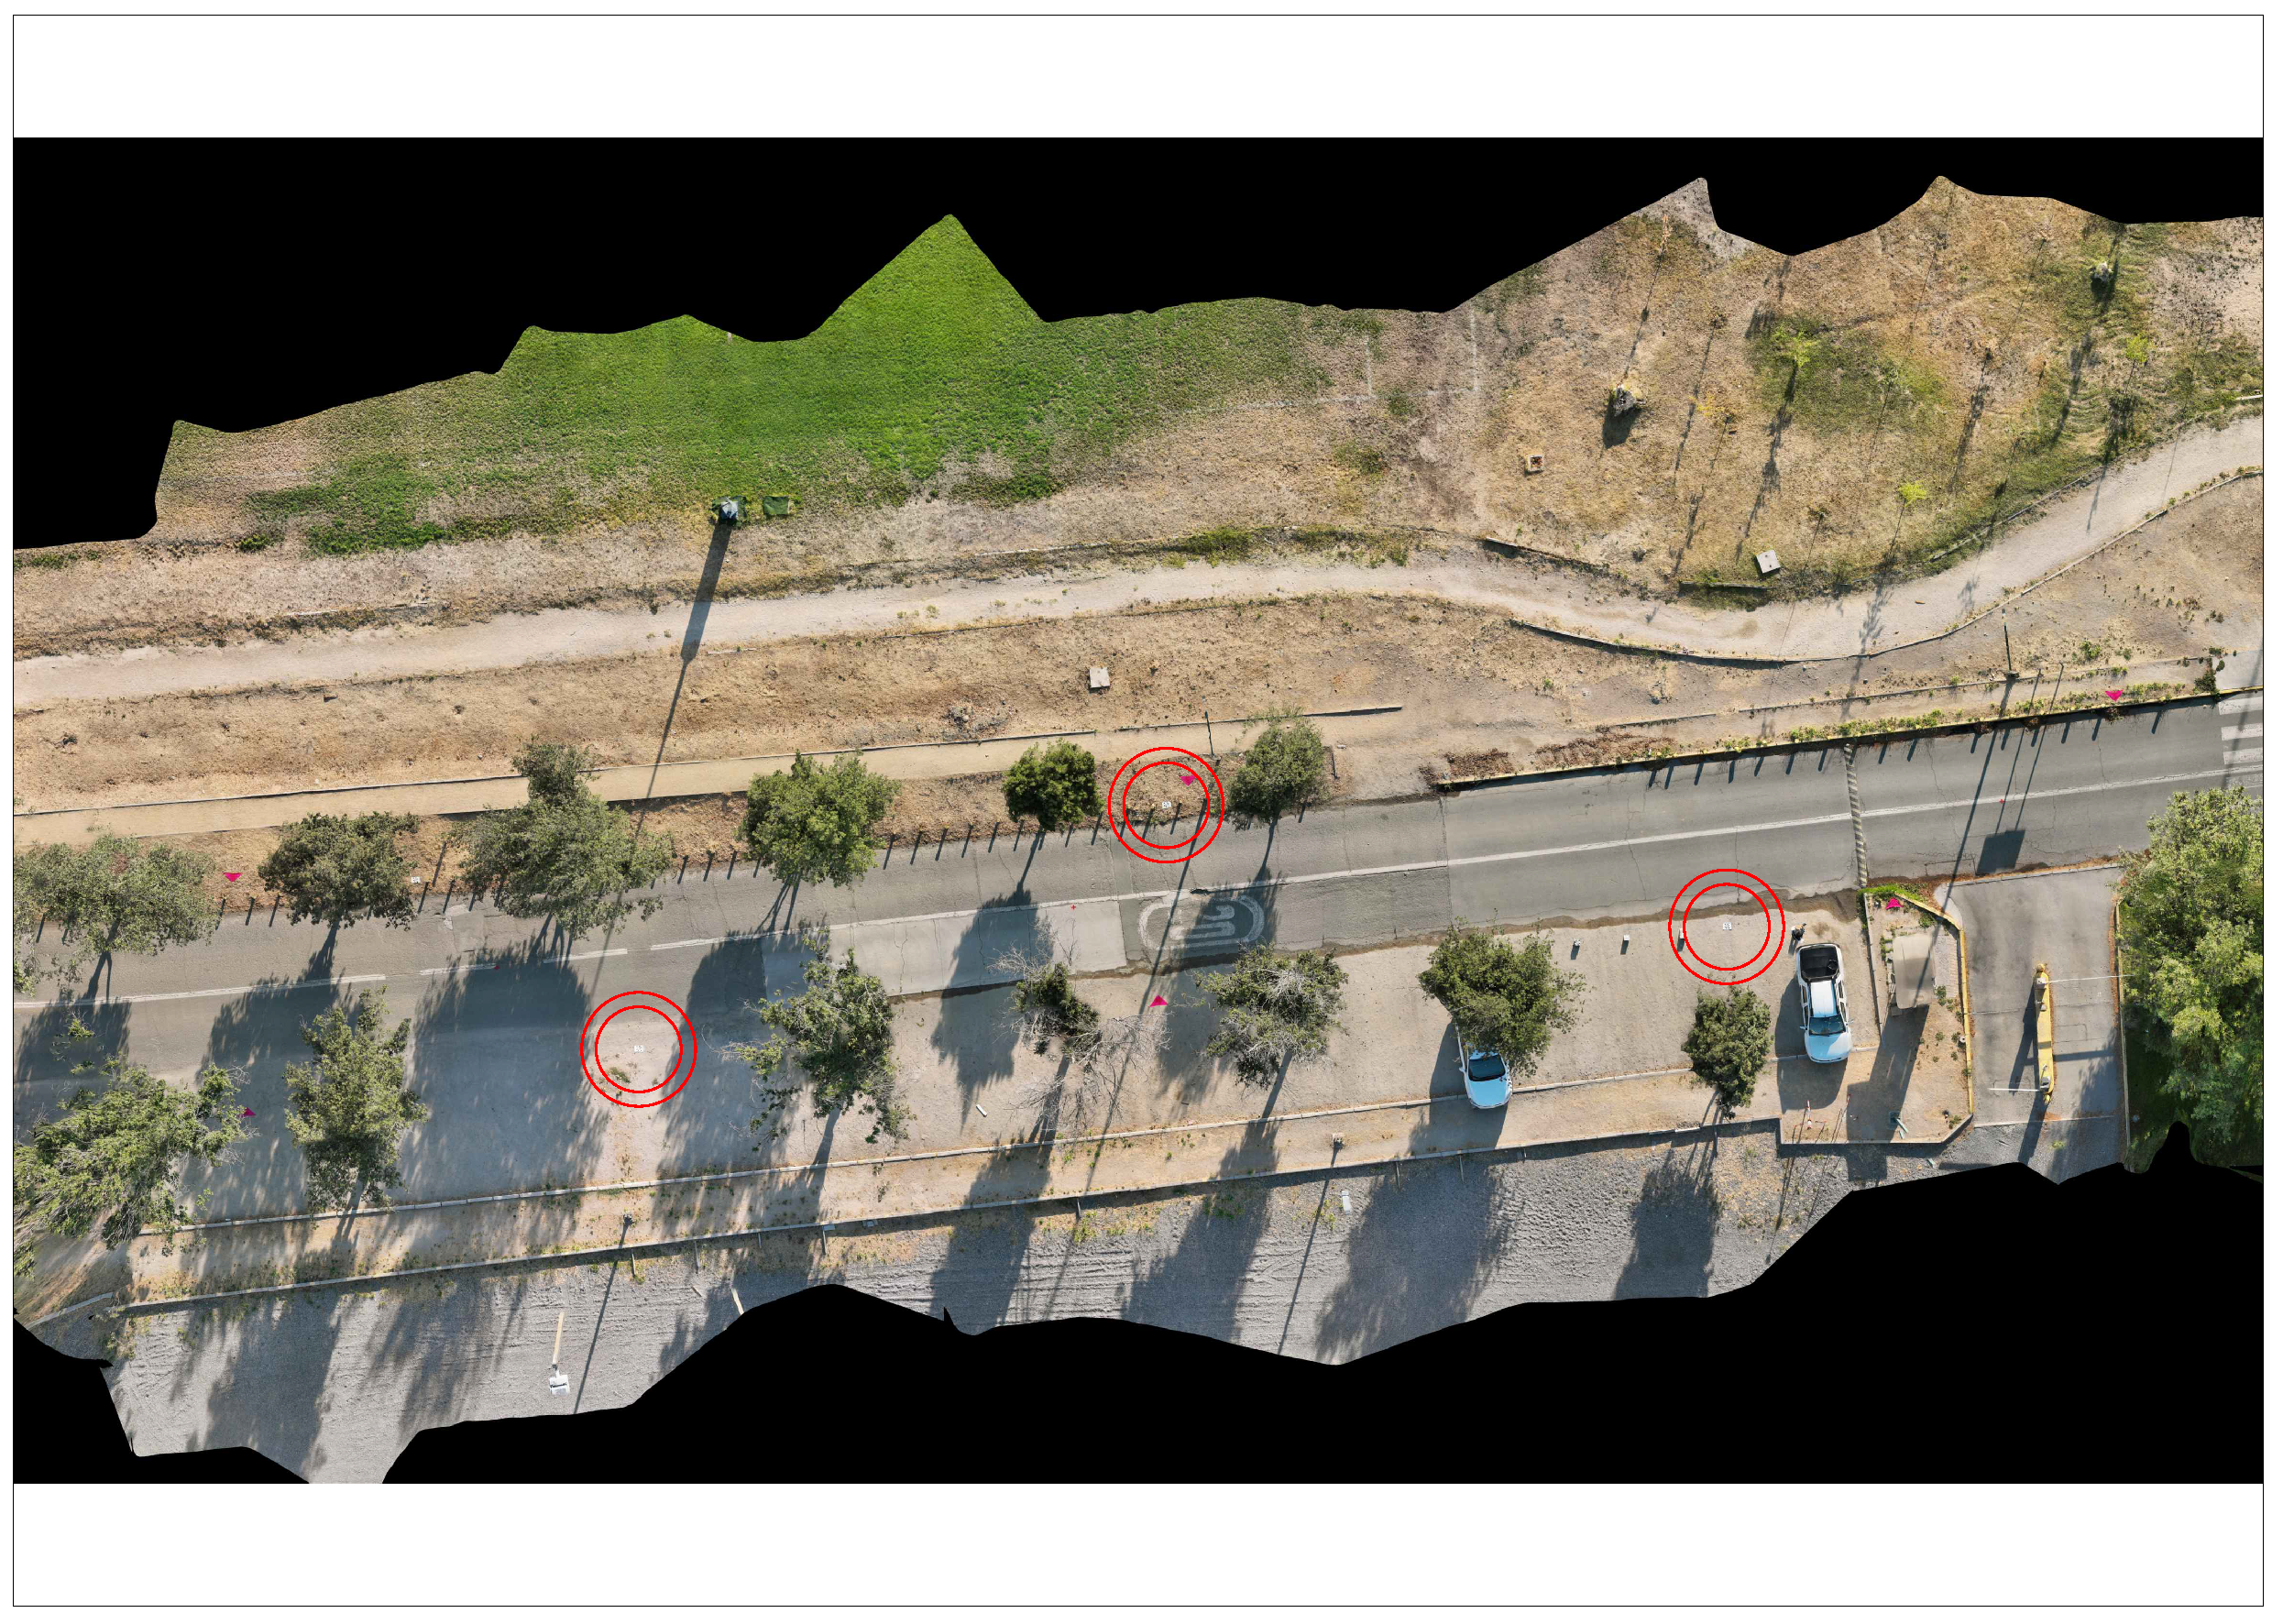
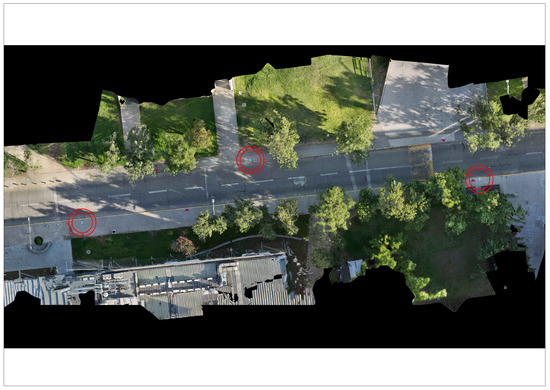
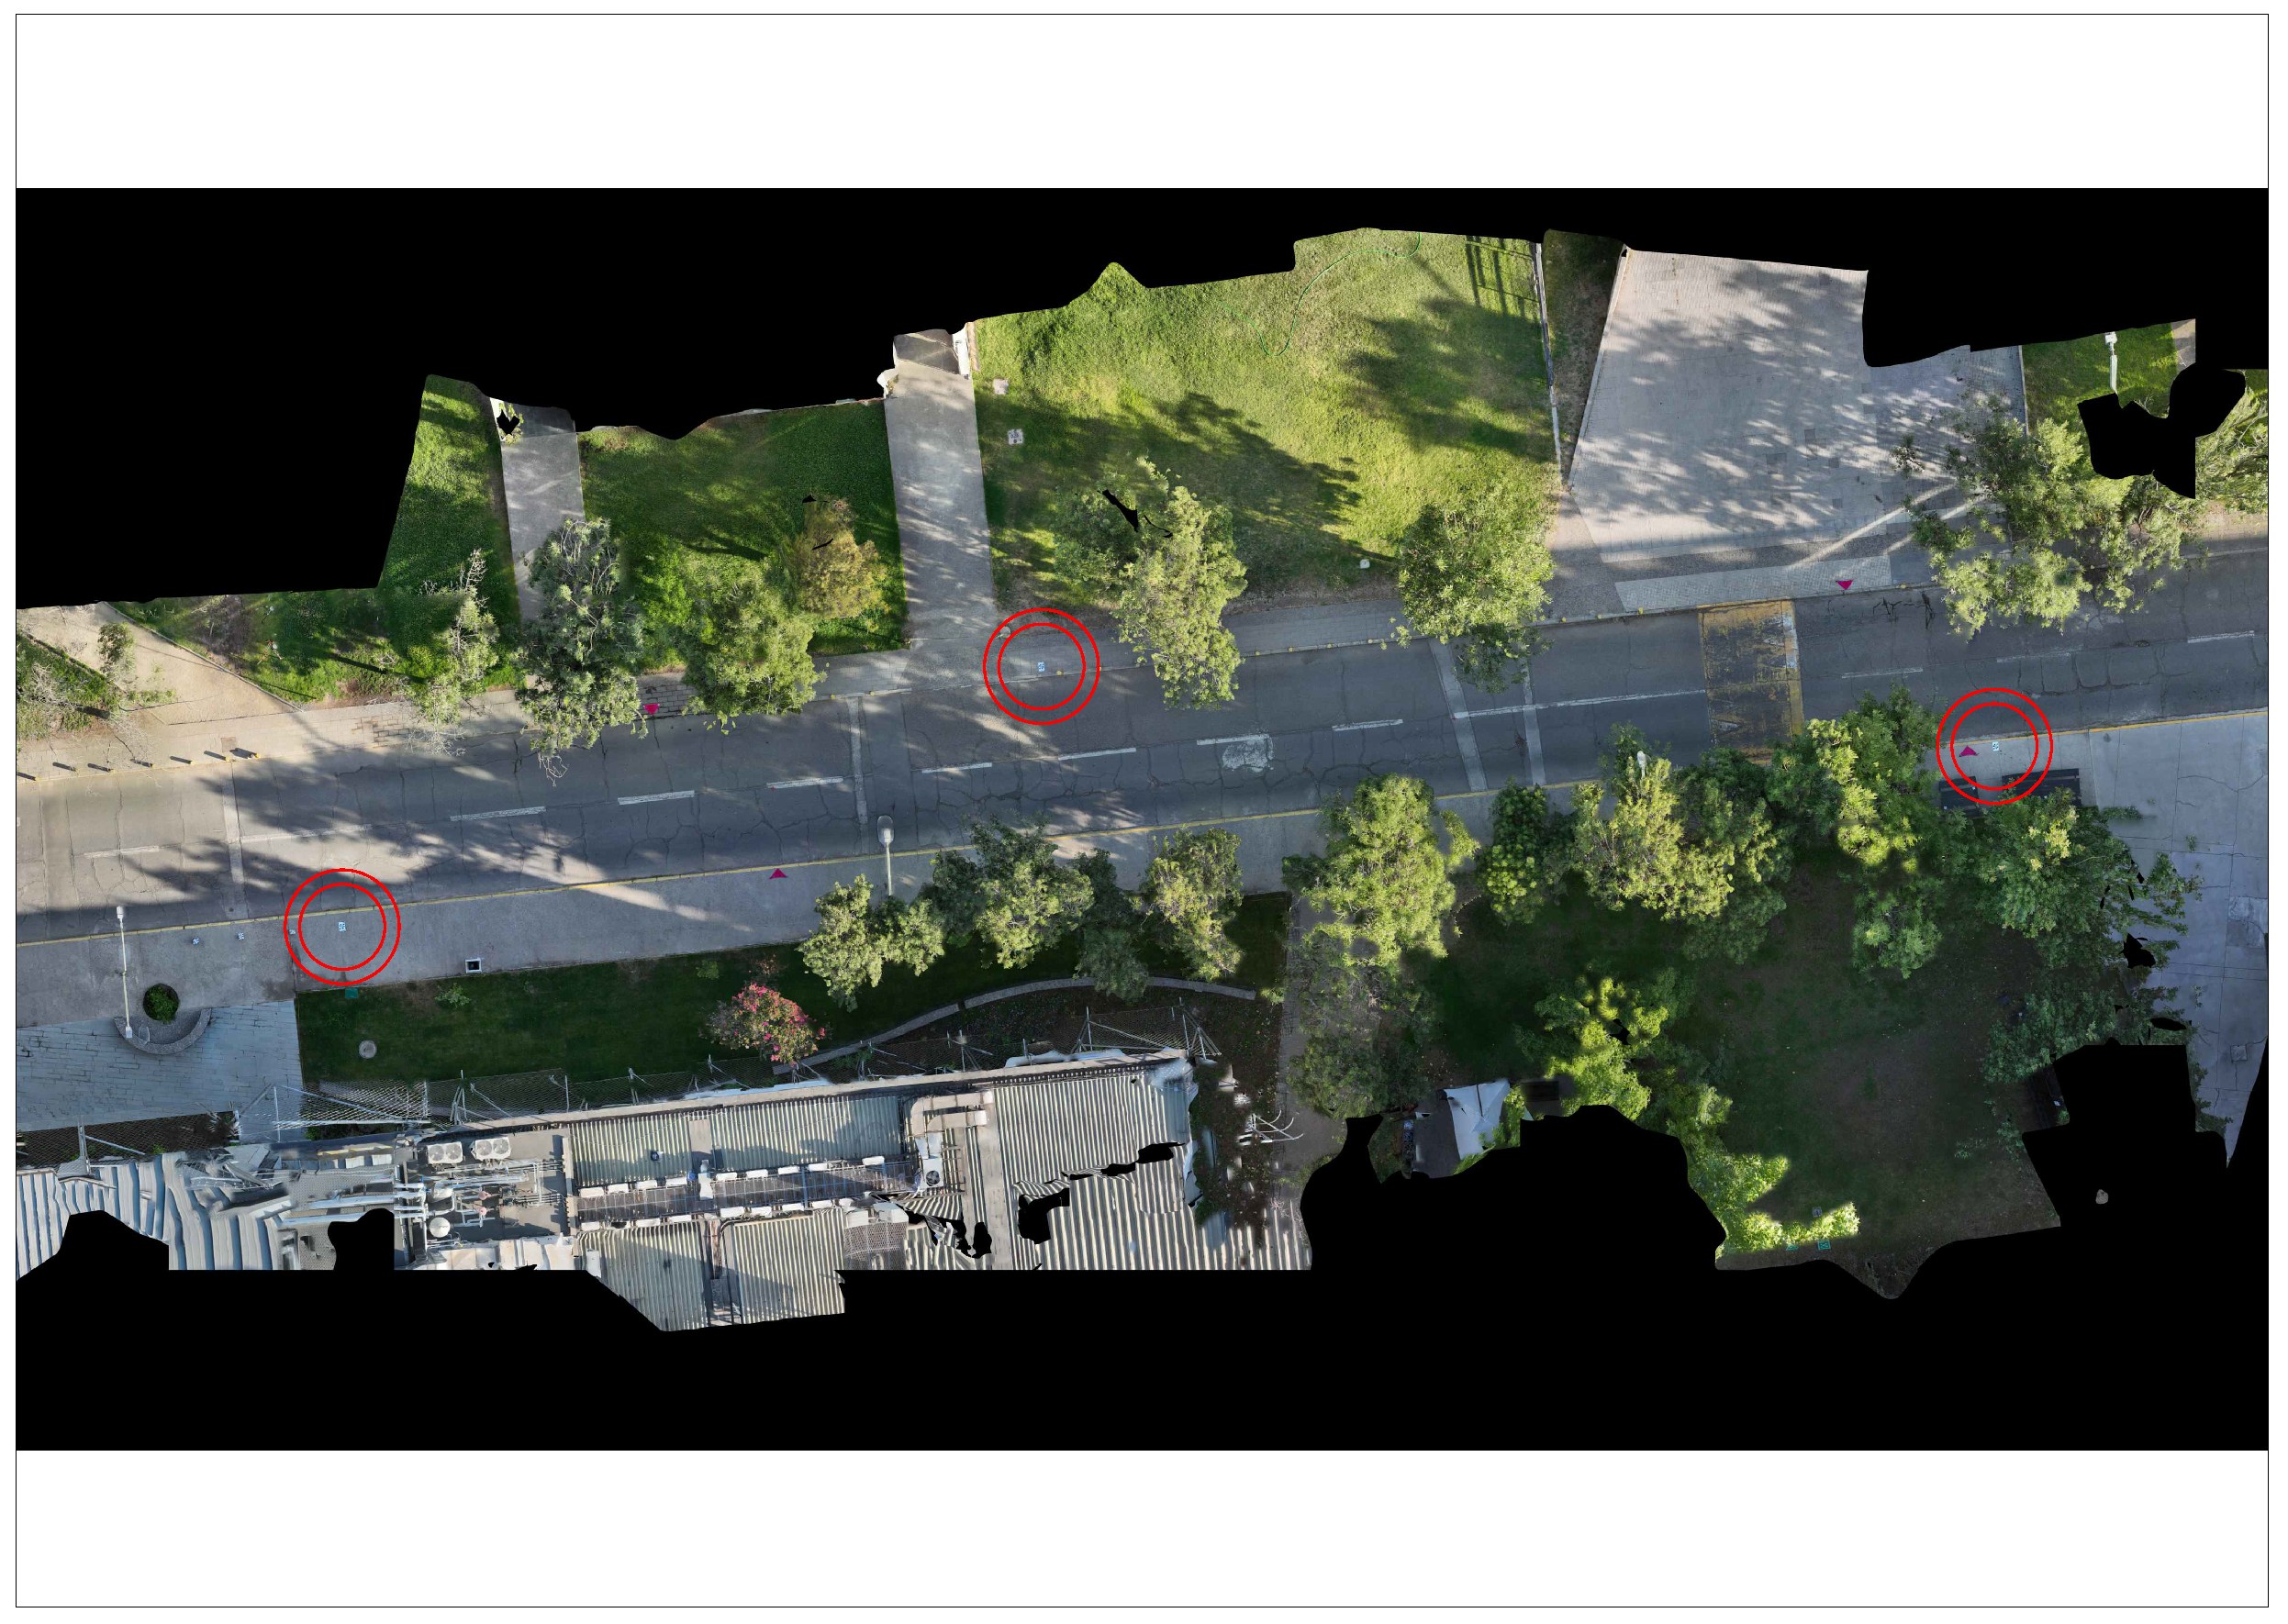
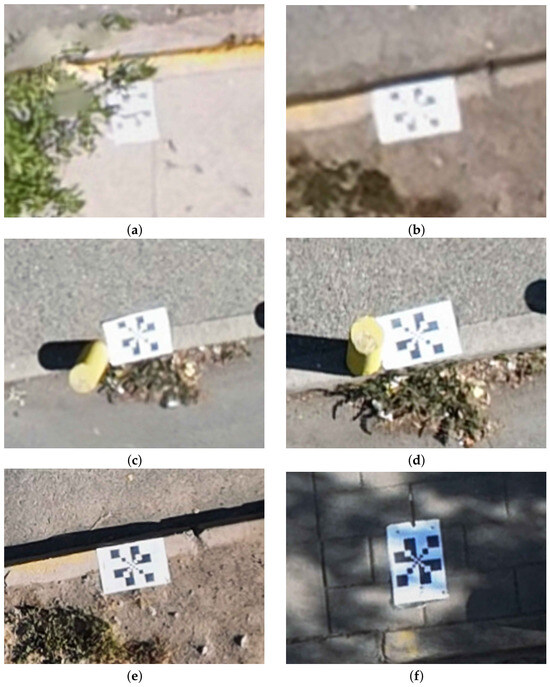
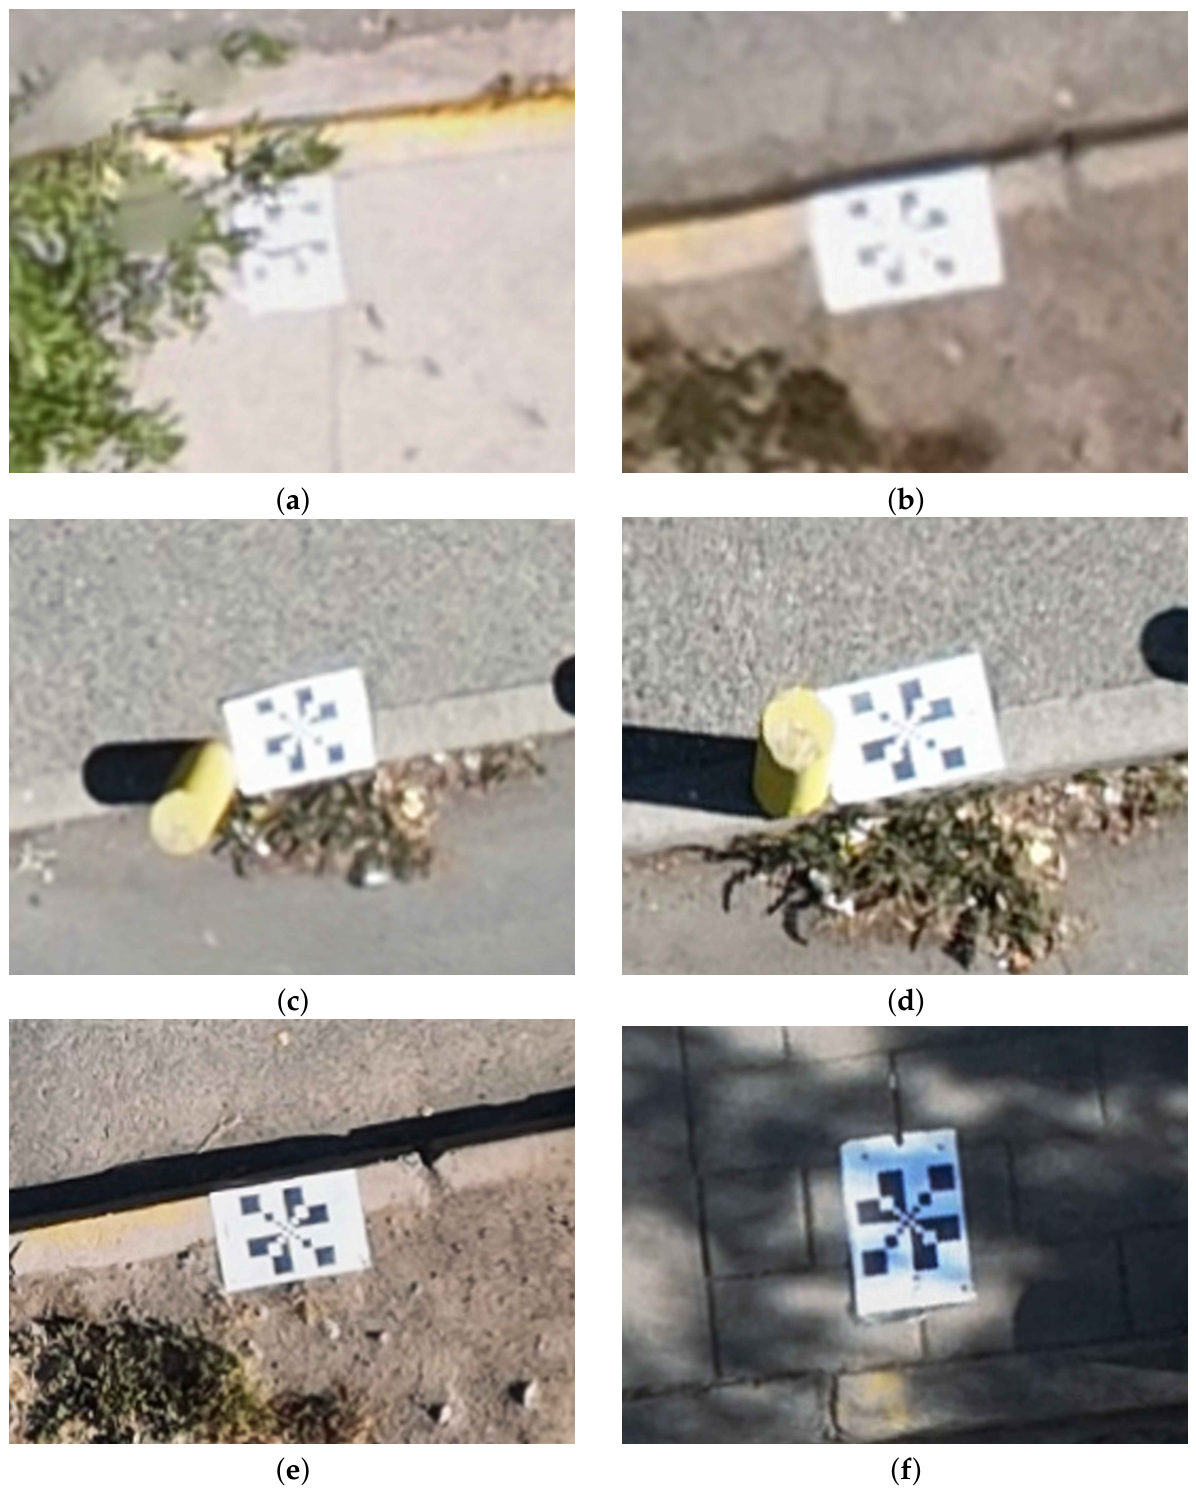
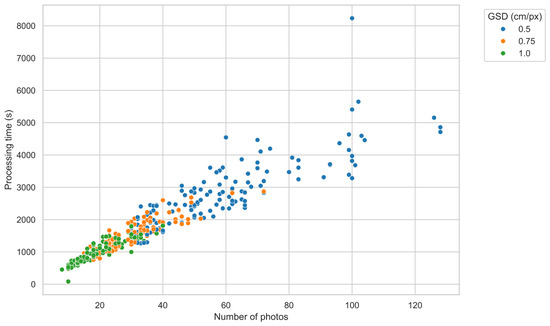
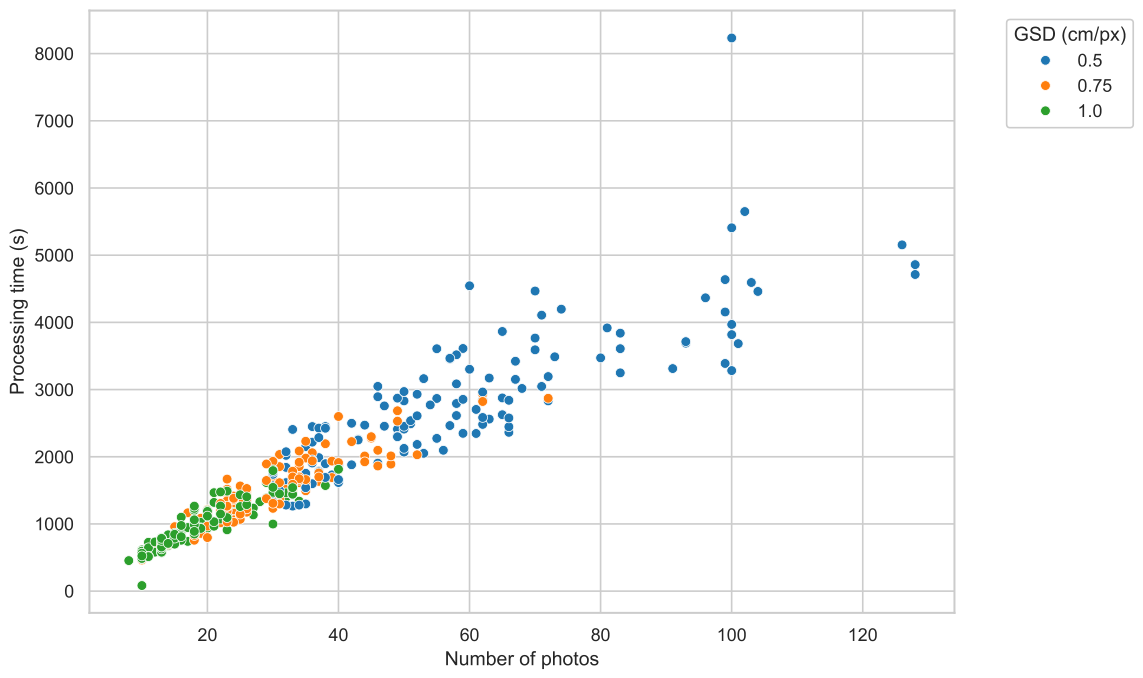
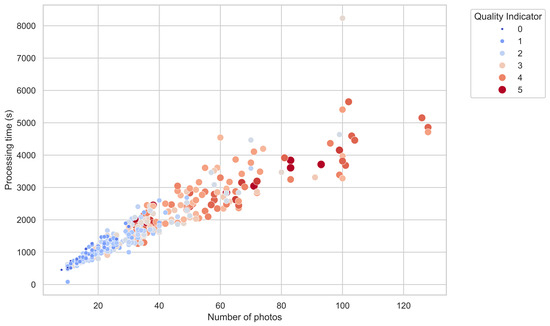
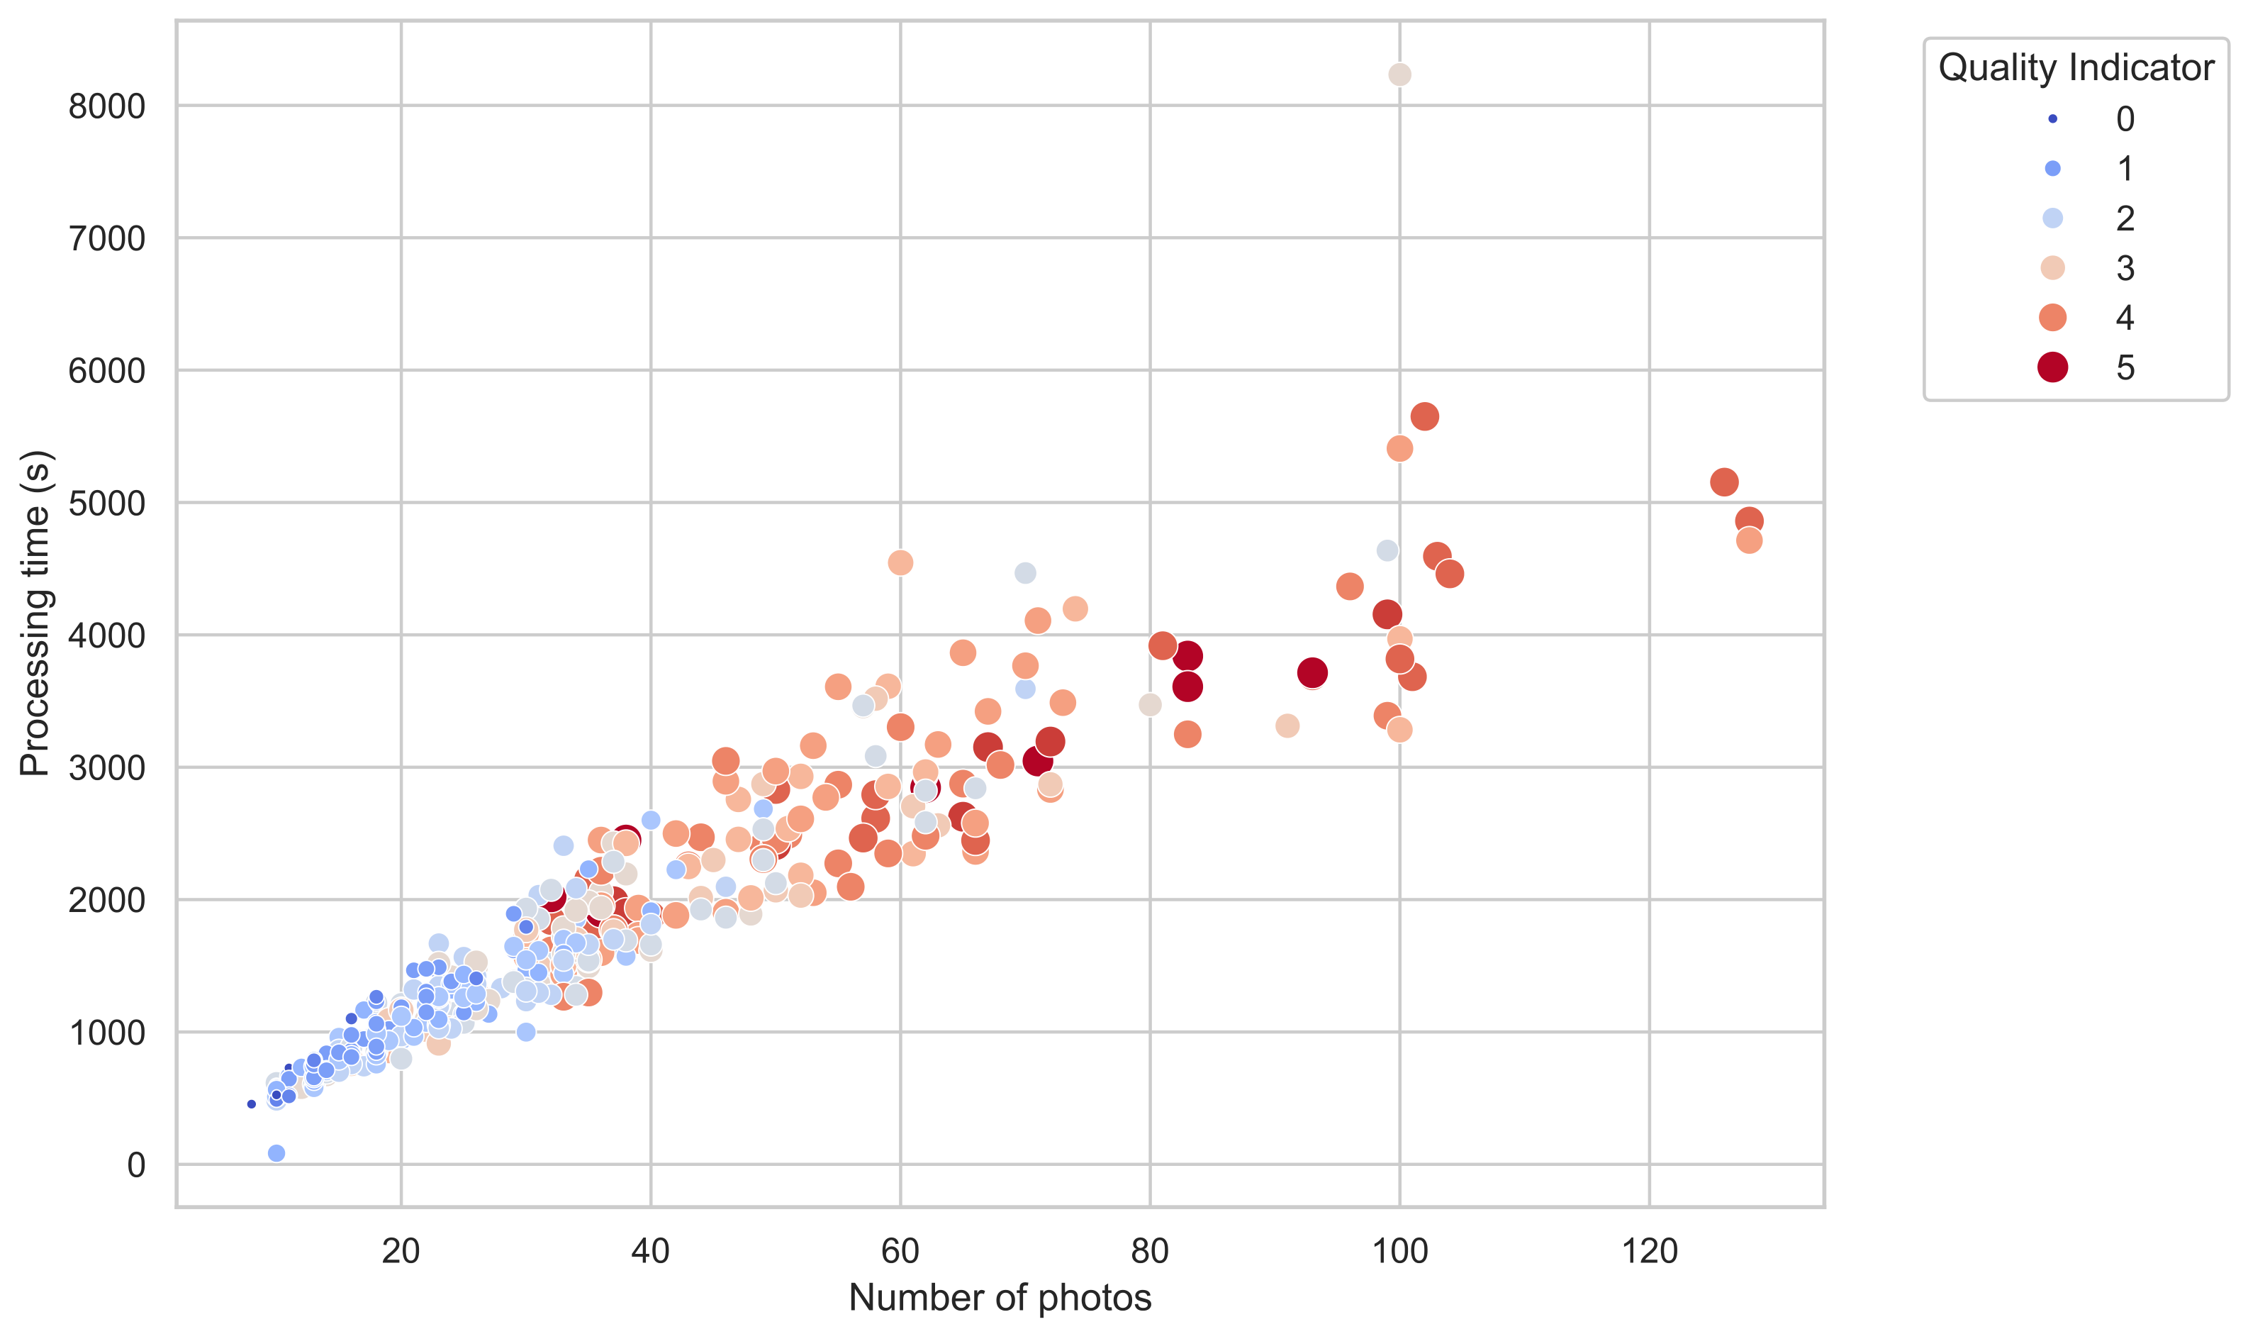
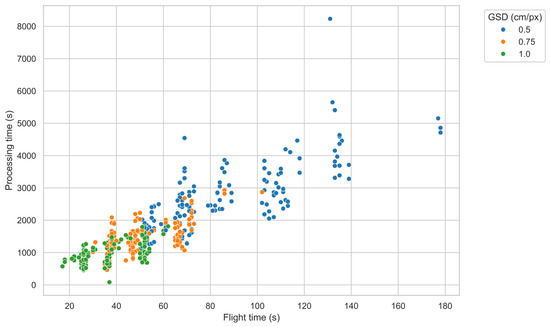
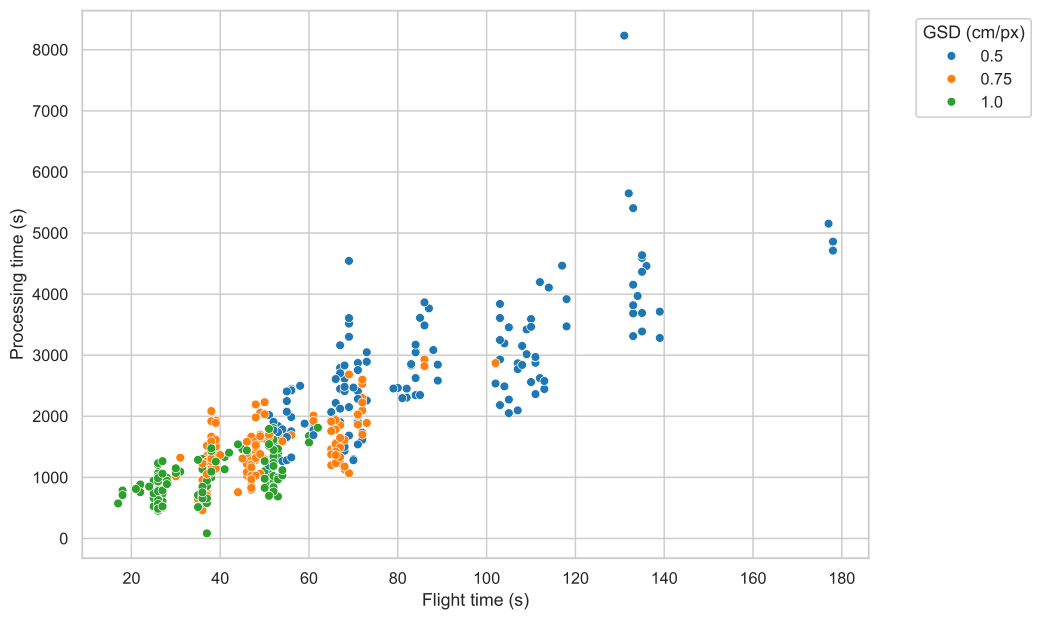
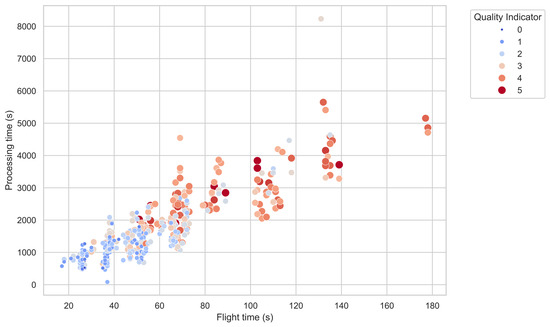
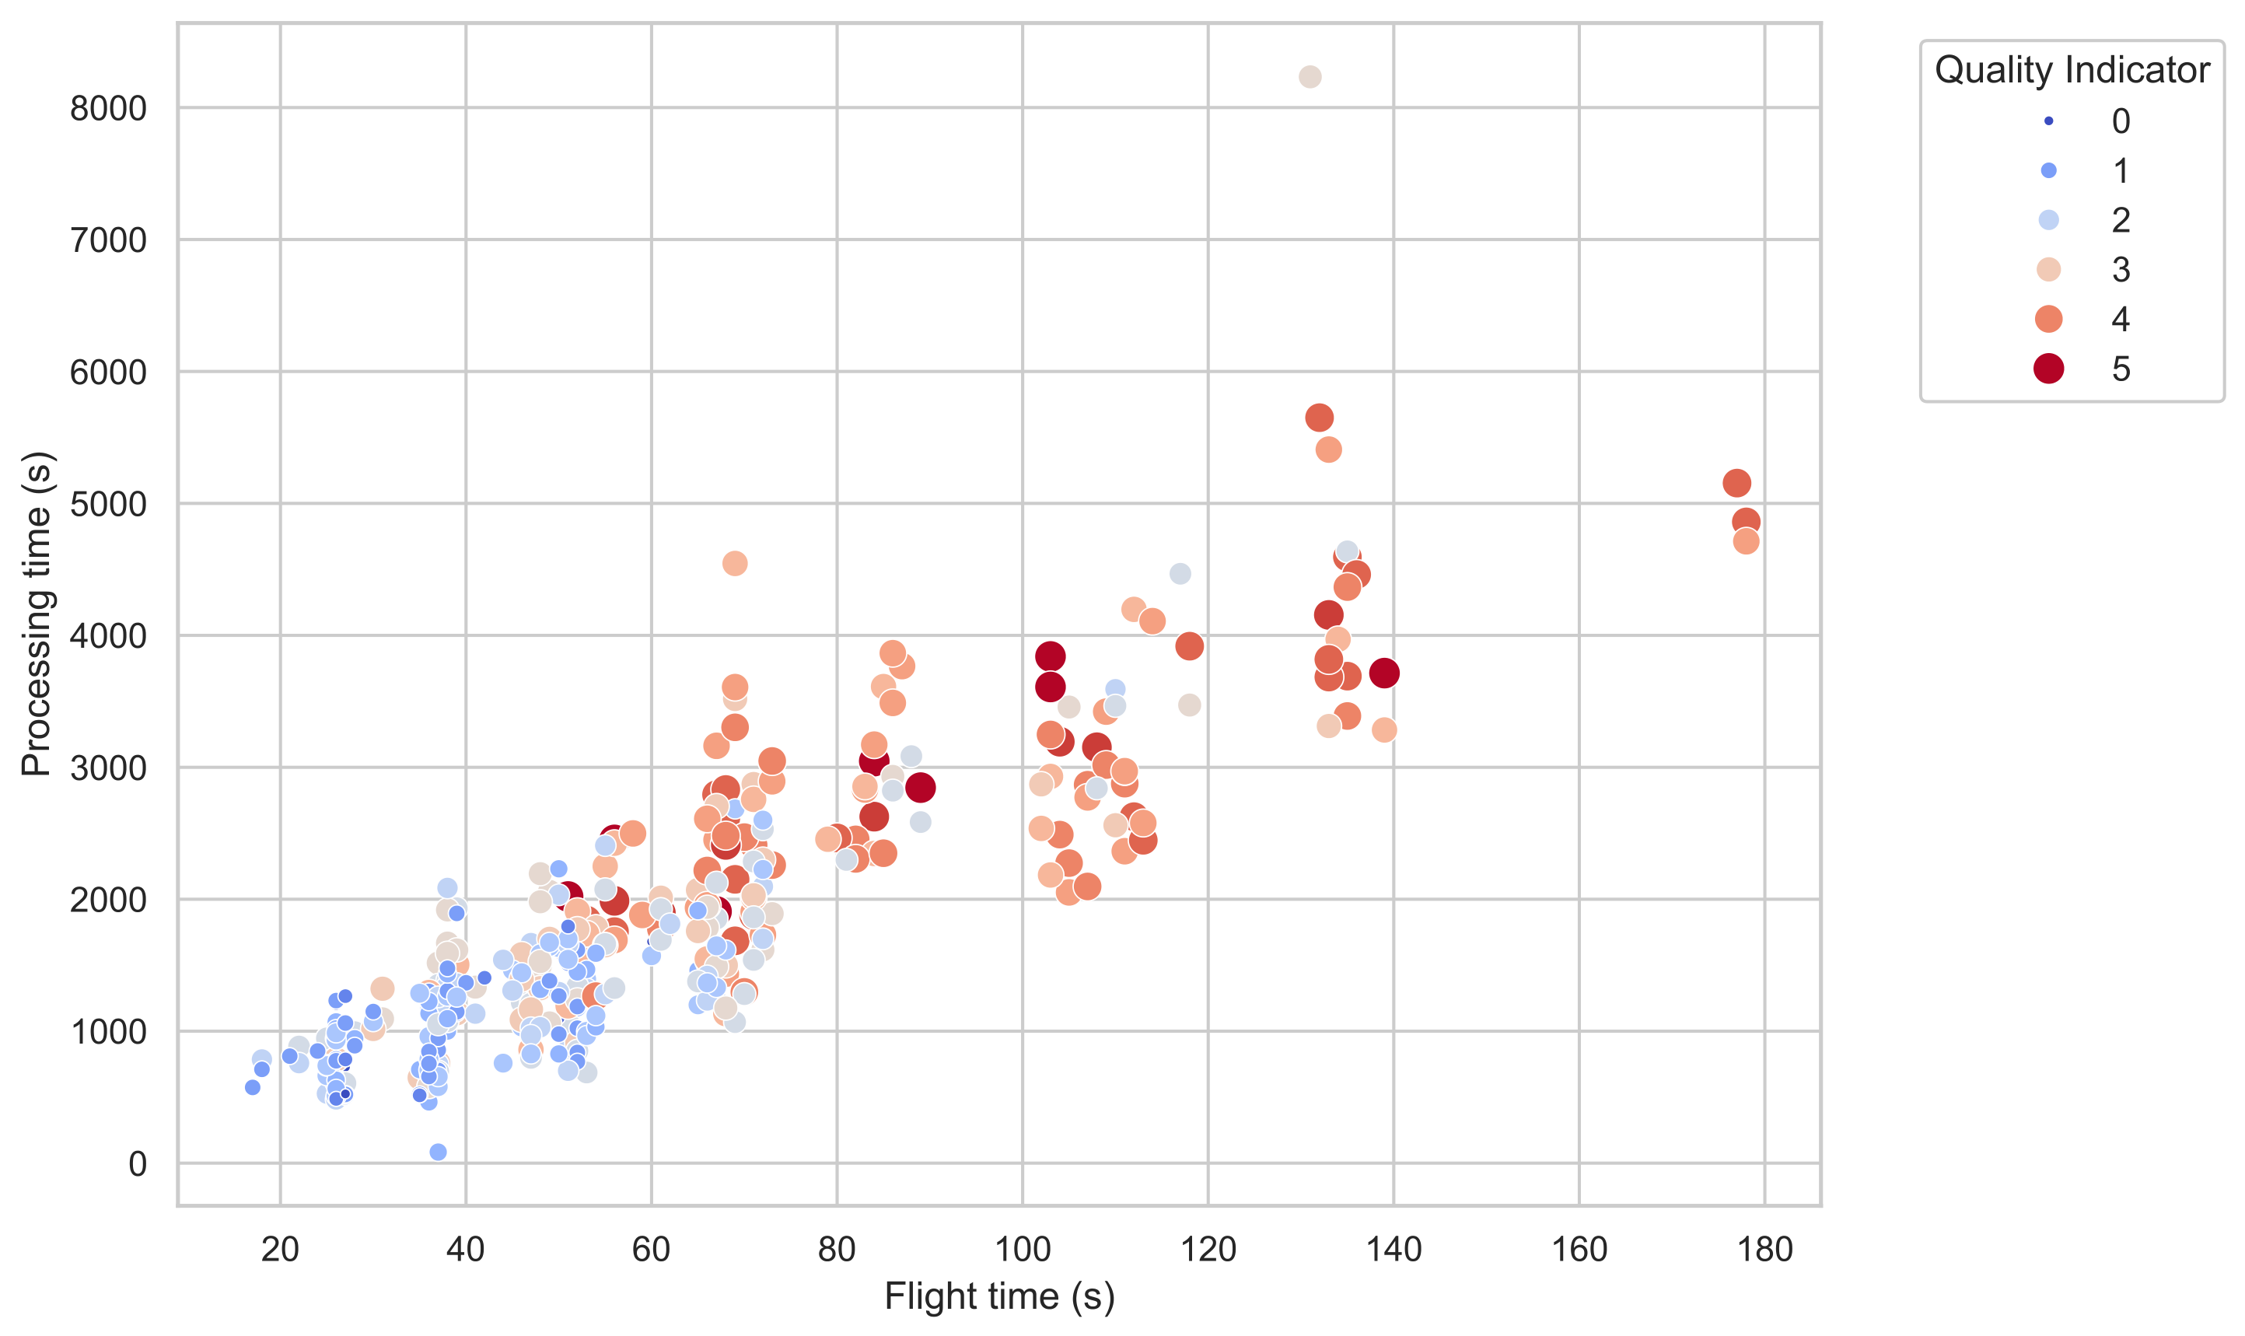
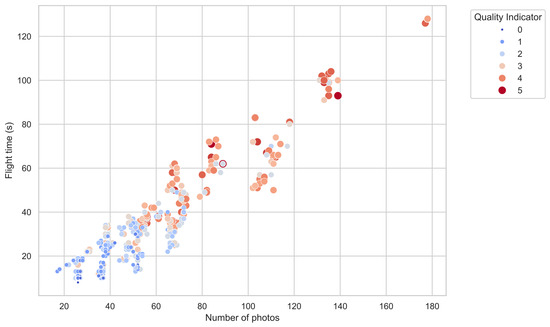
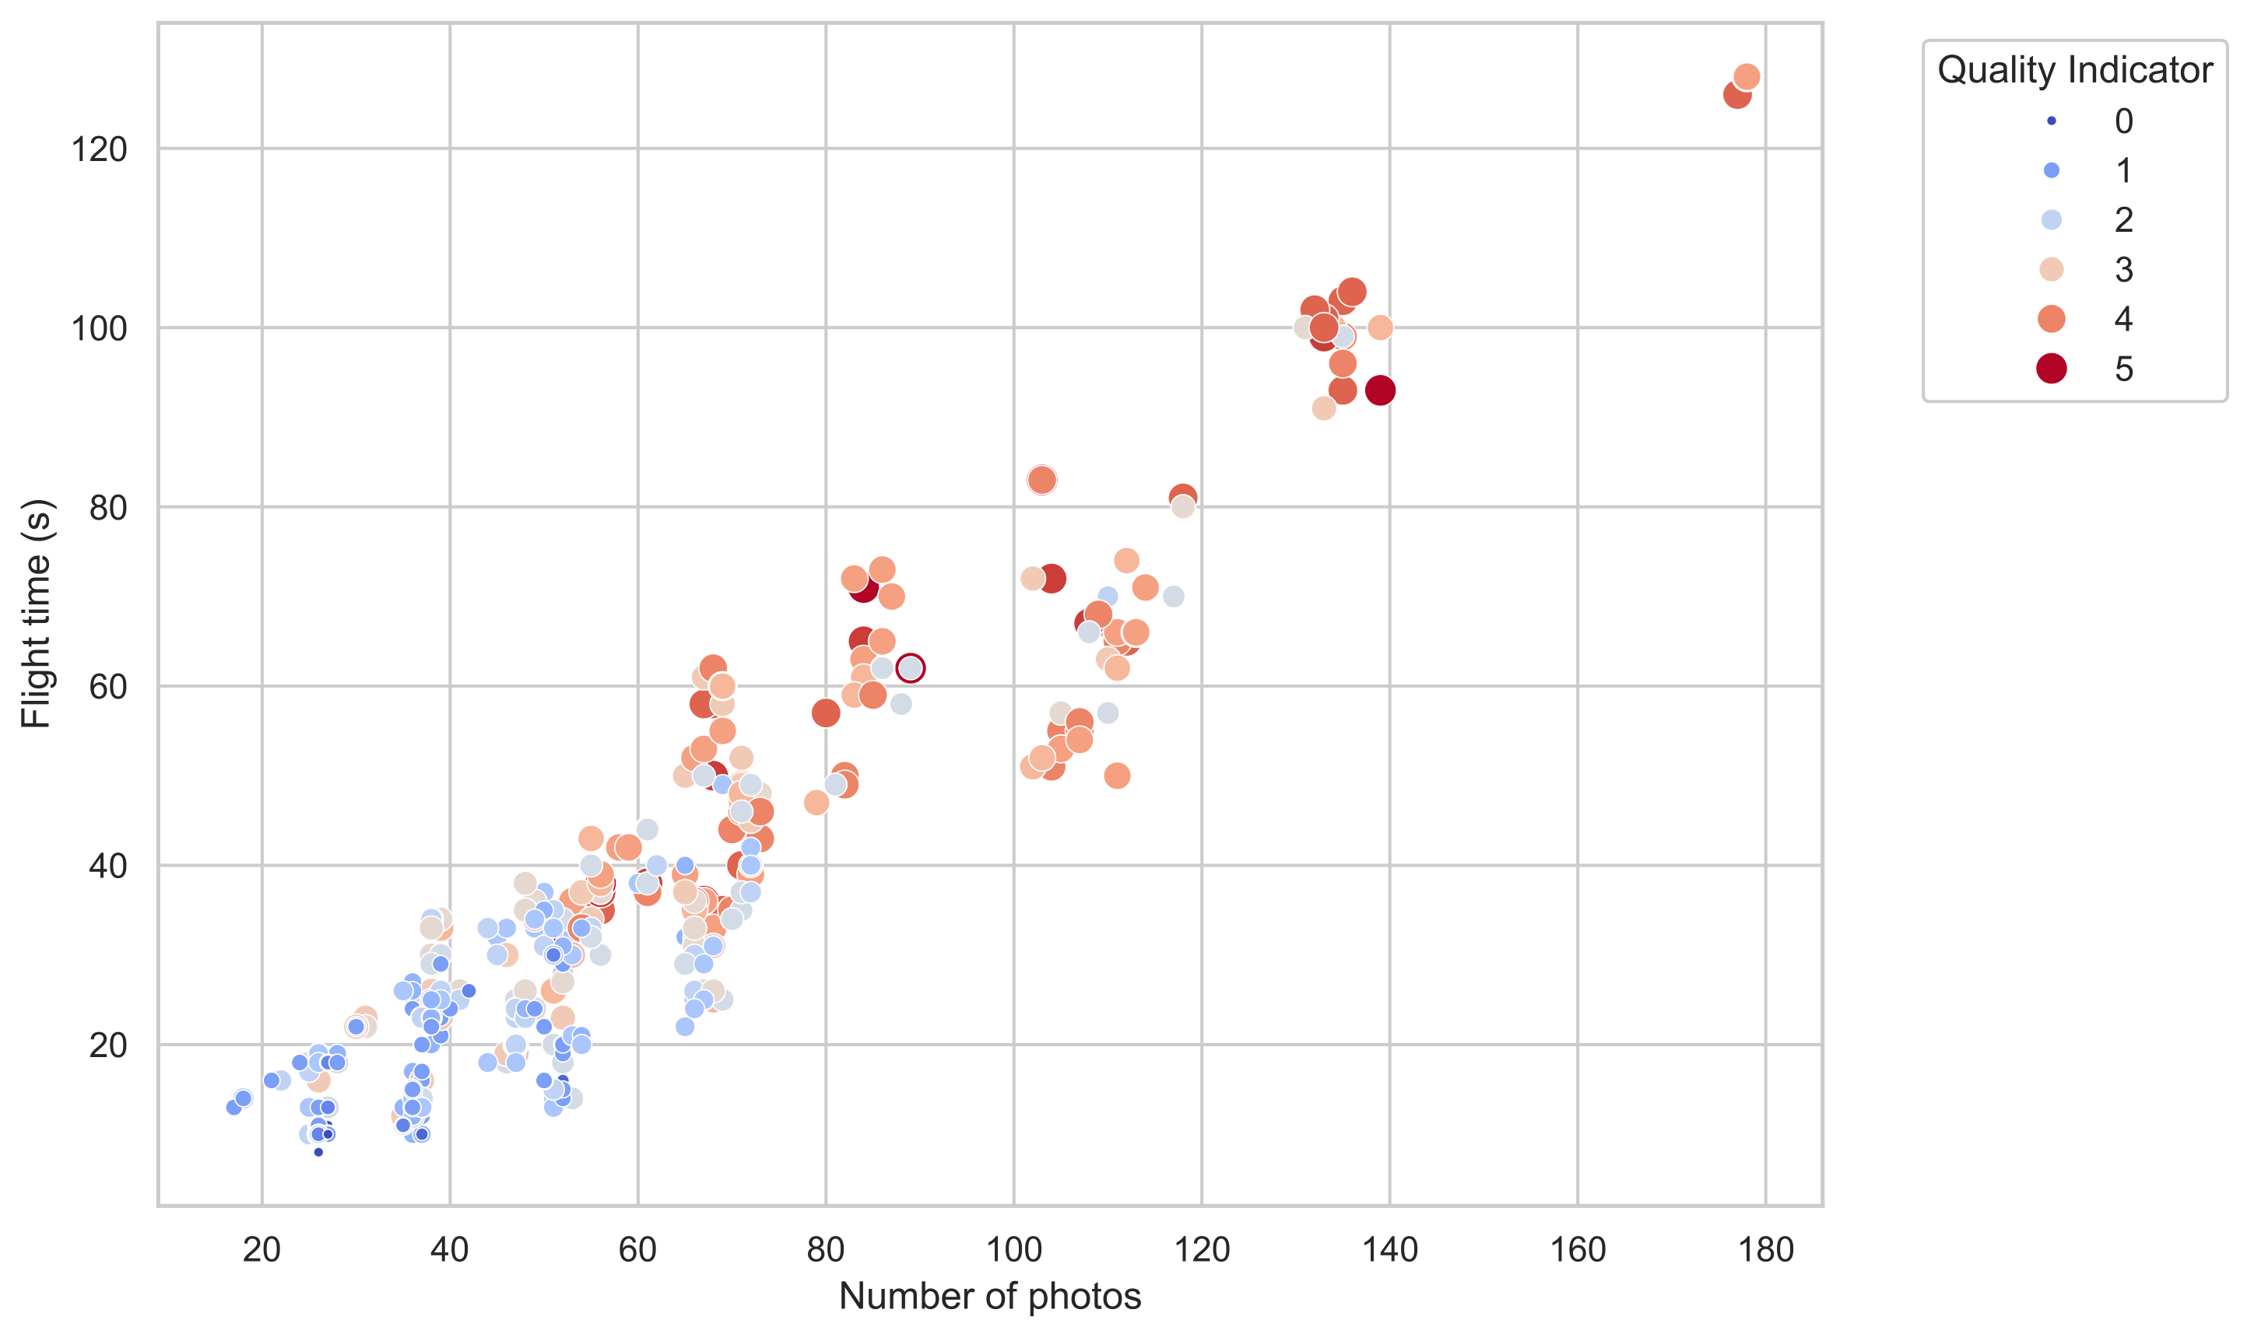
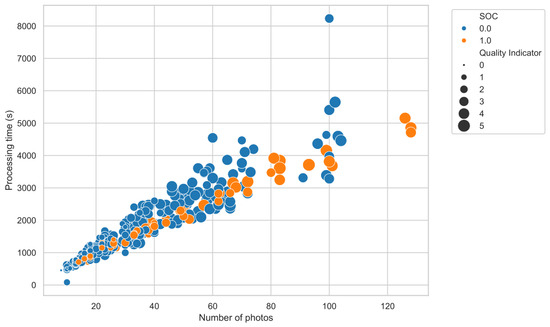
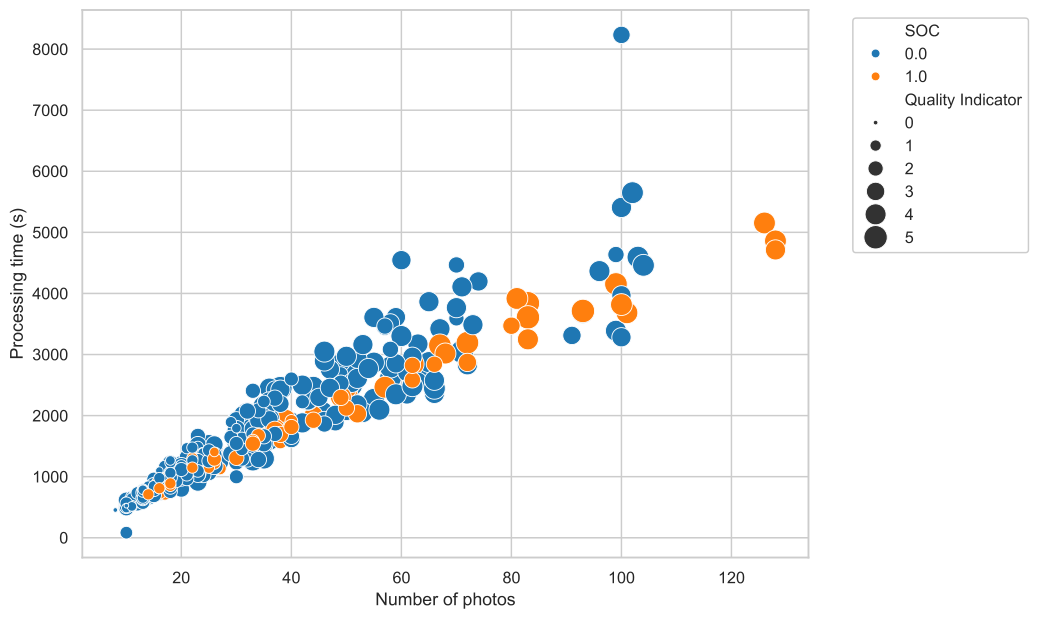
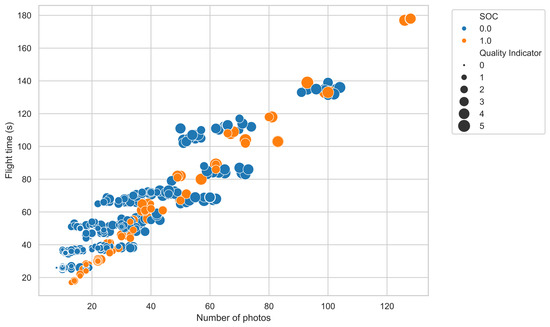
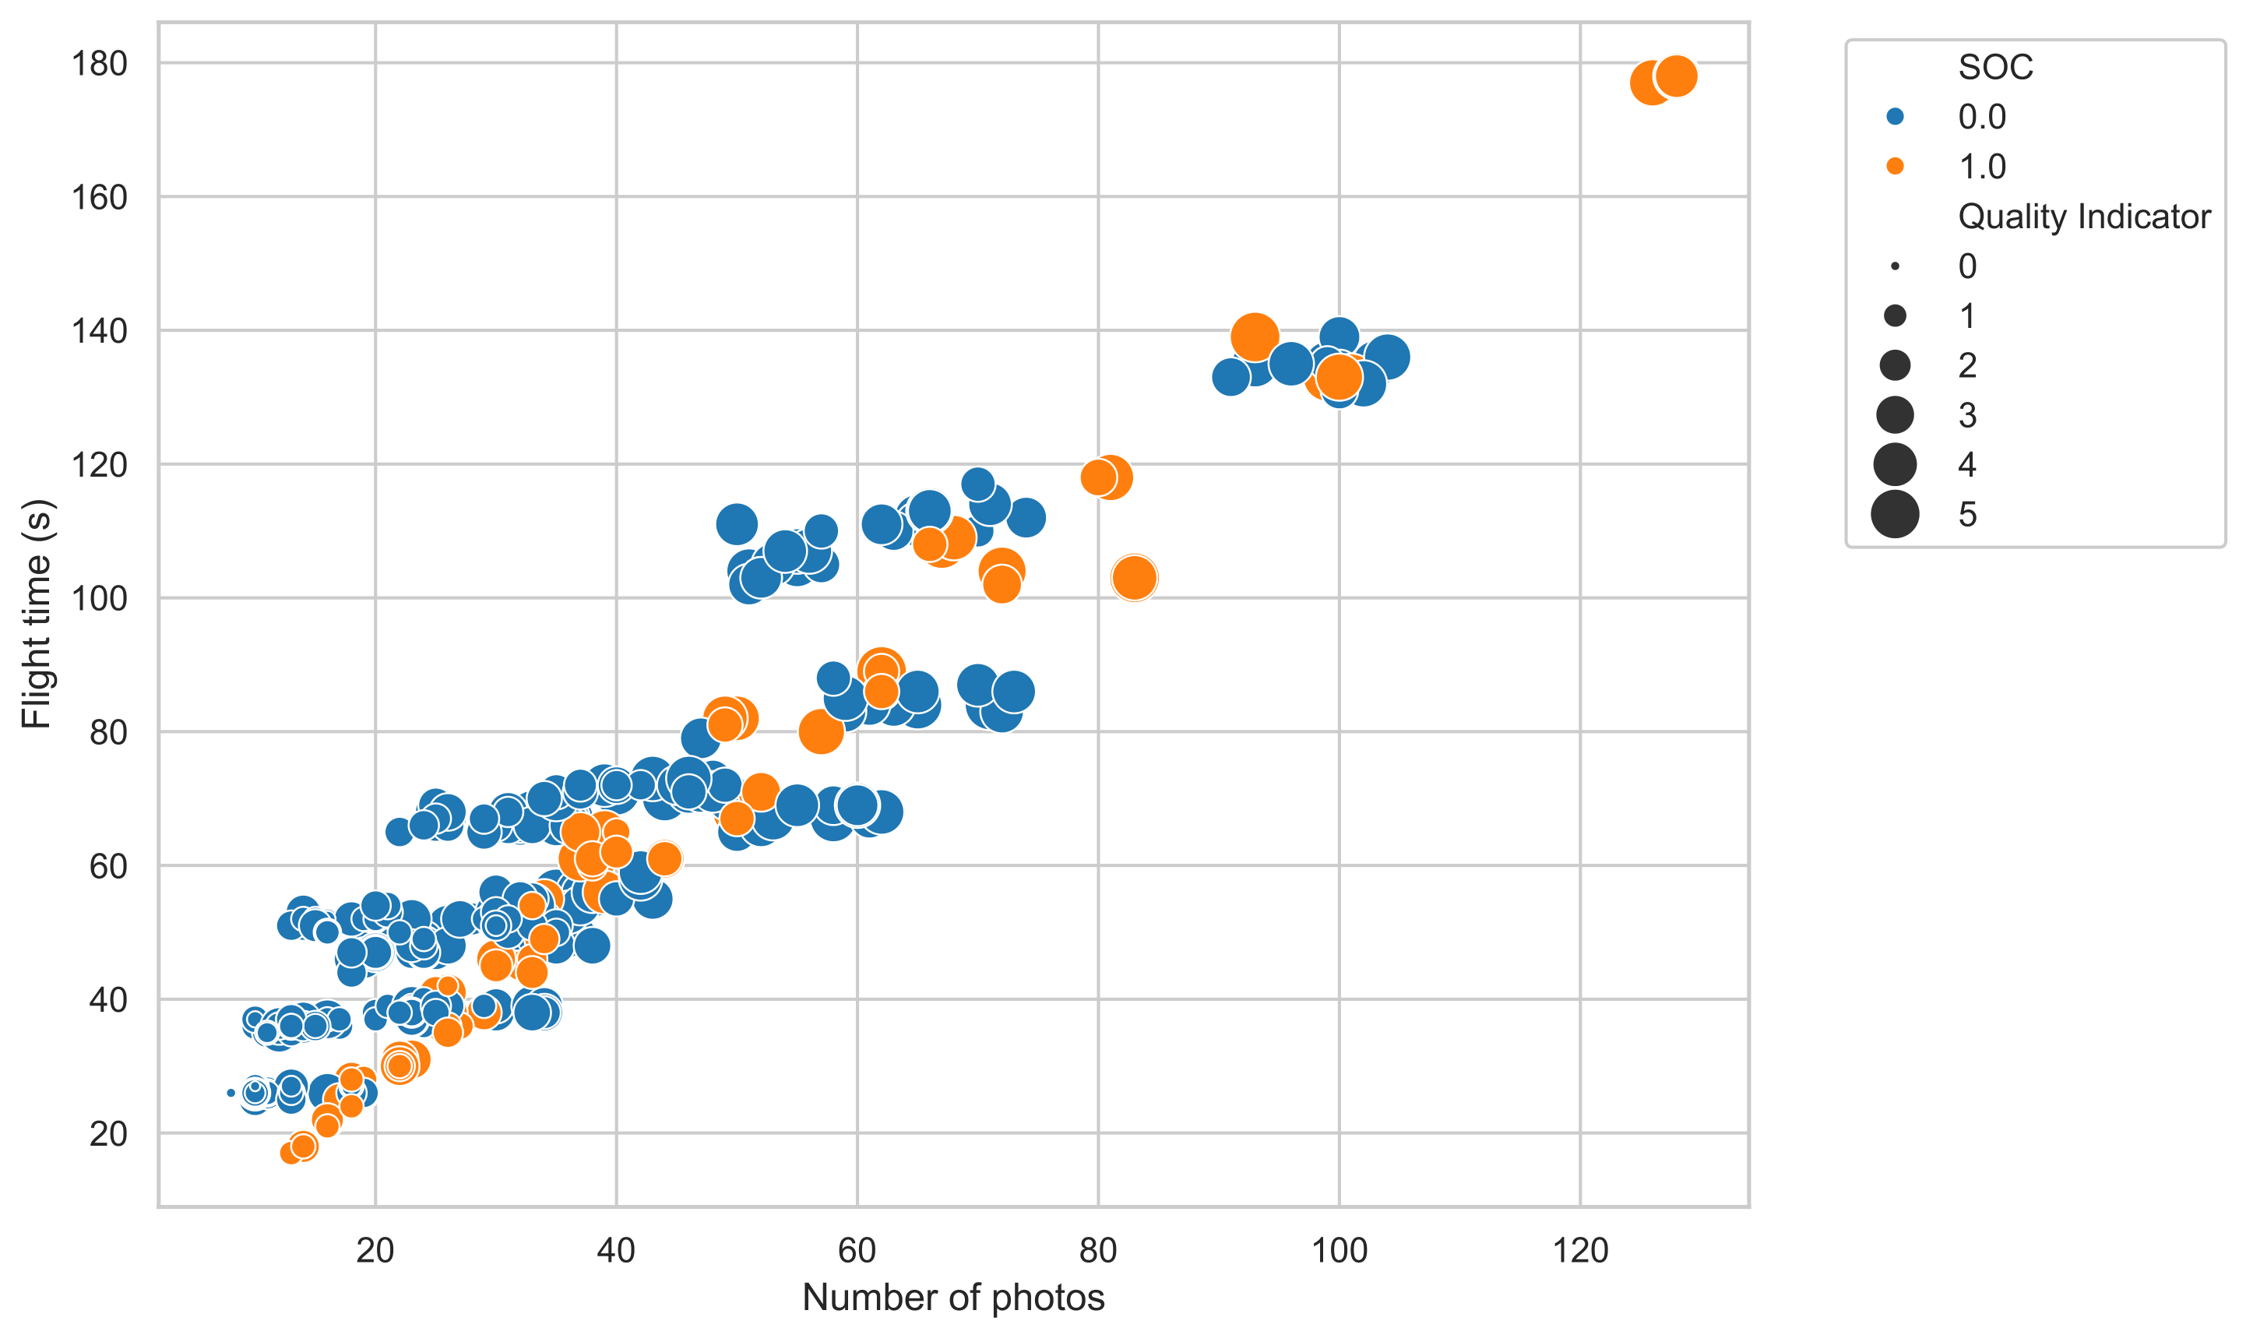
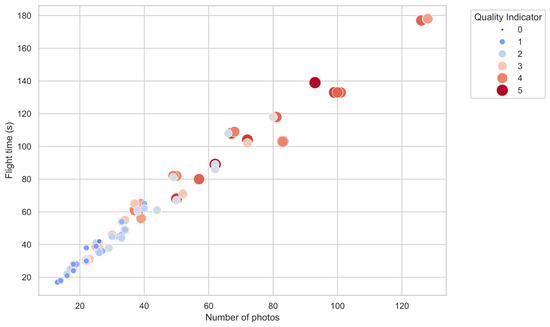
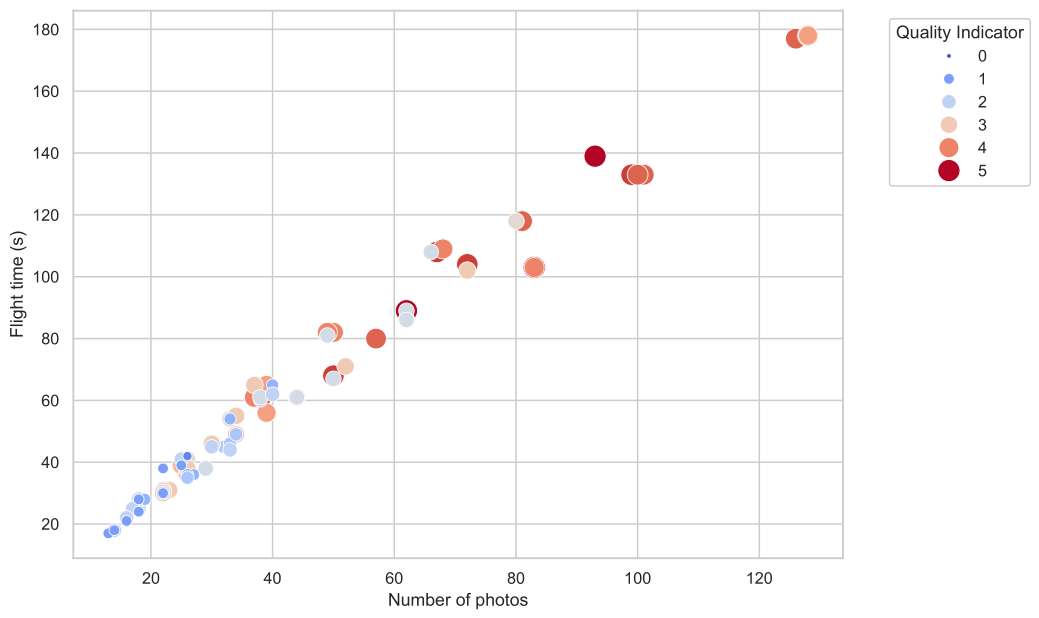
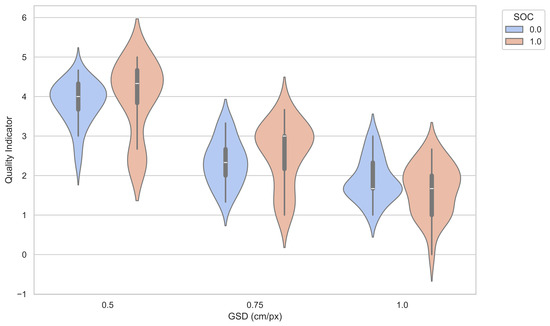
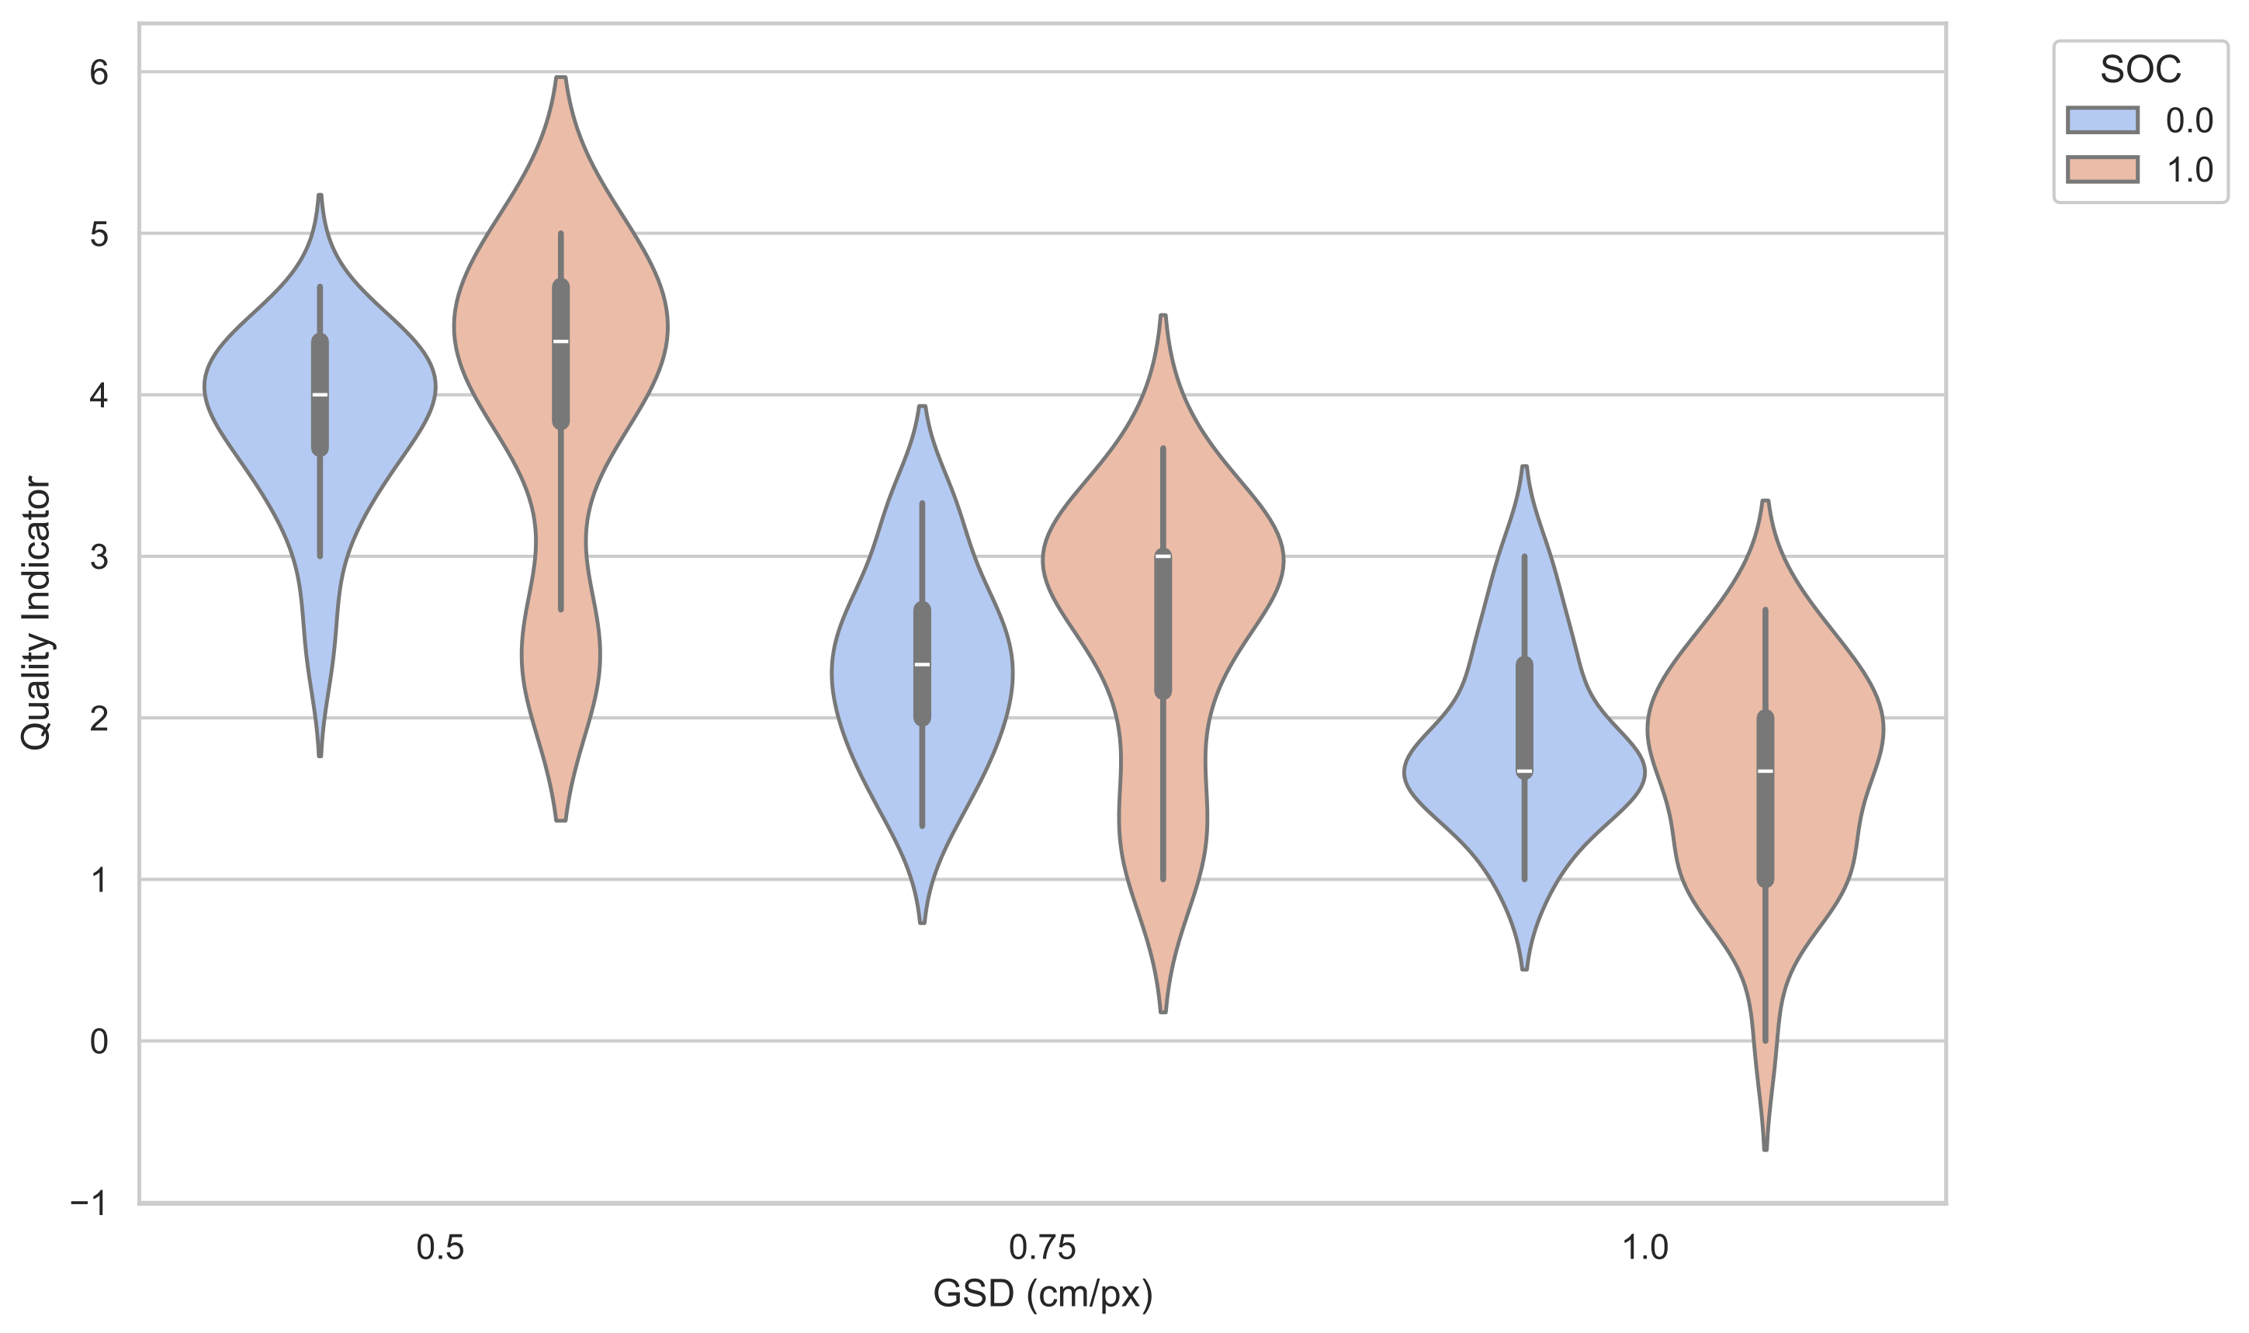
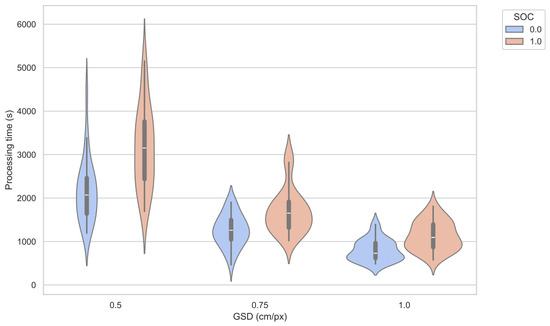
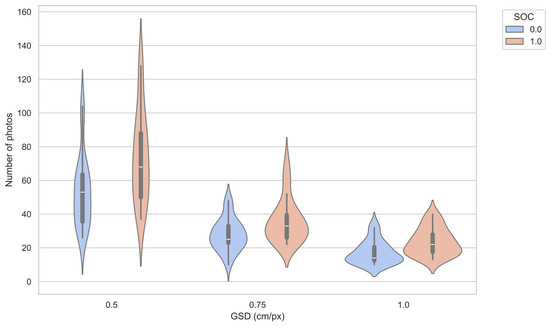
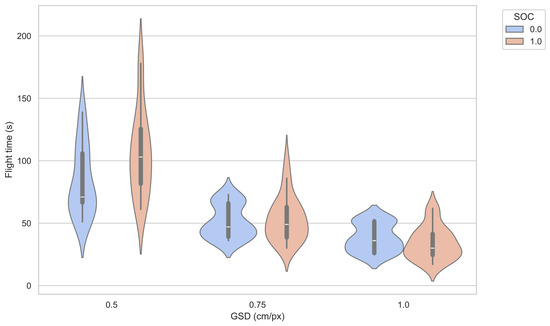
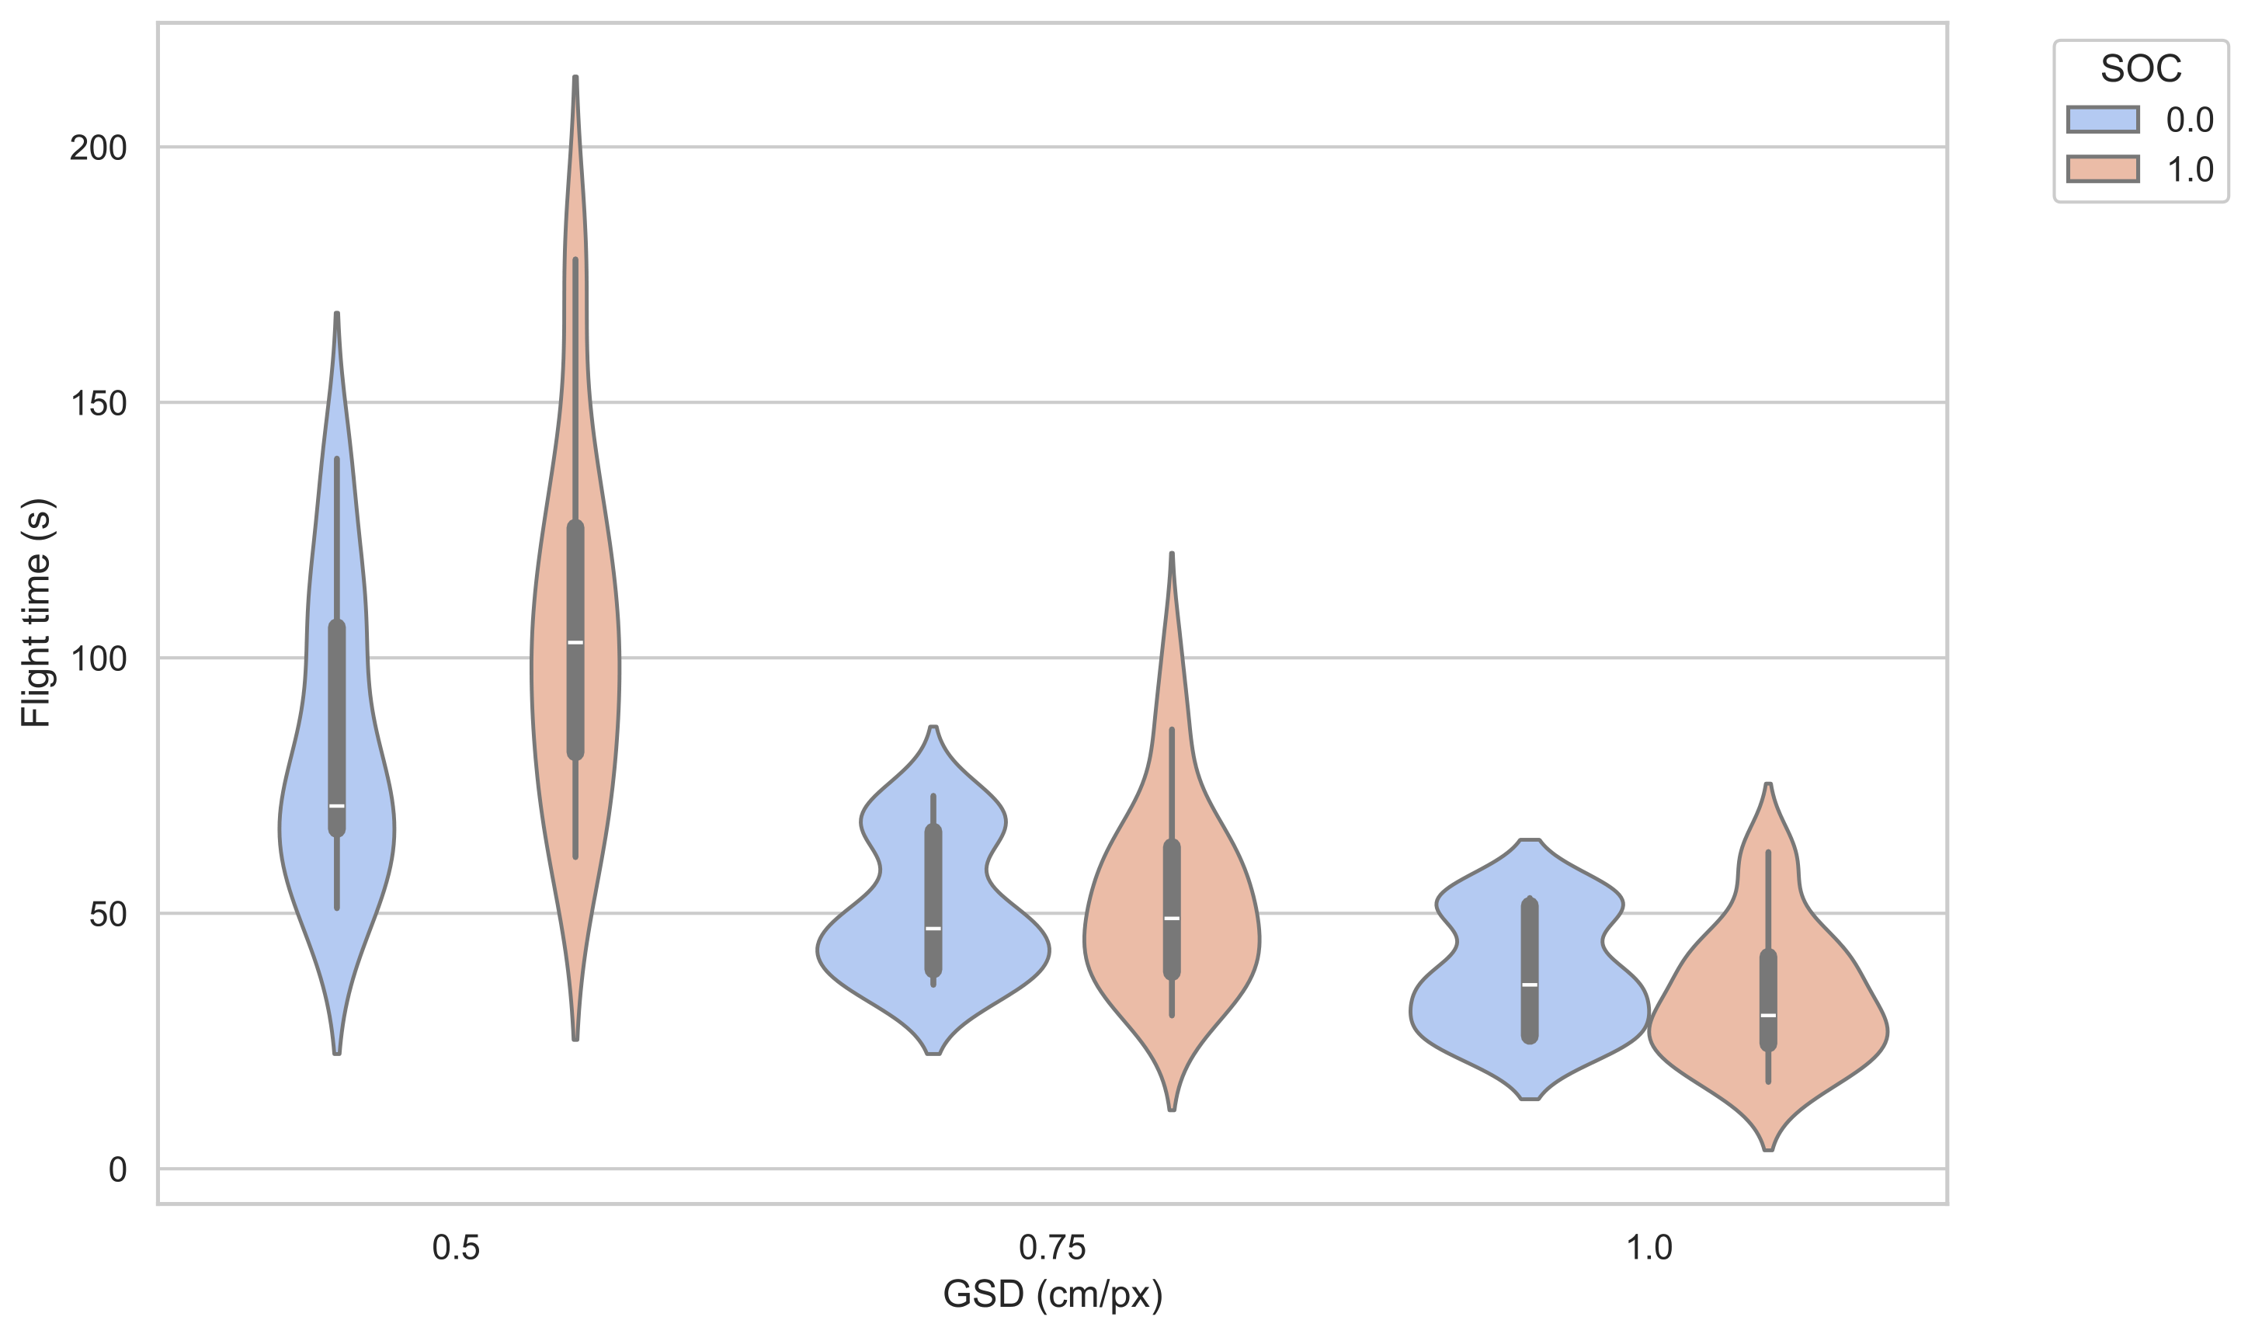
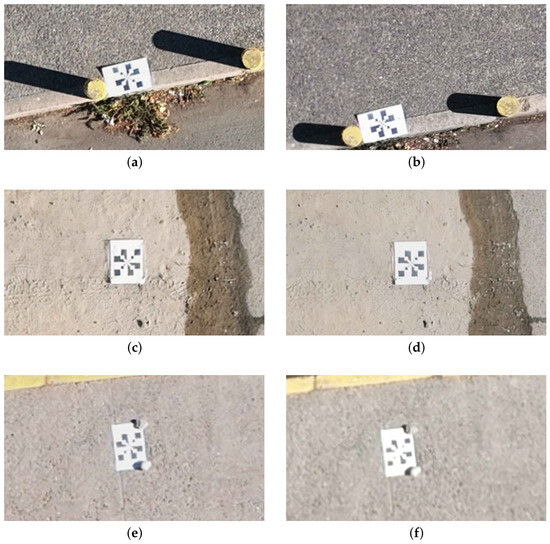
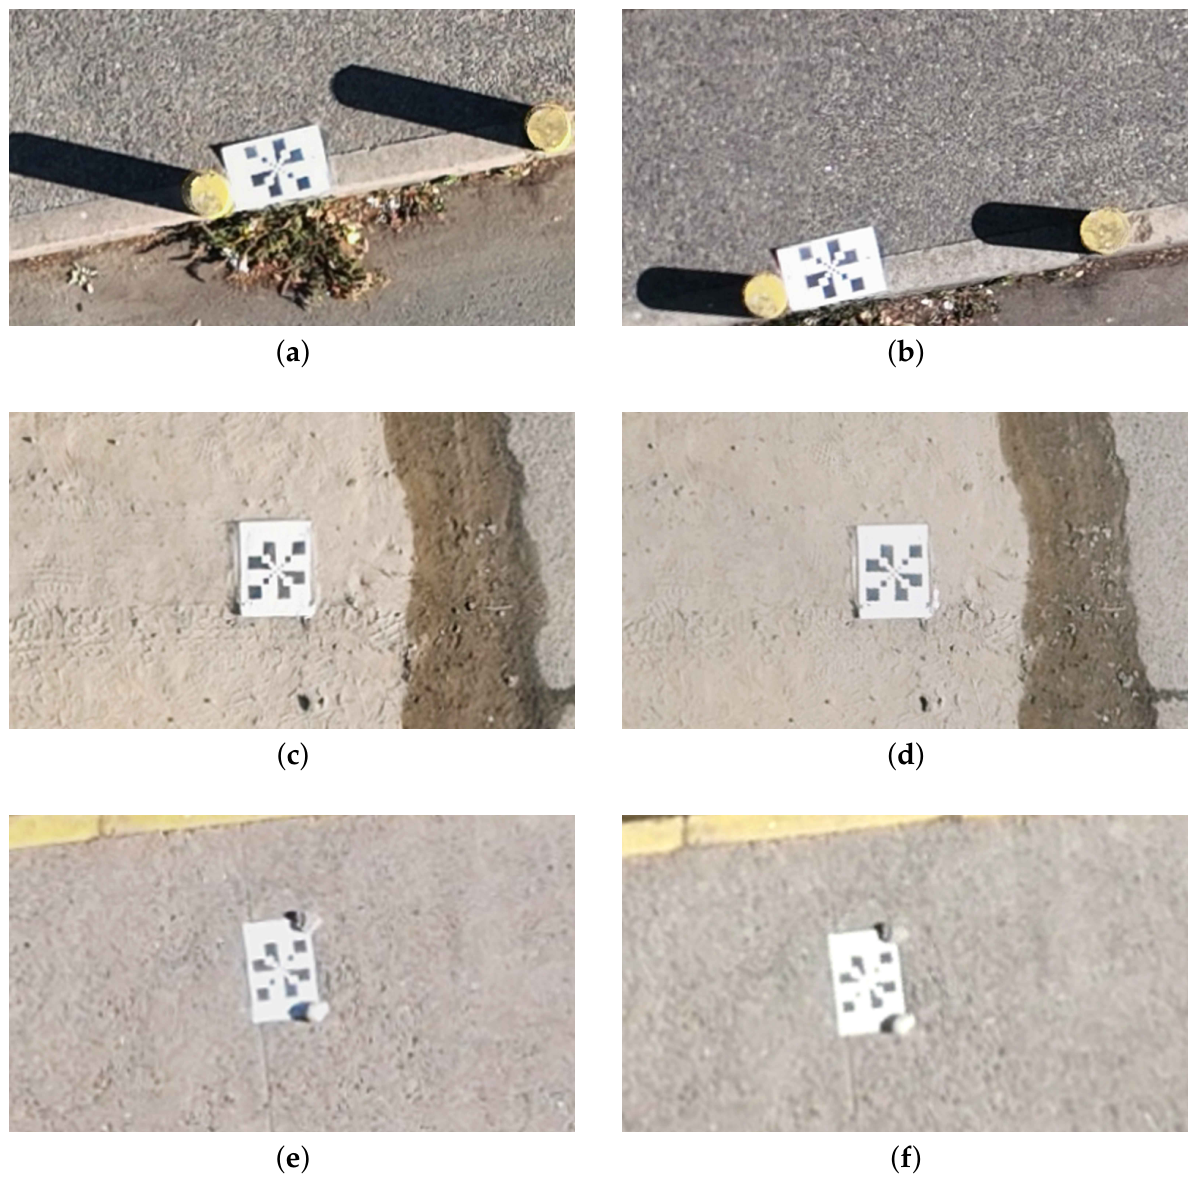
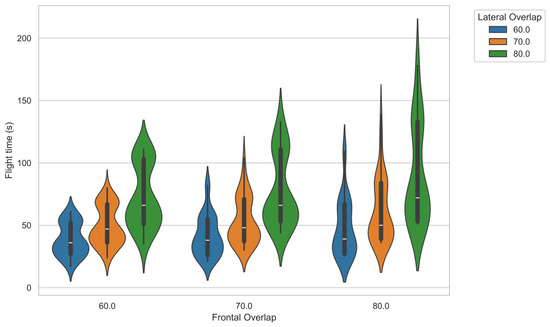
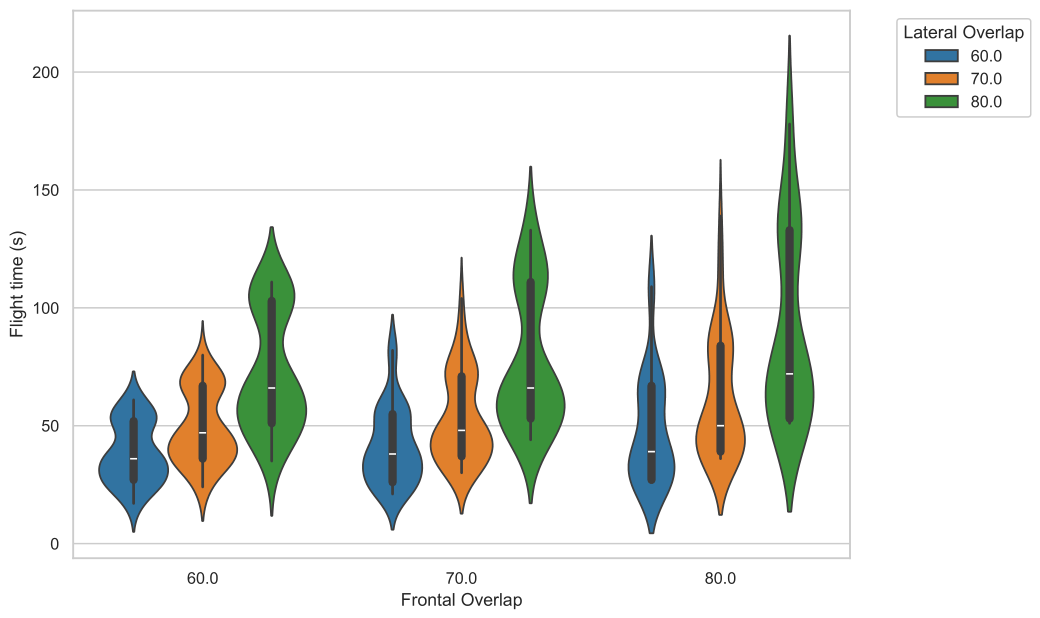
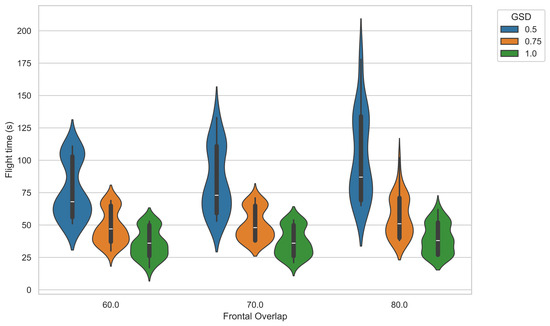
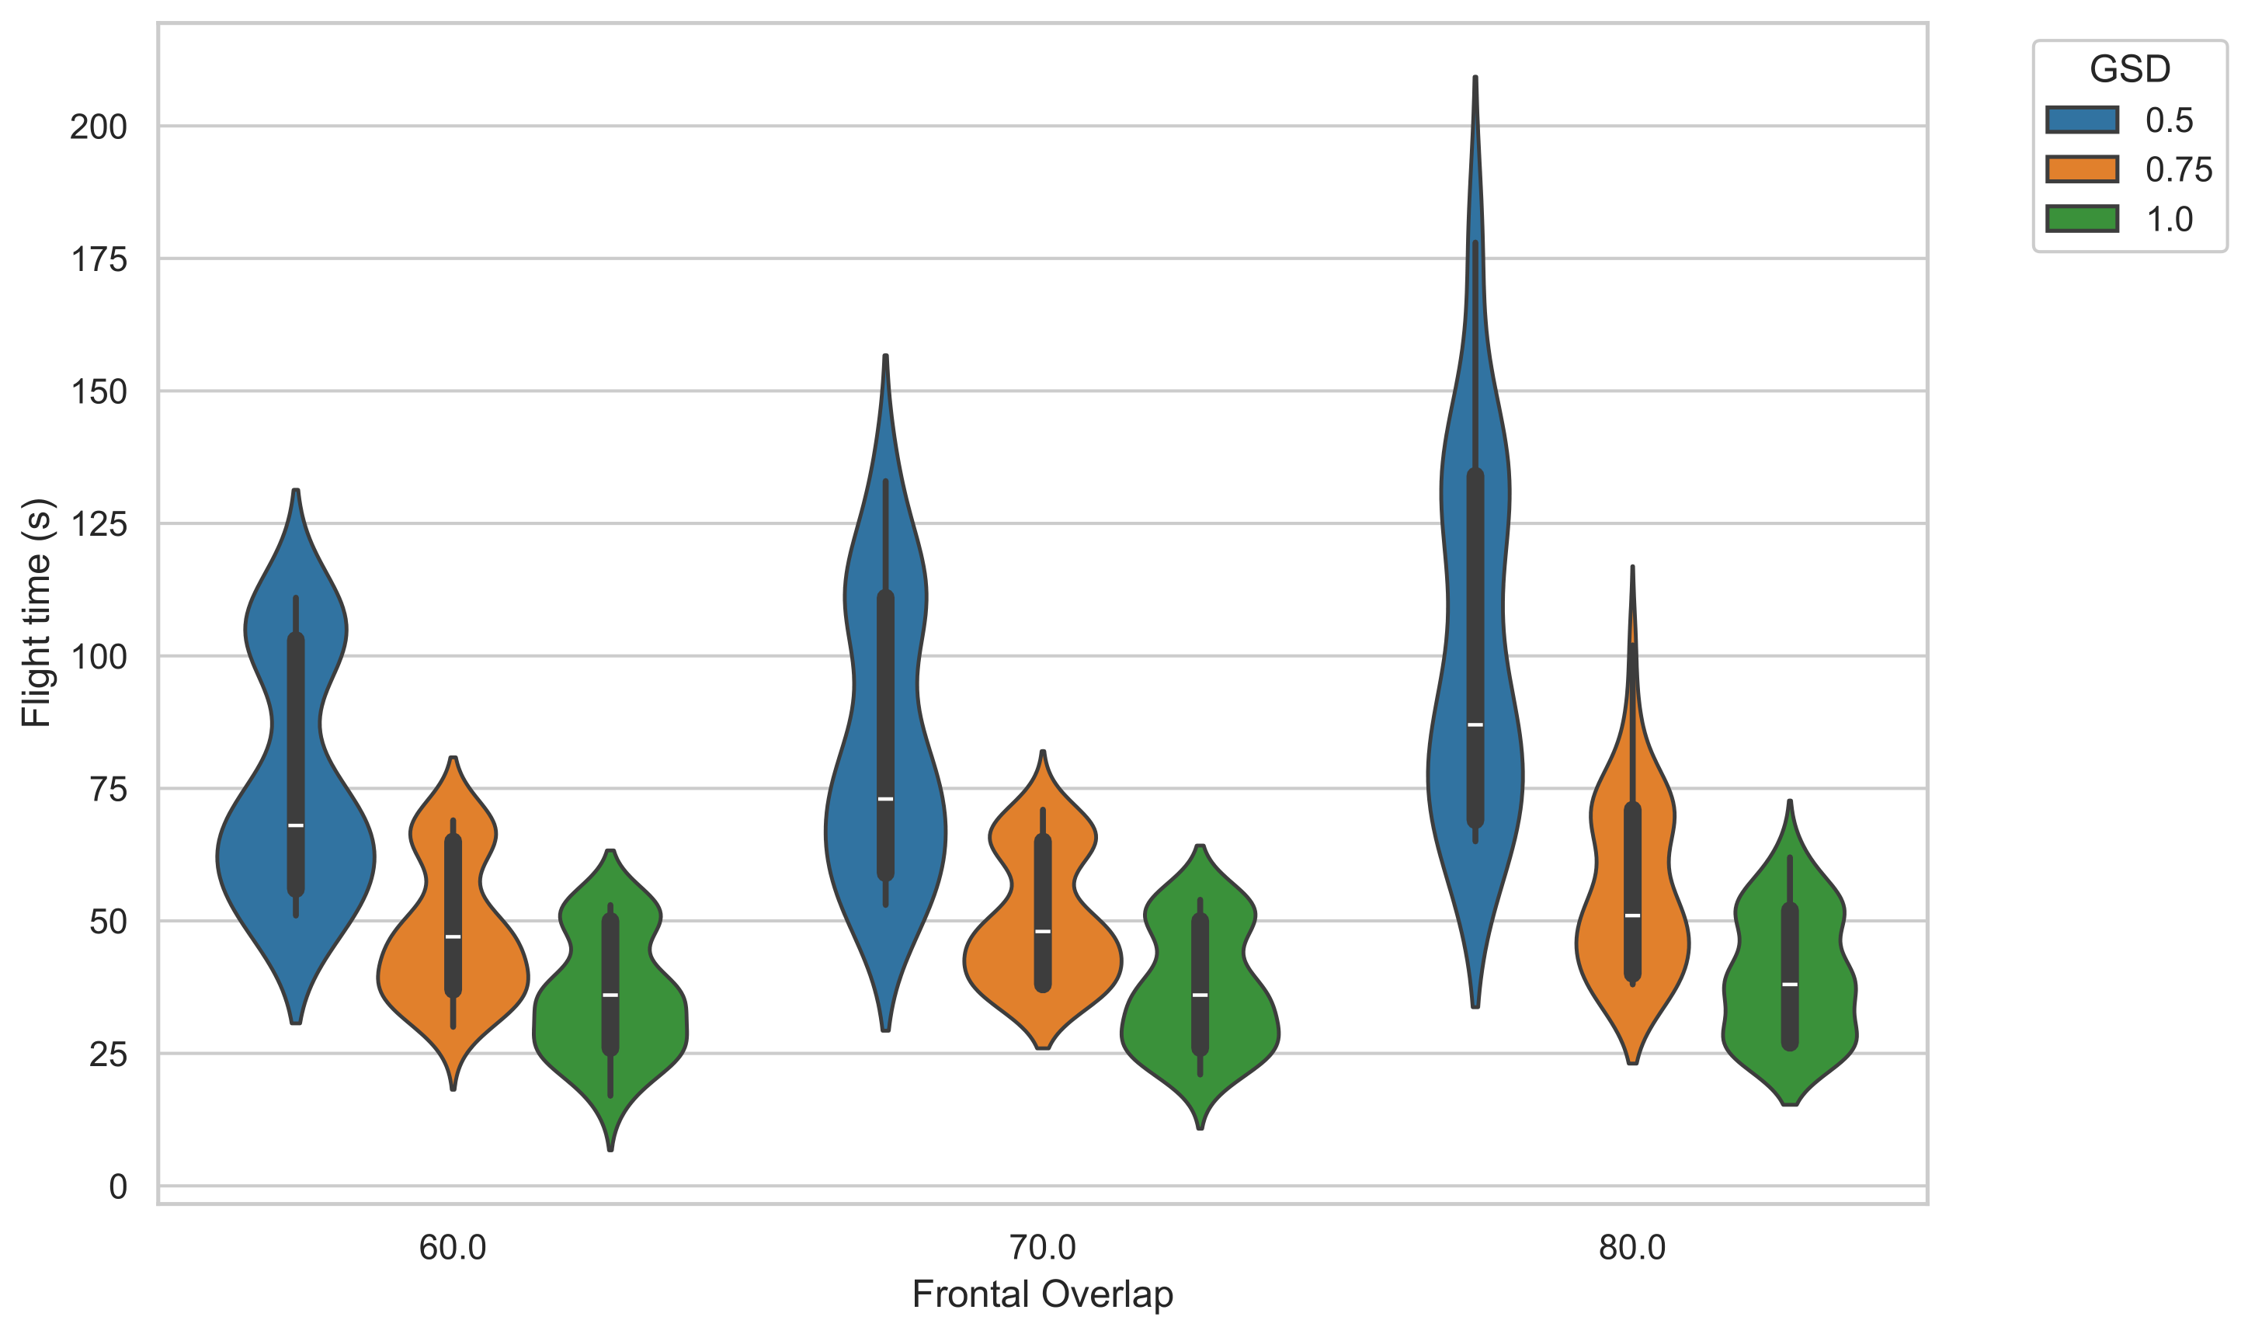
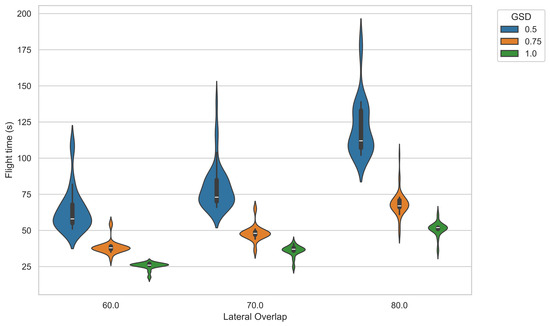
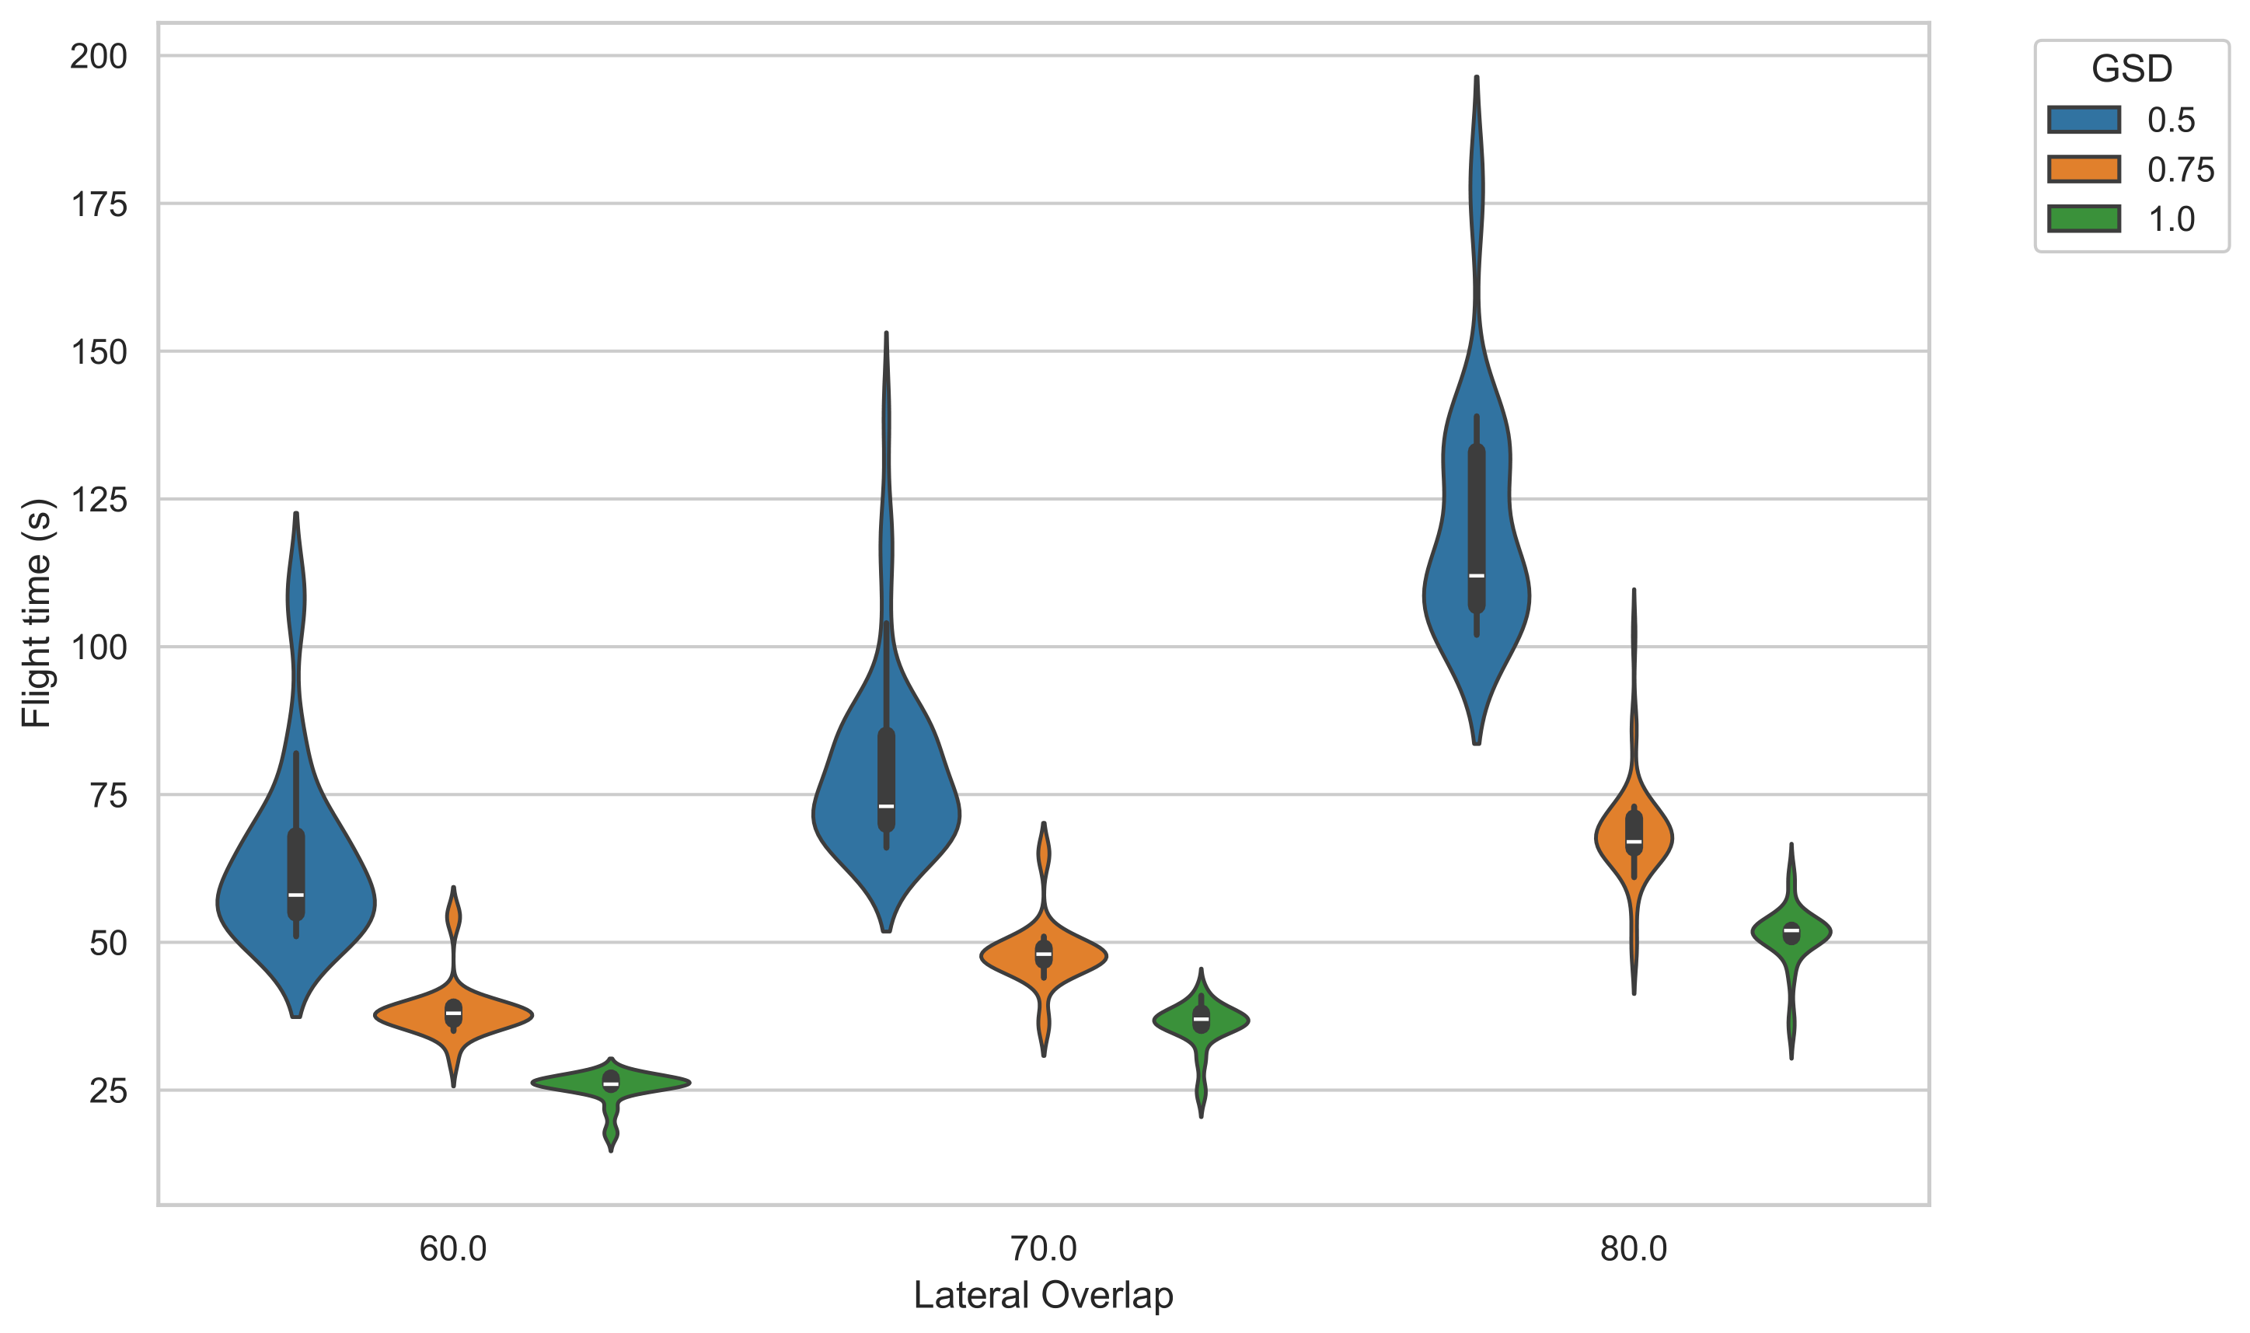
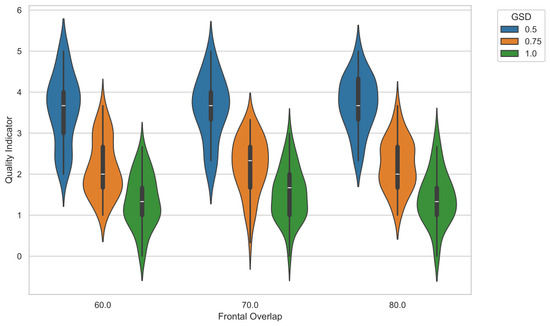
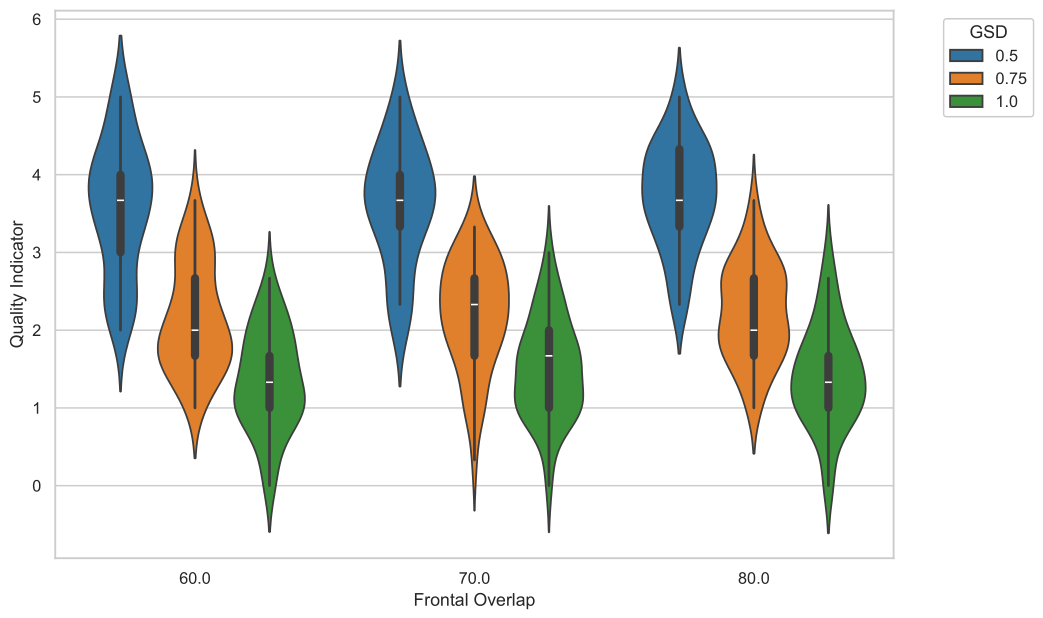
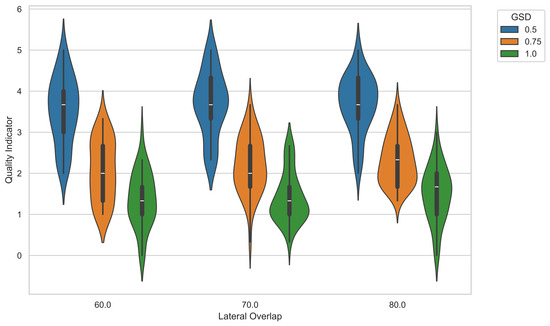
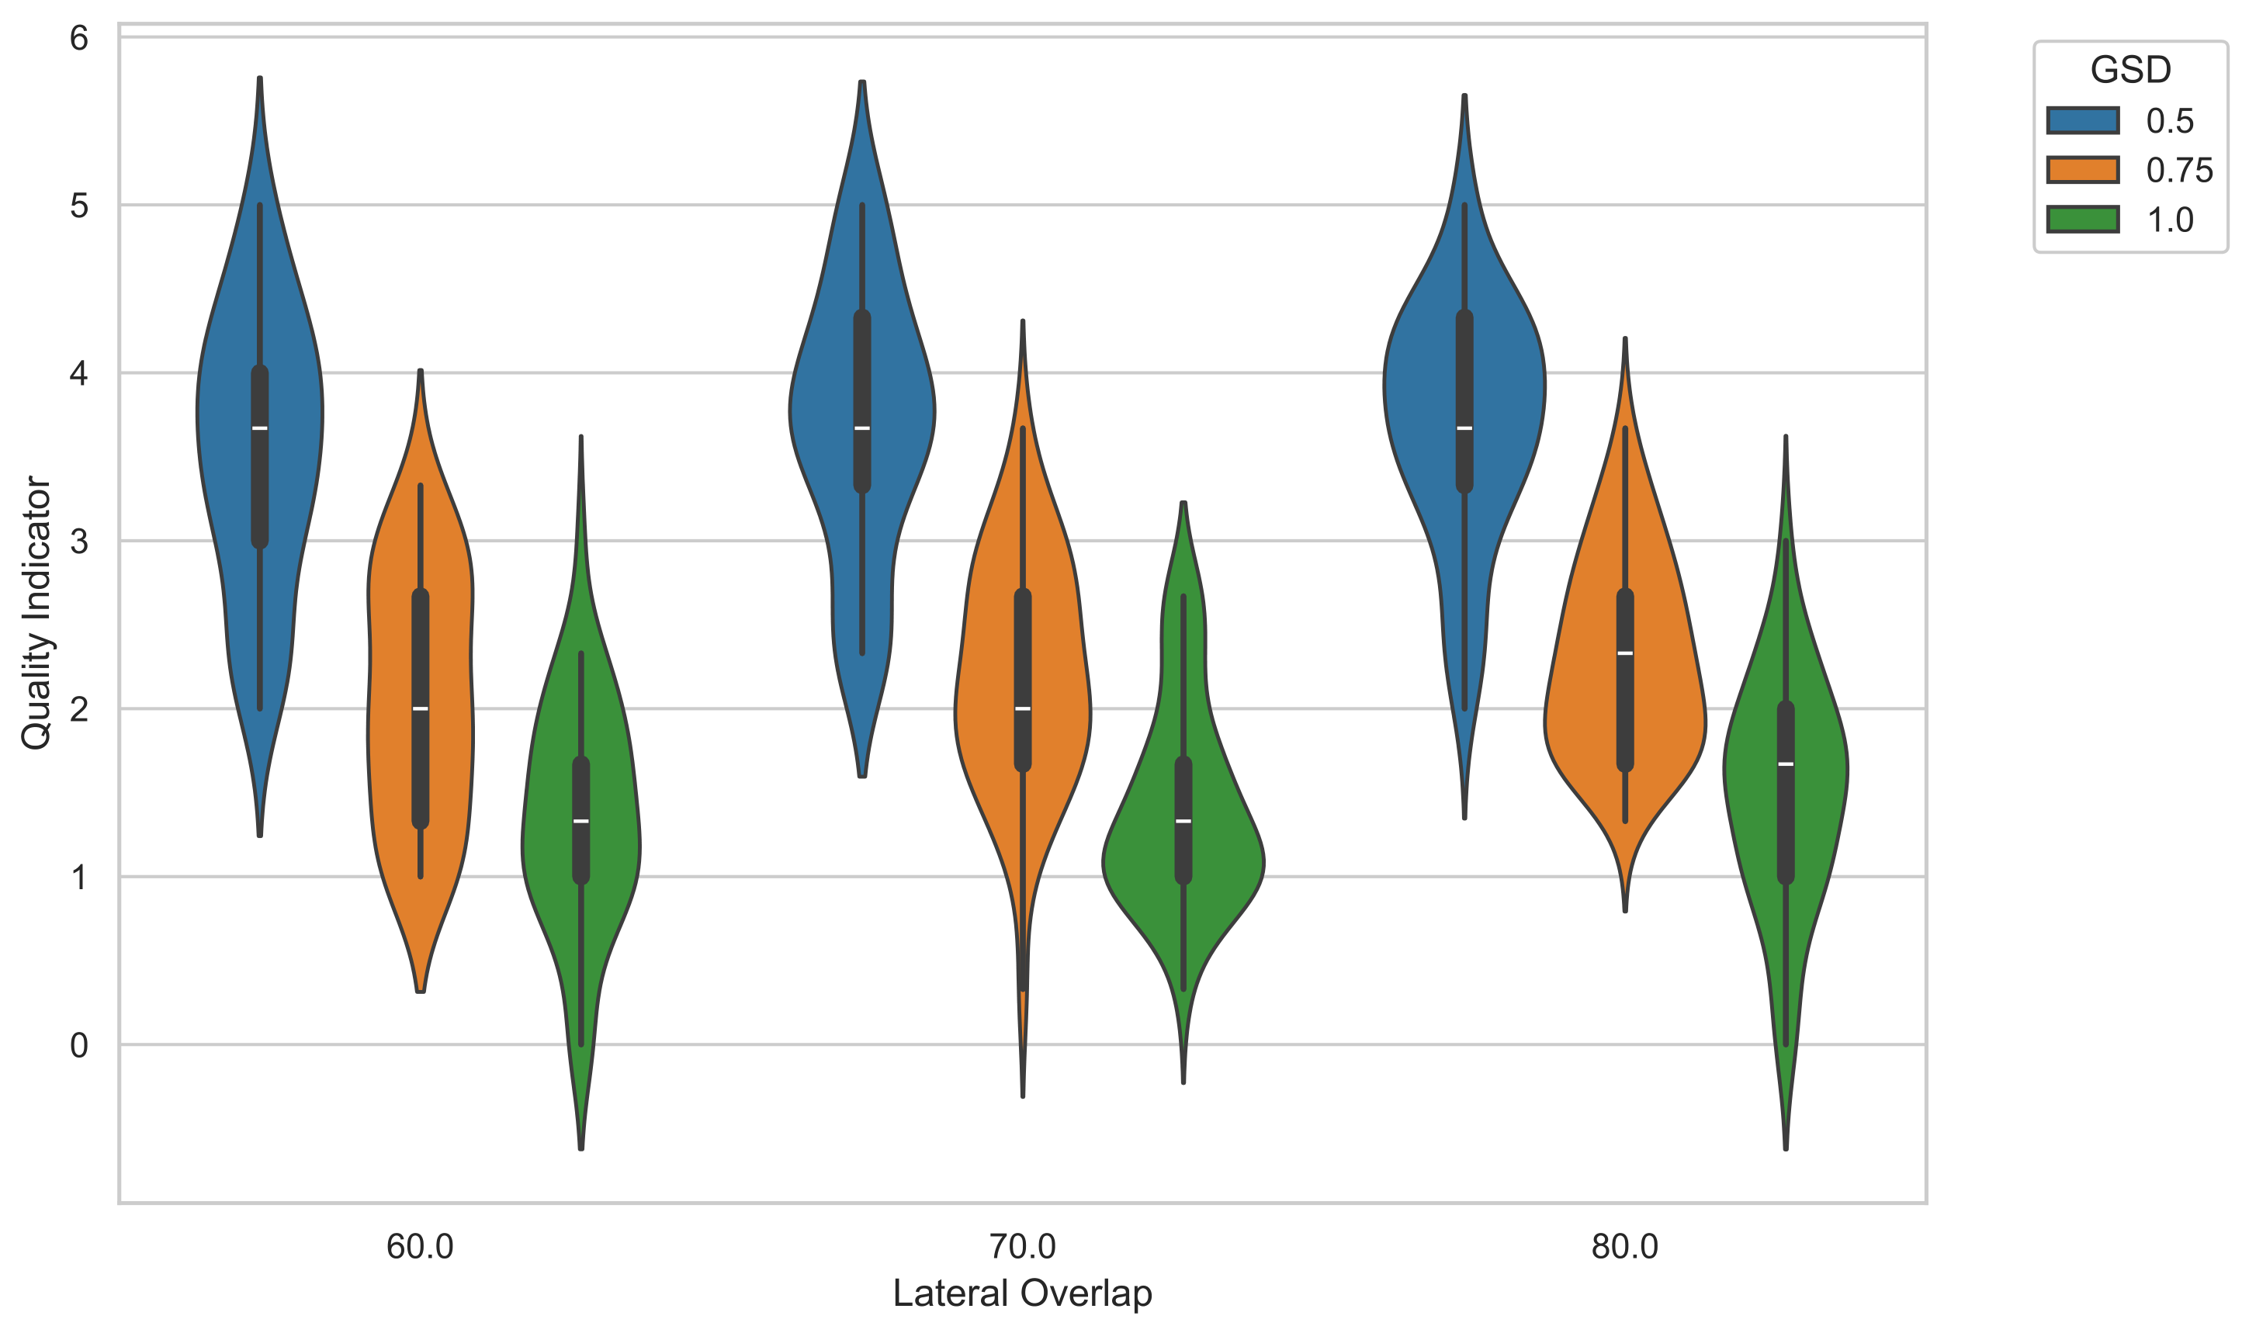
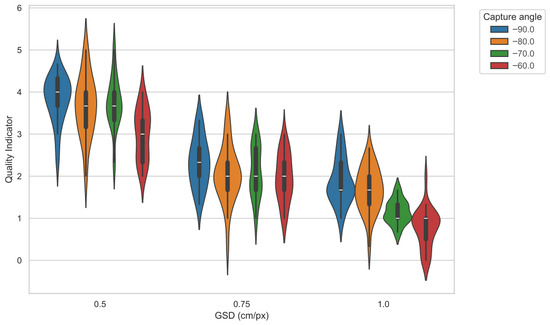
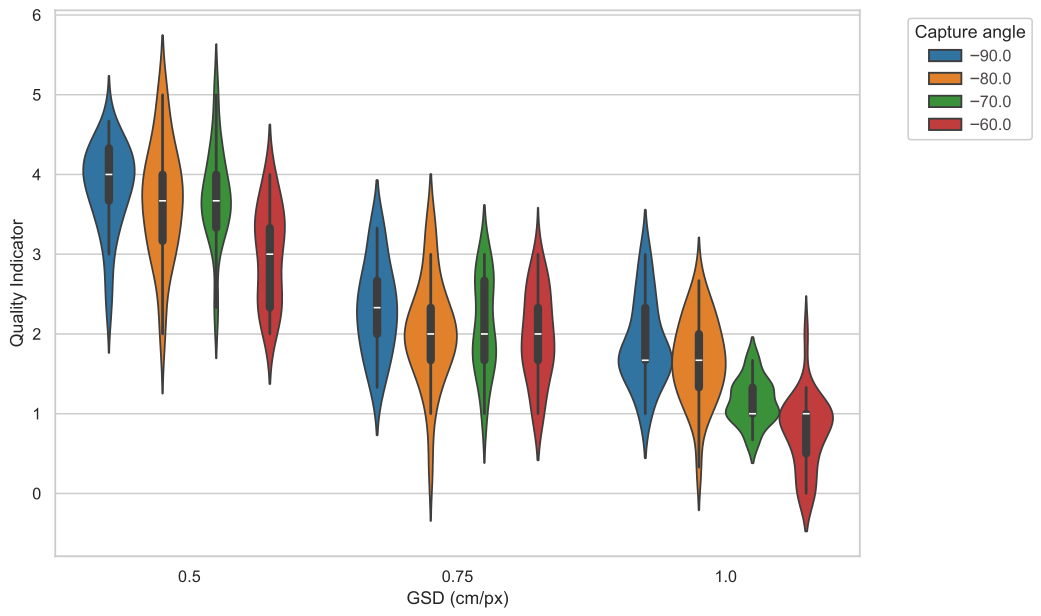
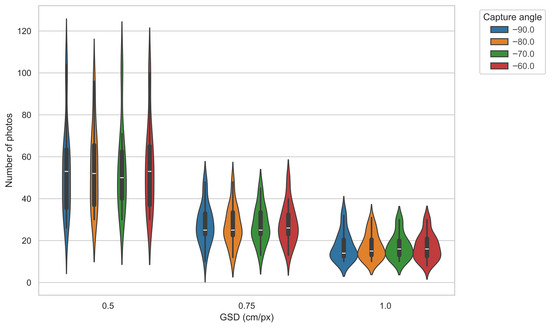
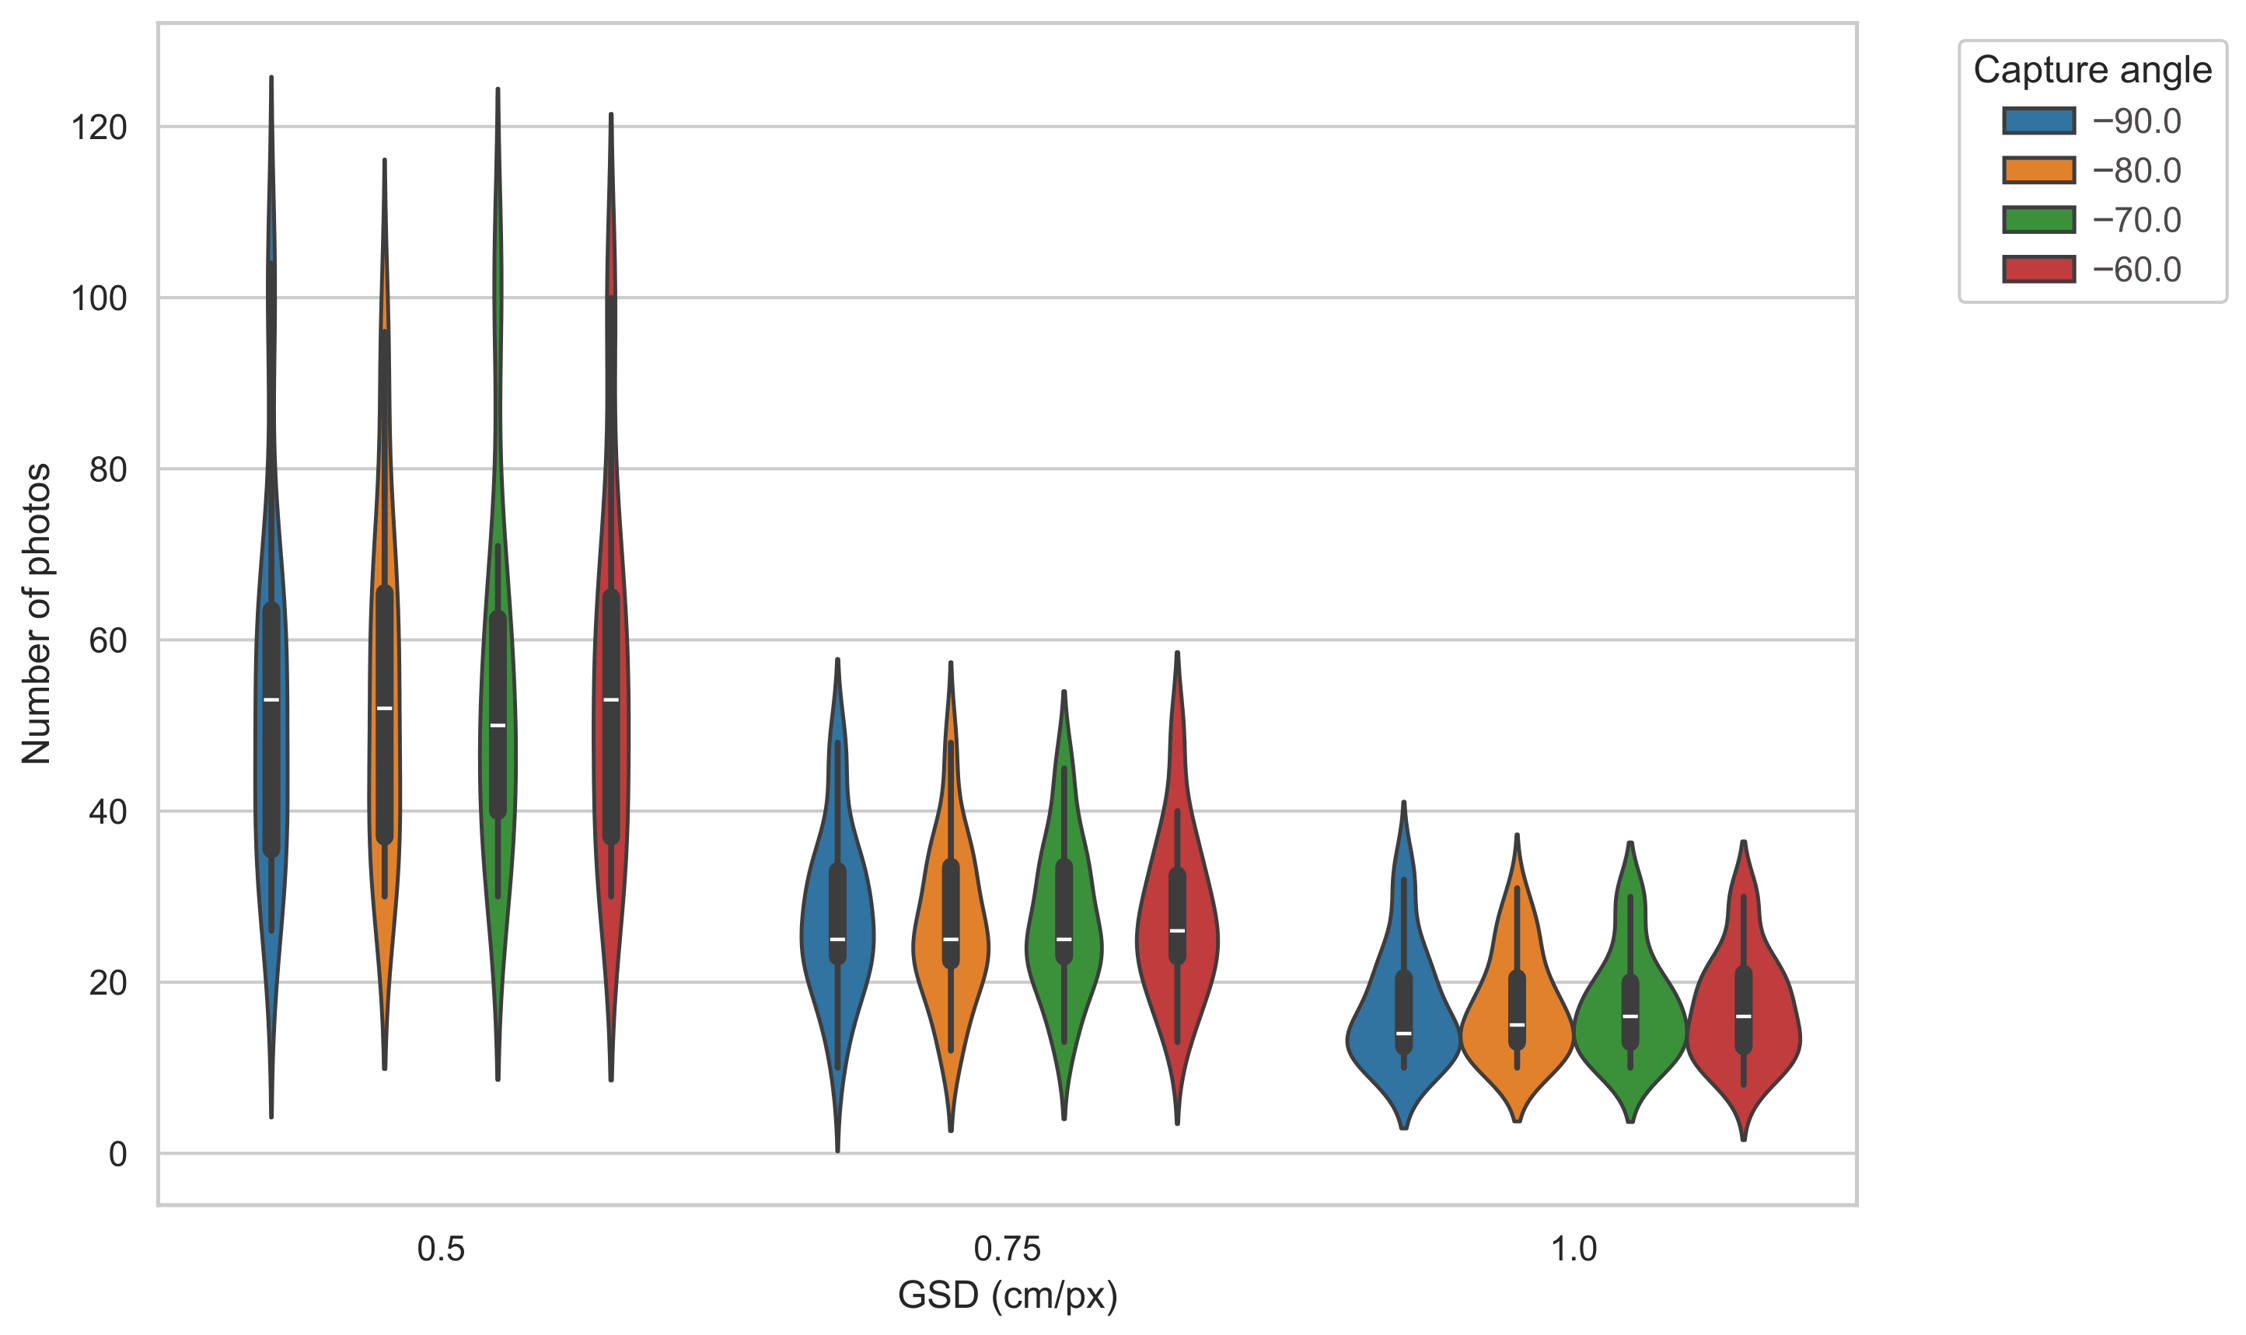

Disclaimer/Publisher’s Note: The statements, opinions and data contained in all publications are solely those of the individual author(s) and contributor(s) and not of MDPI and/or the editor(s). MDPI and/or the editor(s) disclaim responsibility for any injury to people or property resulting from any ideas, methods, instructions or products referred to in the content. |
© 2026 by the authors. Licensee MDPI, Basel, Switzerland. This article is an open access article distributed under the terms and conditions of the Creative Commons Attribution (CC BY) license.