


Highlights
What are the main findings?
- For the quadrotor drone with a vertically offset rear-rotor configuration, the overall power loading coefficient reaches its maximum at a vertical spacing ratio (H/R) of 1, where the rear rotor’s thrust is substantially recovered. In contrast, the front rotor’s performance loss is effectively controlled.
- Vertical rotor spacing (H/R) significantly modulates aerodynamic interference: strong vortex-propeller interaction (VPI) and entangled tip vortices occur at H/R < 0.83, while the wake of the front rotor and the rear rotor’s vortex system are nearly decoupled at H/R ≥ 1.31, accompanied by reduced turbulent kinetic energy (TKE) in the interference region.
What are the implications of the main finding?
- The identified optimal vertical spacing ratio (H/R = 1) provides direct theoretical guidance and practical design criteria for improving the aerodynamic efficiency of compact multi-rotor drones.
- Reduced TKE induced by the vertically offset configuration mitigates periodic rotor loading fluctuations, which helps enhance the structural integrity of the drone and reduce maintenance requirements.
Abstract
The deployment of multi-rotor drones in applications such as package delivery and urban air mobility is increasingly prevalent. Aerodynamic interference between rotors in traditional quadrotor drones impairs performance, and vertical offset is a promising solution to mitigate this interference. This study systematically investigates the aerodynamic characteristics of a quadrotor drone with a vertically offset rear-rotor configuration through computational fluid dynamics (CFD) simulations. By varying the vertical spacing ratio between the front and rear rotors (H/R), quantitative analyses were conducted of key performance metrics, including rotor thrust and power loading, with explanations provided from the perspective of the flow field structure. Furthermore, the underlying physical mechanisms influencing the observed performance variations are explored. The results indicate that, under the operating conditions investigated in this study, which include a single rotor RPM, a 10° inflow angle, and a specific forward-flight speed, the vertically offset configuration demonstrates superior aerodynamic performance at H/R = 1. At this spacing ratio, the rear rotor disk avoids most of the downwash-induced velocity generated by the front rotor, allowing partial recovery of the effective angle of attack. Consequently, vortex-propeller interaction (PVI) is significantly weakened, turbulent kinetic energy (TKE) levels in the interference region are reduced, and premature flow separation on the rear rotor blades is suppressed. These combined effects enhance overall aerodynamic efficiency. This study clarifies the role of vertical rotor spacing in regulating aerodynamic interference in multi-rotor drones, offering valuable insights for the aerodynamic design of compact rotorcraft.
1. Introduction
With the rapid expansion of multi-rotor aircraft, these platforms are increasingly employed in express delivery, large-area search missions, earthquake relief, and other operational scenarios. In parallel, multi-rotor aircraft with vertical takeoff and landing (VTOL) capabilities are regarded as a promising solution for alleviating congestion in future urban air transportation systems. Under such application scenarios, hover and low-speed forward flight conditions are of particular importance, especially during takeoff, landing, and near-ground operations. Consequently, this makes the research on their flight performance an attractive research field [1,2]. To satisfy maneuverability and accessibility requirements in confined environments, multi-rotor drones are often designed with compact rotor layouts. However, close rotor proximity inevitably intensifies aerodynamic interference, leading to pronounced variations in rotor aerodynamic performance. Given that high-energy-density batteries remain under active development [3], flight efficiency is crucial to extending flight endurance. One commonly adopted approach to reduce the footprint of multi-rotor systems is the use of coaxial rotor configurations [4,5,6]. Nevertheless, because the downwash generated by the upper rotor directly impinges on the lower rotor [7], substantial thrust degradation can occur. Previous studies have reported that the thrust loss of the lower rotor may reach up to 30% [8], depending on design parameters and flight conditions. These limitations highlight the necessity of optimizing aerodynamic configurations for multi-rotor drones.
An alternative compact arrangement is the coplanar configuration, in which multiple propellers are mounted within the same plane with limited horizontal spacing. Prior research has shown that when the hub spacing exceeds approximately 1.1 times the rotor diameter, hover performance losses are negligible [9]. However, in low-speed forward flight, significant efficiency degradation—on the order of 11–18%—has been observed when the spacing ratio satisfies d/D < 3, primarily due to adverse rotor–rotor interactions affecting downstream rotors [10]. For conventional square quadrotor layouts, modifying the flight configuration has also been shown to mitigate performance losses in forward flight [11]. Barcelos et al. [12] employed potential flow theory to investigate aerodynamic interactions in quadrotor configurations and reported that diamond layouts achieve up to 3.5% higher rotor efficiency and exhibit reduced pitch-up tendencies compared with square layouts. Misiorowski et al. [13] conducted detached eddy simulations (DES) to examine the aerodynamic behavior of quadrotors in forward flight for both ‘X’ and ‘+’ configurations. Herz et al. [14] further explored asymmetric performance induced by different rotor rotation directions. Additionally, Chae et al. [15] investigated rotor–rotor interactions in twin-rotor systems under axial descent conditions and analyzed the aerodynamic effects associated with vortex ring state (VRS) on multirotor drones.
To balance vertical takeoff and landing (VTOL) capability and efficient cruise flight, one solution is to adopt a convertible quadrotor configuration. Durán-Delfin et al. [16] developed a convertible aircraft capable of performing both VTOL and cruise flight, and they designed a Passivity-Based Control (PBC) strategy to cover the full flight envelope of the aircraft. Osman et al. [17] conducted a comprehensive analysis of hybrid VTOL aircraft systems, with special attention paid to the unique capabilities of tilt-rotor, tilt-wing, and dual systems across multiple sectors—including agriculture, surveying, and cargo transportation.
Numerous existing studies have indicated that during forward flight, the front rotor of a quadrotor drone adversely affects the rear rotor [18,19]. Therefore, building upon the conventional coplanar quadrotor configuration, this paper examines a vertically offset rotor layout—where some rotors are displaced from the common plane—as an alternative approach to mitigate aerodynamic interference. By introducing vertical spacing between the rotors, this layout aims to weaken wake-impingement effects and enhance overall propulsive efficiency. This configuration combines the advantages of the planar quadrotor configuration, avoids the significant thrust loss of the lower rotor in coaxial configurations, and simultaneously mitigates the aerodynamic interference of the front rotor wake on the rear rotor’s flow field inherent in the planar quadrotor configuration. Theoretically, it can further enhance the overall performance of the aircraft. Starting from square and diamond quadrotor configurations, Kostek et al. [20] analyzed the aerodynamic efficiency of two layouts with a vertical spacing of 0.38 times the rotor diameter. Their results showed that the square configuration yielded better gains compared to the diamond arrangement. In contrast, the present study focuses more closely on validating the influence of the vertical spacing ratio on aerodynamic performance, leveraging the advantages of flow-visualization techniques based on computational fluid dynamics (CFD). Specifically, this research emphasizes correlating flow-field characteristics with rotor power loading and overall aerodynamic performance.
It is worth noting that the wake interference exerted on the rear rotor of the elevated configuration mentioned in this paper is physically distinct from that on the lower rotor of a coaxial twin-rotor configuration. For coaxial twin-rotors, the lower rotor is situated in the downwash of the upper rotor, which directly reduces the angle of attack of the lower rotor, thus decreasing its thrust. However, for the planar quadrotor layout, the interference on the rear rotor mainly stems from the disruption of the bound vortex structures on the rear rotor blades by the wake vortices of the forward rotor. Therefore, it is reasonable to consider the wake interference of the forward rotor on the rear rotor from the perspective of the turbulent kinetic energy at the rear rotor disk. The vertically lifted configuration investigated in this study enables the rear rotors to avoid the wake vortices of the front rotors, which, in principle, allows the rear rotors to achieve superior aerodynamic performance and more stable aerodynamic loads. At present, an overwhelming majority of quadrotor drones adopt a planar configuration, whereas this study aims to remedy the aerodynamic drawbacks of the planar configuration by modifying the rotor configuration. Through this research, we aim to explore the relationship between performance trends and flow mechanisms, investigate the evolution of the vortex system under different vertical offsets, and evaluate overall performance metrics such as thrust and efficiency, to address the research gap in the field of wake interference mitigation for planar quadrotors under static configurations. Specifically, we anticipate that vertical offset can reduce the rear rotor thrust fluctuation by 15% and improve the overall aerodynamic efficiency by 5%, thereby providing an engineering-feasible solution for the fatigue life extension and endurance enhancement of quadrotors. Compared with previous studies, this research mainly aims to explore the flow field structure changes caused by the vertical offset distance and analyze the specific physical reasons for the variations in thrust, power, and power load.
2. Theoretical Analysis
The symbols used in the theoretical analysis are summarized in Table 1.
Table 1.
Nomenclature and definitions.
2.1. Research Model
The present study investigates a quadrotor drone featuring a vertically offset rear-rotor configuration. In conventional multi-rotor aircraft, rotor spacing is often constrained to achieve a compact airframe layout, while sufficiently large rotor disk areas are required to generate the necessary lift. As a result, adjacent rotors are placed in close proximity, making aerodynamic interference between rotor wakes unavoidable.
In traditional coaxial quadrotor configurations, the blade tip vortex wake generated by the front rotor continuously impinges on the disk of the rear rotor. This interaction alters the local inflow conditions of the rear rotor and leads to a significant degradation in its aerodynamic performance. To mitigate this adverse interaction, this study adopts a vertically offset configuration, where the rear rotor is elevated to a higher vertical position relative to the front rotor. The primary aim of this configuration is to reduce direct impingement of the front rotor’s wake while maintaining a compact planar layout, thereby achieving higher aerodynamic efficiency without increasing the horizontal footprint.
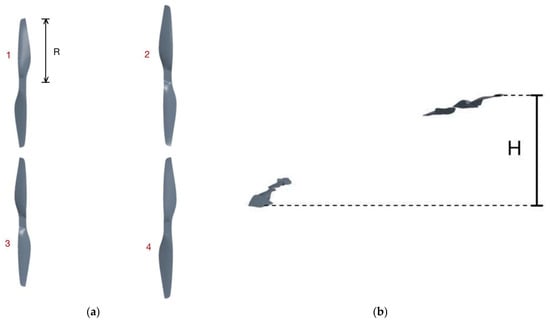
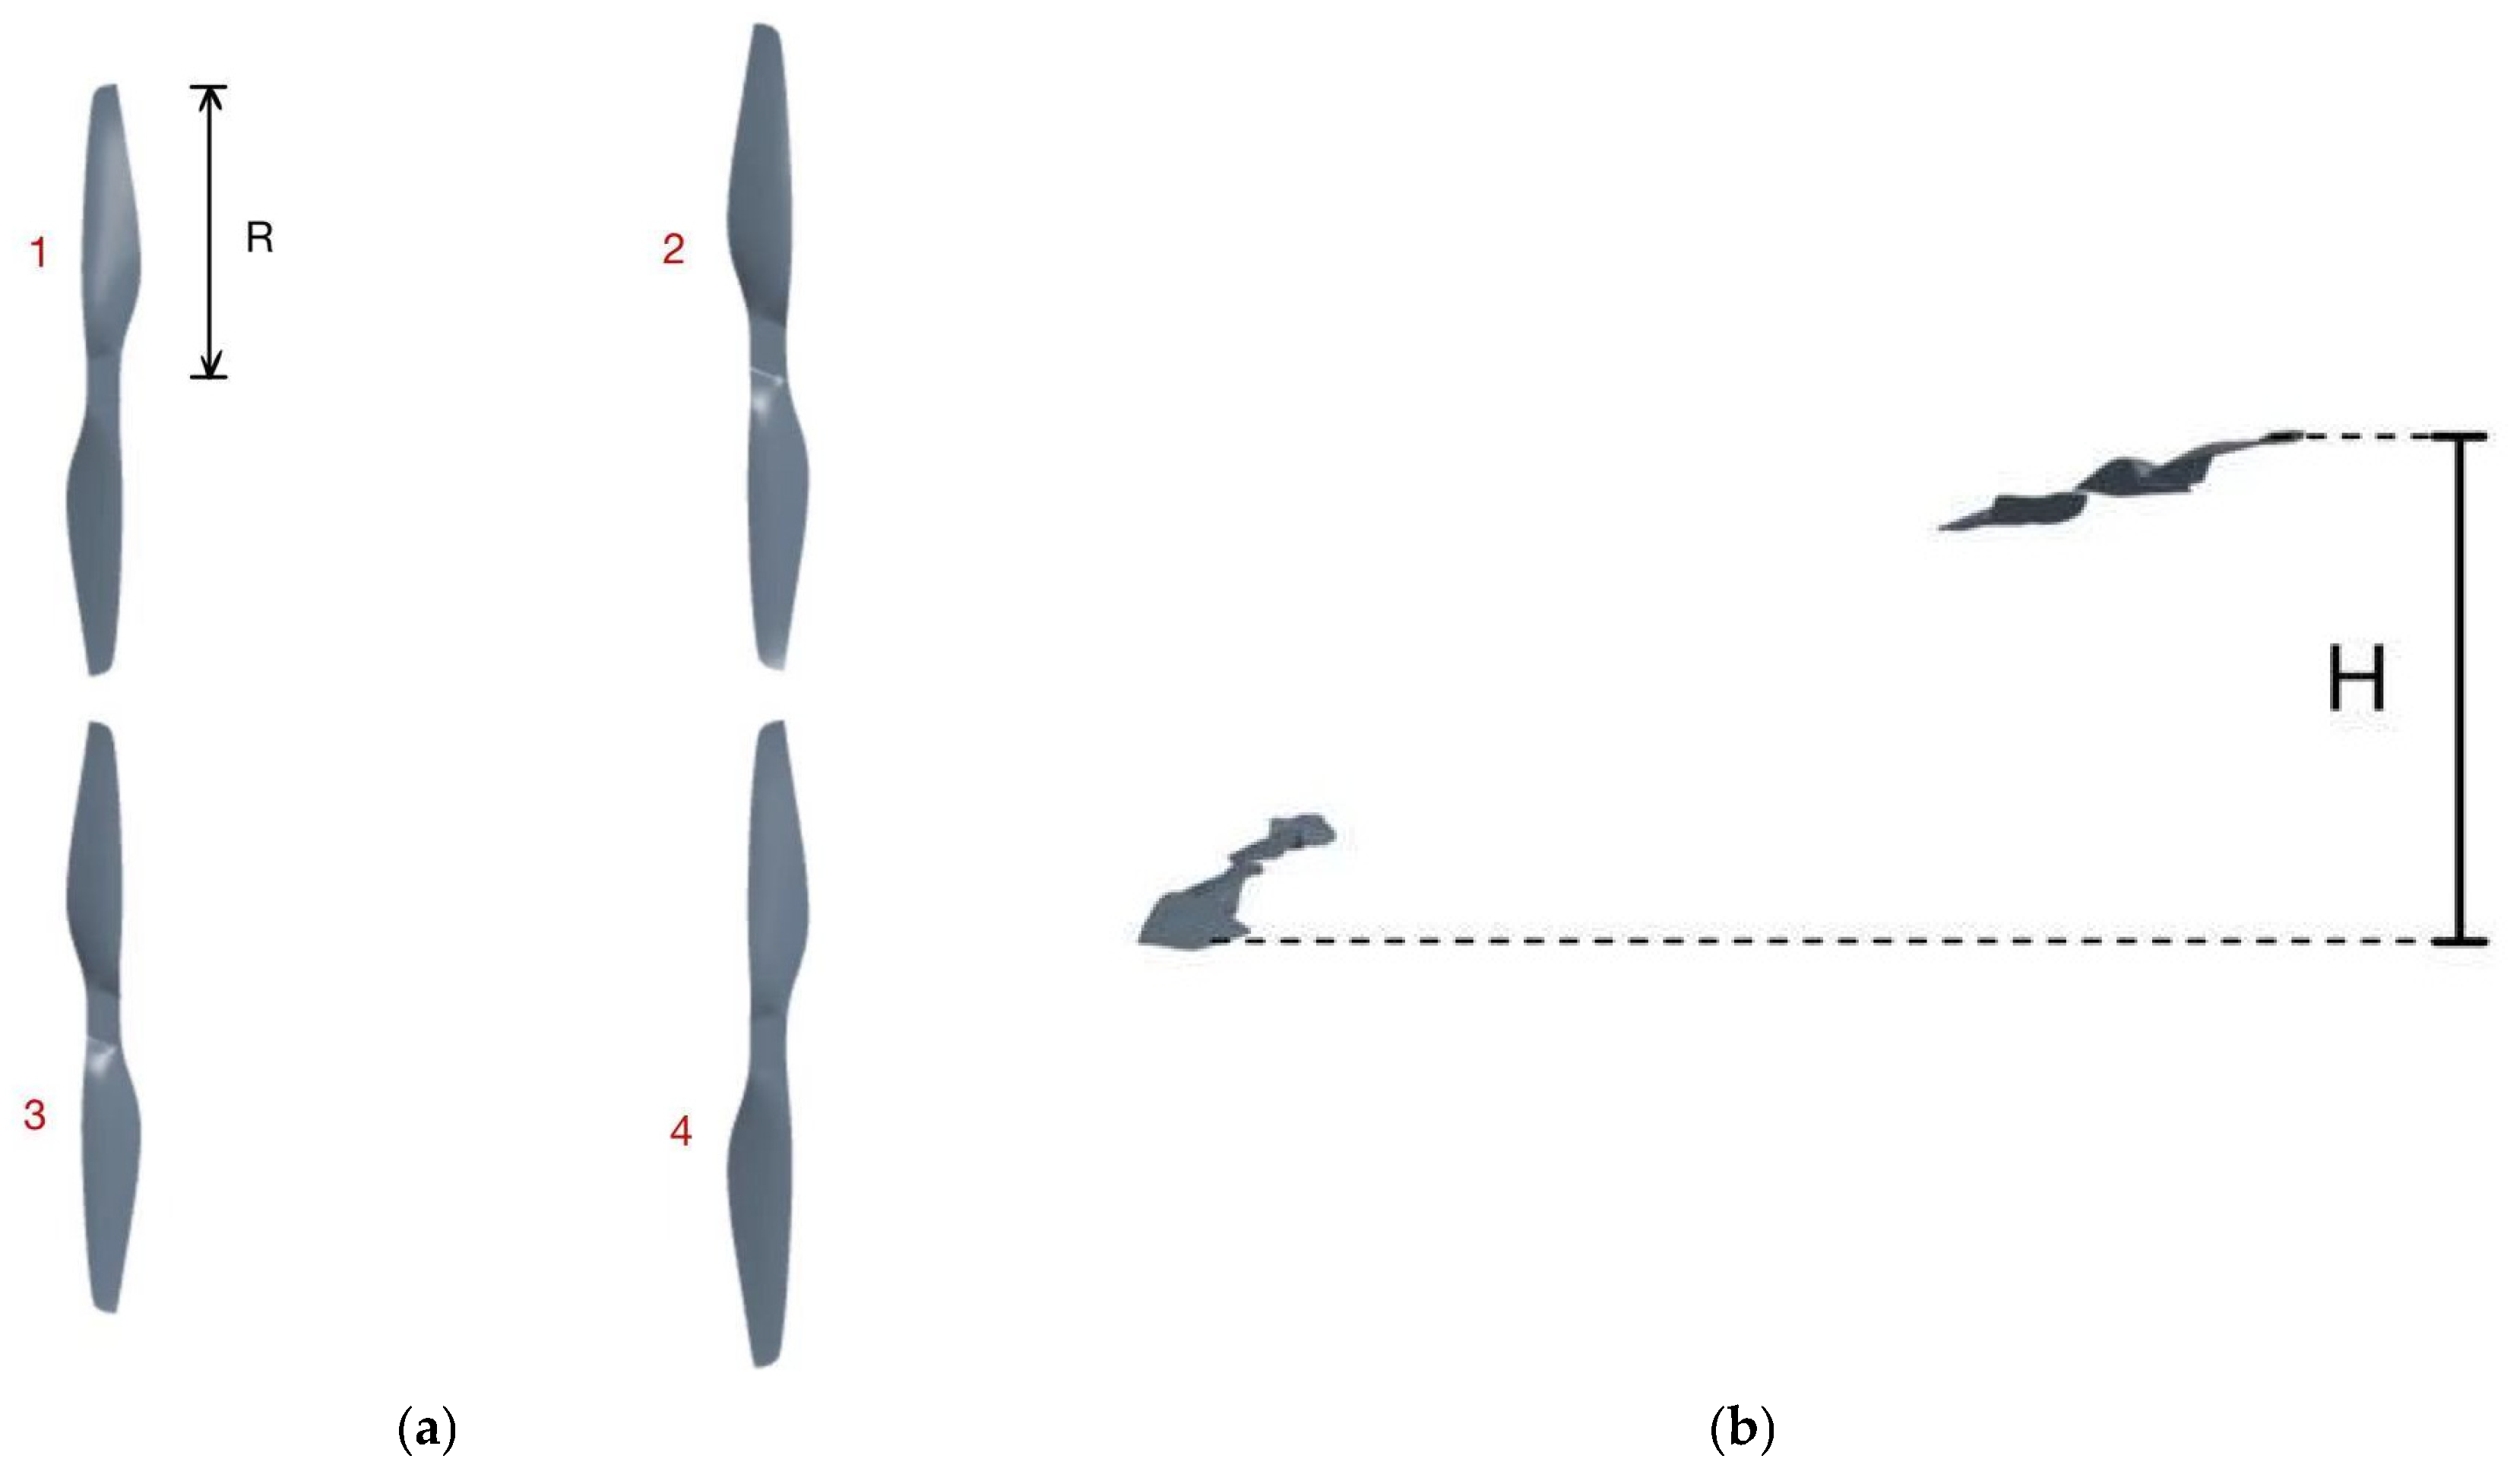
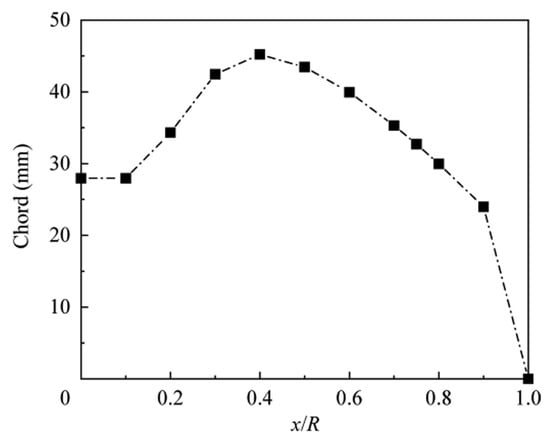
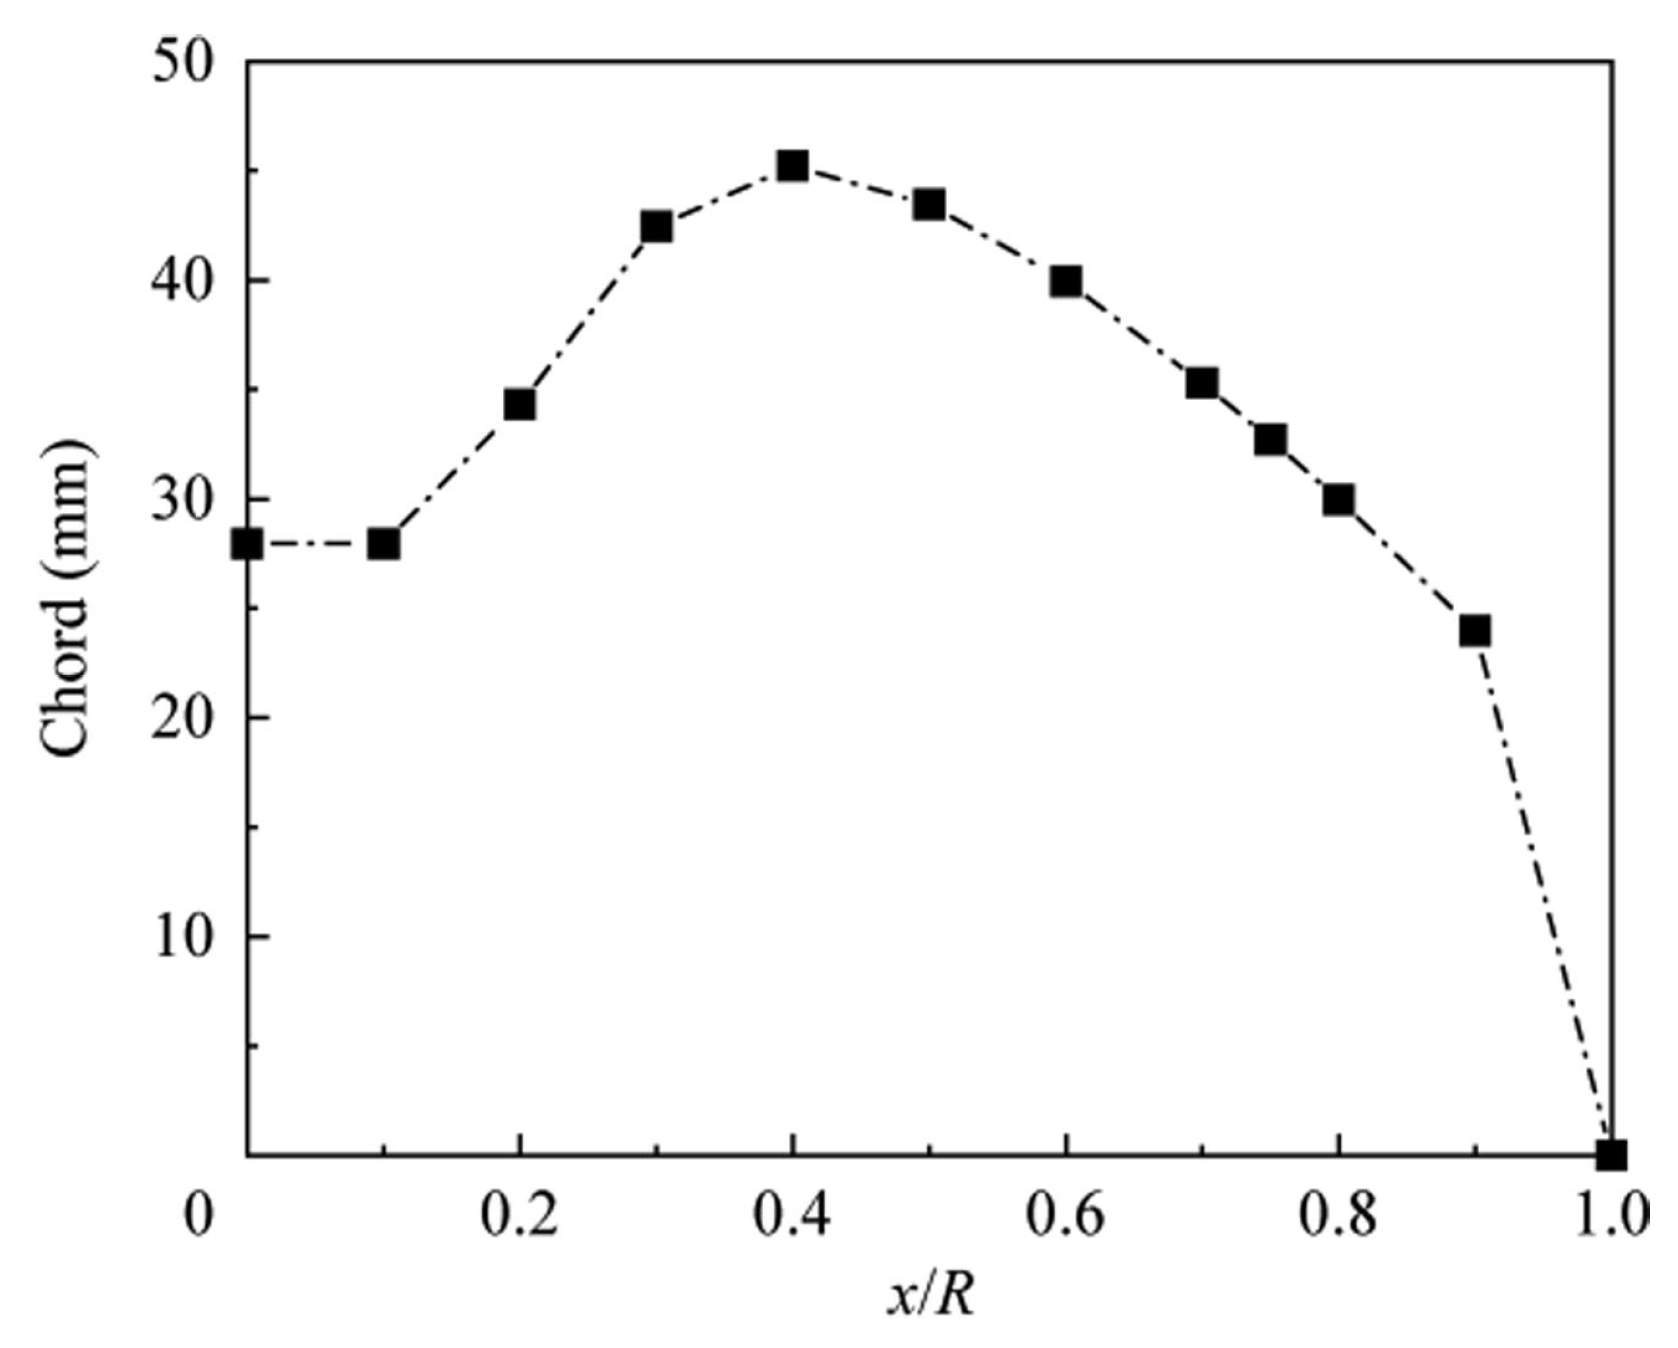
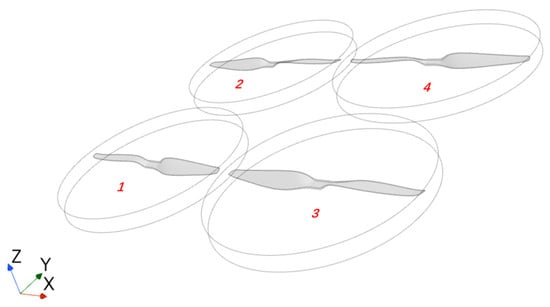
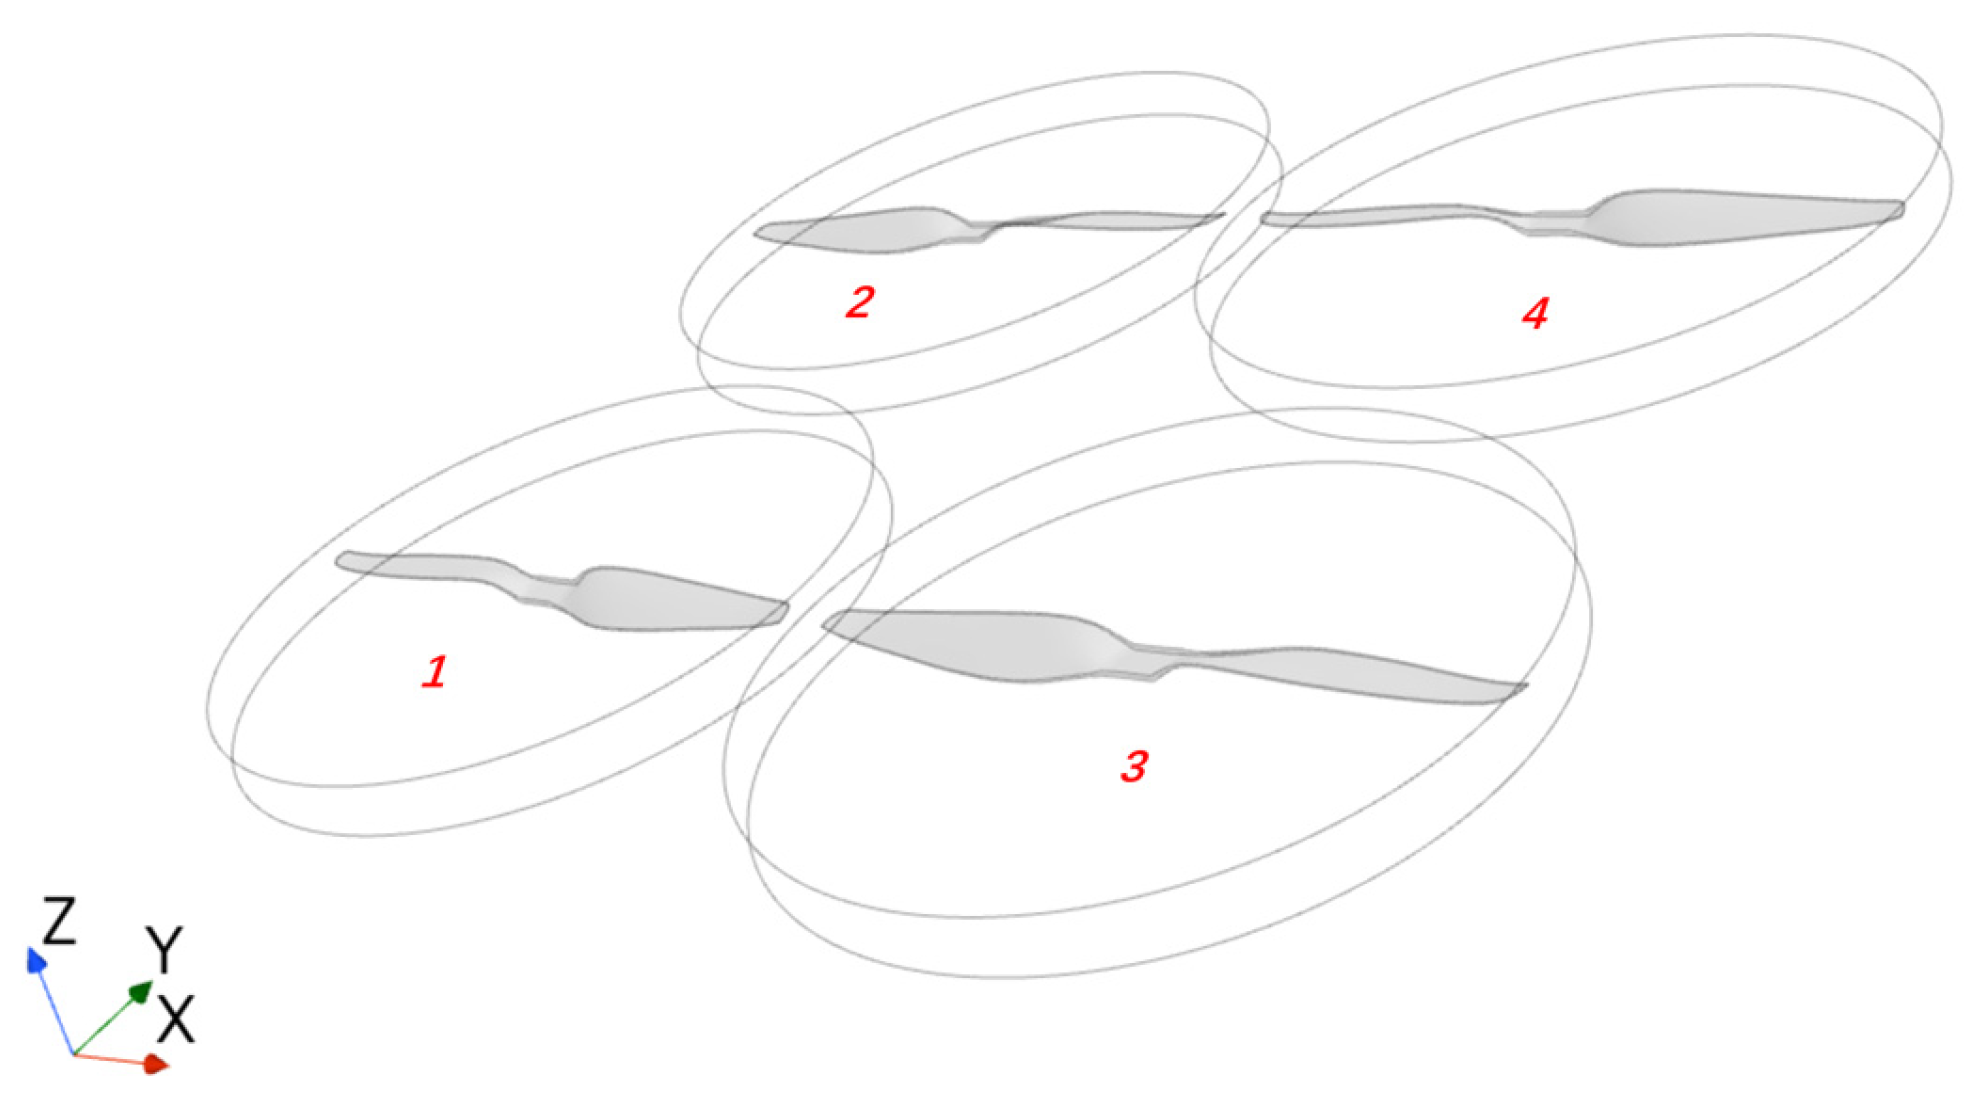
As illustrated in Figure 1, the simplified quadrotor model consists of four rotors. Rotors 1 and 3 are positioned at the front, while rotors 2 and 4 are located at the rear. Rotors 2 and 3 rotate clockwise (CW), whereas Rotors 1 and 4 rotate counterclockwise (CCW), ensuring torque balance. All rotors employ the T-MOTOR 1855 propeller with a diameter of 18 inches (radius R = 228.6 mm). The rotor parameters are shown in Table 2, and the chord length distribution along the radius is illustrated in Figure 2. The horizontal spacing between adjacent rotors is fixed at 250 mm, and the vertical elevation height of the rear rotors relative to the front rotors is denoted by H.
Figure 1.
Configuration of the vertically elevated rear-rotor quadcopter drone. (a) Top view. (b) Side view.
Table 2.
Parameter of a single rotor.
Figure 2.
Chord length distribution along the radius [21].
2.2. Geometric Definition of the Quadrotor Layout
Figure 3 illustrates the body coordinate system of the quadrotor with this configuration, where the four rotors are centrally symmetric about the coordinate origin. The 1st and 3rd rotors are located on the negative semi-axis of the Y-axis and serve as the front rotors; the 2nd and 4th rotors are situated on the positive semi-axis of the Y-axis and act as the rear rotors. The forward flight direction of the aircraft is along the negative semi-axis of the Y-axis, the positive direction of the X-axis corresponds to the left side of the aircraft, and the positive direction of the Z-axis points upward relative to the aircraft.
Figure 3.
Body Coordinate System.
During forward flight, the incoming flow direction of the gas is (0, cos10°, −sin10°), which corresponds to the flight state when the aircraft is tilted forward by 10°. Regarding the selection of the forward tilt angle in this study, most quadrotor drones can achieve a maximum forward tilt angle of more than 20° during forward flight, and some small-sized drones can even reach 30°. The choice of 10° is relatively conservative, as this angle is achievable by the vast majority of quadrotor drones.
2.3. Governing Equations and Turbulence Model
The vertically offset quadrotor configuration investigated in this study is primarily intended for operation under low-to-moderate Reynolds number conditions. The three-dimensional viscous flow of an ideal gas is governed by the Navier–Stokes (N–S) equations [22], which are expressed in integral form as follows:
In the above formulation, U denotes the vector of conservative variables, and ω represents the finite control volume bounded by the surfaces. The vector of convective fluxes, , is related to the convective transport of quantities in the fluid. is the vector of viscous fluxes, which contains the viscous stresses and the heat diffusion. Variation in the conservative variables depends solely on the flux across the boundary of the control volume since the integral formulation of the conservation law has no volume source. The components of the convective and diffusive (viscous) fluxes can be expressed in Cartesian coordinates as follows:
where F, G, and H are the convective flux vectors, and , and are the diffusive flux vectors.
The thermodynamic behavior of the fluid is described by the ideal gas equation of state:
We employed STAR-CCM+ (v18.02.008) to perform the numerical simulation and solution. In this paper, the SST k-omega turbulence model is adopted, which synergistically merges k-epsilon formulations applicable to free-stream regions with k-omega-based treatments tailored for near-wall boundaries [23]. This hybrid methodology incorporates the transport of turbulent shear stress via its modified definition of eddy viscosity. Classified as a low-Reynolds-number model, it retains resolution capabilities analogous to those of the baseline k-omega model while overcoming key limitations intrinsic to both the k-omega and k-epsilon frameworks—particularly in flow fields characterized by adverse pressure gradients. This study focuses on the steady-state interaction characteristics under the condition of steady forward flight. The steady Reynolds-Averaged Navier–Stokes (RANS) method enables efficient acquisition of average aerodynamic performance, making it well-suited for parametric analysis. Unsteady approaches (e.g., Large Eddy Simulation, LES) are associated with high computational resource requirements, while the time step size adopted in this study (1 × 10⁻⁴ s) is sufficient to capture the dynamic evolution of tip vortices. Thus, the steady RANS method demonstrates adequate applicability for the present research. Relevant studies [24] have indicated that the overall consistency between numerical results obtained via the RANS method and experimental data can be rated as satisfactory.
It is worth noting that this model has certain limitations. While it performs well in capturing large-scale flow features and flow separation, the SST model has inherent limitations in resolving small-scale turbulent flow problems compared with Direct Numerical Simulation (DNS) and LES approaches [25].
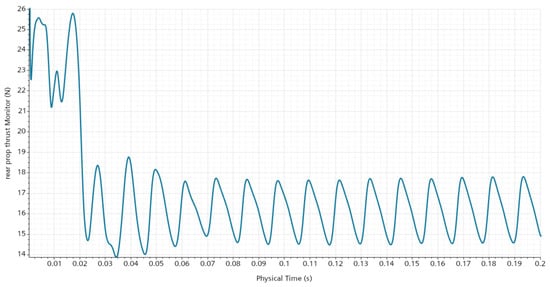
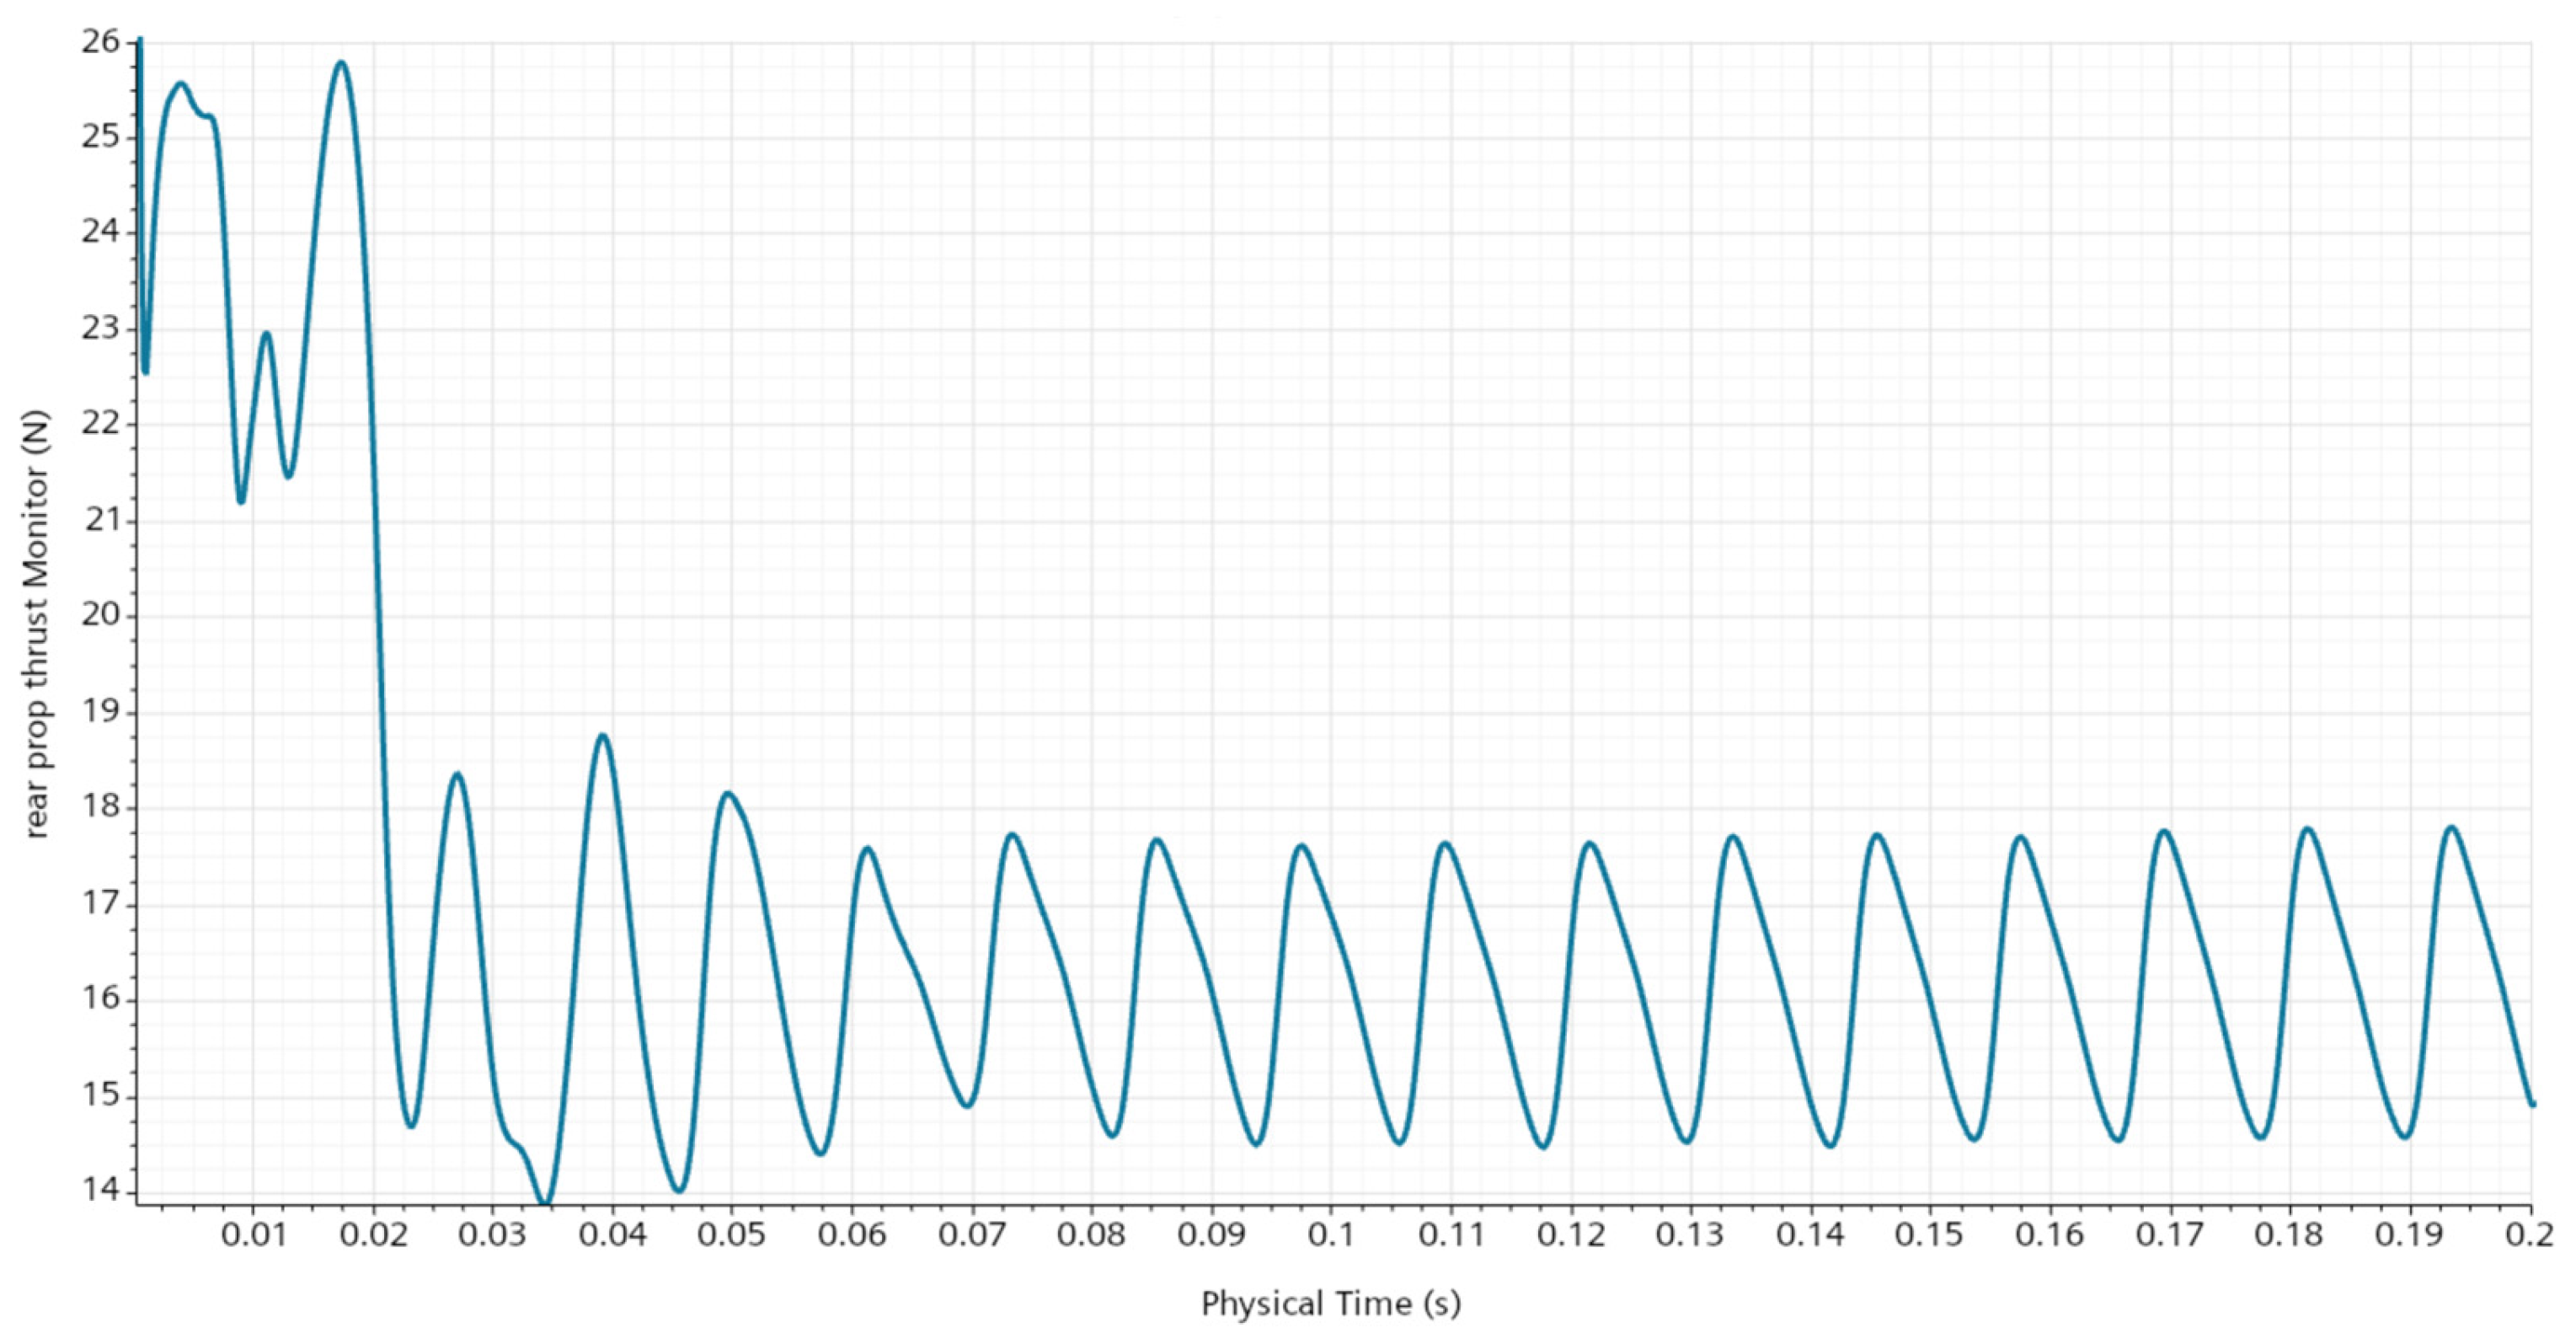
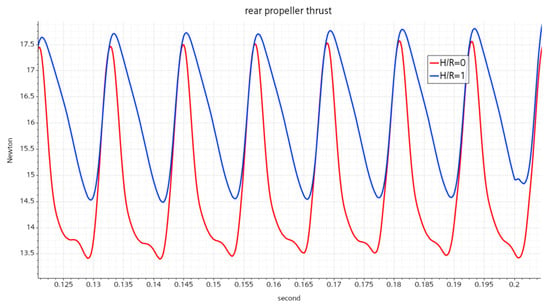
To ensure computational efficiency and model convergence, the solver time step is set to 1 × 10⁻⁴ s, within which the rotor rotates by 1.5 degrees. Taking H/R = 1 as an example, Figure 4 presents the rear rotor thrust curve under this time step.
Figure 4.
Thrust curve of the rear rotor for the H/R = 1 configuration.
It can be observed that the front rotor thrust exhibits stable periodic fluctuations after 0.1s, indicating that the results have converged.
2.4. Definition of Parameters
The Reynolds number is defined as:
where μ denotes the atmospheric viscosity, is the mean chord length, and R is the rotor radius. The thrust coefficient is defined as:
The torque coefficient is defined as:
The power coefficient is defined as:
where P denotes the rotor power, calculated as:
To evaluate the aerodynamic efficiency of different rotor configurations, the power loading coefficient η is defined as:
The turbulent kinetic energy (TKE) is defined as:
where u′, v′, and w′ denote the fluctuating velocity components in the three coordinate directions. TKE is employed as a quantitative indicator for characterizing the intensity of turbulence and its evolution within the flow field.
3. Simulations
3.1. Mesh Distribution
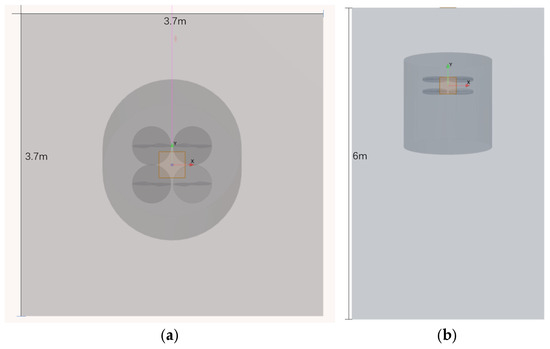
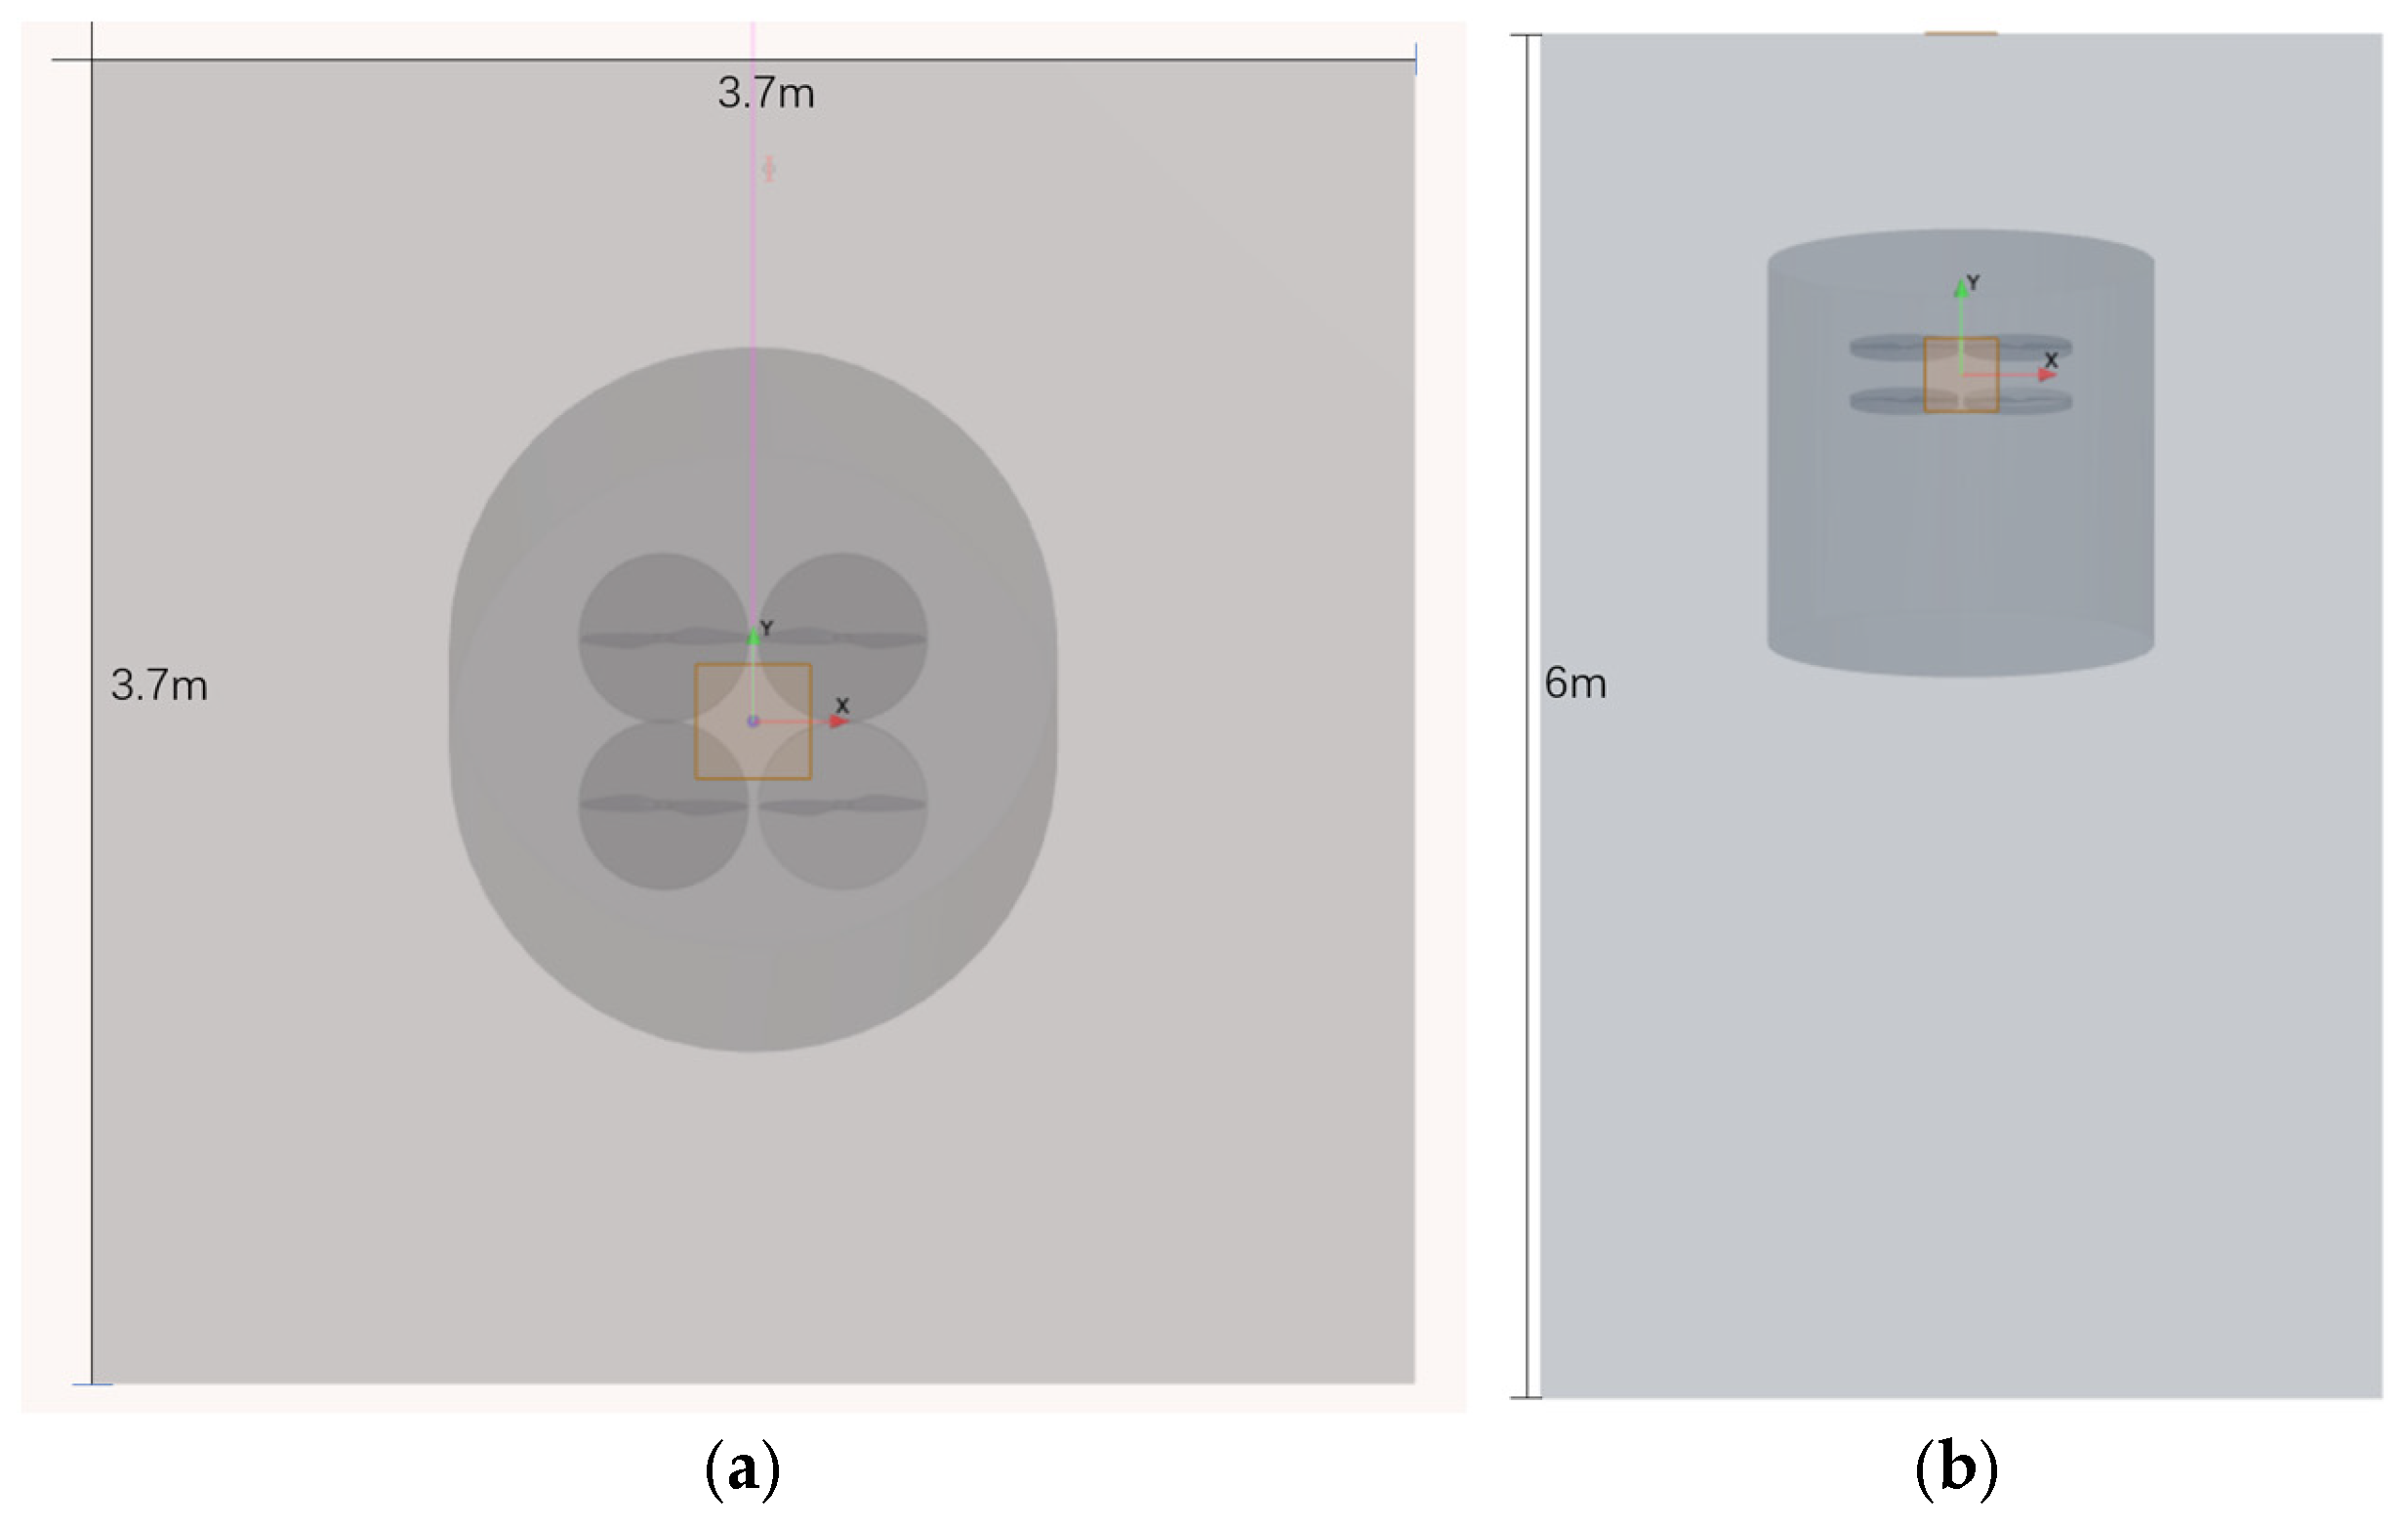
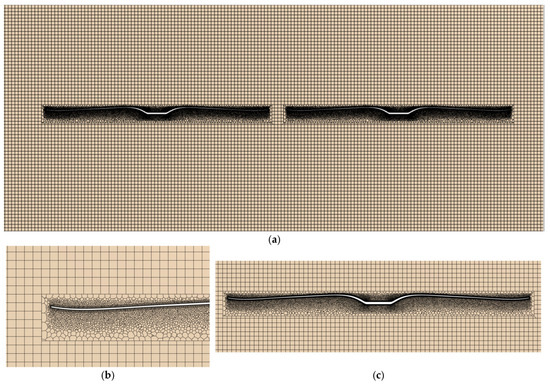
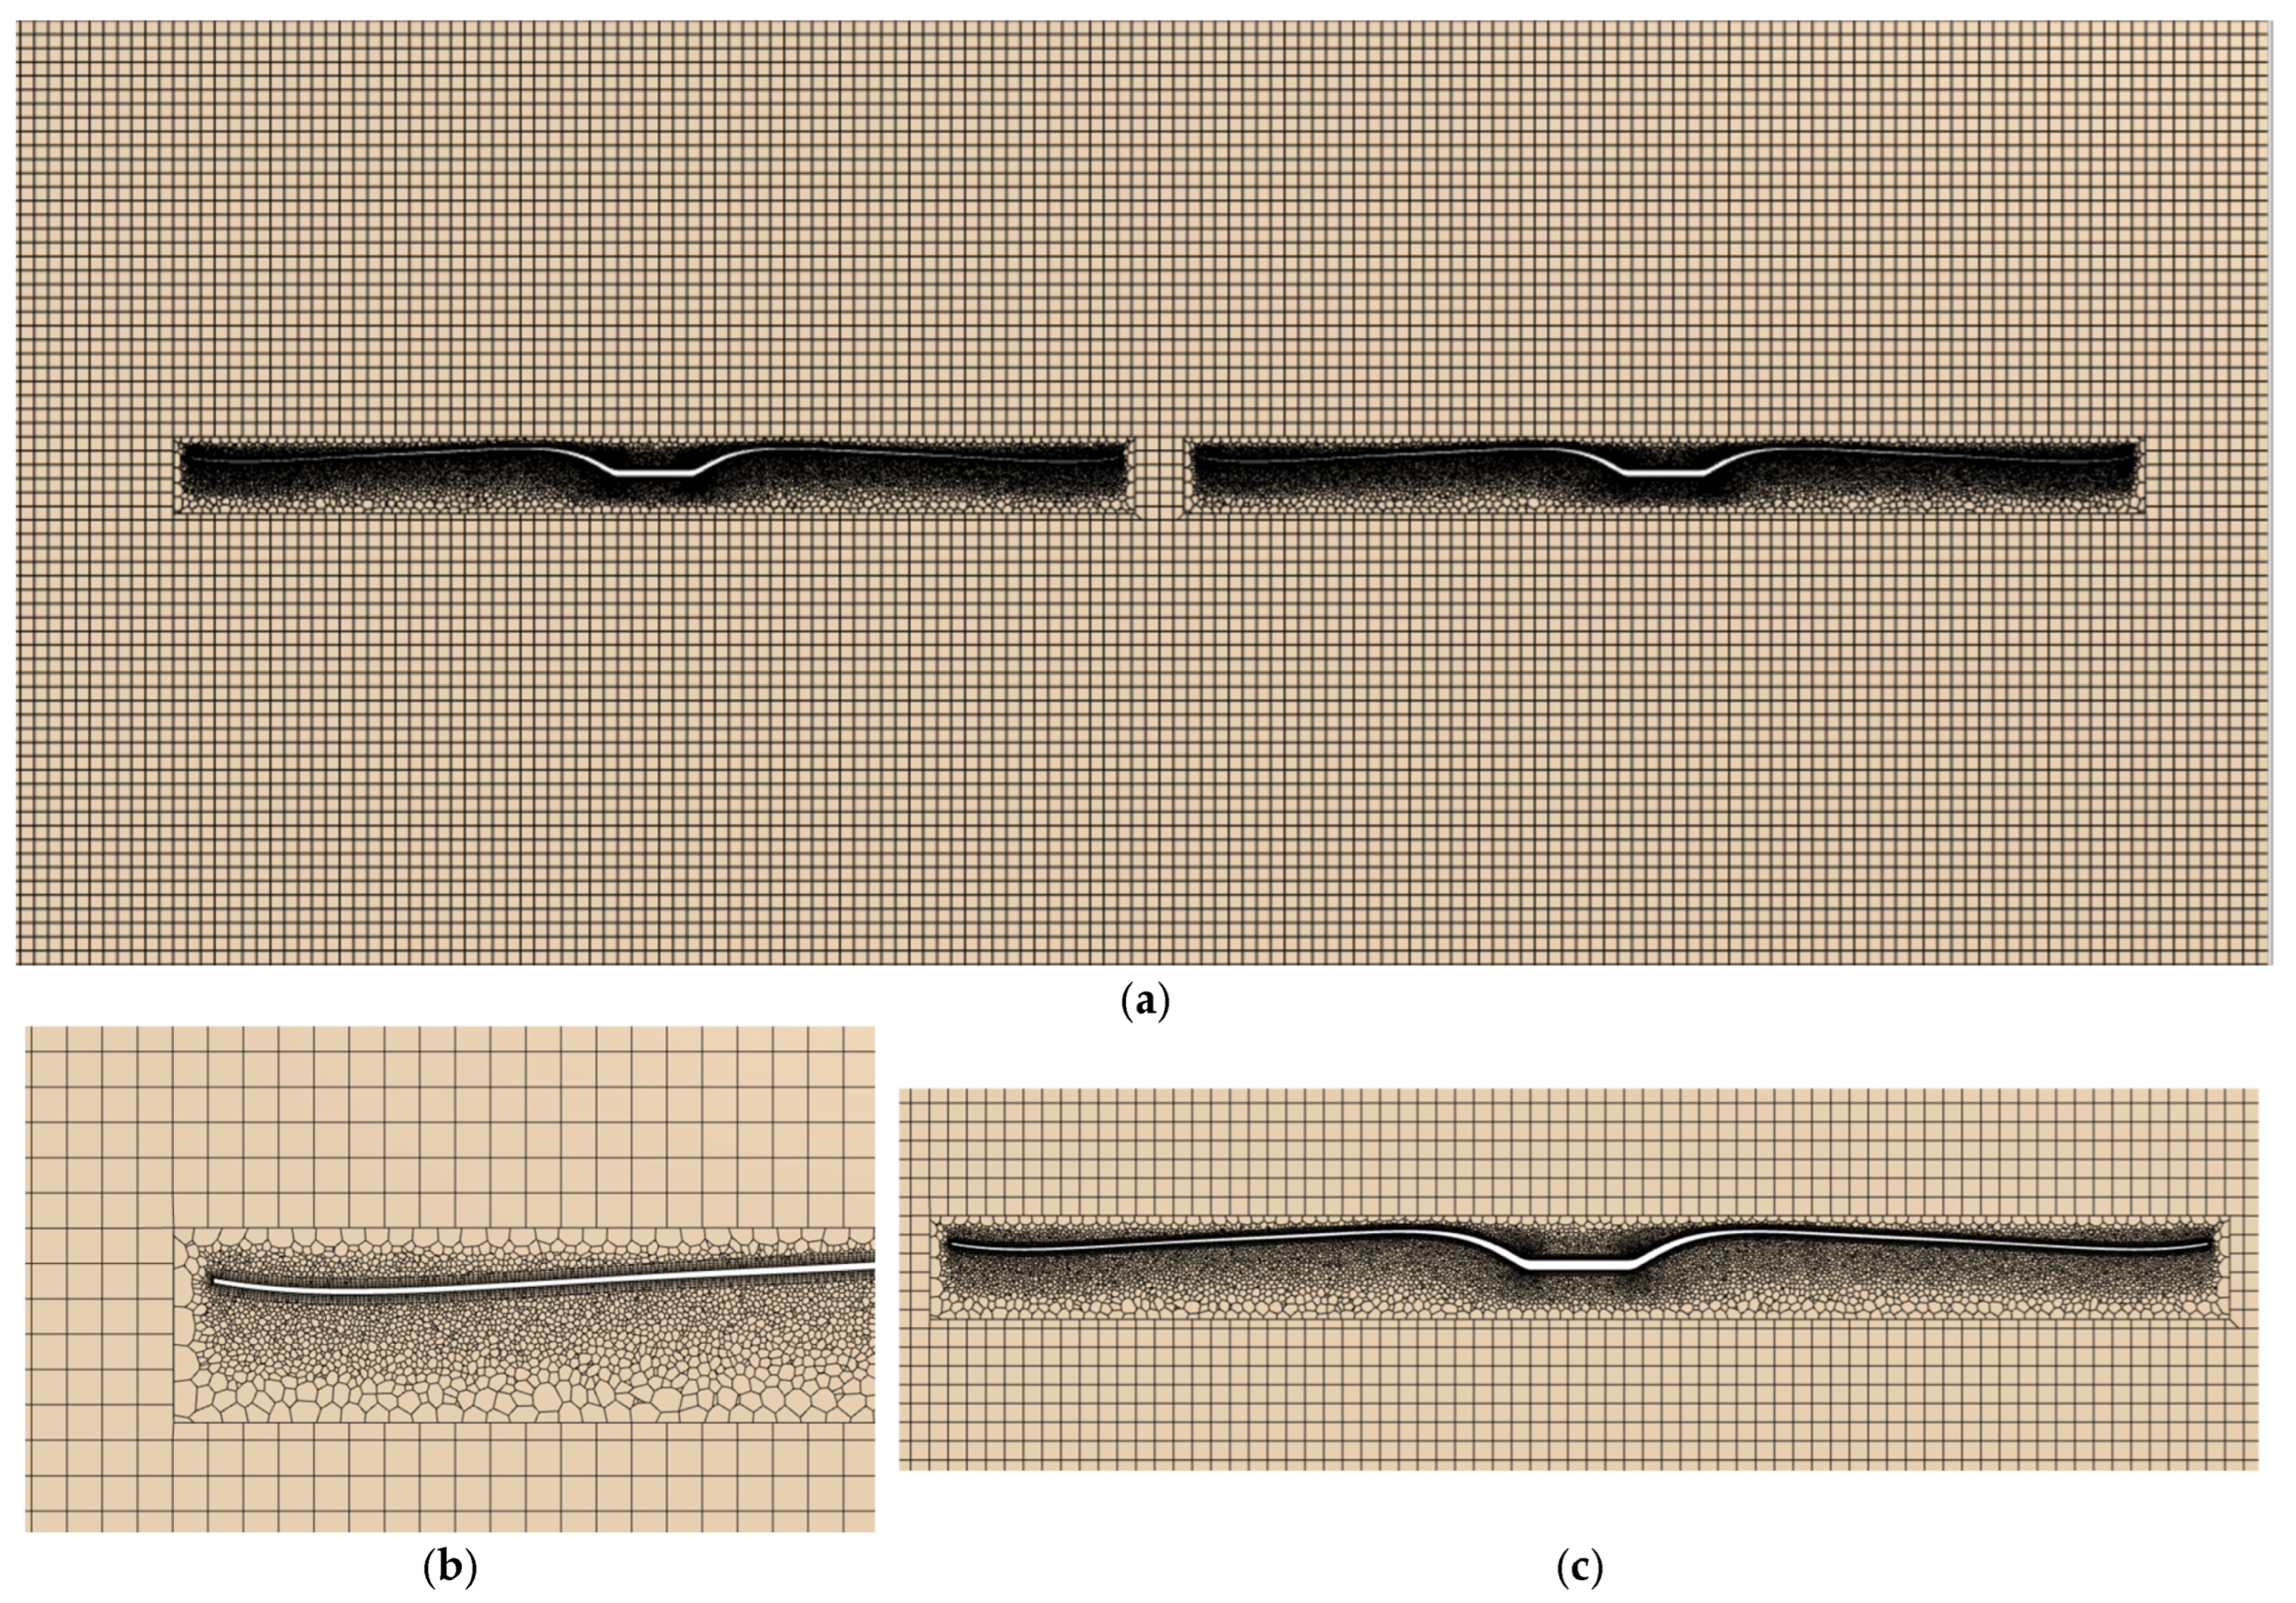
The computational domain is defined as a rectangular volume, with the top and bottom boundaries forming square planes of side length 3.7 m (16.185 R) and a total height of 6 m (26.247 R). The model is shown in Figure 5. The reference pressure is set to sea-level atmospheric pressure (101,325 Pa), and the gauge pressure on the boundary is 0 Pa. The computational domain is divided into stationary and rotating regions. The stationary region is discretized using a cut-cell meshing strategy, and the rotating rotor domains are meshed using polyhedral elements. A prism-layer mesh is generated near solid surfaces to adequately resolve the boundary layer. Additionally, the region near the quadrotor is refined to capture the wake vortices in detail. The mesh settings are shown in Figure 6.
Figure 5.
Computational domain. (a) Top view. (b) Side view.
Figure 6.
Grid setup of the computational domain. (a) Computational grid of the twin-rotor system. (b) Computational grid of the rotor tip. (c) Computational grid of the single rotor.
3.2. Simulation Parameter Design
To investigate the influence of the vertical offset of the rear rotors on both individual rotor performance and overall aircraft aerodynamics, a series of numerical simulations is conducted, in which the height-to-radius ratio (H/R) is varied. All simulation cases are performed using identical mesh configurations to ensure consistency and comparability of the results.
The rotational speed of each rotor is prescribed as ω = 261.8 rad/s. The propeller inflow angle is set to 10° to simulate forward flight conditions.
3.2.1. Determination of Free-Stream Velocity
In the forward flight regime, the free-stream velocity is derived from the condition of force balance. The initial numerical analysis assumed a free-stream velocity of 7 m/s and a rotor configuration with no vertical offset (H/R = 0). With these parameters, the obtained results indicated a net forward thrust of −2.25 N, meaning the aerodynamic drag was 2.25 N greater than the propulsive thrust generated for forward motion.
According to the rotor disk drag formula:
It can be known from the simulation that the thrust coefficient = 0.02471 when H/R = 0. Through calculation, when the forward thrust is balanced with the drag, = 5.83 m/s. This value is therefore adopted as the representative operating condition, and all subsequent simulations are conducted at a free-stream velocity of 5.83 m/s.
It should be noted that the relative inflow velocity is one of the various flight parameters and is itself related to multiple aspects. In future work, we will also discuss the impacts brought by factors such as velocity (advance ratio) and rotor spacing. Therefore, for the current study, although the velocity accuracy obtained by this method is insufficient and may introduce potential circular reasoning, the derived values can be used as a reference for experimental conditions.
3.2.2. Design of H/R Values
The initial set of height-to-radius ratios considered in this study includes H/R = 0, 0.33, 0.66, 1, 1.31, 1.64, and 1.97, corresponding to incremental vertical elevations of 75 mm for the rear rotors. Following a preliminary analysis of the simulation results, additional intermediate H/R values (0.167, 0.45, 0.56, and 0.83) are introduced to more clearly capture the variation trends in aerodynamic performance.
3.3. Grid Independence Verification
To assess the sensitivity of the numerical results to the grid resolution, a mesh independence study was conducted. This analysis employs two configurations, namely H/R = 0 and H/R = 1, and simulations were performed using two distinct grid densities. A comparison of the thrust and torque coefficients obtained from the medium and fine grids is summarized in Table 3 and Table 4. Table 3 presents the data for the H/R = 0 configuration, and Table 4 shows that for the H/R = 1 configuration.
Table 3.
Mesh independence at H/R = 0.
Table 4.
Mesh independence at H/R = 1.
The relative errors of the thrust coefficients and torque coefficients between the two mesh resolutions for both the H/R = 0 and H/R = 1 configurations are all maintained below 5%, suggesting sufficient mesh independence of the numerical results. This confirms that the adopted meshing strategy and numerical solver are reliable for the scope of this study.
3.4. Experimental Validation
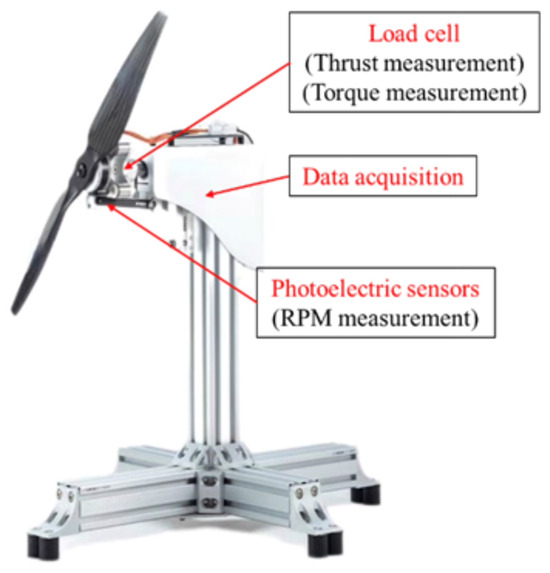
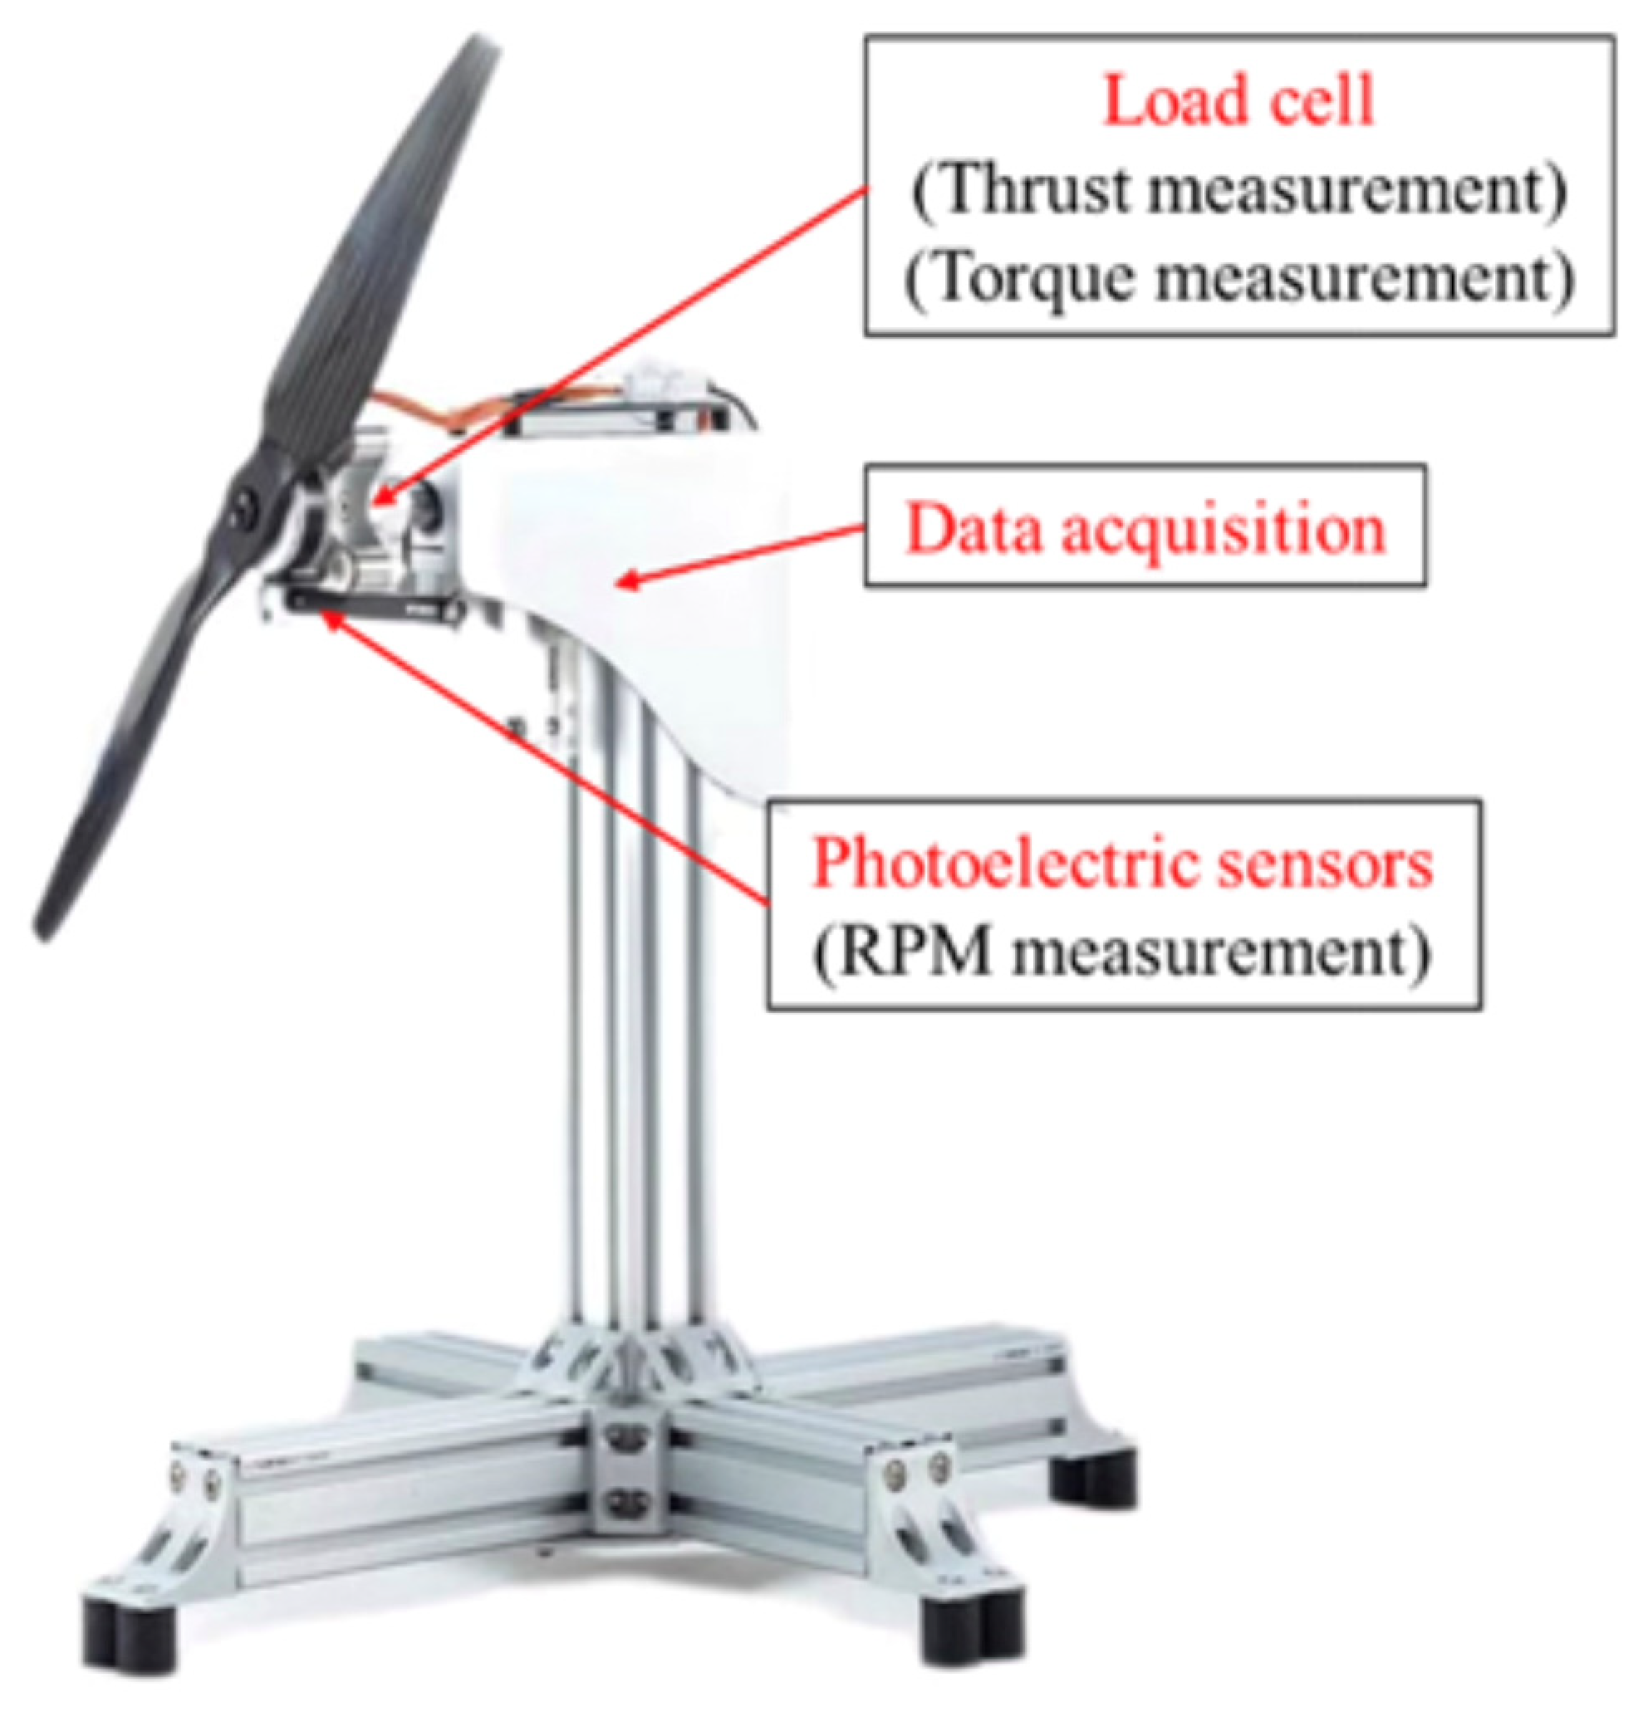
To validate the numerical methodology, a comparison with available experimental data is performed. The experimental setup and measurement procedure previously reported in Ref. [21] are adopted, as illustrated in Figure 7.
Figure 7.
Single Rotor Experimental Setup [21].
The experimental dataset consists of thrust and torque measurements of a T-MOTOR 1855 propeller operating in hover at a rotational speed of approximately 2500 rpm. A corresponding single-rotor numerical model is established using the same meshing and simulation settings as those employed in the present study. The comparison between the numerical and experimental results is summarized in Table 5.
Table 5.
Single-Rotor Simulation and Experimental Error Analysis.
The relative deviation between the simulated and measured thrust coefficients is within 5%, indicating reasonable agreement between the numerical predictions and experimental observations. This level of accuracy demonstrates that the numerical approach can adequately capture the aerodynamic characteristics of the rotor under the considered operating conditions.
To verify the accuracy of the computational model under oncoming flow conditions, this study proposes a validation method that does not rely on wind tunnel experiments: a coaxial twin-rotor configuration test rig was utilized for experimental tests, while numerical simulations were conducted simultaneously with parameters (such as mesh settings and solver time step) consistent with those of the simulation model in this study. By comparing the thrust of the upper and lower rotors obtained from the simulation and experiment, the accuracy of the simulation model in predicting flow behaviors under oncoming flow conditions can be evaluated.
The test and simulation conditions are as follows: no ground effect, a vertical distance of 0.3 R between the upper and lower rotors, and a horizontal distance of 0 (i.e., coaxial configuration). Both the upper and lower rotors operate at a rotational speed of 2500 rpm, which is consistent with the rotational speed used in the evaluation of the vertically elevated rear-rotor configuration. The comparison between the numerical and experimental results is summarized in Table 6.
Table 6.
Coaxis-Rotor Simulation and Experimental Error Analysis.
Under coaxial conditions, when using the same mesh, solver, and rotational speed parameters as those in the numerical simulation, the relative errors of the thrust coefficients are all within 5%. This indicates that the numerical results of the model under oncoming flow conditions are reliable.
3.5. Thrust Characteristics of the Rotors
Variations in H/R significantly influence the thrust distribution of the quadrotor system. Due to aerodynamic interference, the wake generated by the front rotors modifies the inflow conditions of the rear rotors, thereby affecting their thrust generation. In this subsection, the thrust characteristics of the front and rear rotors are analyzed separately as a function of H/R.
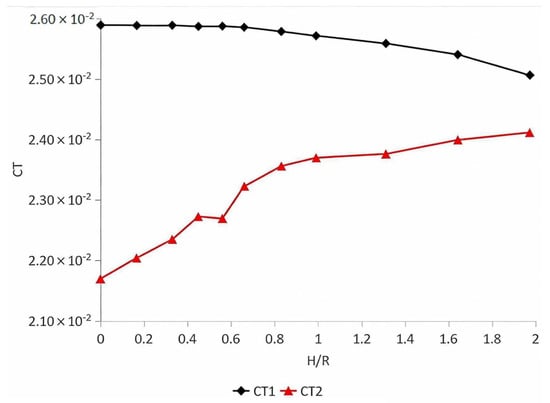
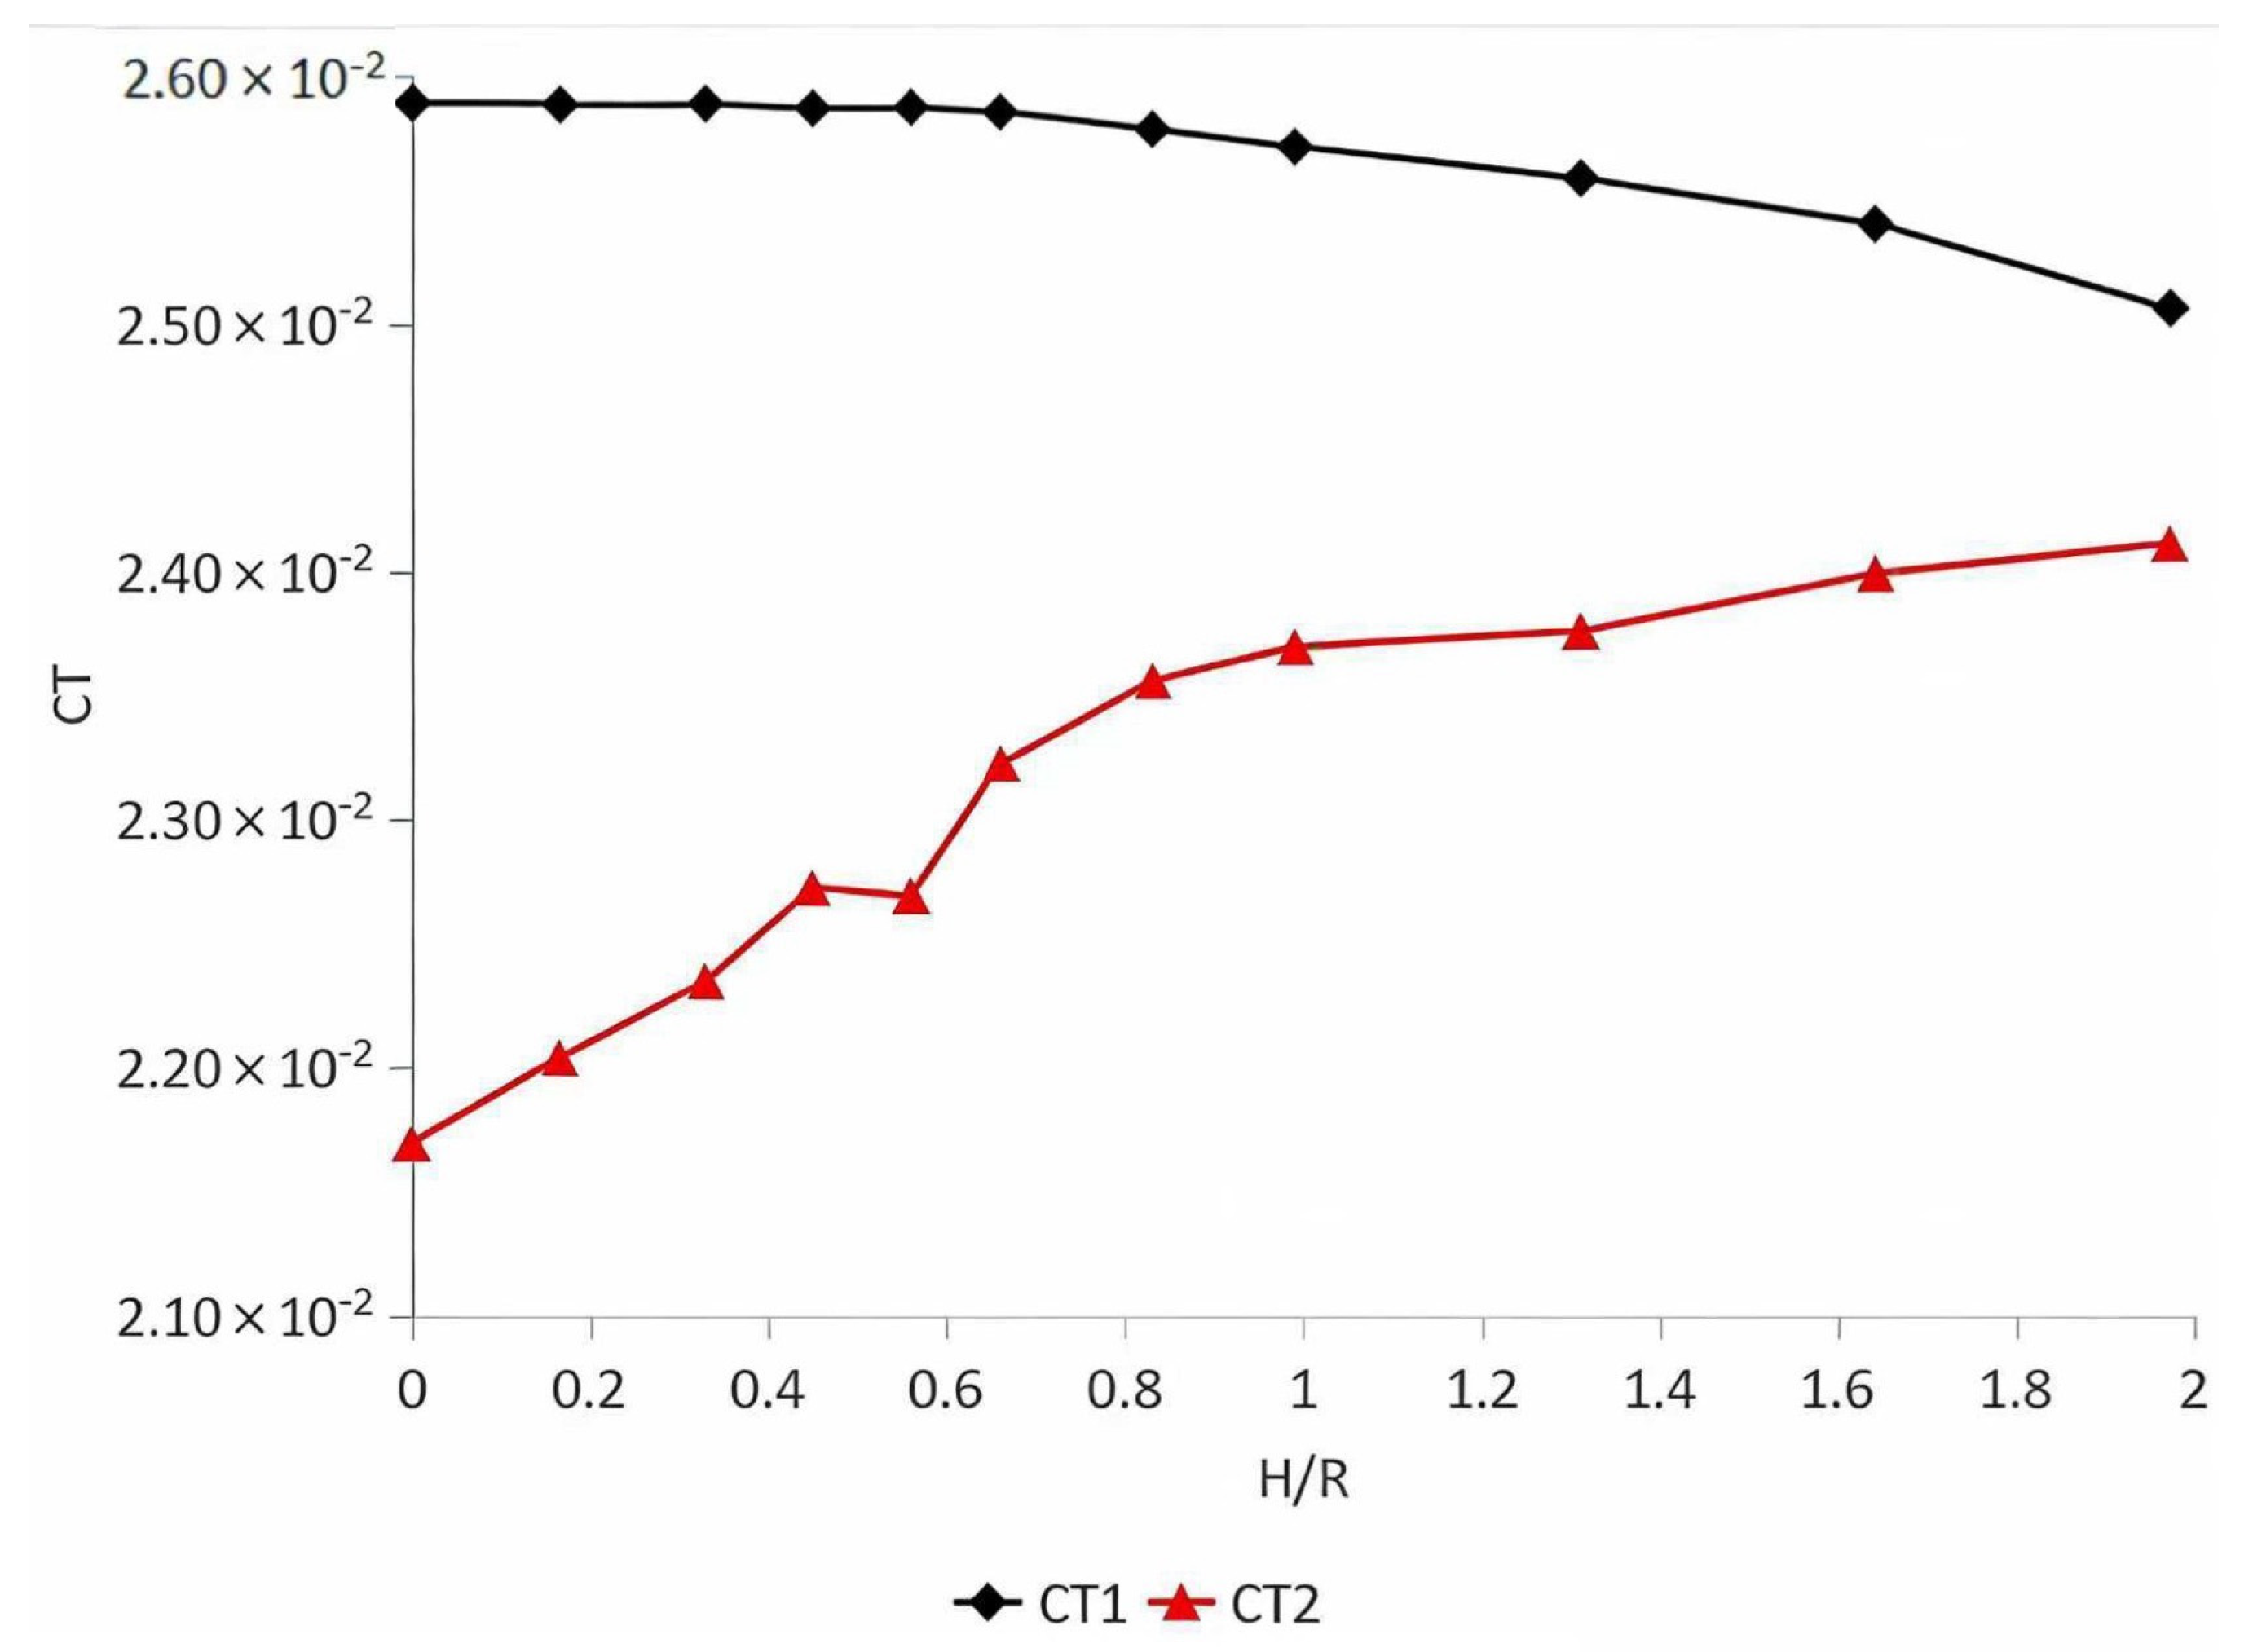
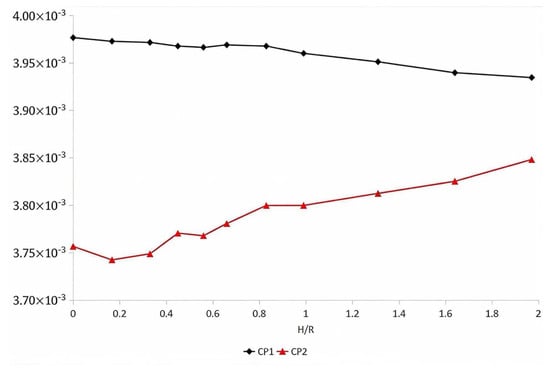
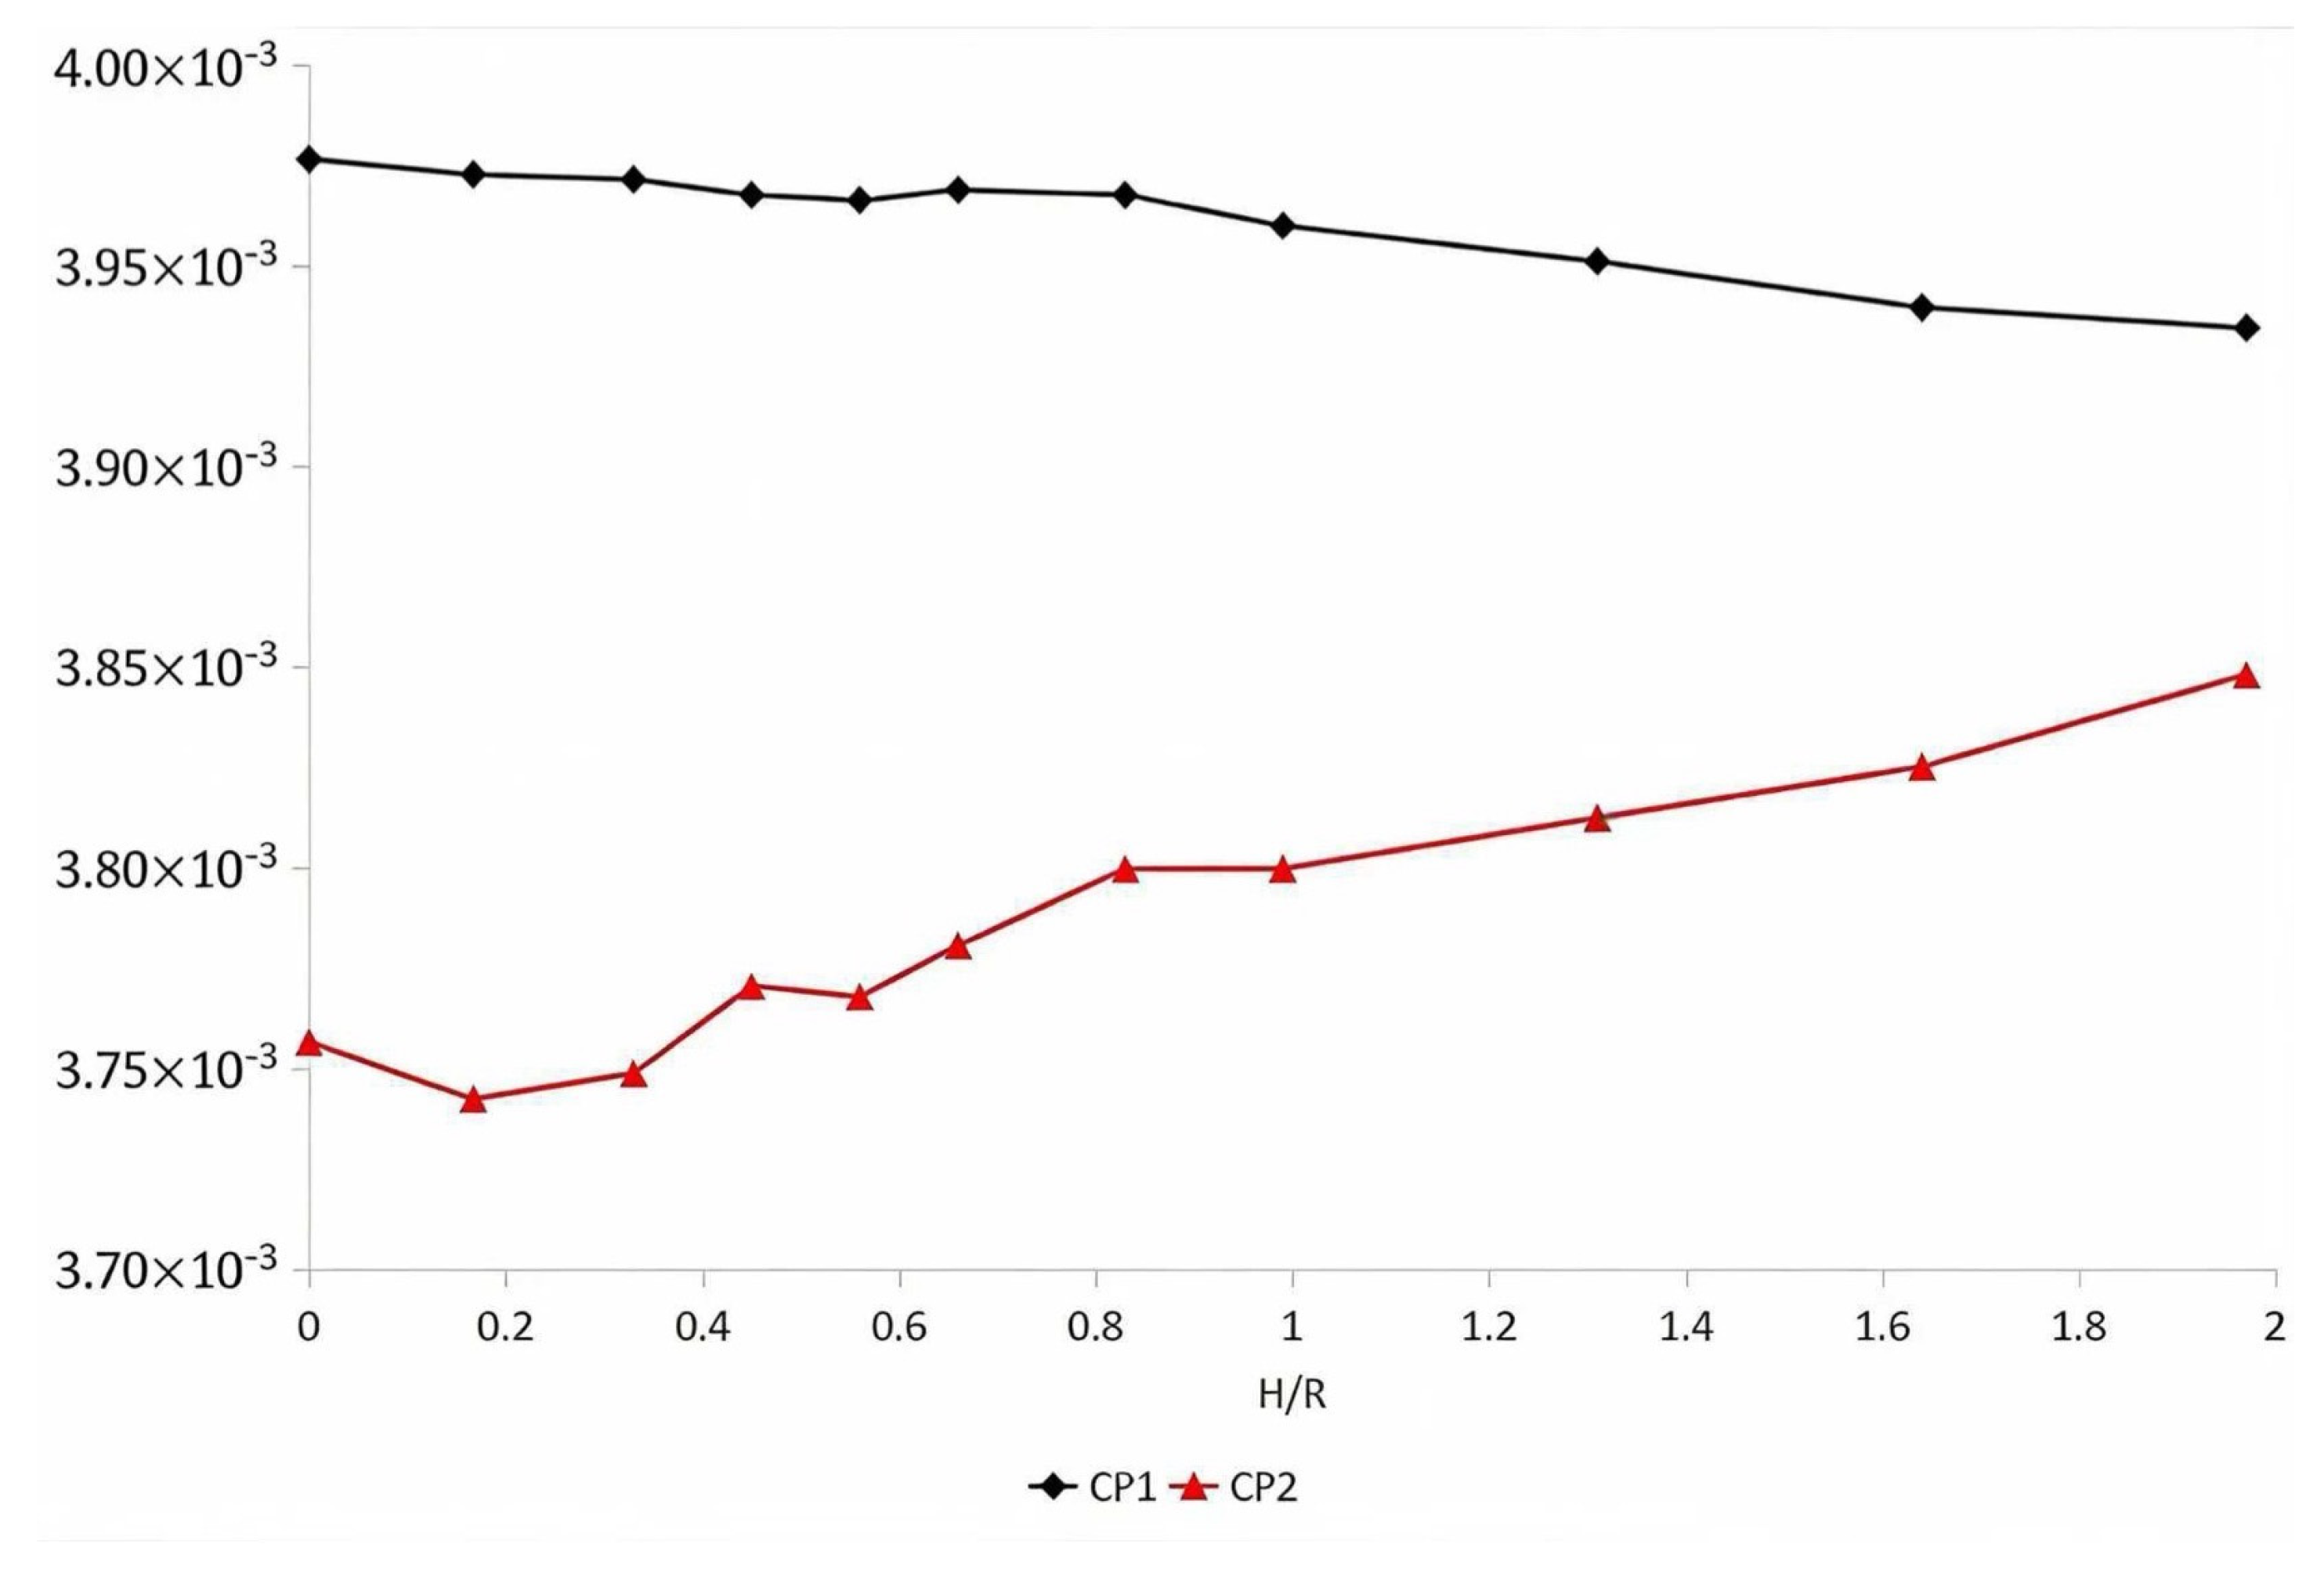
The variations in the front rotor thrust coefficient () and rear rotor thrust coefficient () with H/R are summarized in Table 7 and Table 8, respectively, and the corresponding trends are illustrated in Figure 8. As H/R increases from 0 to 1.97, increases monotonically, while exhibits a gradual decrease. Overall, the rear-rotor thrust coefficient increases by a maximum of 11.16%, whereas the front-rotor thrust coefficient decreases by no more than 3.18% over the investigated range.
Table 7.
Data on the variation in the front rotor thrust coefficient with H/R.
Table 8.
Data on the variation in the rear rotor thrust coefficient with H/R.
Figure 8.
Propeller Thrust Coefficient.
To gain further insight into the effect of the rear rotor on the front rotor, an additional test case was examined: under the H/R = 0 configuration, the rear rotor was deactivated while all other conditions remained unchanged. It was found that, compared to the scenario with the rear rotor operating normally, the thrust coefficient of the front rotor in this case was not only lower than that under the H/R = 0 configuration but also lower than that under the H/R = 1.97 configuration. This demonstrates that the rear rotors produce a gain effect rather than a detrimental effect on the front rotors. This gain takes effect when H/R is relatively small and is roughly negatively correlated with H/R.
3.6. Power Characteristics of Rotors
In this section, we calculated the rotor power coefficients under the aforementioned operating conditions and conducted an analysis of the corresponding data.
The variations in the front rotor power coefficient () and rear rotor power coefficient () with H/R are presented in Table 9 and Table 10, with the corresponding trends shown in Figure 9. As the H/R ratio increased, the power coefficient of the front rotor generally exhibited a declining trend, while that of the rear rotor showed an overall upward trend. These variations align with the observed changes in thrust, reflecting the interdependent relationship between rotor power consumption and thrust generation.
Table 9.
Data on the variation in the front rotor power coefficient with H/R.
Table 10.
Data on the variation in the rear rotor power coefficient with H/R.
Figure 9.
Propeller Power Coefficient.
3.7. Power Loads of Rotors
The power loading coefficient η represents the thrust generated per unit power, which serves as a critical metric for evaluating the aerodynamic efficiency of rotors. A higher η value indicates greater thrust output for a given power input. In this section, we analyze the variations in power loading characteristics of the front rotor, the rear rotor, and the overall quadrotor system with different H/R.
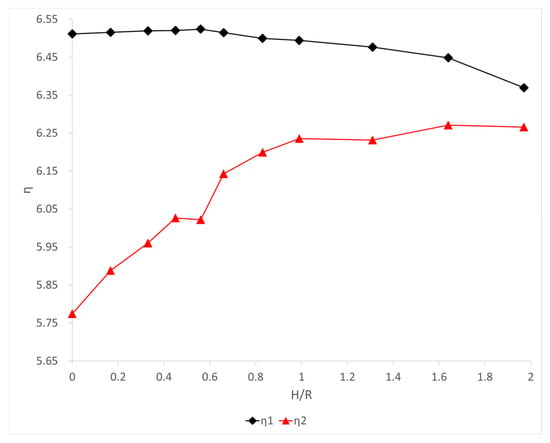
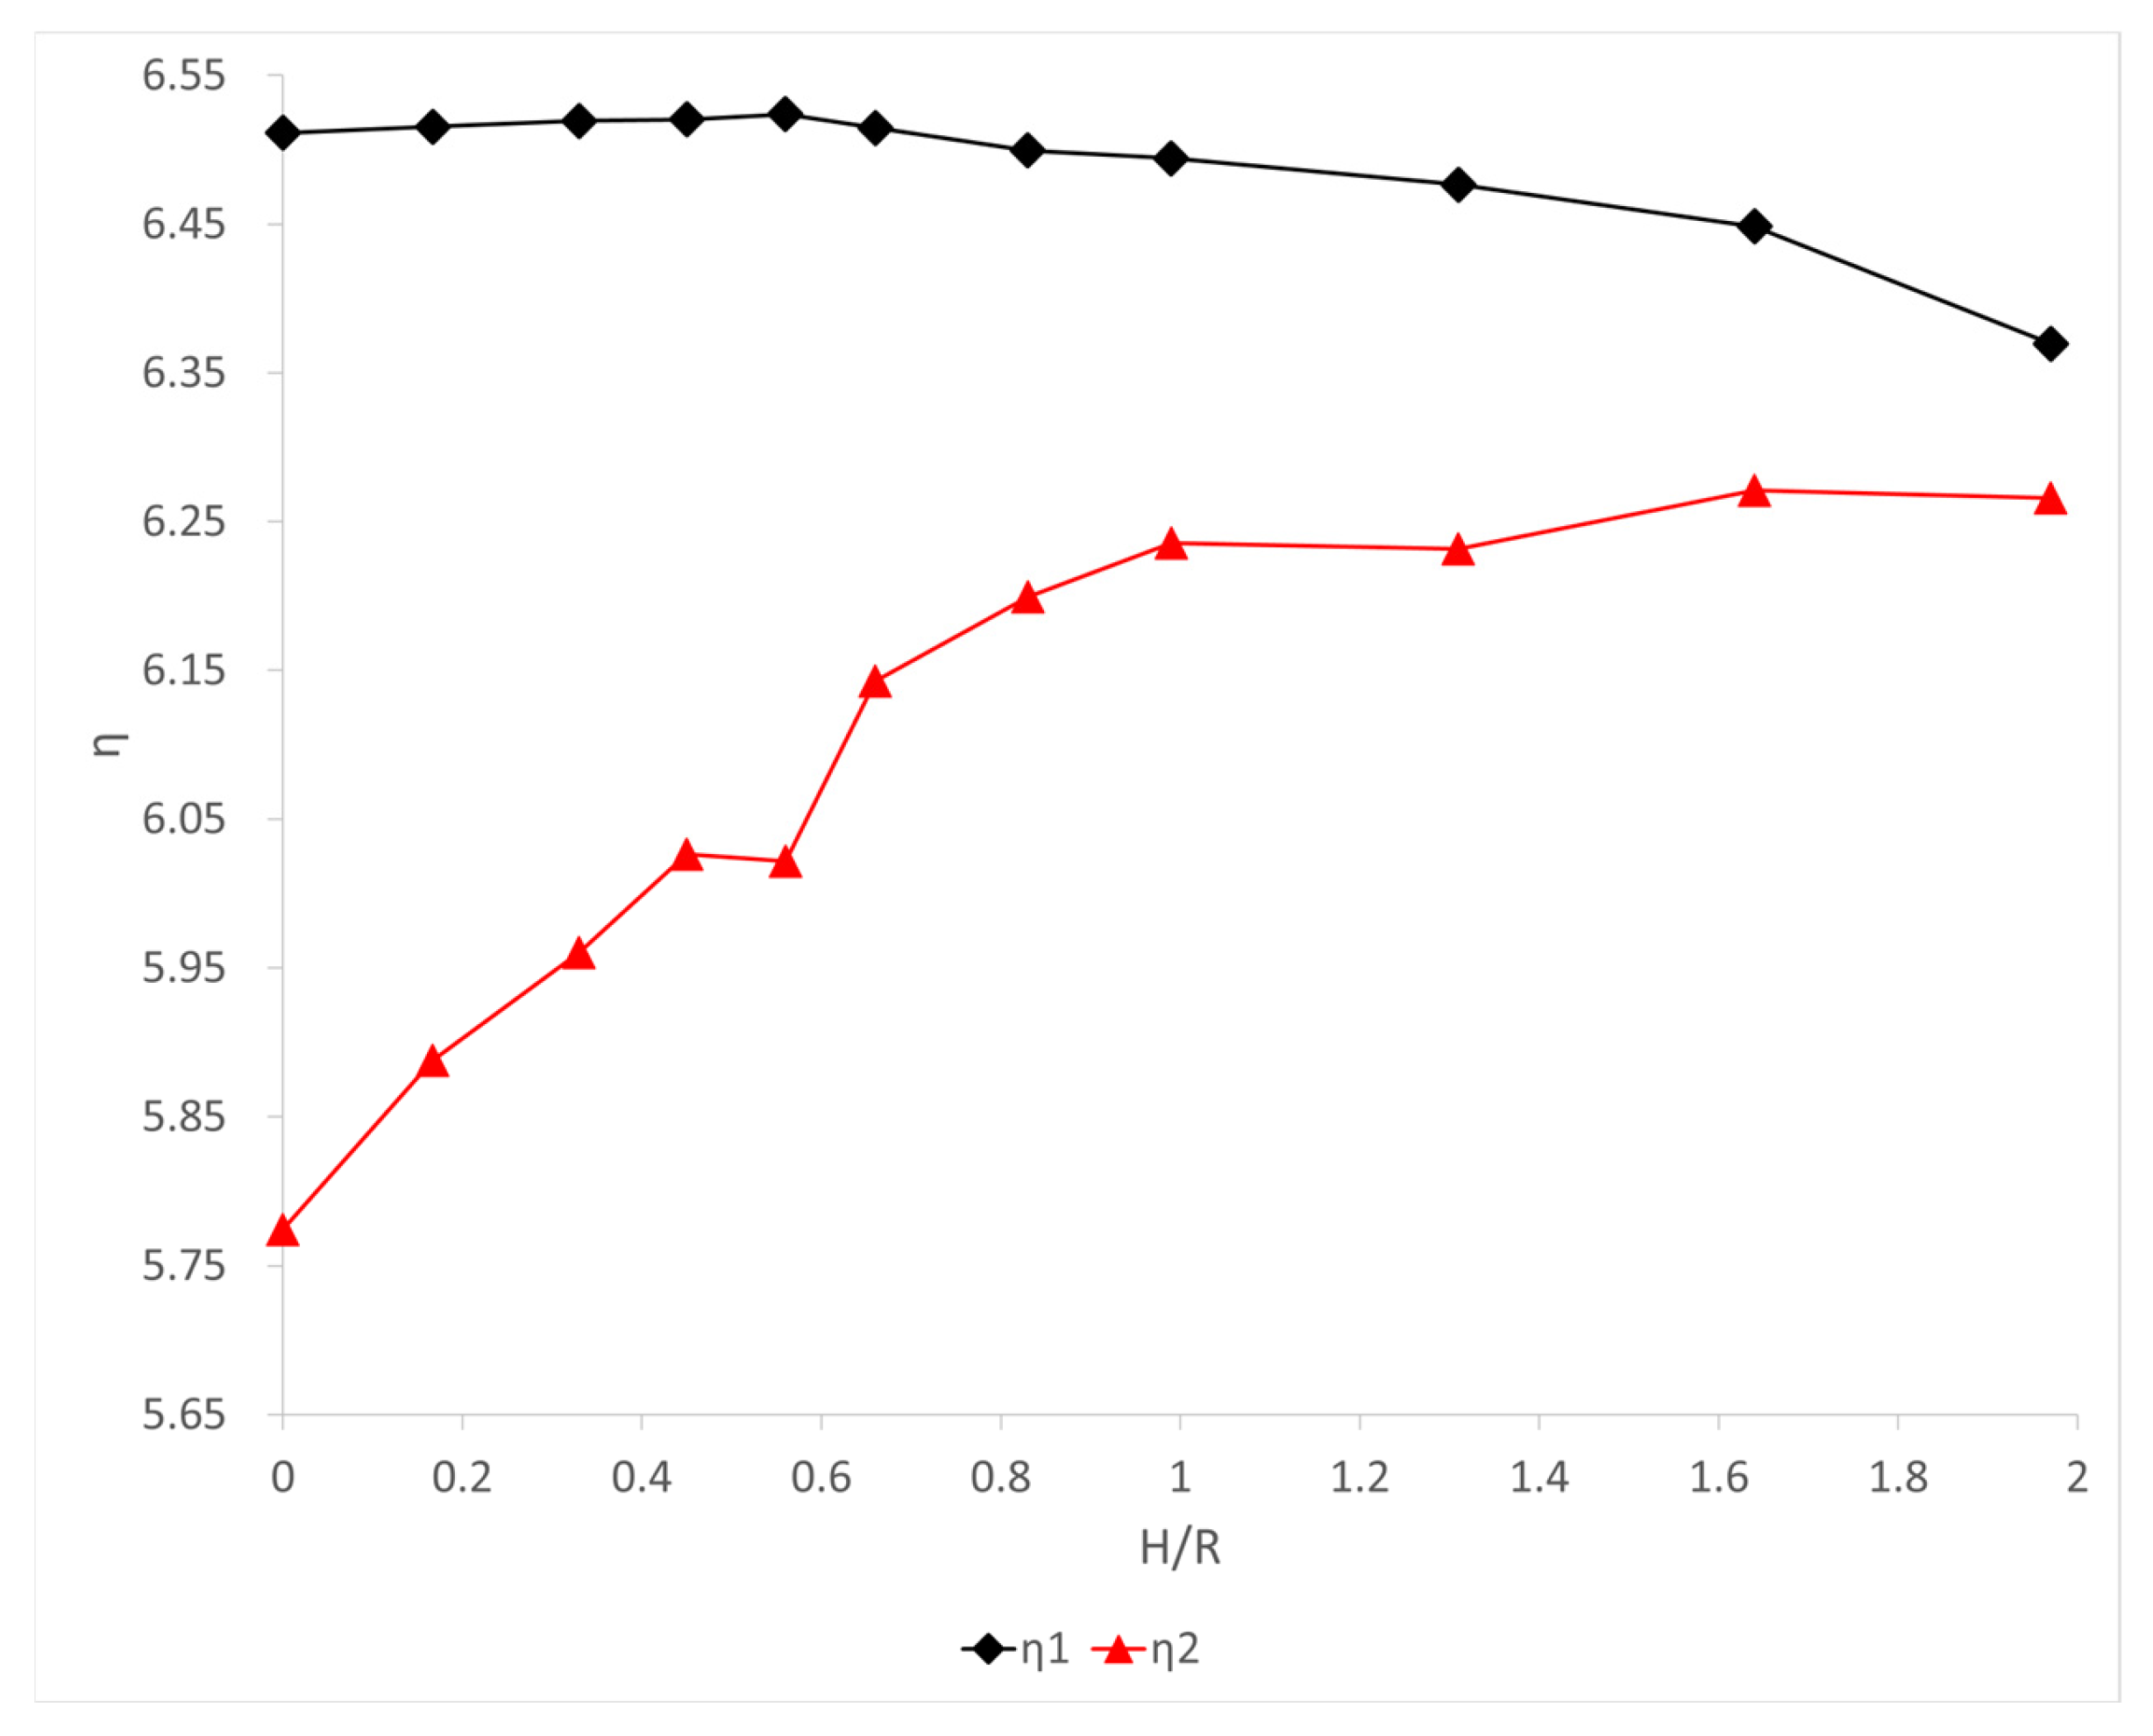
The variations in the front-rotor power loading coefficient (η1) and rear-rotor power loading coefficient (η2) with H/R are summarized in Table 11 and Table 12 and illustrated in Figure 10. Table 13 presents the power load coefficient of the entire aircraft. The front-rotor power loading remains nearly constant for H/R < 0.6 but decreases noticeably as H/R increases further. In contrast, η2 increases with H/R, although the rate of increase gradually diminishes at larger values of H/R.
Table 11.
Data on the variation in the front rotor power loading coefficient with H/R.
Table 12.
Data on the variation in the rear rotor power loading coefficient with H/R.
Figure 10.
Power Loading Coefficient.
Table 13.
Data on the variation in the overall power loading coefficient with H/R.
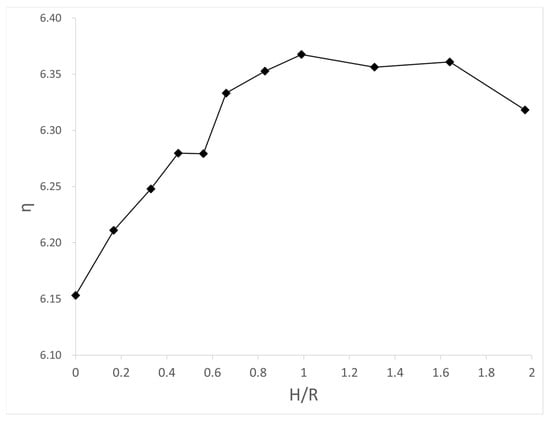
Figure 11 presents the variation in the overall power loading coefficient η. As H/R increases from 0 to 1, η increases continuously, indicating improved overall aerodynamic efficiency. Beyond H/R = 1, further increases in H/R result in little improvement and eventually lead to a slight reduction in η. From the perspective of power loading, the optimal configuration is therefore achieved at H/R = 1, corresponding to a rear-rotor elevation equal to the rotor radius. Under the investigated operating condition, this configuration yields an improvement of approximately 3.5% in overall power loading compared with the coplanar baseline configuration.
Figure 11.
Overall Power Load Coefficient of the Entire drone.
It is worth noting that numerically, the 3.5% increase may be comparable in magnitude to the deviations induced by numerical uncertainty. Yet the variation trends of thrust, power, and power loading can be clearly observed from the aforementioned figures, and these trends substantiate that the rise in the overall power loading coefficient of the aircraft is not primarily attributed to numerical uncertainty.
4. Results
4.1. Vortex-Propeller Interaction (PVI)
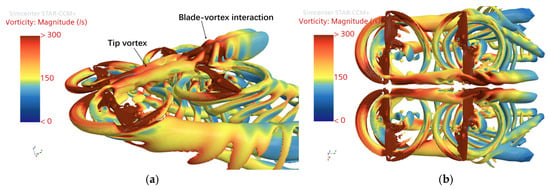
During rotor operation, the pressure difference between the lower and upper surfaces of the blade tip causes the airflow to roll up, forming blade tip vortices with elevated vorticity and intense induced velocity, as illustrated in Figure 12. These blade tip vortices propagate downstream along the rotor wake and serve as the primary source of aerodynamic interference in compact multi-rotor configurations.
Figure 12.
Three-dimensional Visualization of the Drone Rotor Blade Tip Vortices. (a) Side view. (b) Top view.
In the conventional layout (H/R = 0), the blade tip vortices produced by the front rotor strike the disk of the rear rotor directly, resulting in pronounced vortex-propeller interaction (PVI). At specific azimuth angles, the vortex core can intersect with blade sections in the region that contributes most to thrust generation (around 0.8–0.9 R). The strong induced velocities linked to these vortices create an additional downwash component over the blades of the rear rotor, which reduces their effective angle of attack and consequently leads to a decrease in the thrust produced by the rear rotor.
Since the blade region affected by PVI contributes substantially to the total rotor thrust, even a localized disturbance can lead to a substantially degraded performance of the rear rotor. Moreover, the impingement of blade tip vortices enhances turbulence intensity within the blade boundary layer, promotes premature flow separation, and further aggravates thrust loss.
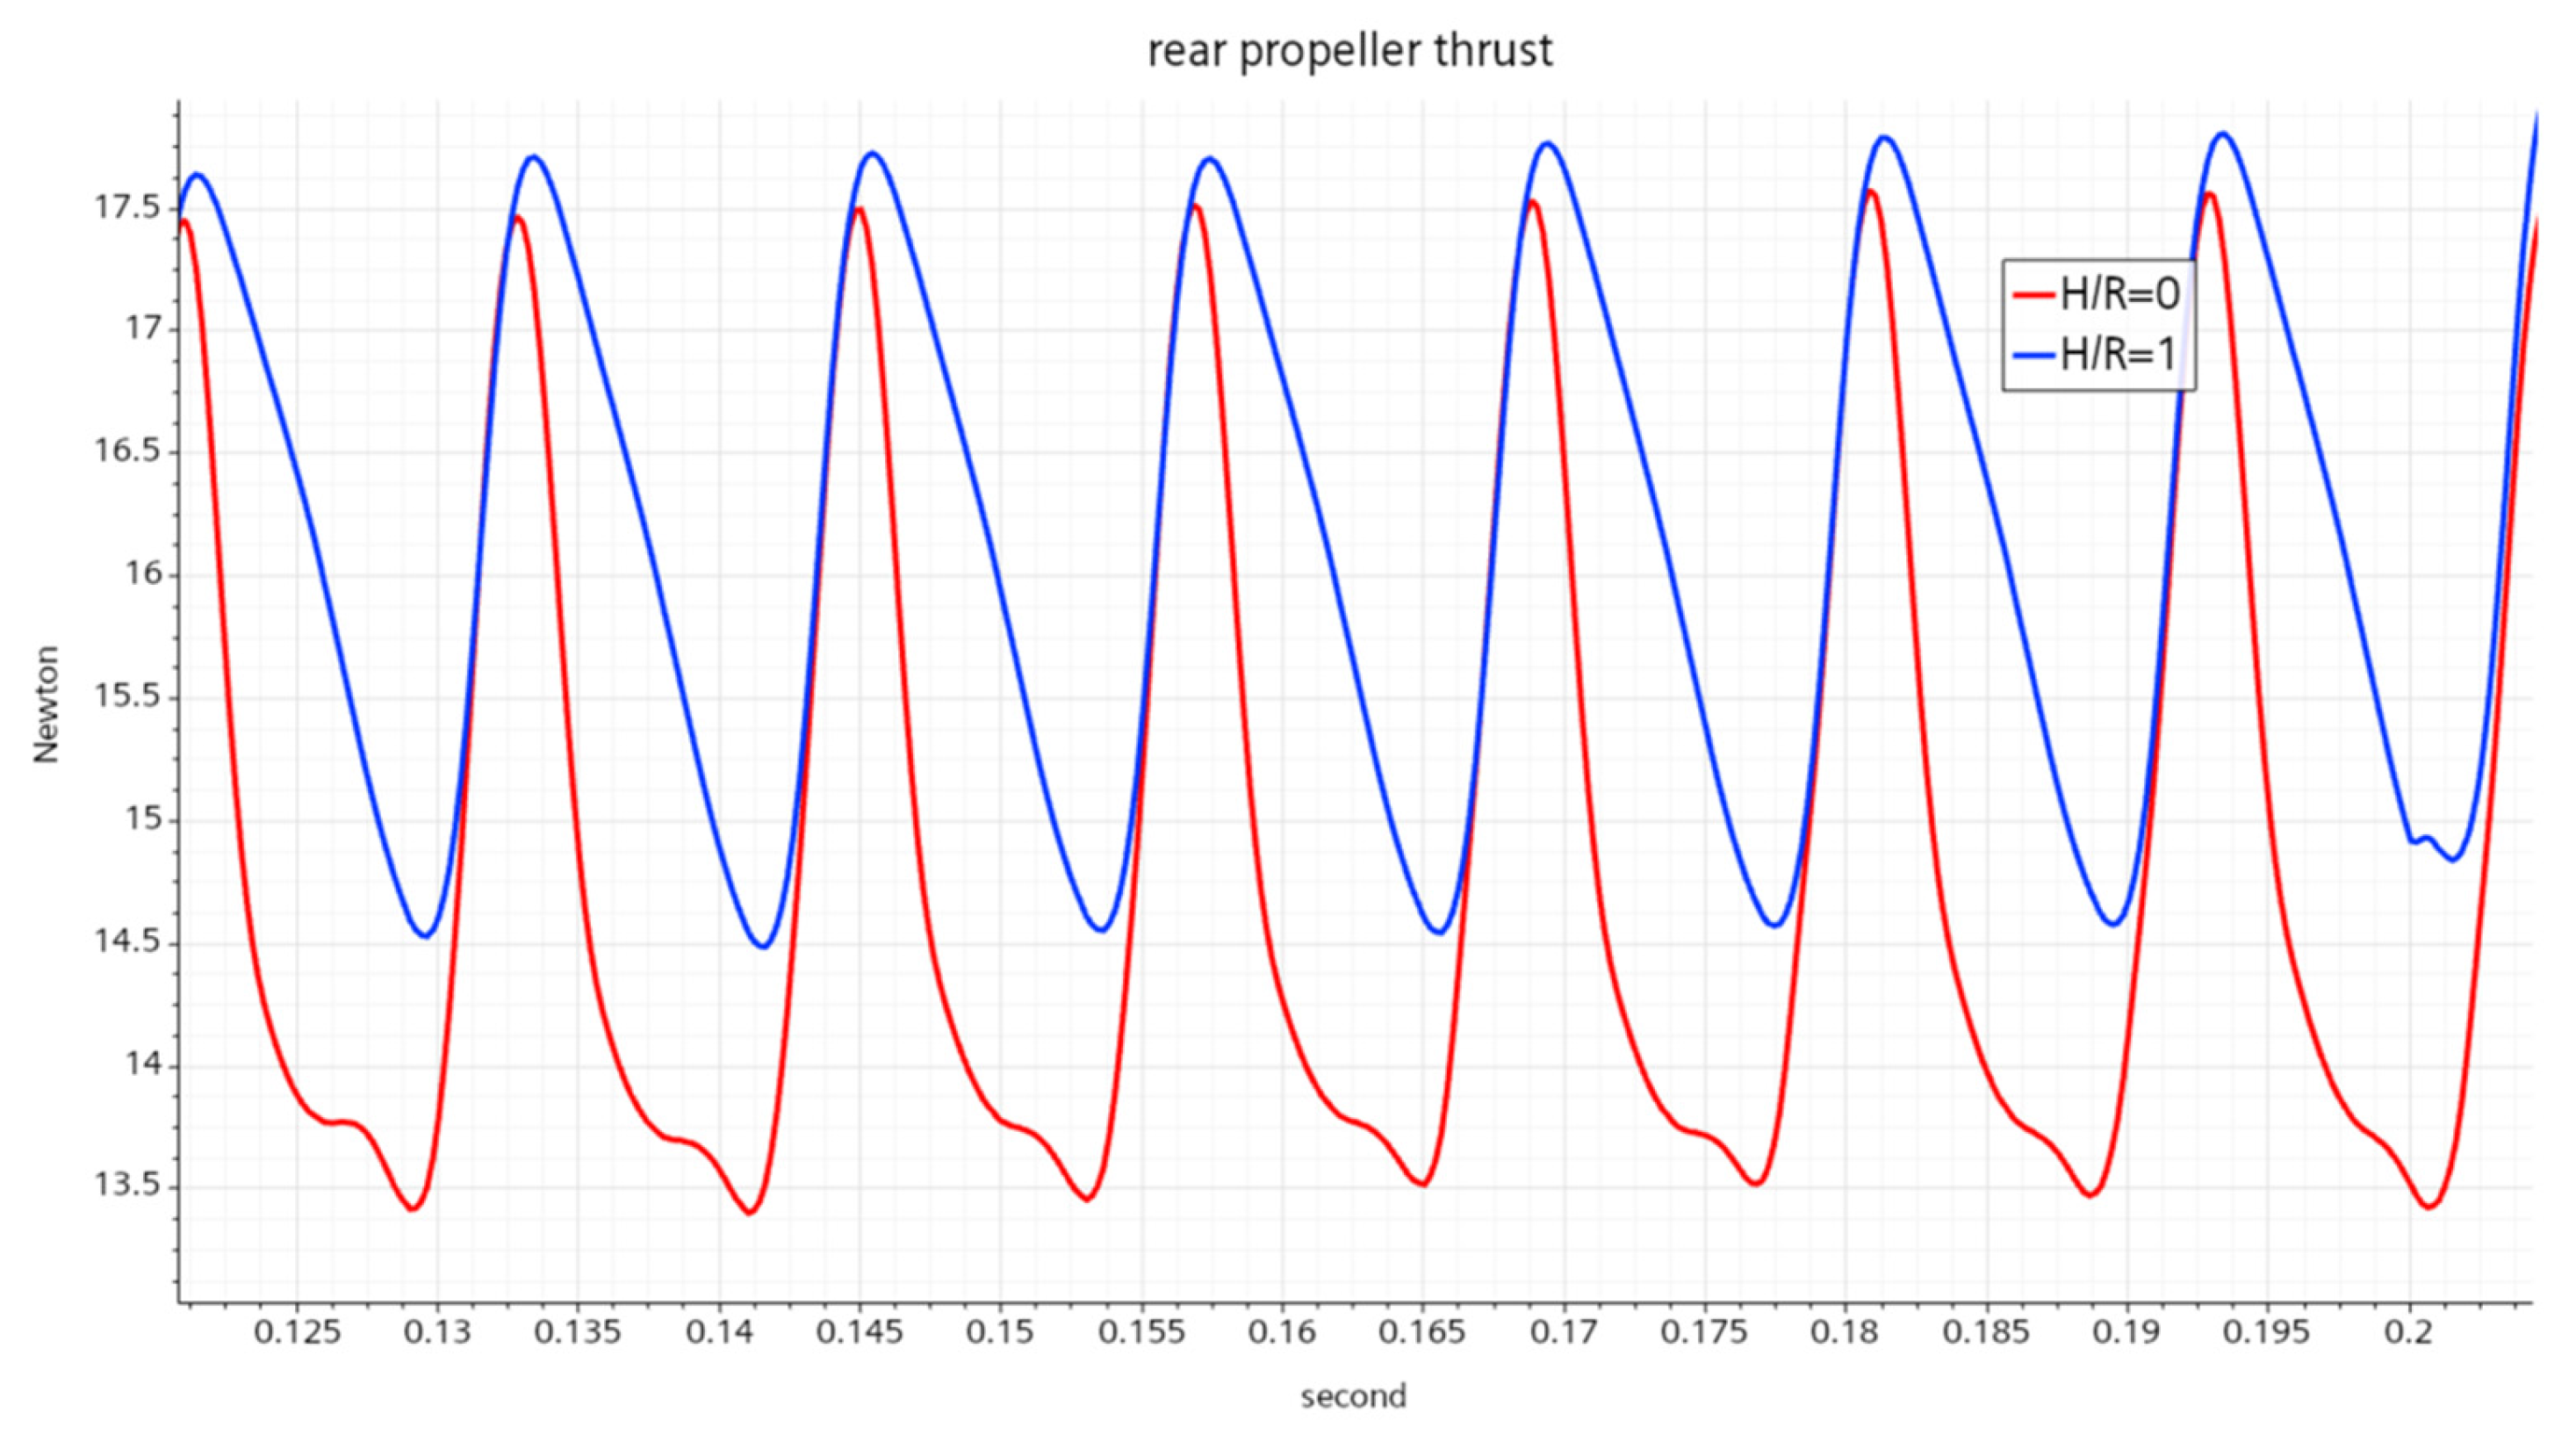
From the perspective of the time-domain correlation between PVI and thrust, when the blade tip vortices of the front rotor directly impinge on the blade tip of the rear rotor (the high-lift contribution region), the rear rotor thrust reaches a peak and then decreases rapidly. When the blade tip of the rear rotor avoids the blade tip vortices of the front rotor (i.e., the vortex entanglement at the blade tips is the weakest), the rear rotor thrust reaches a valley and then gradually recovers. This indicates that the vortex entanglement generated by the blade tip vortices of the front rotor at the blade tips of the rear rotor exerts an adverse effect on the rear rotor thrust, directly leading to fluctuations in the rear rotor thrust. The level of the adverse effect is positively correlated with the intensity of the vortex-rotor interaction. Quantitatively, for the H/R = 0 configuration, the total thrust peak of the rear rotor reaches 17.5 N in forward flight, while the valley value is 13.5 N. The comparison of thrust at different vertical elevation heights is elaborated in Section 4.3 in conjunction with the TKE level.
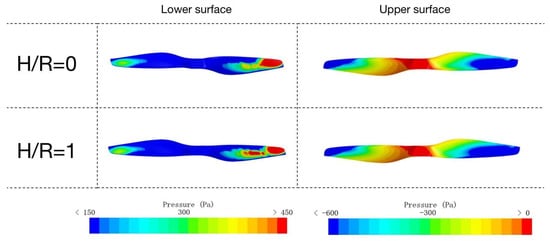
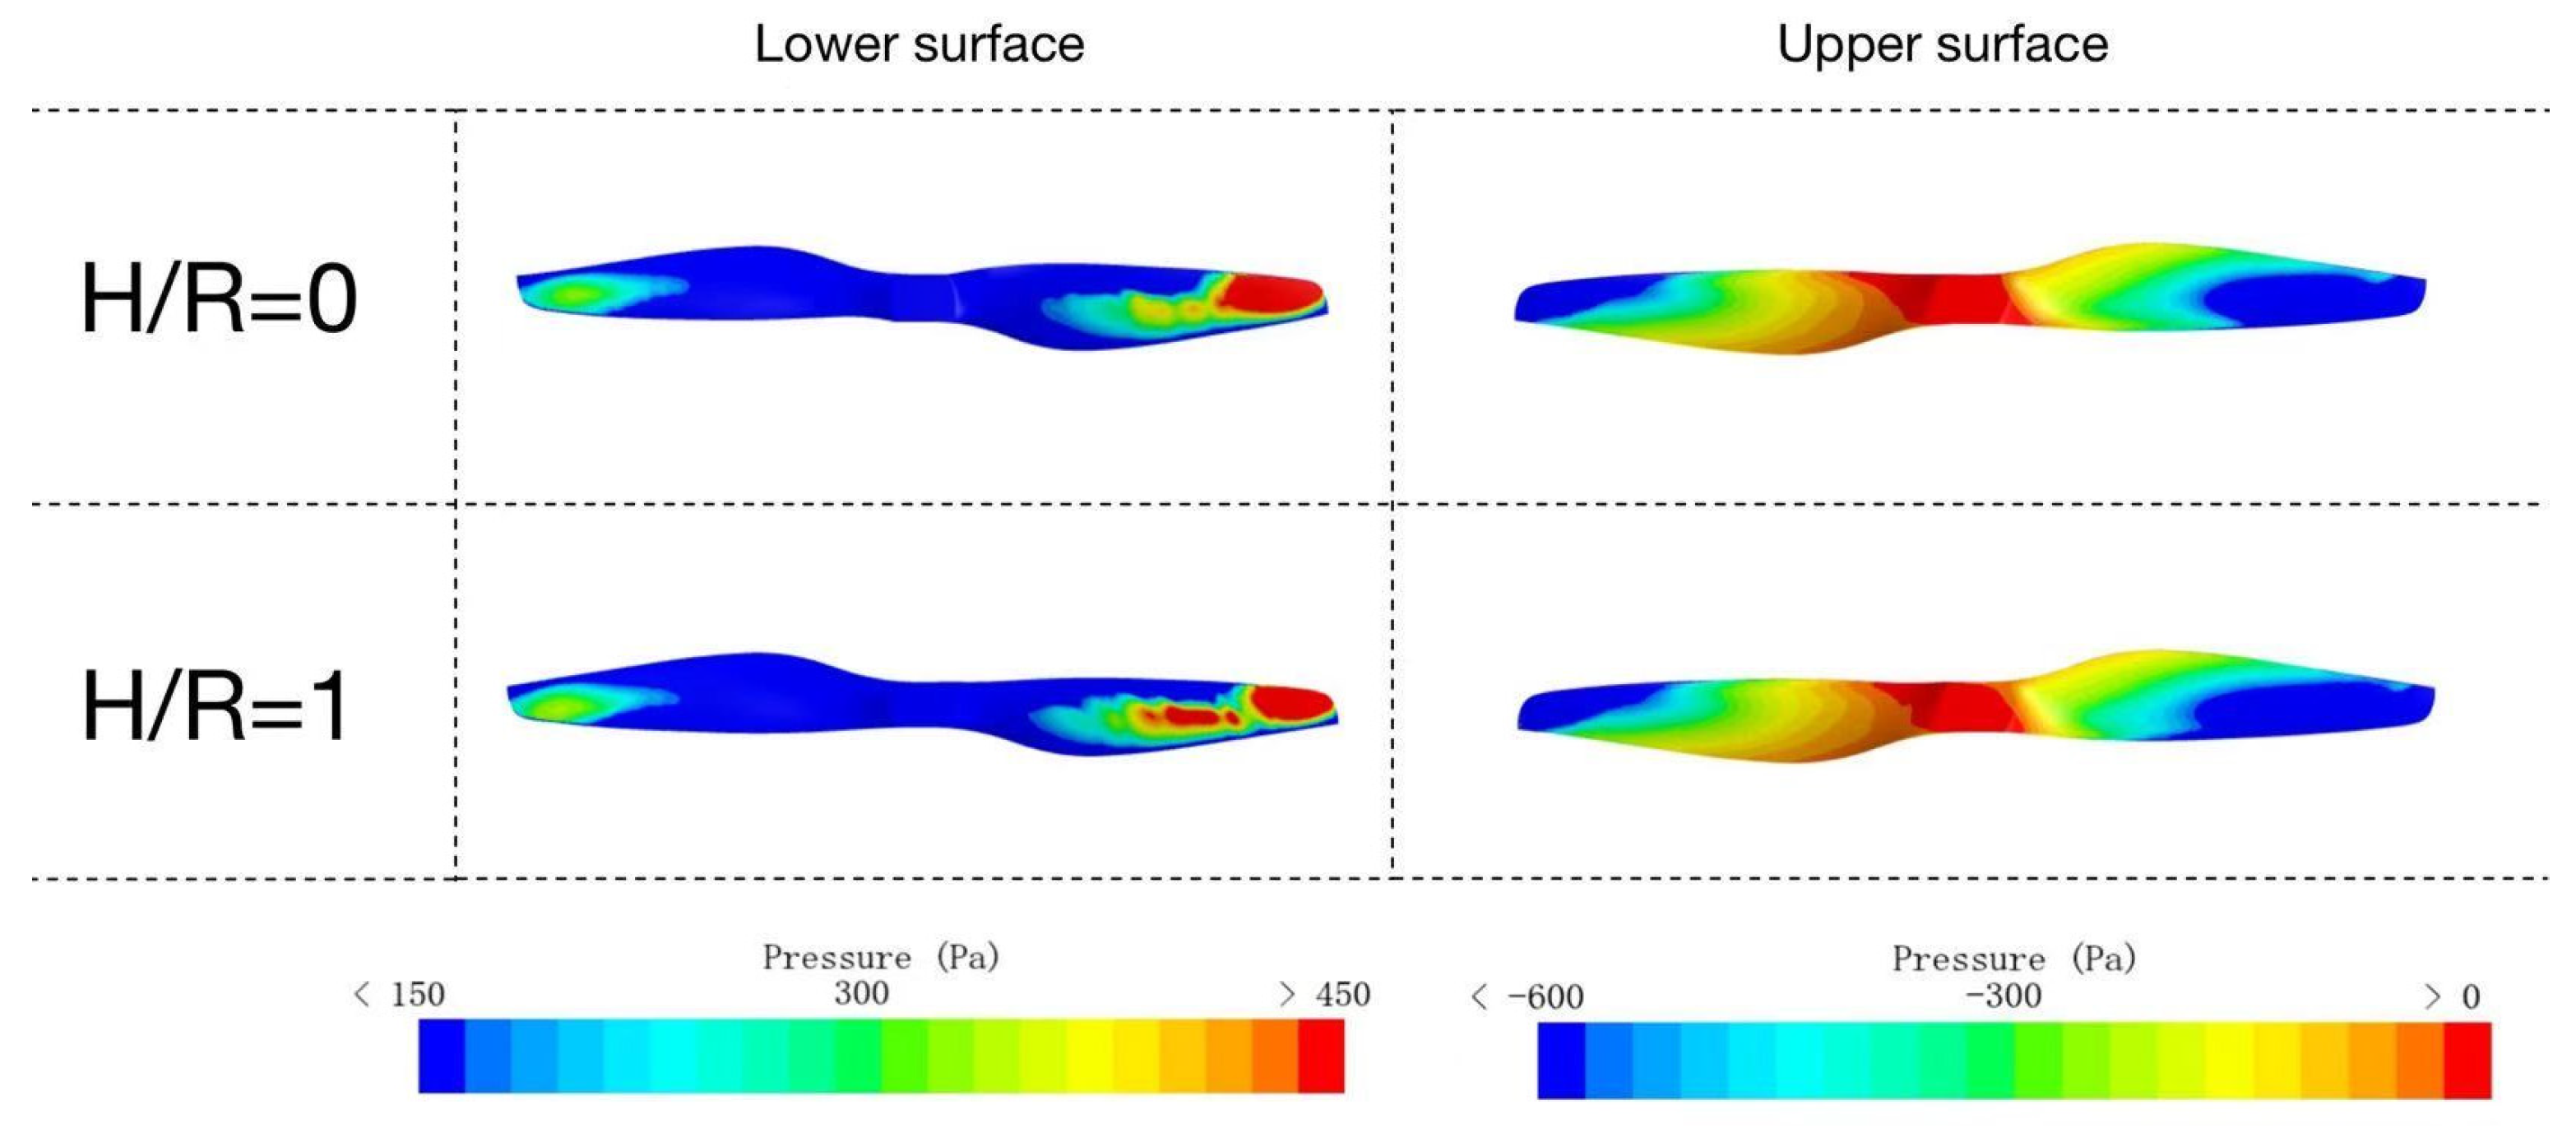
To quantitatively assess the influence of front-rotor blade tip vortices, the surface pressure distribution of the rear rotor is examined. As shown in Figure 13, when H/R = 1, the lower surface pressure of the rear rotor in the H/R = 1 configuration is increased, while the upper surface pressure is decreased. Thus, the H/R = 1 configuration exhibits a higher thrust coefficient. This improvement directly reflects the mitigation of PVI due to reduced overlap between the front-rotor wake and the rear rotor disk.
Figure 13.
Rotor Surface Pressure Distribution Diagrams Under Different Configurations.
4.2. Flow Field Characteristics
Rotor wake characteristics are closely associated with thrust performance, aerodynamic efficiency, vibration, and acoustic behavior. Therefore, this subsection focuses on the influence of vertical rotor spacing on the wake velocity field.
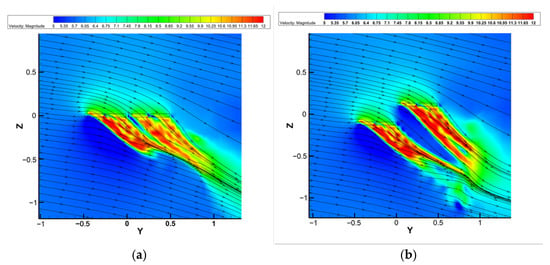
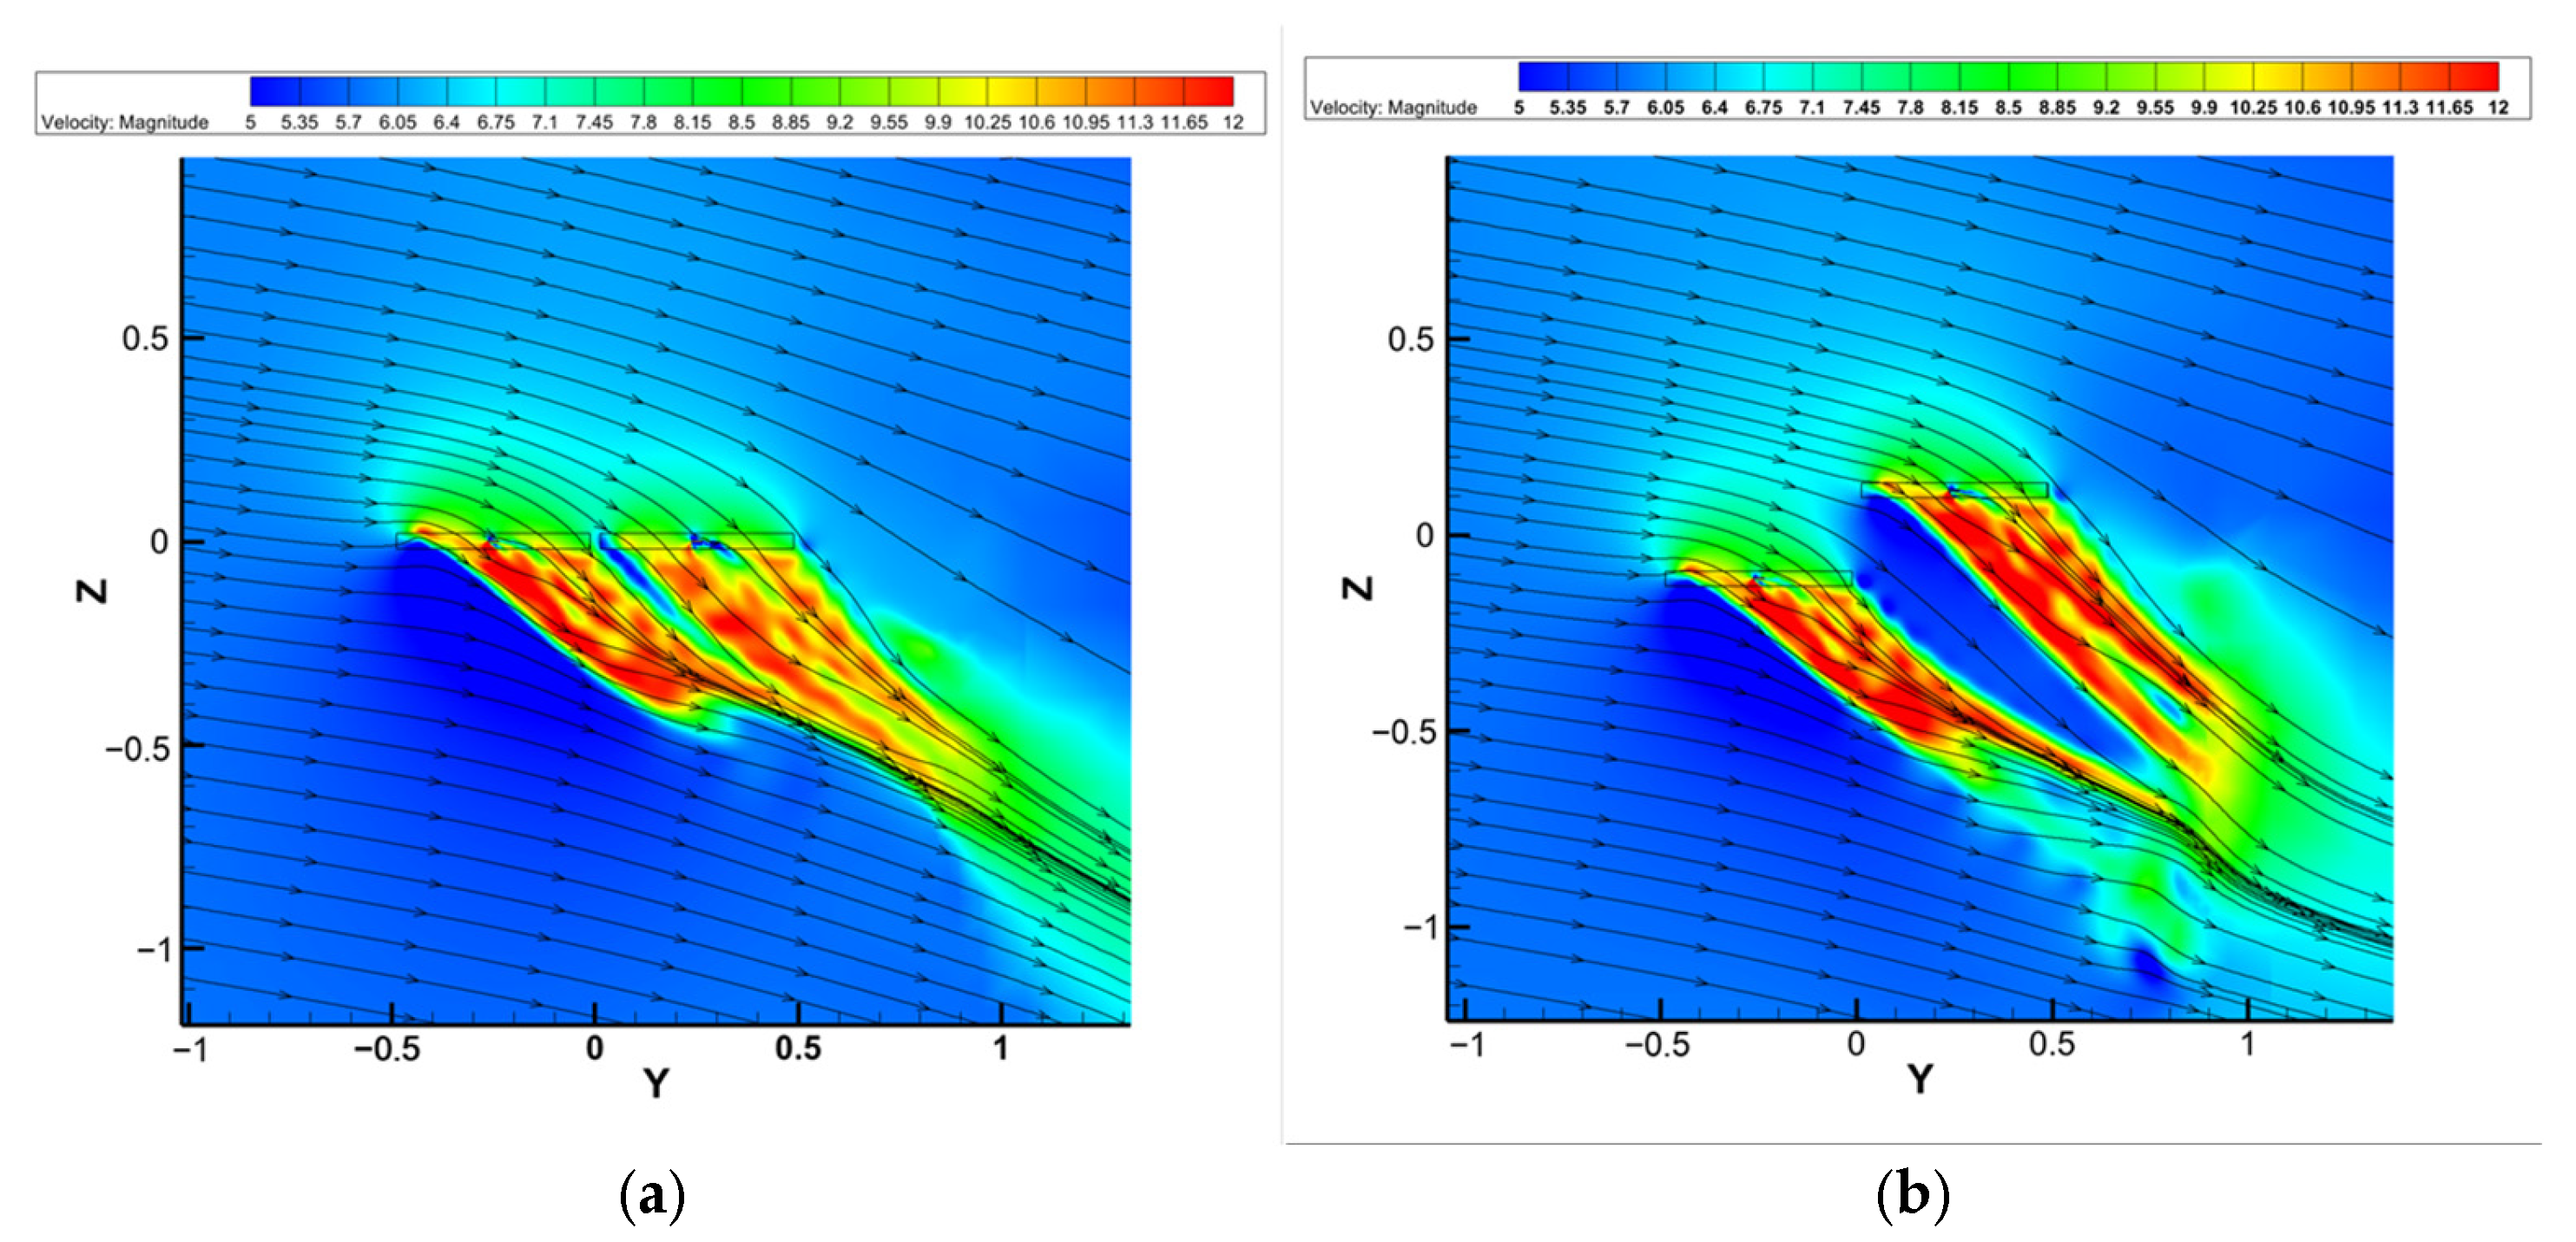
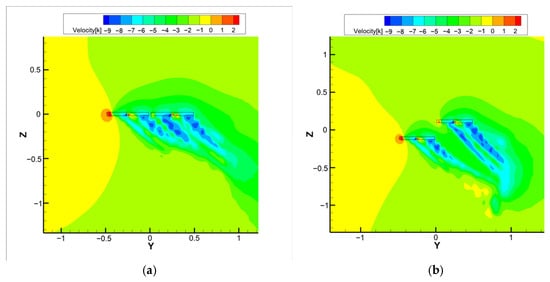
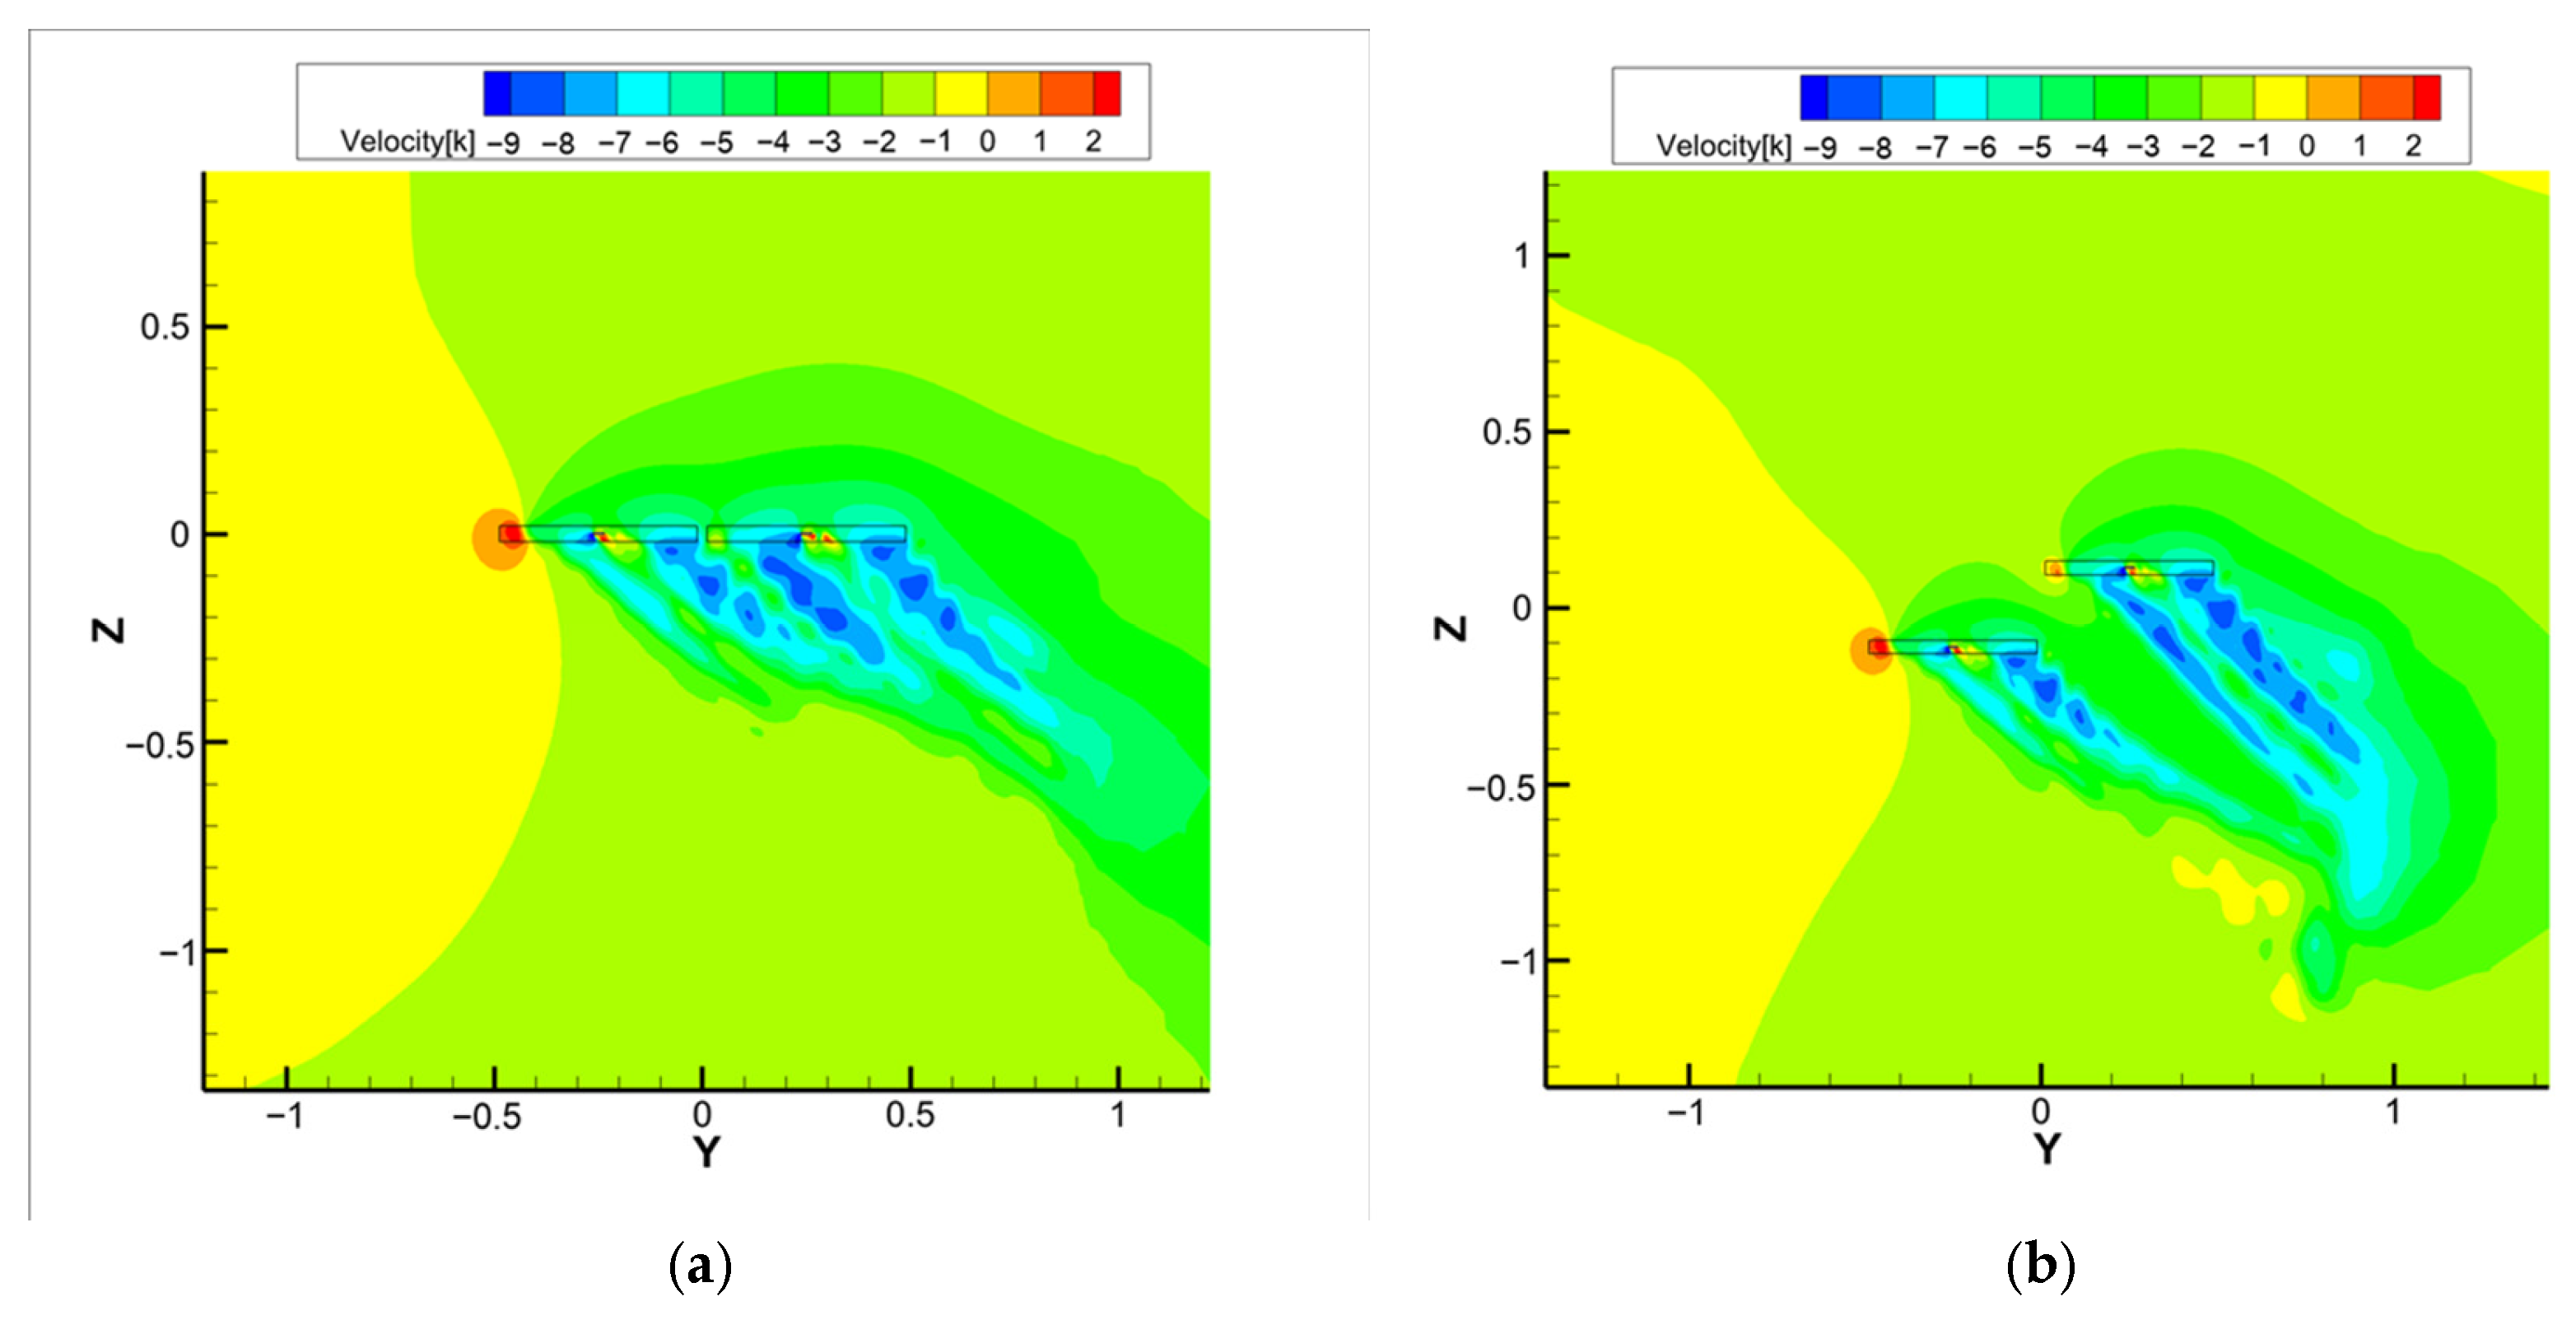
In the coplanar configuration (H/R = 0), the wake of the front rotor interacts strongly with the induced flow region of the rear rotor, as shown in Figure 14a. Owing to wake attraction effects, the front and rear rotor wakes merge downstream, forming a coupled wake structure. From the perspective of the front rotor, the rear rotor produces a weak aerodynamic gain through two mechanisms: (i) the low-pressure region upstream of the rear rotor disk draws flow from the upstream side of the front rotor, reducing its inflow pressure in a manner analogous to a ceiling effect; and (ii) the wake of the forward rotor interacts and merges with that of the rear rotor in the downstream area, which reduces the adverse pressure gradient of the forward rotor’s wake and thus increases the mass flow rate at the forward rotor disk. However, this gain is limited and diminishes progressively as H/R increases, which explains the gradual reduction in front-rotor thrust and power coefficients observed earlier. Nevertheless, the gain effect of the rear rotor on the front rotor in the present configuration is a numerical observation specific to the investigated operating conditions. The above discussion presents a plausible explanation for this phenomenon, and its generalizability requires further validation.
Figure 14.
Velocity Contours of Rotor Mid-Section. (a) H/R = 0. (b) H/R = 1.
In contrast, the rear rotor is subjected to adverse effects from the front rotor. Figure 14 illustrates the distribution of induction velocity on the symmetry plane. As seen in Figure 14b, downstream of the rear rotor, the induced velocity in the H/R = 0 configuration is noticeably lower than that in the H/R = 1 configuration. This indicates that the rear rotor operates under a more pronounced adverse pressure gradient in the H/R = 0 layout.
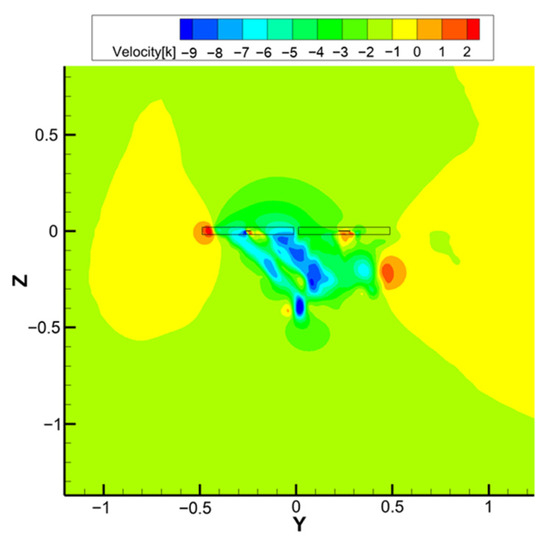
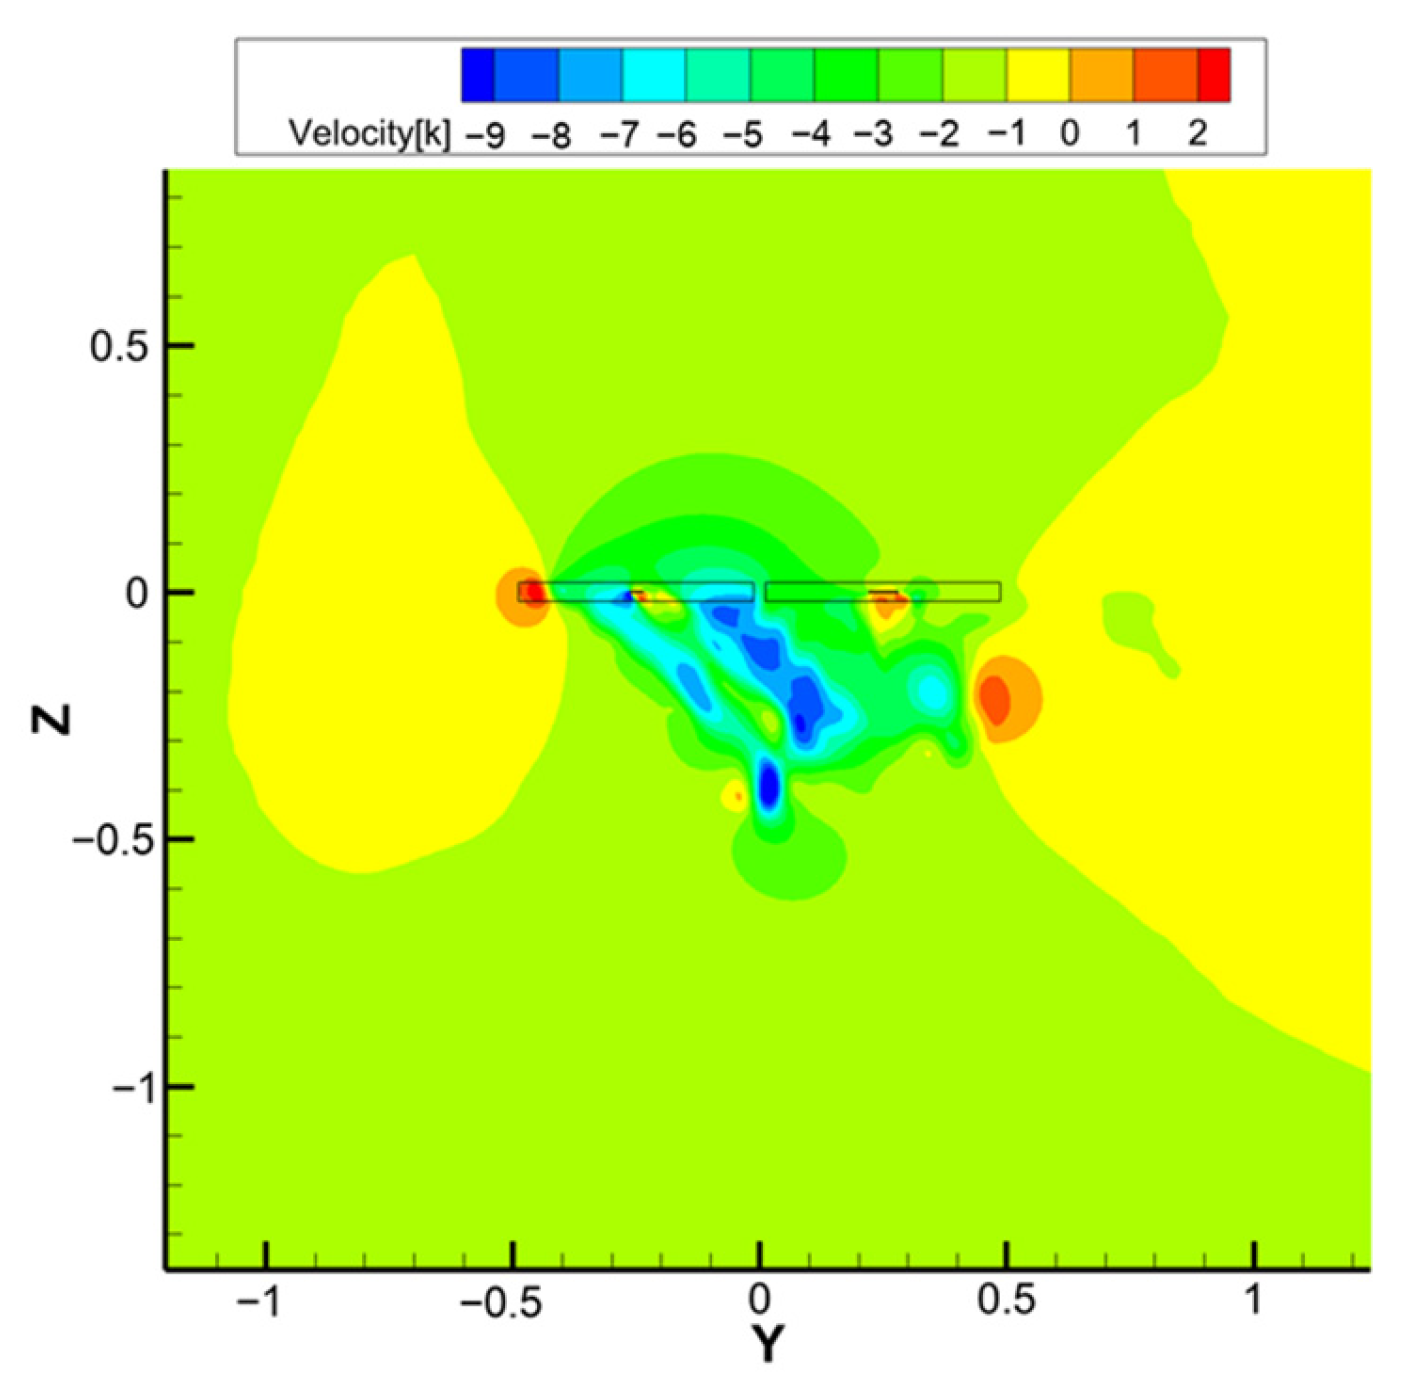
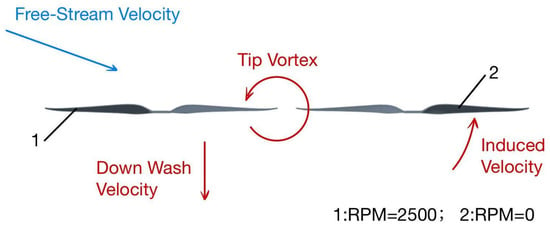
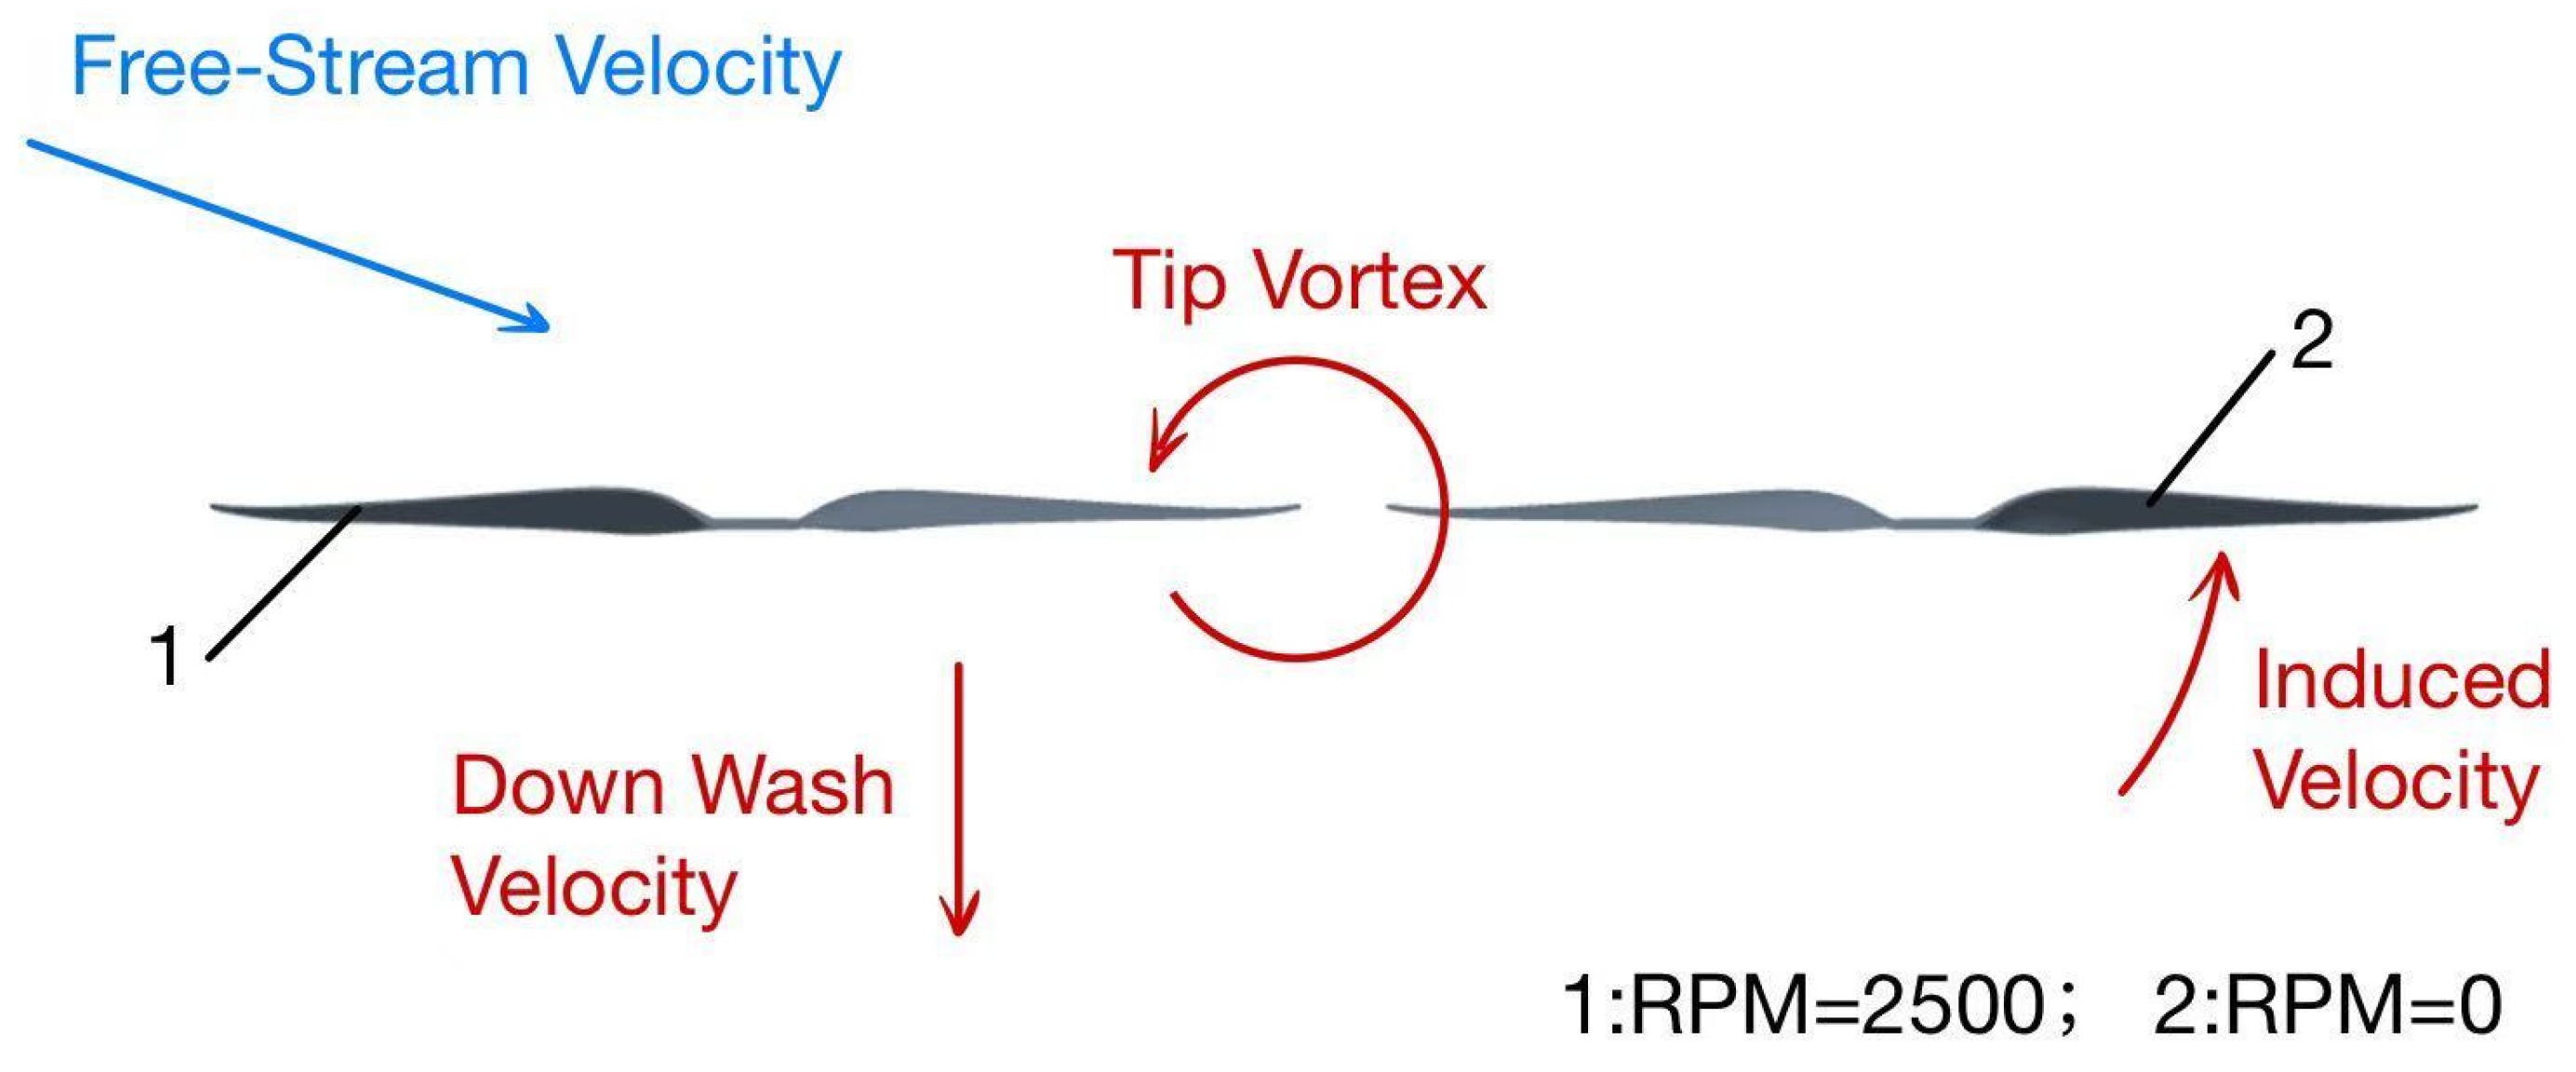
To further elucidate this behavior, axial velocity contours are examined. Figure 15a,b shows the contours of the axial velocity component of the flow field at H/R = 0 and H/R = 1, respectively. Figure 16 presents the contours of the axial velocity component when H/R = 0, but the rear rotor is stationary. Due to the induced velocity field of the front rotor, there exists an upwash below the rear rotor disk (the yellow and red regions in Figure 16), which coincides exactly with the wake of the downwash flow of the rear rotor (Figure 15a). This results in a larger adverse pressure gradient acting on the induced velocity downstream of the rear rotor, leading to a decrease in the downstream induced velocity of the rear rotor and thus a reduction in its thrust coefficient. In contrast, when H/R = 1, the wake of the rear rotor does not coincide with the core region of the upwash induced velocity from the front rotor, thereby improving the condition of the downstream flow field.
Figure 15.
Axial Velocity Contours of Rotor Mid-Section. (a) H/R = 0. (b) H/R = 1.
Figure 16.
Axial Velocity Contours of Rotor Mid-Section when the Rear Rotor is Stationary.
Figure 17 is a schematic diagram depicting the distribution of the induced velocity of the front rotor at the rear rotor position, which serves to clearly illustrate the origin of the red region below the rear rotor in Figure 16.
Figure 17.
Schematic Diagram of Induced Velocity from Front Rotor Blade Tip Vortices When the Rear Rotor is Stationary.
4.3. TKE Characteristics
The thrust performance of the rotor is a key indicator for evaluating the aircraft. In the following section, a comparison of rotor thrust variations over time between the H/R = 0 and H/R = 1 configurations is presented, as illustrated in Figure 18. Periodic oscillations in thrust are observed in both configurations, with nearly identical phases. However, the mean thrust in the H/R = 0 configuration is lower than that in the H/R = 1 configuration. Furthermore, while the maximum thrust values are comparable between the two layouts, the minimum thrust under the H/R = 0 condition is noticeably diminished, indicating the presence of stronger aerodynamic interactions within specific azimuthal ranges. Specifically, at H/R = 1, the thrust fluctuation coefficient (defined as (peak value−valley value)/mean value) is reduced by approximately 15.63% compared with that at H/R = 0. This has achieved the anticipated results.
Figure 18.
Thrust-Time Diagrams of the Rear Rotor at H/R = 0 and H/R = 1.
Maximum and minimum thrust values occurred at approximately 90° and 10° azimuth angles of the rear rotor, respectively. These phases correspond to the encounter and separation of the blade tip vortices from the front and rear rotors, which consequently induced notable unsteady loading effects. Turbulent kinetic energy (TKE) serves as a useful metric for assessing blade tip vortex interference, reflecting the intensity of turbulent fluctuations in the flow field. In this study, turbulent kinetic energy (TKE) is defined as one-half of the mean square value of turbulent velocity fluctuations per unit mass of fluid, and its physical implication refers to the kinetic energy carried by random motions in turbulence. In RANS simulations, TKE is directly obtained by solving the transport equation of turbulent kinetic energy. Therefore, visualization was performed for the TKE levels on the rotor disk plane.
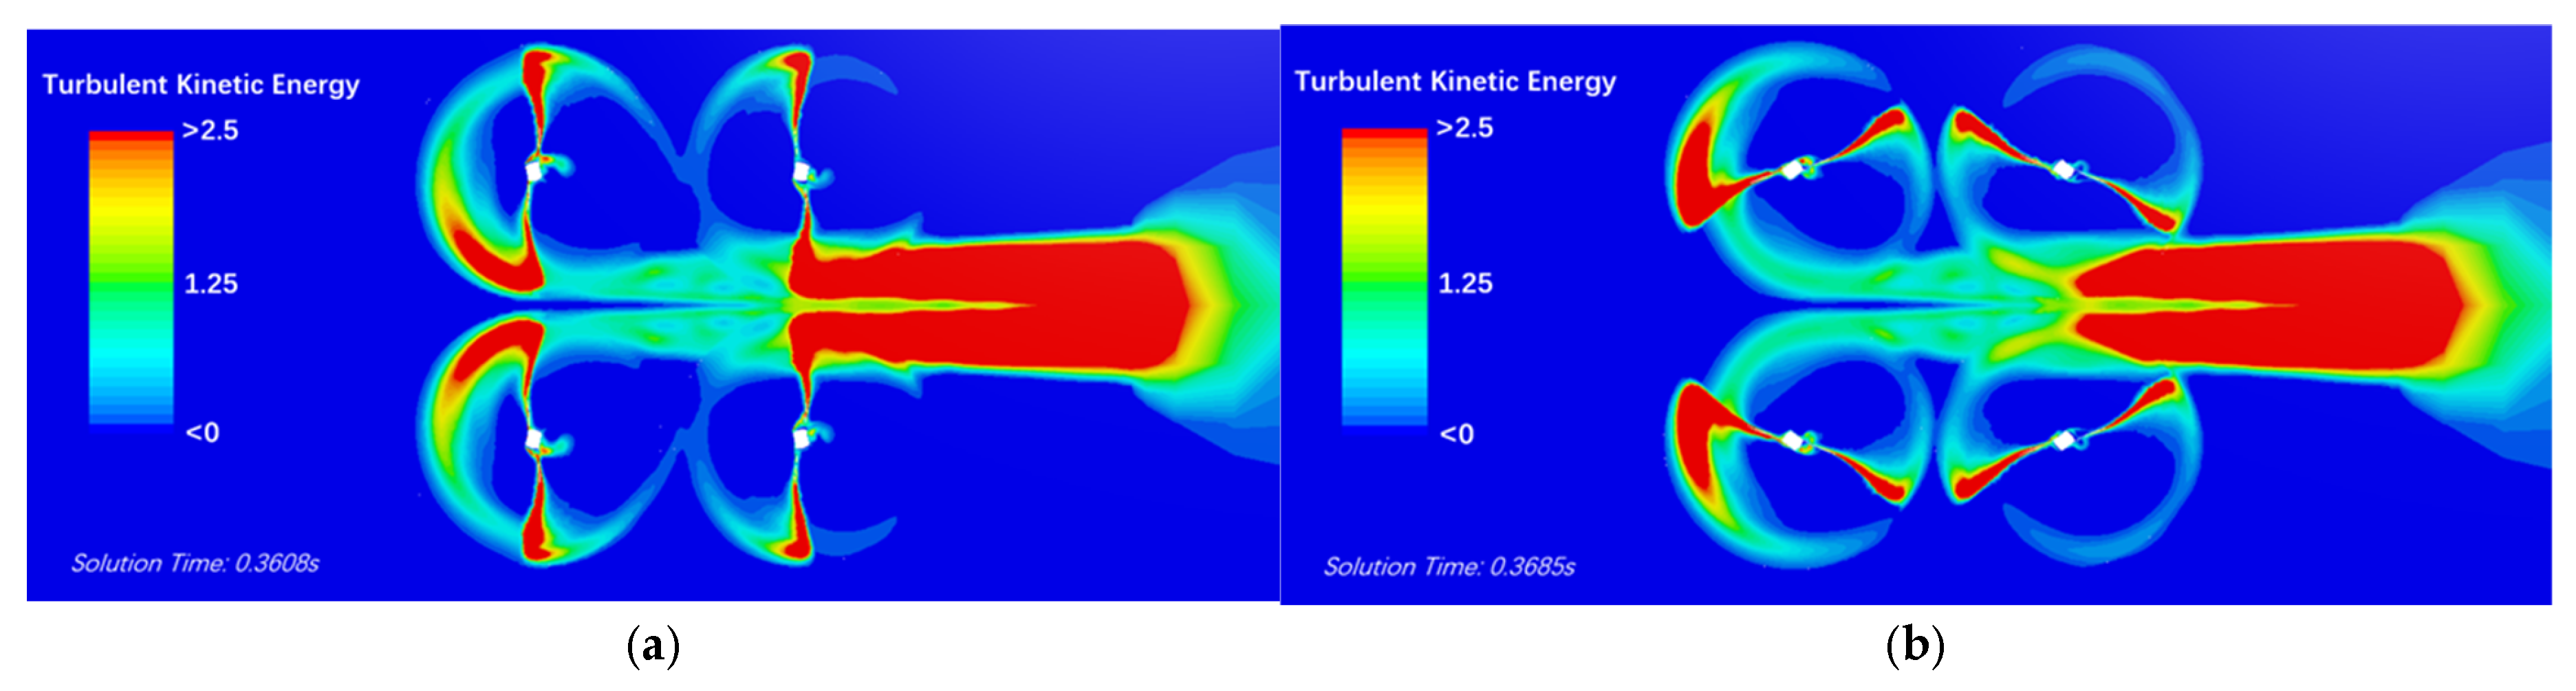
Figure 19a,b illustrate the distribution of TKE on the rotor disk plane for the H/R = 0 configuration. Figure 19a corresponds to the moment of maximum thrust on the rear rotor, while Figure 19b corresponds to the moment of minimum thrust on the rear rotor. Spatially, TKE is primarily concentrated in the mid-to-rear region of the quadrotor as well as near the rotor tips. For each rotor, the TKE near the tip on the side closer to the central region is relatively high, whereas it is lower on the tip farther from the center. This spatial non-uniformity in TKE distribution induces a bending moment on each rotor, and the periodic rotation of the rotors further excites cyclic vibrations.
Figure 19.
TKE Contours of the Rotor Disk Plane at H/R = 0. (a) At the Moment of Maximum Thrust of the Rear Rotor. (b) At the Moment of Minimum Thrust of the Rear Rotor.
For an individual rotor, the high TKE near the blade tip induces a noticeable loss of thrust when the rotor tips approach each other. Consequently, as the azimuth angle of the rear rotor increases from 90° to 180°, its thrust progressively decreases, reaching a minimum around 180°. When the rotor tips gradually move apart, the thrust steadily recovers and peaks near an azimuth angle of 90°.
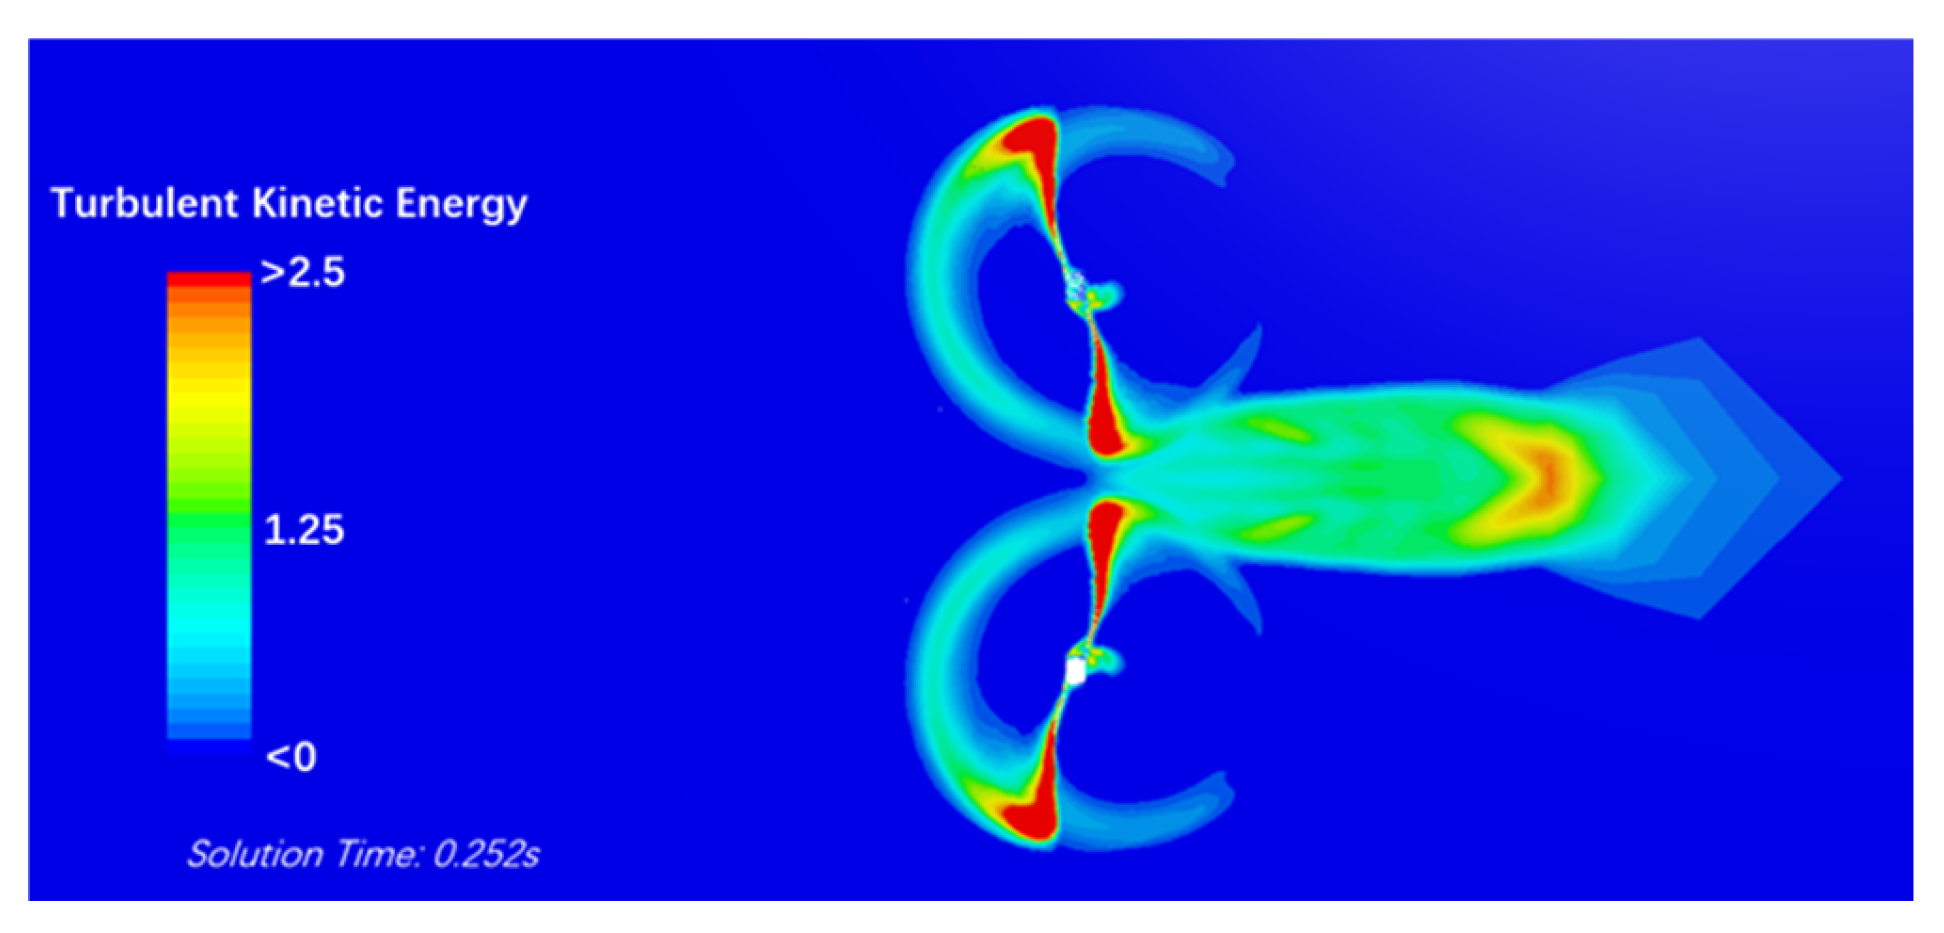
Figure 20 depicts the spatial distribution of TKE over the rotor disk plane of the rear rotor in the H/R = 1 configuration. The magnitude and pattern of TKE under this condition indicate that elevating the rear rotor by a distance equal to one rotor radius (R) effectively shields it from the pronounced influence of the high-TKE flow field induced by the front rotor. Consequently, the decrease in thrust experienced by the rear rotor within the azimuthal range of 90° to 180° is less pronounced compared to the H/R = 0 configuration. Similarly, beyond an azimuth angle of 180°, the thrust of the rear rotor begins to recover. Since the TKE levels remain relatively low throughout the azimuthal span of 0° to 90° and do not exhibit a strong dependence on H/R, the peak thrust in the H/R = 1 configuration is not significantly altered. This explains why the improvement in average thrust is achieved primarily by raising the minimum thrust rather than by enhancing the peak thrust value.
Figure 20.
TKE Contours of the Rear Rotor Disk Plane at H/R = 1.
It should be noted that TKE can reflect the overall level of turbulence intensity and vortex interaction, while unsteady loading is also influenced by factors such as vorticity magnitude and rotor surface pressure fluctuations. Additionally, it can be observed that in the coplanar configuration, the blade tip vortices from the front and rear rotors undergo strong vortex-vortex interaction, forming an entangled vortex network characterized by disrupted vortex cores and high unsteadiness. This leads to the extensive region of high turbulent kinetic energy observed downstream of the rotors. When H/R = 1, this entangled structure is substantially weakened, resulting in a noticeable reduction in the TKE within the wake. Specifically, the TKE levels in the wake region at H/R = 0 exceed 2.5 J/kg, whereas for H/R = 1, the TKE levels across the majority of the wake region are approximately 1.25 J/kg, corresponding to a significant reduction.
4.4. Evolution of Blade Tip Vortex Structures with H/R
The above analyses have demonstrated the significant influence of H/R on PVI, induced velocity, and TKE. This subsection further examines the evolution of blade tip vortex structures as H/R varies.
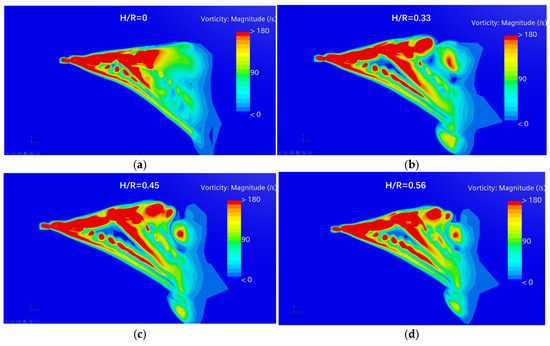
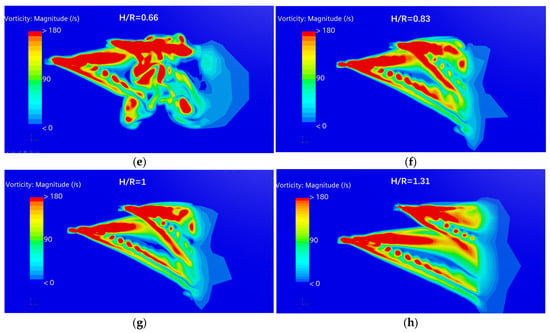
Figure 21 shows the vorticity contour plots of the main action plane of the blade tip vortex for H/R = 0, 0.33, 0.45, 0.56, 0.66, 0.83, 1, and 1.31, respectively. The plane is selected as the one where the 0.83r blade section is located at an azimuth angle of 90°. This position is the main thrust-contributing area of the blade and also the region where the blade tip vortex exerts a significant effect.
Figure 21.
Vorticity Contours of the 0.86R Section. (a) H/R = 0. (b) H/R = 0.33. (c) H/R = 0.45. (d) H/R = 0.56. (e) H/R = 0.66. (f) H/R = 0.83. (g) H/R = 1. (h) H/R = 1.31.
When the H/R ratio is less than approximately 0.56, the blade tip vortices generated by the front rotor directly intersect with the rear rotor disk, disrupting the bound vortex structure on the blades of the rear rotor. As the H/R ratio increases to about 0.66, the wake from the front rotor begins to detach from the plane of the rear rotor disk. However, it still interacts intensely with the blade tip vortices of the rear rotor, forming a densely interlaced vortex system accompanied by significant secondary vortex generation. This results in a highly unsteady behavior in the wake region.
When the H/R value exceeds 0.83, the wake vortices from the front rotor and the vortex system of the rear rotor become separated, leading to a significant reduction in vortex coupling strength. Consequently, the rate of thrust improvement for the rear rotor slows down, indicating that the benefits gained from further increasing H/R are diminishing.
At H/R = 1.31, the wake of the front rotor and the blade tip vortices of the rear rotor are nearly completely decoupled, with only weak vortex merging observed downstream. Secondary vortex structures are essentially absent, demonstrating that vortex-vortex interactions have been markedly reduced.
Overall, as the H/R ratio increases, the evolution of the vortex system exhibits three distinct phases: at low H/R, there is strong direct impingement and a closely entangled state; within a critical transitional range, vortex interactions rapidly diminish; and at higher H/R values, only weak downstream coupling occurs. This evolutionary process provides a coherent flow-field-level explanation for the previously observed thrust recovery and power loading trends. Importantly, H/R = 1 falls within a key range where vortex-rotor interactions have been substantially mitigated, while avoiding a significant reduction in the aerodynamic benefit of the front rotor due to excessive vertical separation. This confirms that, under the studied operating conditions, it represents a relatively optimal configuration.
5. Conclusions
- (1)
- The power loading performance of a quadrotor drone with a vertically elevated rear rotor was characterized. The axial spacing between the rotor disks of the quadrotor was varied from 0 to 1.97 R. Within the selected parameter range, the power loading coefficient of the front rotor exhibited a relatively weak negative correlation with H/R, while that of the rear rotor showed a positive correlation. The overall power loading coefficient of the vehicle reached its highest value at H/R = 1. At this point, the power loading of the rear rotor recovered substantially, while the performance loss of the front rotor remained effectively controlled.
- (2)
- The aerodynamic interference between rotors degrades their performance, characterized by a marginal beneficial effect of the rear rotor on the front rotor and a significant detrimental effect of the front rotor on the rear rotor. The thrust and power of the rear rotor are more sensitive to configuration changes. This is because it operates partially or fully within the wake of the front rotor, and the flow field downstream of the rear rotor is influenced by the upwash induced by the front rotor.
- (3)
- The downstream vortex system exhibits notable sensitivity to variations in H/R across a certain range. Specifically, when H/R is less than 0.83, the blade tip vortices from the front rotor and those from the rear rotor in the downstream flow field form a densely intertwined vortex system, accompanied by substantial secondary vortex generation. In contrast, when H/R reaches 1.31, the wake of the front rotor and the blade tip vortices of the rear rotor become almost completely decoupled.
- (4)
- The blade tip vortices generated by the rotor lead to a significant increase in TKE levels within the surrounding flow region. When high-TKE airflow impinges on the rotor, it disrupts the bound vortex structure on the rotor surface. As a result, the aerodynamic performance of the rotor shows a strong negative correlation with the local TKE intensity in its operating environment. Thrust reaches its peak when the tips of adjacent rotor blades are closest, after which the increased TKE disrupts the bound vortex structure, causing thrust to decline. As the blade tips move apart, thrust gradually recovers. This process collectively gives rise to the observed periodic fluctuations in thrust output.
Beyond aerodynamic efficiency, the reduction in turbulent kinetic energy (TKE) achieved by elevating the rear rotor carries significant engineering implications. Lower TKE levels can mitigate periodic loading fluctuations on the rotor blades, potentially reducing bending moments, vibration amplitudes, and fatigue accumulation. This suggests that in compact multi-rotor drone design, a vertically offset configuration not only offers aerodynamic benefits but also provides a promising pathway for enhancing structural integrity and lowering maintenance demands.
In summary, this study elucidates the role of the vertical spacing ratio H/R in modulating the aerodynamic performance and flow-field structure of a quadrotor drone. By revealing the underlying vortex interaction mechanisms and establishing correlations between performance metrics and flow characteristics, the findings identify the H/R = 1 configuration under the specific operating conditions investigated (single RPM, 10° inflow angle, fixed forward-flight speed). H/R = 1 yields the highest aerodynamic efficiency among the configurations tested. It should be clearly stated that the simulation is only targeted at the forward flight condition with a 10° angle of attack, does not account for hovering or high-angle-of-attack conditions, and has not yet evaluated the impacts of different advance ratios and rotor radial spacings on the overall performance of the aircraft. Therefore, the design of such drones warrants further investigation in future studies. For instance, assessing the influence of parameters such as the radial spacing ratio and the advance ratio on overall performance, as well as examining their corresponding flow-field changes, should be carried out. Such work would contribute to a comprehensive evaluation of the aerodynamic behavior of drones with a vertically elevated rear rotor and inform the design of future configurations with high power loading.
Author Contributions
Conceptualization, H.Z.; Methodology, H.Z.; Software, Q.Z.; Validation, H.Z., X.Y. and Y.Y.; Formal analysis, H.Z. and X.Y.; Investigation, H.Z., X.Y. and X.W.; Resources, H.N., X.W. and Y.Y.; Data curation, H.Z.; Writing—original draft, X.Y.; Writing—review & editing, H.Z.; Visualization, X.Y.; Supervision, H.Z., H.N. and X.W.; Project administration, H.Z., H.N., X.W., Q.Z. and Y.Y.; Funding acquisition, H.Z., H.N. and Q.Z. All authors have read and agreed to the published version of the manuscript.
Funding
This research was funded by the National Natural Science Foundation of China (He Zhu, No. 52572409; Hong Nie, No. 52275114), National Key Laboratory of Helicopter Aeromechanics Foundation (He Zhu, No. ZAG2500624), and the Fundamental Research Funds for the Central Universities (He Zhu, No. 1001-XAC25003).
Data Availability Statement
The authors confirm that the data supporting the findings of this study are available within this article.
Conflicts of Interest
The authors declare no conflicts of interest.
Abbreviations
The following abbreviations are used in this manuscript:
| CCW | Counterclockwise |
| CW | Clockwise |
| DES | Detached Eddy Simulation |
| H/R | Height-to-Radius Ratio |
| N-S | Navier–Stokes Equations |
| PVI | Vortex-Propeller Interaction |
| RANS | Reynolds-Averaged Navier–Stokes |
| LES | Large Eddy Simulation |
| TKE | Turbulent Kinetic Energy |
| VRS | Vortex Ring State |
References
- Mohsan, S.A.H.; Othman, N.Q.H.; Khan, M.A.; Amjad, H.; Żywiołek, J. A Comprehensive Review of Micro UAV Charging Techniques. Micromachines 2022, 13, 977. [Google Scholar] [CrossRef] [Scilit] [PubMed]
- Kim, J.S.A.; Gadsden, S.A.; Wilkerson, S.A. A comprehensive survey of control strategies for autonomous quadrotors. Can. J. Electr. Comput. Eng. 2019, 43, 3–16. [Google Scholar] [CrossRef] [Scilit]
- Selis, L.A.; Velazco-Lorenzo, D.; Quillas, J.; Galvez-Aranda, D.E. Electronic Structure and Binding Characteristics of Ionic Liquid Ions on Li-Metal Surfaces Through a DFT Approach. Crystals 2025, 15, 928. [Google Scholar] [CrossRef] [Scilit]
- Aziz, A.; Shi, Y. Impact of Rotor-to-Rotor Interactions on the Tonal Noise Characteristics of Different Octocopter Configurations. Aerospace 2024, 11, 1022. [Google Scholar] [CrossRef] [Scilit]
- Lei, Y.; Zhao, X. The Aerodynamic Performance of a Novel Overlapping Octocopter in Hover. Aerospace 2024, 11, 737. [Google Scholar] [CrossRef] [Scilit]
- Li, H.; Chen, Z.; Jia, H. Experimental Investigation on Hover Performance of a Ducted Coaxial-Rotor UAV. Sensors 2023, 23, 6413. [Google Scholar] [CrossRef] [Scilit]
- Giljarhus, K.E.T.; Porcarelli, A.; Apeland, J. Investigation of Rotor Efficiency with Varying Rotor Pitch Angle for a Coaxial Drone. Drones 2022, 6, 91. [Google Scholar] [CrossRef] [Scilit]
- Gan, W.; Wang, Y.; Wang, H.; Zhuang, J. Aerodynamic Investigation on a Coaxial-Rotors Unmanned Aerial Vehicle of Bionic Chinese Parasol Seed. Biomimetics 2024, 9, 403. [Google Scholar] [CrossRef] [Scilit]
- Ramasamy, M. Hover Performance Measurements Toward Understanding Aerodynamic Interference in Coaxial, Tandem, and Tilt Rotors. J. Am. Helicopter Soc. 2015, 60, 17. [Google Scholar] [CrossRef] [Scilit]
- Otsuka, H.; Nagatani, K. Pitching Moment Caused by Rotor Flow Interference on a Small Quad-rotor Unmanned Aerial Vehicle in a Uniform Flow. Trans. Jpn. Soc. Aeronaut. Space Sci. 2018, 61, 87–96. [Google Scholar] [CrossRef] [Scilit]
- Arslan, K.M.; Zhao, L.; Xue, K. Investigation of Aerodynamic Interference Between Vertically Aligned Quadcopters at Varying Rotor Speeds and Separations. Drones 2025, 9, 712. [Google Scholar] [CrossRef] [Scilit]
- Barcelos, D.; Kolaei, A.; Bramesfeld, G. Aerodynamic Interactions of Quadrotor Configurations. J. Aircr. 2020, 57, 1074–1090. [Google Scholar] [CrossRef] [Scilit]
- Misiorowski, M.; Gandhi, F.; Oberai, A.A. Computational Study on Rotor Interactional Effects for a Quadcopter in Edgewise Flight. AIAA J. 2019, 57, 5309–5319. [Google Scholar] [CrossRef] [Scilit]
- Herz, S.; Atte, A.; Seth, D.; Rauleder, J.; McCrink, M. Effects of rotor-rotor and rotor-body interactions on quadrotor vehicle performance for multiple flight configurations. Aerosp. Sci. Technol. 2025, 158, 14. [Google Scholar] [CrossRef] [Scilit]
- Chae, S.; Lee, S.; Kim, J. Effects of rotor-rotor interaction on the wake characteristics of twin rotors in axial descent. J. Fluid Mech. 2022, 952, 27. [Google Scholar] [CrossRef] [Scilit]
- Durán-Delfin, J.E.; Garcia-Beltrán, C.D.; Guerrero-Sánchez, M.E.; Valencia-Palomo, G.; Hernández-González, O. Modeling and Passivity-Based Control for a convertible fixed-wing VTOL. Appl. Math. Comput. 2024, 461, 13. [Google Scholar] [CrossRef] [Scilit]
- Osman, M.; Xia, Y.Q.; Mahdi, M.; Ahmed, A. Hybrid VTOL UAV technologies: Efficiency, customization, and sector-specific applications. Alex. Eng. J. 2025, 120, 13–49. [Google Scholar] [CrossRef] [Scilit]
- Throneberry, G.; Takeshita, A.; Hocut, C.M.; Shu, F.; Abdelkefi, A. Wake Propagation and Characteristics of a Multi-Rotor Unmanned Vehicle in Forward Flight. Drones 2022, 6, 130. [Google Scholar] [CrossRef] [Scilit]
- Combey, K.; Elsayed, O.A.; Qaissi, K.; Chouiyakh, H.; Mustapha, F. Numerical Analysis of Multirotor Aerodynamic Interactions in Forward and Transition Flight. J. Aircr. 2025, 17, 1–17. [Google Scholar] [CrossRef] [Scilit]
- Kostek, A.A.; Braukmann, J.N.; Lößle, F.; Visingardi, A.; Boisard, R.; Gardner, A.D. Influence of vertical rotor spacing on aerodynamic efficiency of quadcopter configurations. CEAS Aeronaut. J. 2025, 16, 123–137. [Google Scholar] [CrossRef] [Scilit]
- Zhu, H.; Du, Y.H.; Nie, H.; Wei, S.X.; Wei, X.H. Aerodynamic interactions of staggered counter-rotating rotor system. Chin. J. Aeronaut. 2025, 38, 15. [Google Scholar] [CrossRef] [Scilit]
- Aybay, O. Time-Conservative Finite-Volume Method with Large-Eddy Simulation for Computational Aeroacoustics. Ph.D. Thesis, Durham University, Durham, UK, 2010. [Google Scholar]
- Jiang, H.Y.; Cheng, L.; He, F.; Guo, Z.; Cai, Y.; Cen, Z.J.; Wang, L.Z. Wall boundary conditions for RANS modelling of unidirectional and oscillatory boundary-layer flows. Ocean Eng. 2024, 312, 12. [Google Scholar] [CrossRef] [Scilit]
- Biava, M.; Vigevano, L. Simulation of a complete helicopter: A CFD approach to the study of interference effects. Aerosp. Sci. Technol. 2012, 19, 37–49. [Google Scholar] [CrossRef] [Scilit]
- Somashekar, V.; Vinod, L. Predicting the high-angle-of-attack characteristics of an airfoil for micro/unmanned aerial vehicle applications. Int. J. Fluid Eng. 2025, 2, 023101. [Google Scholar] [CrossRef] [Scilit]

Disclaimer/Publisher’s Note: The statements, opinions and data contained in all publications are solely those of the individual author(s) and contributor(s) and not of MDPI and/or the editor(s). MDPI and/or the editor(s) disclaim responsibility for any injury to people or property resulting from any ideas, methods, instructions or products referred to in the content. |
© 2026 by the authors. Licensee MDPI, Basel, Switzerland. This article is an open access article distributed under the terms and conditions of the Creative Commons Attribution (CC BY) license.