


Abstract
Climate change presents serious challenges, especially in dry and semi-dry areas, and these challenges are most severe in sub-Saharan Africa, where people are dependent on rain-fed agriculture. To address this issue, a new type of reinforcement learning (RL) mechanism that can be used to simulate and optimize climate adaptation policies in Kitui County, Kenya, was developed. In this study, combined geospatial data encompassing several variables, such as precipitation, the health of vegetation, population, and economic indicators, were used to create a custom reinforcement learning environment. A Deep Q-Network (DQN) agent was developed to distribute restricted financial resources amongst nine climate adaptation policies over a 25-year simulation period. The findings clearly show that the artificial intelligence agent targeted the long-term sustainability of the ecosystem. In connection to this, it made the choice of agroforestry in 76.0% of its decision cycles, and at the same time, it tactically bypassed high-capital, high-latency infrastructure such as dams and opted for distributed adaptive measures. This framework provides a powerful tool to support policymakers in a data-driven manner to analyze the interdependence of urgent aid and sustainable development. The study demonstrates the possibilities of using AI-powered decision support systems in the field of climate policy planning for the areas most affected by climate change.
1. Introduction
Climate change disproportionately threatens food security and livelihoods in arid and semi-arid lands, particularly in sub-Saharan Africa, where increasing frequencies of droughts and rainfall anomalies undermine agricultural productivity. In response, climate-resilient agriculture (CRA) has emerged as a vital mitigation strategy [1]. However, widespread implementation of CRA is constrained by a significant adaptation financing gap, estimated to be hundreds of billions of dollars per year, with local governments in emerging economies suffering much of this burden [2]. In Kenya, arid and semi-arid lands constitute approximately 80% of the country’s landmass and are home to over 10 million people, predominantly pastoralists and agro-pastoralists whose livelihoods depend on climate-sensitive natural resources [3]. These regions are characterized by elevated levels of water scarcity, erratic rainfall patterns, and frequent droughts that have intensified in frequency and severity due to anthropogenic climate change [4]. The impacts extend beyond immediate food insecurity to encompass long-term poverty traps, resource-based conflicts, and forced migration [5].
Kitui County, located in the eastern region of Kenya, exemplifies these challenges. With an estimated population of 2.1 million (2023), the county experiences annual rainfall ranging from 350 mm to 1000 mm in highly unreliable bimodal patterns [6]. Over 70% of the population depends directly on rain-fed agriculture and livestock production, making them extraordinarily vulnerable to climate shocks. Traditional policy planning in developing countries relies on static cost–benefit analysis that fails to capture the non-linear, compounding feedback loops between climate shocks, human capital, and infrastructure degradation [7]. Common challenges include data scarcity and quality issues at local scales, short-term planning horizons that focus on long-term resilience building, resource constraints requiring careful prioritization, and the inherent complexity of climate–society interactions that defy simple linear modeling [8,9].
Recent advances in artificial intelligence (AI) and machine learning offer transformative potential for climate policy and adaptation planning [10]. Reinforcement learning (RL) has emerged as a powerful approach for sequential decision-making problems characterized by uncertainty and long-term consequences [11]. Several studies have applied RL to environmental management challenges, including water resource management and reservoir operations [12], agricultural planning under climate uncertainty [13], and climate risk adaptation pathways [14]. However, few studies on climate-resilient agriculture, financial management, and policy adaptation RL frameworks exist.
By framing adaptation policy as a sequential decision-making problem, deep reinforcement learning (DRL) can simulate millions of policy trajectories to identify optimal, dynamic intervention strategies [15]. This study presents an AI-powered decision support framework for climate adaptation that integrates multi-modal EO data with a simulation of the socio-ecological environment of Kitui County, Kenya, demonstrating how DRL can uncover hidden synergies between financial management and CRA, and providing actionable, scalable insights for policymakers and international climate funds. It further addresses the gap in integrating satellite data from Earth Observation with RL for multi-sectoral climate policy optimization at the sub-national level in Africa. By calibrating this model with EO data of Kitui County, this research demonstrates how advanced data science can align public finance, localized water infrastructure, and climate-smart agriculture to foster resilient dryland systems.
2. Data and Methodology
This study integrates three core components: (i) an Earth Observation data pipeline to establish biophysical and socio-economic baselines; (ii) a custom reinforcement learning environment simulating regional dynamics; and (iii) a Deep Q-Network agent trained to optimize policy interventions.
2.1. Earth Observation Data Pipeline
To establish the simulation to reflect real-world conditions, historical environmental and socio-economic data for Kitui County were extracted via the GEE (Google Earth Engine) Python (version 3) API from 2009 to 2024.
- Hydro-climatic Data: Daily precipitation from the CHIRPS (Climate Hazards Group InfraRed Precipitation with Station data) dataset at a 0.05° resolution was aggregated to calculate annual rainfall and derive a Rainfall Anomaly Index to simulate drought shocks.
- Vegetation Health Data: This included data from the Normalized Difference Vegetation Index (NDVI) from MODIS (MOD13A2) at 1 km resolution, averaged annually. NDVI values range from −1 to 1, with higher scores indicating healthier vegetation.
- Population Data: Gridded estimates from WorldPop at a 100 m resolution provided demographic baselines. Due to data gaps, manual data from official Kenya National Bureau of Statistics figures and projected values were used to supplement the gaps or zero values for Kitui County.
- Economic Data (Poverty Rate): The poverty rate was simulated as a baseline trend (declining from 50% in 2010 to 0.5% per year, capped at 20%), disrupted by climate anomalies, due to limited EO-derived poverty metrics.
2.2. Reinforcement Learning Environment Framework
The climate policy simulation process was developed as a Markov Decision Process (MDP), defined by the tuple (S, A, P, R, γ) [16], and implemented using the gymnasium library. The gymnasium environment was developed to model Kitui County socio-environmental dynamics.
- State Space (St ∈ R^9): The state space included a continuous vector representing the region’s status at year t: [Current Year, Budget, Poverty Rate, Population, Rainfall Anomaly, Health Infrastructure, Education Level, Agroforestry Level, Dam Progress].
- Action Space (At ∈ {0, 1, …, 8}): The action space represented 9 mutually exclusive annual policy interventions: 0 (Do Nothing), 1 (Build Irrigation Systems), 2 (Subsidize Drought-Resistant Crops), 3 (Develop Early Warning Systems), 4 (Fund Microfinance Loans), 5 (Invest in Community Health), 6 (Invest in Education), 7 (Agroforestry / Mangrove Restoration), 8 (Build a Water Reservoir (Dam)).
- Transition Dynamics (P): The actions incur specific budget costs and alter state variables. For instance, education and agroforestry act as buffer variables, multiplicatively reducing the negative impact of future climate shocks and generating compounding socio-economic returns. The transition function can be represented using transition dynamics.
- Reward Function (Rt): The reward function represented a multi-objective shaping function designed to align with Sustainable Development Goals (SDGs). It rewards poverty reduction, penalizes budget deficits, and provides substantial terminal bonuses for the accumulation of long-term resilience capital (e.g., completed infrastructure, high agroforestry coverage). The transition and reward function is given as follows:
Climate impact:
Then define the dam-drought indicator as:
where if the dam is completed; otherwise, it is 0. So only when the dam is completed and the year is a drought year.
Net impact:
Poverty rate change:
where
Budget change:
Reward:
where = poverty rate (%), = budget, = education, agroforestry, and health levels (0–10), = rainfall in year (mm; historical CHIRPS value, or simulated future value), = action chosen, = action cost, = direct climate mitigation, = direct poverty reduction, = rainfall anomaly, = reward function, = dam completion indicator, = dam-drought indicator, = model year (timestep) ), and = historical county-mean rainfall (mm), the mean of all years preceding .
All transition coefficients, reward weights, and action costs are modeling assumptions calibrated to produce plausible dynamics for a semi-arid county context; they are not estimated from econometric data.
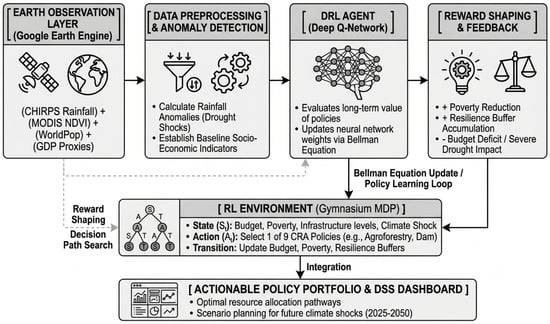
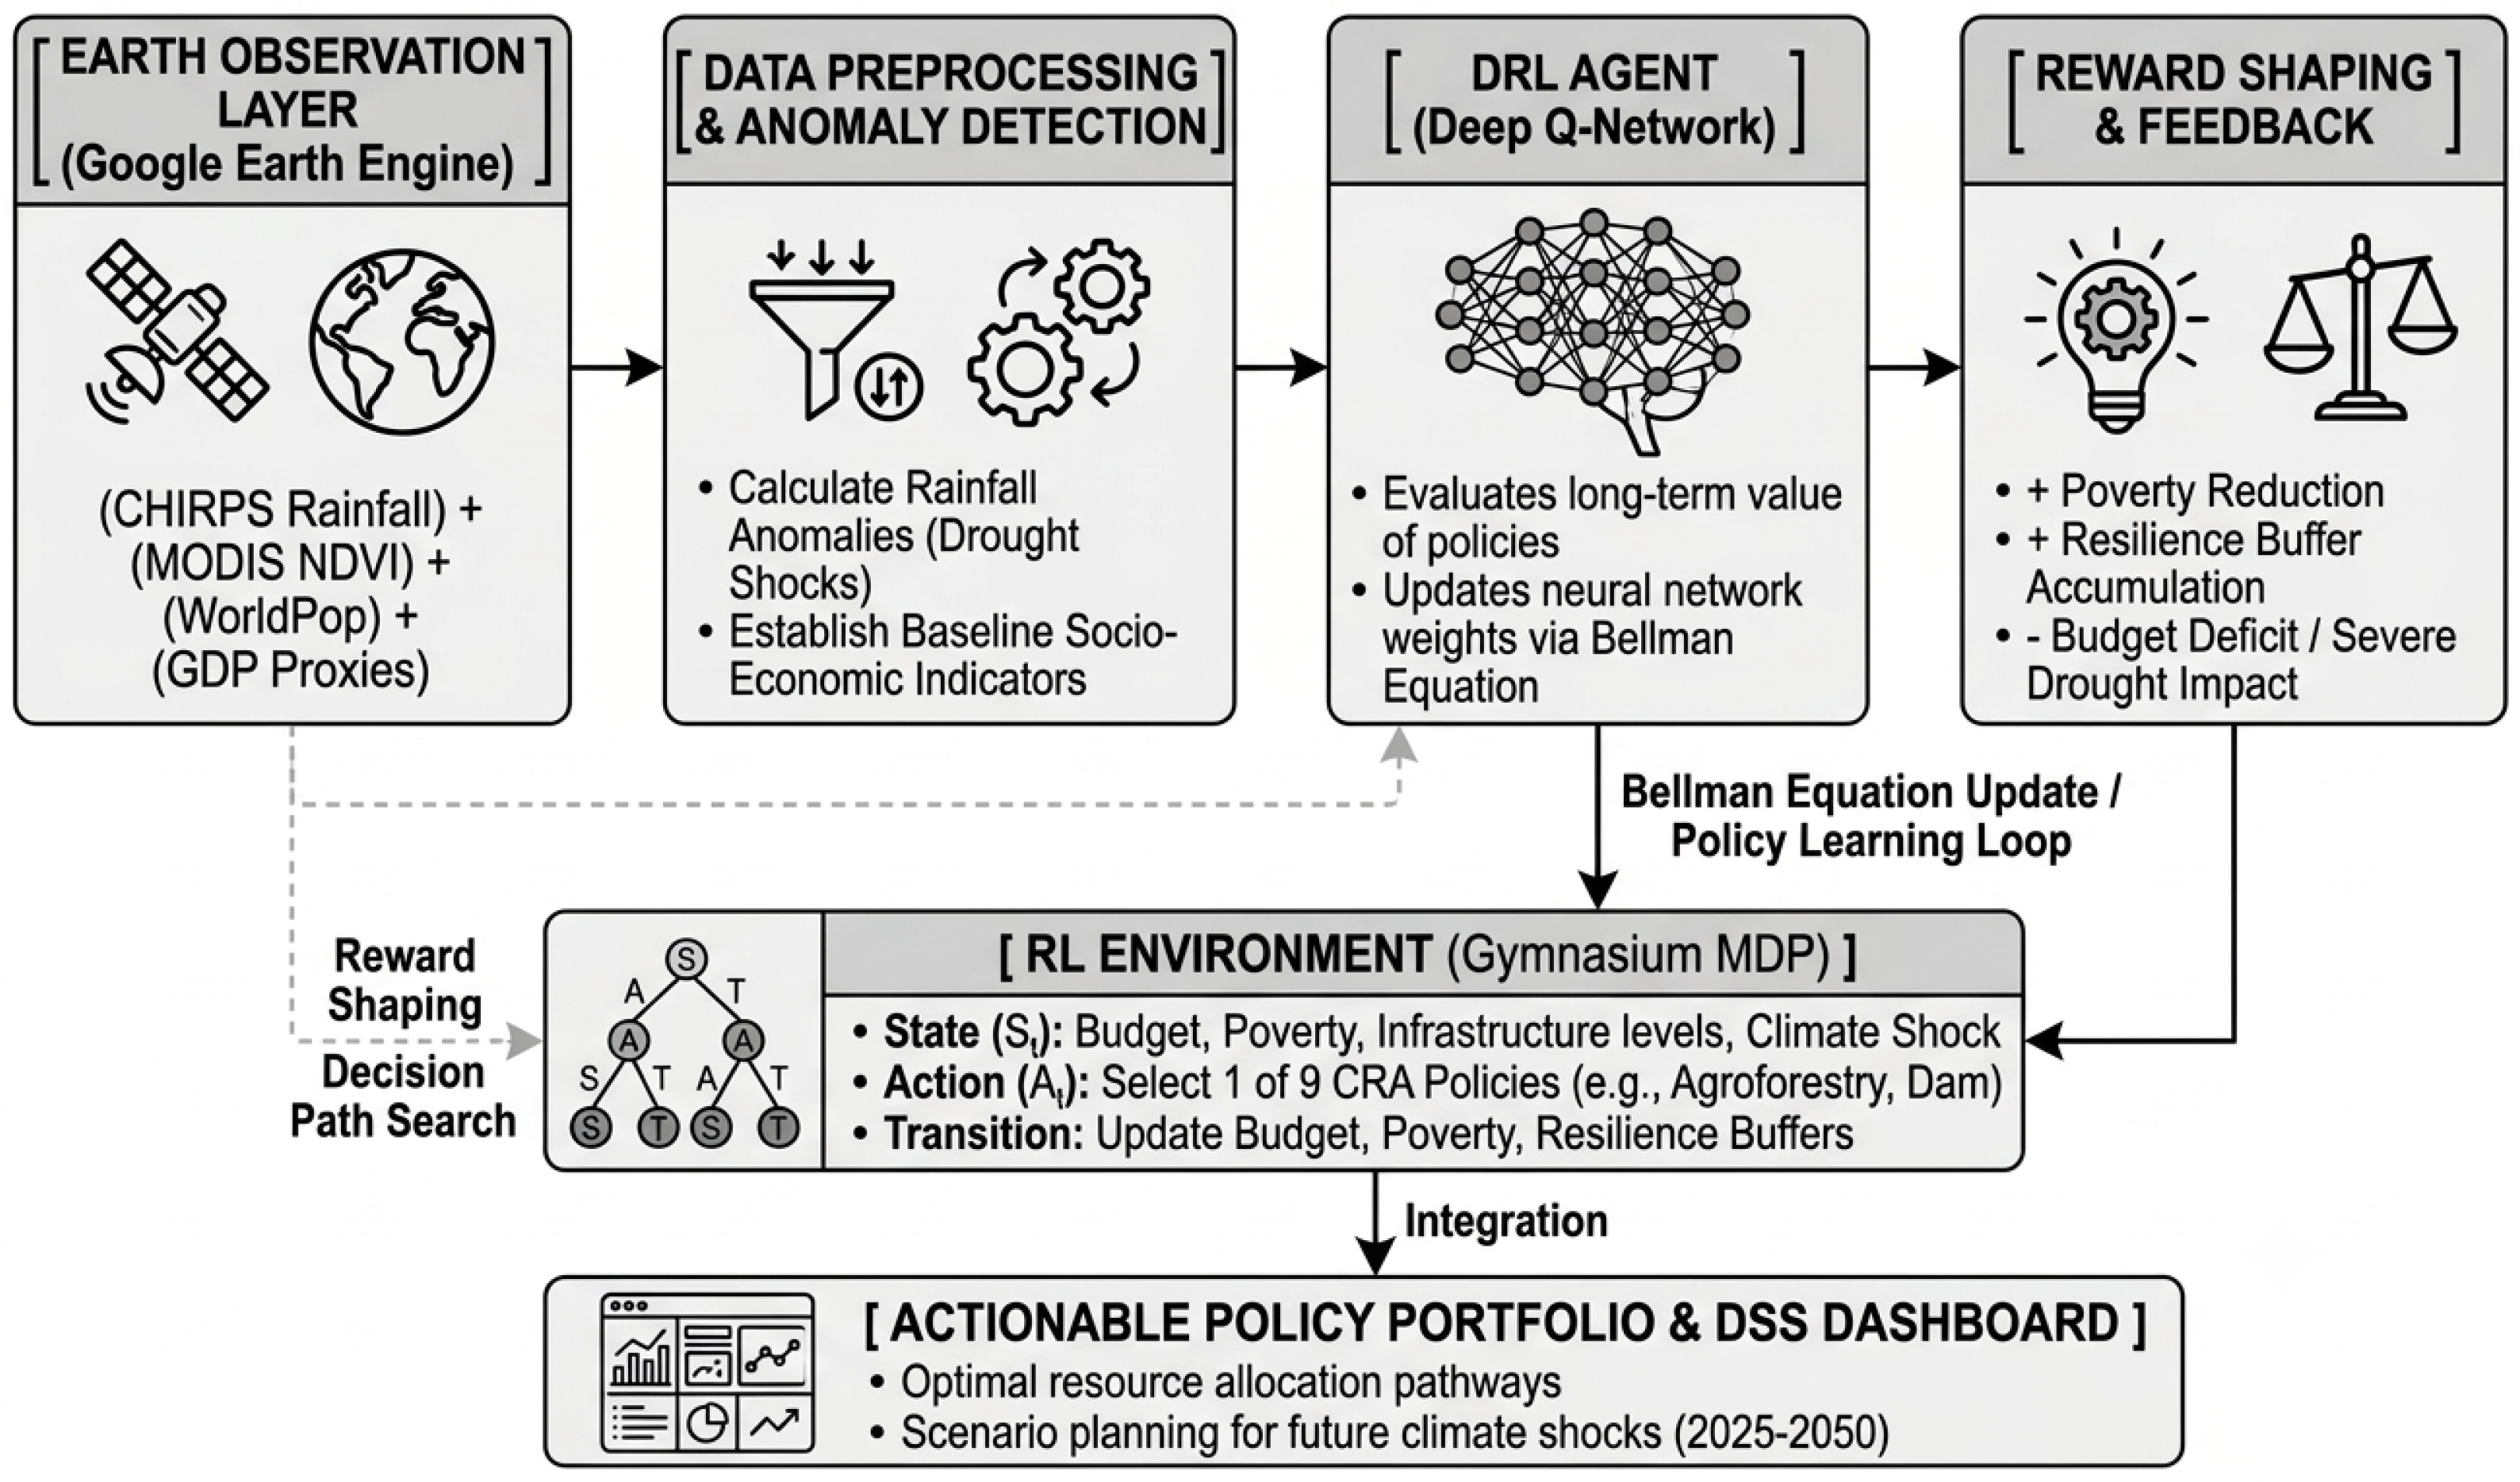
Figure 1 shows a conceptual workflow representation of the proposed AI-driven Decision Support Framework.
Figure 1.
Conceptual workflow of the EO-driven RL policy framework.
2.3. Deep Q-Network Architecture
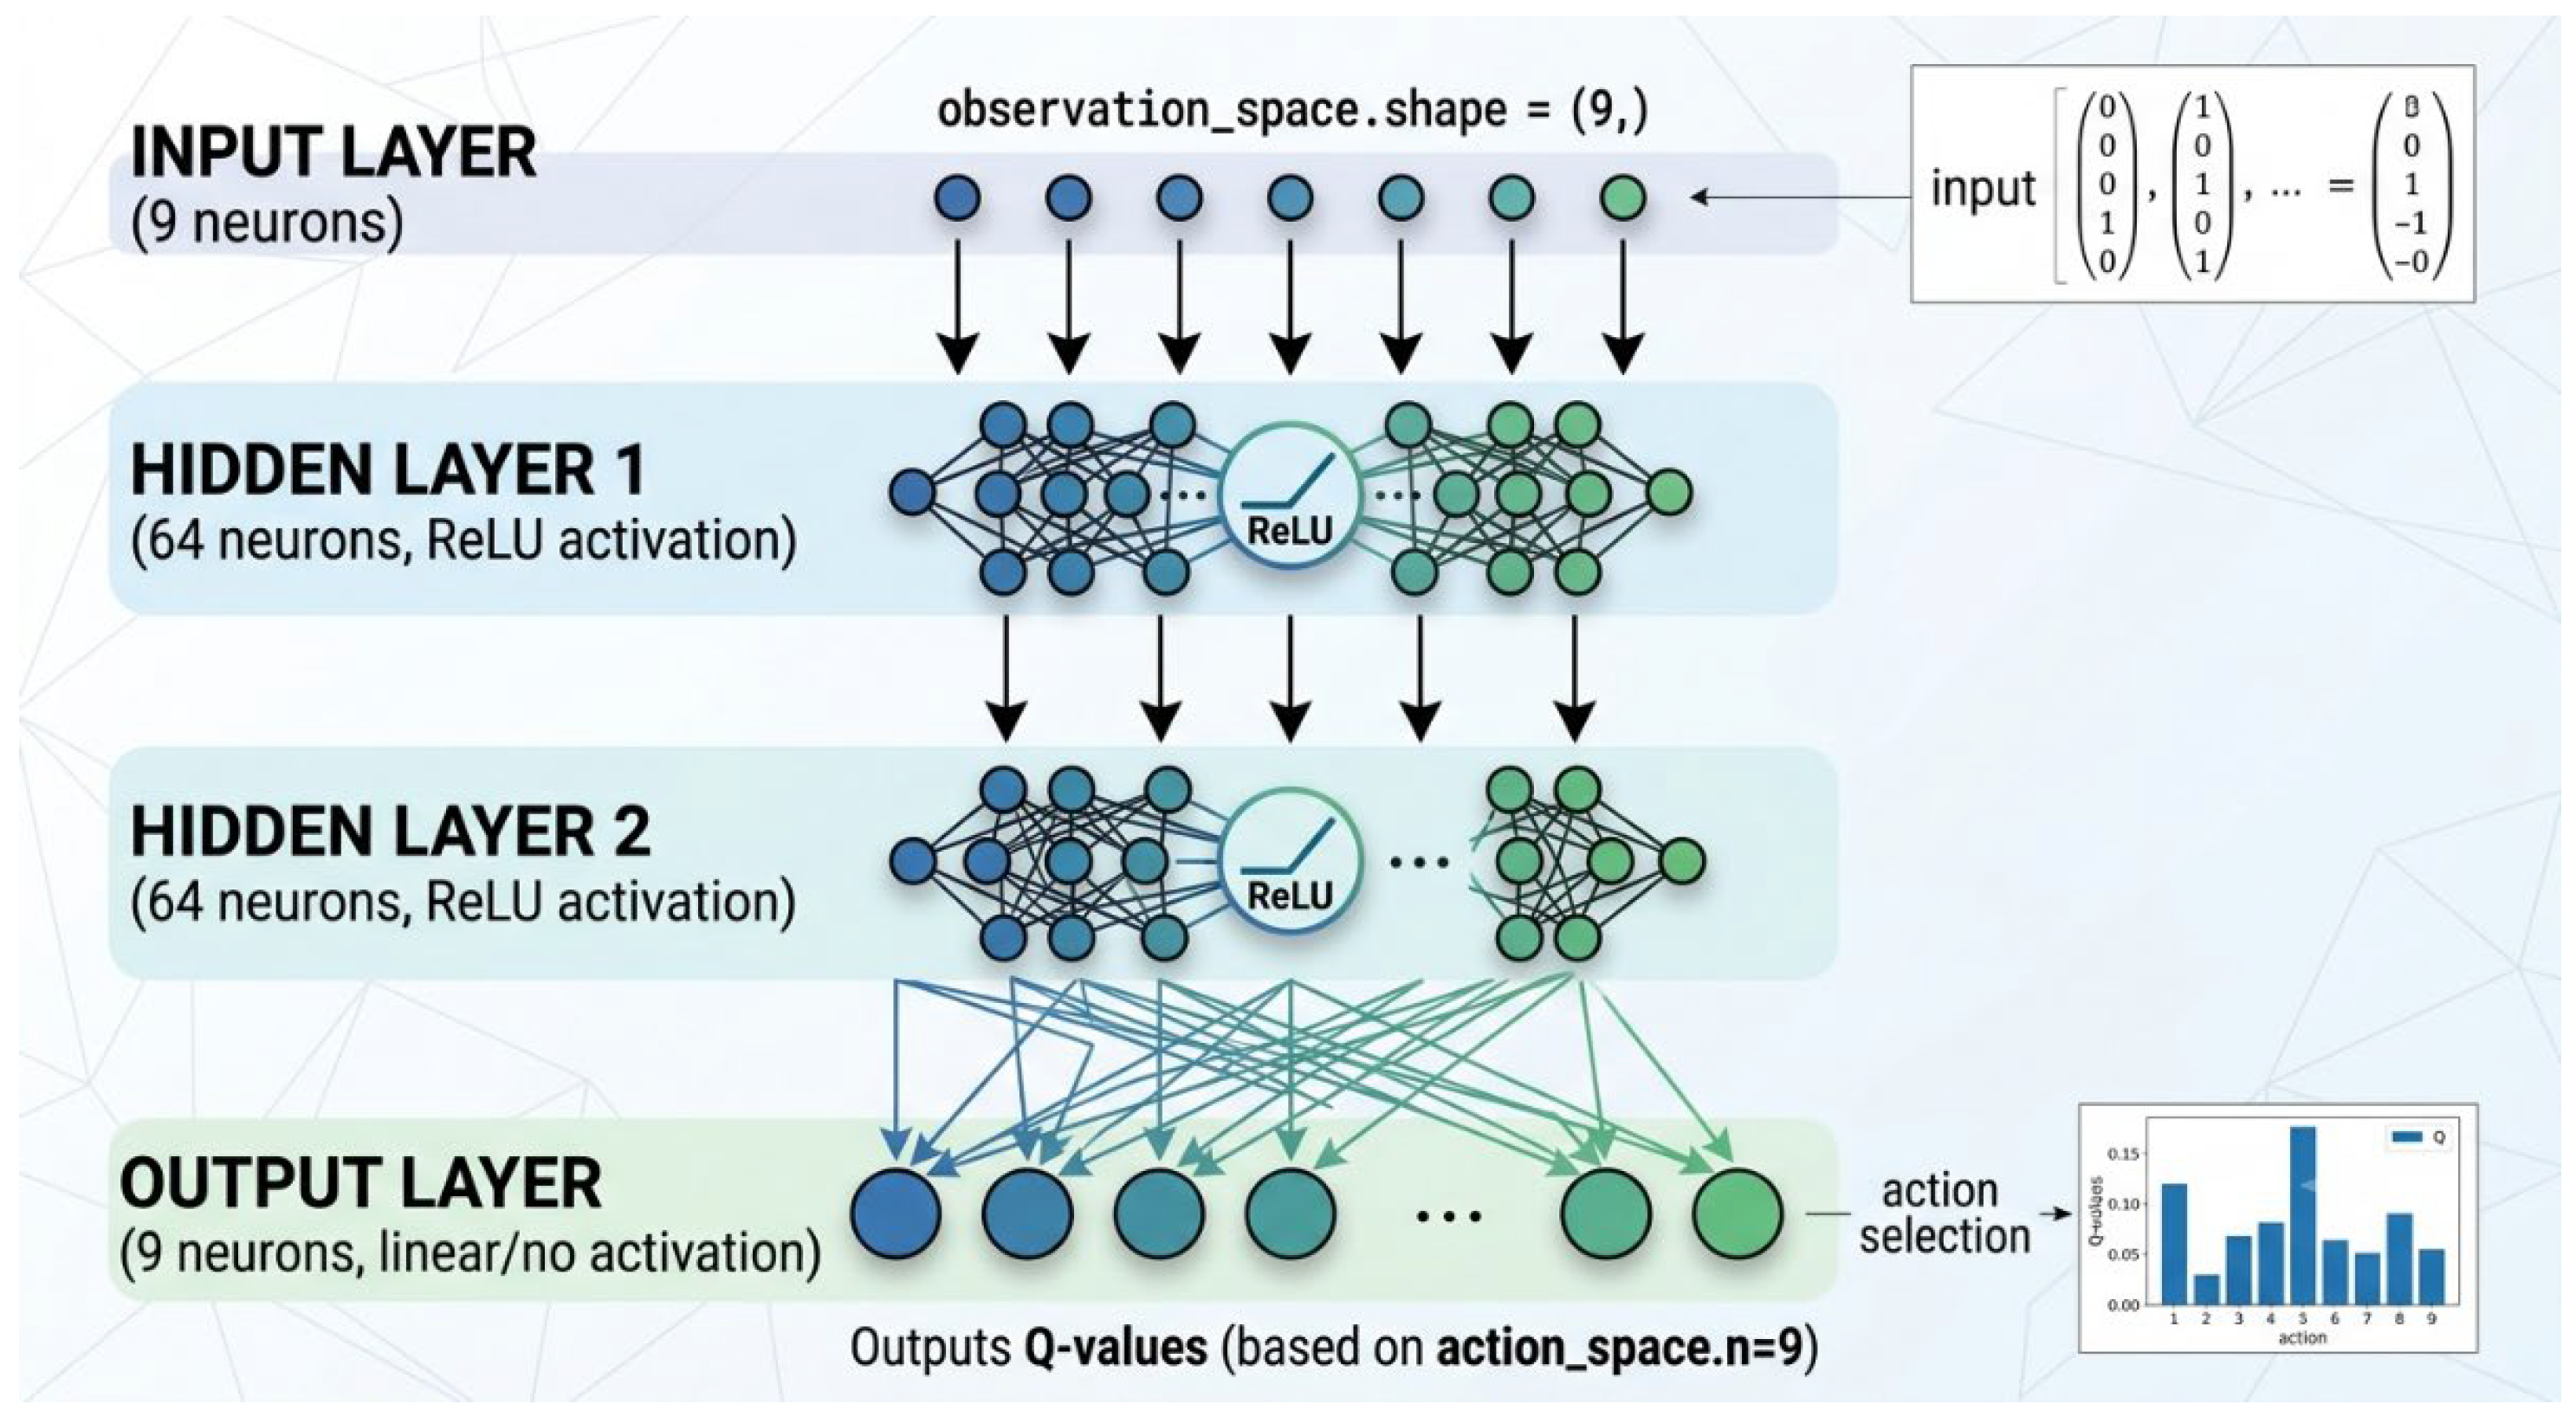
The reinforcement learning model used neural networks to approximate the Q-value function [15]. The Deep Q-Network (DQN) operated on a Multi-Layer Perceptron (MLP) architecture from Stable-Baselines3. The agent was trained in over 100,000 timesteps using an -greedy exploration strategy (initial , final ) to ensure robust exploration of the vast policy space before converging on an optimal strategy. The algorithm learned an action-value function Q (s, a) that estimates the expected cumulative reward for taking action a in state s. The algorithm flows through the Bellman Equation [16]:
where = the immediate reward (e.g., poverty reduction, budget penalty), γ Gamma = the discount factor (how much the AI cares about future resilience vs. immediate costs), and = the neural network’s own prediction of the best possible future policy.
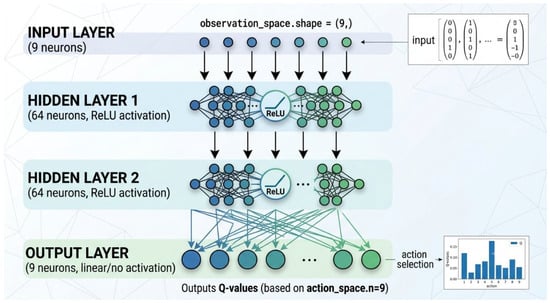
During training, the neural network calculates its own prediction and compares it to the Bellman target . It then uses gradient descent to adjust its weights (the 64–64 MLP architecture) to minimize the error between the two. An MLP network was used because the state space is a flat, structured vector of numerical socio-economic and environmental indicators (rather than sequential time-series data that would require an LSTM). Figure 2 below is a schematic representation of Deep Q-Network architecture.
Figure 2.
Schematic representation of multi-layer perceptron (MLP) architecture.
Following training, the policy was evaluated using a deterministic greedy approach (greedy argmax of the learned Q-function, ) over a single 25-year reference horizon to illustrate the agent’s learned temporal sequencing. The hyperparameters followed RL best practices. The hyperparameters used are listed in Table 1.
Table 1.
Training hyperparameters.
3. Results and Discussion
3.1. Poverty Reduction and Budget Dynamics
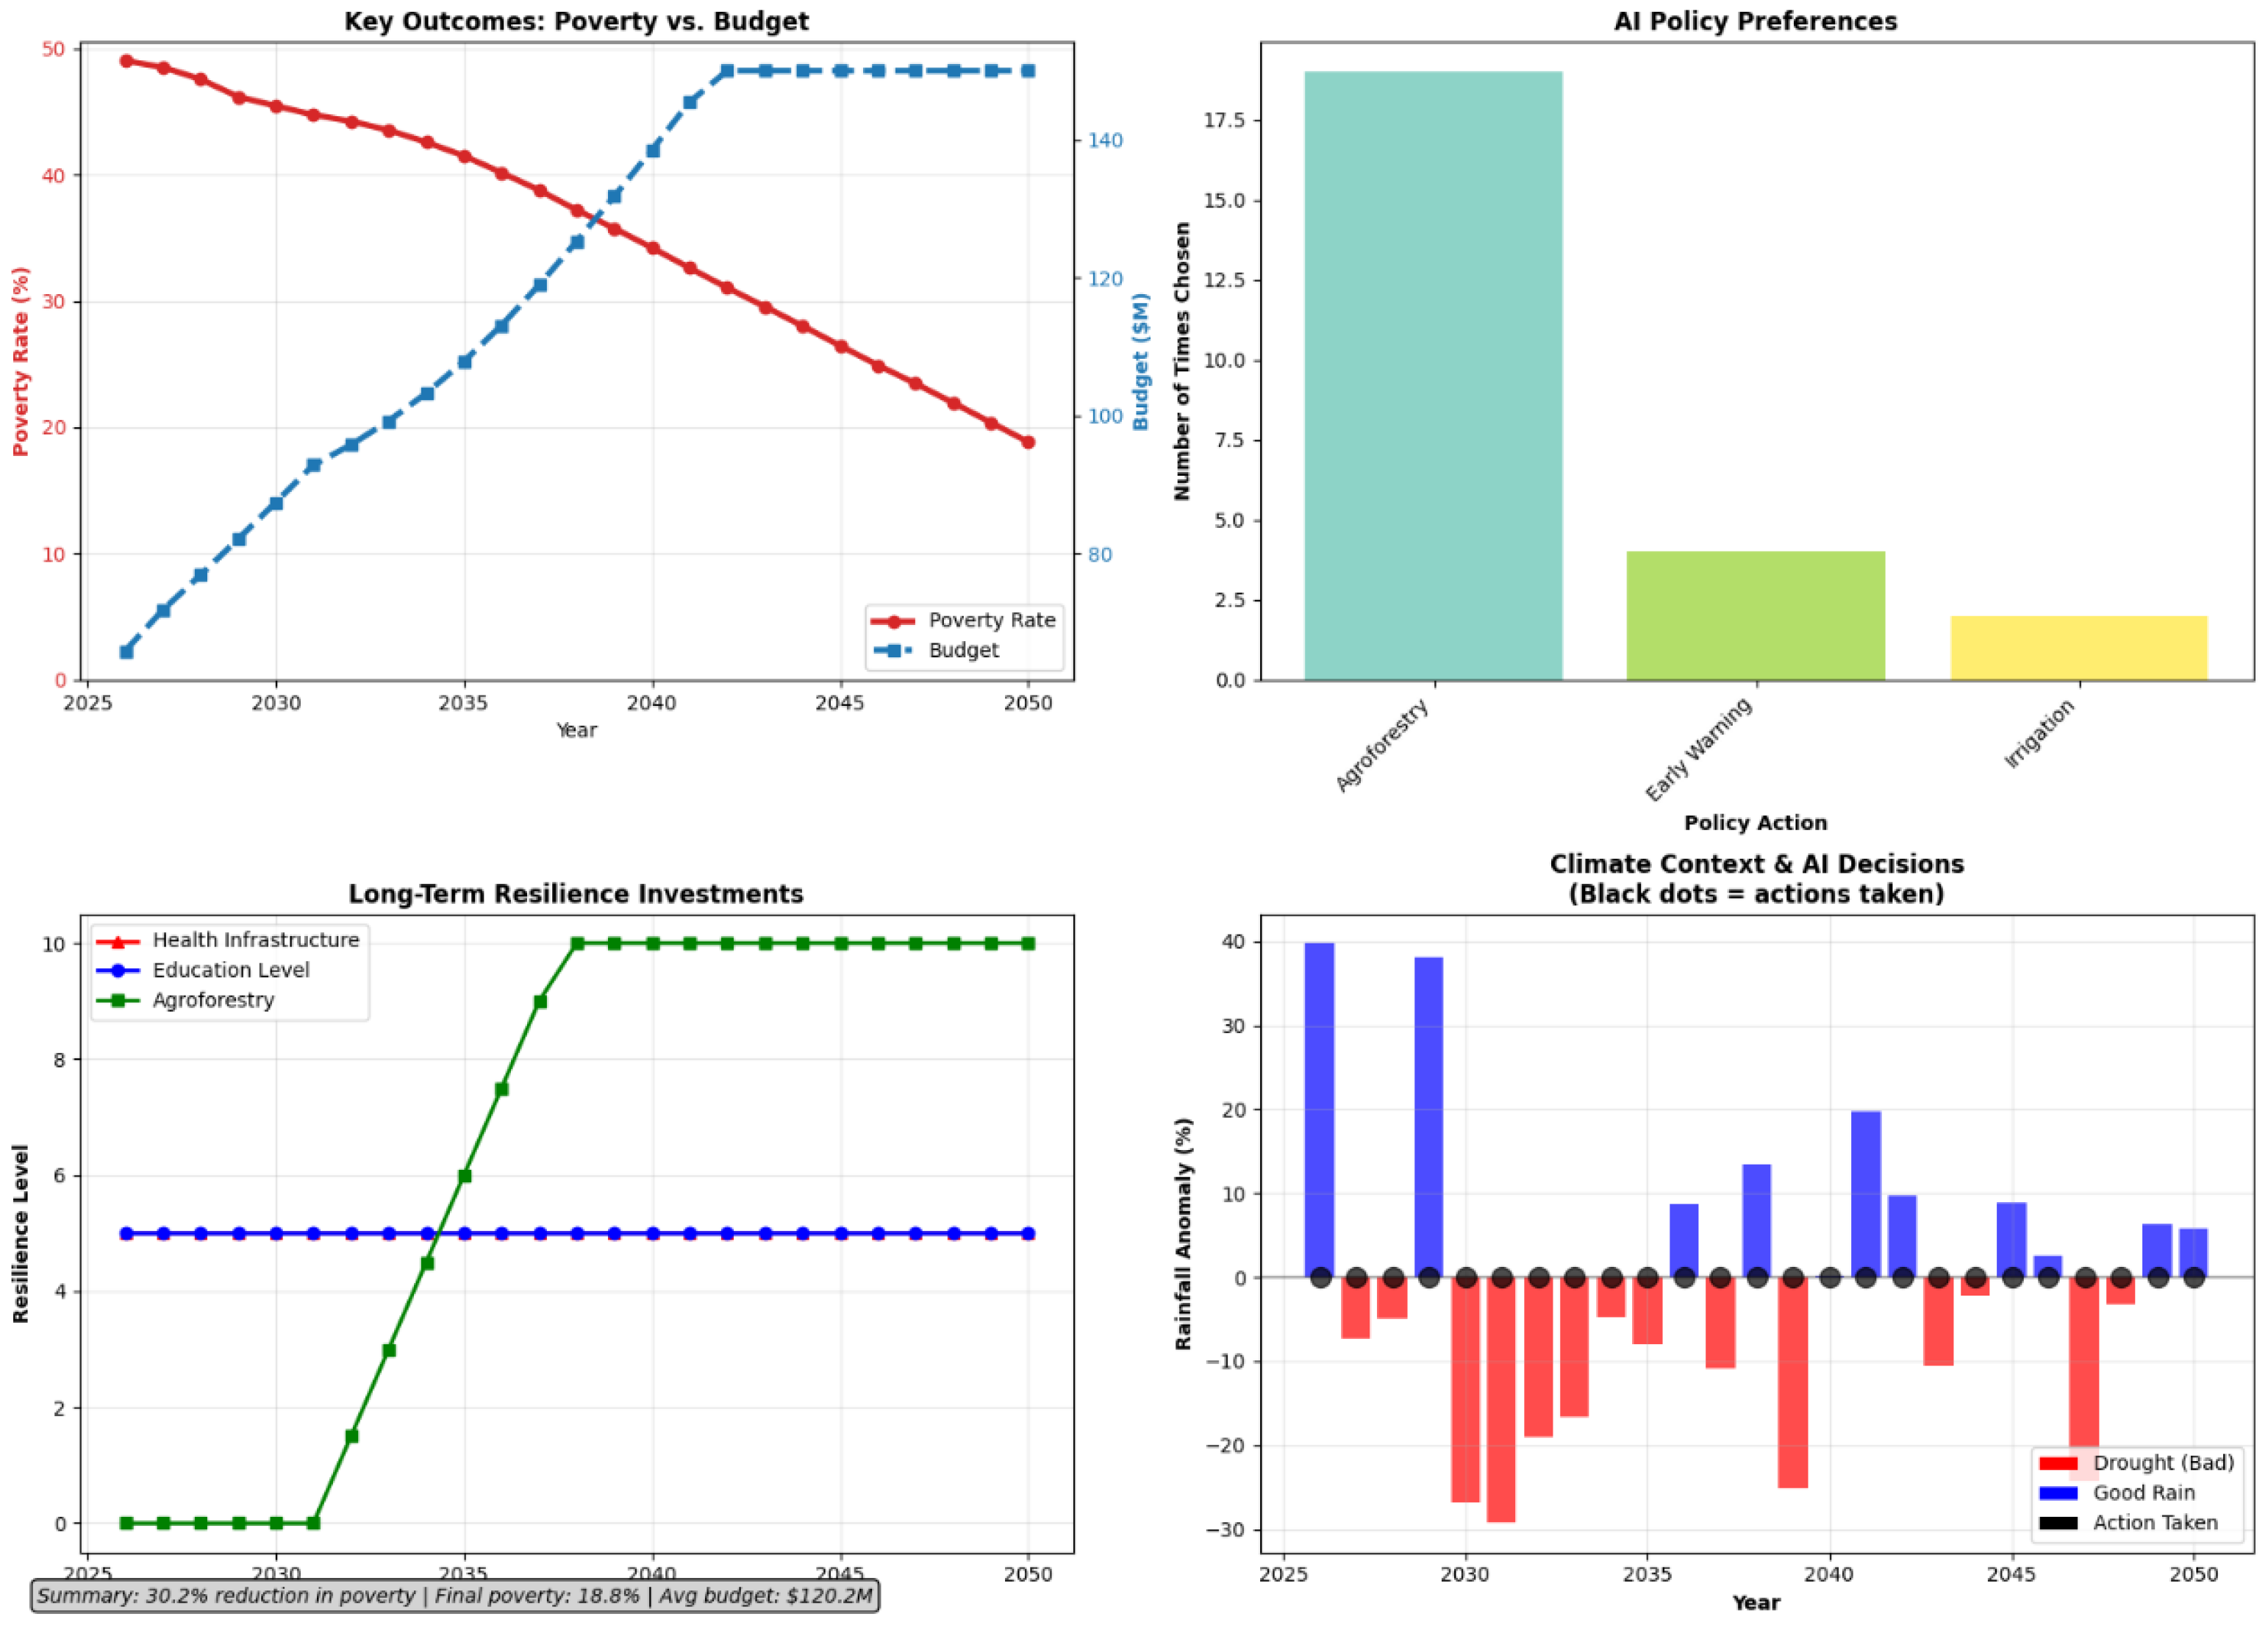
The AI agent was initialized with a constrained regional budget of 60 units ($60M), subject to a maximum cap of 150 units ($150M). To survive, the AI had to navigate a complex action space where policies carried immediate fiscal costs ranging from 4 units (irrigation, microfinance, education) to 10 units (dam initiation). Over the simulated 25-year horizon (2025–2050), the DQN agent successfully reduced regional poverty, starting with a poverty rate of ~50% and a population of ~1.01 million, while maintaining fiscal solvency. The poverty rate decreased from 50.0% to 18.8%, representing a relative reduction of 30.2% by 2050 driven by consistent investments in sustainable policy measures. The reported poverty reductions therefore reflect the model’s specified dynamics rather than measured welfare changes.
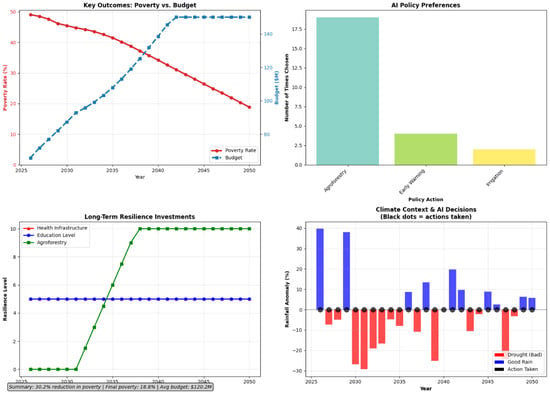
The AI’s policy portfolio revealed a high preference for nature-based solutions. Agroforestry (cost: 8 units) was selected in 76.0% of all decision cycles, while the agent chose to “Do Nothing” in 0% of the cycles, indicating continuous, proactive optimization of the regional budget. In traditional planning, mega-infrastructure (like dams) or capital-intensive irrigation is often prioritized for drought mitigation. However, the AI recognized that under strict local budget constraints, the high upfront capital expenditure (CAPEX) of a dam risks bankrupting the regional budget. Agroforestry, conversely, offers a lower entry cost, provides immediate diversified income (reducing poverty), and cumulatively builds resilience against rainfall anomalies. This validates recent empirical studies suggesting that nature-based solutions offer superior risk-adjusted returns for local governments in semi-arid regions [17]. Figure 3 below shows the results of the AI agent.
Figure 3.
AI policy performance dashboard.
The results presented are based on a deterministic evaluation serving as a reference case study. Because rainfall shocks are random, exact figures like the 76.0% agroforestry rate reflect one specific climate realization over the 25-year horizon, illustrating the agent’s learned policy structure and timing, though frequencies will vary across different climate scenarios. Ensemble forecasting with confidence intervals is planned for future work.
To differentiate structural incentives from learned behavior, the agent’s policy is divided into designed and emergent components. Agroforestry is favored due to four reward pathways and an initial asymmetry, providing greater reward potential compared to education or health. Three observed behaviors emerged: (i) the agent consistently avoided “Do Nothing,” learning that active investment surpasses fiscal saving; (ii) it did not pursue a dam project, recognizing the risk of budget failure due to a 3-year CAPEX commitment during droughts; and (iii) it used irrigation and early warning systems as immediate responses to acute droughts, later transitioning to agroforestry as a long-term solution, showcasing a strategy that was not programmed in the gymnasium environment.
3.2. Dynamic Temporal Sequencing and Evolution of Climate Adaptation Strategies
The AI agent did not apply policies statically; it learned to sequence interventions dynamically in response to Earth Observation (EO)-derived climate shocks. Across the simulation, the agent identified and responded to 10 distinct drought years (defined by significant negative rainfall anomalies). Most importantly, the AI’s response strategy evolved significantly over time, demonstrating a sophisticated shift from reactive physical infrastructure to proactive ecological buffering:
- Reactive and Physical Buffering (2026, 2027, 2030): During the early stages of the simulation, the AI’s accumulated resilience multipliers (education, health, and agroforestry) were low, meaning its annual budget generation was highly vulnerable to drought-induced poverty spikes. To protect the budget from hitting zero, the AI relied on cheaper, immediate interventions: irrigation (2026, 2027) = 4 units, and early warning systems (2030) = 5 units. These lower-CAPEX policies buffered immediate shock without over-leveraging the limited budget.
- Proactive Ecological Resilience (2033–2047): As the simulation progressed and the cumulative agroforestry level compounded, the AI’s drought response shifted entirely. In all subsequent drought years (2033, 2034, 2036, 2040, 2041, 2043, and 2047), the agent exclusively selected agroforestry.
This demonstrates the RL framework’s ability to understand the temporal physics of climate adaptation. It shows that adaptation finance should not be allocated as a fixed annual budget but must be structured as a dynamic contingency fund that releases specific instruments (like index-based insurance or early warning tech) triggered by real-time EO climate data [18].
3.3. The Mega-Infrastructure Trap and the Blended Finance Imperative
Despite the considerable importance of long-term resilience in completing a water reservoir (dam), the AI agent never initiated the dam project over the 25-year period. The AI correctly identified a systemic market failure: the local tax base and annual budget generation are incompatible with the CAPEX requirements of mega-infrastructure, even if the long-term return on investment (ROI) is positive. This computational finding suggests the necessity of Blended Finance [19]. Local governments cannot build climate-resilient mega-infrastructure alone. International climate funds (e.g., Green Climate Fund, GAFSP) must intervene with concessional capital or guarantees to de-risk these projects.
3.4. Human Capital as the Ultimate Climate Multiplier
The agent’s learned strategy consistently co-invests in human capital (education and health) and ecological buffers (agroforestry). The transition dynamics modeled education as a multiplier that increases the efficacy of all other policies. This model indicates that human capital development is a foundational climate adaptation strategy. Healthier and more educated people possess a higher climate-adaptive capacity, making subsequent agricultural investments more effective [20].
3.5. Policy Implications for Kitui County
The findings of this study align directly with the Kitui Government County report [6], which prioritizes ecosystem-based adaptation, tree growing, and landscape rehabilitation. The model’s strong preference for agroforestry is consistent with the county’s planned KES 350 million investment in tree growing and KES 50 million investment in ecosystem rehabilitation under Policy Objectives 5 and 7. The model’s avoidance of high-CAPEX infrastructure under local budget constraints supports the county’s emphasis on decentralized sand dams, water harvesting, and small-scale irrigation rather than mega-dams. The early warning response identified by the agent corresponds to Specific Goal 3 of the policy, which calls for structured information management and early warning systems. Budget flexibility is essential, aligning with Policy Objective 3’s call to operationalize the County Climate Change Fund and develop bankable proposals for external finance. Capacity building in climate-smart agriculture, community engagement through ward planning committees, and monitoring systems tracking poverty, agroforestry survival rates, budget allocation, and rainfall anomalies are recommended in accordance with the policy’s monitoring, evaluation, reporting, and learning framework.
4. Conclusions
The transition to climate-resilient agriculture in semi-arid counties such as Kitui requires more than increased financing. It requires the intelligent sequencing of limited resources under uncertain rainfall, recurring drought, and constrained public budgets. By integrating Earth Observation data with a deep reinforcement learning framework, this study demonstrates a practical decision-support approach for exploring how adaptation finance can be allocated across competing short-term relief measures and long-term resilience investments. The simulation suggests three policy lessons that are directly relevant to Kitui County.
- Prioritize Nature-Based Solutions: Local budgets are best directed toward agroforestry and catchment rehabilitation, which is consistent with the county’s largest planned budget lines (KES 350 million for tree growing; KES 50 million for landscape rehabilitation). These cumulative, low-CAPEX buffers provide poverty alleviation and long-term ecological shielding, but their dominance should be treated as scenario-based guidance subject to sensitivity analysis rather than a fixed allocation target.
- Restructure International Blended Finance: The model’s inability to finance a dam under the simulated local budget mirrors the county’s fiscal reality. International and national climate funds must provide concessional capital to absorb upfront CAPEX for larger water storage, while county resources prioritize decentralized sand dams and irrigation aligned with the policy’s identified opportunities in the Tana and Athi River basins.
- Implement Dynamic, EO-Triggered Financing: The model’s drought response highlights the value of early warning and short-term protective measures before climate shocks deepen. Therefore, adaptation funds should be released based on real-time satellite monitoring of rainfall anomalies and vegetation health, linked to the County Climate Change Fund and National Drought Management Authority (NDMA) assessments, enabling precise sequencing of early warnings, microfinance, and crop interventions as drought risk unfolds.
Overall, the framework acts as a decision-support tool, complementing participatory planning. It integrates climate data, budget constraints, and adaptation policy choices. For Kitui County, it suggests initial investments in decentralized nature-based resilience, strategic use of external Blended Finance for larger water infrastructure, and the establishment of flexible financing mechanisms responsive to drought risk.
The methodology developed in this study provides a replicable framework for AI-driven climate policy formulation in other climate-vulnerable regions, particularly in the Global South, where data constraints often limit evidence-based decision-making. While this research utilizes a simulated socio-economic baseline calculated using local trends in Kitui County, future research and iterations should integrate real-time, high-frequency micro-economic survey data, regional climate projections, and multi-agent systems to simulate the interactions between government policymakers and individual smallholder farmers. Nonetheless, this framework establishes a foundational groundwork for operationalizing AI as a critical tool in the global fight against climate vulnerability.
Funding
This research received no external funding.
Institutional Review Board Statement
Not applicable.
Informed Consent Statement
Not applicable.
Data Availability Statement
The dataset and Python code used in this study are available on request from the author.
Conflicts of Interest
The author declares no conflicts of interest.
References
- Alvar-Beltrán, J.; Elbaroudi, I.; Gialletti, A.; Heureux, A.; Neretin, L.; Soldan, R. Climate Resilient Practices: Typology and Guiding Material for Climate Risk Screening; FAO: Rome, Italy, 2021; Available online: https://openknowledge.fao.org/handle/20.500.14283/cb3991en (accessed on 28 June 2026).
- United Nations Environment Programme (UNEP). Adaptation Gap Report 2023: Underfinanced. Underprepared. Inadequate Investment and Planning on Climate Adaptation Leaves World Exposed, 2023. Available online: https://wedocs.unep.org/handle/20.500.11822/43796 (accessed on 28 June 2026).
- Government of Kenya. Kenya National Adaptation Plan: 2015–2030: Enhanced Climate Resilience Towards the Attainment of Vision 2030 and Beyond; Ministry of Environment and Natural Resources: Nairobi, Kenya, 2016. Available online: https://unfccc.int/sites/default/files/resource/NAP_Kenya_2017.pdf (accessed on 28 June 2026).
- Intergovernmental Panel on Climate Change (IPCC). Climate Change 2022—Impacts, Adaptation and Vulnerability: Working Group II Contribution to the Sixth Assessment Report of the Intergovernmental Panel on Climate Change; Cambridge University Press: Cambridge, UK, 2023. [Google Scholar] [CrossRef] [Scilit]
- Bryan, E.; Ringler, C.; Okoba, B.; Roncoli, C.; Silvestri, S.; Herrero, M. Adapting agriculture to climate change in Kenya: Household strategies and determinants. J. Environ. Manag. 2013, 114, 26–35. [Google Scholar] [CrossRef] [Scilit]
- Kitui County Government. Kitui County Environment and Climate Change Policy; Ministry of Environment, Tourism and Natural Resources: Kitui, Kenya, 2023. Available online: https://repository.kippra.or.ke/handle/123456789/4200 (accessed on 27 June 2026).
- Hallegatte, S.; Bangalore, M.; Bonzanigo, L.; Fay, M.; Kane, T.; Narloch, U.; Treguer, D.; Rozenberg, J.; Vogt-Schilb, A. Shock Waves: Managing the Impacts of Climate Change on Poverty; World Bank Publications: Washington, DC, USA, 2016. [Google Scholar] [CrossRef] [Scilit]
- Conway, D.; Schipper, E.L.F. Adaptation to Climate Change in Africa: Challenges and Opportunities Identified from Ethiopia. Glob. Environ. Change 2011, 21, 227–237. [Google Scholar] [CrossRef] [Scilit]
- Fankhauser, S. Adaptation to Climate Change. Annu. Rev. Resour. Econ. Annu. Rev. 2017, 9, 209–230. [Google Scholar] [CrossRef] [Scilit]
- Huntingford, C.; Jeffers, E.S.; Bonsall, M.B.; Christensen, H.M.; Lees, T.; Yang, H. Machine learning and artificial intelligence to aid climate change research and preparedness. Environ. Res. Lett. 2019, 14, 124007. [Google Scholar] [CrossRef] [Scilit]
- Sutton, R.S.; Barto, A.G. Reinforcement Learning: An Introduction, 2nd ed.; The MIT Press: Cambridge, MA, USA, 2018. [Google Scholar]
- Xu, W.; Meng, F.; Guo, W.; Li, X.; Fu, G. Deep reinforcement learning for optimal hydropower reservoir operation. J. Water Resour. Plan. Manag. 2021, 147, 04021045. [Google Scholar] [CrossRef] [Scilit]
- Gautron, R.; Maillard, O.; Preux, P.; Corbeels, M.; Sabbadin, R. Reinforcement learning for crop management support: Review, prospects and challenges. Comput. Electron. Agric. 2022, 200, 107182. [Google Scholar] [CrossRef] [Scilit]
- Feng, K.; Lin, N.; Kopp, R.E.; Xian, S.; Oppenheimer, M. Reinforcement learning-based adaptive strategies for climate change adaptation: An application for coastal flood risk management. Proc. Natl. Acad. Sci. USA 2025, 122, e2402826122. [Google Scholar] [CrossRef] [Scilit]
- Mnih, V.; Kavukcuoglu, K.; Silver, D.; Rusu, A.A.; Veness, J.; Bellemare, M.G.; Graves, A.; Riedmiller, M.; Fidjeland, A.K.; Ostrovski, G.; et al. Human-level control through deep reinforcement learning. Nature 2015, 518, 529–533. [Google Scholar] [CrossRef] [Scilit] [PubMed]
- Meyn, S. The Projected Bellman Equation in Reinforcement Learning. IEEE Trans. Autom. Control 2024, 69, 8323–8337. [Google Scholar] [CrossRef] [Scilit]
- Seddon, N.; Chausson, A.; Berry, P.; Girardin, C.A.J.; Smith, A.; Turner, B. Understanding the value and limits of nature-based solutions to climate change and other global challenges. Philos. Trans. R. Soc. London. Ser. B Biol. Sci. 2020, 375, 20190120. [Google Scholar] [CrossRef] [Scilit]
- World Bank. Weather Index Insurance for Agriculture: Guidance for Development Practitioners (Agriculture and Rural Development Discussion Paper; No. 50); World Bank, Washington, DC, USA, 2011. Available online: http://documents.worldbank.org/curated/en/590721468155130451 (accessed on 27 June 2026).
- OECD/UNCDF. Blended Finance in the Least Developed Countries 2020: Supporting a Resilient COVID-19 Recovery; OECD Publishing: Paris, France, 2020. [Google Scholar] [CrossRef] [Scilit]
- Feinstein, N.W.; Mach, K.J. Three roles for education in climate change adaptation. Clim. Policy 2020, 20, 317–322. [Google Scholar] [CrossRef] [Scilit]

Disclaimer/Publisher’s Note: The statements, opinions and data contained in all publications are solely those of the individual author(s) and contributor(s) and not of MDPI and/or the editor(s). MDPI and/or the editor(s) disclaim responsibility for any injury to people or property resulting from any ideas, methods, instructions or products referred to in the content. |
© 2026 by the author. Licensee MDPI, Basel, Switzerland. This article is an open access article distributed under the terms and conditions of the Creative Commons Attribution (CC BY) license.