


Abstract
Groundwater nitrate contamination has become an important concern due to its adverse effects on groundwater quality and human health. Therefore, developing reliable prediction models is necessary for estimating nitrate concentrations and supporting groundwater quality monitoring. In this study, machine learning models integrated with optimization algorithms were developed for predicting groundwater nitrate concentrations in Telangana, India. A total of 368 observations obtained from a secondary dataset available on Kaggle, representing post-monsoon conditions in 2020, were used for the analysis. Four input-variable configurations (C1–C4) were considered to examine the effect of different combinations of hydrochemical parameters on model performance. Furthermore, Random Forest-based feature selection was applied to determine the relative importance of the input variables. The Bagged Trees (BT) model was subsequently optimized using the Educational Competition Optimizer (ECO) and Firefly Algorithm (FA). In addition, SHapley Additive exPlanations (SHAP) was employed to explain the contribution of the input variables to the model predictions. Model performance was evaluated using the coefficient of determination (R2), ratio of performance to interquartile distance (RPIQ) and relative absolute error (RAE) during the training and testing stages. Five-fold cross-validation was also considered for model evaluation. The results showed that configuration C4 provided the best performance among the conventional BT models and was therefore selected for further optimization. The optimized BT-FA-C4 model produced the best testing results, with R2, RPIQ and RAE values of 0.983, 10.256 and 0.086, respectively. Similarly, the BT-ECO-C4 model achieved R2, RPIQ and RAE values of 0.949, 8.060 and 0.097, respectively. Moreover, SHAP analysis provided further information on the relative contributions of the hydrochemical parameters to groundwater nitrate predictions. Based on these results, the integration of feature selection, optimization algorithms and explainable machine learning provides a useful approach for predicting groundwater nitrate concentrations from hydrochemical data.
1. Introduction
Groundwater is an important source of water for domestic consumption, agricultural activities and industrial use [1]. Its quality is influenced by natural hydrogeochemical processes and human activities, which can introduce different contaminants into groundwater systems. Among these contaminants, NO3 is of particular concern because elevated concentrations can affect drinking-water quality and pose risks to human health. Agricultural fertilizer application, wastewater disposal and other nitrogen-bearing wastes are recognized as potential sources of groundwater nitrate contamination [2]. However, the extent of nitrate accumulation varies according to local hydrogeological conditions, land use and groundwater chemistry [3]. Therefore, the assessment and prediction of groundwater NO3 concentrations require appropriate analytical approaches that can describe the variation in water quality across different locations [4].
In India, groundwater is widely used to support domestic water requirements and agricultural production. However, groundwater quality varies considerably across different regions because of differences in geological conditions, recharge processes and human activities. Previous studies have demonstrated the importance of identifying areas with elevated nitrate concentrations and assessing the factors associated with their distribution [5]. Telangana State is an important region for groundwater assessment because groundwater supports agricultural and domestic activities across its districts [6]. The variation in groundwater hydrochemical characteristics provides an opportunity to investigate the relationships between nitrate concentration and other water quality parameters. Furthermore, the geographical distribution of groundwater observations can help identify locations that require additional investigation and monitoring. Therefore, examining the spatial variation of NO3 concentrations alongside hydrochemical characteristics is important for improving groundwater quality assessment in the region [7]. Groundwater nitrate contamination is an important concern in Telangana, India, due to its implications for drinking-water quality and human health. The permissible limit for nitrate concentration in drinking water is 45 mg/L according to the Bureau of Indian Standards (BIS), while the World Health Organization (WHO) recommends a guideline value of 50 mg/L. The occurrence of elevated nitrate concentrations has also been reported in previous investigations conducted in different parts of Telangana. In the present dataset, which comprises 368 groundwater observations, 166 observations (45.11%) exceeded the BIS permissible limit, while 148 observations (40.22%) were above the WHO guideline value. The nitrate concentrations ranged from 0.097 to 1028 mg/L, with a mean value of 80.52 mg/L. These results indicate considerable variation in nitrate concentrations within the investigated dataset and highlight the importance of developing reliable approaches for nitrate prediction and groundwater quality assessment [8]. Previous investigations have reported the occurrence of elevated nitrate concentrations in groundwater in different parts of Telangana. Adimalla et al. [8], in their investigation of Central Telangana, reported that approximately 71% of the 105 groundwater samples exceeded the maximum permissible limit for nitrate. Similarly, Adimalla et al. [9] reported nitrate concentrations ranging from 0.8 to 130 mg/L in groundwater from the Nirmal region, with 26.47% of the samples exceeding the WHO guideline value. These findings indicate that nitrate contamination is an important groundwater quality concern in the region. In the present study, the analysis of 368 groundwater observations showed that 166 observations (45.11%) exceeded the BIS permissible limit of 45 mg/L, while 148 observations (40.22%) exceeded the WHO guideline value of 50 mg/L. The nitrate concentrations ranged from 0.097 to 1028 mg/L, with a mean value of 80.52 mg/L. These results demonstrate considerable variation in the nitrate concentrations represented in the dataset and provide further justification for investigating the relationships between nitrate and the associated hydrochemical parameters.
Conventional groundwater quality assessment relies mainly on sampling and laboratory analysis. Although these methods provide direct measurements of water quality, the interpretation of multiple hydrochemical parameters can be challenging because their relationships may be nonlinear and interdependent [10]. Machine learning (ML) models provide an alternative approach by learning relationships between input variables and target parameters from available observations [11]. Different algorithms, including regression trees, random forest, support vector regression and artificial neural networks, have been applied to groundwater quality prediction. These models can describe complex relationships between hydrochemical parameters and groundwater quality indicators without requiring a predefined mathematical relationship [12]. For example, machine learning approaches have been used to assess regional groundwater nitrate contamination in India, demonstrating the potential of data-driven methods for identifying areas with elevated nitrate concentrations [5].
However, the performance of these models depends on the characteristics of the dataset, the selection of input variables and the model configuration. Therefore, comparing different models using the same dataset and performance criteria is necessary to determine their relative prediction capability [13]. Furthermore, model performance may be affected by the selection of relevant input variables. Groundwater hydrochemical datasets commonly contain parameters that are strongly correlated or provide overlapping information. Including all available variables may increase model complexity without necessarily improving prediction accuracy [14]. Feature selection can help identify the parameters that contribute most strongly to the prediction of a target variable [15]. Random forest (RF) importance provides a method for ranking input variables according to their contribution to model performance [16]. In the present study, RF importance rankings were used to develop four input configurations (C1–C4), ranging from a smaller set of highly ranked parameters to the complete set of available hydrochemical variables. This approach provides a basis for examining whether a reduced input set can provide satisfactory NO3 prediction or whether the inclusion of additional parameters improves model performance [17].
In addition to feature selection, optimization algorithms can be integrated with machine learning models to identify suitable model configurations and improve prediction performance [18]. The parameters of a prediction model influence its ability to represent the relationship between the input variables and the target variable. Therefore, an appropriate optimization procedure can help identify parameter combinations that provide better predictive results. In this study, the boosted tree (BT) model was integrated with the Educational Competition Optimizer (ECO) and Firefly Algorithm (FA) to develop optimized prediction models. The performance of the optimized models was compared with that of the corresponding single models using the same input configurations. Furthermore, five-fold cross-validation was employed to evaluate model performance across different data subsets. The use of cross-validation provides information on the consistency of the predictions and helps assess whether the reported performance is maintained across the validation folds.
Although ML models can provide accurate predictions, interpreting their outputs remains a challenge, particularly when nonlinear relationships are involved. A model may identify important relationships within the dataset without directly explaining how individual parameters influence its predictions. XAI methods provide additional information on model behaviour by estimating the contribution of input variables to the predicted output. Shapley Additive Explanations (SHAP) is a game-theory-based method that quantifies the contribution of individual features to model predictions [12]. SHAP can be used to rank the importance of hydrochemical parameters and examine whether different parameter values increase or decrease predicted NO3 concentrations. Previous groundwater studies have demonstrated the usefulness of combining machine learning with SHAP to interpret groundwater quality predictions and investigate hydrochemical relationships [19]. In the present study, SHAP was applied to identify the parameters that contributed most strongly to the predicted NO3 concentrations. The SHAP results were also examined in relation to the RF sensitivity and correlation analyses to determine whether the different approaches identified similar influential variables.
Moreover, groundwater nitrate concentrations may vary geographically, and a model that describes the overall dataset may not fully represent the spatial distribution of the observed concentrations. Spatial analysis provides an approach for examining the geographical variation of NO3 and determining whether similar concentrations tend to occur near one another [20]. Such information is useful for identifying locations that require further groundwater quality assessment [20]. The integration of spatial analysis with ML and XAI can therefore provide complementary information on NO3 distribution, prediction performance and the hydrochemical parameters associated with the model outputs. However, spatial patterns and statistical associations alone cannot establish the sources of NO3 contamination; additional information on land use, agricultural practices and hydrogeological conditions is required to investigate the processes responsible for the observed variation. Therefore, the principal contribution of this study is the combined use of predictive modelling, feature selection, spatial assessment and explainable AI to evaluate groundwater NO3 variation and support the identification of hydrochemical parameters relevant to groundwater quality monitoring.
Recent studies have further demonstrated the applicability of machine learning techniques in predicting groundwater nitrate concentrations. Mahboobi et al. [21] developed a heterogeneous ensemble approach by integrating random forest regression (RFR), k-nearest neighbors (KNN) and support vector regression (SVR) for nitrate prediction in the Qom aquifer, Iran. The outputs of the individual models were combined using averaging and geographically weighted regression (GWR). The GWR-based ensemble achieved better prediction performance, with an R2 of 0.75, compared with the averaging approach (R2 = 0.68), indicating the importance of considering spatial variations in groundwater nitrate prediction. Similarly, Jacob and Masilamani [10] investigated nine machine learning algorithms for predicting groundwater nitrate concentrations in the Thiruvannamalai District, India. Among the investigated models, random forest provided the best prediction performance across the pre-monsoon, monsoon and post-monsoon periods, with an R2 value of 0.94. Furthermore, Li et al. [22] developed an interpretable stacking ensemble learning framework by combining gradient boosting decision tree, extreme gradient boosting, random forest, extremely randomized trees and KNN models with SHAP analysis. Their findings demonstrated the potential of ensemble learning for improving groundwater nitrate prediction and identifying the major factors influencing nitrate distribution. More recently, studies have explored the integration of hyperparameter optimization, feature selection and explainable machine learning to improve nitrate prediction and spatial assessment. Although several studies have investigated groundwater nitrate contamination and its prediction using statistical and machine learning techniques, the prediction of nitrate concentrations remains challenging because of the complex relationships among hydrochemical parameters. Previous studies have demonstrated the application of Random Forest and Boosted Regression Trees for regional-scale nitrate prediction. Furthermore, investigations conducted in different parts of Telangana have reported considerable variations in groundwater nitrate concentrations and the occurrence of samples exceeding recommended drinking-water limits. However, the predictive contribution of different combinations of hydrochemical parameters, particularly the use of a limited number of routinely measured parameters compared with a broader hydrochemical dataset, requires further investigation. In addition, the interpretation of the contribution of individual hydrochemical variables to optimized model predictions is important for understanding the factors influencing the estimated nitrate concentrations. Therefore, the present study investigates the performance of conventional and optimized Bagged Trees models under different input-variable configurations, using the Educational Competition Optimizer and Firefly Algorithm. SHAP analysis is further employed to examine the relative contribution of the input variables to the model predictions. Particular attention is given to comparing the predictive performance obtained from different input configurations and determining the extent to which a reduced set of hydrochemical parameters can support nitrate prediction. Also, although SHAP and other explainable artificial intelligence techniques have been introduced in recent groundwater studies, the integration of model optimization and explainability remains an important consideration for developing reliable prediction frameworks. Furthermore, spatial variations and hydrogeochemical interactions may influence nitrate distribution, making it necessary to interpret model predictions in relation to the environmental characteristics of the study area. Therefore, further investigation is required to develop an integrated modelling framework that combines bio-inspired optimization, different input-variable configurations and explainable machine learning for groundwater nitrate prediction.
Based on these considerations, the present study develops an integrated modelling framework for groundwater nitrate prediction by combining the Bagged Trees (BT) model with two bio-inspired optimization algorithms, namely the Educational Competition Optimizer (ECO) and Firefly Algorithm (FA). Four input-variable combinations (C1–C4) were examined to investigate the influence of different hydrochemical predictor configurations on model performance. Furthermore, the integration of ECO and FA with the BT model was intended to improve the predictive capability of the learning algorithm through optimization. SHapley Additive exPlanations (SHAP) was incorporated to determine the contribution of individual input variables to the model predictions and provide further insight into the hydrochemical factors associated with nitrate concentration. The performance of the developed models was evaluated using the coefficient of determination (R2), ratio of performance to interquartile distance (RPIQ) and relative absolute error (RAE) during the training and testing phases. The main contribution of this study is the integration of bio-inspired optimized BT models with SHAP-based interpretation and systematic evaluation of different hydrochemical input configurations. This framework provides an additional approach for improving groundwater nitrate prediction and understanding the contribution of hydrochemical parameters to nitrogen pollution assessment. The specific objectives were to: (i) examine the spatial distribution and variation in groundwater NO3 concentrations across the sampled locations; (ii) identify the influential hydrochemical parameters using RF sensitivity analysis and correlation analysis; (iii) develop and compare four input configurations (C1–C4) for NO3 prediction; (iv) evaluate the performance of single and optimized BT models using the selected performance criteria and five-fold cross-validation; and (v) apply SHAP to interpret the contributions of hydrochemical parameters to the model predictions. The study provides an integrated framework for evaluating groundwater NO3 prediction and identifying hydrochemical parameters that may support groundwater quality monitoring and assessment.
2. Materials and Methods
2.1. Proposed Methodology
The groundwater-quality data used in this study originated from the Ground Water Department, Government of Telangana, which conducts pre-monsoon and post-monsoon groundwater monitoring, and were accessed through the Kaggle platform https://www.kaggle.com/datasets/sivapriyagarladinne/telangana-post-monsoon-ground-water-quality-data (accessed on 11 September 2026). The dataset comprised 368 groundwater observations collected during the post-monsoon period of 2020 in Telangana State, India. The records included NO3 concentration, hydrochemical parameters and geographical information used for spatial analysis and model development.
The proposed methodology integrates spatial analysis, feature selection, machine learning, optimization algorithms and explainable artificial intelligence (XAI) for groundwater NO3 prediction in Telangana State, India (see Figure 1). The hydrochemical parameters were used as input variables, while NO3 concentration was considered the dependent variable.
Figure 1.
The proposed methodology framework.
Initially, the dataset was examined to determine the distribution of NO3 concentrations and the variation in groundwater quality across the sampled locations. Spatial analysis was conducted to investigate the geographical distribution of nitrate and the degree of spatial autocorrelation. Furthermore, correlation analysis was performed to examine the relationships between NO3 and the available hydrochemical parameters. RF importance was subsequently used to rank the input variables according to their contribution to model performance. Based on the ranking results, four input configurations (C1–C4) were developed to investigate the effect of variable selection on NO3 prediction.
The BT model was initially developed as a single model using the selected input configurations. Thereafter, the ECO and FA were integrated with BT regression to develop optimized models. The developed models were evaluated using the selected performance criteria during the training and testing stages. Five-fold cross-validation was also employed to examine the consistency of model performance across different data subsets. The optimization procedure was restricted to the training data to reduce the risk of information leakage into the validation or testing stages. Finally, SHAP was applied to interpret the predictions and determine the contribution of individual hydrochemical parameters to the simulated NO3 concentrations. The SHAP results were examined alongside the RF sensitivity and correlation analyses to identify the parameters that consistently showed greater importance. The proposed methodology therefore provides a framework for comparing single and optimized prediction models, examining the spatial variation in groundwater nitrate and interpreting the hydrochemical parameters associated with the model predictions.
In the present study, data preprocessing involved outlier detection and filling missing values before model development. These procedures were considered to improve data completeness and identify observations requiring further examination.
2.2. Study Location
The study was conducted in Telangana State, located in the southern part of India. The state covers an area of approximately 112,077 km2 and shares its boundaries with Maharashtra, Chhattisgarh, Karnataka and Andhra Pradesh. Hyderabad is the state capital. The region is characterised by a predominantly hot climate, with most of its rainfall occurring during the southwest monsoon [23]. These climatic conditions influence groundwater recharge and availability across the state [23].
Groundwater is an important source of water for domestic use and agricultural activities in Telangana. However, its quality varies with local geological conditions, water–rock interactions and human activities [24]. The presence of different hydrochemical characteristics makes the region suitable for investigating groundwater quality and predicting NO3 concentrations using data-driven models. The geographical dataset used in this study contains the names of districts, mandals and villages, together with their corresponding latitude and longitude coordinates (see Figure 2). The 368 groundwater sampling locations are geographically distributed between 15.896° N and 19.731° N latitude and 77.444° E and 80.920° E longitude across Telangana State, India. These geographical records provide the spatial reference for identifying the locations represented in the dataset [24]. The study uses groundwater hydrochemical parameters, including electrical conductivity (E.C), total hardness (T.H), residual sodium carbonate (RSC), major ions and other water quality variables, to develop predictive models for NO3 concentration. The geographical coverage of the dataset provides the basis for examining nitrate prediction across the represented locations in Telangana.
Figure 2.
Spatial distribution of the geographical locations represented in the groundwater dataset across Telangana, India.
2.3. Models’ Theory
2.3.1. Boosted Tree (BT)
Boosted Tree (BT) is an ensemble learning technique that combines multiple decision trees to improve prediction accuracy. The model develops trees sequentially, with each new tree attempting to reduce the prediction errors of the existing ensemble. This approach enables the model to represent nonlinear relationships between groundwater hydrochemical parameters and nitrate (NO3) concentration [25]. Also, the BT model was developed using 450 trees, with a shrinkage rate of 0.05, an interaction depth of 3 and a minimum terminal node size of 13. The squared-error loss function was adopted to minimize the prediction errors during model development.
2.3.2. Efficient Linear Regression (ELR)
Efficient Linear Regression (ELR) is a regression-based modelling approach used to describe the relationship between a dependent variable and a set of independent variables. Linear regression estimates the contribution of each predictor to the response variable by fitting a linear equation to the observed data. In groundwater quality modelling, this approach can be used to investigate the relationship between hydrochemical parameters and NO3 concentration [26].
2.3.3. Educational Competition Optimizer (ECO)
The Educational Competition Optimizer (ECO) is a population-based metaheuristic algorithm developed to solve complex optimization problems. The algorithm is inspired by competitive processes observed in educational systems. It divides the optimization process into three stages, namely primary school, middle school and high school. These stages provide different search strategies to maintain a balance between exploration and exploitation. Exploration enables the algorithm to search different regions of the solution space, whereas exploitation improves promising solutions identified during the search [27].
2.3.4. Firefly Algorithm (FA)
The Firefly Algorithm (FA) is a population-based metaheuristic optimization technique inspired by the flashing behaviour of fireflies. The algorithm assumes that fireflies are attracted to individuals with greater brightness, while attractiveness decreases as the distance between them increases [28]. The brightness of each firefly is associated with the objective-function value of its corresponding solution. The algorithm searches for improved solutions by moving less attractive fireflies towards more attractive ones, while introducing random movement to maintain diversity in the search process [29].
2.3.5. Optimization Settings
The BT model was optimized using the ECO algorithm. The optimization procedure employed a population size of 12 and a maximum of 1000 iterations, while five-fold cross-validation was used to evaluate the candidate solutions. The random seed was set to 12,345 to ensure reproducibility. Three hyperparameters were considered during the optimization process, including the number of trees, minimum leaf size and maximum number of splits, with search ranges of 30–150, 1–20 and 2–100, respectively. The objective function was based on minimizing the mean squared error (MSE) obtained from five-fold cross-validation using the training data. The supplied MATLAB 2024a implementation performed ten optimization runs for each input configuration and data partition. In the ECO optimization procedure, the initial population was generated within a normalized search range of −10 to +10. The search process employed an adaptive control parameter, α, defined as 0.7 ((1−progress) + 0.05), which gradually decreases as the optimization progresses. Furthermore, the parameter β was varied randomly according to 0.2 + 0.6 rand to control the influence of the population members during candidate generation. An additional re-exploration mechanism was incorporated, with a probability of 0.10 (1−progress), to maintain search diversity and reduce the possibility of premature convergence. During the optimization process, a new candidate solution was accepted whenever it produced a lower objective function value than the previous solution. These procedures were used to balance the exploration and exploitation processes during the optimization of the Bagged Trees hyperparameters.
Similarly, the second MATLAB script, labelled BT-FA, was examined and implemented. The FA procedure also employed a population size of 12, a maximum of 1000 iterations and five-fold cross-validation, with the random seed set to 12,345. The same three BT hyperparameters were optimized, namely the number of trees (30–150), minimum leaf size (1–20) and maximum number of splits (2–100). The optimization objective was to minimize the cross-validation MSE using the training data. As implemented in the supplied script, ten optimization runs were performed for each input configuration and data partition. The FA was implemented using three control parameters, namely the randomization coefficient (α), initial attractiveness (β0) and light absorption coefficient (γ). The optimum values were selected as α = 0.20, β0 = 1.00 and γ = 0.50. The randomization coefficient controls the random movement of the fireflies and maintains diversity during the search process, while β0 determines the initial attractiveness between fireflies. Furthermore, γ regulates the reduction in attractiveness with increasing distance between fireflies. These parameters were considered to balance the exploration and exploitation processes during the optimization of the BT hyperparameters.
2.4. Performance Objectives and Validation
The performance of the developed models was evaluated using the coefficient of determination (R2), ratio of performance to interquartile distance (RPIQ), and relative absolute error (RAE). These statistical criteria were used to examine the agreement between predicted and observed groundwater nitrate (NO3) concentrations [30]. Furthermore, the three metrics provided complementary information on model accuracy, prediction error and performance relative to the distribution of the observed data.
The coefficient of determination (R2) measures the proportion of variation in the observed NO3 concentrations explained by the model. It is calculated as
where yi and ŷi represent the observed and predicted NO3 concentrations, respectively, ȳ is the mean of the observed concentrations, and n is the number of observations. Higher R2 values generally indicate better agreement between the predicted and observed values. However, R2 can be negative when predictions perform worse than the mean-based reference model.
R2 = 1 − [Σi=1n (yi − ŷi)2]/[Σi=1n (yi − ȳ)2]
The ratio of performance to interquartile distance (RPIQ) was used to assess prediction error relative to the spread of the observed NO3 concentrations. It is expressed as
where Q3 and Q1 denote the third and first quartiles of the observed values, respectively, and RMSE is the root mean square error. RMSE is calculated as
RPIQ = (Q3 − Q1) / RMSE
RMSE = √{(1/n) Σi=1n (yi − ŷi)2}
A higher RPIQ indicates lower prediction error relative to the interquartile range of the observed data. This metric relates prediction error to the central spread of the observations.
The relative absolute error (RAE) measures the total absolute prediction error relative to the absolute deviation of the observed values from their mean. It is calculated as
where yi, ŷi, and ȳ are the observed value, predicted value, and mean of the observed values, respectively. Lower RAE values indicate better predictive performance. A value below 1 indicates that the model has a lower total absolute error than a reference prediction based on the observed mean.
RAE = [Σi=1n |yi − ŷi|]/[Σi=1n |yi − ȳ|]
Furthermore, the dataset was divided into training and testing subsets using a 70%/30% partition [31]. The training subset was used to develop the models and estimate their parameters, whereas the testing subset was reserved to evaluate predictive performance on observations not used for model fitting. This procedure provided an assessment of the generalization ability of the developed models. Five-fold cross-validation was applied within the training procedure to examine model performance across different data subsets. The training data were divided into five approximately equal folds [32]. In each iteration, four folds were used for model fitting and the remaining fold was used for validation. The procedure was repeated five times so that each fold served once as the validation subset. The resulting validation performance was examined to assess the consistency of the models and support the selection of suitable model configurations (see Figure 3). For the optimized models, the optimization algorithms searched for suitable hyperparameter combinations using the training data [5]. The five-fold validation procedure was used to assess candidate configurations during model development. The 30% testing subset was kept separate from model fitting and hyperparameter optimization and was used for the final performance assessment. This separation was intended to reduce information leakage and provide a more independent evaluation of the optimized models [32].
Figure 3.
Validation technique used in the current study.
2.5. Explainable Artificial Intelligence Using SHAP
SHapley Additive exPlanations (SHAP) was employed to examine the contribution of the input variables to the predictions generated by the selected machine learning model [33]. The method is based on Shapley values from cooperative game theory, where the contribution of each input variable is determined by evaluating its influence on the model output. In this study, SHAP analysis was applied to the BT model using the training dataset. The Tree SHAP approach was employed. The mean absolute SHAP values were used to examine the relative importance of the input variables, whereas the SHAP summary and dependence plots were used to investigate the direction and distribution of their contributions to the model predictions [34]. Positive SHAP values indicate contributions towards higher predicted nitrate concentrations, while negative values indicate contributions towards lower predicted concentrations. The analysis was used to interpret model behaviour and the relative contribution of the predictors, rather than to establish causal relationships [34].
3. Results and Discussion
3.1. Spatial Analysis of NO3 Concentration
The spatial distribution of groundwater NO3 concentration was analyzed using 368 sampling locations across Telangana, India. The dataset represents post-monsoon measurements collected in 2020 and includes the geographical coordinates of each sampling location. The spatial analysis was conducted to examine the variation in NO3 concentration across the study area and identify locations with relatively high and low values. The number of groundwater samples varied across the districts, which is an important consideration when interpreting the spatial distribution of nitrate concentrations. A total of 368 observations were obtained from 33 districts, with the number of samples per district ranging from 4 to 36. Nalgonda had the highest number of observations (n = 36), followed by Nizamabad (n = 23) and Kamareddy (n = 21), whereas Bhupalpally and Mulugu had the lowest number of observations (n = 4 each). Furthermore, several districts were represented by relatively few samples, which may limit the extent to which the observed nitrate concentrations represent the overall groundwater conditions in those areas. Therefore, district-level nitrate statistics should be interpreted in relation to the corresponding sample size, particularly when comparing districts with different numbers of observations. This consideration is important for avoiding overgeneralisation of the observed spatial variations in groundwater nitrate concentrations.
Figure 4 shows that NO3 concentrations varied considerably among the sampling locations. The observed values ranged from 0.097 mg/L to 1028 mg/L, with a mean of 80.52 mg/L and a median of 39.73 mg/L. The mean was higher than the median, indicating a positively skewed distribution. Furthermore, the standard deviation was 118.29, confirming substantial variability in the recorded concentrations. The maximum value was considerably higher than the 75th percentile (92.78), suggesting the presence of extreme observations that require verification against the original records. The location-level results identified several sites with particularly high NO3 concentrations. Manchal in Rangareddy district recorded the maximum value of 1028, followed by Tirumalayapalem in Khammam (797.22) and Somaram in Yadadri (578.43). Other high values were recorded at Chandrugonda in Bhadradri (535.91) and Malkajgiri in Medchal (528.82). These observations indicate that high concentrations occurred at locations in different parts of the study area rather than being restricted to a single district. However, the spatial distribution alone cannot establish the sources responsible for these elevated values. District-level analysis further showed differences in mean NO3 concentration. Nagarkurnool recorded the highest district mean (180.50), followed by Yadadri (161.29), Rangareddy (157.19) and Khammam (144.57). In contrast, lower means were observed in Mulugu (7.45), Mancherial (8.56) and Wanaparthy (11.21). These differences describe the sampled locations and should be interpreted in consideration of the number of observations and the variability within each district. For example, Rangareddy had a standard deviation of 243.01, indicating substantial variation among its recorded locations. Global spatial autocorrelation was examined using Moran’s \( I\) , with eight nearest neighbours and inverse-distance spatial weights. The calculated Moran’s \( I\) was 0.0575, with a permutation \( p\) -value of 0.020 based on 999 permutations. The positive value indicates weak positive spatial autocorrelation, suggesting a limited tendency for nearby locations to have similar NO3 concentrations. Although the permutation result was statistically significant at the 5% level, the small Moran’s \( I\) value indicates that the spatial clustering was weak. Local spatial statistics would therefore be useful for determining whether specific high-concentration clusters or spatial outliers occur within the study area. Based on these results, groundwater NO3 concentration exhibited considerable variability across the sampled locations, together with weak positive spatial autocorrelation. The identified high-concentration locations warrant further investigation, particularly through data verification and local spatial analysis. These findings also support the use of spatially informed predictive modelling to examine the relationship between NO3 concentration and the measured hydrochemical parameters.
Figure 4.
Spatial distribution of groundwater NO3 concentration in Telangana, India.
3.2. Pre-Analysis Results
This sub-chapter briefly demonstrates the pre-modelling analysis, including three different data analyses, namely, descriptive statistics, correlation analysis and sensitivity analysis. Table 1 presents the descriptive statistical characteristics of 368 groundwater observations collected across Telangana State, India. The statistical parameters include the mean, median, mode, standard deviation, kurtosis, skewness, minimum and maximum values. These indicators provide information on the central tendency, variability and distribution patterns of the hydrochemical parameters, including groundwater nitrate concentrations. Regarding the major cations, calcium (Ca) and magnesium (Mg) recorded mean concentrations of 89.6 and 51.6, respectively. Total hardness (T.H) exhibited a mean of 435.9, with values ranging from 60.0 to 3479.2 and a standard deviation of 311.6. The sodium adsorption ratio (SAR) recorded a mean of 2.7, whereas residual sodium carbonate (RSC) exhibited a negative mean of −2.4. Electrical conductivity (E.C) recorded a mean of 1414.7, with a standard deviation of 1000.9 and a maximum value of 9499.0, indicating considerable variation in the dissolved ionic composition of the groundwater. Fluoride (F) exhibited a mean concentration of 1.0, with values ranging from 0.0 to 7.7. Considering the target variable, NO3− recorded a mean concentration of 80.5 mg/L, while the median and mode were 39.7 and 6.4 mg/L, respectively. The concentrations ranged from 0.1 to 1028.0 mg/L, with a standard deviation of 118.3 mg/L. The difference between the mean and median indicates a positively skewed distribution, which is further supported by the skewness coefficient of 3.5. The kurtosis value of 17.2 also indicates a highly peaked distribution with a pronounced upper tail and extreme observations. These statistical characteristics demonstrate substantial variation in groundwater nitrate concentrations across the sampled locations. Furthermore, most hydrochemical parameters exhibited positive skewness, particularly SO4 (13.1) and K (12.0), indicating the presence of relatively few observations with exceptionally high concentrations. The high kurtosis values of several parameters, including SO4 (212.7), K (181.5), Cl (25.9) and T.H (26.7), further demonstrate the presence of extreme observations and departures from a normal distribution. In contrast, pH exhibited a relatively symmetrical distribution, with a skewness of −0.1 and kurtosis of 0.0. In view of these results, the groundwater dataset exhibits considerable heterogeneity in its hydrochemical characteristics, particularly in nitrate concentration, electrical conductivity, chloride and total hardness. The positively skewed nitrate distribution and the presence of extreme observations are important considerations for subsequent feature selection, model development and predictive performance evaluation.
Table 1.
Descriptive statistics results of the current study.
Furthermore, Correlation analysis was performed to examine the strength and direction of the relationships between groundwater NO3 concentration and the measured hydrochemical parameters. The correlation coefficient ranges from −1 to +1, where positive values indicate that two variables tend to increase together, negative values indicate an inverse relationship, and values close to zero indicate a weak linear relationship. The analysis helps identify parameters associated with NO3 concentration and provides an initial basis for selecting predictor variables for the modelling process. However, correlation does not establish causation, and weak linear correlation does not necessarily exclude nonlinear relationships; that is why it is not used in the current study for feature selection engineering. As shown in Figure 5, NO3 exhibited positive correlations with E.C (r = 0.57), T.H (r = 0.53), K (r = 0.47), Cl (r = 0.44), Ca (r = 0.44) and Mg (r = 0.44). Furthermore, Na showed a moderate positive correlation with NO3 (r = 0.39), whereas SO4 exhibited a relatively weak positive correlation (r = 0.19). These results indicate that E.C and T.H had the strongest positive linear relationships with NO3 among the variables presented in the correlation matrix.
Figure 5.
Heatmap of the water quality parameters.
Moreover, the sensitivity analysis was conducted to evaluate the contribution of each hydrochemical parameter to groundwater NO3 prediction. The analysis examines how changes in input variables influence the model output and identifies the parameters that contribute most to the prediction. The results help determine the relative importance of the input variables and provide insight into the factors associated with NO3 concentration. Furthermore, sensitivity analysis supports model interpretation and helps identify the most informative parameters for groundwater quality assessment. Table 2 presents the random forest (RF)-based sensitivity analysis results for groundwater NO3 prediction. In the present study, RF-based feature selection was performed using the training data. The testing data were not used to determine the feature importance or select the input variables. This procedure ensures that the feature-selection process is independent of the observations used for final model evaluation.
Table 2.
Random forest-based sensitivity analysis results.
Total hardness (T.H) exhibited the highest importance score (0.2731), followed by electrical conductivity (E.C) with 0.2330. These two parameters were ranked as the most influential predictors and grouped under class C1. Furthermore, RSC (0.0844), HCO3 (0.0718) and K (0.0663) showed moderate contributions, followed by pH (0.0480) and F (0.0389), which were assigned to class C2. The remaining parameters, including SO4, Cl, Mg, gwl, Na, SAR, Ca and CO3, exhibited relatively low importance scores and were classified under C3. Among these parameters, CO3 recorded the lowest importance score (0.0014). Based on these results, T.H and E.C were identified as the dominant predictors of groundwater NO3 concentration, accounting for approximately 50.61% of the total RF importance. These findings provide a basis for selecting input combinations and examining their influence on the predictive performance of the developed models. Hence, the variables were arranged from the highest to the lowest importance, and the predictor combinations were developed progressively to examine the effect of the number of input variables on groundwater NO3 prediction.
The correlation matrix and RF sensitivity analysis provided complementary information for selecting the hydrochemical input variables for groundwater nitrate prediction. EC (r = 0.57) and TH (r = 0.53) showed the strongest positive correlations with nitrate, while RF ranked TH and EC as the first and second most influential predictors, with importance values of 0.2731 and 0.2330, respectively, accounting for 50.61% of the total importance. Furthermore, RSC showed a moderate negative correlation (r = −0.48) and ranked third in RF importance (0.0844), while K exhibited a positive correlation (r = 0.47) with an importance value of 0.0663. However, strong relationships were also observed among several hydrochemical parameters, particularly between EC and Cl (r = 0.94), TH (r = 0.88), Na (r = 0.83), Mg (r = 0.77) and Ca (r = 0.69). These relationships indicate possible overlap in the predictive information provided by some variables, which may explain why certain parameters showed moderate correlations with nitrate but relatively low RF importance. Therefore, the predictive contribution of EC should be interpreted with consideration of its relationship with the overall ionic composition of groundwater. This relationship may partly explain the predictive performance obtained when EC is included among the input variables. However, EC is not a direct measurement of nitrate concentration, and its relationship with nitrate may vary according to the contribution of other dissolved ions and the hydrogeochemical characteristics of groundwater. Consequently, models developed using EC should be considered as prediction or preliminary screening approaches rather than replacements for direct nitrate analysis.
- C1: The two most important variables, T.H and E.C, were selected.
- C2: The first five ranked variables were selected: T.H, E.C, RSC, HCO3 and K.
- C3: The first nine variables were selected: T.H, E.C, RSC, HCO3, K, pH, F, SO4 and Cl.
- C4: All 15 hydrochemical variables were included: T.H, E.C, RSC, HCO3, K, pH, F, SO4, Cl, Mg, gwl, Na, SAR, Ca and CO3.
3.3. Stand-Alone and Hybrid Optimized Results
The hydrochemical parameters were grouped into four input combinations (C1–C4) based on their RF importance rankings. C1 included the two highest-ranked variables, T.H and E.C, whereas C2 comprised the first five variables. C3 included the first nine variables, while C4 contained all 15 available hydrochemical parameters. This progressive selection strategy was used to evaluate the influence of input variable selection on groundwater NO3 prediction. Furthermore, comparing the four configurations helps determine whether including additional parameters improves model performance or whether a smaller set of influential variables is sufficient for accurate prediction.
Table 3a,b demonstrates the performance of the single and optimized models during the training and testing stages, respectively. The training phase demonstrates the performance of the models considering the use of the 5-cross validation method and without the 5-cross validation technique in order to compare the performance metrics of the techniques.
Table 3.
(a). Performance of the single and optimized models in the training stage for both with 5-cross validation and without 5-cross validation approaches. (b). Performance of the single and optimized models in the testing stage.
The model performance was evaluated using R2, RPIQ and RAE. During training, BT-FA-C4 achieved the highest mean R2 (0.988 ± 0.006) and mean RPIQ (5.764 ± 0.142), together with the lowest mean RAE (0.055 ± 0.005). Similarly, BT-ECO-C4 produced a mean R2 of 0.959 ± 0.014, an RPIQ of 3.076 ± 0.089 and an RAE of 0.083 ± 0.006. These results indicate that the optimized models provided a closer fit to the training data than the single models. Among the single models, BT-C4 performed best, with an R2 of 0.840 and an RAE of 0.314, followed by ELR-C4, which achieved an R2 of 0.735.
The testing results showed a similar pattern for the optimized models. BT-FA-C4 achieved the highest R2 (0.983) and RPIQ (10.256), with an RAE of 0.086. BT-ECO-C4 also showed strong performance, with an R2 value of 0.949, an RPIQ of 8.060 and an RAE of 0.097. In comparison, BT-C4 recorded the highest R2 among the single models (0.399), with an RPIQ of 1.091 and an RAE of 0.594. ELR-C4 produced an R2 of 0.237 and an RAE of 0.549. The remaining single models showed relatively low testing R2 values, ranging from 0.027 to 0.136, indicating limited predictive performance.
Based on these results, BT-FA-C4 was the best-performing model according to the reported metrics, followed by BT-ECO-C4. Furthermore, the improved results obtained with C4 suggest that the inclusion of all 15 hydrochemical parameters may benefit these models. The substantial difference between the optimized and single-model results was addressed by employing five-fold cross-validation (k = 5) to evaluate model performance more robustly. Furthermore, the optimization process was restricted to the training data to minimize the risk of data leakage and provide a more reliable assessment of predictive performance. The high testing R2 values obtained by BT-FA-C4 and BT-ECO-C4 were therefore assessed within this validation framework.
Furthermore, the quantitative performance results depicted in Table 3 can also be demonstrated using different visualizations. For instance, Figure 6 presents the agreement between the simulated and actual NO3 values for the different modelling configurations. The results show differences in predictive performance among the models. In several panels, the data points are widely scattered around the fitted regression lines, indicating limited agreement between the simulated and actual values. Furthermore, some models show a relatively weak relationship, as reflected by the shallow regression lines and the dispersion of observations. These patterns suggest that the models did not consistently reproduce the observed NO3 concentrations.
Figure 6.
Agreement comparison between simulated and actual NO3 values.
In contrast, the BT-FA-C4 and BT-ECO-C4 techniques show a closer alignment between the simulated and actual values, with most data points distributed along the fitted lines. This indicates better agreement and suggests that the corresponding models captured the variation in NO3 concentrations more effectively.
Moreover, Figure 7 presents the Taylor diagrams for the training (70%) and testing (30%) datasets. The diagrams compare the standard deviation and correlation coefficient of the simulated NO3 values with the observed values. The distance of each model from the reference point provides an indication of its agreement with the observed data, with higher correlation and a standard deviation closer to the observed value indicating better performance. During training, BT-FA-C4 and BT-ECO-C4 showed relatively high correlation coefficients and standard deviations close to the observed NO3 values. BT-FA-C4 was positioned near the observed standard deviation, indicating that it reproduced the variability of the training data more closely. Furthermore, several single models, including BT-C1, BT-C2 and BT-C3, showed lower correlation coefficients and greater differences in standard deviation, suggesting weaker agreement with the observed values. Based on these results, BT-FA-C4 and BT-ECO-C4 demonstrated the most favorable performance in the Taylor diagrams during both training and testing.
Figure 7.
Comparative performance of the models using the Taylor diagram.
Additionally, the numerical performance demonstrated in Table 3 can also be visualized using the box plot. Figure 8 presents the box plots comparing the distribution of simulated NO3 values obtained from the different modelling configurations. The plots show differences in the spread of the predicted values, the position of the central observations and the presence of extreme values. Several models exhibit positively skewed distributions, with most observations concentrated within a relatively narrow range and a number of high-value outliers. This pattern reflects the considerable variability in NO3 concentrations within the dataset.
Figure 8.
Box plot comparative performance for NO3 modelling.
Furthermore, the spread of the box plots varies among the models. Some configurations show a relatively compact distribution, whereas others exhibit wider dispersion and more extreme observations. The narrower distributions suggest lower variability in the simulated values, while the wider distributions indicate greater variation in model predictions. However, a compact distribution does not necessarily indicate better predictive performance, since the simulated values must also agree with the observed NO3 concentrations. Based on these results, Figure 8 demonstrates that the distribution of simulated NO3 values depends on the selected model and input configuration. The box plots therefore provide complementary information on the variability and distribution of model predictions.
Additionally, the numerical results of the current study are compared with recent studies published in the technical literature. In comparison, the study by Mogaraju [5] compared 19 machine-learning models for groundwater nitrate prediction using Central Ground Water Board datasets. The reported R2 values ranged from 0.44 to 0.51 across the examined dataset and spatial-input configurations. The BT-FA-C4 result in the present study is numerically higher, although differences in datasets, predictors and validation design prevent attributing this difference to the optimization algorithm alone. Also, the study by Karahan et al. [35], A Novel Method to Forecast Nitrate Concentration Levels in Irrigation Areas for Sustainable Agriculture, reported an R2 of 0.89 for its RF model using a 70%/30% training–testing partition. In comparison, the BT-FA-C4 model achieved a testing R2 of 0.983, indicating a higher coefficient of determination in the present study. However, the two results should be interpreted in relation to their respective datasets, model inputs and evaluation procedures. Also, Mahboobi et al. [21] investigated a heterogeneous ensemble approach involving random forest regression (RFR), k-nearest neighbours (KNN) and support vector regression (SVR) for nitrate prediction in the Qom aquifer, Iran. Their findings demonstrated the importance of combining different learning algorithms and considering spatial variations to improve prediction performance. Similarly, Jacob and Masilamani [10] evaluated nine machine learning algorithms for groundwater nitrate prediction and reported satisfactory performance using random forest during different seasonal periods. Li et al. [21] also demonstrated the potential of interpretable ensemble learning for groundwater nitrate prediction through the integration of different learning algorithms and SHAP analysis. Another important aspect of the present investigation concerns the influence of input-variable selection on model performance. Four input-variable combinations (C1–C4) were examined to determine how different hydrochemical predictor configurations influence the prediction of nitrate concentrations. This approach provides additional information compared with studies that mainly investigate model performance using a single input configuration. The results obtained from the four configurations showed that BT-FA-C4 model produced the best testing results, with R2, RPIQ and RAE values of 0.983, 10.256 and 0.086, respectively. This finding suggests that the selection of hydrochemical predictors plays an important role in determining the predictive capability of machine learning models. Furthermore, it provides an opportunity to examine whether increasing the number of input variables necessarily improves prediction accuracy or whether a smaller combination of relevant parameters can provide satisfactory results. The application of SHAP in the present study also provides an additional basis for comparing the proposed approach with previous groundwater nitrate modelling studies. While conventional performance indicators provide information about the predictive accuracy of a model, they do not sufficiently explain the contribution of individual input variables to the generated predictions. The SHAP analysis therefore provides further information regarding the relative contribution and direction of influence of the hydrochemical parameters considered in this study. The results indicated that BT-FA-C4 model produced the best testing results, with R2, RPIQ and RAE values of 0.983, 10.256 and 0.086, respectively. These findings can be considered in relation to previous studies reporting the influence of hydrochemical and environmental factors on groundwater nitrate distribution. However, differences in the identified influential variables may be associated with variations in geological conditions, groundwater chemistry, land-use characteristics and the distribution of the available observations. Based on these comparisons, the present study provides an additional modelling approach by combining bio-inspired optimized BT models, different hydrochemical input configurations and SHAP-based interpretation within a single framework. The integration of these techniques provides an opportunity to investigate predictive performance and variable contributions simultaneously. Furthermore, the use of R2, RPIQ and RAE provides complementary information regarding model fitting and prediction errors during both training and testing phases. These findings demonstrate the potential application of optimized tree-based learning techniques for groundwater nitrate prediction and provide additional information for nitrogen pollution assessment.
Moreover, Figure 9 provides the hydrogeochemical interpretation of groundwater nitrate concentrations and provides further insight into the possible sources and processes influencing nitrate occurrence in the study area.
Figure 9.
Conceptual representation of possible nitrate sources, infiltration pathways and hydrogeochemical processes influencing groundwater nitrate concentrations.
As illustrated in the conceptual diagram, agricultural activities may contribute to groundwater nitrate through the application of nitrogen- and potassium-containing fertilizers, followed by infiltration and leaching through the soil into the underlying aquifer. This interpretation is supported by the positive correlation between nitrate and K+ (r = 0.47), suggesting a possible association with potassium-based fertilizers. Furthermore, the positive correlations with Cl− (r = 0.44) and Na+ (r = 0.39) indicate possible contributions from domestic wastewater, septic leakage, sewage discharge and other anthropogenic activities. These ions may enter the groundwater system through infiltration and subsequent transport within the aquifer. Moreover, the positive relationship between nitrate and total hardness (r = 0.53) suggests an association between nitrate occurrence and the overall hydrochemical composition of groundwater. This relationship may be influenced by mineral dissolution and cation exchange involving Ca2+, Mg2+, Na+ and K+. In addition, animal waste and urban runoff may represent other potential non-point sources contributing to groundwater contamination. Based on these observations, nitrate occurrence in the study area may be associated with a combination of agricultural inputs, domestic wastewater and natural hydrogeochemical processes. However, further isotopic and geochemical investigations would be required to confirm the specific sources and distinguish their individual contributions. Hence, the practical utility of the developed models lies in their potential to support preliminary groundwater nitrate assessment and identify locations that may require further investigation. The optimized BT-ECO and BT-FA models demonstrated improved predictive performance, suggesting their potential for estimating nitrate concentrations from routinely measured hydrochemical parameters. Furthermore, the identification of influential parameters, particularly EC and TH, may help guide the groundwater monitoring programme by providing useful information on the variables associated with nitrate occurrence. Such predictions could assist water resource managers and policymakers in prioritizing groundwater sampling, identifying potentially vulnerable areas and allocating laboratory testing resources more efficiently. However, the developed models are intended to complement rather than replace conventional laboratory nitrate analysis, particularly where accurate assessment of drinking-water quality and compliance with regulatory limits is required.
3.4. Explainable Artificial Intelligence (XAI)
Explainable Artificial Intelligence (XAI) refers to methods used to interpret the predictions generated by machine learning models. These methods provide information on how input variables contribute to the model outputs and help explain the relationships between the input parameters and the predicted target variable. In this study, XAI was applied to investigate the contribution of hydrochemical parameters to groundwater NO3 prediction.
Shapley Additive Explanations (SHAP) is an XAI method based on cooperative game theory. It quantifies the contribution of each input variable to an individual prediction by estimating its influence on the model output relative to a baseline prediction. Positive SHAP values indicate that a variable increases the predicted NO3 concentration, whereas negative values indicate that it decreases the prediction. Furthermore, the magnitude of a SHAP value represents the strength of a variable’s contribution to the prediction. SHAP can therefore be used to identify the most influential hydrochemical parameters and examine how their values affect the predicted NO3 concentrations.
Also, Figure 10 presents the mean absolute SHAP values for the groundwater parameters used in NO3 modelling. T.H showed the highest SHAP importance, with a value of approximately 32.9, followed by E.C (22.3) and RSC (19.0). These results indicate that total hardness, electrical conductivity and residual sodium carbonate were the most influential parameters in the model predictions. Furthermore, HCO3 showed a moderate contribution, with a mean absolute SHAP value of approximately 6.4, followed by SO4, Mg, Cl and pH. In contrast, F, Na, K and SAR showed relatively low contributions. Ca, groundwater level (gwl) and CO3 recorded the lowest SHAP importance, indicating that these parameters had a limited influence on the model predictions compared with the other variables.
Figure 10.
The SHAP mean absolute values for groundwater parameters used in NO3 modelling.
Based on these results, T.H, E.C and RSC were the dominant parameters influencing the predicted NO3 concentrations. The higher importance of T.H and E.C suggests that the model relied strongly on indicators of groundwater mineral content and ionic composition. However, the SHAP values represent the contribution of each parameter to the model predictions and do not establish a direct causal relationship with groundwater NO3 concentrations.
The SHAP results are consistent with both the sensitivity analysis and the correlation analysis, which also identified T.H and E.C among the most influential variables for NO3 modelling. The correlation analysis showed positive relationships between NO3 and E.C (r = 0.57) and T.H (r = 0.53), whereas RSC showed a negative relationship (r = −0.48). Furthermore, the RF sensitivity analysis ranked T.H and E.C as the two most important predictors, followed by RSC. The agreement among these methods strengthens the evidence that these three hydrochemical parameters are important for explaining the model’s NO3 predictions, although their rankings reflect different statistical and modelling properties.
From an environmental perspective, the high importance of E.C indicates that groundwater mineralization and dissolved ionic content may be relevant to the observed variation in NO3 concentrations. Total hardness reflects the presence of dissolved calcium and magnesium, while RSC represents the balance between carbonate and bicarbonate ions and calcium and magnesium. Their importance suggests that nitrate prediction is associated with broader hydrochemical characteristics rather than a single water quality parameter. These relationships may help identify groundwater locations requiring further investigation and support the selection of key parameters for routine water quality monitoring. However, the observed associations do not establish that these parameters directly cause changes in nitrate concentration; additional hydrogeochemical and land-use information would be required to determine the processes responsible for the observed patterns.
Furthermore, the SHAP distribution shows that high T.H and E.C values are associated with positive SHAP values for several observations, indicating an increase in the predicted NO3 concentration. In contrast, high RSC values are mainly associated with negative SHAP values, whereas lower RSC values tend to show positive contributions. HCO3, SO4, Mg and Cl show comparatively smaller effects, although their contributions vary across observations. The remaining parameters, including pH, F, Na, K, SAR, Ca, groundwater level (gwl) and CO3, are generally concentrated around zero, indicating relatively limited contributions to the model output. These results are consistent with the sensitivity and correlation analyses, which also identified T.H, E.C and RSC as important variables for NO3 modelling. From an environmental perspective, the influence of T.H and E.C suggests that groundwater mineralization and ionic composition are associated with the predicted nitrate concentrations. The contribution of RSC further indicates that carbonate–bicarbonate balance and calcium–magnesium chemistry may provide additional information for interpreting groundwater quality. These findings can support the selection of hydrochemical parameters for groundwater monitoring and nitrate assessment. However, the SHAP results describe the model’s learned relationships and do not establish direct causal effects between the hydrochemical parameters and nitrate concentrations.
3.5. Limitations of the Study and Future Research Directions
Despite the promising results obtained in this study, some limitations associated with the developed prediction framework should be acknowledged. First, the performance of the developed models depends largely on the quality, distribution and representativeness of the available groundwater hydrochemical data. Although four input-variable combinations (C1–C4) were examined to investigate the influence of different predictor configurations, the selected variables may not completely represent all the hydrogeochemical processes influencing nitrate concentrations. Factors such as land-use characteristics, agricultural activities, fertilizer application, soil properties, rainfall, groundwater recharge and seasonal variations may also contribute to nitrate distribution. The absence or limited availability of such information may restrict the ability of the models to capture some environmental processes associated with nitrogen pollution. Therefore, future studies should consider integrating hydrochemical measurements with climatic, geological, land-use and anthropogenic information to improve the representation of the factors influencing groundwater nitrate concentrations. Also, among the major limitations of the current study is that the random partition does not provide independent spatial validation and that the transferability of the models to other locations remains to be established.
Similarly, the integration of the ECO and FA provides an optimization mechanism for improving model performance; however, both algorithms are stochastic optimization techniques whose search processes may be influenced by their initial population, parameter settings and convergence behaviour. Consequently, different optimization runs may produce variations in the selected solutions. Further investigation involving repeated optimization experiments, alternative population sizes and convergence analysis would be useful to examine the stability and consistency of the optimized models. In addition, the computational requirements associated with optimization may increase with dataset size and model complexity.
Another limitation concerns the interpretation of model predictions using SHAP. Although SHAP provides useful information regarding the contribution of individual input variables to model predictions, the estimated contributions should not be interpreted as direct evidence of causal relationships. The presence of correlations and interactions among hydrochemical parameters may also influence the distribution of SHAP values. Therefore, the interpretation of influential variables should be considered together with hydrogeochemical knowledge and additional environmental evidence. Future research could further investigate the relationships between the identified influential parameters and nitrate contamination through the integration of SHAP with other explainable artificial intelligence techniques and hydrogeochemical assessment approaches.
Moreover, the applicability of the developed models to other groundwater systems requires further investigation. The predictive performance obtained from the available dataset may not necessarily be maintained under different geological, climatic and anthropogenic conditions. Although the training and testing evaluation provides information about the predictive capability of the developed models, independent validation using groundwater datasets from other locations and different sampling periods would provide stronger evidence of their generalization ability.
Overall, according to these limitations, further research should investigate the integration of additional environmental and anthropogenic variables, alternative machine learning architectures, advanced optimization techniques and independent validation strategies. Furthermore, the application of the developed framework to larger groundwater datasets covering different geographical and seasonal conditions could provide a more comprehensive understanding of nitrate distribution. These improvements may contribute to the development of more reliable and transferable prediction models for groundwater nitrate assessment and provide useful information for groundwater monitoring, nitrogen pollution management and environmental decision-making.
4. Conclusions and Recommendations
This study investigated groundwater NO3 prediction using machine learning models, feature selection and XAI. The hydrochemical parameters were grouped into four input configurations (C1–C4) based on their RF importance rankings. The results showed that model performance varied considerably with the selected input variables and modelling approach. Among the single models, BT-C4 provided the best testing performance. However, the optimized models achieved higher prediction accuracy, with BT-FA-C4 producing the highest testing R2 (0.983) and the lowest RAE of 0.0864. These results indicate that integrating optimization algorithms with BT regression improved the prediction performance for the dataset considered. The feature selection results identified T.H and E.C as the most influential hydrochemical parameters, followed by RSC, HCO3 and K. Furthermore, the SHAP analysis identified T.H, E.C and RSC as the leading contributors to the model predictions. This agreement with the RF sensitivity and correlation analyses supports the importance of these parameters in explaining the predicted NO3 concentrations in the current study. From an environmental perspective, these findings suggest that groundwater mineralization and ionic composition provide useful information for nitrate prediction. The identified parameters may therefore be considered when selecting variables for groundwater quality monitoring and assessment.
Also, the following recommendations are proposed:
- Groundwater monitoring: T.H, E.C and RSC should receive particular attention when selecting hydrochemical parameters for nitrate assessment while retaining direct NO3 measurements for validation. These results indicate their predictive relevance within the dataset but do not establish them as direct indicators or sources of nitrate contamination. Therefore, these parameters should be considered complementary hydrochemical predictors that may support preliminary nitrate assessment rather than substitutes for direct nitrate measurement or specific indicators of nitrate pollution.
- Future studies should therefore consider spatial and temporal validation, together with the assessment of model transferability across different aquifer systems. The integration of geographical information systems (GIS), groundwater flow modelling and spatially distributed environmental variables may also provide additional information for understanding the spatial variability of nitrate contamination.
Funding
This research received no external funding.
Institutional Review Board Statement
Not applicable.
Informed Consent Statement
Not applicable.
Data Availability Statement
The data used in the current study can be obtained from platform https://www.kaggle.com/datasets/sivapriyagarladinne/telangana-post-monsoon-ground-water-quality-data (accessed on 11 September 2026).
Acknowledgments
The author would like to thank Near East University for supporting this project.
Conflicts of Interest
The author declares no conflicts of interest.
References
- Kom, K.P.; Gurugnanam, B.; Bairavi, S. Non-carcinogenic health risk assessment of nitrate and fluoride contamination in the groundwater of Noyyal basin, India. Geod. Geodyn. 2022, 13, 619–631. [Google Scholar] [CrossRef] [Scilit]
- Karunanidhi, D.; Aravinthasamy, P.; Subramani, T.; Wu, J. Potential health risk assessment for fluoride and nitrate contamination in hard rock aquifers of Shanmuganadhi River basin, South India. Hum. Ecol. Risk Assess. An. Int. J. 2019, 25, 250–270. [Google Scholar] [CrossRef] [Scilit]
- Jia, H.; Qian, H. Groundwater nitrate response to hydrogeological conditions and socioeconomic load in an agriculture dominated area. Sci. Rep. 2025, 15, 1315. [Google Scholar] [CrossRef] [Scilit] [PubMed]
- Zenebe, G.B.; Hailu, G.; Girmay, A.; Hussien, A.; Abrehe, S. Evaluation of geostatistical interpolation methods on spatial representation of groundwater depth and nitrate concentration of Elalla-Aynalem wellfield, Northern Ethiopia. Discov. Water 2025, 5, 9. [Google Scholar] [CrossRef] [Scilit]
- Mogaraju, J.K. Evaluation of spatial effects on hydrogeochemical interactions in nitrate pollution using machine learning and explainable artificial intelligence. Discov. Geosci. 2026, 4, 32. [Google Scholar] [CrossRef] [Scilit]
- Patil, M.; Davala, M.S.; Kumar, R.S.; Dixit, S. Investigating the relationship between groundwater augmentation and water quality in the 6000 ha watershed in Telangana state, India. Groundw. Sustain. Dev. 2022, 19, 100857. [Google Scholar] [CrossRef] [Scilit]
- Senapati, C. A Comprehensive Approach to Groundwater Quality Prediction and Management in the State of Telangana, India, Using Stacking Ensemble Approach. In Proceedings of the 2024 International Conference on Emerging Systems and Intelligent Computing (ESIC), Bhubaneswar, India, 9–10 February 2024; pp. 118–123. [Google Scholar] [CrossRef] [Scilit]
- Adimalla, N.; Dhakate, R.; Kasarla, A.; Kumar, A. Appraisal of groundwater quality for drinking and irrigation purposes in Central Telangana, India. Groundw. Sustain. Dev. 2020, 10, 100334. [Google Scholar] [CrossRef] [Scilit]
- Adimalla, N.; Qian, H. Groundwater chemistry, distribution and potential health risk appraisal of nitrate enriched groundwater: A case study from the semi-urban region of South India. Ecotoxicol. Environ. Saf. 2021, 207, 111277. [Google Scholar] [CrossRef] [Scilit] [PubMed]
- Jacob, C.; Masilamani, U.S. Performance evaluation of different machine learning algorithms for prediction of nitrate in groundwater in Thiruvannamalai District. CLEAN–Soil Air Water 2025, 53, 2400060. [Google Scholar] [CrossRef] [Scilit]
- Amir, M.; Reshadi, M.; Rezanezhad, F.; Shahvaran, A.R. Assessment of environmental and socioeconomic drivers of urban stormwater microplastics using machine learning. Sci. Rep. 2025, 15, 6299. [Google Scholar] [CrossRef] [Scilit] [PubMed]
- Ghosh, T. Groundwater hydro-geochemical inferences and eXplainable Artificial Intelligence augmented groundwater quality prediction in arid and semi-arid segment of Rajasthan, India. Groundw. Sustain. Dev. 2024, 26, 101272. [Google Scholar] [CrossRef] [Scilit]
- Mbunge, E.; Millham, R.C.; Sibiya, M.N.; Takavarasha, S. Application of machine learning models to predict malaria using malaria cases and environmental risk factors. In 2022 Conference on Information Communications Technology and Society (ICTAS); IEEE: Piscataway, NJ, USA, 2022; pp. 1–5. [Google Scholar]
- Rahman, A.T.M.S.; Hosono, T.; Quilty, J.M.; Das, J.; Basak, A. Multiscale groundwater level forecasting: Coupling new machine learning approaches with wavelet transforms. Adv. Water Resour. 2019, 141, 103595. [Google Scholar] [CrossRef] [Scilit]
- Agrawal, P.; Abutarboush, H.F.; Ganesh, T.; Mohamed, A.W. Metaheuristic algorithms on feature selection: A survey of one decade of research (2009–2019). IEEE Access 2021, 9, 26766–26791. [Google Scholar] [CrossRef] [Scilit]
- Breiman, L. Random Forests. Mach. Learn. 2001, 45, 5–32. [Google Scholar] [CrossRef] [Scilit]
- Rodriguez-galiano, V.F.; Luque-espinar, J.A.; Chica-olmo, M.; Mendes, M.P. Feature selection approaches for predictive modelling of groundwater nitrate pollution: An evaluation of fi lters, embedded and wrapper methods. Sci. Total Environ. 2018, 624, 661–672. [Google Scholar] [CrossRef] [Scilit] [PubMed]
- Lary, D.J.; Alavi, A.H.; Gandomi, A.H.; Walker, A.L. Machine learning in geosciences and remote sensing. Geosci. Front. 2016, 7, 3–10. [Google Scholar] [CrossRef] [Scilit]
- Shyamala, G.; Neelamegam, P.; Alphonse, B.J.; Berhe, M.A.; Kumar, K.R.; Hemalatha, B. Explainable artificial intelligence for groundwater quality prediction and hydrochemical interpretation. Sci. Rep. 2026, 16, 1–27. [Google Scholar] [CrossRef] [Scilit] [PubMed]
- Liang, Y.; Zhang, X.; Gan, L.; Chen, S.; Zhao, S.; Ding, J.; Kang, W.; Yang, H. Mapping specific groundwater nitrate concentrations from spatial data using machine learning: A case study of chongqing, China. Heliyon 2024, 10, e27867. [Google Scholar] [CrossRef] [Scilit] [PubMed]
- Mahboobi, H.; Shakiba, A.; Mirbagheri, B. Improving groundwater nitrate concentration prediction using local ensemble of machine learning models. J. Environ. Manag. 2023, 345, 118782. [Google Scholar] [CrossRef] [Scilit] [PubMed]
- Li, M.; Yu, D.; Yang, F.; Yu, L.; Bai, J.; Zhi, C.; Chang, W.; Hu, X. Spatial prediction of coastal groundwater nitrate using combined feature selection and explainable machine learning. J. Environ. Manag. 2026, 419, 131222. [Google Scholar] [CrossRef] [Scilit] [PubMed]
- Rajkumar, V.; Shailaja, K.; Gangadhar Rao, S. A Study on Impact of Agricultural Activities on the Groundwater Quality of Medchal Malkajgiri District, Telangana State, India. Plant Sci. Arch. 2024, 9, 5–10. [Google Scholar] [CrossRef] [Scilit]
- Rao, N.S.; Sunitha, B.; Rambabu, R.; Rao, P.V.N.; Rao, P.S.; Spandana, B.D.; Sravanthi, M.; Marghade, D. Quality and degree of pollution of groundwater, using PIG from a rural part of Telangana State, India. Appl. Water Sci. 2018, 8, 227. [Google Scholar] [CrossRef] [Scilit]
- Motevalli, A.; Naghibi, S.A.; Hashemi, H.; Berndtsson, R.; Pradhan, B.; Gholami, V. Inverse method using boosted regression tree and k-nearest neighbor to quantify effects of point and non-point source nitrate pollution in groundwater. J. Clean. Prod. 2019, 228, 1248–1263. [Google Scholar] [CrossRef] [Scilit]
- Gholami, V.; Booij, M.J. Use of machine learning and geographical information system to predict nitrate concentration in an unconfined aquifer in Iran. J. Clean. Prod. 2022, 360, 131847. [Google Scholar] [CrossRef] [Scilit]
- Lian, J.; Zhu, T.; Ma, L.; Wu, X.; Heidari, A.A.; Chen, Y.; Chen, H.; Hui, G. The educational competition optimizer. Int. J. Syst. Sci. 2024, 55, 3185–3222. [Google Scholar] [CrossRef] [Scilit]
- Yang, X. Firefly Algorithms for Multimodal Optimization; Springer Nature: Berlin/Heidelberg, Germany, 2009; pp. 169–170. [Google Scholar]
- Yang, X. Firefly algorithm: Recent advances and applications. Int. J. Swarm Intell. 2013, 1, 36–50. [Google Scholar] [CrossRef] [Scilit]
- Onyutha, C. Pros and cons of various efficiency criteria for hydrological model performance evaluation. Proc. IAHS 2024, 385, 181–187. [Google Scholar] [CrossRef] [Scilit]
- Adelabu, S.; Mutanga, O.; Adam, E. Testing the reliability and stability of the internal accuracy assessment of random forest for classifying tree defoliation levels using different validation methods. Geocarto Int. 2015, 30, 810–821. [Google Scholar] [CrossRef] [Scilit]
- Moayedi, H.; Osouli, A.; Nguyen, H.; Rashid, A.S.A. A novel Harris hawks’ optimization and k-fold cross-validation predicting slope stability. Eng. Comput. 2019, 37, 369–379. [Google Scholar] [CrossRef] [Scilit]
- Laphrom, W.; Se, C.; Champahom, T.; Jomnonkwao, S.; Wipulanusatd, W.; Satiennam, T.; Ratanavaraha, V. XGBoost-SHAP and Unobserved Heterogeneity Modelling of Temporal Multivehicle Truck-Involved Crash Severity Patterns. Civ. Eng. J. 2024, 10, 1890–1908. [Google Scholar] [CrossRef] [Scilit]
- Anjum, M.; Khan, K.; Ahmad, W.; Ahmad, A.; Amin, M.N.; Nafees, A. New SHapley Additive ExPlanations (SHAP) approach to evaluate the raw materials interactions of steel-fiber-reinforced concrete. Materials 2022, 15, 6261. [Google Scholar] [CrossRef] [Scilit] [PubMed]
- Karahan, H. A Novel Method to Forecast Nitrate Concentration Levels in Irrigation Areas for Sustainable Agriculture. Agriculture 2025, 15, 161. [Google Scholar] [CrossRef] [Scilit]
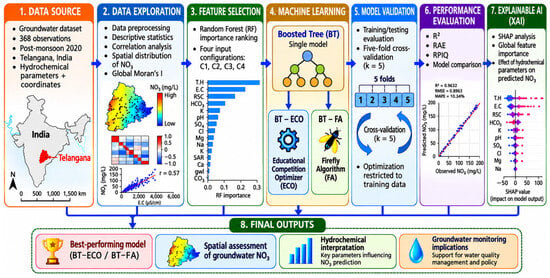
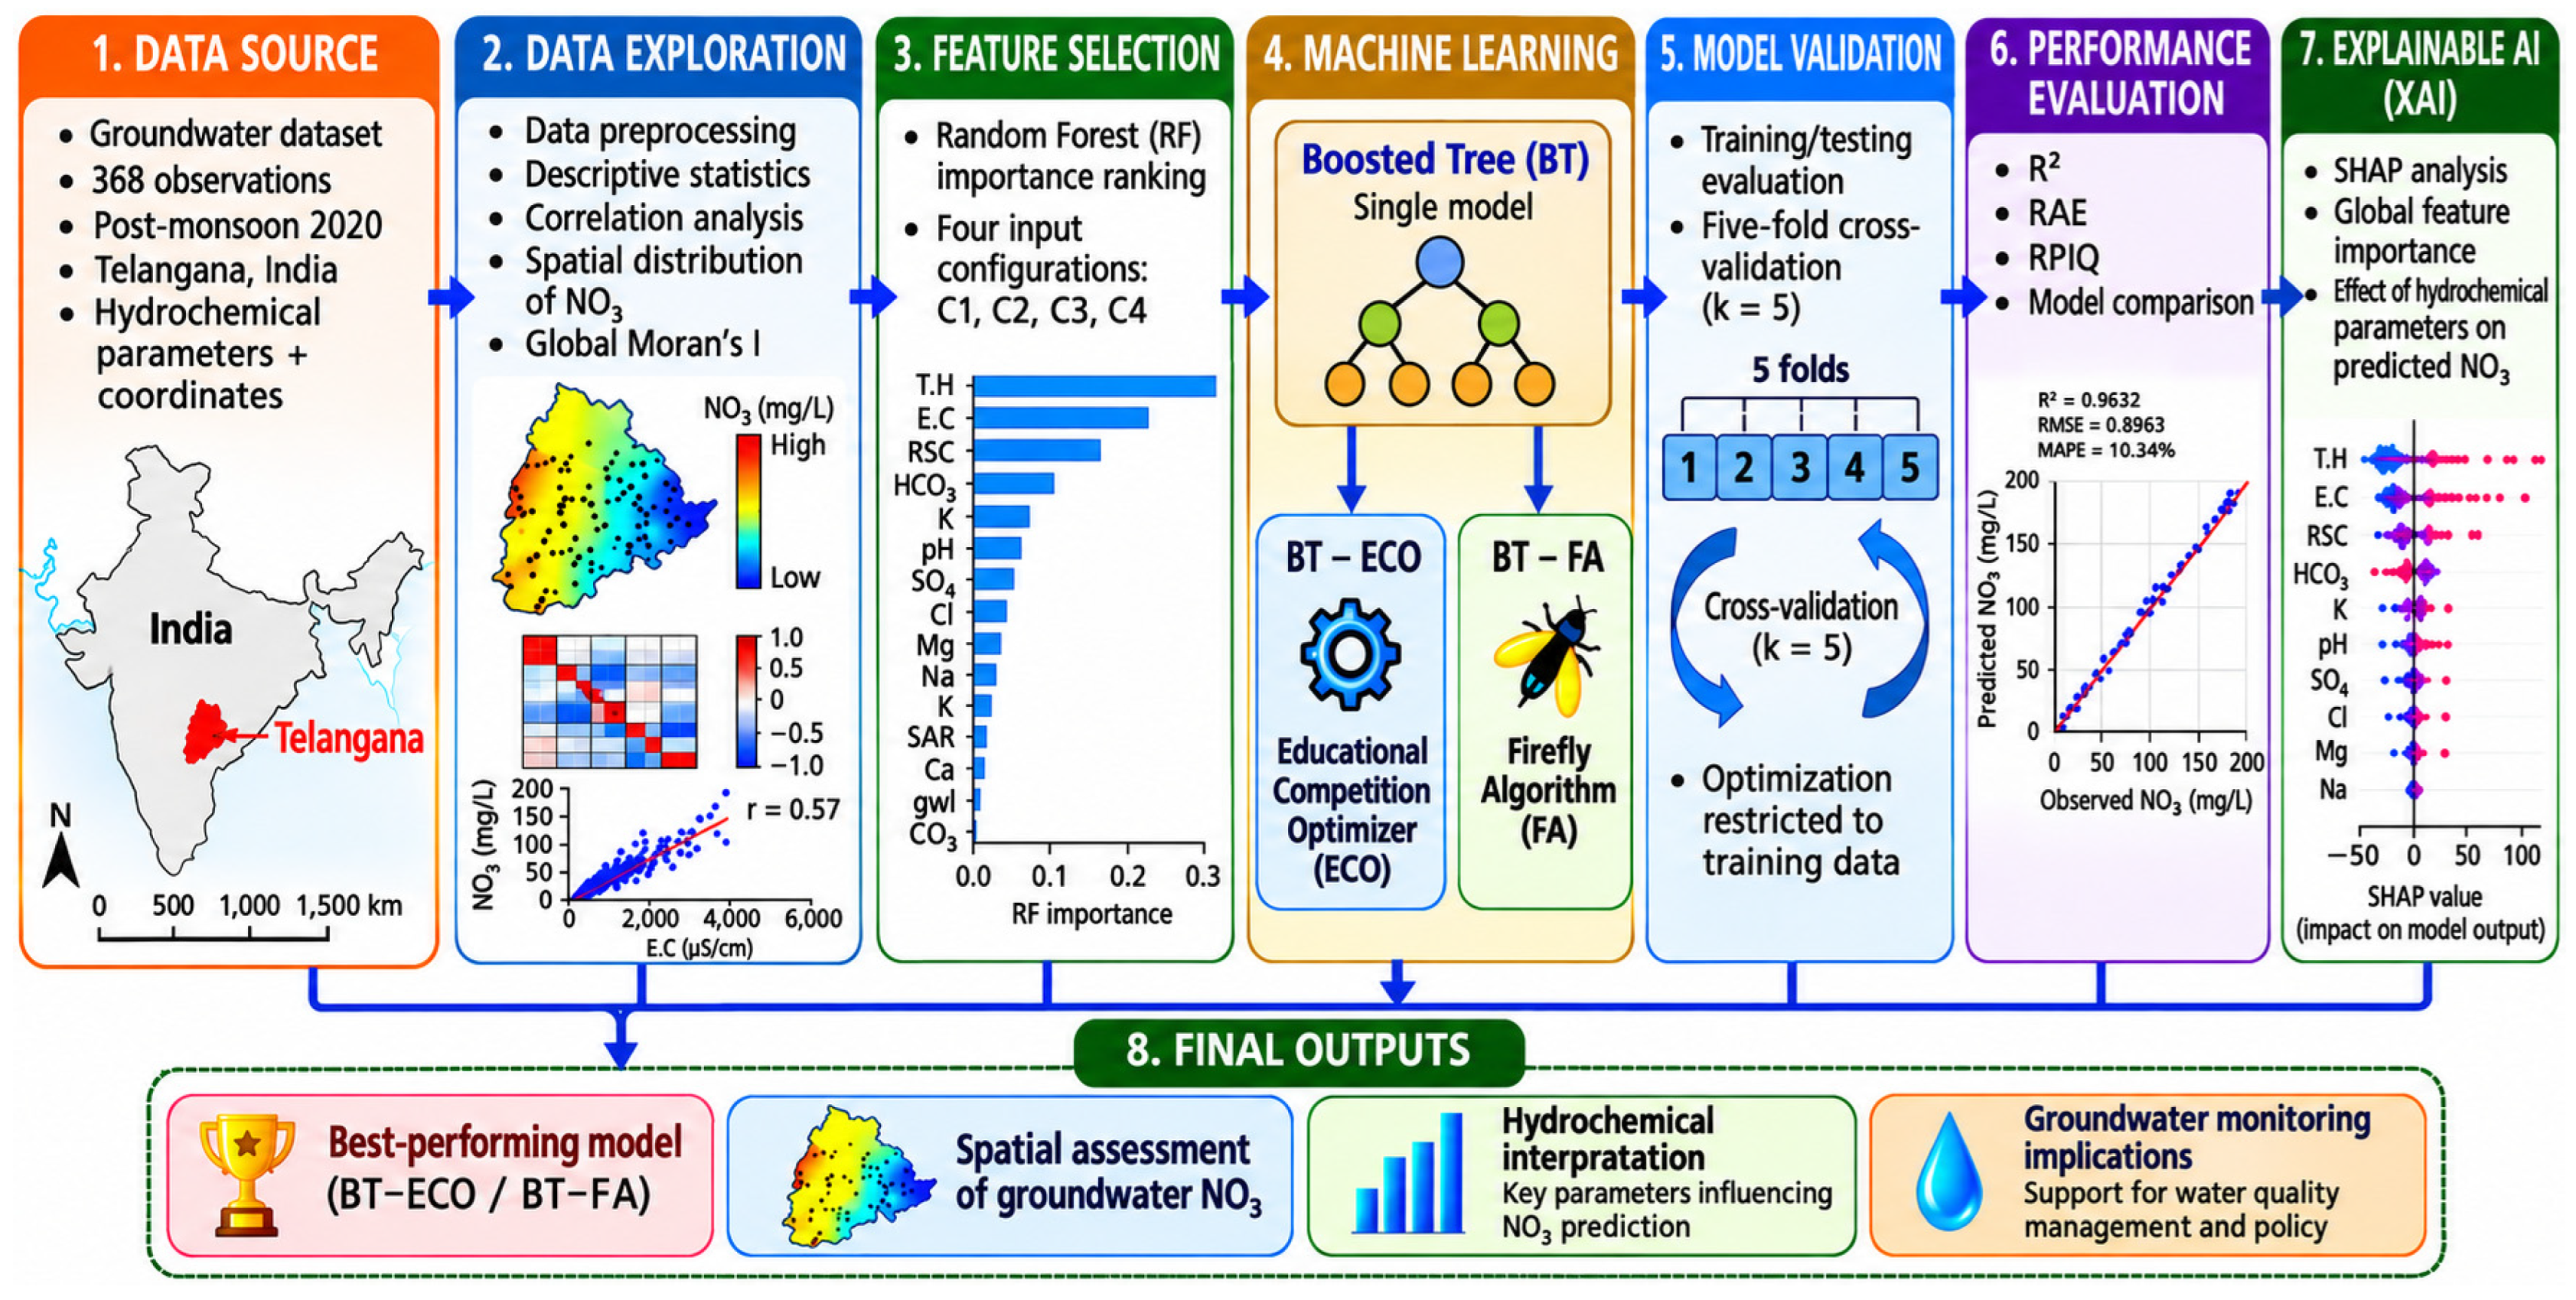
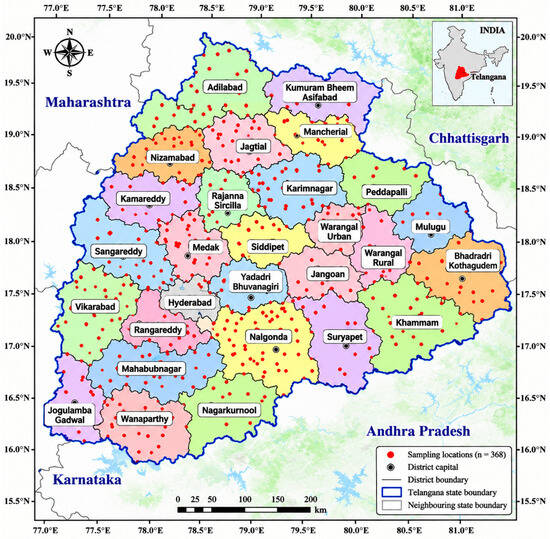
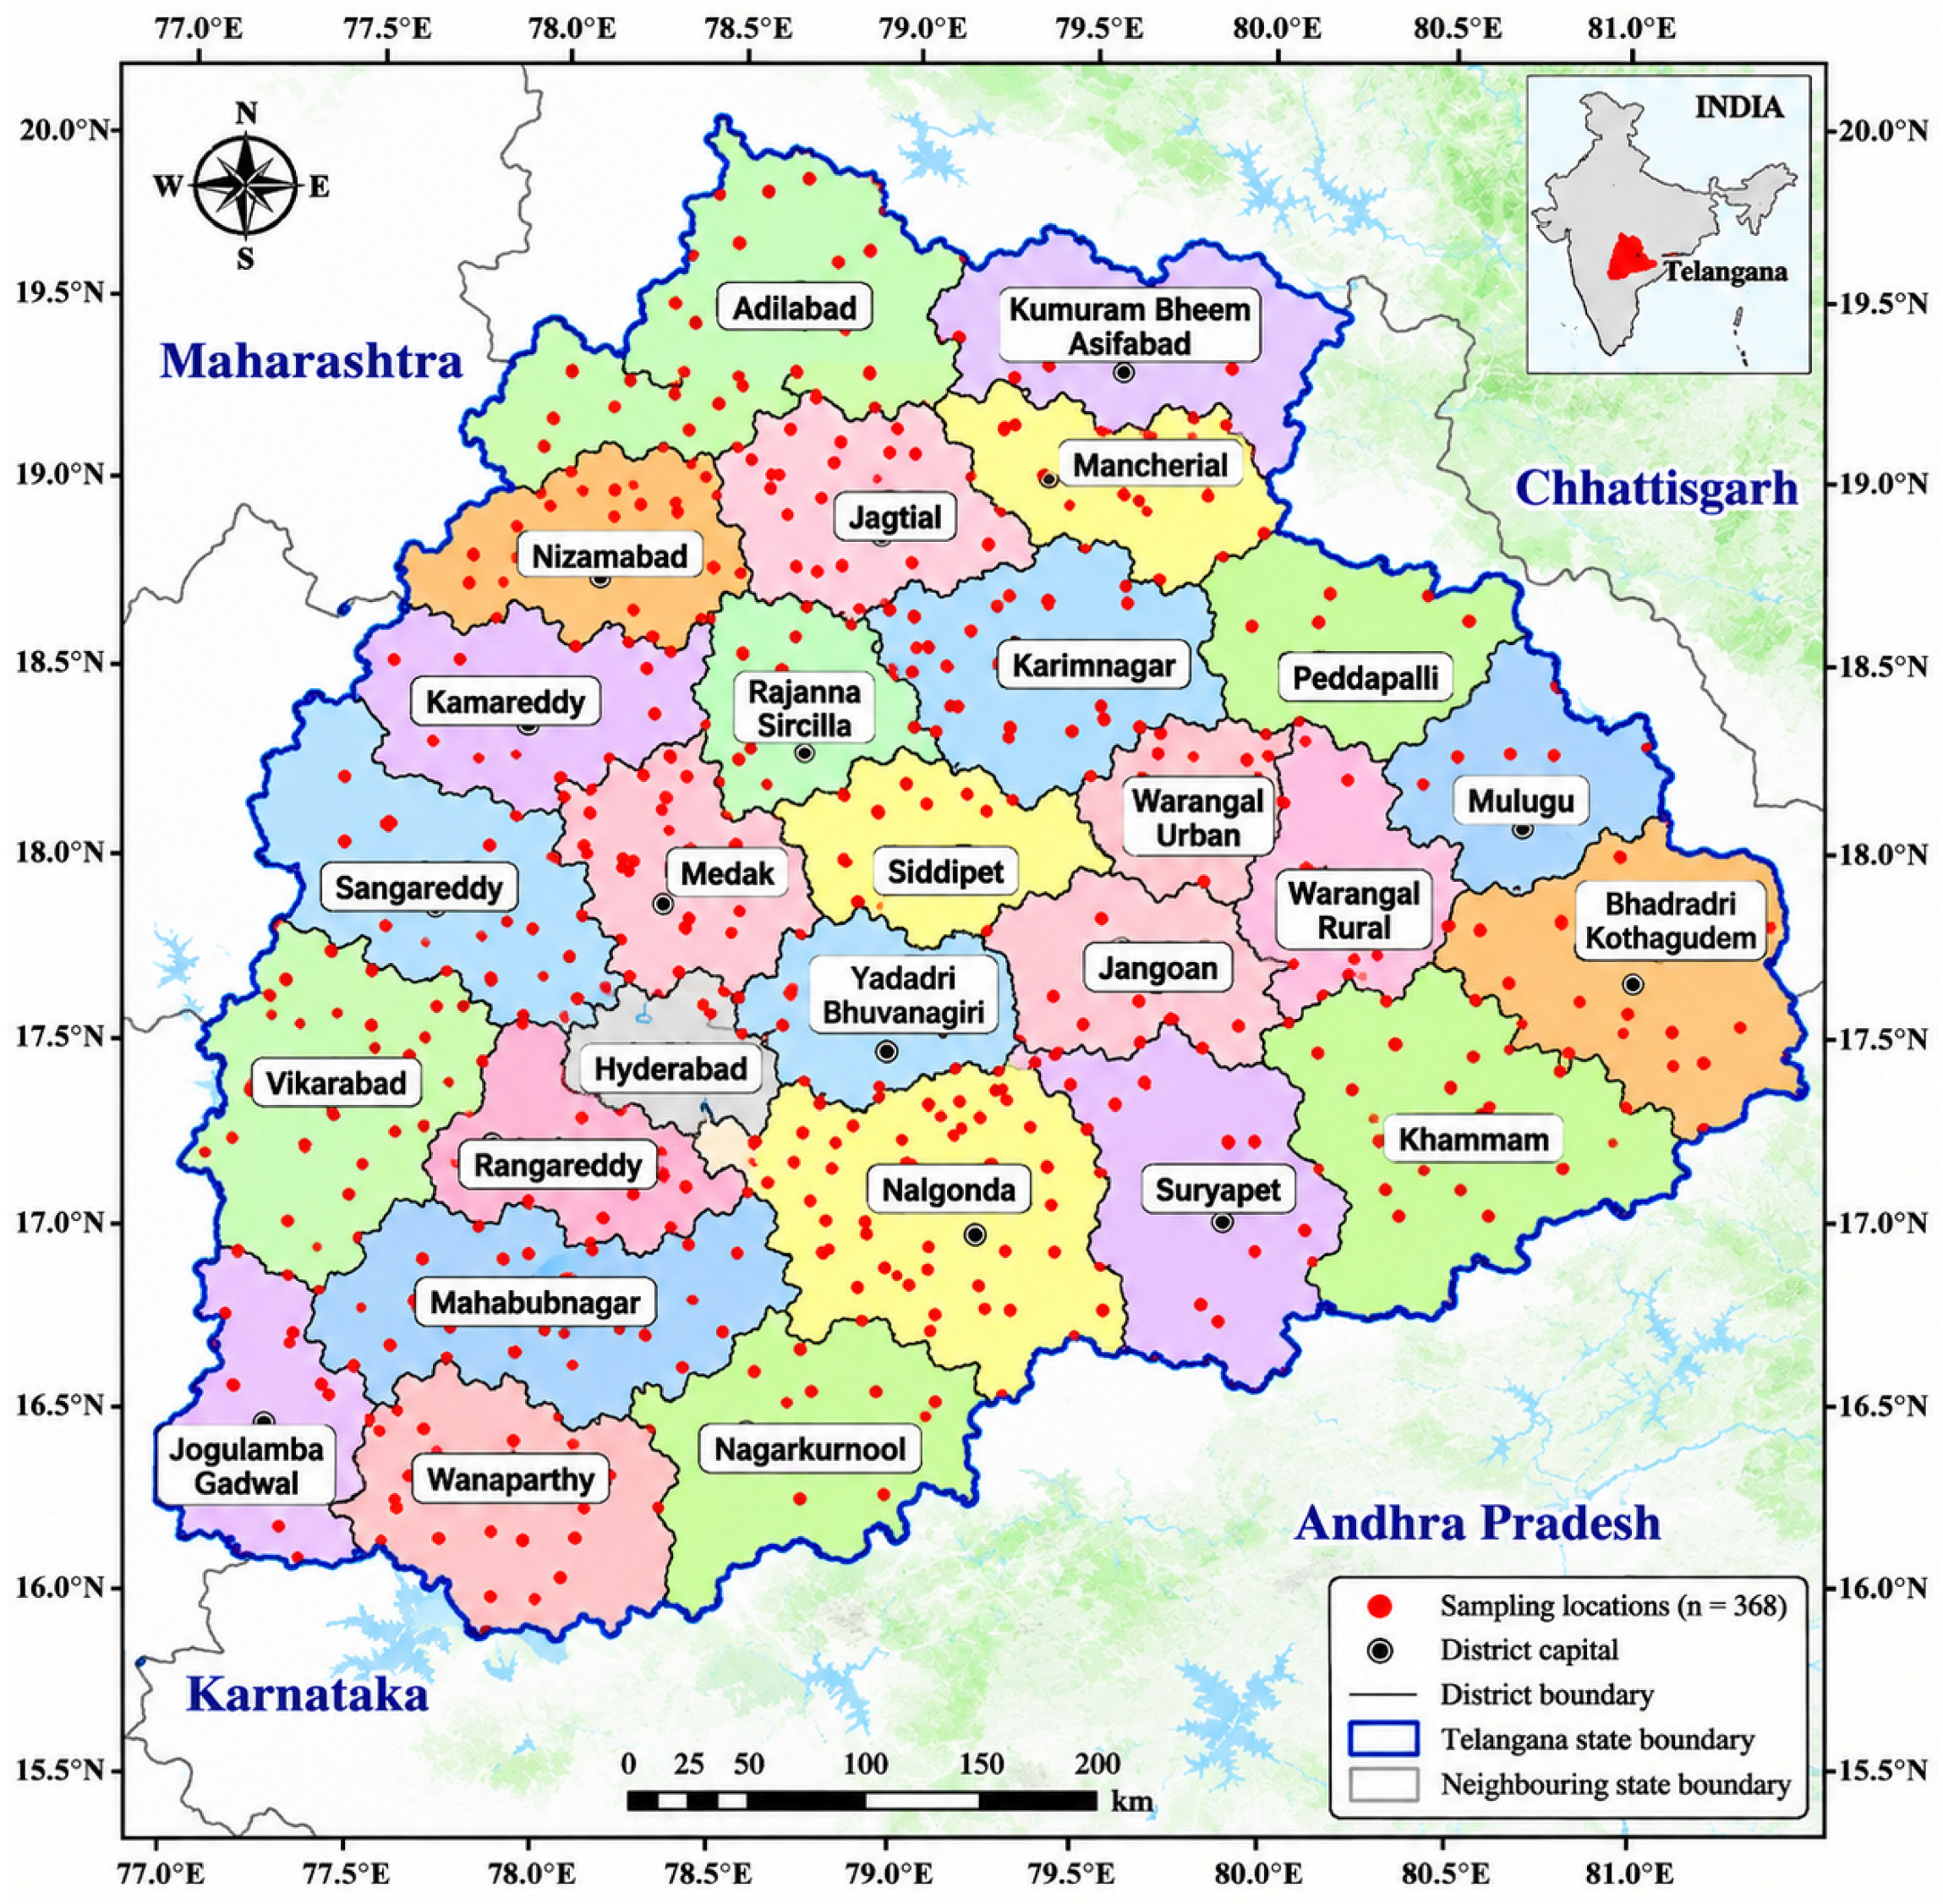
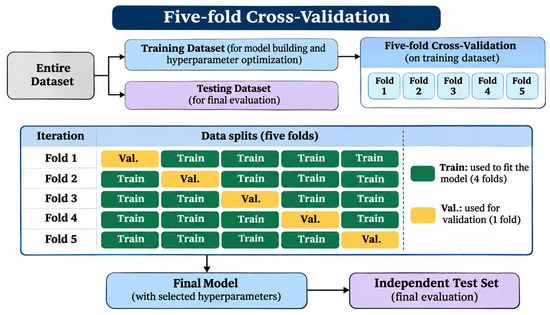
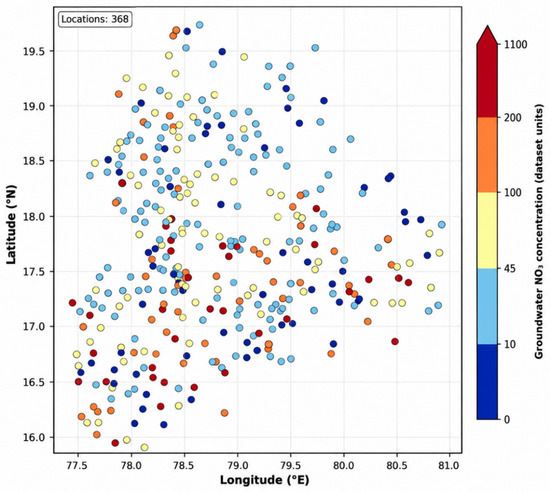
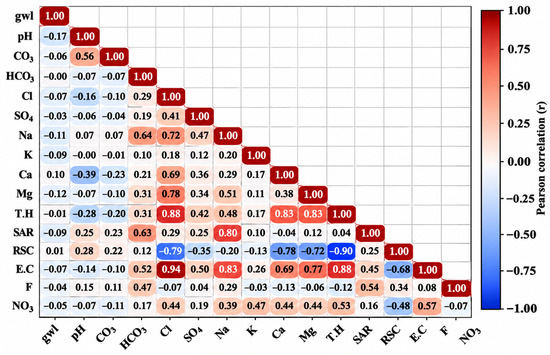
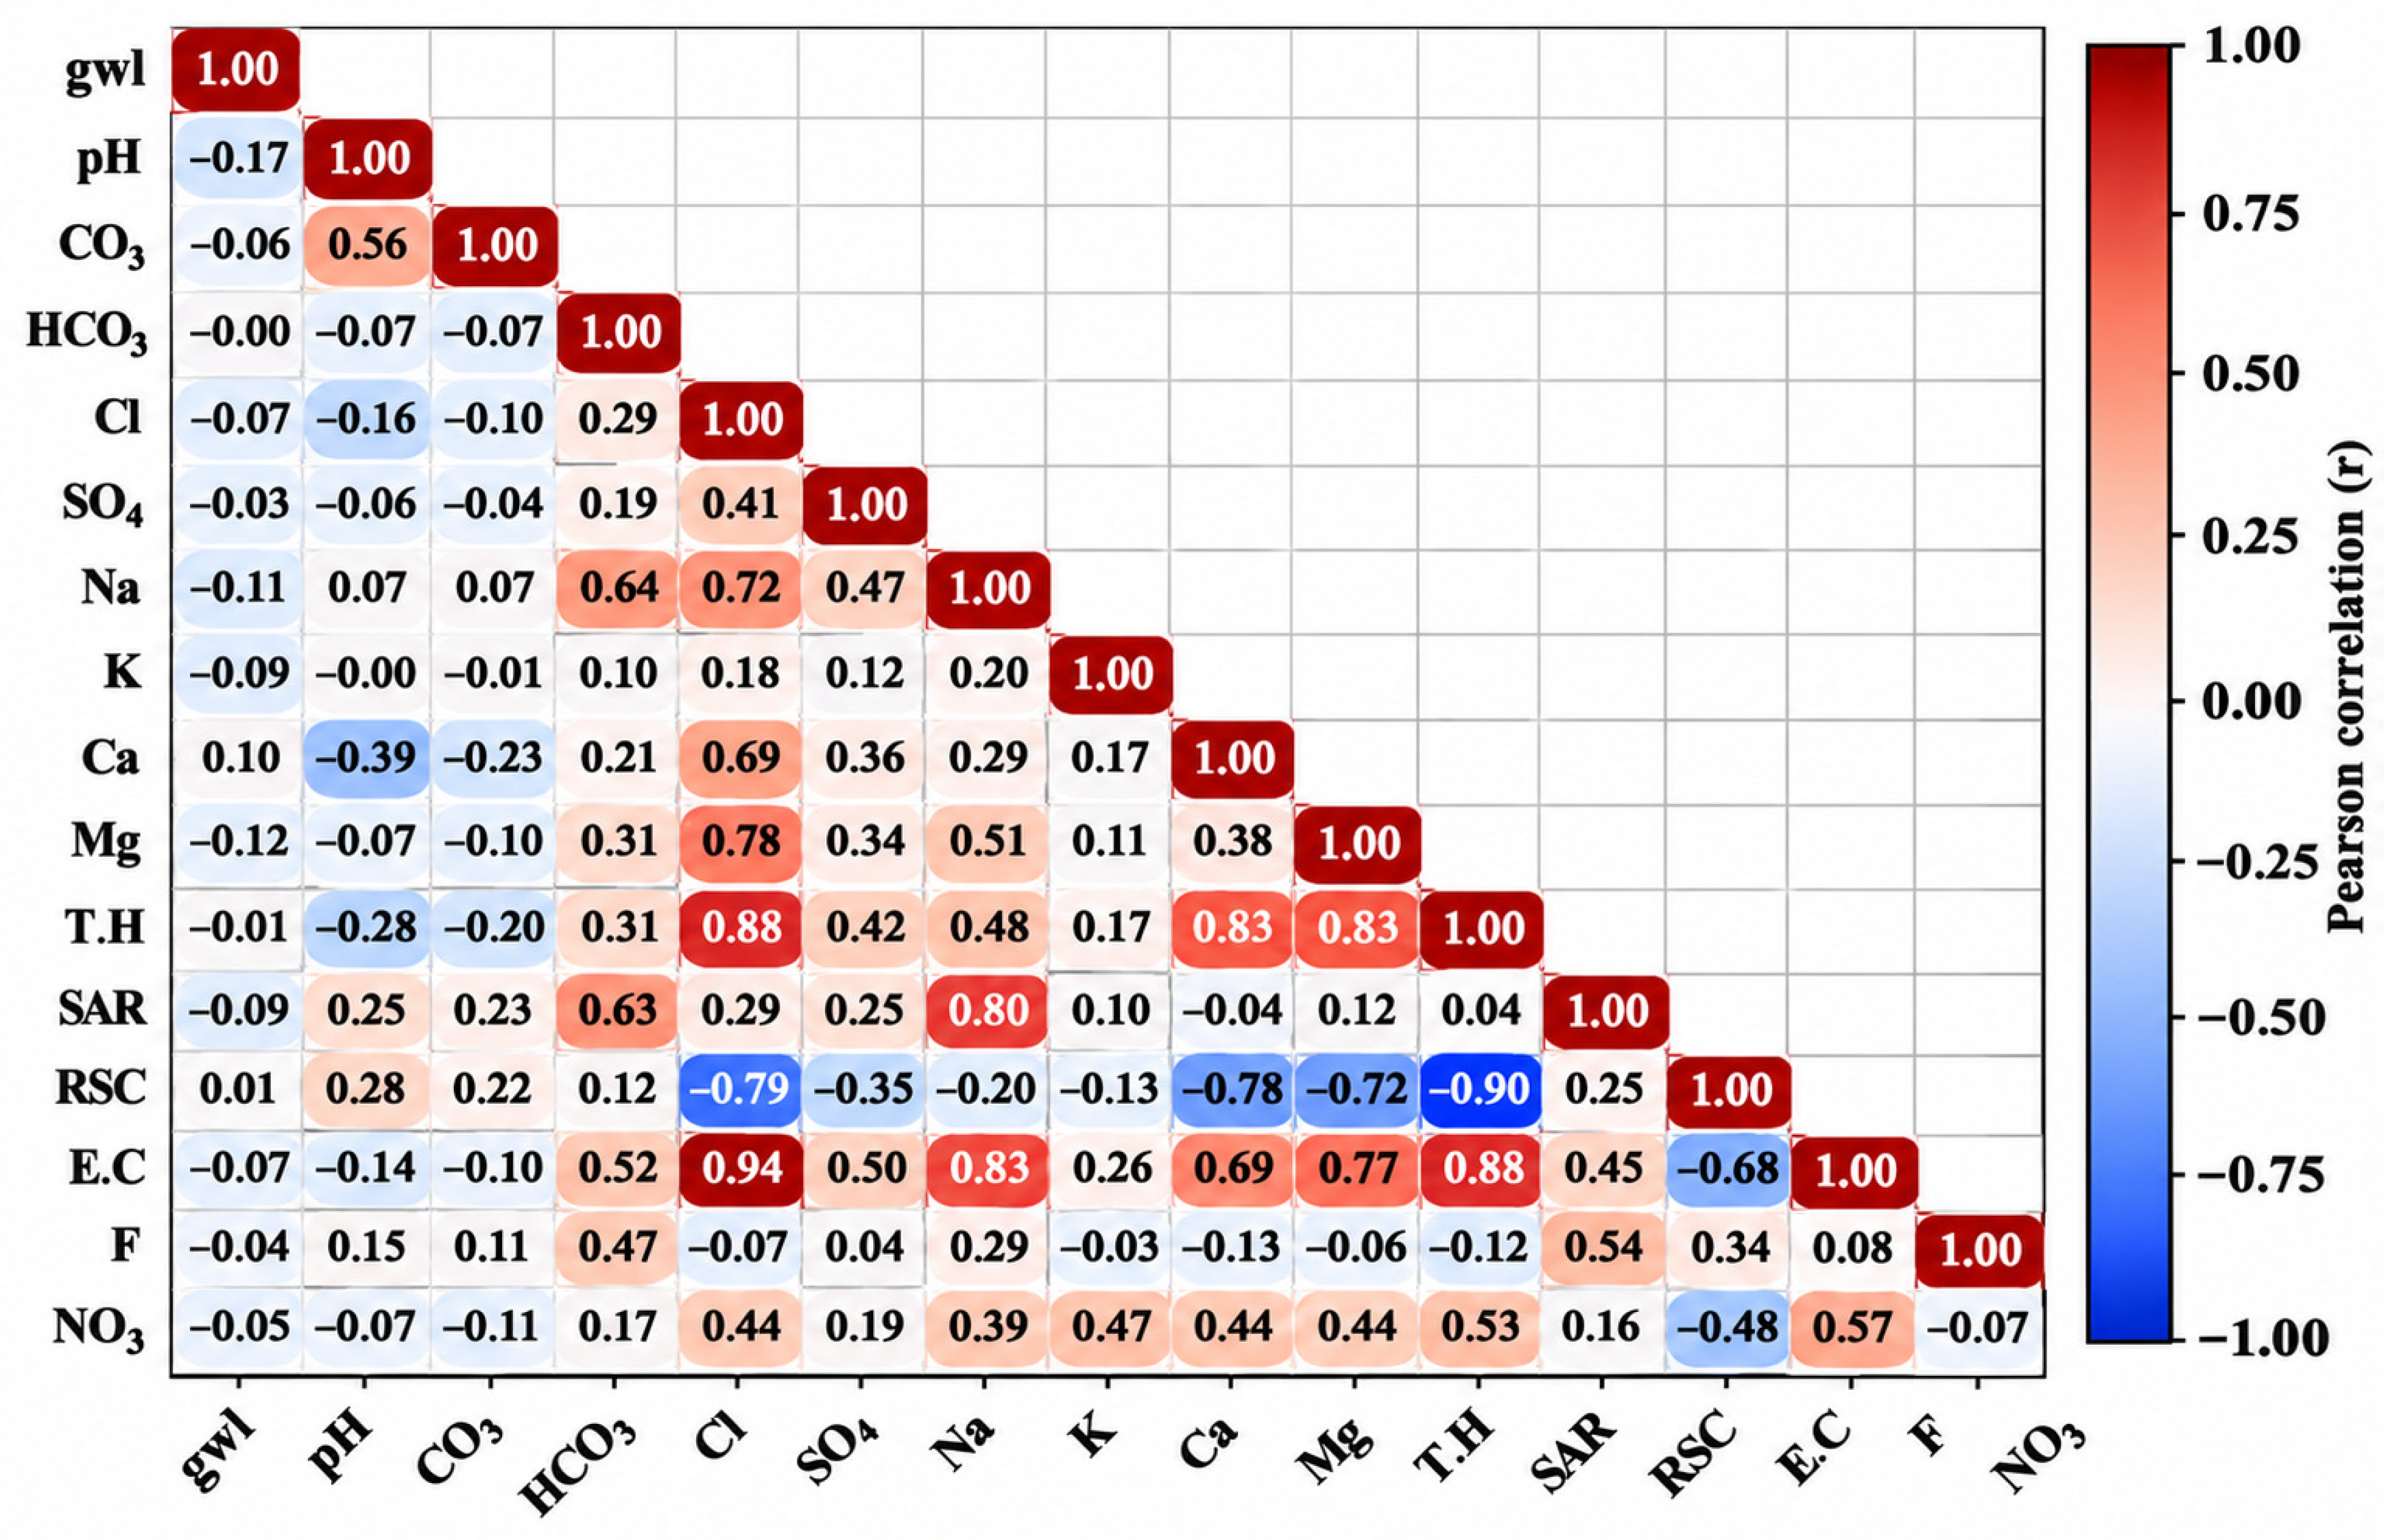
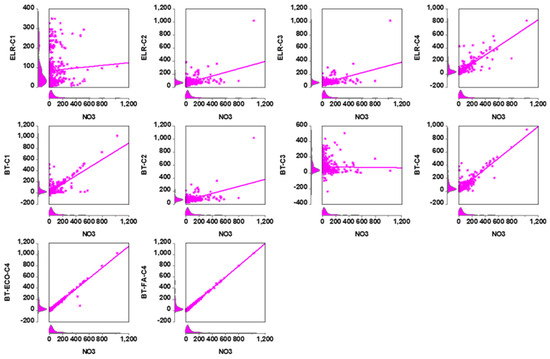
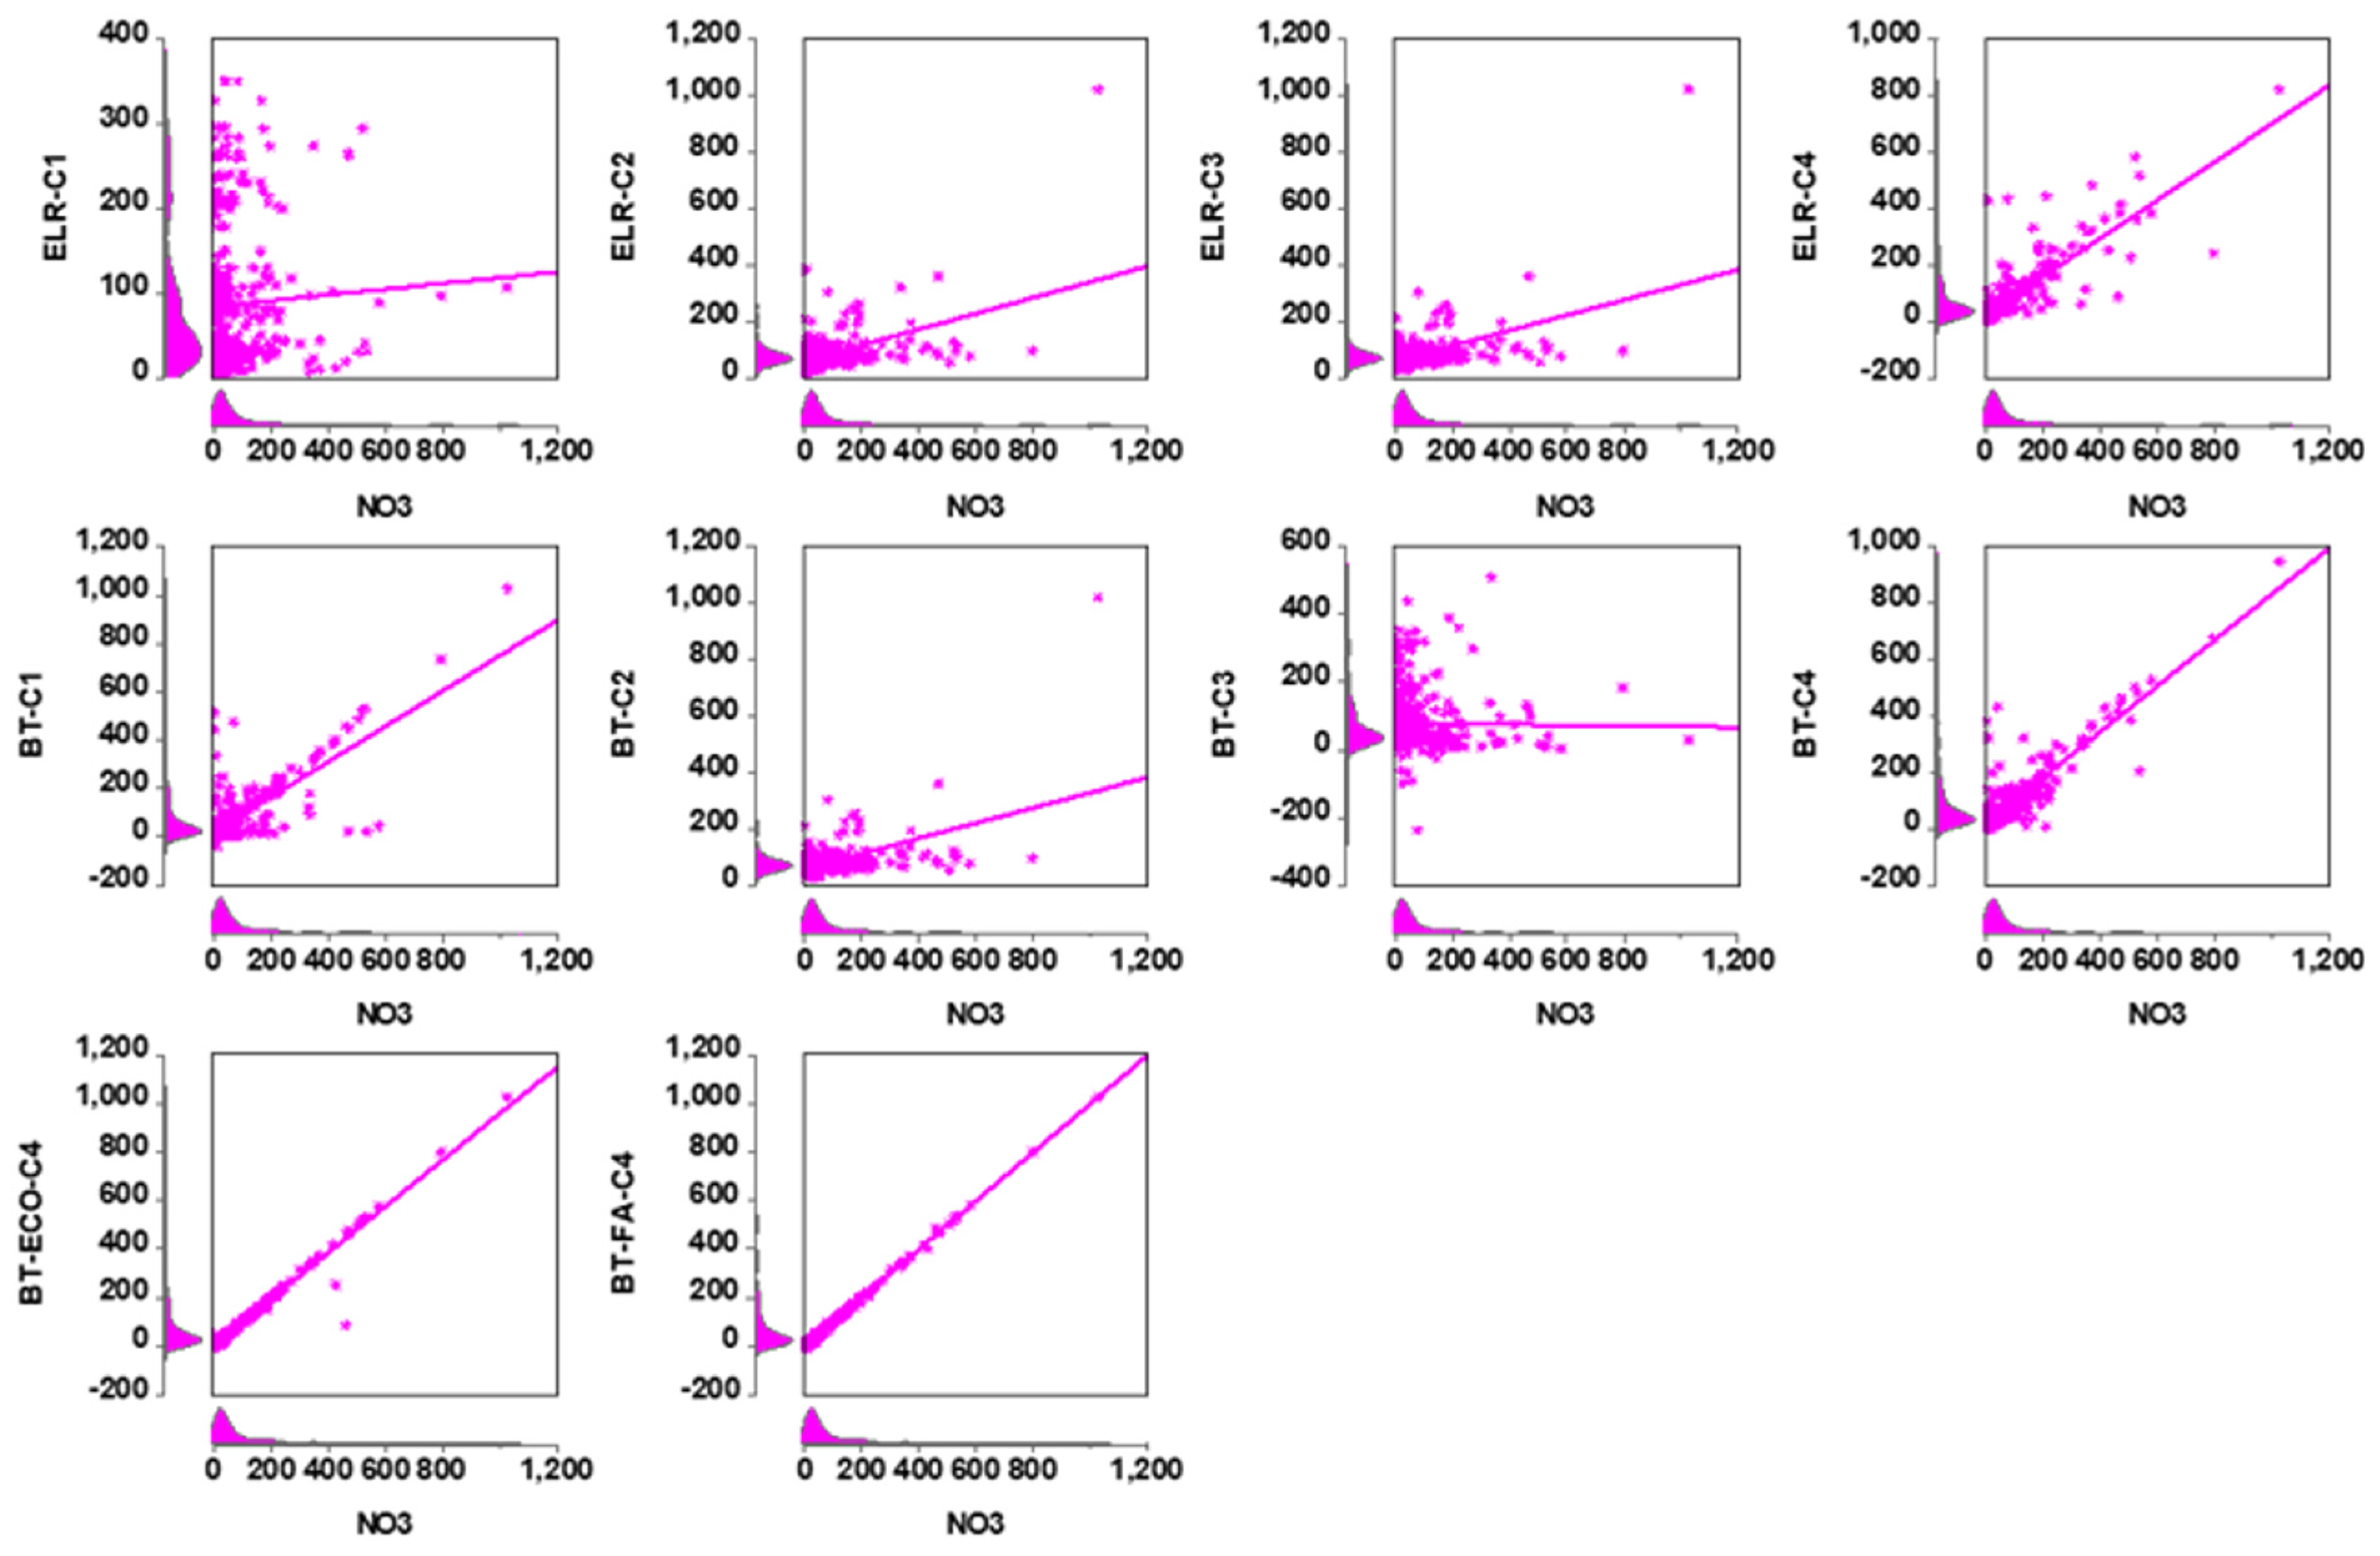
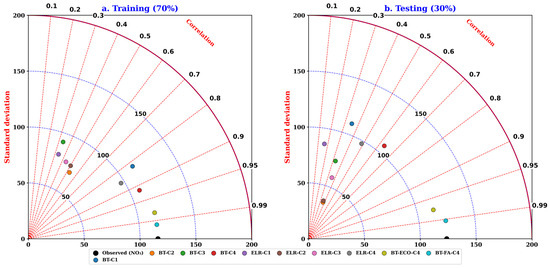
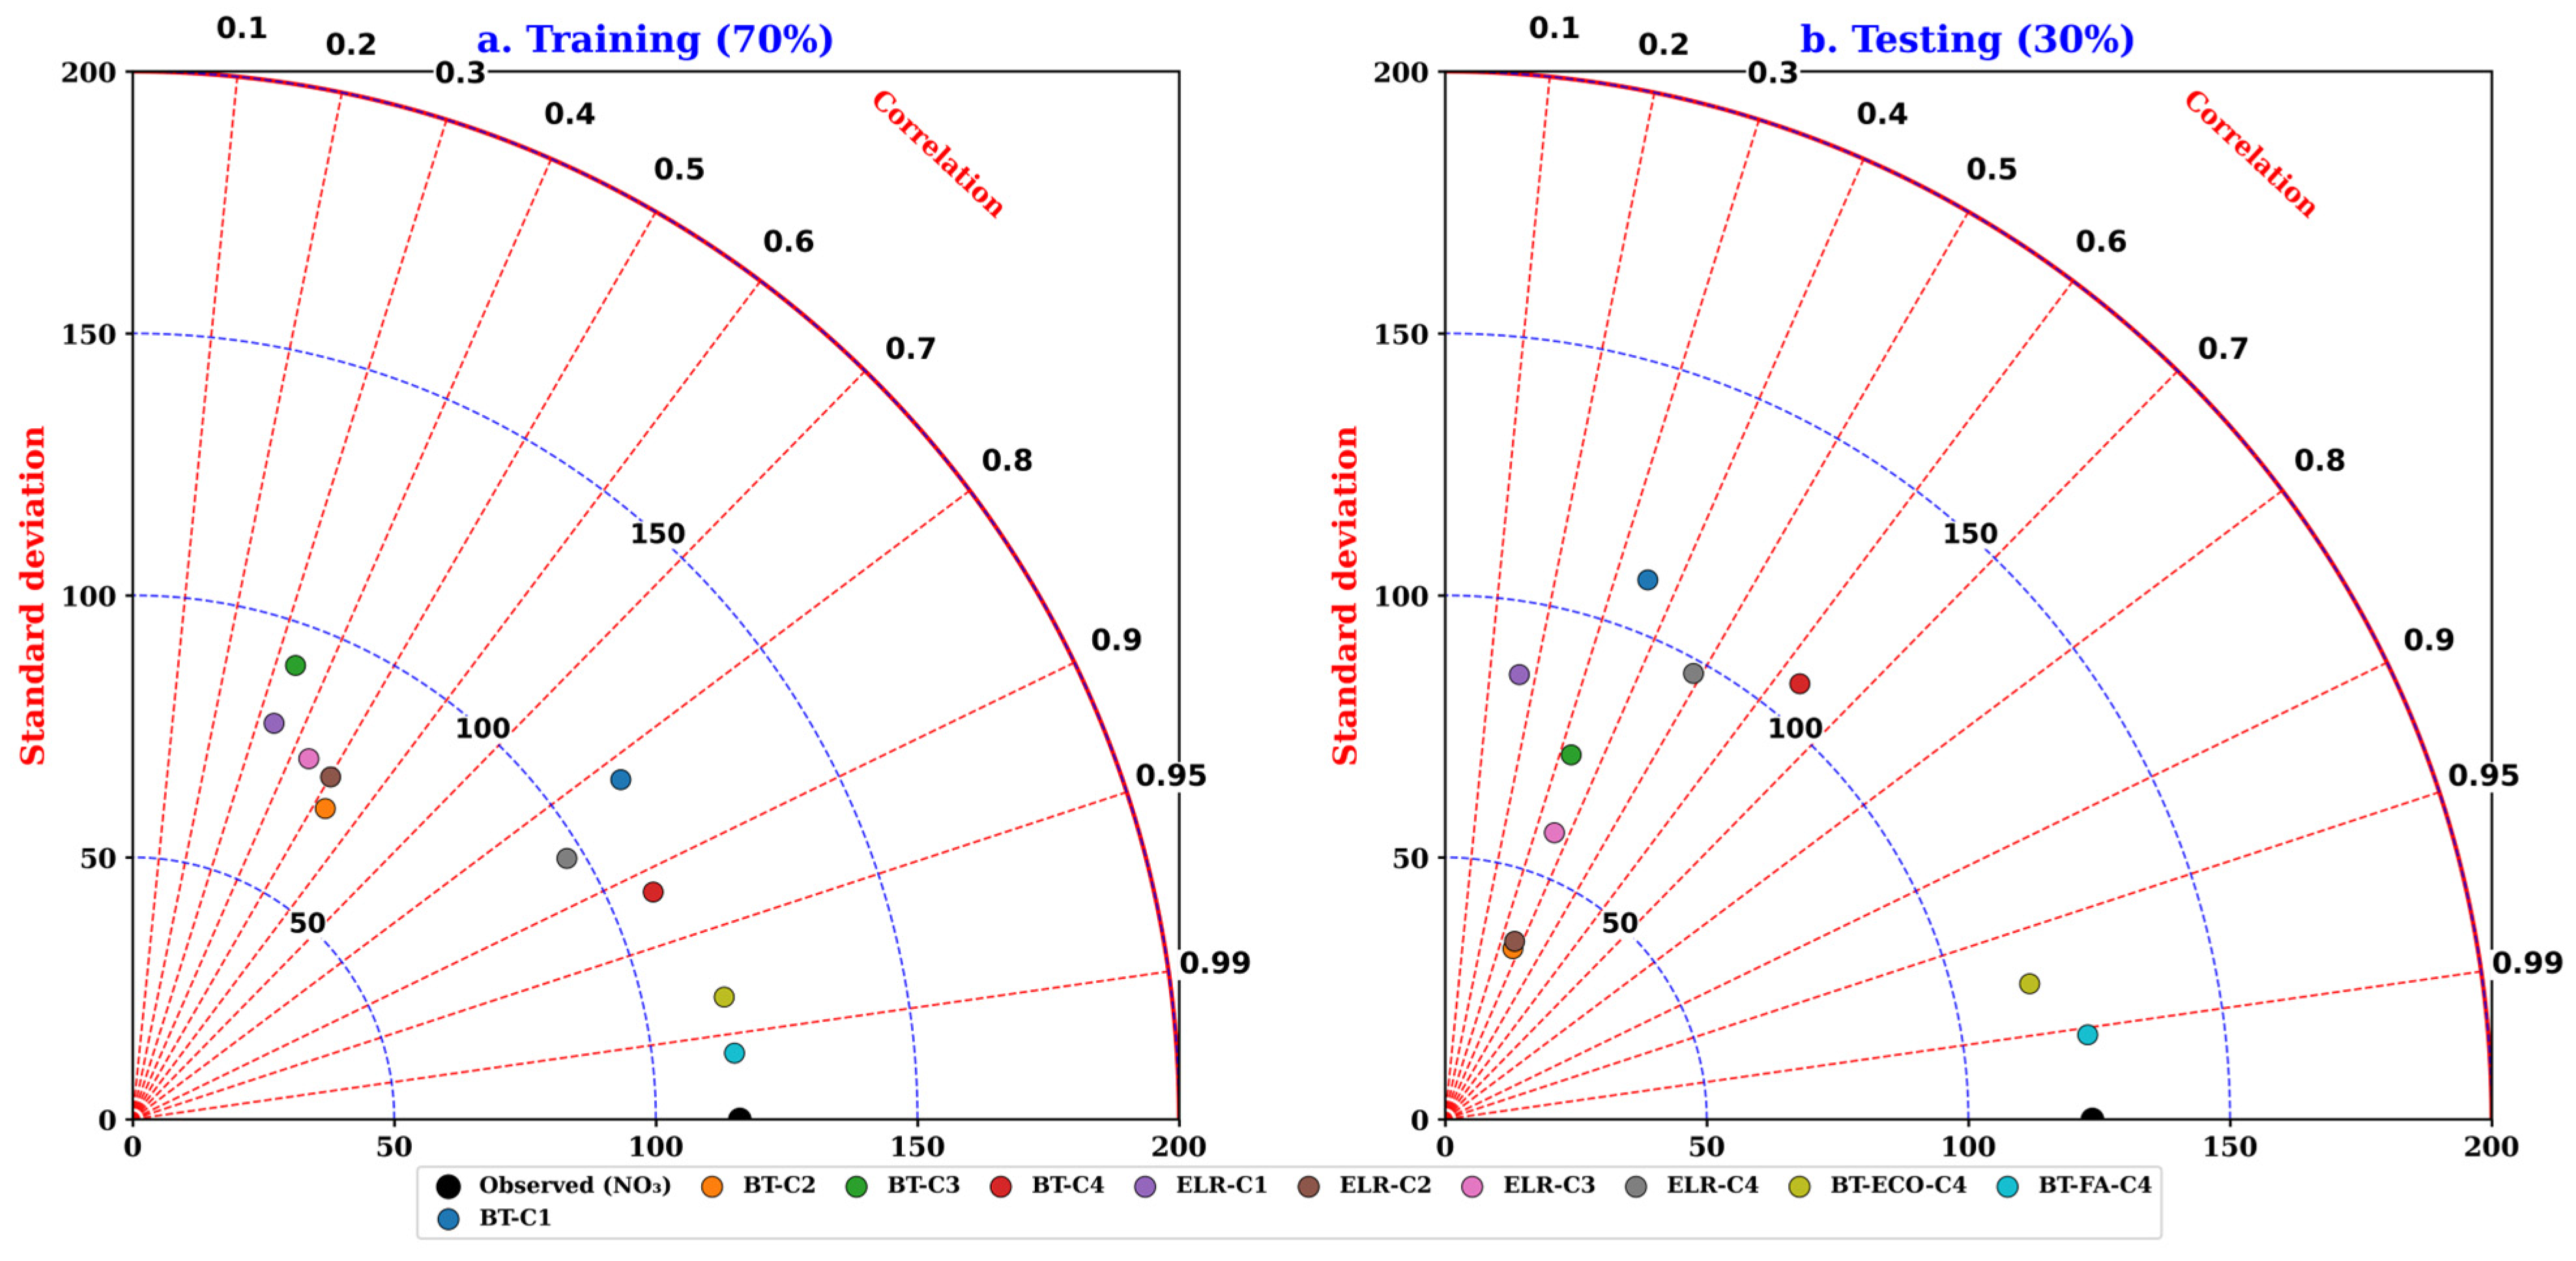
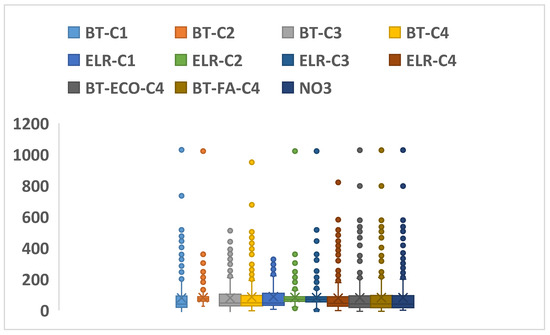
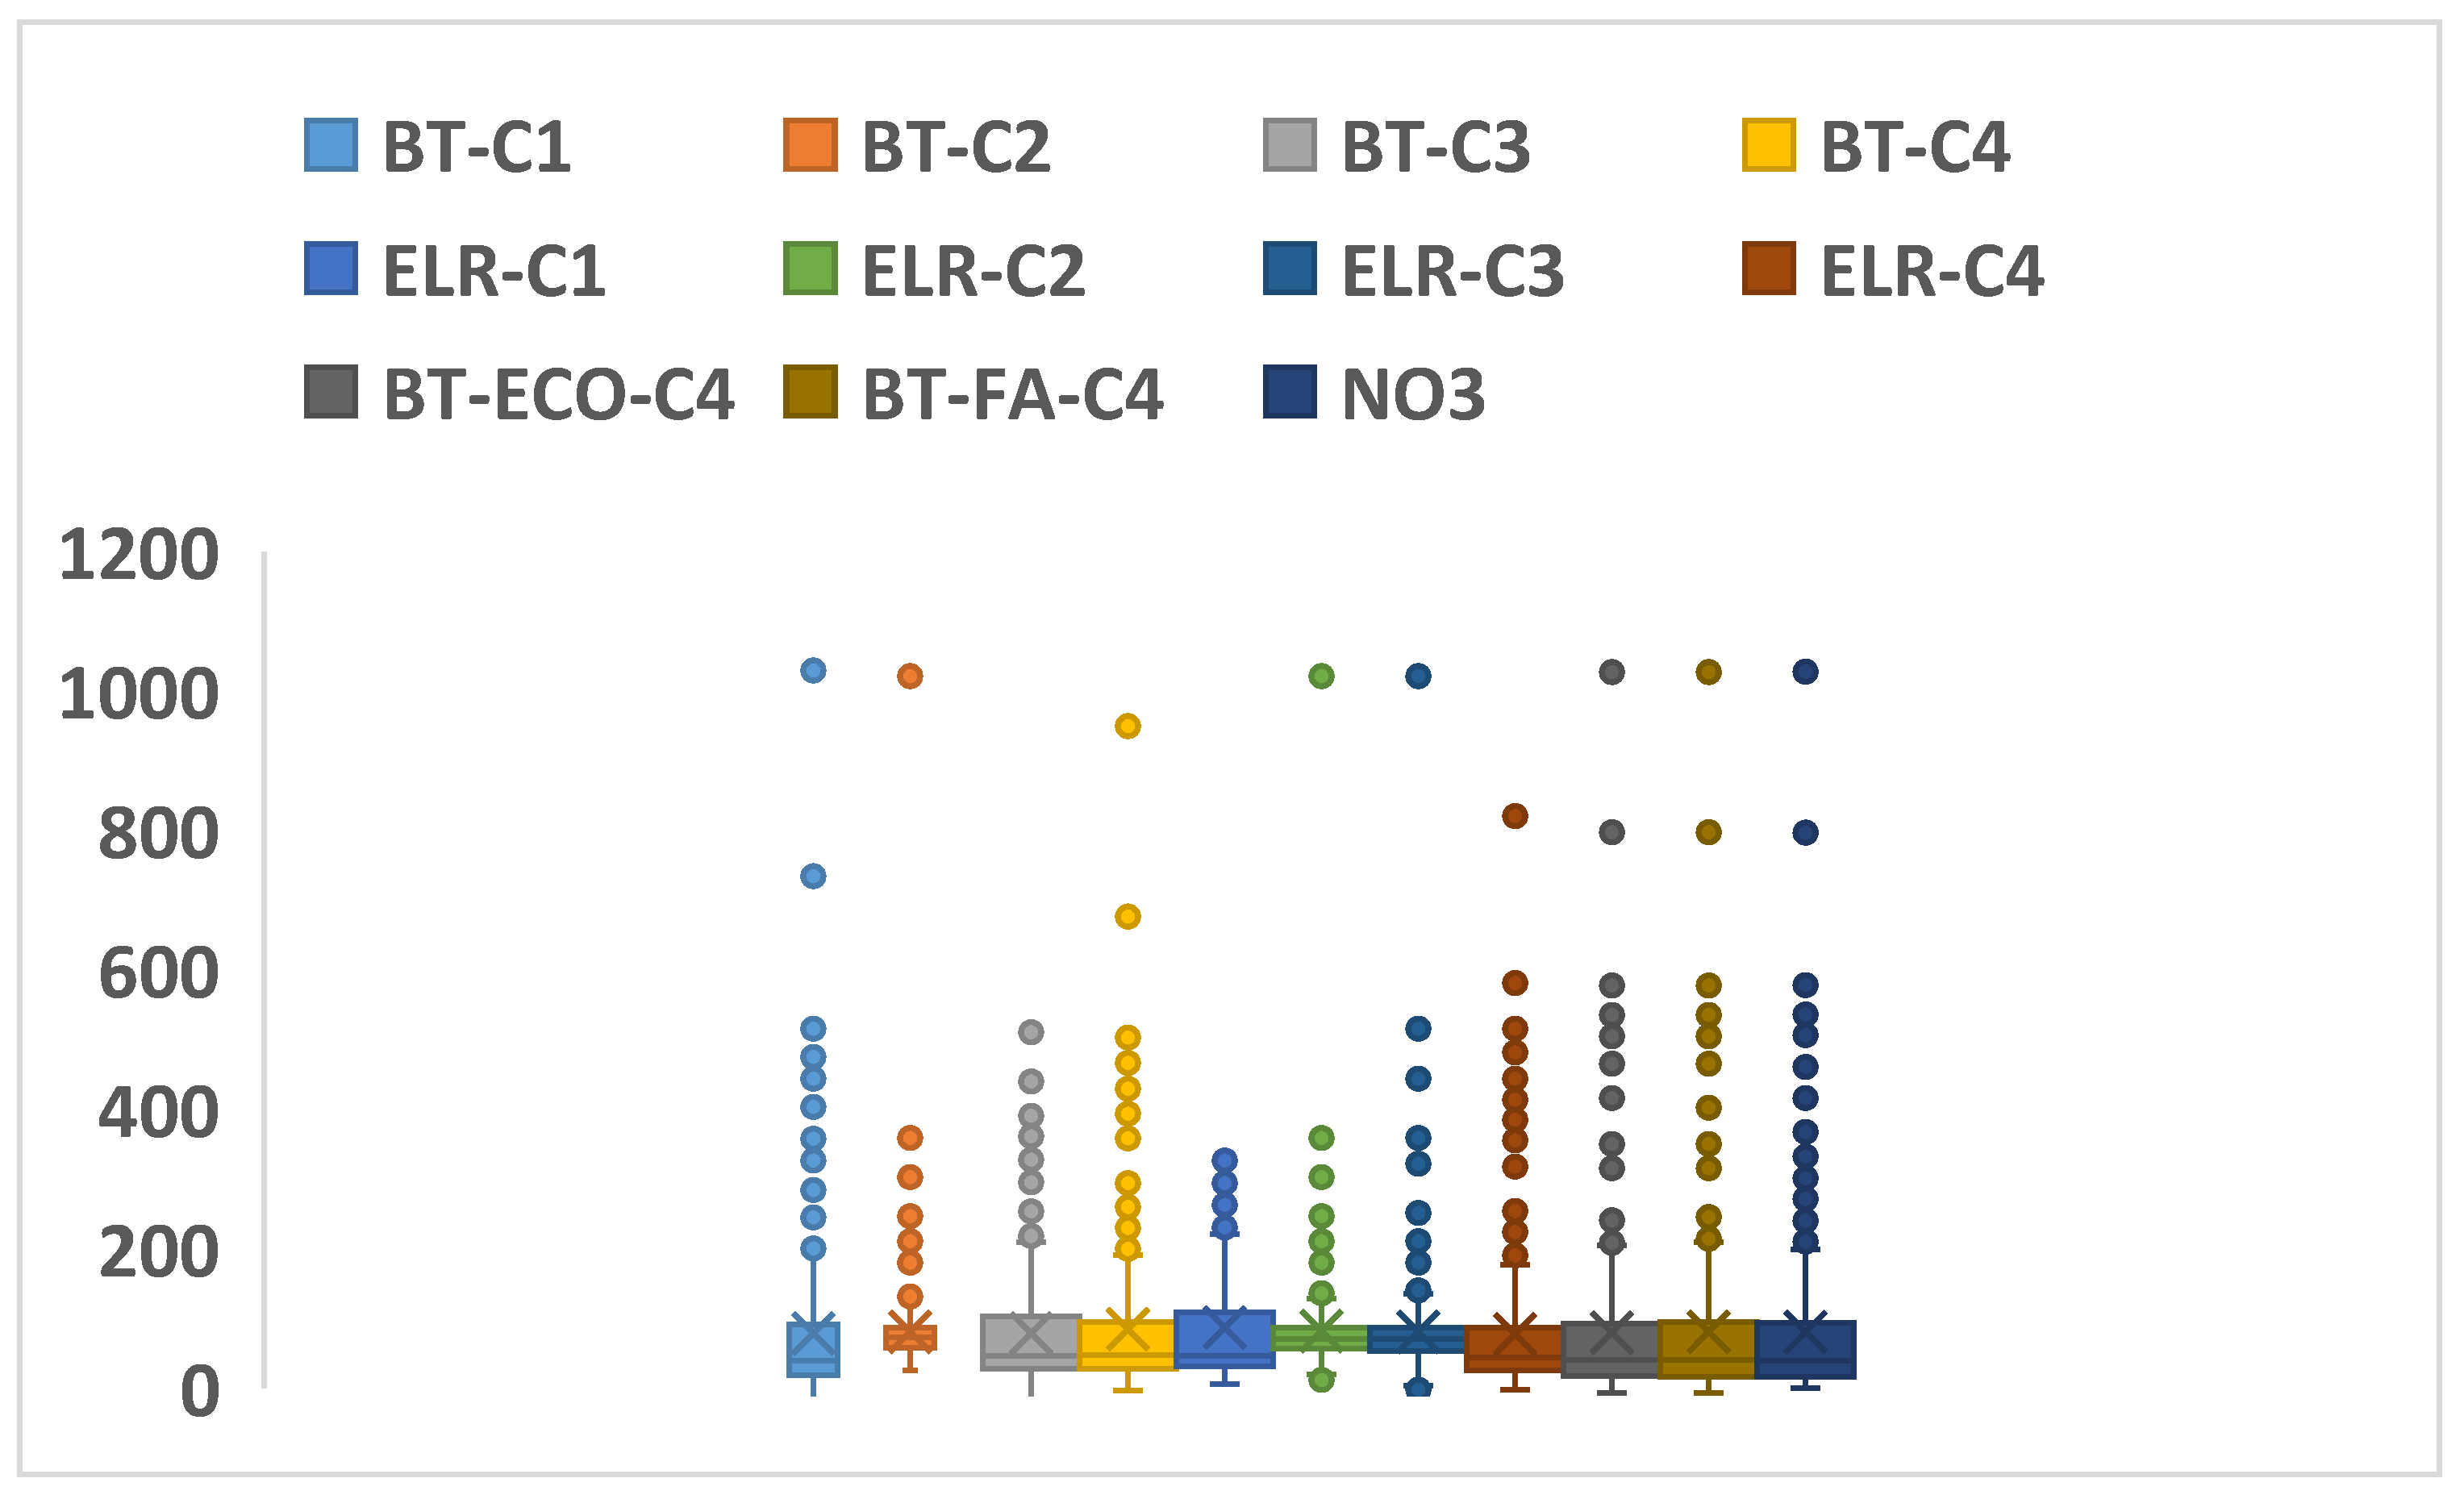
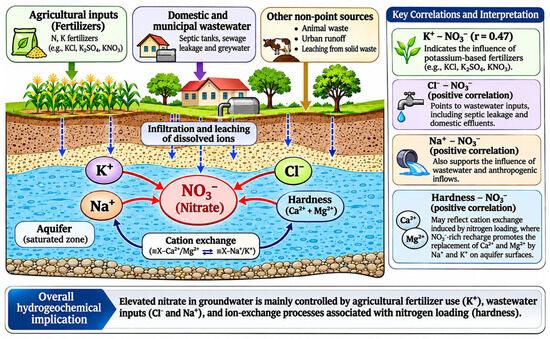
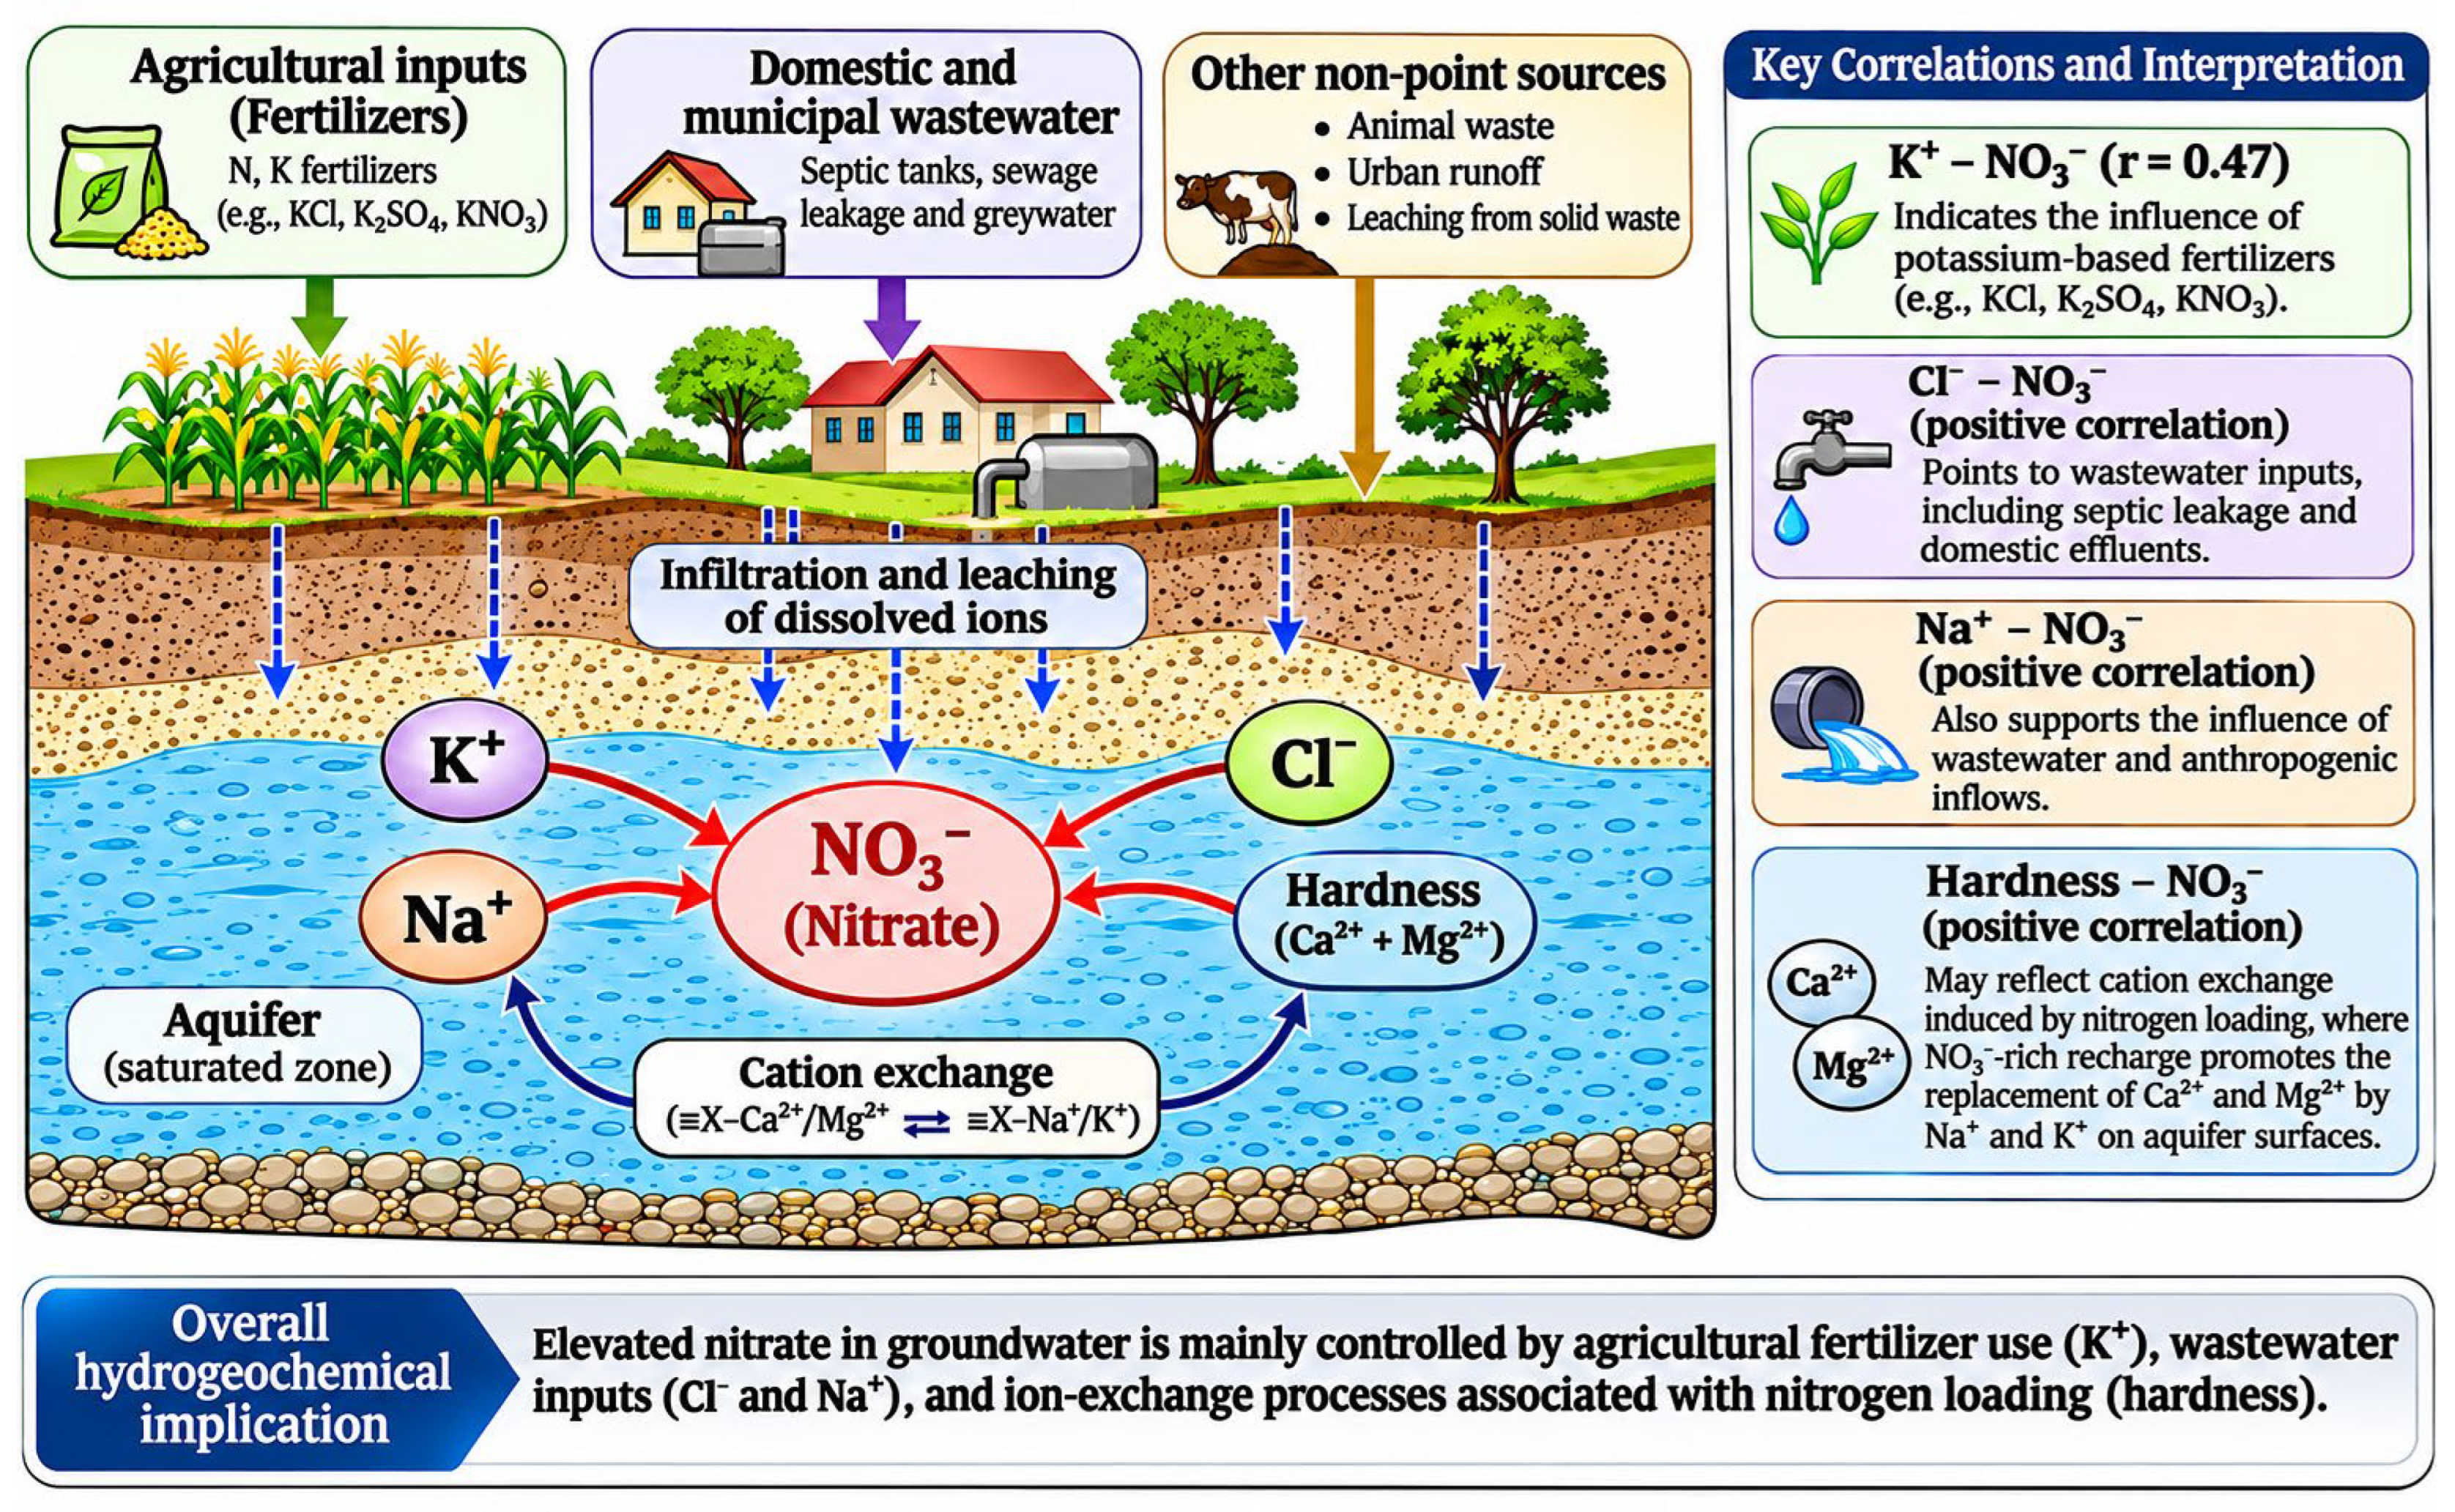
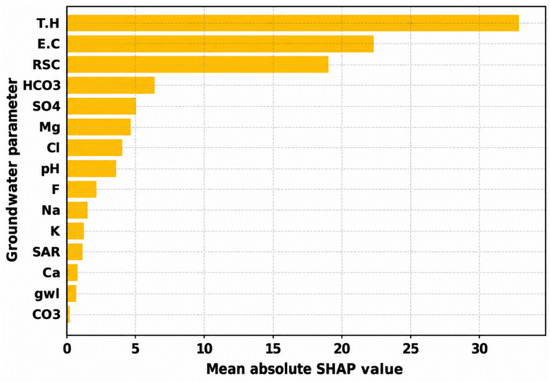
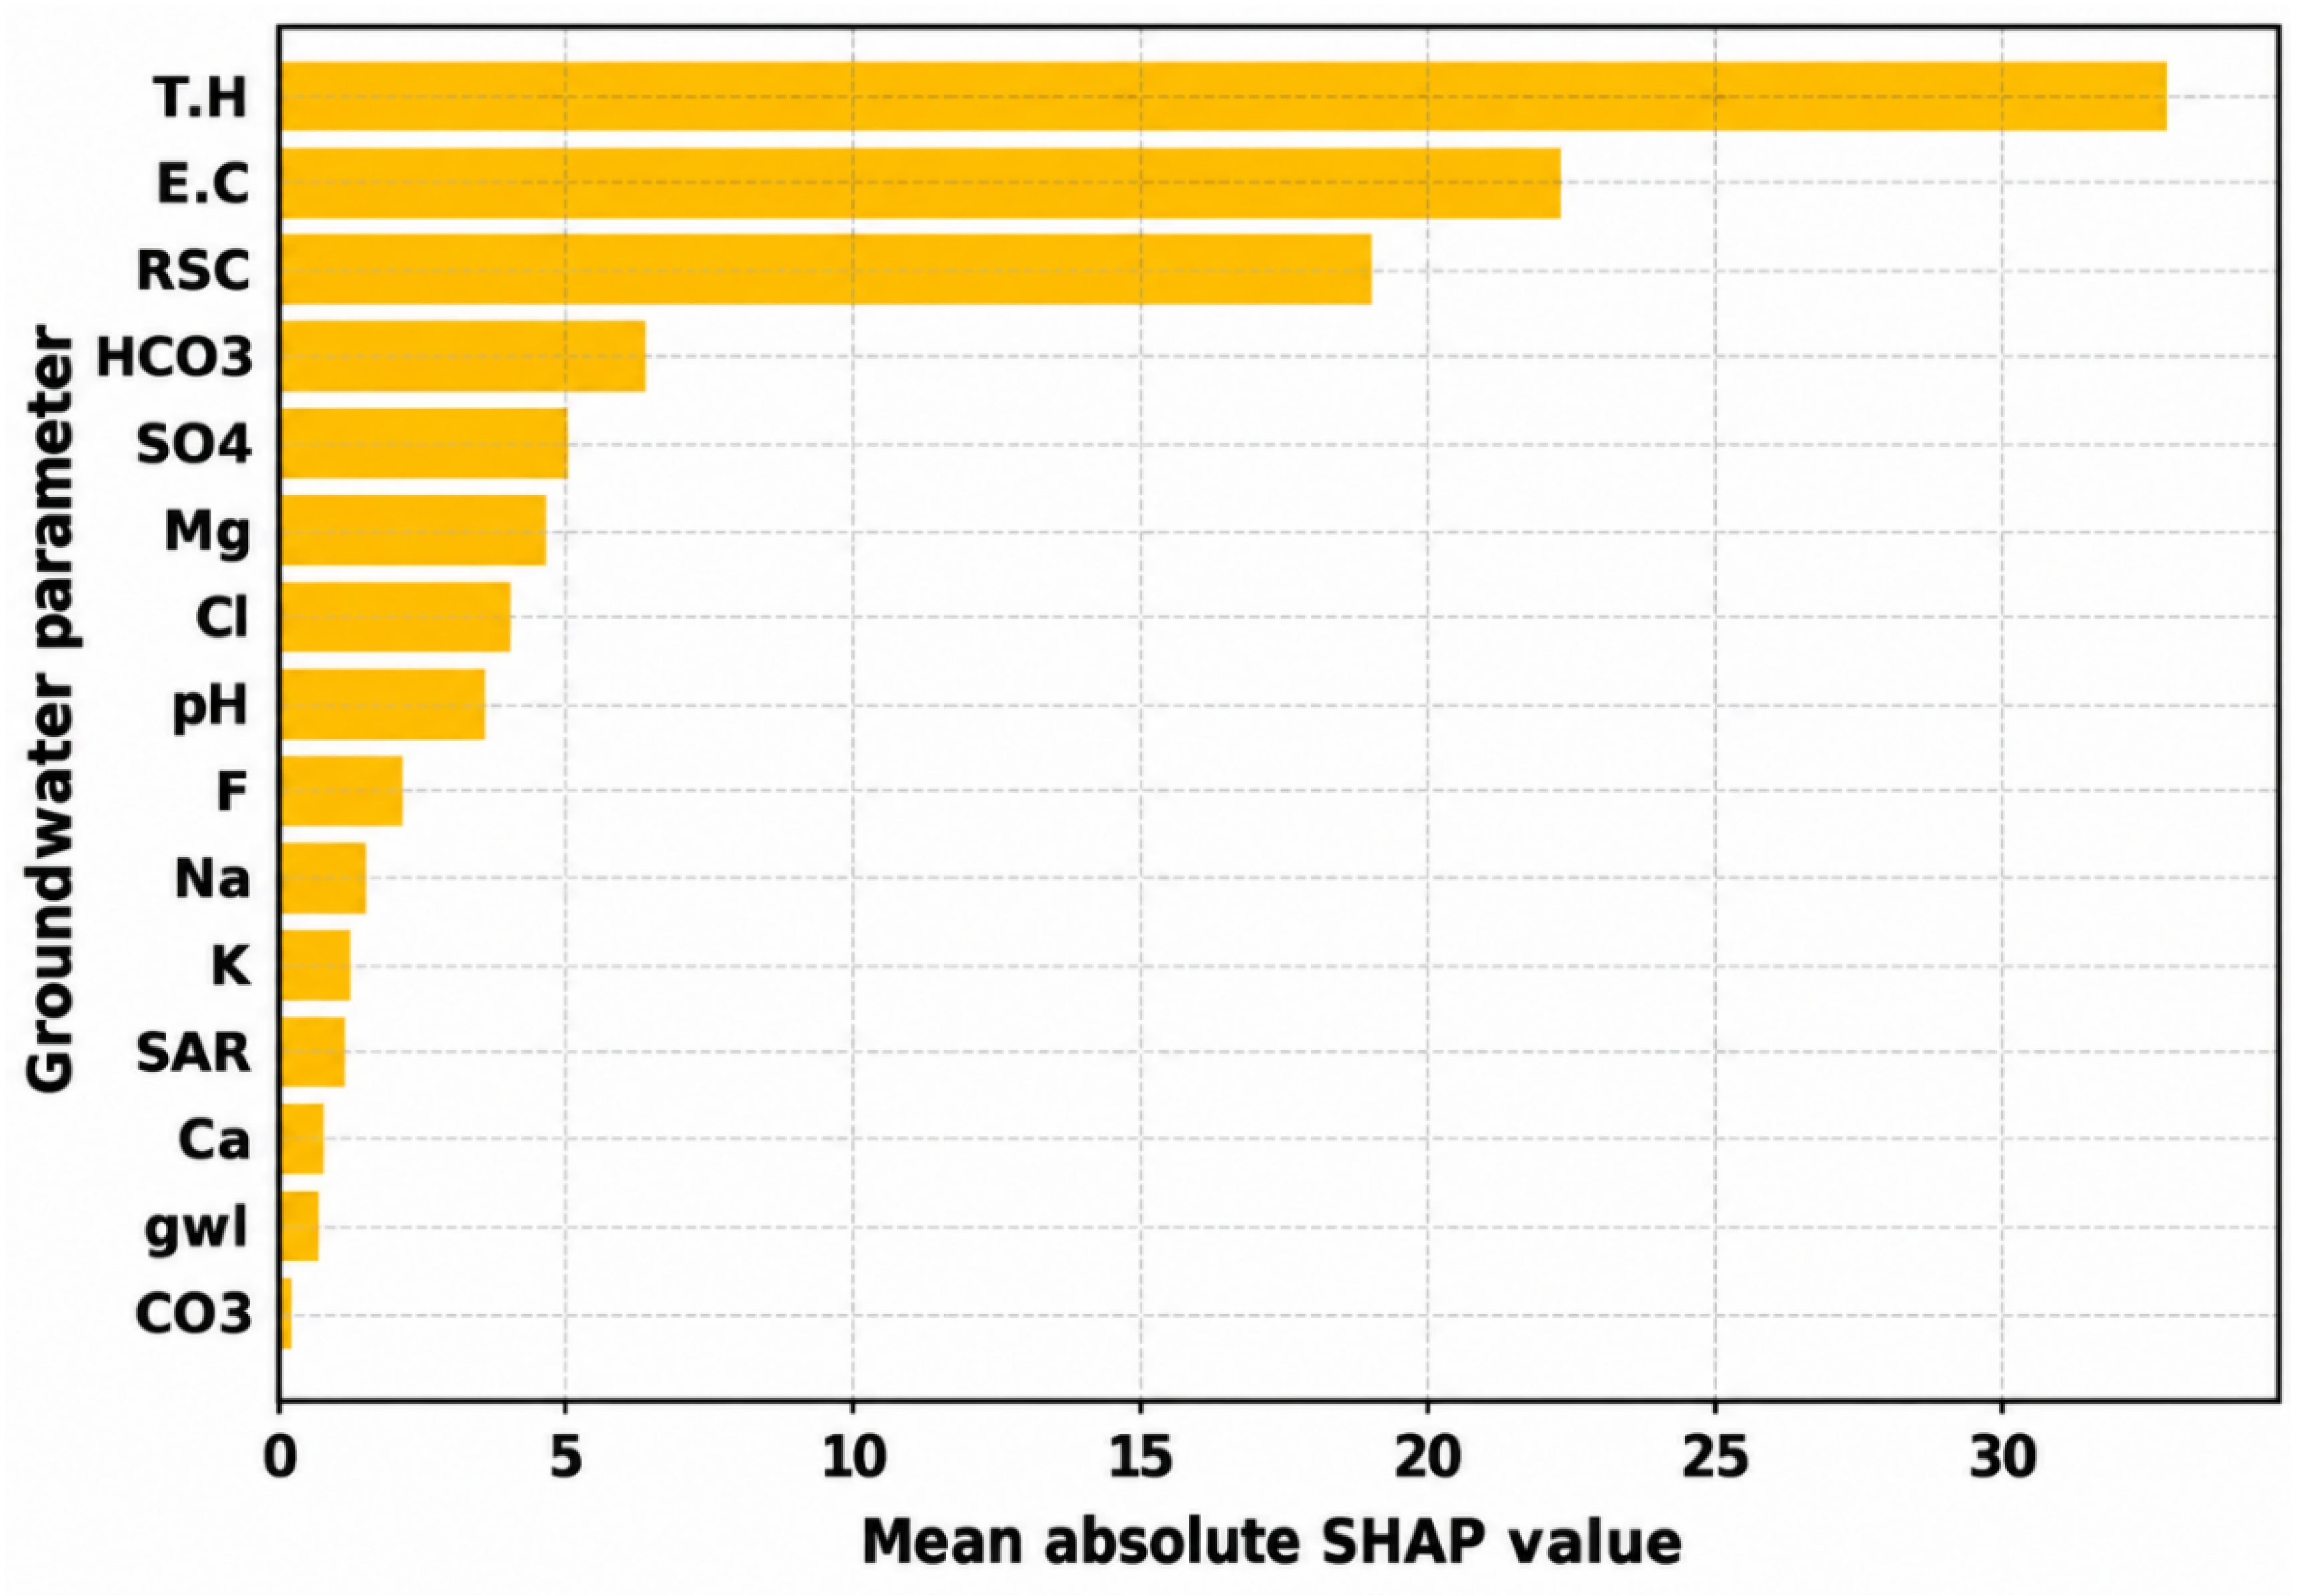

Disclaimer/Publisher’s Note: The statements, opinions and data contained in all publications are solely those of the individual author(s) and contributor(s) and not of MDPI and/or the editor(s). MDPI and/or the editor(s) disclaim responsibility for any injury to people or property resulting from any ideas, methods, instructions or products referred to in the content. |
© 2026 by the author. Licensee MDPI, Basel, Switzerland. This article is an open access article distributed under the terms and conditions of the Creative Commons Attribution (CC BY) license.