


Abstract
Excess or deficiency of nitrogen affects wheat yield significantly. Several destructive and non-destructive methods are used for nitrogen diagnosis to support precision fertilizer management in wheat. Recently, UAV-based remote sensing combined with machine learning has emerged as a promising approach for wheat nitrogen assessment. A systematic review was conducted to identify strengths and gaps in the methodologically diverse literature. The PRISMA approach was used to identify relevant literature from Scopus and Web of Science databases. The extracted data were used for comparative quantitative analysis to evaluate whether studies targeted direct nitrogen variables or proxy traits, how validation rigor influenced reported performance, and which growth stages were most commonly associated with nitrogen diagnosis. Across studies with comparable reported performance, direct nitrogen studies showed a median selected R2 of 0.855, while close-proxy and indirect-proxy studies showed median selected R2 values of 0.868 and 0.841, respectively. Validation design also differed markedly across the literature. Most studies relied on internal-only validation, and these studies showed a higher median selected R2 (0.860) than studies using independent-like validation (0.825), suggesting that reported performance may often be optimistic under less rigorous validation frameworks. Growth-stage analysis showed that nitrogen diagnosis was most commonly investigated from jointing to grain filling with most studies focusing on multiple growth stages rather than on a single stage. This indicates the use of a broader diagnostic window rather than identifying single stages of practical importance. In conclusion, the reviewed literature represents a mixture of direct nitrogen and proxy or indirect studies with stronger within-study predictive capacity than in providing robust and transferable performance for practical nitrogen management. Future research should focus on direct nitrogen diagnosis and adopt independent validation designs to link diagnosis outputs to actionable precision nutrient management.
1. Introduction
Cereals are central to global food security and agricultural economies. They are among the most cultivated crops covering 745 million ha worldwide [1] and wheat is the most produced cereal accounting for 29.5% of the area under cereals cultivation (Figure 1). Nitrogen is one of the most important nutrients governing wheat growth, productivity, and grain quality. It plays an important role in canopy development, chlorophyll formation, photosynthetic activity, biomass accumulation, and grain formation, whereas nitrogen deficiency can reduce growth and yield and affect nitrogen use efficiency [2]. On the other hand, excessive nitrogen application increases production costs and contributes to environmental problems such as nitrate losses and greenhouse gas emissions [3]. Therefore, improving nitrogen management in wheat is an agronomic as well as environmental priority.
Figure 1.
(a) Area under cultivation of different crop groups and (b) share of different cereals.
Conventional approaches for crop nitrogen status assessment include blanket fertilizer recommendations, visual diagnosis, and destructive tissue sampling. However, generalized recommendations have their limitations as they often fail to capture within-field variability, delay in visual symptoms appearance, and destructive sampling is labor-intensive and difficult to repeat across space and time [4]. These limitations have increased interest in rapid, non-destructive approaches that can monitor crop nitrogen status at high spatial resolution. In recent years, remote sensing has become an important tool for crop nitrogen assessment [5]. Among remote sensing platforms, unmanned aerial vehicles (UAVs) offer practical advantages for field phenotyping and crop monitoring. UAVs can collect imagery at user-defined times, provide very high spatial resolution, and capture fine-scale within-field variability under real agronomic conditions [6].
The increasing availability of RGB, multispectral, hyperspectral, thermal, and fused sensing systems has further strengthened the role of UAVs in precision agriculture. At the same time, advances in machine learning have greatly expanded the analytical capacity of UAV-based crop monitoring. Compared with conventional linear or empirical approaches, machine learning methods can accommodate nonlinear relationships, high-dimensional spectral information, and complex interactions among crops, environment, and management variables [7]. As a result, a rapidly growing body of literature now reports strong predictive performance for nitrogen-related traits in wheat using UAV imagery combined with machine learning [8,9,10].
Despite this rapid progress, an important question of what exactly is being predicted, and how robust the evidence is, remains unresolved. The current literature is highly diverse in terms of target variables, validation strategies, and growth-stage reporting. Some studies directly estimate crop nitrogen indicators such as plant nitrogen concentration (PNC), leaf nitrogen concentration (LNC), plant nitrogen accumulation (PNA), leaf nitrogen accumulation (LNA), or nitrogen nutrition index (NNI) [11,12,13], whereas others focus on related but indirect outcomes such as chlorophyll content, biomass, or nitrogen treatment classes [10,14,15]. Although all of these outcomes may be useful in specific contexts, they are not equivalent from the perspective of true nitrogen diagnosis. A model that accurately predicts a proxy trait does not necessarily provide the same agronomic information as a model that directly estimates crop nitrogen status.
A second challenge is model validation. Many studies report strong predictive performance, but validation strategies vary substantially. Most studies use internal train-test splitting or cross-validation [11,16,17], whereas a smaller group of studies has begun to evaluate transferability through temporal, spatial, external, or cross-domain validation designs [18,19,20]. Model validation is important because predictive performance estimated under internal validation may overstate how well a model will transfer to new conditions. For UAV-based nitrogen diagnosis to support practical nitrogen management, robustness across fields, seasons, and management settings is just as important as within-dataset accuracy.
Besides direct nitrogen diagnosis and model validation, wheat growth stage represents a third unresolved issue. Nitrogen status and its spectral expression are not static during the wheat growing season. Instead, they change with canopy development, nitrogen uptake, remobilization, and reproductive progression [21]. As a result, studies have investigated UAV-based nitrogen diagnosis at different phenological stages, from early vegetative growth to heading, anthesis, and grain filling [9,12,22,23]. However, it remains unclear whether the literature supports one consistently optimal stage for nitrogen diagnosis or whether UAV-based assessment is better interpreted as effective across a broader diagnostic window, as different studies highlight different stages or stage ranges as particularly informative [20,24,25,26].
Although several reviews have summarized the use of UAV sensors, vegetation indices, and machine learning algorithms for crop monitoring [5,27], an important question remains unanswered: whether UAV-based studies are truly diagnosing crop nitrogen status or predicting traits that are only indirectly related to nitrogen. This distinction is important because high model accuracy for chlorophyll, biomass, yield, or nitrogen treatment class does not necessarily indicate reliable nitrogen diagnosis. In addition, reported model performance cannot be interpreted without considering the independence and rigor of validation design. Therefore, the novelty of this review lies in moving beyond a technology-centered summary and providing a structured assessment of target-directness and validation rigor as two key indicators of the maturity and practical readiness of UAV-based nitrogen diagnosis in wheat.
Therefore, the aim of this review was to analyze the evidence on UAV-based nitrogen diagnosis in wheat and to evaluate the field beyond simple summaries of sensors and algorithms. Specifically, this review addressed three primary questions: (i) whether published studies directly diagnose crop nitrogen status or mainly predict proxy traits, (ii) how rigorously predictive models are validated, and (iii) which growth stages are most commonly associated with UAV-based nitrogen diagnosis. In addition, broader patterns in sensor complexity, data fusion, and model complexity were examined to place the main findings in a technological context. By combining systematic literature selection with structured comparative quantitative analysis, this review provides a clearer assessment of the current strengths, limitations, and future needs of UAV-based nitrogen diagnosis in wheat.
2. Materials and Methods
2.1. Literature Search Strategy
The Preferred Reporting Items for Systematic Reviews and Meta-Analyses (PRISMA) guideline was used to ensure transparency and reproducibility. A systematic search to identify studies on UAV-based nitrogen assessment in wheat was conducted in Scopus and Web of Science databases on 6 April 2026 [28]. The search strategy combined terms related to wheat, UAV/UAS platforms, nitrogen status, and machine learning. Searches were limited to English language journal articles published between 2017 and 2026. We used Boolean operators (AND/OR), phrase searching, truncation (e.g., fertil*), and synonyms to construct reproducible search expressions. The full database-specific search strings are provided in Supplementary Table S1.
In Scopus, the search was performed in the TITLE-ABS-KEY field and returned 112 records. In Web of Science Core Collection, the search was performed using Topic Search (TS) with equivalent keyword combinations and filters for article document type and English language, yielding 231 records. Records from both databases were downloaded in Excel and RIS format. RIS files were imported into the Zotero reference manager to remove duplicates (n = 108). The remaining 235 records were used for title, abstract, and full-text screening.
2.2. Eligibility Criteria
Articles were considered eligible when they met all of the following criteria: (i) focused on wheat; (ii) used a UAV platform for image acquisition; (iii) addressed nitrogen diagnosis, nitrogen-related prediction, or a closely related nitrogen-response outcome; (iv) used machine learning or predictive modeling and (v) the full text was accessible for data extraction. Studies were excluded when one or more of the above-mentioned conditions were not fulfilled.
During screening, 235 records were evaluated. After applying the eligibility criteria, 91 studies were initially retained. During the full-text extraction phase, three studies were subsequently removed because the full articles were not accessible for complete extraction, resulting in a final dataset of 88 studies. Among excluded records, the main reasons for exclusion were wrong crop (n = 80), wrong outcome (n = 60), wrong platform (n = 2), and review articles (n = 2). These study-selection steps are summarized in Figure 2. The completed PRISMA 2020 [28] checklist is provided in Supplementary Table S2.
Figure 2.
PRISMA flow diagram of the literature inclusion and exclusion process for this study (Source: adapted from Page et al. [28]).
2.3. Study Screening and Selection
Study screening was conducted in a stepwise manner. Titles and abstracts were first reviewed to remove records that were clearly outside the scope of the review. Records that appeared potentially relevant, or for which eligibility remained uncertain at the title and abstract stage, were retained for full-text assessment to avoid premature exclusion. Full texts were then assessed against the predefined inclusion and exclusion criteria. Only studies that passed full-text screening and contained sufficient information for extraction and comparative analysis were retained in the final dataset. Where the full article could not be accessed, or where essential methodological information was unavailable for reliable extraction, the study was not included in the final review. Details of study inclusion and exclusion are given in Supplementary Table S3.
2.4. Data Extraction
A structured data-extraction sheet was developed in Microsoft Excel and used to record information from each included study in a standardized manner. The final extraction file contained 88 studies and 41 variables per study. Extracted information covered bibliographic details, experimental context, sensing platform, target outcome, model characteristics, validation design, growth-stage reporting, and model-performance information. The main extracted variables included: study identifier and bibliographic details, experimental details, wheat type, nitrogen treatment structure, growth stage or stages evaluated, sensor type, use of data fusion, nitrogen-related target variable, model family, validation approach, selected model-performance metric, and study-level notes relevant to interpretation.
Screening and data extraction were conducted using a predefined eligibility and extraction framework developed before full-text screening. Four reviewers independently screened titles and abstracts, and potentially eligible records were retained for full-text assessment. Full-text eligibility and data extraction were then checked by a second reviewer. Disagreements were resolved through discussion, and when necessary, by consultation with a senior reviewer until consensus was reached. The review protocol was not formally registered; however, the search strategy, eligibility criteria, coding framework, and data-extraction variables were defined before final synthesis to improve transparency and reproducibility. Studies for which the full text was inaccessible were excluded because complete methodological and performance information was required for reliable coding and comparison. We acknowledge that this criterion may introduce availability bias, and this issue has been added as a limitation of the review. The full data-extraction framework, extracted data, and coding dictionary are provided in Supplementary Tables S4–S6.
2.5. Coding Framework and Harmonization
The included literature used inconsistent terminology, variable reporting depth, and heterogeneous analytical targets; therefore, a harmonization step was conducted after initial extraction. This step was designed to convert the raw extraction sheet into a manuscript-oriented analytical dataset that could support transparent cross-study comparison. The coding and harmonization process followed the same pool of studies retained through the PRISMA-based selection process and did not alter the final study count. The final harmonized study-level dataset used for the systematic review is provided in Supplementary Table S7, and the decision rules used for coding and selection of comparative metrics are summarized in Supplementary Note S1.
2.5.1. Coding of Target-Directness
The primary nitrogen-related outcome of each study was classified into one of four categories, namely Direct N, close proxy, indirect proxy, or treatment class only.
- Direct N was used for studies in which the primary target was a direct nitrogen-status variable. Direct nitrogen status variables included plant nitrogen concentration, plant nitrogen accumulation, leaf nitrogen concentration, leaf nitrogen accumulation, canopy nitrogen content, or nitrogen nutrition index.
- Close proxy was used for studies that included variables strongly related to nitrogen status but were not themselves direct nitrogen measures. Studies focusing on SPAD, chlorophyll, or canopy chlorophyll content were classified as a close proxy because chlorophyll measurement is not a direct estimation of nitrogen but it is largely used as an alternative.
- Indirect proxy included broader agronomic traits influenced by nitrogen, such as biomass, yield, or leaf area index. These traits do not directly estimate nitrogen but are nitrogen-dependent.
- Treatment class only referred to studies predicting nitrogen treatment classes or related categorical outcomes rather than continuous nitrogen-status traits. For example, studies focused on identifying nitrogen application classes were classified as a treatment class only.
When multiple outcomes were reported, the primary study-level coding was assigned to the outcome judged most central to the nitrogen-diagnosis purpose of the study, based on the abstract, methods, results emphasis, and reported best model.
2.5.2. Coding of Validation Rigor
Validation procedures were coded according to their degree of independence and then grouped into broader categories for comparison.
- Internal-only validation was used for random train–test splits, holdout validation within the same dataset, k-fold cross-validation, repeated internal resampling, and related within-dataset partitioning approaches.
- Independent-like validation was used when the validation design included temporal separation, spatial separation, site-to-site transfer, experiment-to-experiment transfer, or any explicitly external or cross-domain testing scenario.
2.5.3. Coding of Growth Stage
Growth-stage information was extracted and standardized to common stage labels, including regreening, tillering, jointing, booting, heading, anthesis, grain filling, and maturity. Studies were also categorized according to whether they evaluated single-stage, multi-stage, or unclear growth-stage designs. Where the full text explicitly indicated one practically optimal stage, that study was additionally flagged for best-stage comparison.
2.5.4. Coding of Sensor and Model Complexity
Sensor type was harmonized into final categories including RGB, multispectral, hyperspectral, and multi-sensor systems. Data fusion was coded as yes or no depending on whether a study explicitly combined multiple data types or sensor sources. Primary sensor class and data fusion were coded as separate variables. Primary sensor class refers to the main image-acquisition hardware or sensing source used in the study, such as RGB, multispectral, hyperspectral, or multi-sensor systems. A multi-sensor system was used when a study relied on more than one sensor type as a central part of image acquisition or model input. In contrast, data fusion refers to the analytical integration of multiple data streams or feature types, such as spectral indices with texture features, UAV imagery with satellite or environmental data, or multi-source model inputs. Therefore, a study could have a single primary sensor class but still be coded as using data fusion if additional feature types or data sources were combined during analysis. Model families were also standardized into broader classes such as traditional machine learning, ensemble machine learning, deep learning, and hybrid or physics-informed approaches.
2.6. Reporting Bias and Certainty of Evidence Assessment
Reporting bias and the certainty of evidence were assessed narratively because the review used descriptive quantitative synthesis rather than a formal meta-analysis. Reporting bias was considered in relation to possible selective reporting of best-performing models, incomplete reporting of comparable performance metrics, inconsistent reporting of validation procedures, and limited availability of negative or poorly performing results. Certainty of evidence was assessed for the main review findings by considering study risk of bias, consistency, directness, precision, and possible reporting bias. Certainty was rated as high, moderate, low, or very low. Reporting bias and certainty of evidence assessments are provided in Supplementary Tables S8 and S9, respectively.
2.7. Analytical Questions
The review was organized around six research questions, of which the first three formed the core basis of the manuscript:
- RQ1: Are UAV-based wheat studies directly diagnosing crop nitrogen status or mainly predicting nitrogen-related proxies?
- RQ2: How rigorous are the validation procedures used in the existing literature?
- RQ3: Which wheat growth stages are most commonly associated with UAV-based nitrogen diagnosis?
- RQ4: How complex are the sensing systems used across the literature?
- RQ5: How frequently is data fusion employed?
- RQ6: How complex are the modeling approaches used?
RQ1–RQ3 most directly address the conceptual and methodological maturity of the field. Specifically, they allow evaluation of what is being predicted, how confidently reported model performance can be interpreted, and when UAV-based diagnosis is most commonly attempted. RQ4–RQ6 were used primarily to provide broader technological context regarding the evolution of sensors, fusion strategies, and modeling complexity.
The first three questions therefore structured the main review and the narrative development of the manuscript, whereas the latter three questions supported interpretation of broader trends in the literature.
2.8. Quantitative Analysis Strategy
A formal inverse-variance meta-analysis was not conducted because the included studies did not report sufficiently standardized effect-size information. In particular, many studies lacked one or more of the following elements required for rigorous cross-study pooling: a clearly defined held-out test sample size, an explicitly independent validation structure, a standardized outcome endpoint, or a consistent rule for selecting one comparable model result per study. In addition, the included literature varied substantially in whether the reported outcome represented a direct nitrogen variable or a proxy trait, further limiting strict effect-size comparability.
Therefore, this review adopted a descriptive quantitative synthesis based on selected R2 values extracted from each study. This approach was chosen to enable transparent comparison of major patterns in the literature while respecting the heterogeneity of reported targets, validation strategies, and modeling pipelines. The analytical workflow was implemented after completion of study selection, data extraction, and harmonization, and was based on the final pool of studies retained through the PRISMA-guided review process.
For each comparison group, descriptive quantitative summaries were calculated, including the number of studies, the number of studies with usable R2 values, mean R2, median R2, first and third quartiles, interquartile range, and minimum and maximum values. Figures were then prepared to visualize the distributions of target categories, validation rigor, selected R2 values across major groups, and the frequency of growth stage coverage across the literature. This strategy was considered more appropriate than formal pooled meta-analysis because it allowed the review to address the main conceptual questions of interest without imposing statistical assumptions that were not adequately supported by the published reporting structure of the included studies.
2.9. Sensitivity-Oriented Interpretive Subsets
To reduce conceptual confounding and strengthen interpretation, core subsets were also created for sensitivity-oriented comparison. For RQ1, a Direct N core dataset was prepared using only studies directly estimating nitrogen-status variables. For RQ2, a True N diagnosis core dataset was prepared using studies that both addressed direct nitrogen outcomes and reported usable performance values for validation comparison.
2.10. Data Management and Presentation
All extraction, coding, harmonization, and summary analyses were conducted using Microsoft Excel, with additional support from Python 3.11.15 packaged by Anaconda, Inc., with Matplotlib 3.10.8, Pandas 3.0.2, and NumPy 2.4.3 for summary statistics and figure preparation. Study characteristics, analytical coding, summary tables, and figures were generated from the final harmonized workbook to ensure consistency between the extracted data and manuscript outputs.
3. Results
3.1. Overview of the Evidence Base
A total of 88 studies were included in the final review. The number of studies focusing on UAV-based nitrogen diagnosis in wheat has increased during the last five years, with a marked increase in 2025 (Figure 3).
Figure 3.
Annual publication trend of included studies. The figure shows the number of UAV-based wheat nitrogen assessment studies included in this review by publication year. The 2026 count reflects records identified up to the database search date of 6 April 2026.
Among the included studies, most focused on winter wheat (n = 80), while the remaining studies (n = 6) assessed spring wheat and two studies (n = 2) focused on durum wheat without a clearly specified seasonal type. Geographically, the evidence base was highly concentrated in China, followed by India, with comparatively limited representation from other countries (Figure 4).
Figure 4.
Geographic distribution of the included UAV-based wheat nitrogen assessment studies. Panel (A) shows the countries in which at least one included study was conducted. Panel (B) summarizes the number of included studies by country. For multi-country studies, each country was counted once. The figure highlights the geographic concentration of the current evidence base and the uneven global distribution of UAV-based wheat nitrogen assessment research.
In terms of sensing platforms, the literature showed a clear preference for advanced remote sensing approaches. Multispectral sensing was the most common primary sensor class (n = 37), followed by hyperspectral sensing (n = 21) and multi-sensor systems (n = 21), whereas RGB-only approaches were less frequent (n = 9). Data fusion was coded separately from the primary sensor class and was nearly balanced across the dataset, with 45 studies incorporating fused data sources and 43 studies relying on non-fusion workflows. With regard to modeling approaches, the literature was dominated by more complex analytical methods, particularly ensemble machine learning models (n = 31), followed by hybrid or physics-informed approaches (n = 16) and traditional machine learning models (n = 14). Overall, these patterns indicate that recent research has increasingly moved toward more information-rich sensors and computationally advanced modeling frameworks. A summary of the main characteristics of the included studies is provided in Table 1, while the co-occurrence of sensor type, target-directness, and validation structure across the included literature is summarized in Figure 5.
Table 1.
Summary characteristics of included studies [8,9,10,11,12,13,14,15,16,17,18,19,20,22,23,24,25,26,29,30,31,32,33,34,35,36,37,38,39,40,41,42,43,44,45,46,47,48,49,50,51,52,53,54,55,56,57,58,59,60,61,62,63,64,65,66,67,68,69,70,71,72,73,74,75,76,77,78,79,80,81,82,83,84,85,86,87,88,89,90,91,92,93,94,95,96,97,98].
Figure 5.
Alluvial overview of target-directness, sensor type, and validation grouping. Flow widths are proportional to the number of studies. Flow colors correspond to the target-directness categories shown in the first column.
3.2. Direct Nitrogen Diagnosis Versus Proxy-Based Prediction
One of the main aims of this systematic review was to determine whether UAV-based studies in wheat are diagnosing nitrogen status or instead predicting related proxy traits. Across the 88 included studies, 57 studies were classified as addressing direct nitrogen outcomes, 10 studies focused on close proxies, 17 studies targeted indirect proxies, and 4 studies were limited to treatment-class prediction only (Figure 6A). For quantitative analysis, the most commonly reported model performance metric (R2) was used. Among studies with comparable selected R2 values, 52 direct nitrogen studies, 10 close-proxy studies, and 12 indirect-proxy studies were available for structured quantitative comparison. The median selected R2 for direct nitrogen studies was 0.855, with an interquartile range (IQR) of 0.104 and an overall range of 0.54–0.99. Studies based on close proxies showed a median R2 of 0.868 (IQR = 0.137, range = 0.71–0.98), while indirect proxy studies showed a median R2 of 0.841 (IQR = 0.103, range = 0.72–0.95) (Figure 6B; Supplementary Table S10).
Figure 6.
Target-directness and validation rigor in UAV-based wheat nitrogen assessment studies. Panel (A) shows the distribution of included studies according to nitrogen-related target category. Panel (B) shows the distribution of selected R2 values across target categories for studies with usable R2. Panel (C) shows the distribution of included studies according to validation grouping. Panel (D) shows selected R2 values for internal-only and independent-like validation studies with usable R2. Selected R2 refers to the single study-level model-performance value extracted according to the predefined coding rules for descriptive comparison.
These descriptive patterns show that relatively high predictive performance has been reported across all target categories, including studies that did not directly estimate plant nitrogen traits. This pattern is important because it indicates that strong reported model accuracy should not automatically be interpreted as evidence of true nitrogen diagnosis. A substantial portion of the UAV-wheat literature still relies on proxy outcomes that may be agronomically useful but are conceptually different from direct assessment of crop nitrogen status. Therefore, the apparent maturity of the field may be somewhat overstated if direct and proxy-based studies are interpreted as equivalent.
3.3. Validation Rigor in the UAV-Wheat Nitrogen Literature
A second major objective of this review was to assess how rigorously model performance has been validated in the existing literature. Of the 88 included studies, 65 studies were categorized as using internal-only validation, and 23 studies used independent-like validation (Figure 6C). This indicates that most studies still evaluate model performance using internal data-splitting strategies rather than more stringent validation frameworks that better reflect practical deployment.
For structured quantitative comparison, 51 internal-only studies and 18 independent-like studies reported usable selected R2 values. The median selected R2 under internal-only validation was 0.860 (IQR = 0.100, range = 0.61–0.98), whereas studies using independent-like validation showed a lower median R2 of 0.825 (IQR = 0.158, range = 0.54–0.99) (Figure 6D; Supplementary Table S10).
Among the independent-like studies with usable selected R2 values (n = 18), validation strategies were not uniform. Most of the studies focused on transferability or cross-domain validation (n = 8), followed by external dataset validation (n = 4), temporal validation (n = 3), spatial validation (n = 2), and independent holdout validation (n = 1). When separated by validation subtype, temporal validation showed a median selected R2 of 0.840, spatial validation showed a median selected R2 of 0.865, independent holdout validation showed a median selected R2 of 0.780, external dataset validation showed a median selected R2 of 0.791, and transferability or cross-domain validation showed a median selected R2 of 0.835. These values should be interpreted descriptively because subgroup sizes were small and validation designs differed across studies. Nevertheless, this breakdown shows that independent-like validation in the UAV-wheat nitrogen literature includes multiple levels of rigor rather than a single uniform category. It also supports the broader finding that although several studies have begun to test temporal, spatial, external, or transferability-related robustness, most evidence remains limited compared with the large number of internally validated models.
Although high model performance was reported under both validation groupings, the descriptive pattern suggests that performance tends to be somewhat lower when validation becomes more rigorous. This supports the concern that a sizeable fraction of published UAV-based nitrogen diagnosis studies may report optimistic performance estimates due to reliance on internal-only validation schemes. As a result, the literature appears stronger in terms of within-dataset predictive performance than in demonstrating robustness across independent conditions, seasons, sites, or experimental settings.
3.4. Study Risk of Bias and Certainty of Evidence
Potential reporting bias was mainly related to the selective reporting of best-performing models, incomplete availability of comparable performance metrics, and heterogeneous reporting of validation procedures. These issues were particularly relevant to comparative model-performance findings based on selected R2 values. Certainty of evidence was higher for descriptive study-count findings, including target-trait categories and validation strategies, because these were based on clear study-level coding across all included studies. In contrast, certainty was lower for comparative performance patterns across sensor types, fusion status, model classes, and validation groups because of heterogeneous target traits, unequal subgroup sizes, selected performance reporting, and differences in modeling workflows. The reporting bias and certainty assessments are summarized in Supplementary Tables S8 and S9.
3.5. Growth-Stage Coverage and Practical Timing of UAV-Based Nitrogen Diagnosis
The timing of image acquisition is crucial in UAV-based nitrogen diagnosis, yet the available evidence was less standardized than that for target type and validation rigor. Most studies assessed crop nitrogen status across multiple growth stages (n = 74), whereas only 8 studies focused on a single stage, and 6 studies were classified as unclear in stage reporting. This indicates that growth-stage effects are widely recognized in the literature, but they are often evaluated in multi-stage experimental frameworks rather than being isolated through directly comparable stage-specific designs.
Across all included studies, the most frequently assessed growth stages were jointing (n = 57), grain filling (n = 45), anthesis (n = 42), booting (n = 41), and heading (n = 39). Other stages, such as tillering (n = 18), regreening (n = 9) and maturity (n = 12) were less commonly represented (Figure 7A). A similar pattern was observed when analysis was restricted to studies classified as direct nitrogen diagnosis, suggesting that the overall distribution of stage coverage was not driven solely by proxy-based studies.
Figure 7.
(A) Frequency of growth-stage coverage across the included studies, with the direct-nitrogen subset shown for comparison. (B) Frequency of growth stages covered in single-stage focused studies.
Among single-stage studies (n = 8), five studies focused on direct N while the remaining three focused on indirect (n = 1) or close proxy (n = 2). Among these limited stage-specific comparisons, the median selected R2 was 0.860 for jointing, 0.802 for heading, and 0.768 for anthesis, while the single tillering study reported an R2 of 0.968. Although the subset was small but we observed that reported R2 values for indirect/close proxy at jointing (0.925), heading (0.878), and anthesis (0.925) were higher than those for direct N studies (0.83 and 0.86 at jointing, 0.726 at heading, 0.61 at anthesis). It shows that model performance varies at a given growth stage depending on the targeted outcome. However, the current evidence is not conclusive and requires more in-depth research. A consolidated summary of the quantitative analysis is provided in Supplementary Table S10.
Overall, the growth-stage evidence suggests that UAV-based nitrogen diagnosis in wheat is most commonly explored from jointing to grain filling. However, the present literature does not yet provide sufficiently standardized evidence to support one universally best growth stage for nitrogen diagnosis across all study contexts. Instead, the descriptive patterns point to a relatively broad diagnostic window, with a stronger concentration of research effort in the mid-to-late vegetative and early reproductive stages.
3.6. Model Performance in Studies Focused on Direct N
Direct nitrogen-focused studies (n = 57) were analyzed for variation in study characteristics. Most of the studies (n = 52) used R2 to evaluate model performance while the remaining studies (n = 5) used other metrics to report model performance. Therefore, 52 studies were used to assess variations among study characteristics. For nitrogen diagnosis in wheat, most studies focused on multi-stage data collection (n = 46). Multi-stage studies had a higher mean R2 (0.855) than single-stage studies (0.845) (Figure 8A). The interquartile range was also comparable between the two groups (0.102 for multi-stage vs. 0.108 for single stage). Clearer variation was observed among target nitrogen metrics and sensor types (Figure 8B,C). Among nitrogen targets, model performance was the highest for CNC (mean R2 = 0.863), followed by PNA (0.851), LNC (0.839), and PNC (0.838), whereas NNI had the lowest mean R2 (0.771). Median values followed a similar pattern, with PNC and PNA both showing relatively strong central performance, while NNI tended to be lower. However, CNC (n = 4) and LNA (n = 3) were reported in relatively fewer studies. For sensor type, hyperspectral studies showed higher reported mean R2 (0.872; median = 0.870) in this descriptive dataset, followed closely by multispectral studies (0.852; median = 0.860). Multi-sensor studies had a lower mean R2 (0.774; median = 0.800), while RGB-based studies had the lowest reported performance (mean R2 = 0.615), although this category included only two observations. These results suggest that hyperspectral sensing was associated with the strongest predictive performance in the current dataset, whereas RGB-only approaches appeared less effective.
Figure 8.
Descriptive comparison of selected R2 values among direct nitrogen studies. Selected R2 values from direct nitrogen studies with usable R2 information were summarized by: (A) growth-stage grouping, (B) nitrogen target metric, (C) sensor type, (D) data-fusion status, (E) validation grouping, and (F) model family. Selected R2 refers to the extracted study-level model-performance value used for descriptive synthesis according to the predefined coding rules. Sample sizes are shown below each category.
Data fusion and validation type also showed noticeable descriptive differences (Figure 8D,E). Studies using fusion approaches (n = 30) showed a descriptive tendency toward higher mean selected R2 values than studies without fusion (0.840 vs. 0.813) and also showed a slightly higher median R2 (0.861 vs. 0.820). In addition, the fusion group had a narrower interquartile range (0.075) than the no-fusion group (0.115), suggesting slightly more consistent performance. For validation strategy, internal-only studies (n = 37) reported a higher mean R2 than independent-like studies (0.840 vs. 0.802), while independent-like validation showed a broader spread of values (IQR = 0.158 vs. 0.100). This pattern is consistent with the expectation that internally validated models may report somewhat more optimistic performance than those assessed under more independent conditions.
Differences were also evident across model complexity groups (Figure 8F). Neural/deep learning models showed the highest mean R2 (0.876; median = 0.875), followed by linear/statistical models (0.860), ensemble ML (0.833), traditional ML (0.818), and hybrid/physics-informed models (0.774); however, this should not be interpreted as general superiority. Ensemble ML had the largest number of observations (n = 21), indicating that it was the most frequently represented modeling category in the dataset; however, its average performance remained below that of neural/deep learning models. Hybrid/physics-informed models showed the lowest mean performance among the major model classes and also displayed moderate variability. Taken together, these descriptive results suggest modest performance advantages for fusion-based workflows, hyperspectral sensing, internal-only validation settings, and neural/deep learning models, although unequal sample sizes across categories mean that these comparisons should be regarded as descriptive rather than definitive.
4. Discussion
The systematic review of the available literature shows that UAV-based wheat nitrogen assessment research has progressed considerably, with many studies reporting strong predictive performance and increasingly using advanced sensors and machine learning approaches. Nitrogen assessment in wheat varies depending on crop developmental stage, sensor type used for data collection, target nitrogen characteristic, presence or absence of data fusion, data validation strategy, and model complexity used in the study. The main contribution of this review is the conceptual separation of true nitrogen diagnosis from proxy-based prediction, together with an evaluation of how rigorously reported model performance has been validated. Many UAV-based studies report high predictive accuracy, but such accuracy has different implications depending on whether the target variable is a direct nitrogen indicator, a close proxy, an indirect proxy, or simply a treatment class. This distinction is essential because a model that performs well for chlorophyll, biomass, yield, or nitrogen treatment classification may be useful for crop monitoring but cannot automatically be considered a nitrogen diagnosis tool. Similarly, strong performance under internal train-test splitting or cross-validation does not necessarily demonstrate field-level transferability. By jointly evaluating target directness and validation rigor, this review provides a clearer picture of where UAV-based wheat nitrogen assessment is scientifically strong and where further evidence is needed before operational use in precision nitrogen management.
The systematic review showed that most studies focused on multiple wheat developmental stages and the literature was concentrated from jointing to grain filling, particularly around jointing [9,10,31], booting [14,22], heading [43,46], anthesis [52], and grain filling [33,71]. Nitrogen plays an important role at each developmental stage; therefore, nitrogen assessment at multiple stages is beneficial but at the same time, the evidence was not sufficiently standardized to identify one universally best stage for UAV-based nitrogen assessment. For further advancement in precision agriculture, it is important to identify critical stages for nitrogen assessment. Single-stage studies also focus on different developmental stages, including tillering [64], jointing [20,24,78], heading [15,53], and anthesis [26,52]. This variability suggests that the most useful stage likely depends on the target variable, the sensor used, the nitrogen treatment structure, and the intended management objective. A stage that performs well for plant nitrogen concentration may not be equally suitable for biomass-related proxies or grain-related outcomes later in the season. Likewise, a stage with strong predictive accuracy may still be less useful if it occurs too late for meaningful nitrogen intervention. Future studies would therefore benefit from explicitly testing stage-specific model performance in relation not only to prediction accuracy but also to practical decision timing.
This systematic review found that a substantial part of the literature does not target direct nitrogen variables but instead predicts close or indirect proxies. Several included studies directly estimated crop nitrogen indicators such as PNC [11,18], LNC [94,97], LNA [62], PNA [8,39], or NNI [13,45]. In contrast, other studies focused on chlorophyll-related traits, SPAD, biomass, yield, or nitrogen treatment classes [29,30,37,66]. Reported proxy traits are agronomically important but they are not equivalent to direct assessment of crop nitrogen status. Moreover, a proxy predicting model cannot be assumed to provide equally reliable nitrogen diagnosis for management decisions.
In this review, high model performance (R2 values) was observed for direct nitrogen studies as well as for close proxy and indirect proxy studies. Close or indirect proxies are more readily captured by spectral or structural canopy signals than direct nitrogen traits themselves. Therefore, high reported performance does not indicate that UAV-based nitrogen assessment has been fully achieved. It is important to distinguish between direct nitrogen diagnosis, nitrogen-related trait prediction, and general crop status estimation. Treating these categories as interchangeable risks overstates the readiness of the field for operational nitrogen management.
Another notable pattern in the dataset is the dominance of multispectral, hyperspectral, and fused sensing approaches, together with frequent use of ensemble and hybrid models. Multispectral and hyperspectral sensors cover a larger number of spectral bands than RGB and can improve nitrogen assessment. RGB sensors have been reported to assess nitrogen at very early stages [99,100] but advanced sensors are more widely used for nitrogen assessment particularly for nitrogen diagnosis [23,61,70]. We also observed that advanced models such as neural/deep learning models [57,69] showed higher selected R2 values in this dataset. It indicates that UAV-based remote sensing is utilizing advanced sensors and models for nitrogen assessment in wheat but they can also reduce interpretability and increase cost. Practical usefulness of models does not only depend upon their predictive strength but also on their ease of use, cost, and consistency. At present, the research appears more centered on technological advancement than towards the operational decision support. The researchers have already started focusing on more operationally relevant outputs, such as nitrogen class prediction, transferability-oriented validation, or cross-environment testing, but there is still a gap in connecting diagnosis outputs to recommendation logic, variable-rate application strategies, decision thresholds, or economically meaningful nitrogen classes.
Another research gap observed in this review was the validation design. Most studies in the present dataset used internal-only validation [17,58,60], and comparatively fewer studies used independent-like validation [59,63,74]. Internal-only validation is associated with optimistic model evaluation providing higher R2 values while independent-like validation is considered more rigorous. A similar trend was observed in the current dataset, where the median selected R2 values of independent validation were lower than those of the internal-only validation. Model development is intended for use under practical conditions; however, an internally validated model may have limited value for real-world nitrogen recommendations. In this review, we observed that the field appears strong in identifying informative spectral features and constructing accurate within-study models, but still less developed in demonstrating transferability, generalization, and operational robustness. The expanded validation analysis further shows that “independent-like validation” used different levels of independence, including temporal validation [9,39], spatial validation [22], external dataset validation [14,45], independent holdout testing [59,63], and transferability [18,86]. Although the number of studies in each subgroup remains limited, this breakdown strengthens the conclusion that UAV-based wheat nitrogen models are increasingly being evaluated beyond internal train-test splits, but still require broader temporal, spatial, cross-site, cross-year, and external validation before they can be considered operationally reliable for precision nitrogen management. Yu et al. [101] also reviewed UAV hyperspectral remote sensing for crop nitrogen monitoring and emphasized the increasing importance of hyperspectral imaging, machine learning, deep learning, hybrid modeling, independent testing, model transferability, and phenological confounding in crop nitrogen prediction. These conclusions are in line with the present review, particularly our observation that advanced sensing systems and machine learning approaches are increasingly used in UAV-based nitrogen studies, while independent validation remains insufficiently addressed. However, our review extends that work by focusing specifically on wheat and by separating direct nitrogen diagnosis from close and indirect proxy prediction. Future work should further improve model validation across locations, years, crops, cultivars, management practices, and environmental conditions.
Overall, the review indicates that UAV-based wheat nitrogen assessment is a promising and rapidly developing research area that faces important conceptual and methodological challenges. The use of UAVs, advanced sensors, and machine learning has enabled researchers to predict nitrogen-related traits non-destructively. However, to move from nitrogen assessment to actionable nitrogen diagnosis, it is important to distinguish between direct nitrogen diagnosis and proxy prediction. We also need to adopt independent validation designs and link diagnosis outputs to actionable management decisions. Moreover, to reduce operational costs it is also important to identify critical nitrogen diagnosis stages using UAV-based systems. Therefore, future research should focus not only on improving predictive accuracy within individual studies but also on demonstrating that UAV-based nitrogen diagnosis is transferable, interpretable, and operationally useful under real production conditions.
5. Limitations of the Review
The systematic approach used in this review has some important limitations. The literature search was restricted to Scopus and Web of Science and included only English language journal articles. Availability bias may have been introduced by excluding studies for which full texts were inaccessible. Moreover, the comparative quantitative analysis was based primarily on selected R2 values rather than standardized effect sizes with known variance. Many studies reported the best-performing model rather than a prespecified single endpoint, which may favor optimistic comparison. Variability in target definitions, validation procedures, and growth-stage reporting limited the extent to which all studies could be pooled quantitatively. Therefore, the present review should be interpreted as a systematic review rather than a meta-analysis. This approach provided a practical and transparent way to compare the field along conceptually important dimensions that are often overlooked, particularly the distinction between direct nitrogen diagnosis and proxy prediction, and the difference between internal-only and independent-like validation designs.
6. Conclusions
This systematic review shows that UAV-based wheat nitrogen assessment has advanced rapidly through the use of multispectral and hyperspectral sensing, data fusion, and machine learning approaches. However, its main contribution is the distinction between true nitrogen diagnosis and proxy-based prediction, together with the assessment of validation rigor. High selected R2 values were reported for both direct nitrogen traits and proxy traits, indicating that predictive accuracy alone should not be interpreted as evidence of reliable nitrogen diagnosis. Most studies relied on internal-only validation, whereas independent-like validation was less common and generally showed lower reported performance, suggesting that current evidence is stronger for within-study prediction than for transferable field deployment. Descriptive growth-stage patterns indicate that jointing, booting, heading, anthesis, and grain filling are the most commonly studied stages, but standardized stage-specific validation is still lacking. Future research should prioritize direct nitrogen indicators, agronomically meaningful metrics such as NNI, stronger temporal, spatial, cross-site, cross-year, and external validation, and clearer links between diagnostic outputs and actionable precision nitrogen management.
Supplementary Materials
The following supporting information can be downloaded at: https://www.mdpi.com/article/10.3390/nitrogen7030068/s1. Note S1: Decision Rules for Coding and Comparative review. Table S1: Database search string used for the systematic review of UAV-based nitrogen assessment in wheat. Table S2: PRISMA 2020 checklist. Table S3: Study screening for inclusion and exclusion. Table S4: Extraction Fields. Table S5: Extracted data. Table S6: Final Coding list. Table S7: Final harmonized dataset (88 studies × manuscript variables). Table S8: Study-level risk of bias and methodological quality assessment. Table S9: Certainty of evidence assessment. Table S10: Structured comparative quantitative summary across the main analytical questions.
Author Contributions
Conceptualization, M.W.N., M.Y.N. and C.T.; methodology, M.W.N. and M.Y.N.; software, M.I. and M.H.J.; validation, M.W.N., M.D.J. and C.T.; formal analysis, R.M. and M.H.J.; investigation, M.W.N. and M.I.; resources, C.T.; data curation, M.D.J. and M.H.J.; writing—original draft preparation, M.W.N., R.M. and M.H.J.; writing—review and editing, M.Y.N., M.I. and M.D.J.; visualization, M.W.N.; supervision, C.T. and M.W.N.; project administration, C.T.; funding acquisition, C.T. All authors have read and agreed to the published version of the manuscript.
Funding
This research received no external funding.
Data Availability Statement
All data generated and analyzed during this systematic review are provided within the article and its Supplementary Materials. Further inquiries can be directed to the corresponding authors.
Acknowledgments
During the preparation of this manuscript, the authors used ChatGPT based on GPT-5.5 Thinking by OpenAI for the purposes of language refinement, grammar checking, improving sentence clarity, enhancing readability, and improving Python code for figures improvement. The authors have reviewed and edited the output and take full responsibility for the content of this publication.
Conflicts of Interest
The authors declare no conflicts of interest.
Abbreviations
The following abbreviations are used in this manuscript:
| UAV | Unmanned aerial vehicle |
| UAS | Unmanned aerial system |
| ML | Machine learning |
| PRISMA | Preferred Reporting Items for Systematic Reviews and Meta-Analyses |
| RGB | Red–green–blue |
| PNC | Plant nitrogen concentration |
| PNA | Plant nitrogen accumulation |
| LNC | Leaf nitrogen concentration |
| LNA | Leaf nitrogen accumulation |
| CNC | Canopy nitrogen content |
| NNI | Nitrogen nutrition index |
| SPAD | Soil–Plant Analysis Development (chlorophyll meter) |
| R2 | Coefficient of determination |
| IQR | Interquartile range |
| NUE | Nitrogen use efficiency |
| FAO | Food and Agriculture Organization |
| RIS | Research Information Systems file format |
| TS | Topic Search |
| RQ | Research question |
References
- FAO. FAOSTAT. Available online: https://www.fao.org/faostat/en/#data/QCL (accessed on 12 February 2026).
- Wang, Y.; Wang, D.; Tao, Z.; Yang, Y.; Gao, Z.; Zhao, G.; Chang, X. Impacts of Nitrogen Deficiency on Wheat (Triticum aestivum L.) Grain During the Medium Filling Stage: Transcriptomic and Metabolomic Comparisons. Front. Plant Sci. 2021, 12, 674433. [Google Scholar] [CrossRef] [Scilit] [PubMed]
- Elbasyoni, I.S.; Abdallah, A.M.; Morsy, S.; Baenziger, S. Effect of Deprivation and Excessive Application of Nitrogen on Nitrogen Use Efficiency-Related Traits Using Wheat Cultivars, Lines, and Landraces. Crop Sci. 2019, 59, 994–1006. [Google Scholar] [CrossRef] [Scilit]
- Sharma, L.K.; Bali, S.K. A Review of Methods to Improve Nitrogen Use Efficiency in Agriculture. Sustainability 2018, 10, 51. [Google Scholar] [CrossRef] [Scilit]
- Silva, L.; Conceição, L.A.; Lidon, F.C.; Maçãs, B. Remote Monitoring of Crop Nitrogen Nutrition to Adjust Crop Models: A Review. Agriculture 2023, 13, 835. [Google Scholar] [CrossRef] [Scilit]
- Olson, D.; Anderson, J. Review on Unmanned Aerial Vehicles, Remote Sensors, Imagery Processing, and Their Applications in Agriculture. Agron. J. 2021, 113, 971–992. [Google Scholar] [CrossRef] [Scilit]
- Sarkar, T.K.; Roy, D.K.; Kang, Y.S.; Jun, S.R.; Park, J.W.; Ryu, C.S. Ensemble of Machine Learning Algorithms for Rice Grain Yield Prediction Using UAV-Based Remote Sensing. J. Biosyst. Eng. 2024, 49, 1–19. [Google Scholar] [CrossRef] [Scilit]
- Astaoui, G.; Dadaiss, J.; Sebari, I.; Benmansour, S.; Mohamed, E. Mapping Wheat Dry Matter and Nitrogen Content Dynamics and Estimation of Wheat Yield Using UAV Multispectral Imagery Machine Learning and a Variety-Based Approach: Case Study of Morocco. Agriengineering 2021, 3, 29–49. [Google Scholar] [CrossRef] [Scilit]
- Cheng, Z.; Gu, X.; Zhao, T.; Li, W.; Wei, C.; Xu, Y.; Sun, S.; Du, Y.; Cai, H. Integrating Data Assimilation with Chlorophyll Fluorescence Signatures: An Innovative Framework for Real-Time Monitoring of Crop Nitrogen Dynamics. Field Crops Res. 2025, 333, 110041. [Google Scholar] [CrossRef] [Scilit]
- Du, R.; Chen, J.; Xiang, Y.; Zhang, Z.; Yang, N.; Yang, X.; Tang, Z.; Wang, H.; Wang, X.; Shi, H.; et al. Incremental Learning for Crop Growth Parameters Estimation and Nitrogen Diagnosis from Hyperspectral Data. Comput. Electron. Agric. 2023, 215, 108356. [Google Scholar] [CrossRef] [Scilit]
- Chen, P.; Wang, F. Effect of Crop Spectra Purification on Plant Nitrogen Concentration Estimations Performed Using High-Spatial-Resolution Images Obtained with Unmanned Aerial Vehicles. Field Crops Res. 2022, 288, 108708. [Google Scholar] [CrossRef] [Scilit]
- Fu, Z.; Yu, S.; Zhang, J.; Xi, H.; Gao, Y.; Lu, R.; Zheng, H.; Zhu, Y.; Cao, W.; Liu, X. Combining UAV Multispectral Imagery and Ecological Factors to Estimate Leaf Nitrogen and Grain Protein Content of Wheat. Eur. J. Agron. 2022, 132, 126405. [Google Scholar] [CrossRef] [Scilit]
- Han, S.; Zhao, Y.; Cheng, J.; Zhao, F.; Yang, H.; Feng, H.; Li, Z.; Ma, X.; Zhao, C.; Yang, G. Monitoring Key Wheat Growth Variables by Integrating Phenology and UAV Multispectral Imagery Data into Random Forest Model. Remote Sens. 2022, 14, 3723. [Google Scholar] [CrossRef] [Scilit]
- Ge, Y.; Zhu, Z.; Jin, S.; Zang, J.; Zhang, R.; Li, Q.; Sun, Z.; Liu, S.; Xu, H.; Zhai, Z. Winter Wheat Yield Prediction Using UAV-Based Multivariate Time Series Data and Variate-Independent Tokenization. Plant Phenomics 2025, 7, 100039. [Google Scholar] [CrossRef] [Scilit] [PubMed]
- Wu, Q.; Zhang, Y.; Zhao, Z.; Xie, M.; Hou, D. Estimation of Relative Chlorophyll Content in Spring Wheat Based on Multi-Temporal UAV Remote Sensing. Agronomy 2023, 13, 211. [Google Scholar] [CrossRef] [Scilit]
- Ding, F.; Li, C.; Zhai, W.; Fei, S.; Cheng, Q.; Chen, Z. Estimation of Nitrogen Content in Winter Wheat Based on Multi-Source Data Fusion and Machine Learning. Agriculture 2022, 12, 1752. [Google Scholar] [CrossRef] [Scilit]
- Hassani, K.; Gholizadeh, H.; Taghvaeian, S.; Natalie, V.; Carpenter, J.; Jacob, J. Application of UAS-Based Remote Sensing in Estimating Winter Wheat Phenotypic Traits and Yield During the Growing Season. PFG-J. Photogramm. Remote Sens. Geoinf. Sci. 2023, 91, 77–90. [Google Scholar] [CrossRef] [Scilit]
- Guo, Y.; He, J.; Huang, J.; Jing, Y.; Xu, S.; Wang, L.; Li, S.; Zheng, G. Effects of the Spatial Resolution of UAV Images on the Prediction and Transferability of Nitrogen Content Model for Winter Wheat. Drones 2022, 6, 299. [Google Scholar] [CrossRef] [Scilit]
- Jiang, J.; Atkinson, P.; Zhang, J.; Lu, R.; Zhou, Y.; Cao, Q.; Tian, Y.; Zhu, Y.; Cao, W.; Liu, X. Combining Fixed-Wing UAV Multispectral Imagery and Machine Learning to Diagnose Winter Wheat Nitrogen Status at the Farm Scale. Eur. J. Agron. 2022, 138, 126537. [Google Scholar] [CrossRef] [Scilit]
- Li, Y.; Miao, Y.; Zhang, J.; Cammarano, D.; Li, S.; Liu, X.; Tian, Y.; Zhu, Y.; Cao, W.; Cao, Q. Improving Estimation of Winter Wheat Nitrogen Status Using Random Forest by Integrating Multi-Source Data Across Different Agro-Ecological Zones. Front. Plant Sci. 2022, 13, 890892. [Google Scholar] [CrossRef] [Scilit] [PubMed]
- Zheng, J.; Song, X.; Yang, G.; Du, X.; Mei, X.; Yang, X. Remote Sensing Monitoring of Rice and Wheat Canopy Nitrogen: A Review. Remote Sens. 2022, 14, 5712. [Google Scholar] [CrossRef] [Scilit]
- Feng, H.; Tao, H.; Li, Z.; Yang, G.; Zhao, C. Comparison of UAV RGB Imagery and Hyperspectral Remote-Sensing Data for Monitoring Winter Wheat Growth. Remote Sens. 2022, 14, 3811. [Google Scholar] [CrossRef] [Scilit]
- Wang, J.; Wang, W.; Liu, S.; Hui, X.; Zhang, H.; Yan, H.; Maes, W. UAV-Based Multiple Sensors for Enhanced Data Fusion and Nitrogen Monitoring in Winter Wheat Across Growth Seasons. Remote Sens. 2025, 17, 498. [Google Scholar] [CrossRef] [Scilit]
- Jiang, J.; Wu, Y.; Liu, Q.; Liu, Y.; Cao, Q.; Tian, Y.; Zhu, Y.; Cao, W.; Liu, X. Developing an Efficiency and Energy-Saving Nitrogen Management Strategy for Winter Wheat Based on the UAV Multispectral Imagery and Machine Learning Algorithm. Precis. Agric. 2023, 24, 2019–2043. [Google Scholar] [CrossRef] [Scilit]
- Sahoo, R.; Gakhar, S.; Rejith, R.; Ranjan, R.; Meena, M.; Dey, A.; Mukherjee, J.; Dhakar, R.; Arya, S.; Daas, A.; et al. Unmanned Aerial Vehicle (UAV)-Based Imaging Spectroscopy for Predicting Wheat Leaf Nitrogen. Photogramm. Eng. Remote Sens. 2023, 89, 107–116. [Google Scholar] [CrossRef] [Scilit]
- Wu, Q.; Zhang, Y.; Xie, M.; Zhao, Z.; Yang, L.; Liu, J.; Hou, D. Estimation of Fv/Fm in Spring Wheat Using UAV-Based Multispectral and RGB Imagery with Multiple Machine Learning Methods. Agronomy 2023, 13, 1003. [Google Scholar] [CrossRef] [Scilit]
- Zhang, J.; Hu, Y.; Li, F.; Fue, K.G.; Yu, K. Meta-Analysis Assessing Potential of Drone Remote Sensing in Estimating Plant Traits Related to Nitrogen Use Efficiency. Remote Sens. 2024, 16, 838. [Google Scholar] [CrossRef] [Scilit]
- Page, M.J.; McKenzie, J.E.; Bossuyt, P.M.; Boutron, I.; Hoffmann, T.C.; Mulrow, C.D.; Shamseer, L.; Tetzlaff, J.M.; Akl, E.A.; Brennan, S.E.; et al. The PRISMA 2020 Statement: An Updated Guideline for Reporting Systematic Reviews. BMJ 2021, 372, n71. [Google Scholar] [CrossRef] [Scilit] [PubMed]
- Badagliacca, G.; Messina, G.; Presti, E.; Preiti, G.; Di Fazio, S.; Monti, M.; Modica, G.; Pratico, S. Durum Wheat (Triticum durum Desf.) Grain Yield and Protein Estimation by Multispectral UAV Monitoring and Machine Learning Under Mediterranean Conditions. Agriengineering 2025, 7, 99. [Google Scholar] [CrossRef] [Scilit]
- Chandel, N.; Jat, D.; Chakraborty, S.; Upadhyay, A.; Subeesh, A.; Chouhan, P.; Manjhi, M.; Dubey, K. Deep Learning Assisted Real-Time Nitrogen Stress Detection for Variable Rate Fertilizer Applicator in Wheat Crop. Comput. Electron. Agric. 2025, 237, 110545. [Google Scholar] [CrossRef] [Scilit]
- Chen, D.; Chen, Y.; Zhang, H.; Liu, J.; Cheng, Q.; Duan, F.; Kuang, X.; Fu, W.; Liu, J.; Chen, Z. Diagnosis of Nitrogen Nutrition in Winter Wheat across Years Based on Multi-Source Remote Sensing Data from Unmanned Aerial Vehicles. Smart Agric. Technol. 2025, 12, 101481. [Google Scholar] [CrossRef] [Scilit]
- Chen, P.; Ma, X. Optimal Strategy for Designing a Multitask Learning-Based Hybrid Model to Predict Wheat Leaf Nitrogen Content. IEEE Geosci. Remote Sens. Lett. 2023, 20, 3320154. [Google Scholar] [CrossRef] [Scilit]
- Chen, X.; Li, F.; Chang, Q.; Miao, Y.; Wang, C.; Qin, W.; Yu, K. A UAV-Proxied Satellite Remote Sensing Approach for Winter Wheat Plant Nitrogen Concentration Mapping. IEEE J. Sel. Top. Appl. Earth Obs. Remote Sens. 2025, 18, 24291–24301. [Google Scholar] [CrossRef] [Scilit]
- Chen, X.; Li, F.; Chang, Q.; Miao, Y.; Yu, K. Improving Winter Wheat Plant Nitrogen Concentration Prediction by Combining Proximal Hyperspectral Sensing and Weather Information with Machine Learning. Comput. Electron. Agric. 2025, 232, 110072. [Google Scholar] [CrossRef] [Scilit]
- Chen, X.; Li, F.; Shi, B.; Chang, Q. Estimation of Winter Wheat Plant Nitrogen Concentration from UAV Hyperspectral Remote Sensing Combined with Machine Learning Methods. Remote Sens. 2023, 15, 2831. [Google Scholar] [CrossRef] [Scilit]
- Chen, X.; Miao, Y.; Kusnierek, K.; Li, F.; Wang, C.; Shi, B.; Wu, F.; Chang, Q.; Yu, K. Potential of Multi-Source Multispectral vs. Hyperspectral Remote Sensing for Winter Wheat Nitrogen Monitoring. Remote Sens. 2025, 17, 2666. [Google Scholar] [CrossRef] [Scilit]
- Ding, G.; Shen, L.; Dai, J.; Jackson, R.; Liu, S.; Ali, M.; Sun, L.; Wen, M.; Xiao, J.; Deakin, G.; et al. The Dissection of Nitrogen Response Traits Using Drone Phenotyping and Dynamic Phenotypic Analysis to Explore N Responsiveness and Associated Genetic Loci in Wheat. Plant Phenomics 2023, 5, 128. [Google Scholar] [CrossRef] [Scilit] [PubMed]
- Duan, T.; Chapman, S.; Guo, Y.; Zheng, B. Dynamic Monitoring of NDVI in Wheat Agronomy and Breeding Trials Using an Unmanned Aerial Vehicle. Field Crops Res. 2017, 210, 71–80. [Google Scholar] [CrossRef] [Scilit]
- Fan, Z.; Liu, C.; Yu, F.; Lai, Y.; Wang, Q.; Zhang, Z.; Zhang, J.; Cheng, J.; Ma, X.; Gu, X.; et al. Dynamic Prediction of Carbon and Nitrogen Accumulation in Winter Wheat Grain: Source-Sink Theory Integrated with UAV Multispectral Imagery. Comput. Electron. Agric. 2026, 240, 111228. [Google Scholar] [CrossRef] [Scilit]
- Fu, Z.; Jiang, J.; Gao, Y.; Krienke, B.; Wang, M.; Zhong, K.; Cao, Q.; Tian, Y.; Zhu, Y.; Cao, W.; et al. Wheat Growth Monitoring and Yield Estimation Based on Multi-Rotor Unmanned Aerial Vehicle. Remote Sens. 2020, 12, 508. [Google Scholar] [CrossRef] [Scilit]
- Guo, B.; Feng, Y.; Ma, C.; Zhang, J.; Song, X.; Wang, M.; Sheng, D.; Feng, W.; Jiao, N. Suitability of Different Multivariate Analysis Methods for Monitoring Leaf N Accumulation in Winter Wheat Using in Situ Hyperspectral Data. Comput. Electron. Agric. 2022, 198, 107115. [Google Scholar] [CrossRef] [Scilit]
- Guo, J.; Zeng, X.; Ma, Q.; Yuan, Y.; Zhang, N.; Lin, Z.; Yin, P.; Yang, H.; Liu, X.; Zhang, F. UAV-Based Yield Prediction Based on LAI Estimation in Winter Wheat (Triticum aestivum L.) Under Different Nitrogen Fertilizer Types and Rates. Plants 2025, 14, 1986. [Google Scholar] [CrossRef] [Scilit] [PubMed]
- Han, Y.; Zhang, J.; Bai, Y.; Liang, Z.; Guo, X.; Zhao, Y.; Feng, M.; Xiao, L.; Song, X.; Zhang, M.; et al. Ensemble Learning-Driven and UAV Multispectral Analysis for Estimating the Leaf Nitrogen Content in Winter Wheat. Agronomy 2025, 15, 1621. [Google Scholar] [CrossRef] [Scilit]
- He, L.; Liu, M.; Guo, Y.; Wei, Y.; Zhang, H.; Song, X.; Feng, W.; Guo, T. Angular Effect of Algorithms for Monitoring Leaf Nitrogen Concentration of Wheat Using Multi-Angle Remote Sensing Data. Comput. Electron. Agric. 2022, 195, 106815. [Google Scholar] [CrossRef] [Scilit]
- Jiang, J.; Atkinson, P.; Chen, C.; Cao, Q.; Tian, Y.; Zhu, Y.; Liu, X.; Cao, W. Combining UAV and Sentinel-2 Satellite Multi-Spectral Images to Diagnose Crop Growth and N Status in Winter Wheat at the County Scale. Field Crops Res. 2023, 294, 108860. [Google Scholar] [CrossRef] [Scilit]
- Keselj, K.; Stamenkovic, Z.; Kostic, M.; Acin, V.; Tekic, D.; Novakovic, T.; Ivanisevic, M.; Ivezic, A.; Magazin, N. Machine Learning (AutoML)-Driven Wheat Yield Prediction for European Varieties: Enhanced Accuracy Using Multispectral UAV Data. Agriculture 2025, 15, 1534. [Google Scholar] [CrossRef] [Scilit]
- Kuang, X.; Wang, D.; Mao, B.; Li, Y.; Chen, D.; Fu, W.; Cheng, Q.; Duan, F.; Li, H.; Hou, X.; et al. A CNN-LSTM-XGBoost Hybrid Framework for Interpretable Nitrogen Stress Classification Using Multimodal UAV Imagery. Remote Sens. 2026, 18, 538. [Google Scholar] [CrossRef] [Scilit]
- Li, J.; Sheng, Y.; Wang, W.; Liu, J.; Li, X. Estimating Wheat Chlorophyll Content Using a Multi-Source Deep Feature Neural Network. Agriculture 2025, 15, 1624. [Google Scholar] [CrossRef] [Scilit]
- Li, X.; Su, X.; Li, J.; Anwar, S.; Zhu, X.; Ma, Q.; Wang, W.; Liu, J. Coupling Image-Fusion Techniques with Machine Learning to Enhance Dynamic Monitoring of Nitrogen Content in Winter Wheat from UAV Multi-Source. Agriculture 2024, 14, 1797. [Google Scholar] [CrossRef] [Scilit]
- Li, X.; Li, C.; Guo, F.; Meng, X.; Liu, Y.; Ren, F. Coefficient of Variation Method Combined with XGboost Ensemble Model for Wheat Growth Monitoring. Front. Plant Sci. 2024, 14, 1267108. [Google Scholar] [CrossRef] [Scilit] [PubMed]
- Li, Y.; Wang, C.; Zhu, J.; Wang, Q.; Liu, P. Classification of Nitrogen-Efficient Wheat Varieties Based on UAV Hyperspectral Remote Sensing. Plants 2025, 14, 1908. [Google Scholar] [CrossRef] [Scilit] [PubMed]
- Li, Z.; Cheng, Q.; Chen, L.; Yang, J.; Zhai, W.; Mao, B.; Li, Y.; Zhou, X.; Chen, Z. Enhancing Winter Wheat Plant Nitrogen Content Prediction across Different Regions: Integration of UAV Spectral Data and Transfer Learning Strategies. Comput. Electron. Agric. 2025, 234, 110322. [Google Scholar] [CrossRef] [Scilit]
- Li, Z.; Zhou, X.; Cheng, Q.; Fei, S.; Chen, Z. A Machine-Learning Model Based on the Fusion of Spectral and Textural Features from UAV Multi-Sensors to Analyse the Total Nitrogen Content in Winter Wheat. Remote Sens. 2023, 15, 2152. [Google Scholar] [CrossRef] [Scilit]
- Liao, Z.; Urano, D.; Li, Z.; Wu, Q.; Liu, C.; Jiang, X.; Fan, J. Enhancing the Estimation of Winter Wheat Leaf Area, Photosynthetic Pigment, and Nitrogen Content Utilizing UAV Image Features and Machine Learning Optimized by Bio-Inspired Algorithms. Smart Agric. Technol. 2026, 13, 101890. [Google Scholar] [CrossRef] [Scilit]
- Liu, J.; Wang, W.; Li, J.; Mustafa, G.; Su, X.; Nian, Y.; Ma, Q.; Zhen, F.; Wang, W.; Li, X. UAV Remote Sensing Technology for Wheat Growth Monitoring in Precision Agriculture: Comparison of Data Quality and Growth Parameter Inversion. Agronomy 2025, 15, 159. [Google Scholar] [CrossRef] [Scilit]
- Lu, N.; Wu, Y.; Zheng, H.; Yao, X.; Zhu, Y.; Cao, W.; Cheng, T. An Assessment of Multi-View Spectral Information from UAV-Based Color-Infrared Images for Improved Estimation of Nitrogen Nutrition Status in Winter Wheat. Precis. Agric. 2022, 23, 1653–1674. [Google Scholar] [CrossRef] [Scilit]
- Lysenko, V.; Opryshko, O.; Komarchuk, D.; Pasichnyk, N.; Zaets, N.; Dudnyk, A. Information Support of the Remote Nitrogen Monitoring System in Agricultural Crops. Int. J. Comput. 2018, 17, 47–54. [Google Scholar] [CrossRef] [Scilit]
- Ma, X.; Chen, P.; Jin, X. Predicting Wheat Leaf Nitrogen Content by Combining Deep Multitask Learning and a Mechanistic Model Using UAV Hyperspectral Images. Remote Sens. 2022, 14, 6334. [Google Scholar] [CrossRef] [Scilit]
- Mao, B.; Sun, X.; Li, H.; Wu, F.; Kuang, X.; Feng, Y.; Fu, W.; Zhai, W.; Li, Y.; Duan, F.; et al. Interpretable Across-Period Ensemble Learning with Multi-Stress Dataset Fusion to Enhance Early-Stage Yield Prediction under Combined Water and Nitrogen Stress Using Hyperspectral Sensing. Agric. Water Manag. 2026, 325, 110204. [Google Scholar] [CrossRef] [Scilit]
- Miller, J.; Adkins, J. Monitoring Winter Wheat Growth at Different Heights Using Aerial Imagery. Agron. J. 2021, 113, 1586–1595. [Google Scholar] [CrossRef] [Scilit]
- Pan, P.; Bouzembrak, Y.; Quemada, M.; Tekinerdogan, B. Prediction of Winter Wheat Nitrogen Nutrition Index Using High-Resolution Satellite and Machine Learning. Smart Agric. Technol. 2025, 12, 101119. [Google Scholar] [CrossRef] [Scilit]
- Pan, Y.; Li, J.; Zhang, J.; He, J.; Zhang, Z.; Yao, X.; Cheng, T.; Zhu, Y.; Cao, W.; Tian, Y. Estimating Leaf Nitrogen Accumulation Considering Vertical Heterogeneity Using Multiangular Unmanned Aerial Vehicle Remote Sensing in Wheat. Plant Phenomics 2024, 6, 276. [Google Scholar] [CrossRef] [Scilit] [PubMed]
- Sadeghi-Tehran, P.; Virlet, N.; Ampe, E.; Reyns, P.; Hawkesford, M. DeepCount: In-Field Automatic Quantification of Wheat Spikes Using Simple Linear Iterative Clustering and Deep Convolutional Neural Networks. Front. Plant Sci. 2019, 10, 1176. [Google Scholar] [CrossRef] [Scilit] [PubMed]
- Sahoo, R.; Rejith, R.; Gakhar, S.; Ranjan, R.; Meena, M.; Dey, A.; Mukherjee, J.; Dhakar, R.; Meena, A.; Daas, A.; et al. Drone Remote Sensing of Wheat N Using Hyperspectral Sensor and Machine Learning. Precis. Agric. 2024, 25, 704–728. [Google Scholar] [CrossRef] [Scilit]
- Shu, M.; Wang, Z.; Guo, W.; Qiao, H.; Fu, Y.; Guo, Y.; Wang, L.; Ma, Y.; Gu, X. Effects of Variety and Growth Stage on UAV Multispectral Estimation of Plant Nitrogen Content of Winter Wheat. Agriculture 2024, 14, 1775. [Google Scholar] [CrossRef] [Scilit]
- Singh, B.; Elangovan, A.; Kumar, S.; Arya, S.; Raju, D.; Harikrishna; Dalal, M.; Sahoo, R.; Chinnusamy, V. Non-Destructive Chlorophyll Prediction by Machine Learning Techniques Using RGB-Based Vegetation Indices in Wheat. Plant Physiol. Rep. 2024, 29, 836–847. [Google Scholar] [CrossRef] [Scilit]
- Su, X.; Nian, Y.; Yue, H.; Zhu, Y.; Li, J.; Wang, W.; Sheng, Y.; Ma, Q.; Liu, J.; Wang, W.; et al. Improving Wheat Leaf Nitrogen Concentration (LNC) Estimation across Multiple Growth Stages Using Feature Combination Indices (FCIs) from UAV Multispectral Imagery. Agronomy 2024, 14, 1052. [Google Scholar] [CrossRef] [Scilit]
- Sun, X.; Zhang, B.; Zhang, Z.; Jing, C.; Gu, L.; Zhen, W.; Gu, X. Coupling Decision of Water and Nitrogen Application in Winter Wheat via UAV Hyperspectral Imaging. Field Crops Res. 2025, 334, 110159. [Google Scholar] [CrossRef] [Scilit]
- Suzer, M.; Kiray, F.; Ramazanoglu, E.; Cullu, M.; Mutlu, N.; Yilmaz, A.; Bol, R.; Senbayram, M. Remote Screening of Nitrogen Uptake and Biomass Formation in Irrigated and Rainfed Wheat. Nitrogen 2025, 6, 82. [Google Scholar] [CrossRef] [Scilit]
- Tanaka, T.; Gislum, R. Prediction of Winter Wheat Nitrogen Status Using UAV Imagery, Weather Data, and Machine Learning. Eur. J. Agron. 2025, 164, 127534. [Google Scholar] [CrossRef] [Scilit]
- Vuille-dit-Bille, N.; Häner, L.; Strebel, S.; Burton, A.; Schaad, N.; Pellet, D.; Wuyts, N.; Treier, S.; Bongiovani, P.; Herrera, J. Evaluation of Winter Wheat Varieties’ Responses to Nitrogen Supply Supported by 10-Band Multispectral Aerial Imaging: Reproducibility over Crop Seasons and Sites. Smart Agric. Technol. 2025, 12, 101528. [Google Scholar] [CrossRef] [Scilit]
- Wang, D.; Cheng, Y.; Shi, L.; Yin, H.; Yang, G.; Liu, S.; Dong, Q.; Ge, J. Prediction of Winter Wheat Yield and Interpretable Accuracy Under Different Water and Nitrogen Treatments Based on CNNResNet-50. Agronomy 2025, 15, 1755. [Google Scholar] [CrossRef] [Scilit]
- Wang, D.; Li, R.; Liu, T.; Sun, C.; Guo, W. Estimation of Agronomic Characters of Wheat Based on Variable Selection and Machine Learning Algorithms. Agronomy 2023, 13, 2808. [Google Scholar] [CrossRef] [Scilit]
- Wang, F.; Zhang, J.; Li, W.; Liu, Y.; Qin, W.; Ma, L.; Zhang, Y.; Sun, Z.; Wang, Z.; Li, F.; et al. Characterization of N Variations in Different Organs of Winter Wheat and Mapping NUE Using Low Altitude UAV-Based Remote Sensing. Precis. Agric. 2025, 26, 40. [Google Scholar] [CrossRef] [Scilit]
- Wang, J.; Meyer, S.; Xu, X.; Weisser, W.; Yu, K. Drone Multispectral Imaging Captures the Effects of Soil Mineral Nitrogen on Canopy Structure and Nitrogen Use Efficiency in Wheat. Comput. Electron. Agric. 2025, 235, 110342. [Google Scholar] [CrossRef] [Scilit]
- Yang, B.; Zhou, L.; Yang, G.; Zhang, G.; Qi, J.; Li, C. Integrating Hyperspectral Radiation Transfer Modeling and Deep Transfer Learning to Estimate Nitrogen Density in Winter Wheat Canopies. Artif. Intell. Agric. 2026, 16, 753–763. [Google Scholar] [CrossRef] [Scilit]
- Yang, S.; Hu, L.; Wu, H.; Ren, H.; Qiao, H.; Li, P.; Fan, W. Integration of Crop Growth Model and Random Forest for Winter Wheat Yield Estimation from UAV Hyperspectral Imagery. IEEE J. Sel. Top. Appl. Earth Obs. Remote Sens. 2021, 14, 6253–6269. [Google Scholar] [CrossRef] [Scilit]
- Yang, X.; Yang, R.; Ye, Y.; Yuan, Z.; Wang, D.; Hua, K. Winter Wheat SPAD Estimation from UAV Hyperspectral Data Using Cluster-Regression Methods. Int. J. Appl. Earth Obs. Geoinf. 2021, 105, 102618. [Google Scholar] [CrossRef] [Scilit]
- Yi, J.; Lopez, G.; Hadir, S.; Weyler, J.; Klingbeil, L.; Deichmann, M.; Gall, J.; Seidel, S. Non-Invasive Diagnosis of Nutrient Deficiencies in Winter Wheat and Winter Rye Using UAV-Based RGB Images. Comput. Electron. Agric. 2025, 239, 110865. [Google Scholar] [CrossRef] [Scilit]
- Yin, Q.; Zhang, Y.; Li, W.; Wang, J.; Wang, W.; Ahmad, I.; Zhou, G.; Huo, Z. Better Inversion of Wheat Canopy SPAD Values before Heading Stage Using Spectral and Texture Indices Based on UAV Multispectral Imagery. Remote Sens. 2023, 15, 4935. [Google Scholar] [CrossRef] [Scilit]
- Yu, J.; Wang, J.; Leblon, B.; Song, Y. Nitrogen Estimation for Wheat Using UAV-Based and Satellite Multispectral Imagery, Topographic Metrics, Leaf Area Index, Plant Height, Soil Moisture, and Machine Learning Methods. Nitrogen 2022, 3, 1–25. [Google Scholar] [CrossRef] [Scilit]
- Zelazny, W.; Kusnierek, K.; Geipel, J. Gaussian Process Modeling of In-Season Physiological Parameters of Spring Wheat Based on Airborne Imagery from Two Hyperspectral Cameras and Apparent Soil Electrical Conductivity. Remote Sens. 2022, 14, 5977. [Google Scholar] [CrossRef] [Scilit]
- Zhang, C.; Lu, X.; Zhang, H.; Cui, H.; Ma, H.; Ji, J.; Ding, T. Multispectral UAV Imaging and Machine Learning for Estimating Wheat Nitrogen Nutrition Index. Front. Plant Sci. 2025, 16, 1709459. [Google Scholar] [CrossRef] [Scilit] [PubMed]
- Zhang, C.; Yi, Y.; Wang, L.; Zhang, X.; Chen, S.; Su, Z.; Zhang, S.; Xue, Y. Estimation of the Bio-Parameters of Winter Wheat by Combining Feature Selection with Machine Learning Using Multi-Temporal Unmanned Aerial Vehicle Multispectral Images. Remote Sens. 2024, 16, 469. [Google Scholar] [CrossRef] [Scilit]
- Zhang, C.; Yi, Y.; Wang, L.; Chen, S.; Li, P.; Zhang, S.; Xue, Y. Efficient Physics-Informed Transfer Learning to Quantify Biochemical Traits of Winter Wheat from UAV Multispectral Imagery. Smart Agric. Technol. 2024, 9, 100581. [Google Scholar] [CrossRef] [Scilit]
- Zhang, J.; Cheng, G.; Huang, S.; Yang, J.; Yang, Y.; Xing, S.; Wang, J.; Yang, H.; Nie, H.; Yang, W.; et al. Winter Wheat Nitrogen Content Prediction and Transferability of Models Based on UAV Image Features. Agriculture 2025, 15, 1373. [Google Scholar] [CrossRef] [Scilit]
- Zhang, J.; Cheng, T.; Guo, W.; Xu, X.; Qiao, H.; Xie, Y.; Ma, X. Leaf Area Index Estimation Model for UAV Image Hyperspectral Data Based on Wavelength Variable Selection and Machine Learning Methods. Plant Methods 2021, 17, 49. [Google Scholar] [CrossRef] [Scilit] [PubMed]
- Zhang, J.; Qiu, X.; Wu, Y.; Zhu, Y.; Cao, Q.; Liu, X.; Cao, W. Combining Texture, Color, and Vegetation Indices from Fixed-Wing UAS Imagery to Estimate Wheat Growth Parameters Using Multivariate Regression Methods. Comput. Electron. Agric. 2021, 185, 106138. [Google Scholar] [CrossRef] [Scilit]
- Zhang, L.; Song, X.; Niu, Y.; Zhang, H.; Wang, A.; Zhu, Y.; Zhu, X.; Chen, L.; Zhu, Q. Estimating Winter Wheat Plant Nitrogen Content by Combining Spectral and Texture Features Based on a Low-Cost UAV RGB System throughout the Growing Season. Agriculture 2024, 14, 456. [Google Scholar] [CrossRef] [Scilit]
- Zhang, L.; Wang, A.; Zhang, H.; Zhu, Q.; Zhang, H.; Sun, W.; Niu, Y. Estimating Leaf Chlorophyll Content of Winter Wheat from UAV Multispectral Images Using Machine Learning Algorithms under Different Species, Growth Stages, and Nitrogen Stress Conditions. Agriculture 2024, 14, 1064. [Google Scholar] [CrossRef] [Scilit]
- Zhang, S.; Duan, J.; Qi, X.; Gao, Y.; He, L.; Liu, L.; Guo, T.; Feng, W. Combining Spectrum, Thermal, and Texture Features Using Machine Learning Algorithms for Wheat Nitrogen Nutrient Index Estimation and Model Transferability Analysis. Comput. Electron. Agric. 2024, 222, 109022. [Google Scholar] [CrossRef] [Scilit]
- Zhang, X.; Han, L.; Sobeih, T.; Lappin, L.; Lee, M.; Howard, A.; Kisdi, A. The Self-Supervised Spectral-Spatial Vision Transformer Network for Accurate Prediction of Wheat Nitrogen Status from UAV Imagery. Remote Sens. 2022, 14, 1400. [Google Scholar] [CrossRef] [Scilit]
- Zhang, Z.; Wang, S.; Ma, J.; Wang, C.; Zhang, Z.; Li, X.; Zheng, W.; Hu, C. From Retrieval to Fate: UAV-Based Hyperspectral Remote Sensing of Soil Nitrogen and Its Leaching Risks in a Wheat-Maize Rotation System. Remote Sens. 2025, 17, 3956. [Google Scholar] [CrossRef] [Scilit]
- Zhao, J.; Li, H.; Liu, J.; Zhao, M.; Yan, Z. Integration of Spatial Attention Mechanism into 1D-CNN for Prediction of Wheat Leaf Nitrogen Concentration from UAV-Borne Hyperspectral Imagery. Comput. Electron. Agric. 2025, 239, 110906. [Google Scholar] [CrossRef] [Scilit]
- Zhao, J.; Geipel, J. Super-Resolve Satellite Imagery to Perform on Par with UAV-Borne Hyperspectral Imagery in Predicting Spring Wheat Physiological Parameters Using Transformer Models. Comput. Electron. Agric. 2026, 240, 111204. [Google Scholar] [CrossRef] [Scilit]
- Liao, Z.-Q.; Dai, Y.-L.; Wang, H.; Ketterings, Q.M.; Lu, J.-S.; Zhang, F.-C.; Li, Z.-J.; Fan, J.-L. A Double-Layer Model for Improving the Estimation of Wheat Canopy Nitrogen Content from Unmanned Aerial Vehicle Multispectral Imagery. J. Integr. Agric. 2023, 22, 2248–2270. [Google Scholar] [CrossRef] [Scilit]
- Zheng, H.; Li, W.; Jiang, J.; Liu, Y.; Cheng, T.; Tian, Y.; Zhu, Y.; Cao, W.; Zhang, Y.; Yao, X. A Comparative Assessment of Different Modeling Algorithms for Estimating Leaf Nitrogen Content in Winter Wheat Using Multispectral Images from an Unmanned Aerial Vehicle. Remote Sens. 2018, 10, 2026. [Google Scholar] [CrossRef] [Scilit]
- Zhu, W.; Sun, Z.; Yang, T.; Li, J.; Peng, J.; Zhu, K.; Li, S.; Gong, H.; Lyu, Y.; Li, B.; et al. Estimating Leaf Chlorophyll Content of Crops via Optimal Unmanned Aerial Vehicle Hyperspectral Data at Multi-Scales. Comput. Electron. Agric. 2020, 178, 105786. [Google Scholar] [CrossRef] [Scilit]
- Colovic, M.; Stellacci, A.M.; Mzid, N.; Di Venosa, M.; Todorovic, M.; Cantore, V.; Albrizio, R. Comparative Performance of Aerial RGB vs. Ground Hyperspectral Indices for Evaluating Water and Nitrogen Status in Sweet Maize. Agronomy 2024, 14, 562. [Google Scholar] [CrossRef] [Scilit]
- Prey, L.; von Bloh, M.; Schmidhalter, U. Evaluating RGB Imaging and Multispectral Active and Hyperspectral Passive Sensing for Assessing Early Plant Vigor in Winter Wheat. Sensors 2018, 18, 2931. [Google Scholar] [CrossRef] [Scilit] [PubMed]
- Yu, K.; Belwalkar, A.; Wang, W.; Hu, Y.; Hunegnaw, A.; Nurunnabi, A.; Ruf, T.; Li, F.; Jia, L.; Kooistra, L.; et al. UAV Hyperspectral Remote Sensing for Crop Nitrogen Monitoring: Progress, Challenges, and Perspectives. Smart Agric. Technol. 2025, 12, 101507. [Google Scholar] [CrossRef] [Scilit]
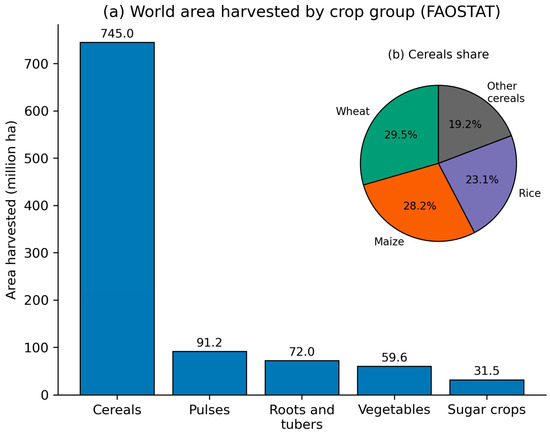
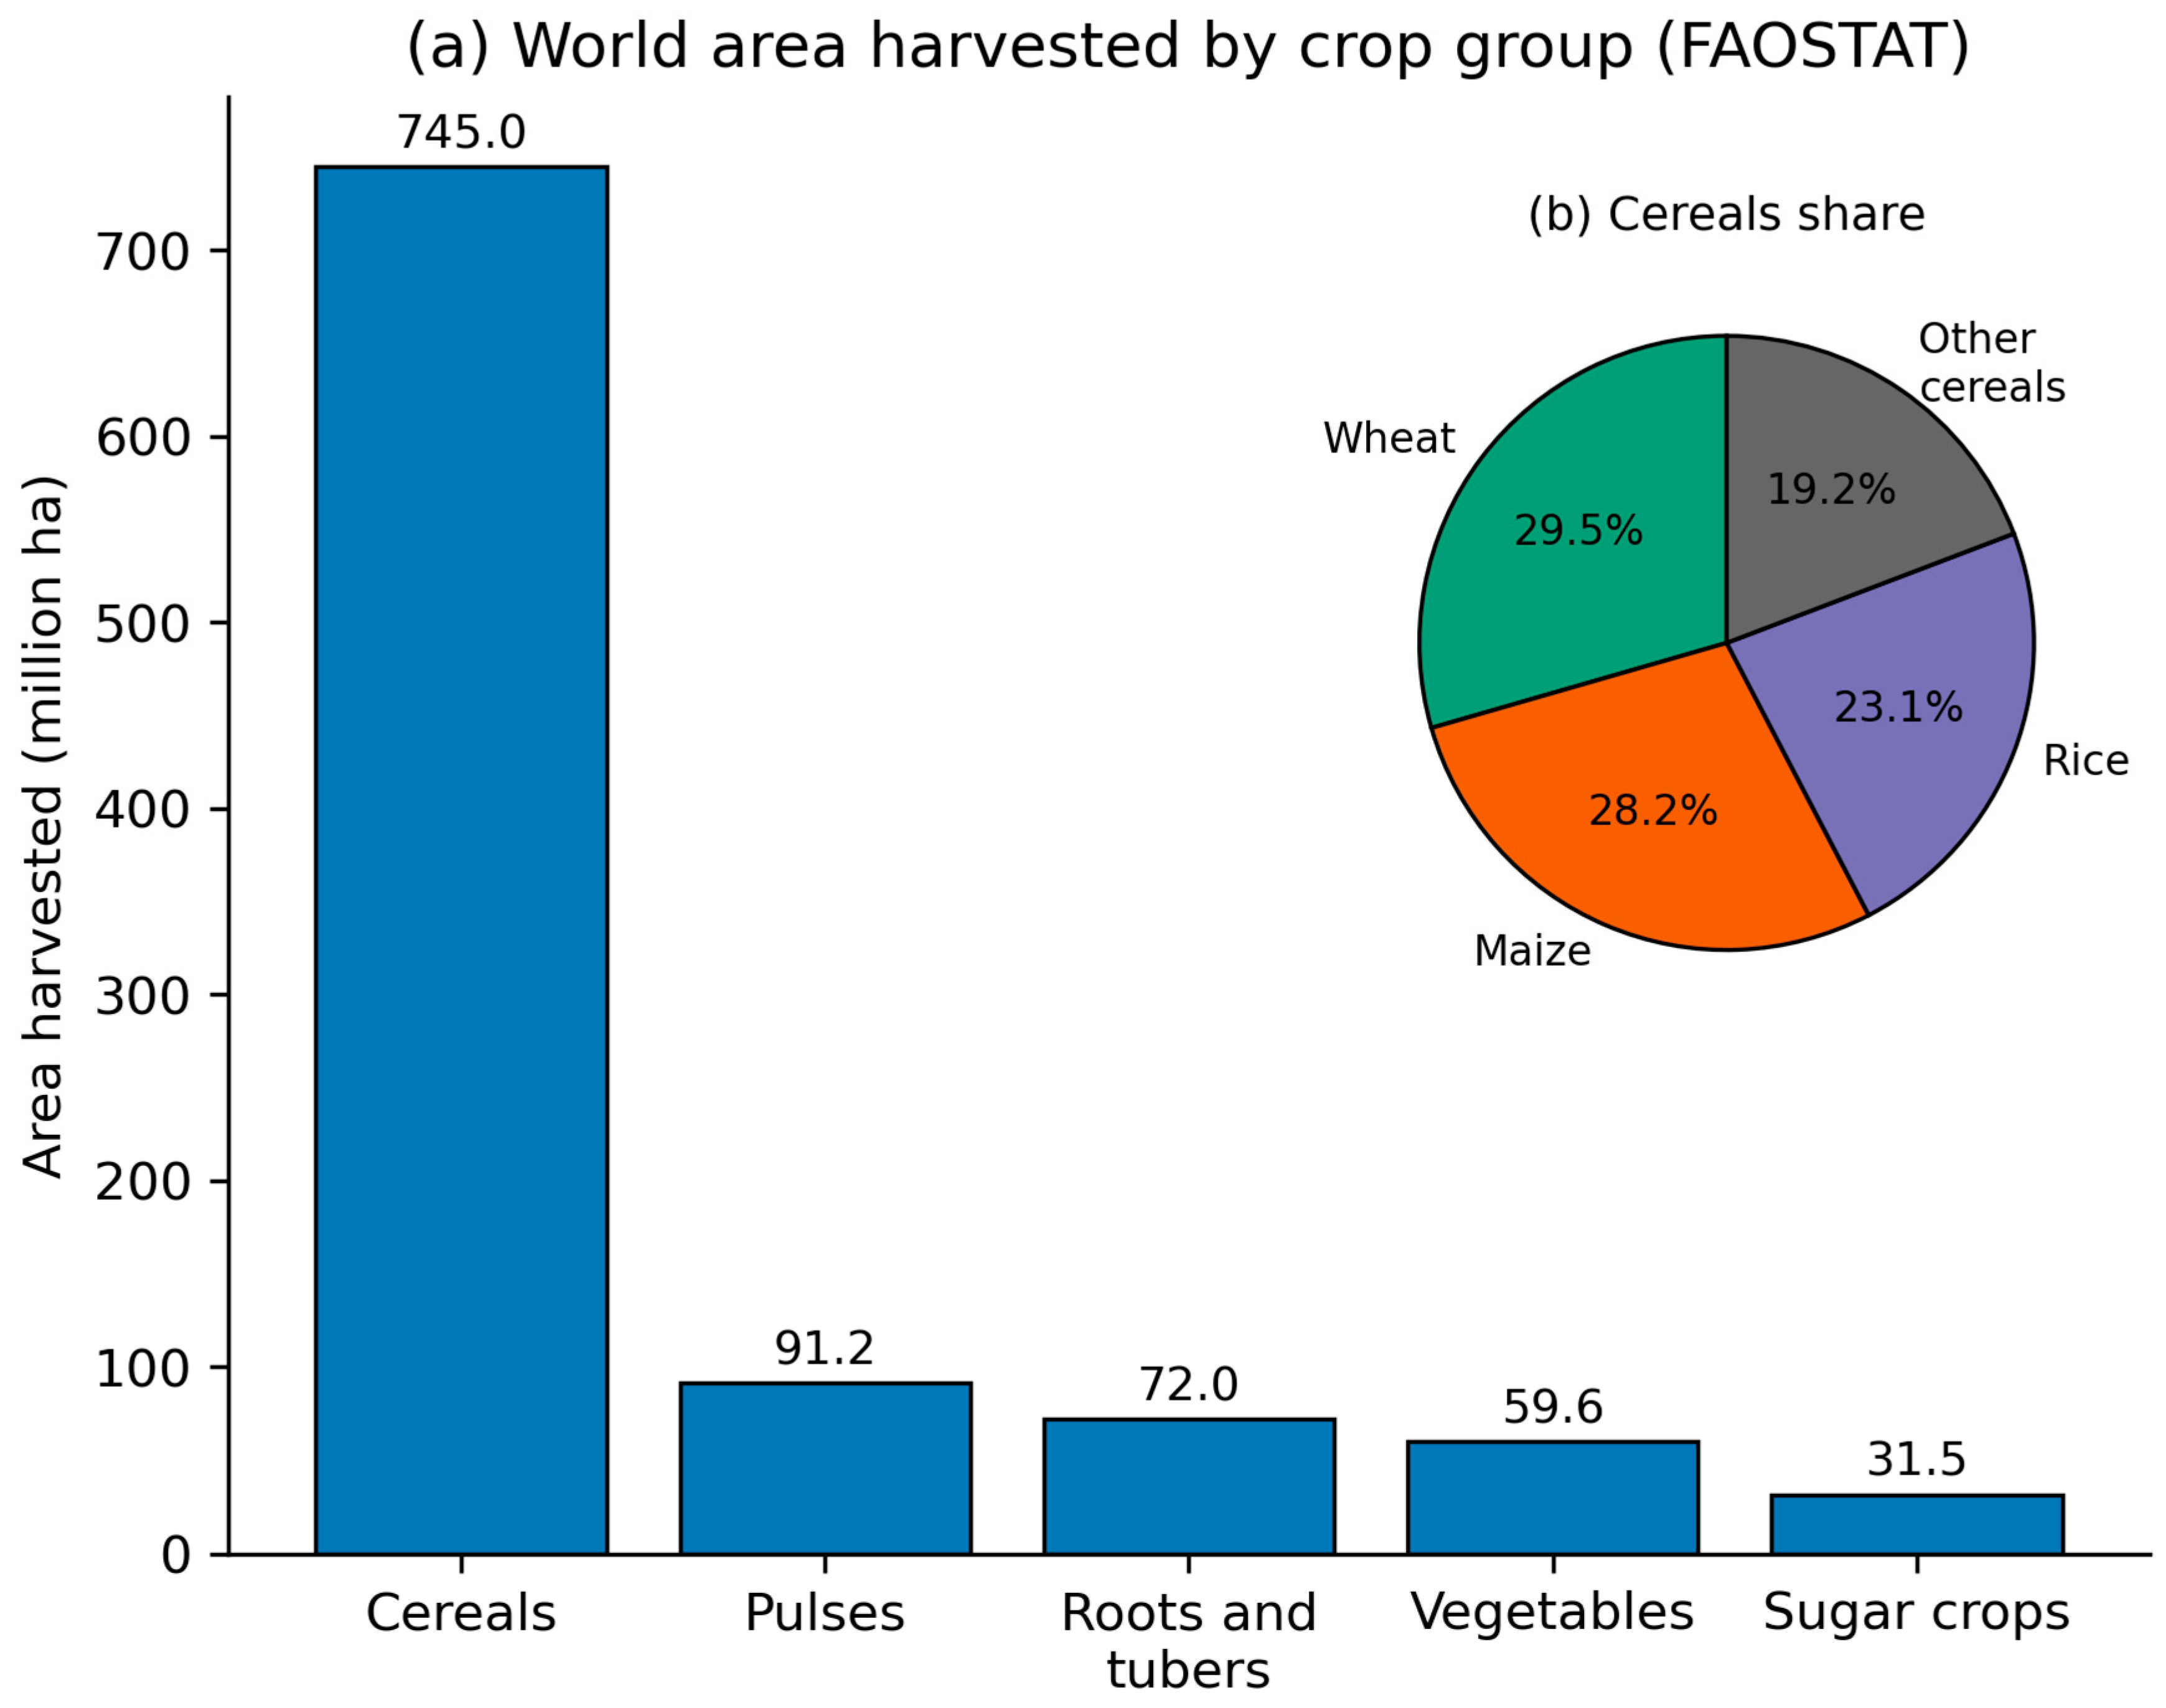
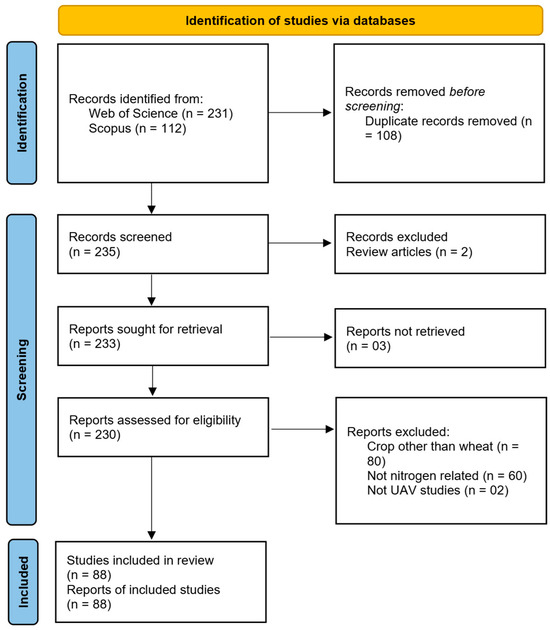
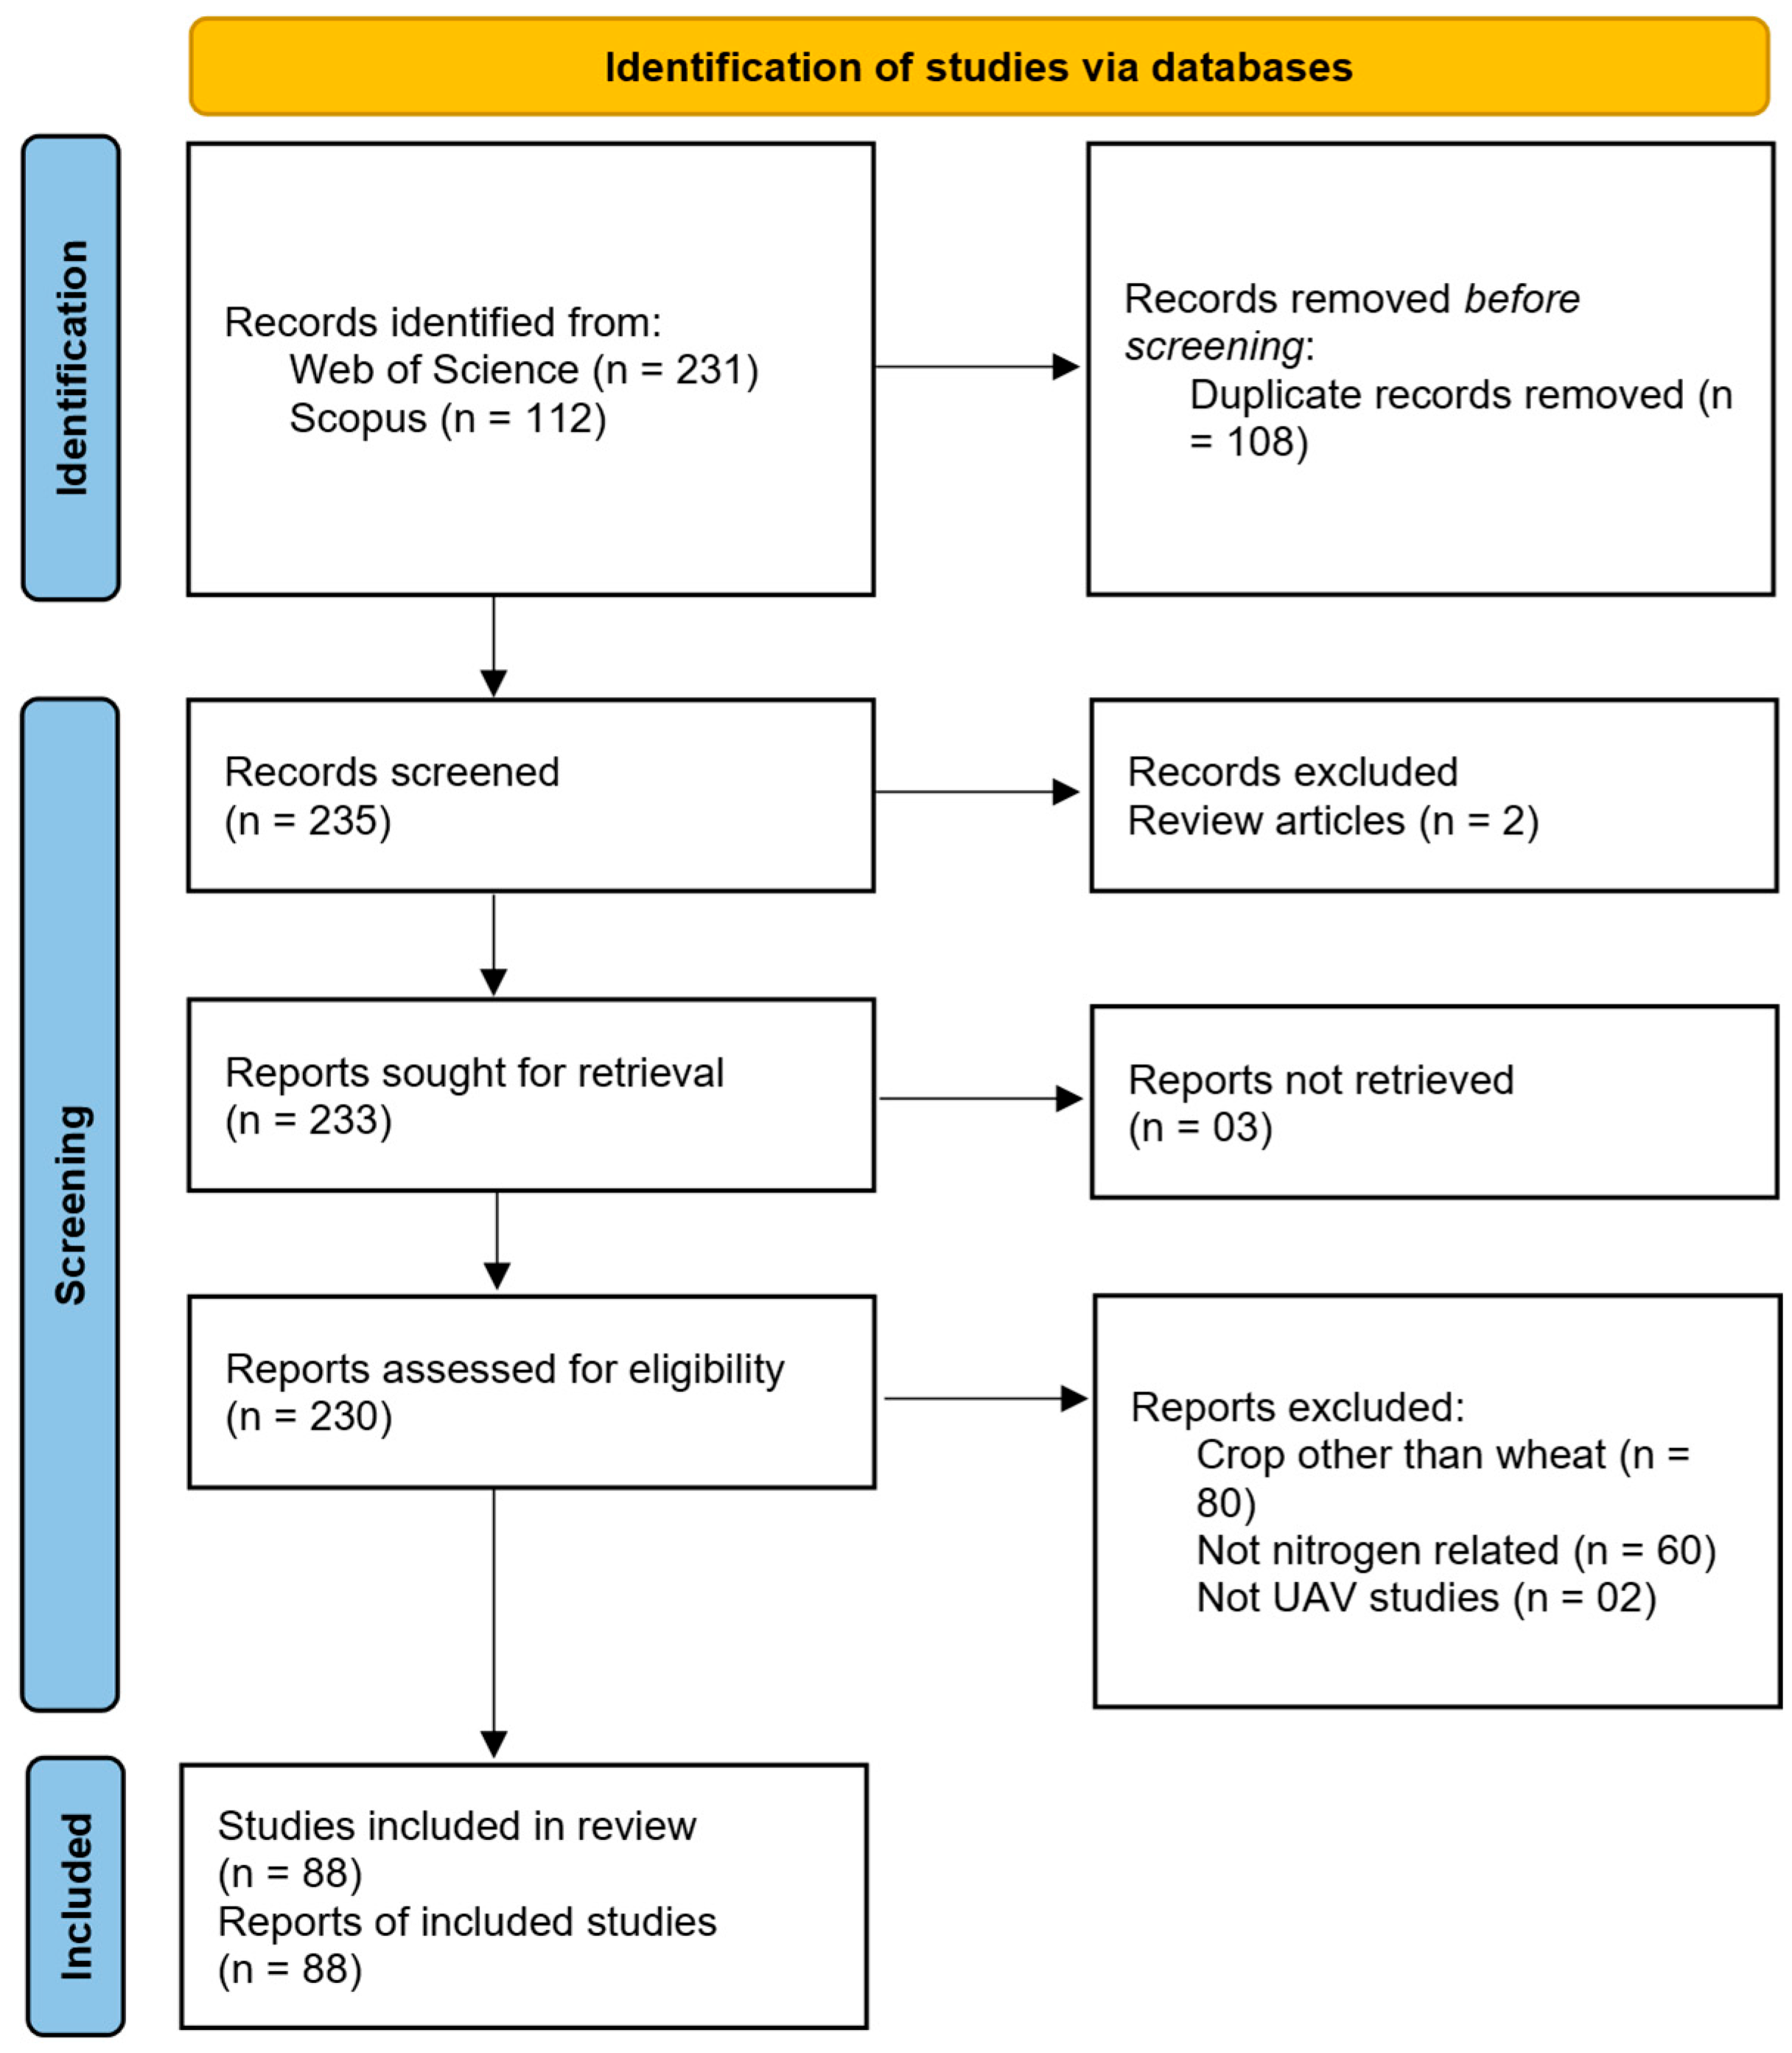
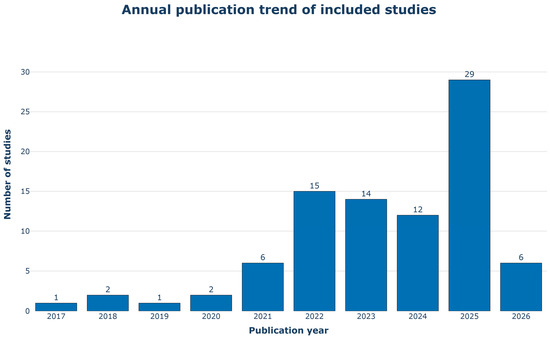
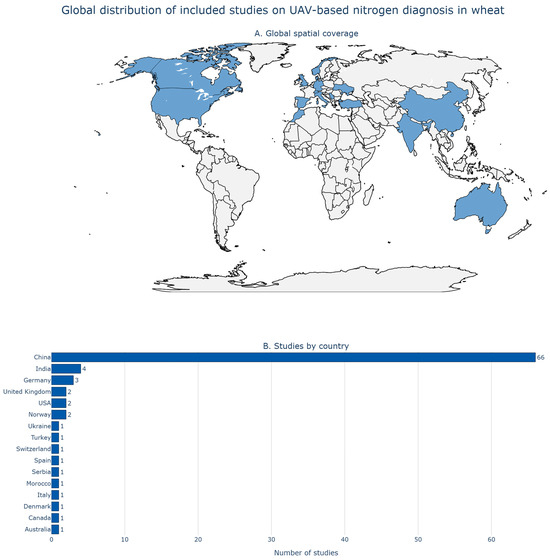
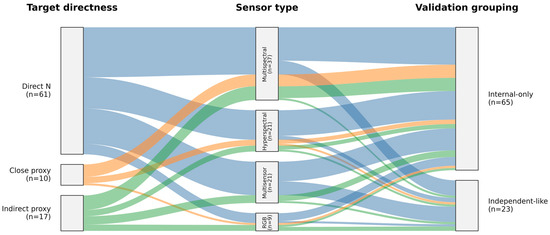
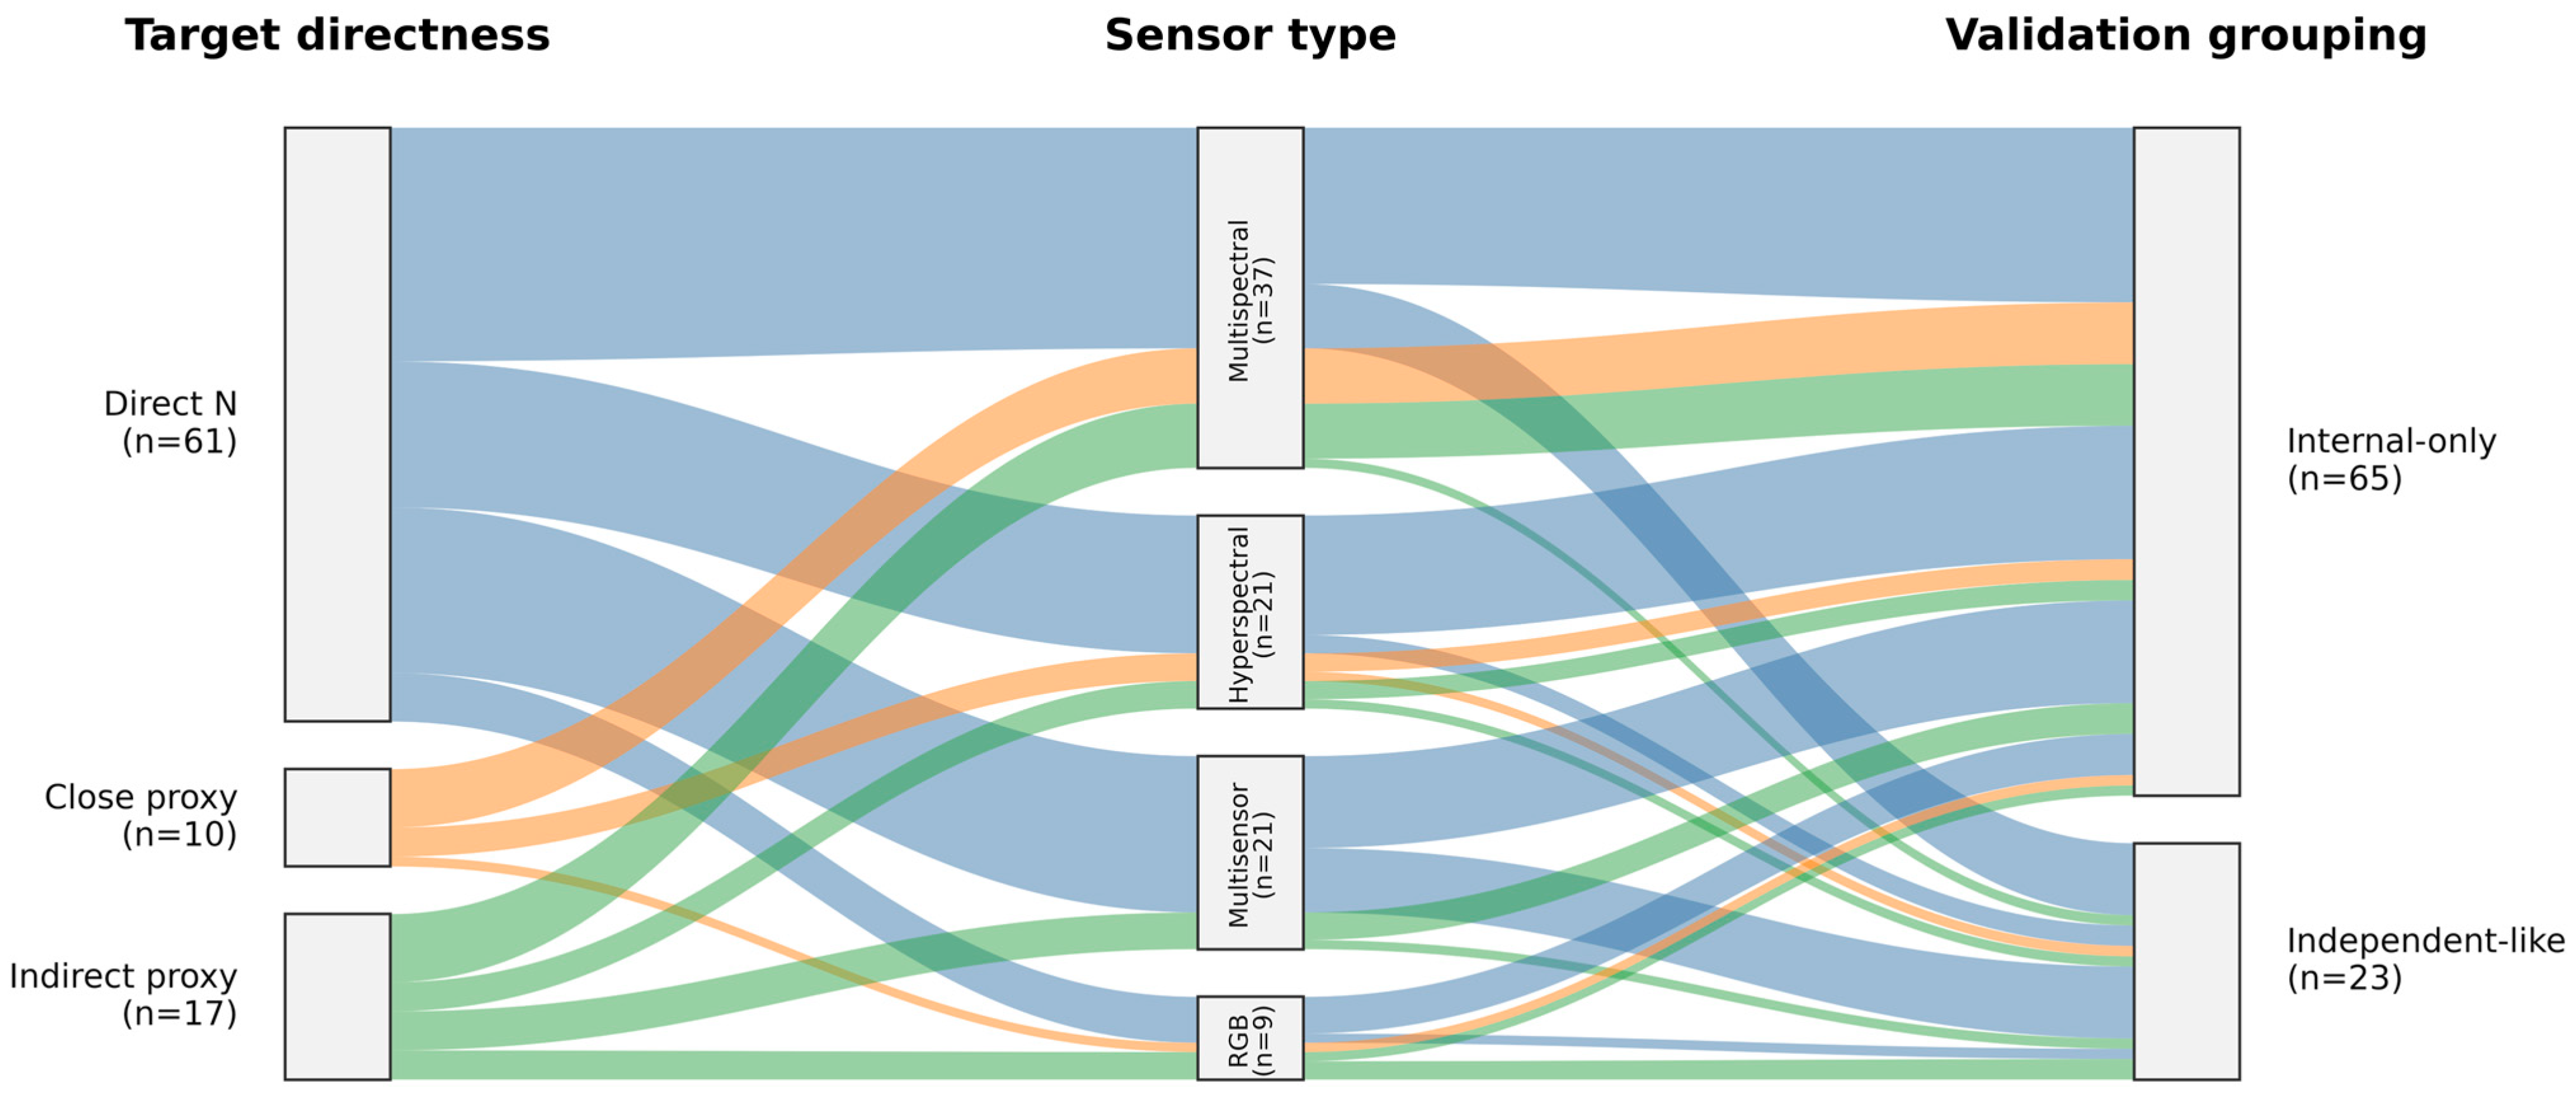
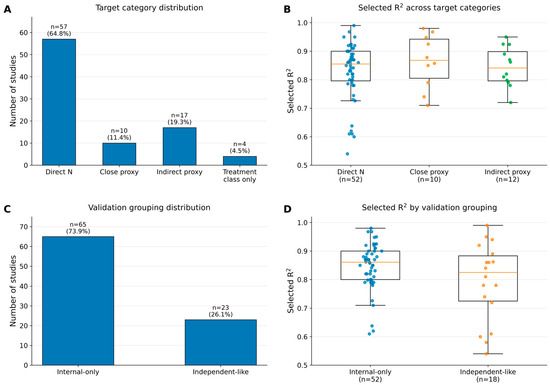
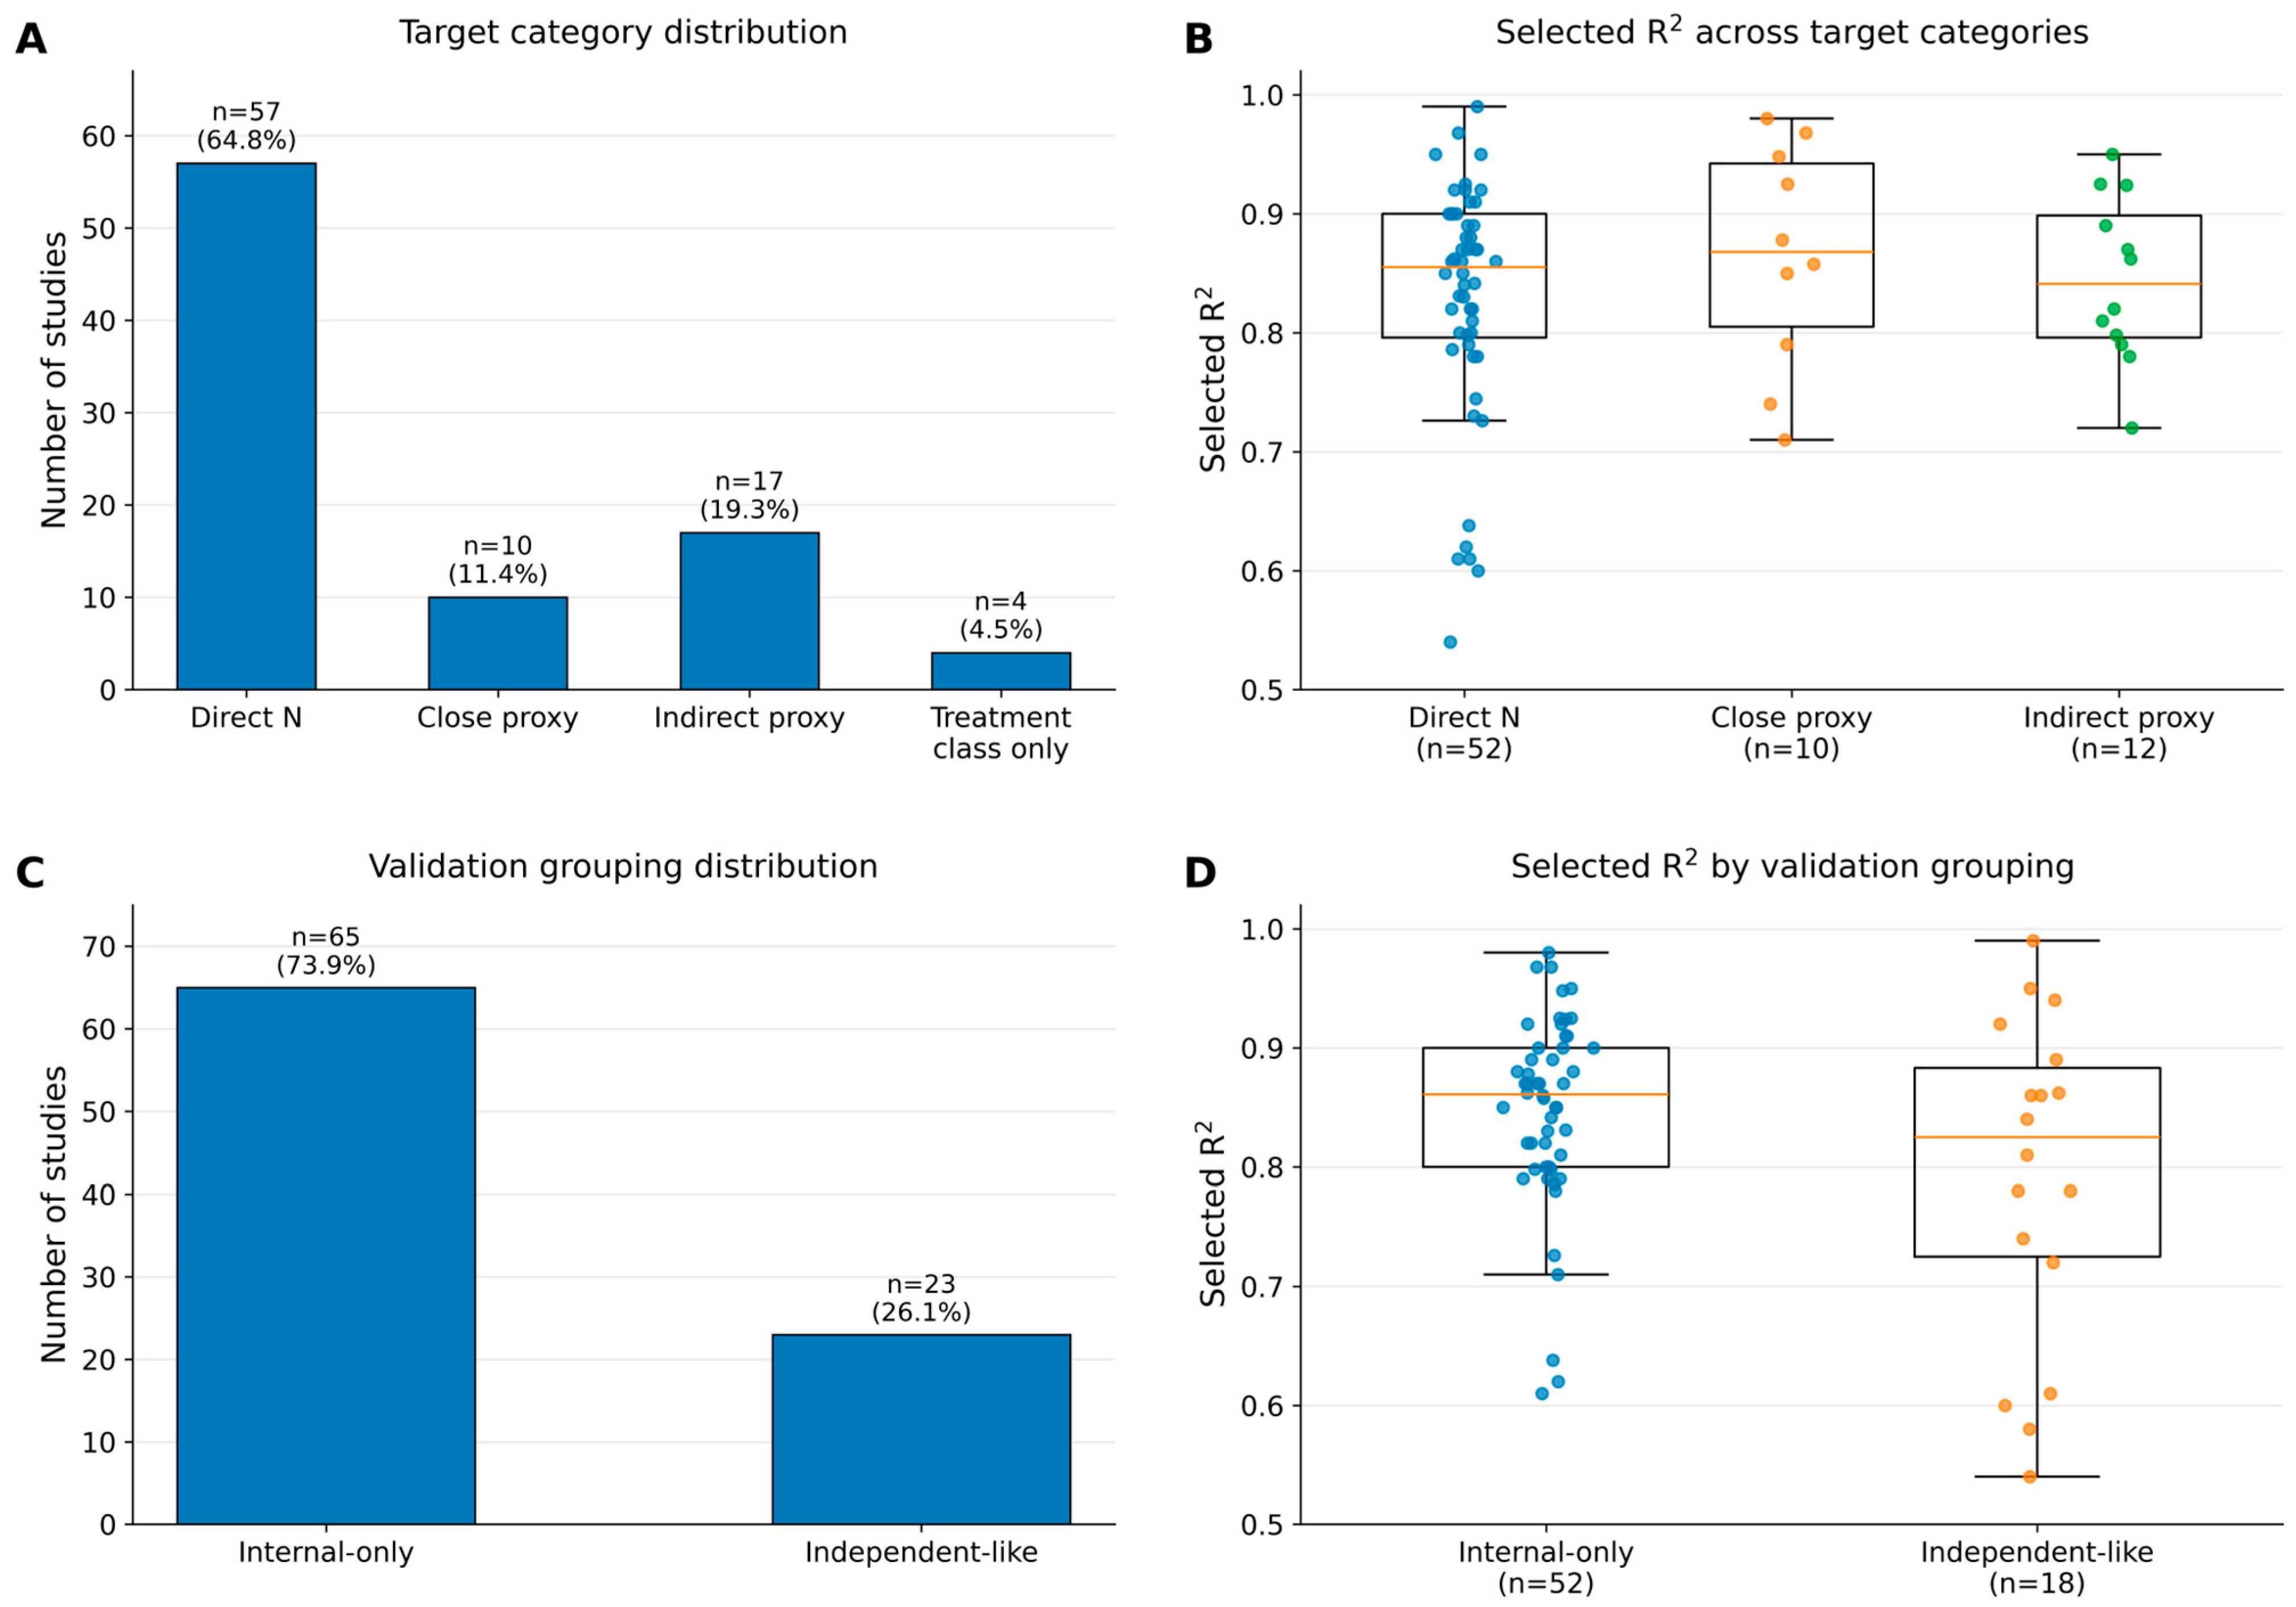
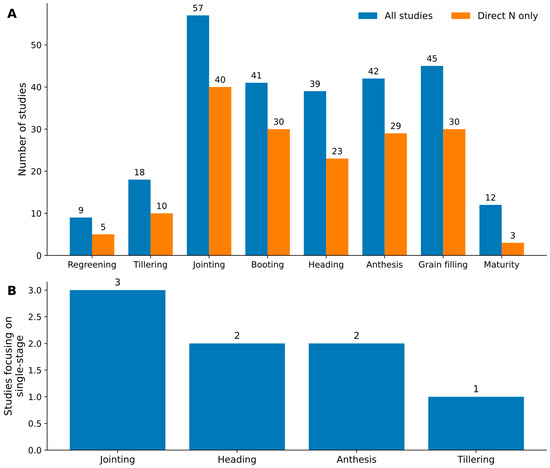
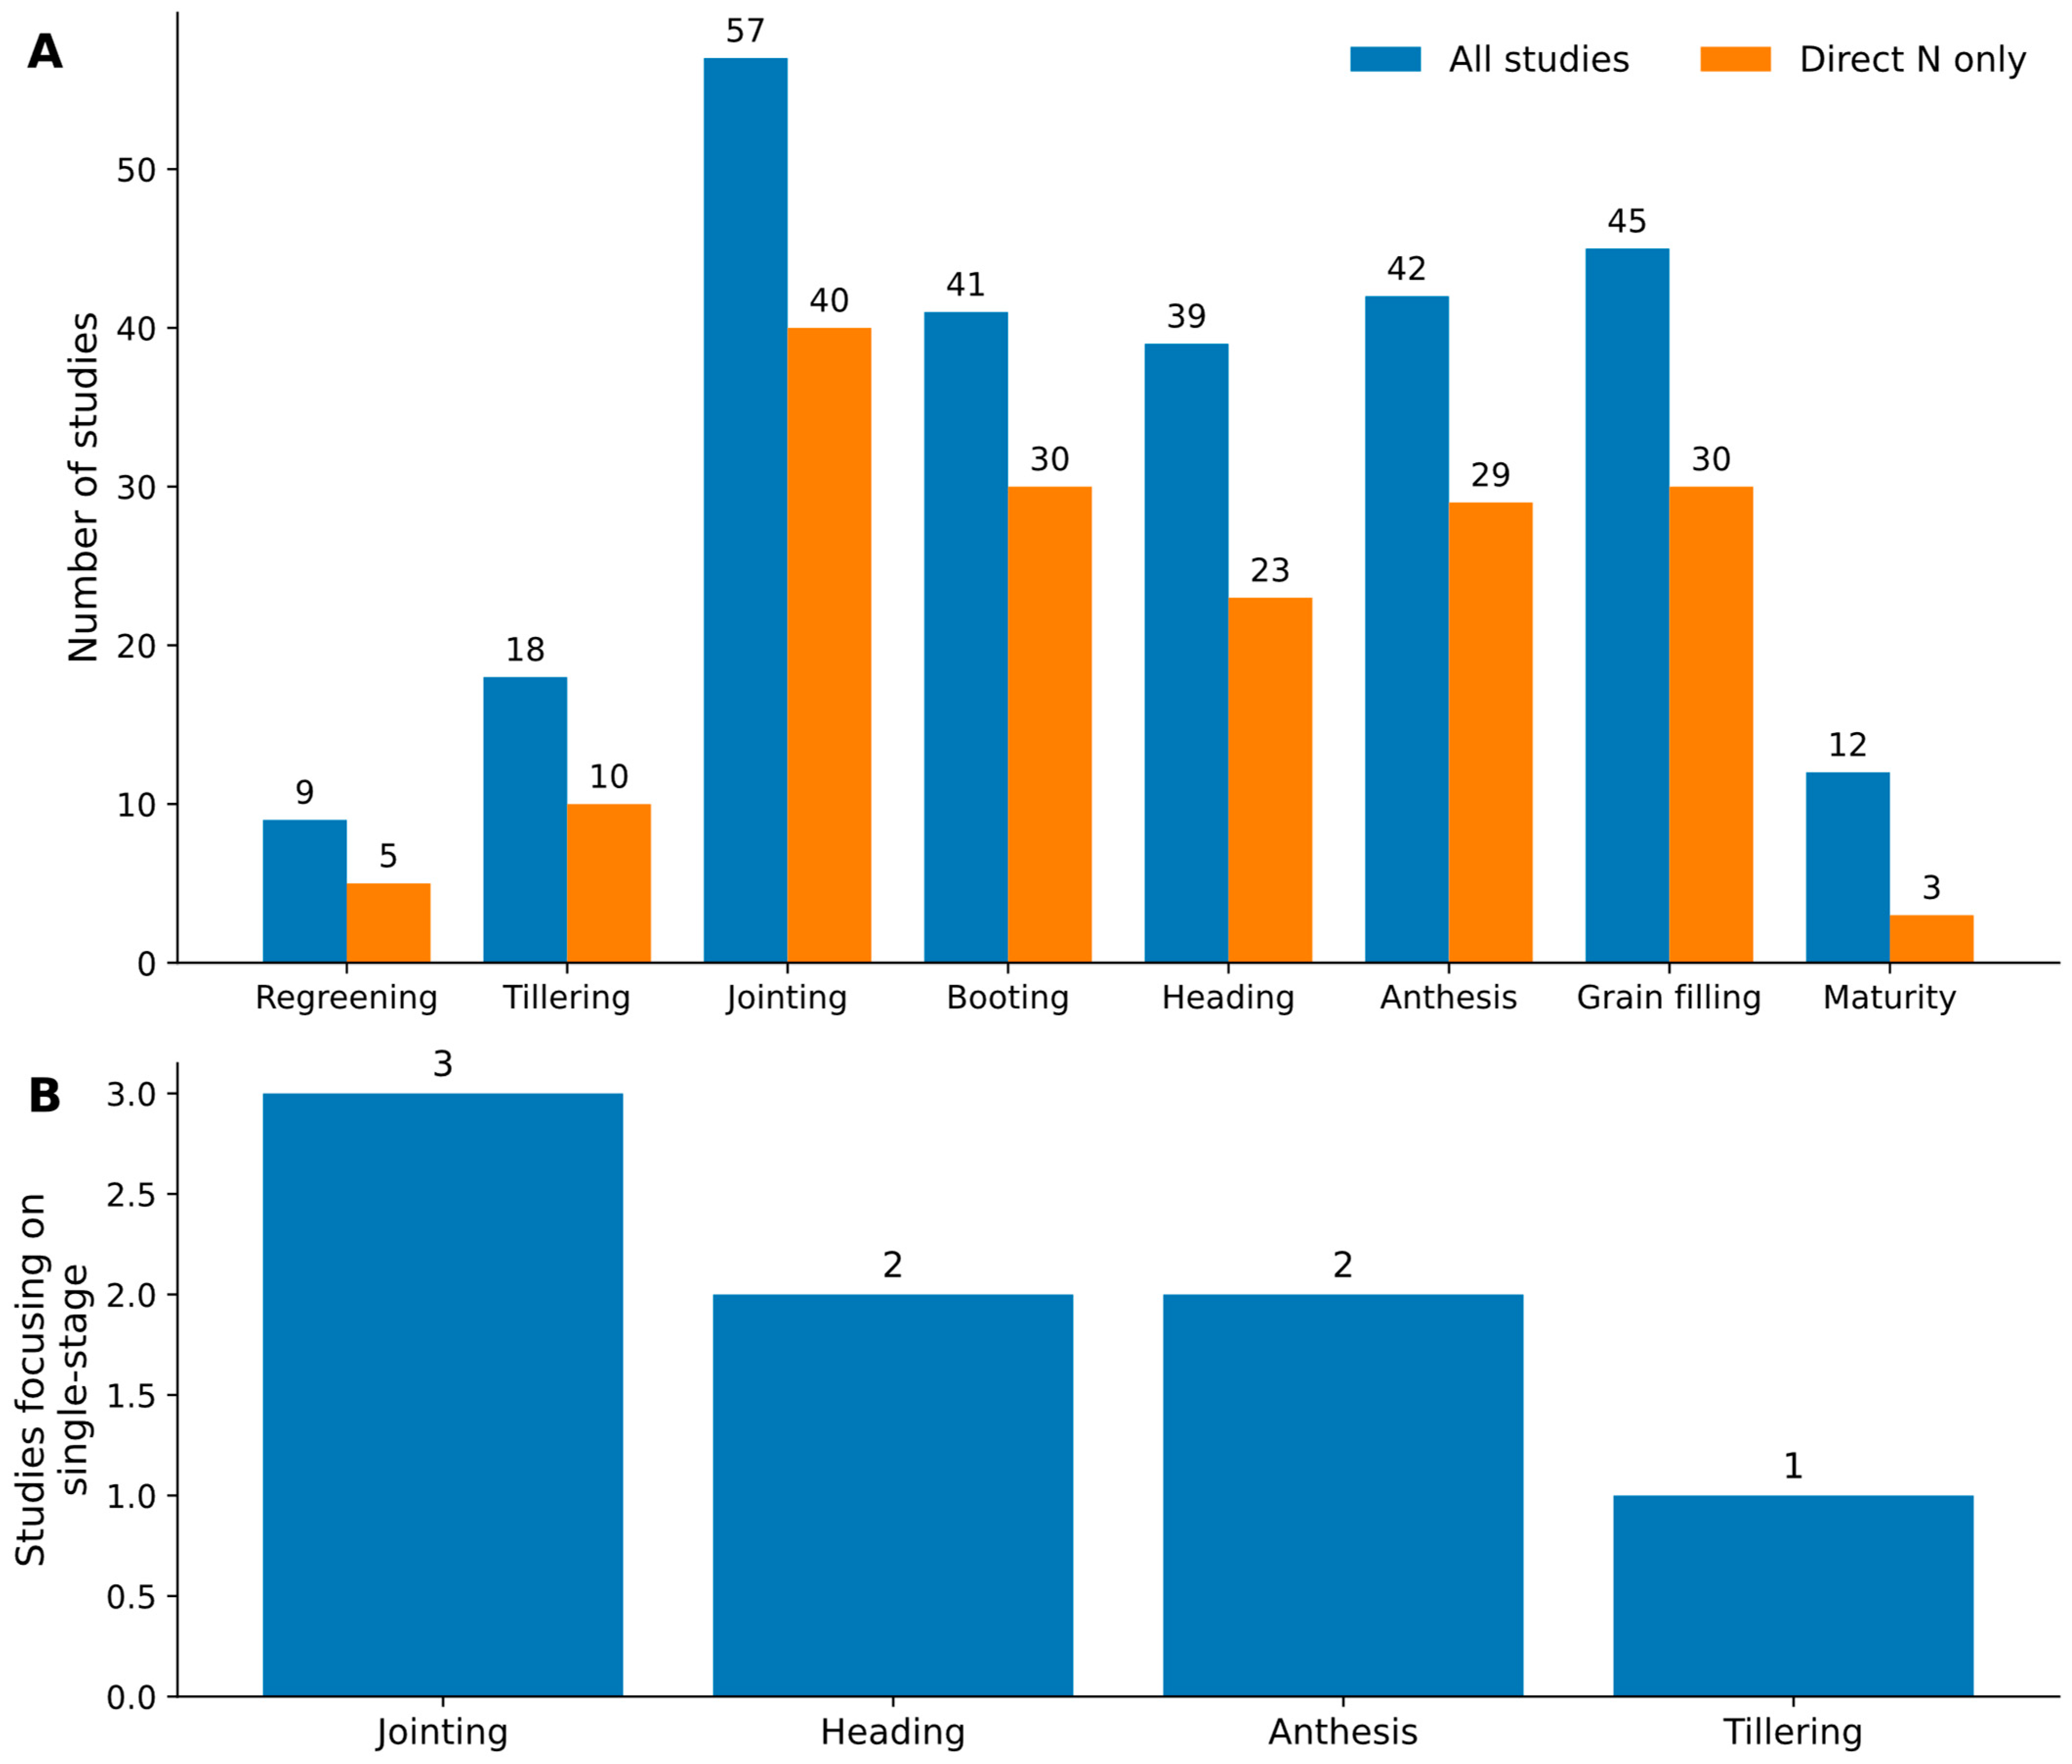
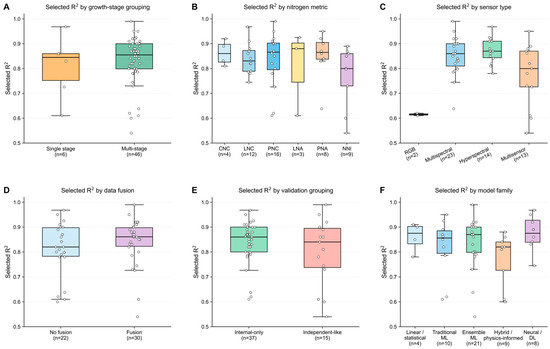
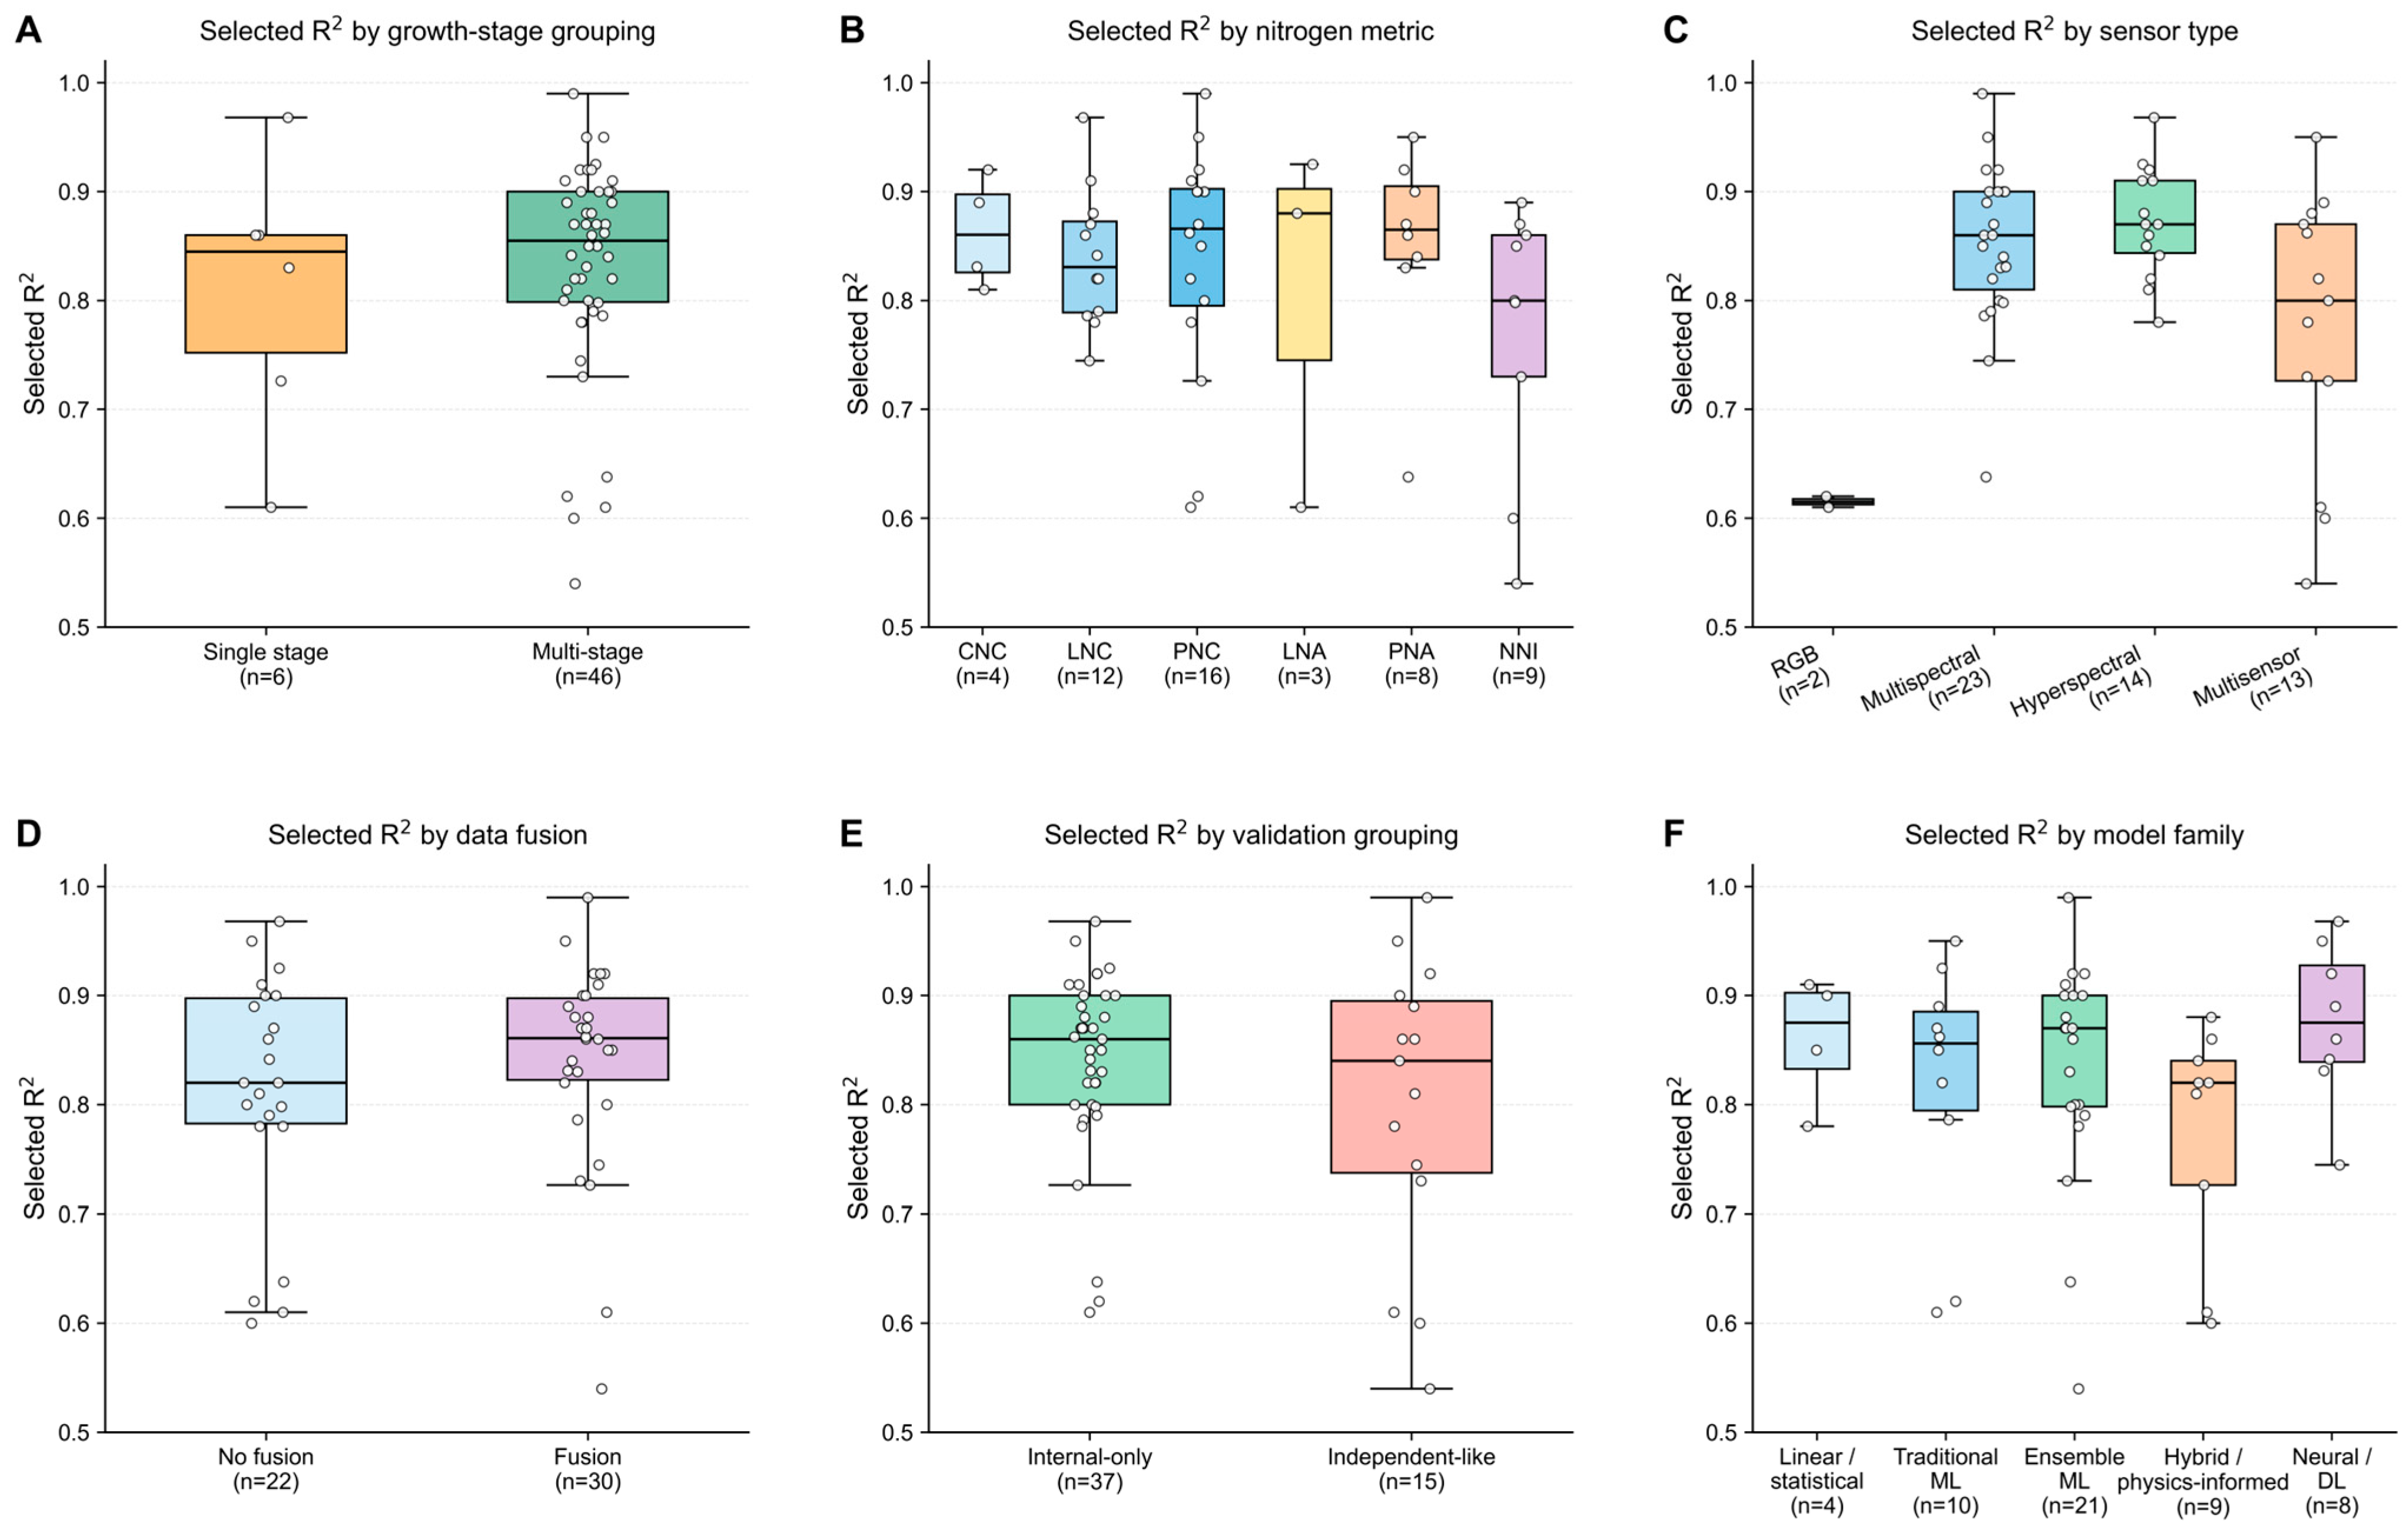

Disclaimer/Publisher’s Note: The statements, opinions and data contained in all publications are solely those of the individual author(s) and contributor(s) and not of MDPI and/or the editor(s). MDPI and/or the editor(s) disclaim responsibility for any injury to people or property resulting from any ideas, methods, instructions or products referred to in the content. |
© 2026 by the authors. Licensee MDPI, Basel, Switzerland. This article is an open access article distributed under the terms and conditions of the Creative Commons Attribution (CC BY) license.