


Abstract
Atmospheric nitrogen dioxide (NO2) is an important component of reactive nitrogen and plays a key role in the atmospheric nitrogen cycle outside major emission regions. However, its variability under remote background conditions remains poorly characterized, as most observational studies focus on urban or continental environments. This study investigates the background variability of in situ NO2 measurements at a remote North Atlantic island (Azores) over the period 2015–2024 and examines its association with large-scale atmospheric transport regimes. Monthly NO2 concentrations were classified into background Atlantic conditions and months classified under enhanced transport conditions using an objective PM10 percentile-based criterion. Differences between regimes were assessed using non-parametric statistics. Although median NO2 concentrations were slightly higher during months classified under enhanced transport conditions, the difference was not statistically significant. Wind speed analysis for the overlapping period 2018–2024 also indicated higher values during these months, but these differences were likewise not statistically significant. These results indicate that, at a monthly resolution, the influence of enhanced transport conditions on NO2 at this remote marine site is weak and not statistically resolved by the present approach. The findings therefore provide limited statistical support for a transport-driven modulation of NO2 and instead highlight the difficulty of detecting subtle reactive-nitrogen signals in clean marine environments. These findings contribute to improving the interpretation of reactive nitrogen variability in remote marine settings and highlight the value of island observatories for studying the atmospheric nitrogen cycle.
1. Introduction
Reactive nitrogen (Nr) plays a central role in atmospheric chemistry and in the broader biogeochemical nitrogen cycle. Since the industrial revolution, anthropogenic activities have substantially altered the global nitrogen cycle through fossil fuel combustion, agriculture, and industrial processes, increasing the abundance and reactivity of nitrogen compounds in the atmosphere [1,2]. Among these species, nitrogen dioxide (NO2) is of particular importance as a key component of nitrogen oxides (NOx = NO + NO2), influencing ozone formation, oxidative capacity, secondary aerosol production, and nitrogen deposition [3,4,5].
While numerous studies have characterized NO2 in urban and industrialized regions, comparatively less attention has been given to its variability under remote, background conditions. Most long-term analyses of NO2 focus on source-dominated environments where local emissions strongly control observed concentrations [6,7]. In contrast, remote marine and insular environments offer a unique opportunity to investigate the behavior of reactive nitrogen decoupled from strong local sources and dominated instead by large-scale atmospheric transport and background chemistry [8,9,10].
Transport processes are expected to influence the distribution of reactive nitrogen in the troposphere. Advection of air masses originating from continental regions, vertical mixing, and synoptic-scale circulation patterns may influence NO2 concentrations even in regions far removed from primary emission sources [11,12,13]. In marine boundary layer environments, background NO2 levels typically remain low but can exhibit episodic enhancements associated with long-range transport from continental regions [14,15]. These transport-driven variations provide insight into hemispheric-scale redistribution of reactive nitrogen and its role in regional nitrogen budgets.
The North Atlantic region represents a particularly valuable natural laboratory for studying background atmospheric composition. Air masses arriving in this region are influenced by a combination of mid-latitude westerlies, subtropical circulation, and occasional incursions of continental or dust-laden air [16,17]. Remote island stations in the North Atlantic have historically contributed to advancing understanding of background atmospheric composition, including greenhouse gases and trace species [18,19]. Previous studies in remote marine and island environments have applied air-mass trajectory analysis and chemical transport approaches to investigate the variability of NO2 and NOx and to attribute observed concentrations to large-scale transport processes [11,15,19]. However, sustained observational analyses focusing specifically on background NO2 variability in such environments remain limited, particularly in studies that assess the detectability of transport-related signals using long-term in situ observations without explicit trajectory reconstruction.
Existing work has highlighted the importance of long-term observations in detecting variability and transport signatures in reactive nitrogen species [2,20]. Non-parametric statistical approaches and percentile-based classification methods are increasingly used to distinguish between background and transport-influenced regimes in atmospheric time series without imposing strong distributional assumptions [21]. Such approaches are particularly appropriate for low-concentration environments where variability is modest and episodic.
In this study, we investigate the background variability of in situ NO2 concentrations measured at a remote North Atlantic island (Azores) over the period 2015–2024. Using an objective percentile-based criterion applied to PM10 as a transport indicator, monthly conditions are classified into background Atlantic and enhanced transport conditions. Differences between regimes are evaluated using non-parametric statistics, and wind speed data are used to support the physical interpretation of transport intensity over the overlapping period 2018–2024. Rather than assuming a priori a strong transport signal, this study evaluates whether differences in NO2 concentrations between transport regimes can be statistically detected on a monthly scale in a low-variability marine environment. In such environments, transport-related signals are expected to be weak and not statistically distinguishable from background variability when aggregated in time. By focusing on a remote insular environment, this work aims to contribute observational evidence on the detectability and magnitude of transport-related variability of reactive nitrogen in marine settings.
The following section describes the study area, datasets, and methodological approach used in this work.
2. Materials and Methods
2.1. Study Area
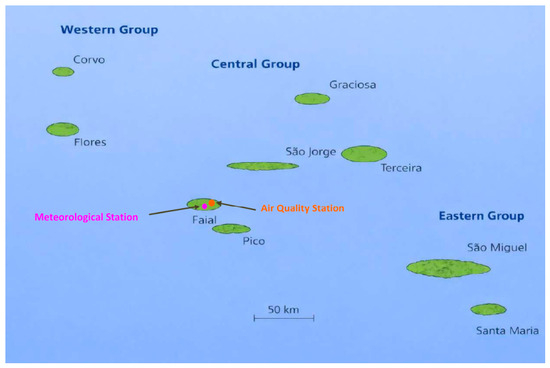
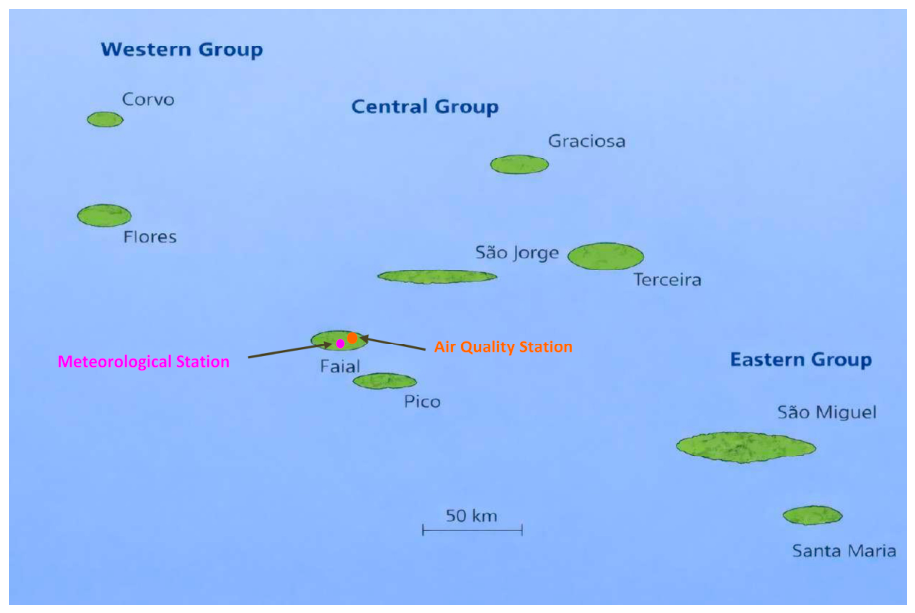
The study was conducted on Faial Island, located in the Azores archipelago in the central North Atlantic Ocean. Owing to its remote oceanic location between Europe and North America, the region is predominantly influenced by marine boundary layer conditions and mid-latitude westerlies (Figure 1).
Figure 1.
Geographic location of the Azores archipelago in the North Atlantic Ocean, indicating the Western, Central, and Eastern island groups. The positions of the meteorological station and the air quality monitoring station on Faial Island are shown.
The island environment is characterized by the absence of major industrial emission sources, making it suitable for investigating background atmospheric composition and transport-driven variability of atmospheric pollutants.
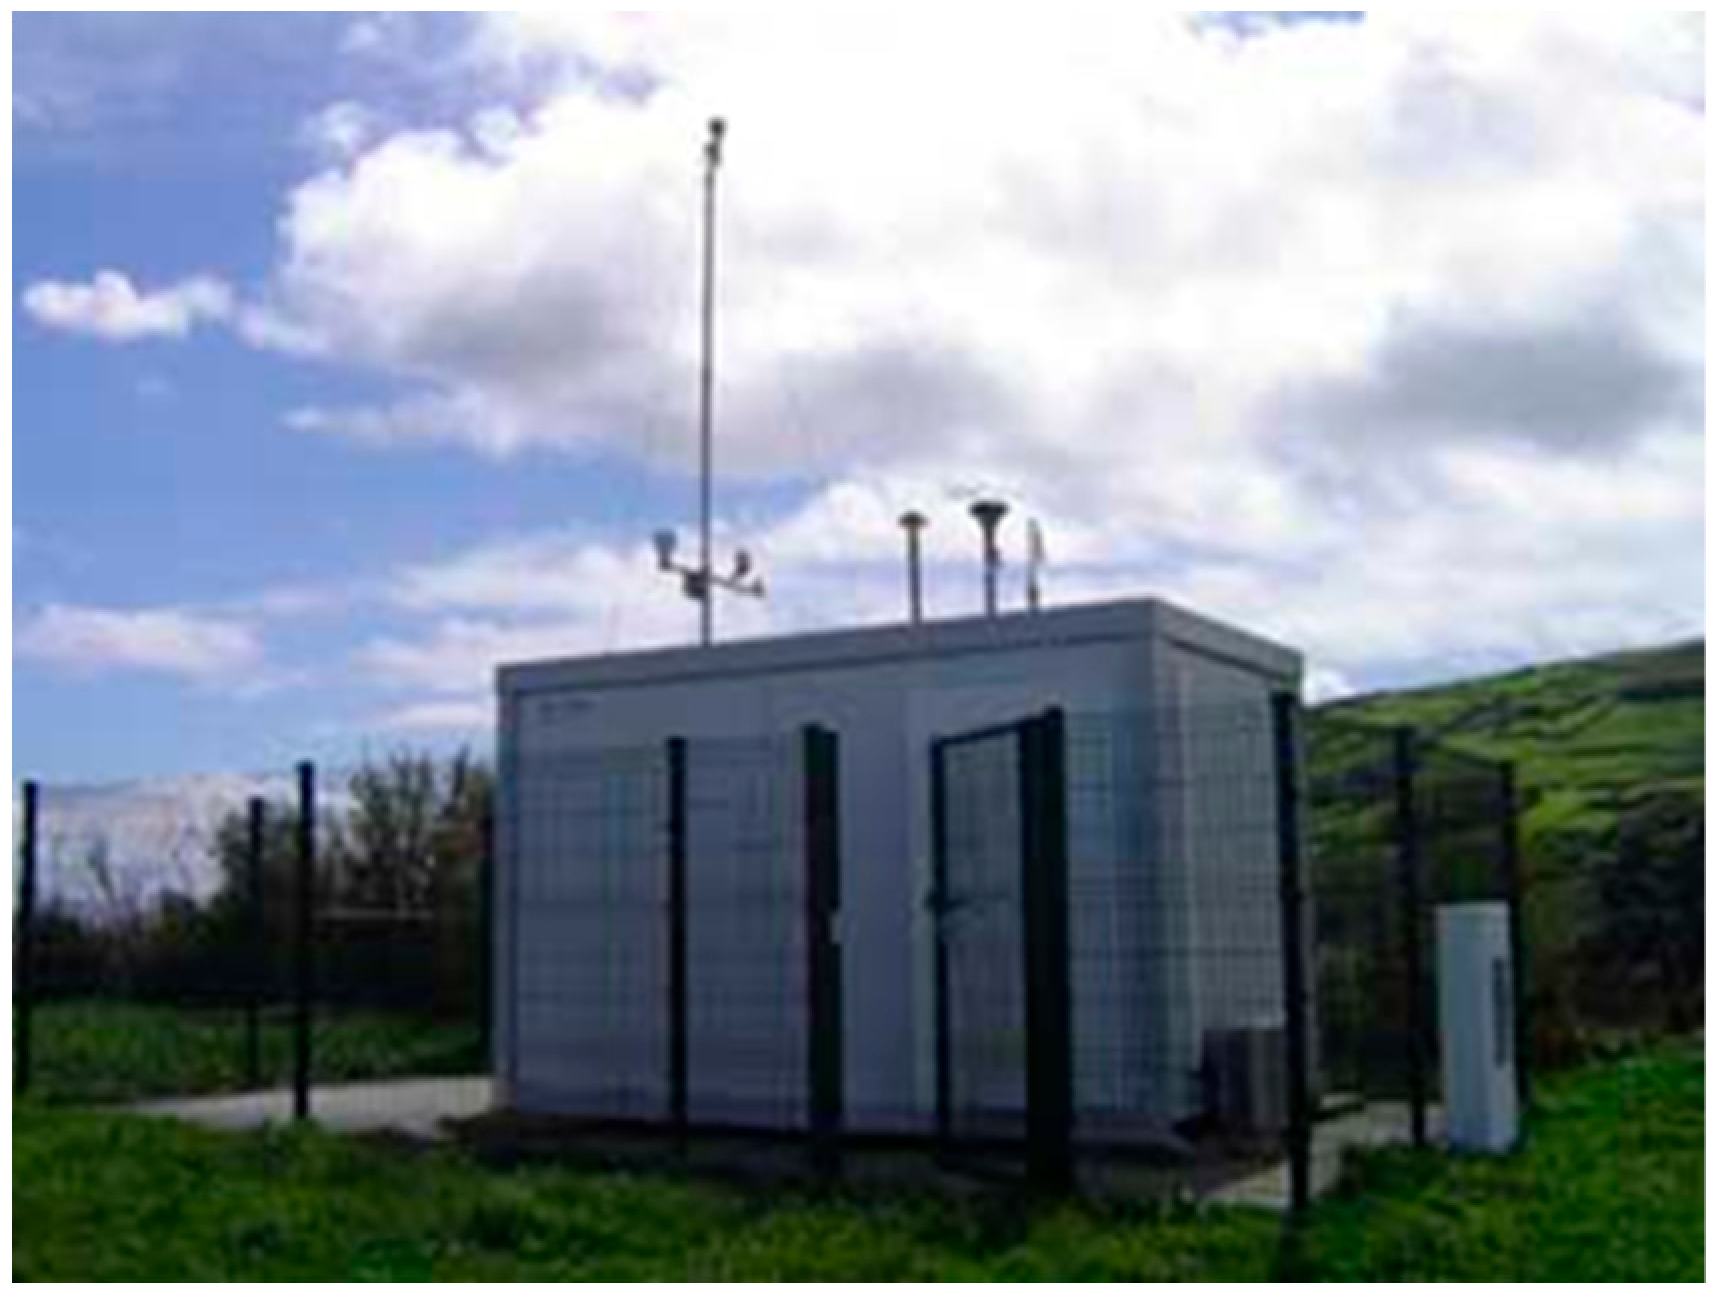
Air quality observations were obtained from the Espalhafatos monitoring station, located in the parish of Ribeirinha (municipality of Horta) at approximately 38.60° N, 28.63° W, at an elevation of about 120 m above sea level (Figure 2).
Figure 2.
Location of the Espalhafatos air quality monitoring station on Faial (Azores), used for continuous measurements of NO2 and PM10 under rural background conditions. The station is part of the regional air quality monitoring network and contributes data to the national air quality information system QualAr.
The station is part of the regional air quality monitoring network of the Azores, and its measurements are integrated into the Portuguese national air quality information system QualAr, operated by the Portuguese Environment Agency. According to the classification criteria established under Directive 2008/50/EC [22], the site is categorized as a rural background monitoring station, meaning that pollutant concentrations measured at this location are minimally influenced by nearby emission sources and are representative of regional atmospheric conditions. Continuous measurements include nitrogen dioxide (NO2), sulfur dioxide (SO2), ozone (O3), and particulate matter (PM10 and PM2.5). In the present study, NO2 and PM10 observations were used to characterize background atmospheric conditions and to identify periods influenced by enhanced atmospheric transport.
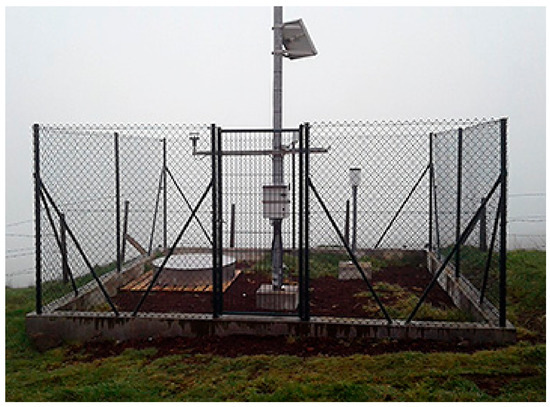
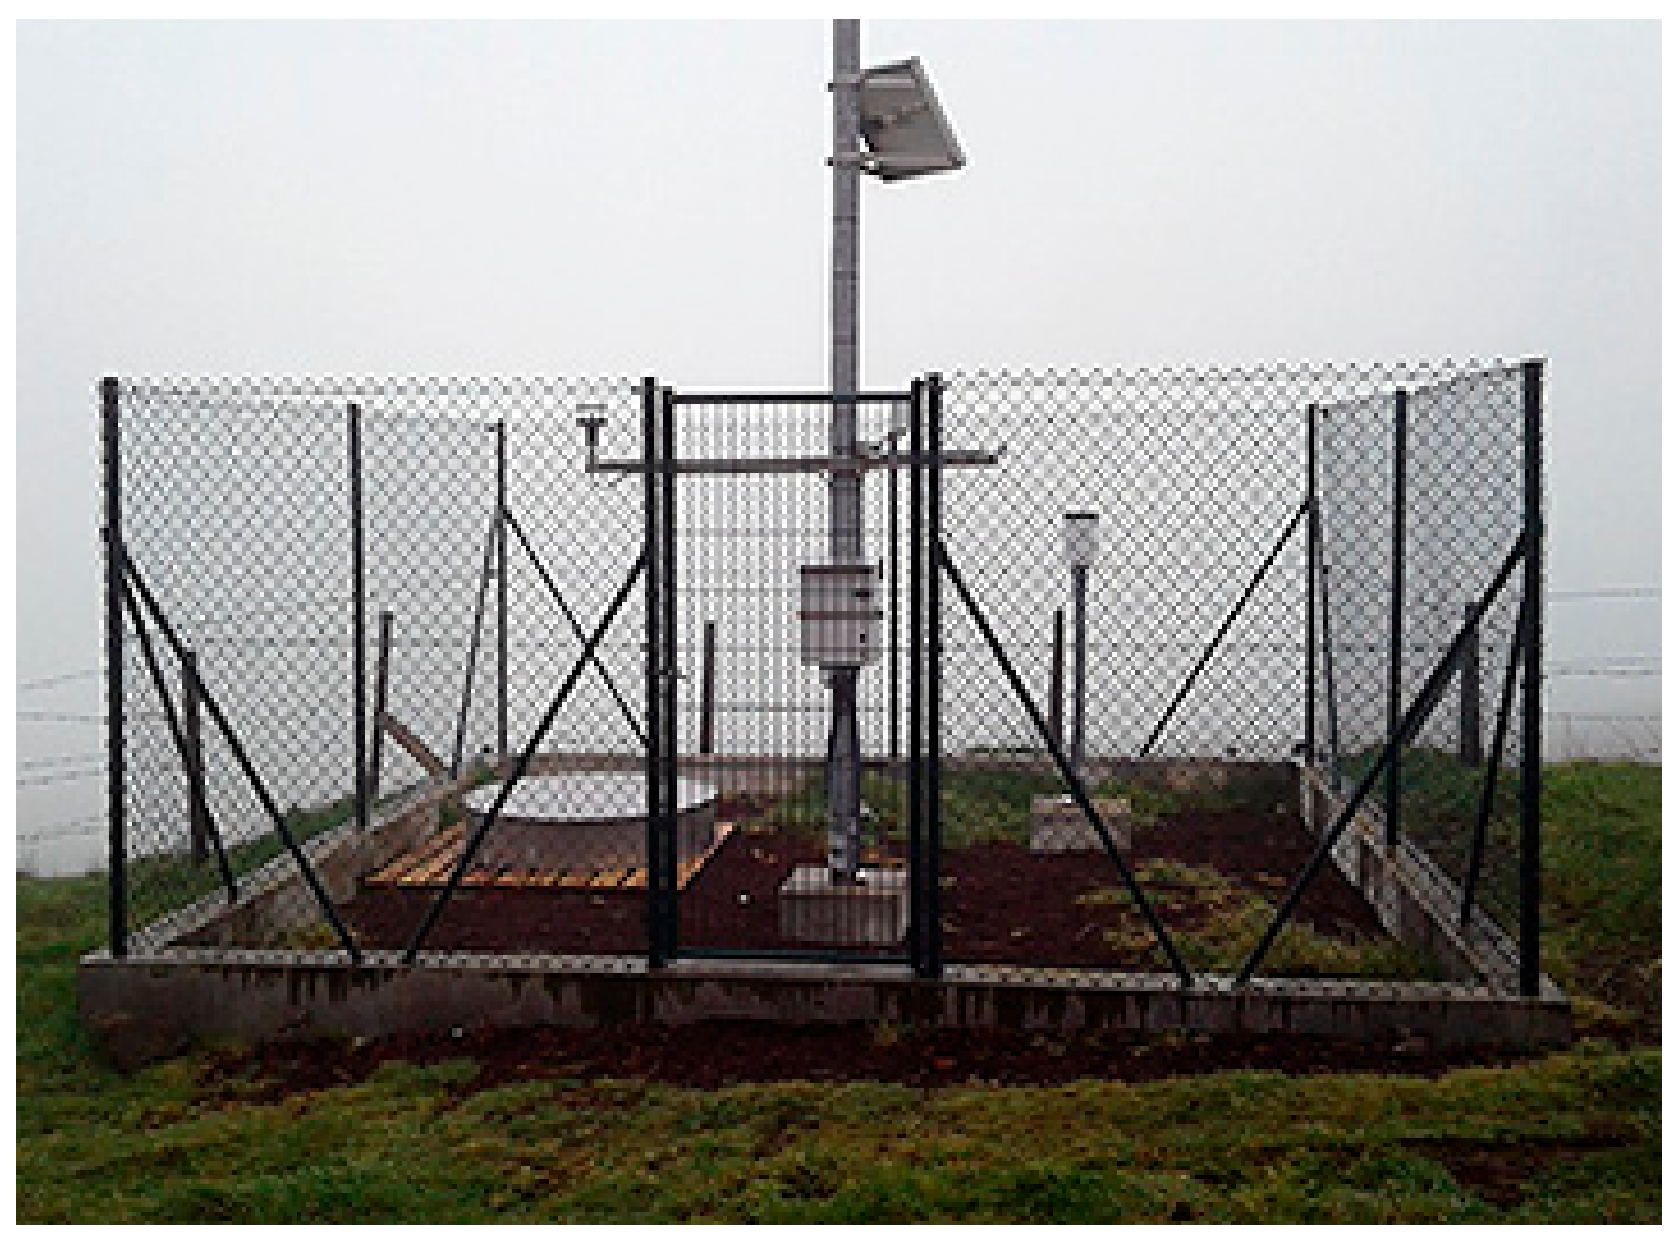
Meteorological conditions were characterized using observations from the Alto do Cabouco meteorological station, located on Faial Island at approximately 38.59° N, 28.69° W, at an elevation of about 330 m above sea level (Figure 3).
Figure 3.
Alto do Cabouco meteorological station located on Faial (Azores). The station belongs to the regional hydrometeorological monitoring network and provides observations of wind speed and wind direction, which were used to characterize atmospheric transport conditions influencing the variability of NO2 in the study area.
The station belongs to the regional hydrometeorological monitoring network of the Azores and records standard meteorological variables including wind speed, wind direction, air temperature, relative humidity, atmospheric pressure, and precipitation. In this study, wind speed and wind direction were used to support the interpretation of atmospheric transport conditions influencing the observed variability of NO2 concentrations.
Due to its position in the mid-latitude North Atlantic, the Azores region is frequently influenced by synoptic-scale atmospheric circulation patterns, including westerly flow and episodic long-range transport of air masses from external source regions, which can modulate background trace gas variability. Remote oceanic islands such as the Azores provide valuable observational platforms for studying background atmospheric composition, as they are largely decoupled from strong local emission sources while remaining sensitive to long-range transport processes.
2.2. NO2 and PM10 Observations
NO2 and PM10 measurements were obtained from the QualAr air quality monitoring network, operated by the Portuguese Environment Agency (APA). Measurements are performed using standardized instrumentation and procedures in accordance with European air quality monitoring directives (Directive 2008/50/EC), including regular calibration, validation, and quality assurance/quality control protocols. Hourly data for the period January 2015 to December 2024 were used, and all analyses were performed using monthly aggregates derived from these observations.
2.2.1. Data Completeness Criterion
To ensure representativeness of monthly statistics, a completeness threshold was applied. For each month m, data completeness was defined as shown in Equation (1):
where is the number of valid hourly observations in month m and the total expected number of hourly observations in that month. Only months satisfying Equation (2):
where retained in subsequent analyses.
Cm = (Nv,m/Nt,m) × 100
Cm ≥ 80%
The data coverage and completeness of the NO2 observations for the period 2015–2024 are summarized in Table 1.
Table 1.
Data coverage and completeness of NO2 observations at the Faial (Espalhafatos) station (2015–2024).
2.2.2. Monthly Aggregation
Monthly mean NO2 concentrations were computed as presented in Equation (3):
where denotes the number of valid hourly observations in month and the corresponding hourly concentration.
Monthly aggregation was adopted to ensure data completeness and statistical consistency, although it may smooth short-term variability associated with individual transport events.
Monthly mean PM10 concentrations were calculated analogously.
No additional filtering or outlier removal was applied beyond the completeness criterion. Missing hourly data within each month were handled implicitly through the ≥80% data availability threshold, and monthly means were computed using all available valid observations. All data were processed in local time as provided by the monitoring networks.
2.2.3. Transport Regime Classification
Transport regimes were defined using a percentile-based classification applied to monthly mean PM10 concentrations. The 90th percentile of the monthly PM10 distribution over the study period was computed as shown in Equation (4):
where PM10,m denotes the monthly mean PM10 concentration in month m.
The P90 threshold was selected to represent relatively elevated PM10 conditions within the local distribution, allowing a clear distinction between background and enhanced transport regimes while retaining a sufficient number of observations for statistical analysis. In addition, sensitivity tests using alternative thresholds (e.g., P85 and P95) were explored and found to yield qualitatively consistent results, without affecting the overall conclusions of the study.
Months were classified as:
This objective threshold was used to distinguish periods of relatively enhanced atmospheric transport from prevailing background conditions.
PM10 was used as an indirect proxy for transport conditions rather than as a direct tracer of NO2. In the Azores region, elevated PM10 concentrations have been associated with long-range transport of aerosol-laden air masses from external source regions, providing a practical indicator of enhanced atmospheric advection. However, PM10 variability may also reflect other processes, including marine aerosol contributions, and therefore does not uniquely identify air-mass origin.
Accordingly, this classification should be interpreted as a simplified, data-driven distinction between relatively enhanced and background transport conditions, rather than as a direct attribution of specific source regions.
2.3. Wind Data
Hourly wind speed and direction data were obtained from the regional hydrometeorological network for the period 2018–2024. Wind speed values provided in km h−1 were converted to International System units according to Equation (5):
Monthly mean wind speed was computed as indicated in Equation (6):
Wind data were used as a supporting variable to provide physical context for the transport regime classification over the overlapping period 2018–2024, rather than as a primary classification criterion.
Wind direction data were available but were not included in the present analysis, as the focus of the study was on the statistical comparison of transport regimes defined by PM10. Preliminary inspection did not reveal a clear or consistent directional signal at the monthly scale, and therefore wind direction was not considered within the scope of this analysis.
2.4. Statistical Analysis
Differences between transport regimes were evaluated using the Mann–Whitney U test, a non-parametric method appropriate for independent samples without assuming normality.
Two samples were defined as:
where represents the monthly mean NO2 concentration in month , and the subscripts denote the transport regime classification.
The Mann–Whitney U statistic is given by Equation (7):
where and denote the sample sizes of the background and enhanced transport groups, respectively, and is the sum of ranks assigned to the observations in sample .
A two-sided test was applied with a significance level of .
Given the low variability of NO2 concentrations and the limited number of months classified under enhanced transport conditions, the statistical analysis is interpreted conservatively, with emphasis on identifying robust differences rather than marginal effects.
The magnitude of the regime difference was quantified using the difference in medians, Equation (8):
where and denote the sample medians of the background and enhanced regimes, respectively.
An analogous procedure was applied to monthly mean wind speed for the overlapping period 2018–2024.
3. Results
This section presents the main observational results obtained from the analysis of the NO2 time series and associated meteorological conditions at the Faial monitoring station. First, the temporal variability of background NO2 concentrations over the period 2015–2024 is described. Subsequently, differences between background Atlantic conditions and months influenced by enhanced transport are examined. Finally, wind speed characteristics are analysed for the overlapping period 2018–2024 to support the physical interpretation of the identified transport regimes.
3.1. Temporal Variability of NO2 (2015–2024)
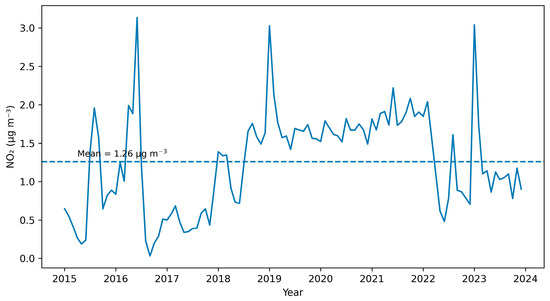
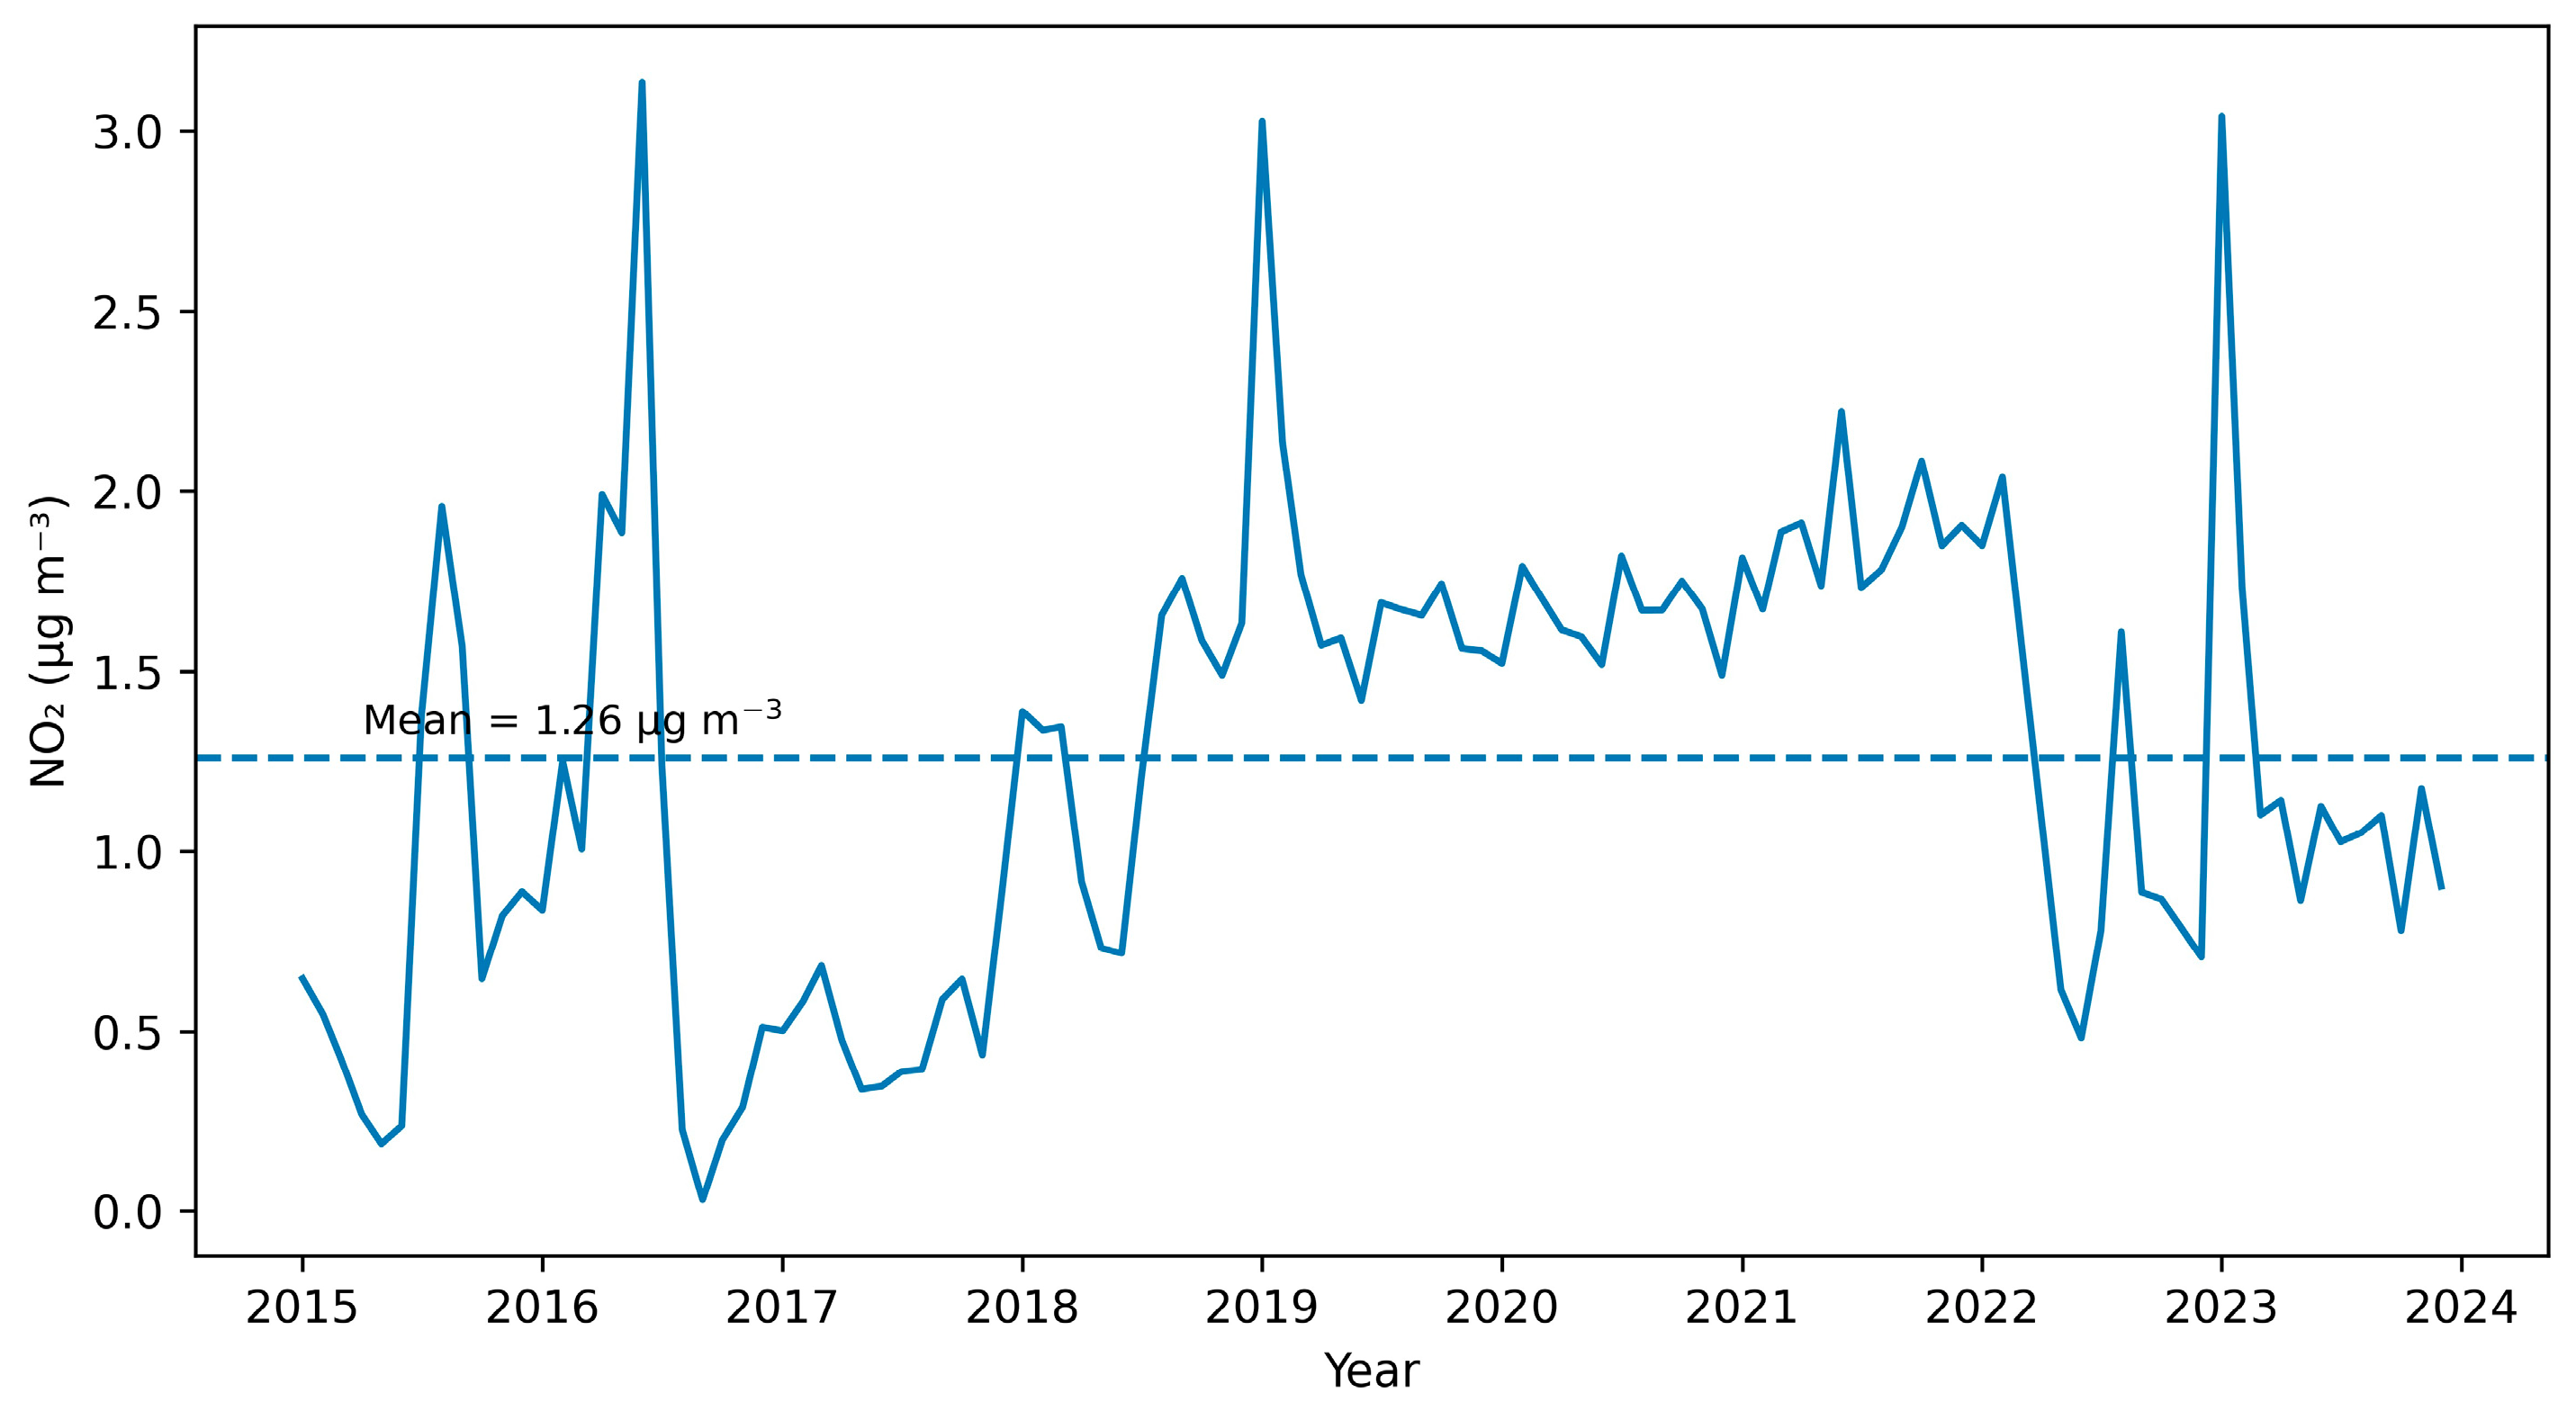
Monthly mean NO2 concentrations measured at the Faial (Espalhafatos) station are shown in Figure 4.
Figure 4.
Monthly mean NO2 concentrations measured at the Espalhafatos air quality monitoring station (Faial Island, Azores) during the period 2015–2024. The dashed horizontal line represents the overall mean NO2 concentration for the study period.
Over the study period, NO2 concentrations remained generally low, consistent with background conditions in a remote North Atlantic environment. The overall mean NO2 concentration was 1.26 µg m−3.
Interannual variability was modest, with no abrupt regime shifts or sustained step changes. Short-term enhancements are visible in several months throughout the record.
3.2. NO2 Under Background and Enhanced Transport Regimes
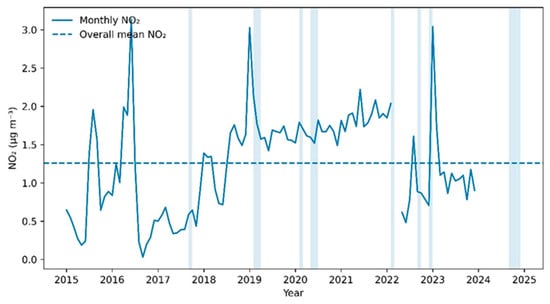
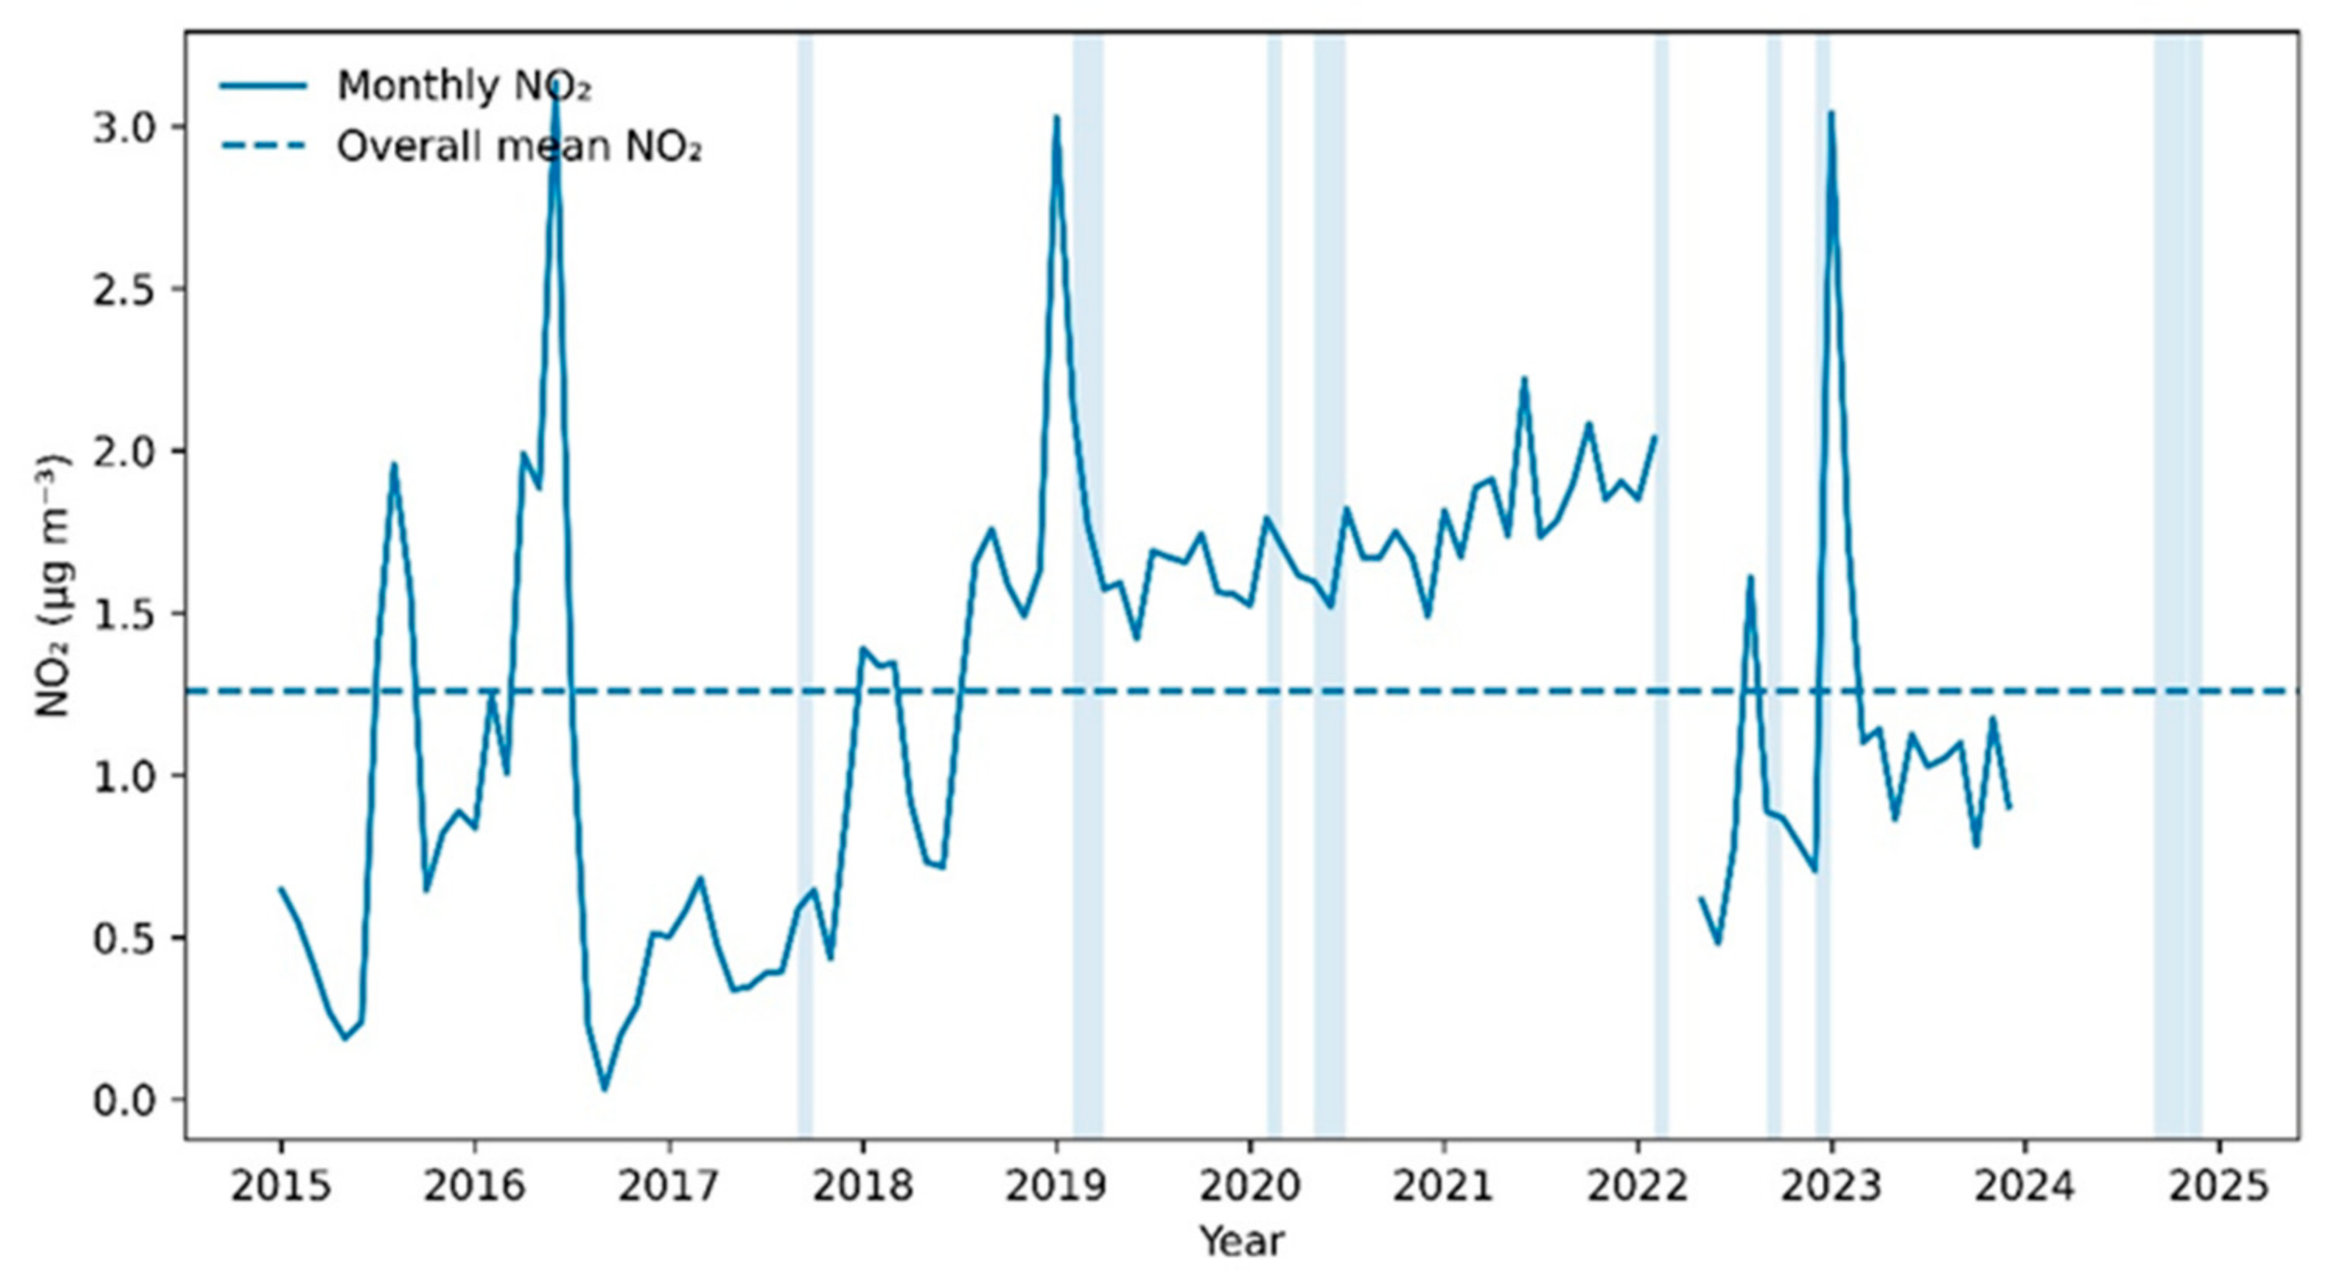
Months classified under enhanced transport conditions (defined as months with PM10 ≥ P90) are indicated by shaded areas in Figure 5. These periods do not dominate the time series but appear intermittently across multiple years, suggesting episodic large-scale transport influences superimposed on relatively stable background conditions.
Figure 5.
Monthly mean NO2 concentrations at the Espalhafatos monitoring station (Faial, Azores) for the period 2015–2024. The dashed line indicates the overall mean NO2 level, and shaded areas represent months influenced by months classified as enhanced transport conditions (PM10 ≥ P90). Only months with ≥80% NO2 data availability were included.
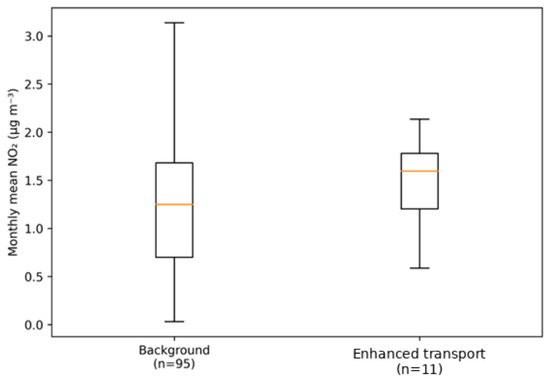
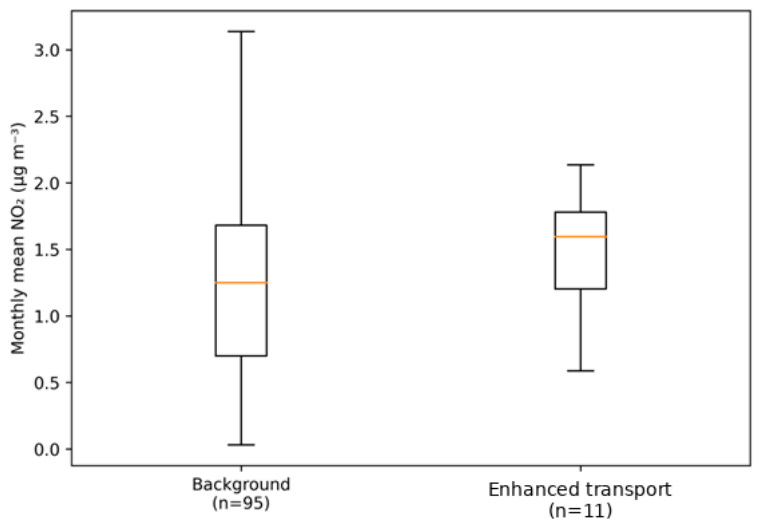
To further examine the effect of transport regimes on NO2 variability, monthly mean NO2 concentrations were grouped according to background Atlantic conditions and months influenced by months were classified as enhanced transport conditions. The distributions of NO2 concentrations for both regimes are shown in Figure 6.
Figure 6.
Distribution of monthly mean NO2 concentrations under background Atlantic conditions (n = 95) and enhanced transport conditions (PM10 ≥ P90; n = 11). Boxes represent the interquartile range, the central line indicates the median, and whiskers extend to the minimum and maximum values.
The boxplots indicate that NO2 concentrations tend to be higher during months classified as enhanced transport conditions compared to background conditions. The median NO2 concentration during these months was 1.60 µg m−3, whereas the median value under background conditions was 1.25 µg m−3, corresponding to a median difference of 0.35 µg m−3. The boxplots indicate relatively narrow interquartile ranges and limited dispersion for both regimes, suggesting low variability in NO2 concentrations across the dataset.
However, the Mann–Whitney U test indicated that this difference was not statistically significant (U = 384, p = 0.153). Therefore, the hypothesis of a statistically detectable increase in NO2 concentrations under enhanced transport conditions is not supported by the present analysis.
The observed difference should be interpreted as a weak descriptive tendency rather than as evidence of a robust transport-related effect.
Overall, the distributions indicate that differences between regimes are small and not statistically resolved on a monthly scale, within the context of low background NO2 concentrations at this remote site.
The number of observations differs between regimes due to the percentile-based classification, with fewer months classified under enhanced transport conditions.
To further examine whether these variations are consistent with differences in atmospheric transport conditions, wind speed characteristics were analysed for the overlapping period 2018–2024.
3.3. Wind Speed Characteristics During Transport Regimes (2018–2024)
Wind speed data were available for the overlapping period 2018–2024 and were used to provide physical context for the transport regimes identified in the NO2 analysis. Monthly mean wind speeds were classified according to the same regime definition applied to NO2 (background vs. enhanced transport conditions).
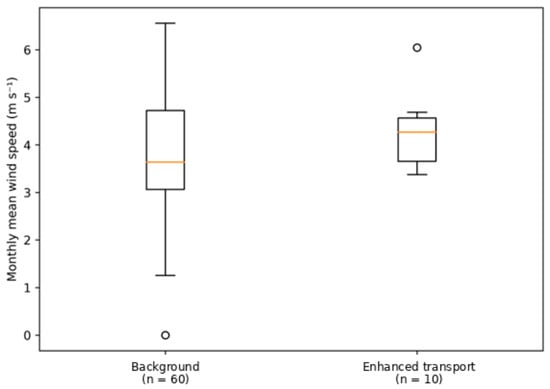
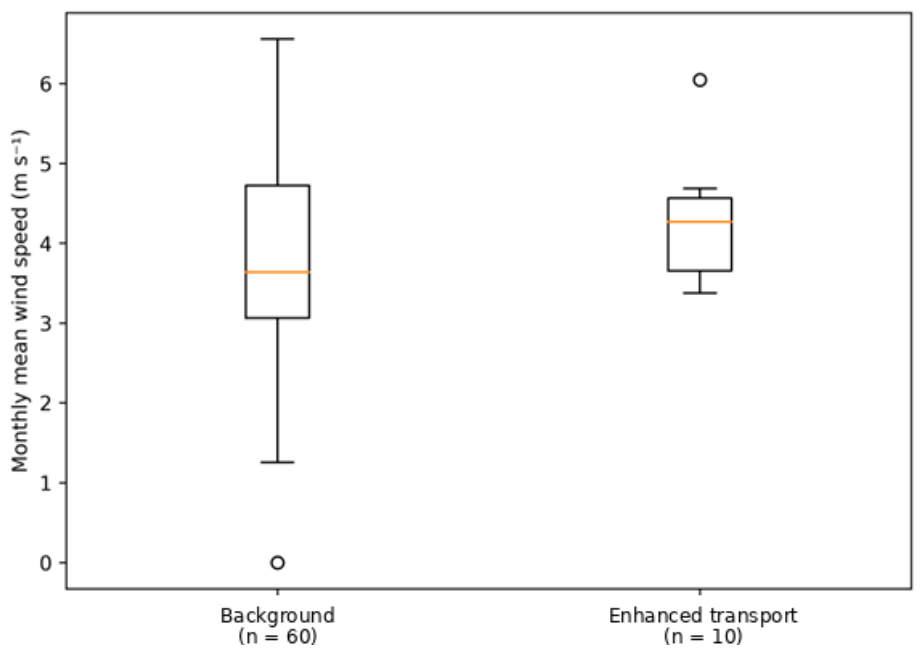
The distributions of monthly mean wind speed under background and enhanced transport conditions are presented in Figure 7. Wind speeds were generally higher during months classified as enhanced transport conditions compared to background Atlantic conditions. The median wind speed during these months was 4.27 m s−1, whereas the median value under background conditions was 3.64 m s−1, corresponding to a median difference of 0.63 m s−1.
Figure 7.
Distribution of monthly mean wind speed under background Atlantic conditions (n = 60) and enhanced transport conditions (PM10 ≥ P90; n = 10) for the period 2018–2024. Boxes represent the interquartile range, the central line indicates the median, and whiskers extend to the minimum and maximum values.
A Mann–Whitney U test indicated that this difference was not statistically significant (U = 194, p = 0.247). Therefore, no statistically robust difference in wind speed between regimes can be established based on the present analysis.
The observed shift toward higher wind speeds should be interpreted as a descriptive tendency rather than as conclusive evidence of enhanced atmospheric advection.
Taken together, the NO2 and wind analyses indicate that differences between regimes are small and not statistically resolved on a monthly scale, within the context of low background variability at this remote site.
4. Discussion
The results presented in this study provide observational insight into the variability of background NO2 concentrations in a remote North Atlantic environment and their relationship with atmospheric transport regimes. In contrast to coastal environments, where nitrogen pollution is often dominated by local anthropogenic sources and regional emission trends [23], and where NO2 variability reflects a combination of local and regional influences [24], the present study focuses on a remote insular setting where background conditions prevail, and transport-related processes may play a role. The consistently low NO2 concentrations observed at the Faial monitoring station reflect the dominance of marine boundary layer conditions and the overall variability remains limited.
Despite the overall stability of the time series, NO2 concentrations tended to be higher during months classified as influenced by enhanced transport conditions. However, this difference was not statistically significant and therefore does not provide evidence of a robust regime-dependent effect. Previous studies have shown that long-range transport can significantly influence NO2 concentrations, even in regions dominated by local emissions [25], reinforcing the importance of transport processes in shaping atmospheric NO2 variability. In the present case, any such influence appears to be weak and not statistically resolved at the monthly scale adopted in this analysis.
The use of a percentile-based PM10 threshold provides an objective and reproducible method to identify transport-influenced conditions. Although PM10 is not a direct tracer of NO2, elevated PM10 levels are commonly associated with long-range transport of aerosol-laden air masses, making it a suitable proxy for distinguishing between background and enhanced transport conditions in the absence of trajectory analysis. This approach is supported by previous studies conducted in the Azores, where PM10 variability has been linked to atmospheric transport processes [26], although such relationships may depend on specific meteorological conditions and do not provide a direct identification of air-mass origin.
The analysis of wind speed provides additional context for interpreting the regime classification. Months classified as enhanced transport conditions were characterized by slightly higher wind speeds. However, these differences were not statistically significant and therefore cannot be considered as evidence of a robust distinction between regimes.
The absence of statistical significance indicates that any transport-related signal in NO2 at this site is weak and not statistically distinguishable from background variability at the monthly scale considered. This reflects both the low concentration levels and the limited variability typical of remote marine environments.
The Azores region, located between major emission regions, is particularly sensitive to long-range transport processes. Air masses reaching the archipelago can carry trace amounts of reactive nitrogen from distant sources, although such variations may not be detectable using aggregated monthly statistics. This interpretation is consistent with previous studies conducted in the Azores, which have linked multiscale variability in atmospheric trace gases to large-scale atmospheric forcing [27] and have shown that surface pollutant concentrations, including NO2, may be influenced by synoptic-scale circulation patterns such as the North Atlantic Oscillation [28]. In addition, similar variability has been reported for other atmospheric indicators measured in remote island environments, including ambient gamma radiation, where fluctuations have been linked to meteorological conditions and large-scale transport processes [29]. The results presented here are therefore consistent with the conceptual understanding of the North Atlantic as a transition zone between transport-influenced conditions and marine background conditions. These findings are consistent with previous observational studies conducted in remote marine environments, where NOx variability has been linked to large-scale atmospheric transport processes [30], although such effects may not be detectable at coarse temporal resolution or under low-variability background conditions, as observed in the present study.
Some limitations should be acknowledged. The classification of transport regimes is based on PM10 as a proxy variable and does not explicitly resolve air-mass origin. Wind data were only available for the period 2018–2024, limiting the temporal overlap with the full NO2 record. In addition, the use of monthly averages, while necessary to ensure data completeness and statistical robustness, may smooth short-term variability associated with individual transport events.
Future work could incorporate air-mass trajectory analysis, chemical transport modelling, or higher temporal resolution data to better resolve the mechanisms underlying the observed variability. Such approaches would allow a more direct attribution of NO2 variations to specific source regions and transport pathways.
Overall, the results indicate that background NO2 variability at this remote North Atlantic site shows no statistically robust dependence on the classified transport regimes on a monthly scale, suggesting that any potential transport-related influence is weak, intermittent, or not detectable under the present analytical framework.
5. Conclusions
This study examined the variability of background NO2 concentrations at a remote North Atlantic site (Faial, Azores) over the period 2015–2024. The results indicate that NO2 levels remained consistently low, reflecting the dominance of background marine conditions in this region.
A comparison between background and enhanced transport conditions indicated slightly higher NO2 concentrations during months classified as influenced by increased atmospheric transport with a median difference of 0.35 µg m−3. However, these differences were not statistically significant and therefore do not provide evidence of a statistically robust regime-dependent effect.
The combined analysis of NO2 and wind speed indicates that any potential influence of atmospheric transport on background reactive nitrogen levels at this site is weak and not statistically resolved at the monthly scale considered. These results highlight the challenges of detecting subtle transport-related signals in low-variability marine environments using aggregated data.
Overall, this study contributes to improving the understanding of reactive nitrogen variability in the North Atlantic by providing evidence that transport-related effects on NO2 are not statistically detectable under the present analytical framework and reinforces the value of long-term observations at remote island sites for characterizing background atmospheric conditions.
Author Contributions
Conceptualization, M.G.M.; methodology, M.G.M. and H.C.V.; software, M.G.M.; validation, M.G.M. and H.C.V.; formal analysis, M.G.M.; investigation, M.G.M.; resources, H.C.V.; data curation, M.G.M. and H.C.V.; writing—original draft preparation, M.G.M.; writing—review and editing, M.G.M. and H.C.V.; visualization, H.C.V.; supervision, M.G.M.; project administration, M.G.M. All authors have read and agreed to the published version of the manuscript.
Funding
This research received no external funding. The article processing charge (APC) was waived by the publisher.
Data Availability Statement
The air quality data used in this study (NO2 and PM10) are publicly available from the Agência Portuguesa do Ambiente (APA) through the QualAr platform. The datasets were obtained from the Faial background monitoring station (Espalhafatos, Azores) and can be accessed at: https://qualar.apambiente.pt/qualar/dados_horarios.php (accessed on 15 October 2025). Meteorological data (wind speed) were obtained from the Alto do Cabouco station of the Azores Hydrometeorological Network, available at https://redehidro.ambiente.azores.gov.pt/ (accessed on 3 November 2025). This data is available upon request from the corresponding regional authorities.
Acknowledgments
The authors acknowledge the Agência Portuguesa do Ambiente (APA) for providing access to air quality data through the QualAr platform, as well as the regional authorities responsible for the Azores Hydrometeorological Network for the provision of meteorological data from the Alto do Cabouco station. The authors also thank all institutions involved in the maintenance and operation of these monitoring networks, whose efforts ensure the availability of high-quality environmental data for scientific research.
Conflicts of Interest
The authors declare no conflicts of interest.
Abbreviations
The following abbreviations are used in this manuscript:
| NO2 | Nitrogen dioxide |
| PM10 | Particulate Matter with an aerodynamic diameter less than or equal to 10 μm |
| Nr | Reactive nitrogen |
| NOx | Nitrogen oxides |
| NO | Nitric oxide |
| SO2 | Sulfur dioxide |
| O3 | Ozone |
References
- Galloway, J.N.; Townsend, A.R.; Erisman, J.W.; Bekunda, M.; Cai, Z.; Freney, J.R.; Martinelli, L.A.; Seitzinger, S.P.; Sutton, M.A. Transformation of the nitrogen cycle: Recent trends, questions, and potential solutions. Science 2008, 320, 889–892. [Google Scholar] [CrossRef] [Scilit] [PubMed]
- Fowler, D.; Coyle, M.; Skiba, U.; Sutton, M.A.; Cape, J.N.; Reis, S.; Sheppard, L.J.; Jenkins, A.; Grizzetti, B.; Galloway, J.N.; et al. The global nitrogen cycle in the twenty-first century. Philos. Trans. R. Soc. Lond. Ser. B Biol. Sci. 2013, 368, 20130164. [Google Scholar] [CrossRef] [Scilit]
- Seinfeld, J.H.; Pandis, S.N. Atmospheric Chemistry and Physics, 3rd ed.; Wiley: Hoboken, NJ, USA, 2016. [Google Scholar]
- Cooper, O.R.; Parrish, D.D.; Ziemke, J.; Balashov, N.V.; Cupeiro, M.; Galbally, I.E.; Gilge, S.; Horowitz, L.; Jensen, N.R.; Lamarque, J.-F.; et al. Global distribution and trends of tropospheric ozone: An observation-based review. Elem. Sci. Anthr. 2014, 2, 000029. [Google Scholar] [CrossRef] [Scilit]
- Monks, P.S.; Granier, C.; Fuzzi, S.; Stohl, A.; Williams, M.L.; Akimoto, H.; Amann, M.; Baklanov, A.; Baltensperger, U.; Bey, I.; et al. Atmospheric composition change—Global and regional air quality. Atmos. Environ. 2009, 43, 5268–5350. [Google Scholar] [CrossRef] [Scilit]
- Duncan, B.N.; Lamsal, L.N.; Thompson, A.M.; Yoshida, Y.; Lu, Z.; Streets, D.G.; Hurwitz, M.M.; Pickering, K.E. A space-based, high-resolution view of notable changes in urban NOx pollution around the world (2005–2014). J. Geophys. Res. Atmos. 2016, 121, 976–996. [Google Scholar] [CrossRef] [Scilit]
- Tørseth, K.; Aas, W.; Breivik, K.; Fjaeraa, A.M.; Fiebig, M.; Hjellbrekke, A.G.; Lund Myhre, C.; Solberg, S.; Yttri, K.E. Introduction to the European Monitoring and Evaluation Programme (EMEP) and observed atmospheric composition change during 1972–2009. Atmos. Chem. Phys. 2012, 12, 5447–5481. [Google Scholar] [CrossRef] [Scilit]
- Parrish, D.D.; Law, K.S.; Staehelin, J.; Derwent, R.; Cooper, O.R.; Tanimoto, H.; Volz-Thomas, A.; Gilge, S.; Scheel, H.-E.; Steinbacher, M.; et al. Long-term changes in lower tropospheric baseline ozone concentrations at northern mid-latitudes. Atmos. Chem. Phys. 2012, 12, 11485–11504. [Google Scholar] [CrossRef] [Scilit]
- Logan, J.A. Nitrogen oxides in the troposphere: Global and regional budgets. J. Geophys. Res. 1983, 88, 10785–10807. [Google Scholar] [CrossRef] [Scilit]
- Stevenson, D.S.; Dentener, F.J.; Schultz, M.G.; Ellingsen, K.; van Noije, T.P.C.; Wild, O.; Zeng, G.; Amann, M.; Atherton, C.S.; Bell, N.; et al. Multimodel ensemble simulations of present-day and near-future tropospheric ozone. J. Geophys. Res. Atmos. 2006, 111, D08301. [Google Scholar] [CrossRef] [Scilit]
- Stohl, A. Characteristics of atmospheric transport into the Arctic troposphere. J. Geophys. Res. 2006, 111, D11306. [Google Scholar] [CrossRef] [Scilit]
- Ye, C.; Zhou, X.; Pu, D.; Stutz, J.; Festa, J.; Spolaor, M.; Tsai, C.; Cantrell, C.; Mauldin, R.L.; Weinheimer, A.; et al. Rapid cycling of reactive nitrogen in the marine boundary layer. Nature 2016, 532, 489–491. [Google Scholar] [CrossRef] [Scilit]
- Lelieveld, J.; Dentener, F.J. What controls tropospheric ozone? J. Geophys. Res. 2000, 105, 3531–3551. [Google Scholar] [CrossRef] [Scilit]
- Kim, M.J.; Farmer, D.K.; Bertram, T.H. A controlling role for the air-sea interface in the chemical processing of reactive nitrogen in the coastal marine boundary layer. Proc. Natl. Acad. Sci. USA 2014, 111, 3943–3948. [Google Scholar] [CrossRef] [Scilit]
- Lee, J.D.; Moller, S.J.; Read, K.A.; Lewis, A.C.; Mendes, L.; Carpenter, L.J. Year-round measurements of nitrogen oxides and ozone in the tropical North Atlantic marine boundary layer. J. Geophys. Res. Atmos. 2009, 114, D21302. [Google Scholar] [CrossRef] [Scilit]
- Hurrell, J.W. Decadal trends in the North Atlantic Oscillation: Regional temperatures and precipitation. Science 1995, 269, 676–679. [Google Scholar] [CrossRef] [Scilit]
- Trigo, R.M.; Osborn, T.J.; Corte-Real, J.M. The North Atlantic Oscillation influence on Europe: Climate impacts and associated physical mechanisms. Clim. Res. 2002, 20, 9–17. [Google Scholar] [CrossRef] [Scilit]
- Keeling, C.D.; Bacastow, R.B.; Bainbridge, A.E.; Ekdahl, C.A.; Guenther, P.R.; Waterman, L.S.; Chin, J.F.S. Atmospheric CO2 variations at Mauna Loa Observatory, Hawaii. Tellus 1976, 28, 538–551. [Google Scholar] [CrossRef] [Scilit]
- Carpenter, L.J.; Fleming, Z.L.; Read, K.A.; Lee, J.D.; Moller, S.J.; Hopkins, J.R.; Purvis, R.M.; Lewis, A.C.; Müller, K.; Heinold, B.; et al. Seasonal characteristics of tropical marine boundary layer air measured at the Cape Verde Atmospheric Observatory. J. Atmos. Chem. 2010, 67, 87–140. [Google Scholar] [CrossRef] [Scilit]
- Vestreng, V.; Ntziachristos, L.; Semb, A.; Reis, S.; Isaksen, I.S.A.; Tarrasón, L. Evolution of NOx emissions in Europe with focus on road transport control measures. Atmos. Chem. Phys. 2009, 9, 1503–1520. [Google Scholar] [CrossRef] [Scilit]
- Wilcoxon, F. Individual comparisons by ranking methods. Biom. Bull. 1945, 1, 80–83. [Google Scholar] [CrossRef] [Scilit]
- European Parliament and Council. Directive 2008/50/EC of the European Parliament and of the Council of 21 May 2008 on ambient air quality and cleaner air for Europe. Off. J. Eur. Union 2008, L152, 1–44. [Google Scholar]
- Howarth, R.W. Coastal nitrogen pollution: A review of sources and trends globally and regionally. Harmful Algae 2008, 8, 14–20. [Google Scholar] [CrossRef] [Scilit]
- Tian, X.-P.; Wang, D.; Wang, Y.-Q.; Gao, Z.-Q.; Tian, C.-G.; Bi, X.-L.; Ning, J.-C. Long-term variations and trends of tropospheric and ground-level NO2 over typical coastal areas. Ecol. Indic. 2024, 164, 112163. [Google Scholar] [CrossRef] [Scilit]
- Graham, A.M.; Pope, R.J.; Chipperfield, M.P.; Dhomse, S.S.; Pimlott, M.; Feng, W.; Singh, V.; Chen, Y.; Wild, O.; Sokhi, R.; et al. Quantifying effects of long-range transport of NO2 over Delhi using back trajectories and satellite data. Atmos. Chem. Phys. 2024, 24, 789–806. [Google Scholar] [CrossRef] [Scilit]
- Meirelles, M.G.; Vasconcelos, H.C. Physical–statistical characterization of PM10 and PM2.5 concentrations and atmospheric transport events in the Azores during 2024. Earth 2025, 6, 54. [Google Scholar] [CrossRef] [Scilit]
- Meirelles, M.G.; Vasconcelos, H.C. Multiscale variability of atmospheric CO2 at the Azores: Detecting seasonal and decadal oscillations. Atmosphere 2025, 16, 1308. [Google Scholar] [CrossRef] [Scilit]
- Vasconcelos, H.C.; Ferreira, A.C.; Meirelles, M.G. Synoptic-scale modulation of surface O3, NO2, and SO2 by the North Atlantic Oscillation in São Miguel Island, Azores (2017–2021). Pollutants 2025, 5, 27. [Google Scholar] [CrossRef] [Scilit]
- Meirelles, M.G.; Vasconcelos, H.C. Ambient gamma radiation as an atmospheric indicator in a remote oceanic island environment: Long-term variability and meteorological controls. Atmosphere 2026, 17, 264. [Google Scholar] [CrossRef] [Scilit]
- Lawrence, M.G.; Crutzen, P.J.; Rasch, P.J.; Eaton, B.E.; Mahowald, N.M. A model for studies of tropospheric photochemistry: Description, global distributions, and evaluation. J. Geophys. Res. Atmos. 1999, 104, 26245–26277. [Google Scholar] [CrossRef] [Scilit]

Disclaimer/Publisher’s Note: The statements, opinions and data contained in all publications are solely those of the individual author(s) and contributor(s) and not of MDPI and/or the editor(s). MDPI and/or the editor(s) disclaim responsibility for any injury to people or property resulting from any ideas, methods, instructions or products referred to in the content. |
© 2026 by the authors. Licensee MDPI, Basel, Switzerland. This article is an open access article distributed under the terms and conditions of the Creative Commons Attribution (CC BY) license.