


Abstract
Objective: The aim of this study was to determine the optimal region-of-interest (ROI) pixel size for fractal dimension analysis on panoramic radiographs that best reflects implant stability assessed by resonance frequency analysis (ISQ) and to investigate whether implant stability can be directly estimated from radiographic images. Materials and Methods: This retrospective cross-sectional study included 65 patients for whom panoramic radiographs and resonance frequency analysis measurements were available. All panoramic images were converted to TIFF format and standardized to a resolution of 2627 × 1646 pixels. All radiographic images were obtained using the same panoramic imaging device and standardized acquisition protocol. Exposure parameters were adjusted within the manufacturer’s recommended range to ensure optimal image quality while maintaining methodological consistency across patients. During ROI selection, care was taken to avoid cortical bone margins, overlapping anatomical structures, and radiographic artifacts in order to ensure that the analyzed regions represented trabecular bone adjacent to the implant surface. Fractal dimension analysis was performed in the cervical peri-implant bone region, starting from the first bone–implant contact and extending apically, using three different ROI configurations. The ROI size was defined as 30 pixels apically and 10 pixels horizontally for FMD1, 30 × 20 pixels for FMD2, and 30 × 30 pixels for FMD3. Implant stability was assessed using ISQ values. Data distribution was evaluated using the Shapiro–Wilk test. Associations between ISQ and fractal dimension measurements were analyzed using Pearson and Spearman correlation analyses. Multiple linear regression models adjusted for age and sex were constructed to assess independent associations. Results: The mean age of the participants was 50.0 ± 9.9 years, and the mean ISQ value was 78.6 ± 5.9. The mean fractal dimension values were 1.466 ± 0.055 for FMD1, 1.595 ± 0.031 for FMD2, and 1.655 ± 0.046 for FMD3. No significant association was found between ISQ and FMD1 or FMD3. A weak positive correlation was observed between ISQ and FMD2; however, this association did not remain statistically significant after correction for multiple comparisons. In multiple linear regression analysis, ISQ was identified as an independent predictor of FMD2, but not of FMD1 or FMD3. Age and sex had no significant effect on fractal dimension measurements. Conclusions: Fractal dimension measurements derived from panoramic radiographs showed a weak association with implant stability that was dependent on the selected ROI pixel size. Among the evaluated configurations, the 30 × 20-pixel ROI at the cervical peri-implant region demonstrated the strongest association with ISQ values, suggesting that this ROI configuration showed the most consistent association with ISQ values among the tested ROI sizes.
1. Introduction
Dental implants have been used effectively for the replacement of missing teeth due to their high survival and success rates [1,2]. The concept of the union of the dental implant and bone is defined as the osseointegration of the dental implant and is considered the most important factor in the success of dental implants [3]. There are different invasive and non-invasive methods, such as RFA (resonance frequency analysis), cutting torque analysis and reverse torque analysis, to objectively assess the degree of osseointegration around an implant [4,5]. Among these techniques, RFA is the most prevalent and least invasive approach for assessing the level of osseointegration of dental implants [6,7,8]. The RFA system quantifies the osseointegration of dental implants on a scale from 1 to 100, utilizing an instrument and components known as pegs affixed to the prosthetic connection of the implant. As the measuring value in the RFA device escalates, the extent of osseointegration correspondingly amplifies [9]. During the healing period, the implant’s stability evolves from primary mechanical stability, achieved immediately after placement through mechanical interlocking between the implant surface and surrounding bone, to secondary biological stability, which develops gradually through new bone formation and remodeling at the bone–implant interface [10,11]. RFA provides valuable insight into this transition, as increased ISQ values over time indicate successful osseointegration and maturation of peri-implant bone [12,13]. Several studies have demonstrated that implant design, surface characteristics, and surgical technique influence implant stability [14,15,16]. Therefore, monitoring ISQ changes at different healing intervals can help clinicians predict the optimal time for prosthetic loading and minimize the risk of implant failure. RFA measurements are influenced by the mechanical engagement between the implant and the surrounding bone, particularly at the marginal crestal region, where primary mechanical stability is most critical for osseointegration and subsequent clinical success. In vitro and in vivo studies have demonstrated that the stability values measured with RFA reflect changes in peri-implant marginal bone and are sensitive to bone loss or defects at the crestal area, indicating that measurements at or near the implant neck region are closely related to the core biomechanical behavior of the implant–bone interface [17].
Recent studies have suggested that radiographic FA (fractal analysis) can complement resonance frequency analysis by providing a non-invasive quantitative assessment of trabecular bone microarchitecture surrounding dental implants [18,19]. A higher FD (fractal dimension) value generally indicates a more complex and denser trabecular pattern, suggesting advanced mineralization and improved bone quality, whereas lower FD values may represent reduced trabecular connectivity or early healing stages [20]. Thus, FA serves as an indirect but objective measure of bone quality and biological stability around dental implants. While RFA evaluates the mechanical aspect of implant stability through ISQ measurements, FA provides insight into the biological and structural aspects of osseointegration. It should also be acknowledged that fractal analysis evaluates the radiographic texture of trabecular bone rather than the actual bone–implant contact (BIC) occurring at the implant surface. The degree of BIC is considered one of the most direct histological indicators of osseointegration; however, its measurement typically requires invasive histomorphometric analysis or high-resolution imaging modalities such as micro-computed tomography, which are not applicable in routine clinical settings. Consequently, fractal analysis should be interpreted as a non-invasive radiomorphometric approach that reflects structural characteristics of peri-implant bone rather than providing a direct quantitative assessment of bone–implant integration. Implant stability represents a multifactorial biomechanical phenomenon influenced by several structural and biological parameters. Although resonance frequency analysis reflects the overall mechanical behavior of the implant–bone complex, radiographic fractal analysis primarily captures textural characteristics of trabecular bone in the peri-implant region. Consequently, correlations between these two parameters may not fully account for other determinants of implant stability, such as cortical bone thickness, bone mineral density, trabecular thickness, and the extent of bone–implant contact. Future studies integrating fractal analysis with additional quantitative imaging approaches, including volumetric bone density assessment from cone-beam computed tomography or advanced morphometric parameters, may provide a more comprehensive understanding of how peri-implant bone structure contributes to implant stability. The integration of these two complementary methods allows for a more comprehensive assessment of implant stability, as changes in FD values over time have been shown to parallel increases in ISQ values, reflecting the transition from primary to secondary stability. Monitoring both parameters simultaneously enables clinicians to correlate biomechanical performance with radiomorphometric bone changes, potentially improving decision-making for prosthetic loading and long-term implant prognosis [21,22].
Accordingly, the aim of the present study was to determine the optimal ROI pixel size for FD analysis on panoramic radiographs that best reflects implant stability assessed by ISQ, in order to identify whether implant stability can be reliably estimated directly from radiographic images. Specifically, the correlations between ISQ values and FD measurements obtained using three different ROI pixel configurations (FMD1, FMD2 and FMD3) at the cervical peri-implant bone region were evaluated.
2. Materials and Methods
This retrospective cross-sectional clinical study was conducted in the Department of Periodontology at Harran University Faculty of Dentistry, in accordance with the ethical standards of the Declaration of Helsinki (2013 revision). Ethical approval was obtained from the Harran University Clinical Research Ethics Committee (Approval No: 07/10/2024-15). All participants provided written informed consent prior to inclusion.
Systemically healthy, partially edentulous patients requiring implant placement in the posterior region were included. Exclusion criteria were smoking more than 10 cigarettes per day, systemic diseases affecting bone metabolism, or a history of bisphosphonate therapy.
2.1. Implant Placement and Resonance Frequency Analysis
All implants used in this study were of the same brand, with a diameter of 4.0 mm and lengths ranging from 8 to 10 mm. All implants were placed under local anesthesia using standard surgical protocols in accordance with the manufacturer’s recommendations.
RFA measurements were performed only at three months postoperatively (T1) using the Osstell device (Ostell, IDx, FA W & H Dentalwerk, Bürmoos, Austria) to record ISQ values. In this study, all ISQ measurements were obtained exclusively in the mesiodistal direction to ensure methodological consistency, and these values were used directly for the analysis. For clarity, RFA outputs were directly expressed as ISQ values, ranging from 1 to 100, as provided by the Osstell device.
2.2. Radiographic Image Acquisition
Standardized panoramic radiographs were taken at the same postoperative time point (T1). All images were captured using Pax Zenith digital panoramic equipment (Vatech, Seoul, Republic of Korea), calibrated with unit parameters between 6 and 10 mA and 60–90 kVp, and an exposure time of 10–20 s. During image acquisition, the sagittal plane was maintained parallel to the Frankfurt horizontal plane and perpendicular to the ground. All panoramic radiographic images were converted to TIFF format and standardized to a resolution of 2627 × 1646 pixels prior to image processing and fractal dimension analysis. In the present study, only implants placed in the posterior mandible (premolar–molar region) were included. This restriction was intentionally applied because panoramic radiographs are known to be affected by superimposition and region-dependent image quality limitations. In the maxilla, visualization of the peri-implant trabecular bone is frequently compromised by the presence of the maxillary sinus and overlapping anatomical structures. In addition, in the anterior regions of both jaws, superimposition of the cervical vertebrae may reduce image clarity and trabecular pattern visibility. Therefore, the posterior mandibular region was selected in order to minimize anatomical overlap, projection-related artifacts and region-dependent variability in fractal dimension measurements.
2.3. Fractal Dimension Analysis and Region of Interest (ROI) Definition
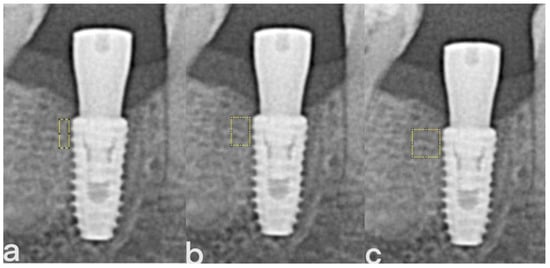
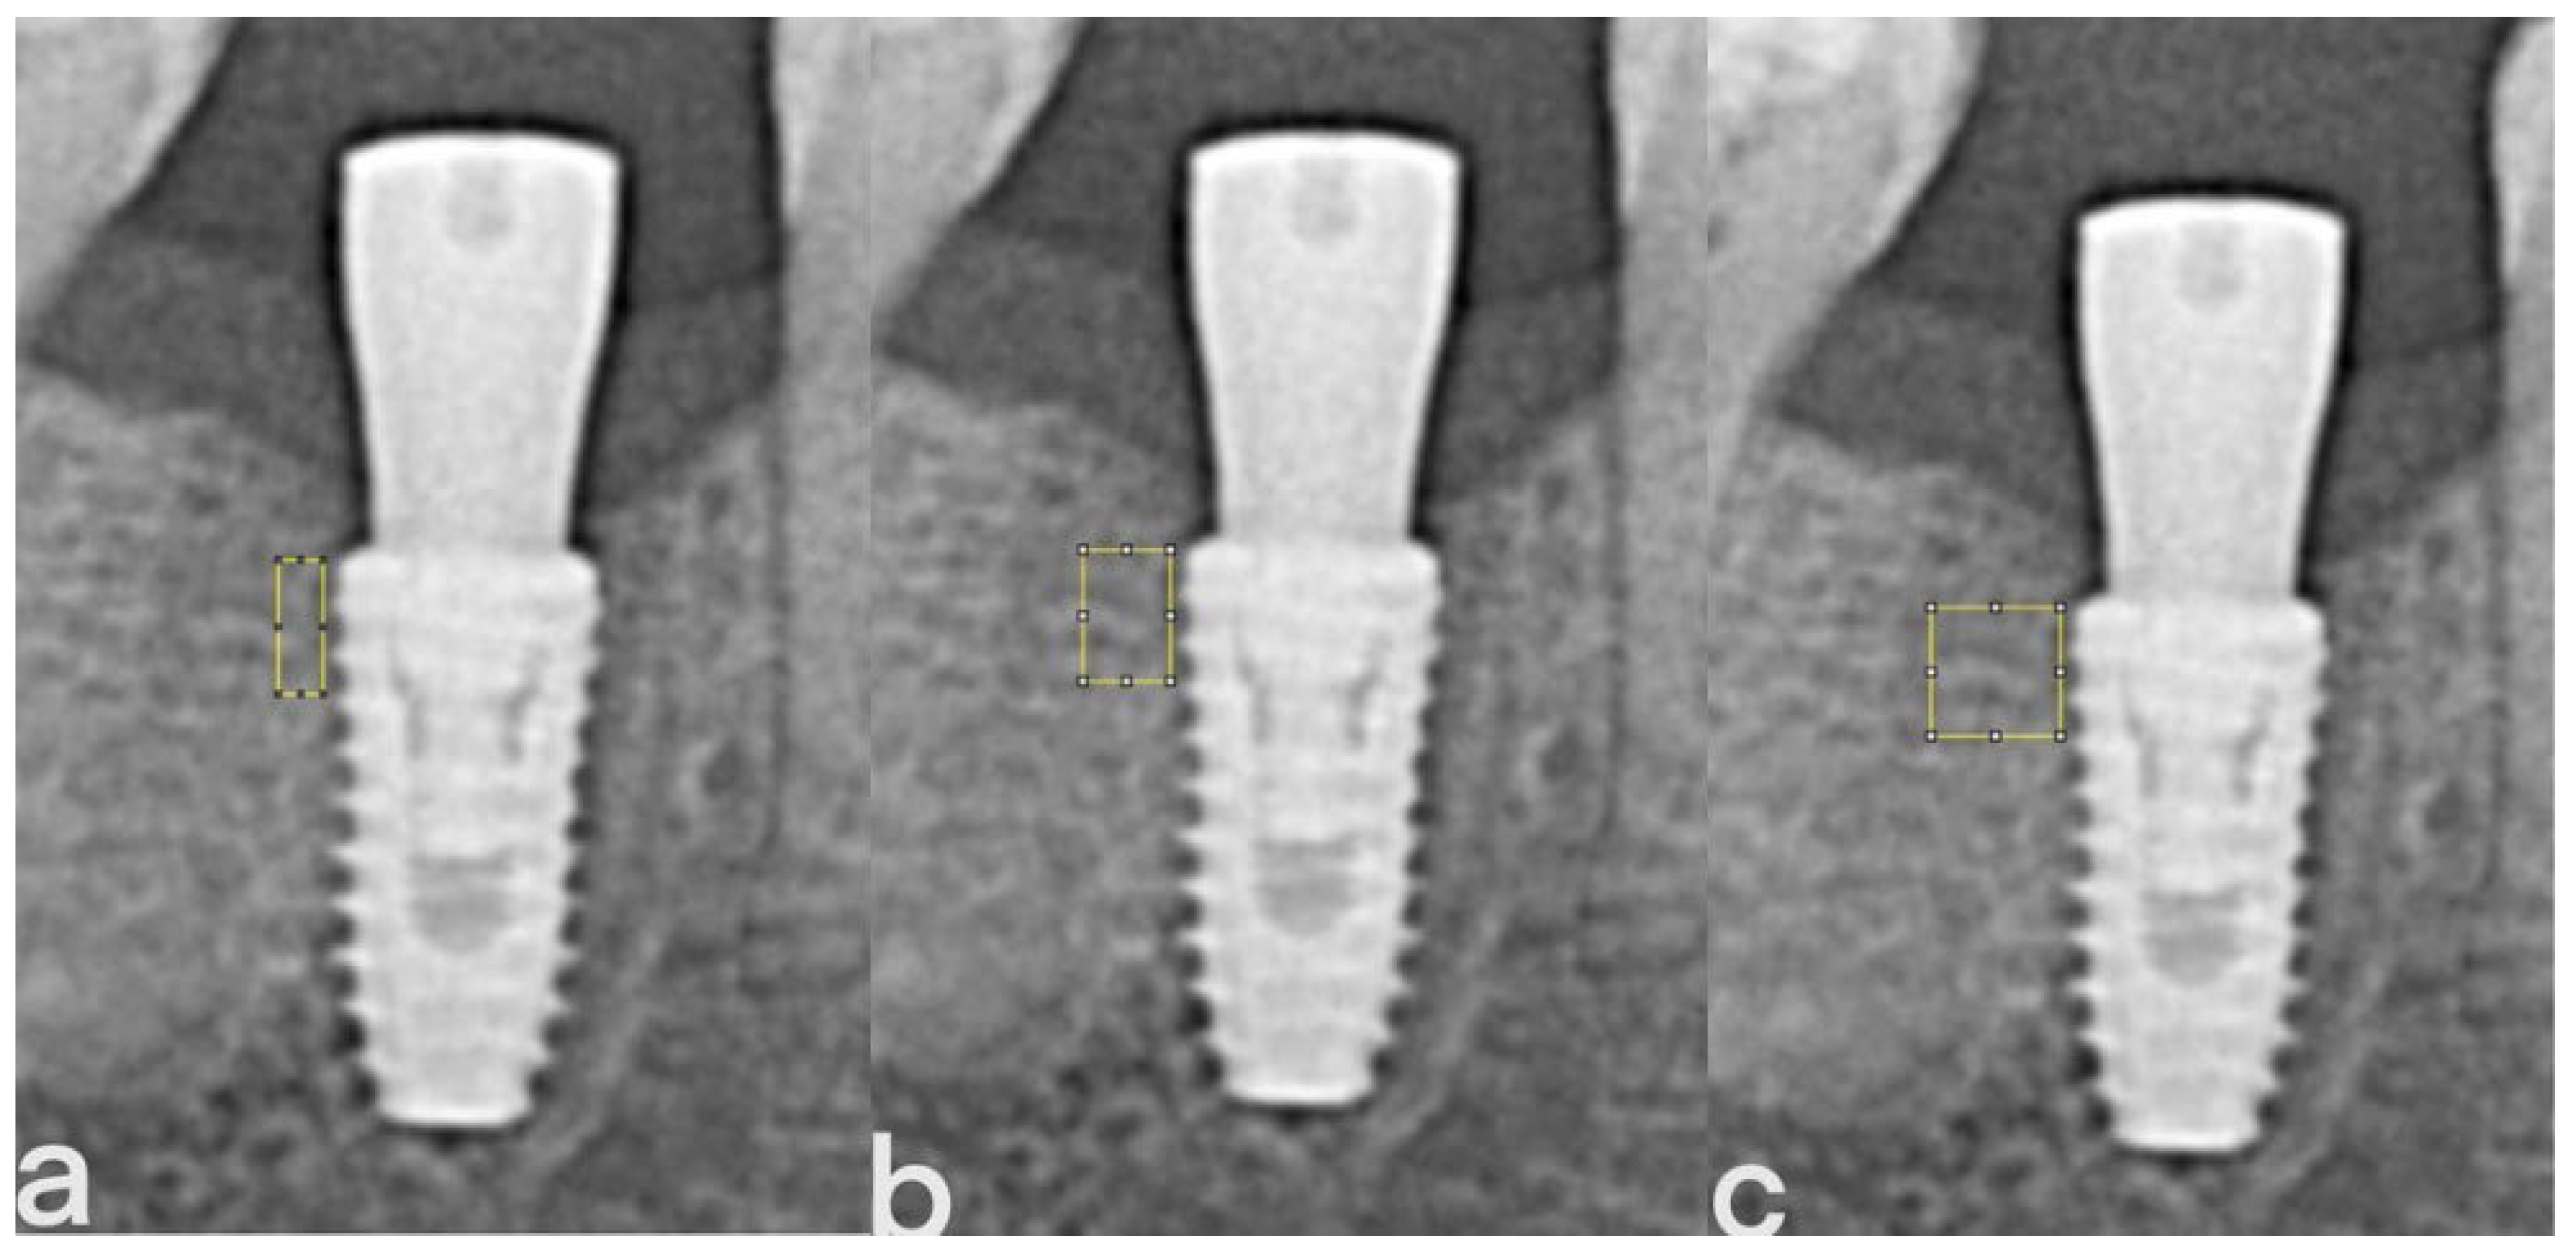
For fractal dimension analysis, standardized rectangular regions of interest (ROIs) were defined on the digital radiographic images in the peri-implant bone area. The reference point for ROI placement was defined as the first bone–implant contact at the cervical (neck) region of the implant. From this reference point, the ROIs were positioned apically along the implant surface. For FMD1, the ROI was positioned starting from the first bone–implant contact at the implant neck and extending 30 pixels apically along the implant axis, with a horizontal width of 10 pixels. For FMD2, a rectangular ROI with a size of 30 × 20 pixels was defined in the same peri-implant region, apical to the first bone–implant contact. For FMD3, a rectangular ROI with a size of 30 × 30 pixels was defined in the same peri-implant region, apical to the first bone–implant contact. All ROIs were placed parallel to the long axis of the implant and were selected to avoid anatomical structures and image artifacts. Fractal dimension calculations were performed using the same image processing protocol for all measurements (Figure 1). Based on the digital resolution of the panoramic images, the vertical dimension of 30 pixels corresponded approximately to 3 mm of peri-implant bone surrounding the implant neck. From a biomechanical perspective, resonance frequency analysis (RFA) primarily reflects the stiffness of the crestal peri-implant bone region located within the first few millimeters around the implant neck. Therefore, the vertical dimension of the ROI was kept constant to represent this biomechanically relevant region. Only the horizontal width of the ROI was varied (10–30 pixels) in order to investigate the influence of ROI scale on fractal dimension measurements while maintaining the same anatomical region.
Figure 1.
Representative panoramic radiographs demonstrating the placement of rectangular regions of interest (ROIs) with three different horizontal widths used for fractal dimension analysis around the implant. (a) FMD1 (30 × 10-pixel), (b) FMD2 (30 × 20-pixel), and (c) FMD3 (30 × 30-pixel).
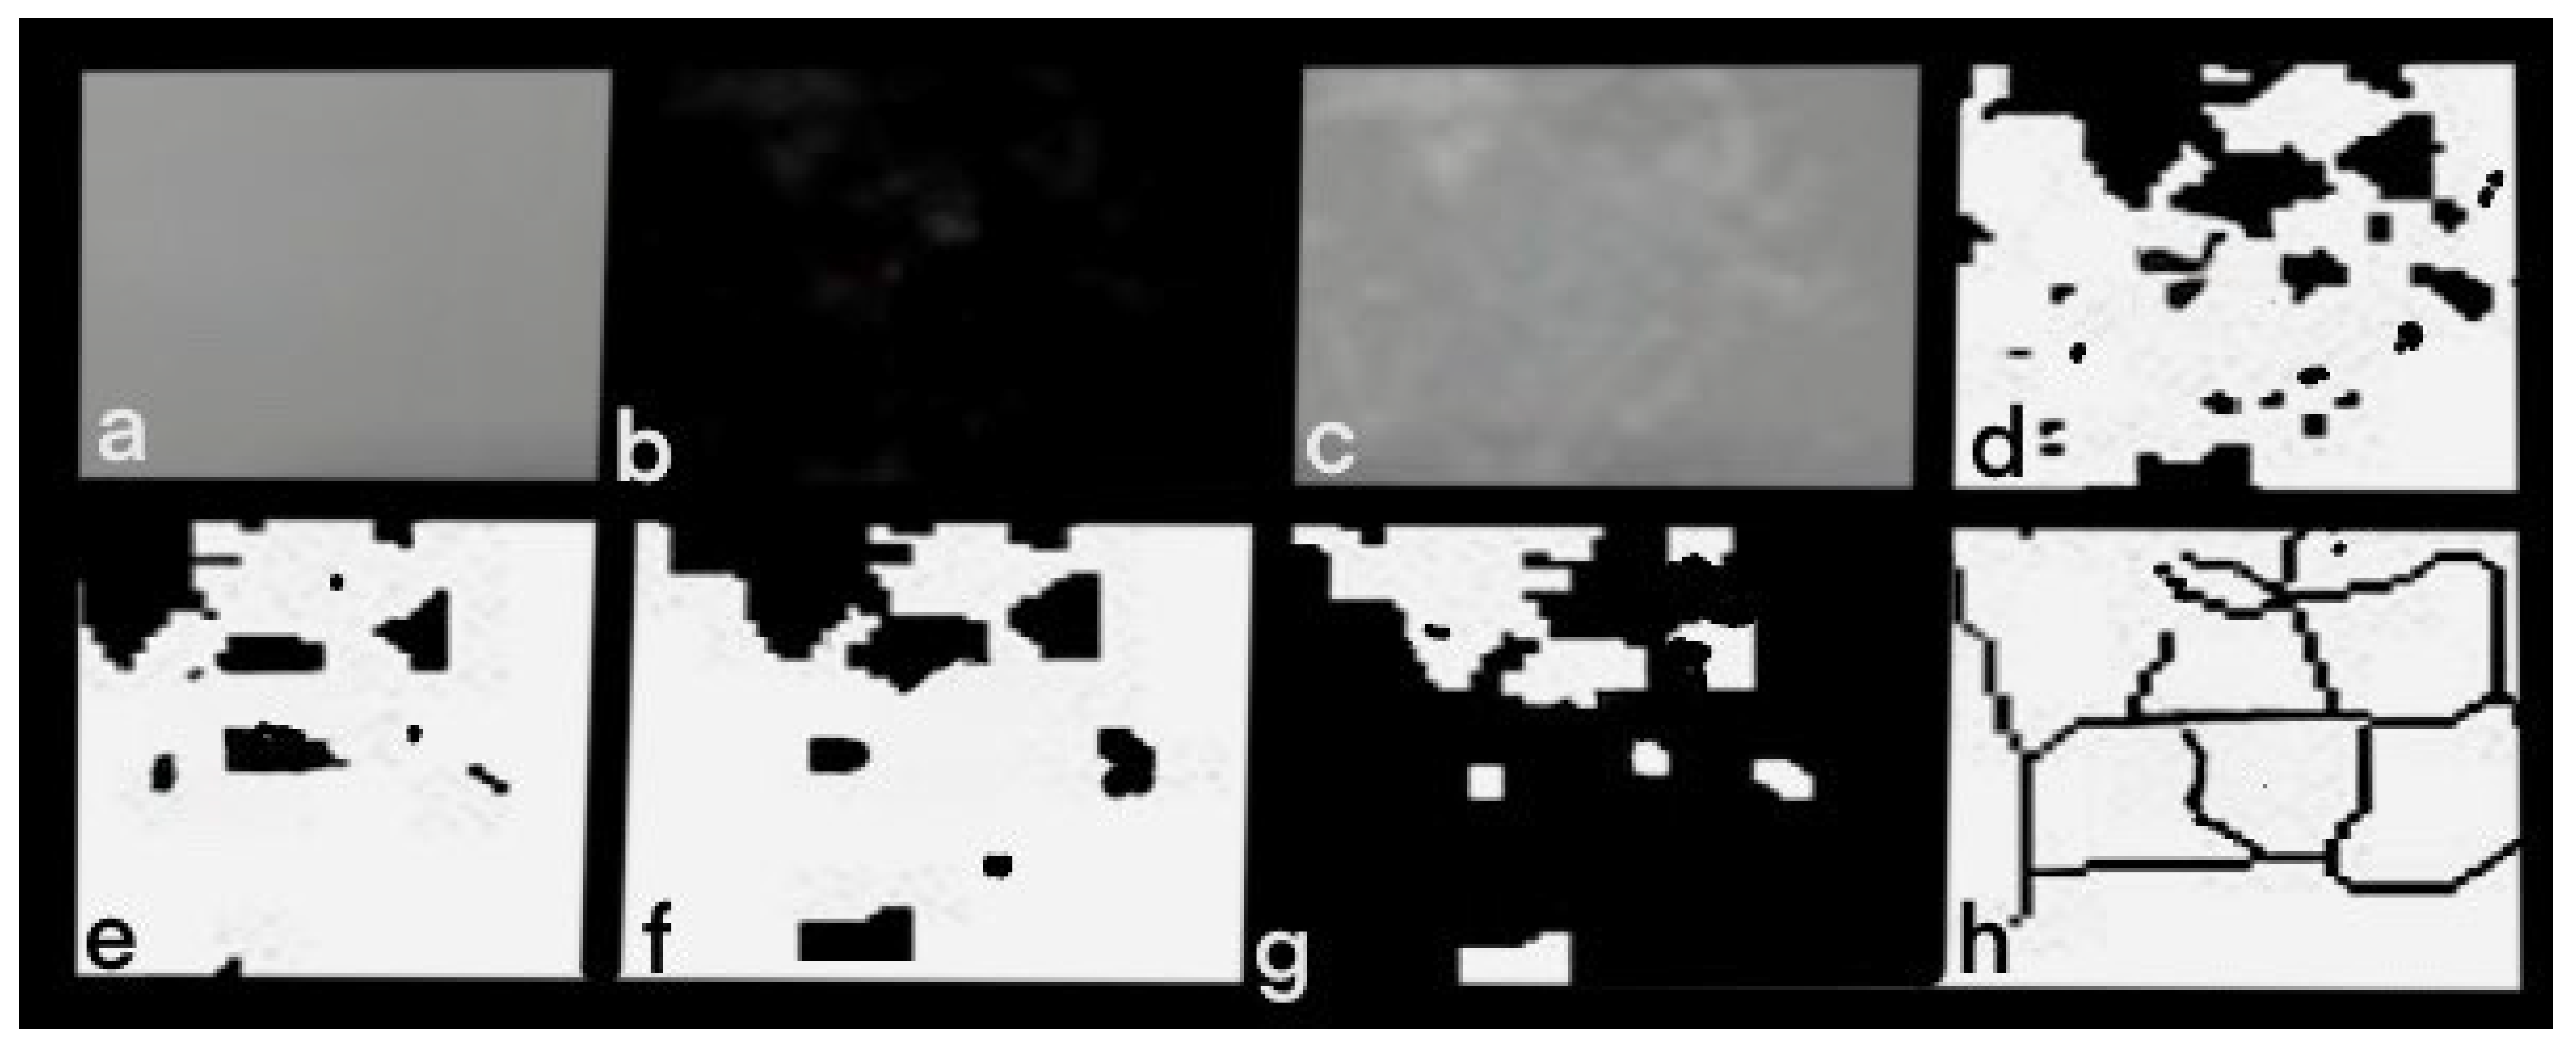
To ensure methodological rigor and standardization, fractal analysis in the present study followed the image-processing framework described by White and Rudolph [23]. The following procedures were applied for FA:
- The selected region was saved in 8-bit format.
- A Gaussian filter (sigma = 35 pixels) was applied to a duplicated image. The Gaussian filter parameter (sigma = 35 pixels) was selected in accordance with the fractal analysis protocol originally described by White and Rudolph [23]. This filtering step reduces low-frequency variations and enhances the visibility of the trabecular pattern before binarization and skeletonization, thereby improving the reliability of fractal dimension calculations.
- The filtered image was subtracted from the original image.
- A value of 128 was added to each pixel.
- The resulting image was binarized at a brightness threshold of 128.
- Erosion and dilation were applied to reduce image noise.
- The image was then inverted and skeletonized, leaving only the central parts of the trabeculae.
- Finally, an FA was performed on the skeletonized image using the box-counting function in ImageJ (version 1.54g, National Institutes of Health, Bethesda, MD, USA) (Figure 2).
Figure 2.
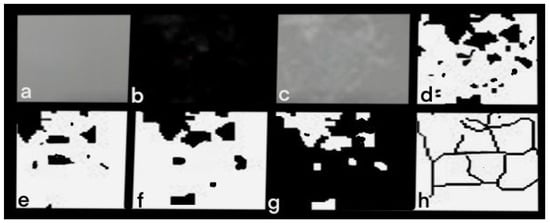
The image-processing workflow consisted of the following standardized steps in order to enhance trabecular patterns for fractal analysis: (a) Blurring; (b) removal of the blurred image from the original image; (c) addition of 128 gray values; (d) conversion of image to black and white; (e) noise reduction with Erode; (f) expansion with Dilate; (g) inversion of the colors; (h) conversion to skeleton format.
2.4. Intra-Observer Reliability
Intraclass correlation coefficient (ICC) analysis was performed to assess the intra-observer reliability of the fractal dimension measurements. Regions of interest (ROIs) were re-selected and re-analyzed in a randomly selected subset of 20 radiographic images after a two-week interval by the same examiner. ROI placement and fractal analysis were performed without knowledge of the corresponding ISQ values in order to minimize measurement bias. Reliability was evaluated using a two-way random-effects model with absolute agreement and single measurements (ICC (2,1)). The intra-observer ICC was 0.87, indicating good agreement.
2.5. Sample Size Determination
The sample size in this study was determined based on the findings of a previous investigation titled “Peri-implant bone microstructural analysis and comparison of resonance frequency analysis before prosthetic placement: a retrospective study” [22].
In that study, the relationship between peri-implant bone microstructure (evaluated by FA) and implant stability (measured by RFA) was assessed, and the reported effect size guided our estimation. According to the effect magnitude and variability described in the aforementioned research, the minimum number of participants required to achieve a power of 80% at a two-tailed significance level of α = 0.05 was calculated. To enhance statistical reliability, account for the retrospective nature of the study, and minimize the risk of data loss or exclusions, we intentionally selected a sample size approximately 30% greater than the calculated minimum. Accordingly, our final sample consisted of 65 patients. The sample size estimation was based on assumptions derived from previously published fractal analysis studies. However, due to the exploratory and multilevel nature of the correlation analyses with subsequent correction for multiple comparisons, the study was not specifically powered to detect small effect sizes across all ROI levels.
2.6. Statistical Analysis
Statistical analyses were performed using IBM SPSS Statistics (ver. 23.0, IBM Corp., Armonk, NY, USA) and R software (version 4.3.1; R Foundation for Statistical Computing, Vienna, Austria). Continuous variables were summarized as mean ± standard deviation. The normality of the data distribution was assessed using the Shapiro–Wilk test. The relationships between implant stability (ISQ) and fractal dimension measurements (FMD1, FMD2, and FMD3) were evaluated using Pearson’s correlation coefficient for normally distributed variables. When the assumption of normality was not met for fractal dimension measurements, Spearman’s rank correlation analysis was additionally performed. Because correlations were examined across three ROI configurations (FMD1–FMD3), a Bonferroni correction was applied to account for multiple comparisons. Adjusted p-values were calculated by multiplying the original p-values by the number of comparisons. To evaluate the independent association between ISQ and each fractal dimension parameter (FMD1, FMD2, and FMD3), separate multiple linear regression models were constructed. Age and sex were included in the models as potential confounding variables. Model assumptions were assessed using standard residual diagnostics. All statistical tests were two-tailed, and a p-value < 0.05 was considered statistically significant.
3. Results
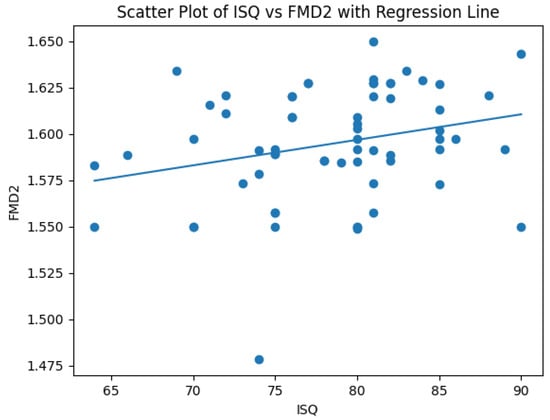
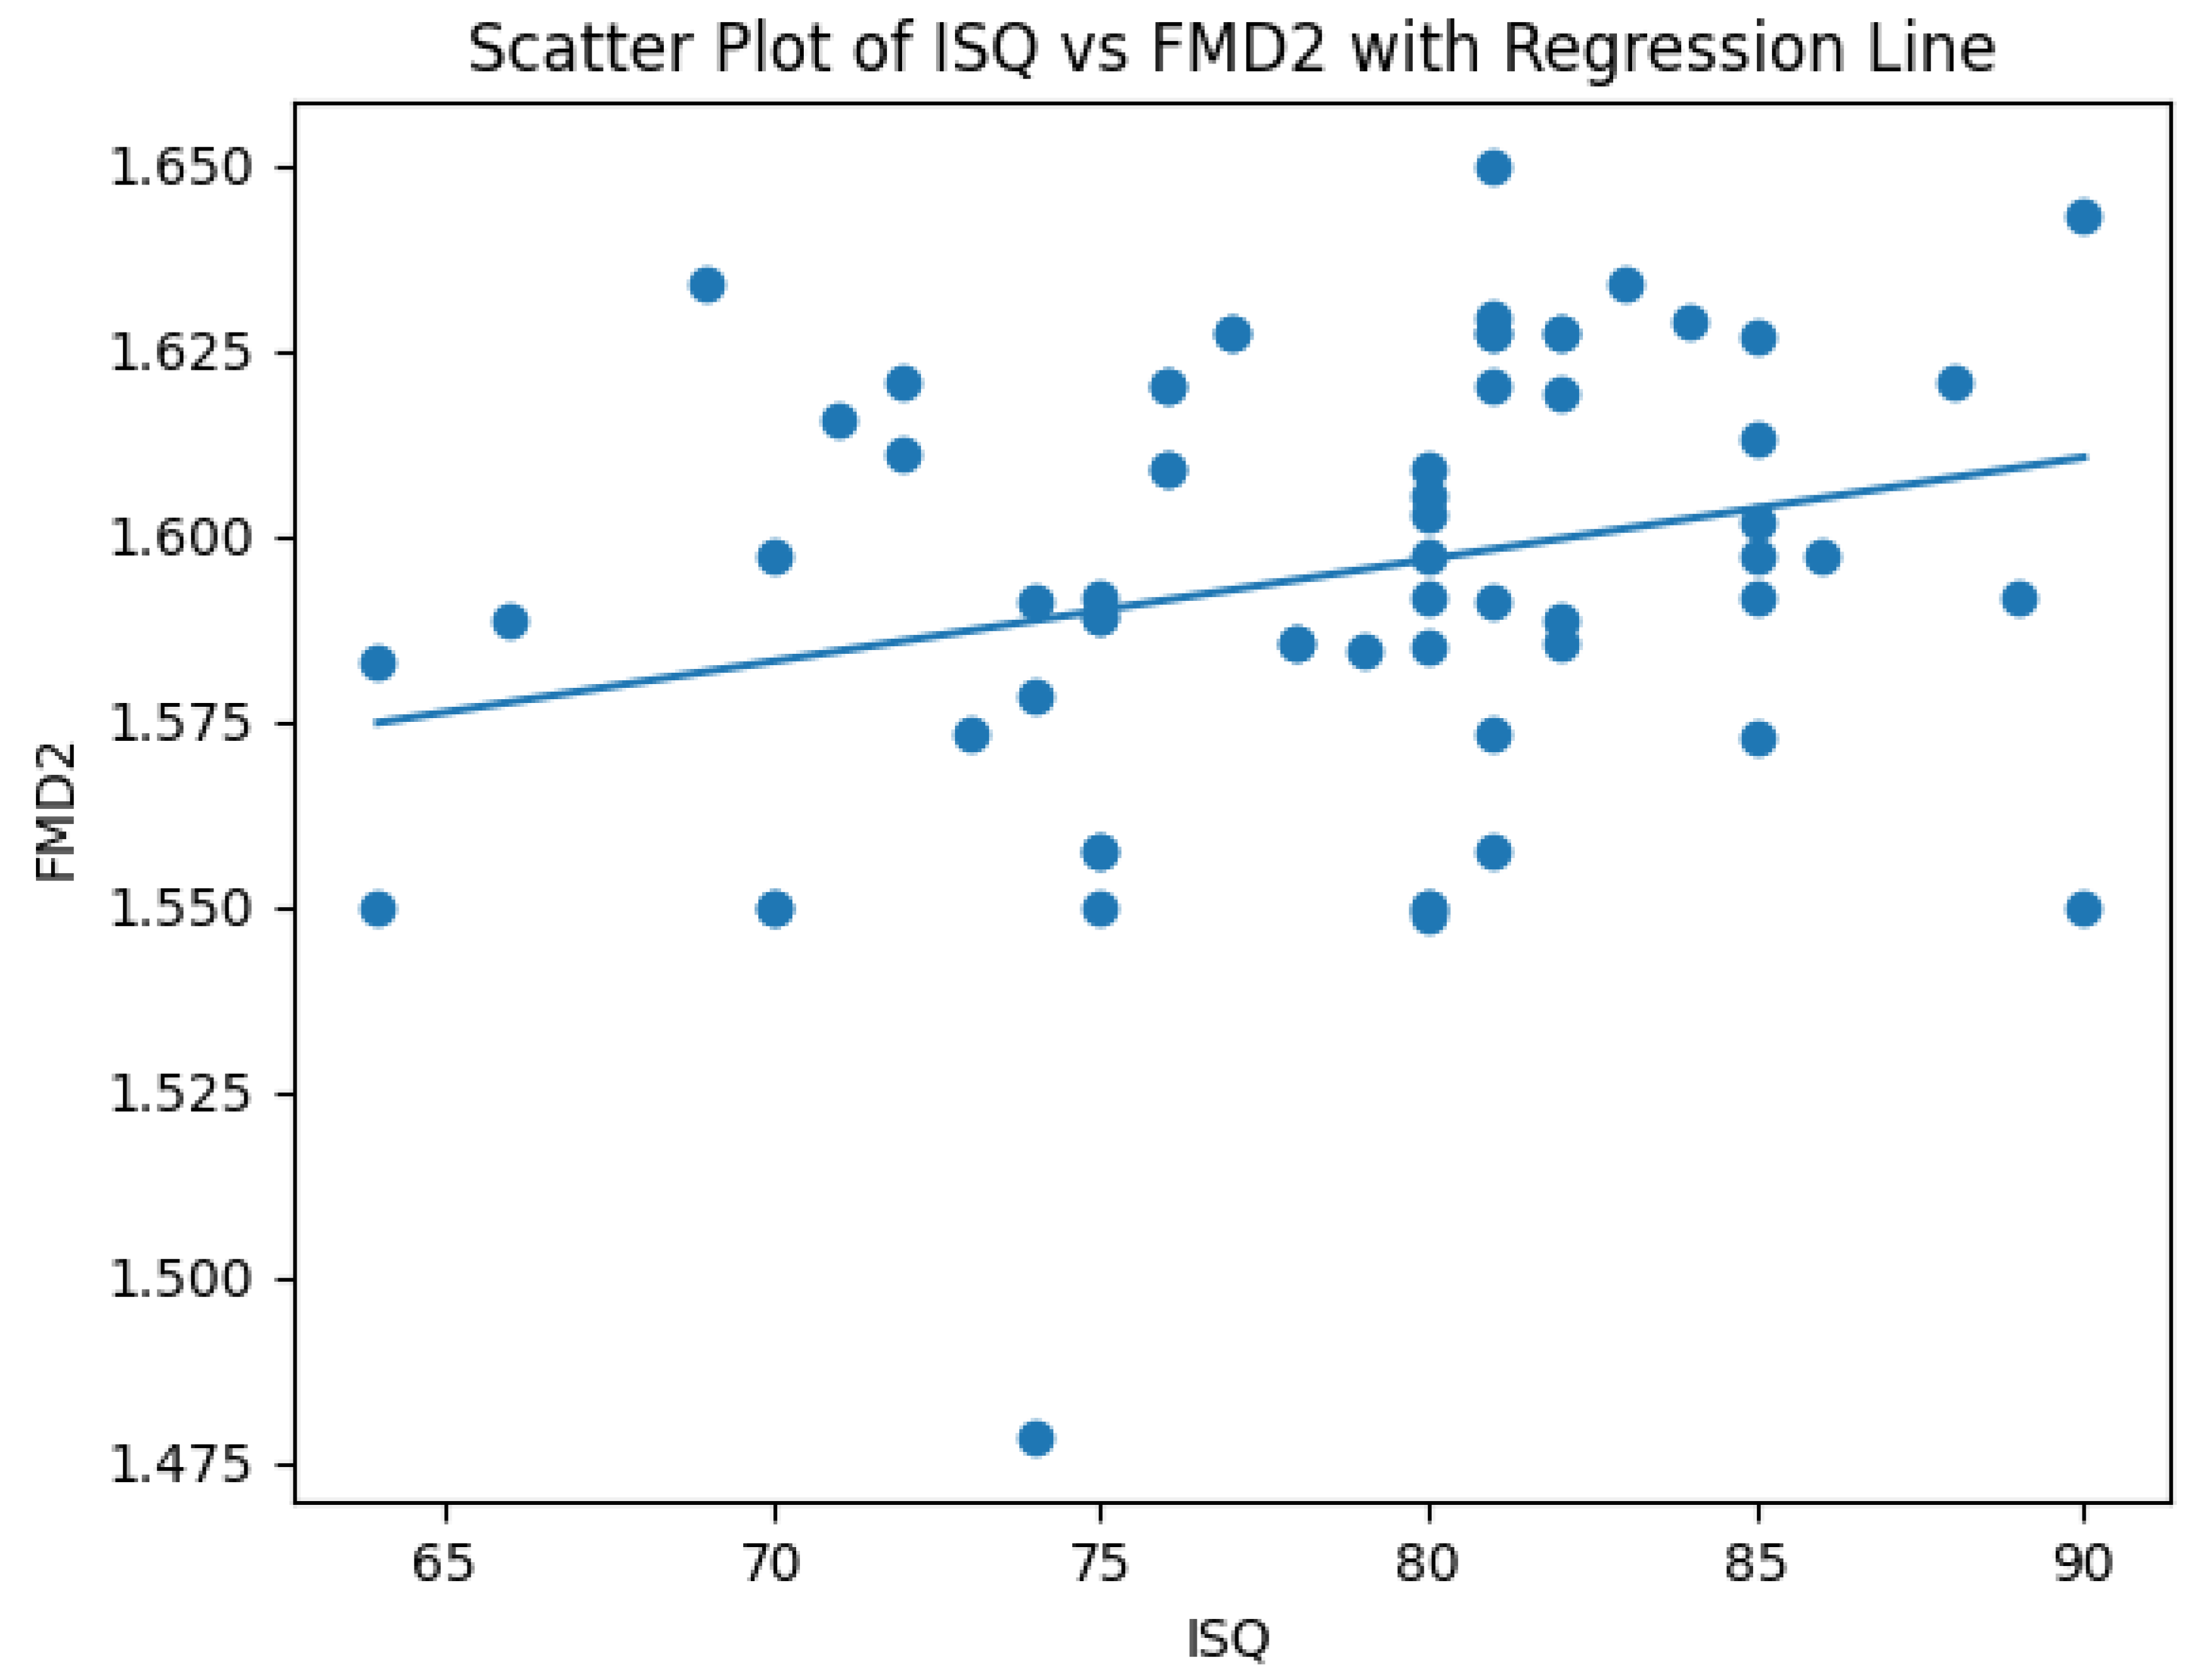
A total of 65 patients were included in the study. The mean age of the participants was 50.0 ± 9.9 years, and the mean ISQ value was 78.6 ± 5.9. The intra-observer reliability of the fractal dimension measurements was good (ICC (2,1) = 0.87). The descriptive statistics of the fractal dimension measurements were as follows: FMD1: 1.466 ± 0.055, FMD2: 1.595 ± 0.031, FMD3: 1.655 ± 0.046 (Table 1). Assessment of data distribution showed that ISQ was normally distributed (Shapiro–Wilk test, p = 0.145), whereas FMD1, FMD2 and FMD3 showed significant deviations from normality (p = 0.049, p = 0.002 and p = 0.001, respectively). When the relationships between ISQ and fractal dimension measurements were evaluated, a weak and statistically non-significant correlation was found between ISQ and FMD1 (Pearson r = 0.214, p = 0.086). A weak but statistically significant positive correlation was observed between ISQ and FMD2 (Pearson r = 0.260, 95% CI: 0.02–0.47, p = 0.036). After Bonferroni correction, the correlation between ISQ and FMD2 did not remain statistically significant. No statistically significant correlation was detected between ISQ and FMD3 (Pearson r = 0.159, p = 0.206). Because the fractal dimension variables were not normally distributed, additional analyses were performed using Spearman’s rank correlation. Consistent with the Pearson results, only the correlation between ISQ and FMD2 remained statistically significant (Spearman ρ = 0.298, p = 0.016), whereas the correlations between ISQ and FMD1 and between ISQ and FMD3 were not significant (p > 0.05) (Table 2). The relationship between ISQ and FMD2 is visually illustrated in the scatter plot with a regression line (Figure 3). In the multiple linear regression analysis performed to account for the potential confounding effects of age and sex, the effect of ISQ on FMD1 was borderline but not statistically significant (β = 0.0023, 95% CI: −0.0001 to 0.0049, p = 0.063). In contrast, ISQ was identified as an independent predictor of FMD2 (β = 0.0016, 95% CI: 0.0003 to 0.0029, p = 0.015). For FMD3, ISQ was not an independent predictor (p = 0.278). Age and sex did not show a statistically significant effect on any of the fractal dimension measurements in the regression models (all p > 0.05).
Table 1.
Descriptive Statistics of Study Variables (N = 65).
Table 2.
Pearson and Spearman Correlation Coefficients Between ISQ and FMD Parameters.
Figure 3.
Relationship between ISQ and FMD2. Scatter plot illustrating the relationship between implant stability quotient (ISQ) values and fractal dimension measurements obtained from the 30 × 20 pixel ROI configuration (FMD2). The regression line demonstrates the weak positive association between the two variables.
4. Discussion
This study was designed to investigate the ROI pixel configuration that may best reflect implant stability assessed by resonance frequency analysis in fractal dimension analysis performed on panoramic radiographs. The findings of the present study showed that, among the three different ROI sizes defined in the cervical peri-implant region, only the 30 × 20-pixel configuration (FMD2) demonstrated a statistically significant, yet weak, association with ISQ values. This association remained after adjustment for age and sex. In contrast, no significant relationship was observed between implant stability and the fractal dimension measurements obtained from the smaller (30 × 10-pixel) and larger (30 × 30-pixel) ROIs.
These results suggest that fractal dimension measurements derived from panoramic radiographs may have the potential to reflect implant stability; however, the observed association appears to be limited and weak and therefore should be interpreted with caution. The weak magnitude of the observed correlation (r = 0.260) indicates that fractal analysis derived from panoramic radiographs cannot be considered a standalone clinical indicator of implant stability. Similarly, the regression coefficient for ISQ predicting FMD2 (β = 0.0016) indicates a very small effect size, suggesting that changes in implant stability are associated with only minimal variations in fractal dimension values. From a clinical perspective, the magnitude of this regression coefficient suggests that even relatively large variations in ISQ values would correspond to only minimal changes in fractal dimension measurements. Therefore, although a statistical association was detected, the practical clinical relevance of this relationship appears to be limited. These findings further support the interpretation that fractal analysis should be considered a complementary radiographic descriptor of peri-implant bone structure rather than a clinically predictive indicator of implant stability. These findings indicate that although the association reached statistical significance before correction, its magnitude is limited and may not represent a clinically meaningful relationship. Implant stability is influenced by multiple biological and biomechanical factors, including bone density, cortical thickness, implant macro-design, and the degree of bone–implant contact (BIC). Radiographic fractal analysis reflects only the radiomorphometric characteristics of trabecular bone and therefore captures only a limited aspect of the osseointegration process. Consequently, the present findings should be interpreted as evidence that fractal analysis may provide supplementary radiographic information rather than serving as a direct decision-making tool for implant loading or clinical stability assessment. In addition, the findings indicate that the size of the selected ROI may influence fractal analysis outcomes, and that an intermediate pixel area may provide a more suitable approach for evaluating peri-implant bone microstructure. A substantial body of literature has utilized RFA to assess implant stability in both mandibular and maxillary sites, consistently demonstrating its utility as a non-invasive approach for monitoring the osseointegration process. Previous studies have reported that mandibular implants often exhibit higher ISQ values, which have been attributed to differences in cortical bone density and biomechanical characteristics between anatomical regions. Within this context, the use of RFA in the present study provides a well-established reference framework against which radiographic texture-based measurements can be methodologically explored, rather than serving as a standalone indicator of clinical outcome [24,25,26,27]. Previous studies have reported that mandibular implants tend to present higher ISQ values during the secondary stability phase, commonly within the range of approximately 75 to 85, whereas maxillary implants have been associated with comparatively lower ISQ values, often reported between 65 and 78. The restriction of the analysis to posterior mandibular implants represents a methodological decision aimed at reducing anatomical superimposition and improving the reliability of radiographic texture assessment. However, this approach may limit the external validity of the findings. Bone structure in the maxilla is typically characterized by lower cortical thickness and a more porous trabecular architecture compared with the mandible. Consequently, the relationships between fractal dimension measurements and implant stability observed in the present study may not be directly generalizable to maxillary implant sites. Future investigations, including both maxillary and mandibular regions, may help clarify whether ROI-dependent fractal dimension behavior remains consistent across different bone qualities. These ranges provide contextual background from the existing literature rather than serving as reference thresholds for the present analysis [18,28,29]. The relatively high ISQ values observed across participants are consistent with previously reported patterns of secondary implant stability at comparable postoperative time points. Prior studies have indicated that secondary stability tends to increase between approximately 6 and 12 weeks following implant placement, a process commonly attributed to ongoing mineralization and structural reorganization at the bone–implant interface [25,30]. In line with previous reports, the present study observed relatively high implant stability in the mandible, with a mean ISQ value of 78.6 ± 5.9 at the three-month follow-up. This observation is consistent with earlier studies reporting higher RFA measurements in mandibular sites and reflects the anatomical and biomechanical characteristics commonly described for this region, rather than serving as independent evidence of enhanced osseointegration.
In dentistry, FA has been shown to quantitatively detect alterations in the alveolar bone as well as changes in the trabecular architecture of the mandibular condyle in patients with temporomandibular joint disorders. Over the past decade, the application of FA in dental research and clinical practice has expanded substantially. Because quantitative evaluation of trabecular bone is essential across various dental specialties, FA has become an increasingly valuable tool, particularly due to its compatibility with routinely acquired dental imaging modalities such as panoramic and periapical radiographs [31]. Fractal analysis performed on panoramic radiographs has been increasingly explored in implant-related research as a radiographic approach for characterizing peri-implant bone texture. Panoramic radiographs were selected in the present study because they offer low radiation exposure and are routinely acquired in standard implant workflows, providing a practical and accessible imaging source for radiomorphometric evaluation. Nevertheless, an inherent limitation of fractal analysis performed on panoramic radiographs is that a complex three-dimensional trabecular architecture is projected onto a two-dimensional image. As a result, subtle spatial variations in trabecular orientation and connectivity may not be fully represented in the radiographic texture pattern. Therefore, fractal dimension values obtained from panoramic images should be interpreted as indirect radiomorphometric indicators rather than direct representations of the true three-dimensional bone microstructure. Advanced imaging modalities such as cone-beam computed tomography or micro-computed tomography may provide more detailed volumetric information about trabecular architecture and could further improve the understanding of the relationship between bone microstructure and implant stability in future studies. Their wide field of view allows consistent visualization of the peri-implant trabecular pattern, enabling methodologically comparable FA assessments without the need for additional imaging modalities [32]. In line with this, Öztürk and Kış reported that higher fractal dimension values measured on panoramic radiographs were associated with peri-implant bone characteristics and implant stability in their study population, and suggested that FD values above a certain range may reflect more organized trabecular patterns. These observations provide contextual support from the existing literature for considering fractal analysis as a complementary radiomorphometric approach in implant-related research, rather than defining specific clinical thresholds [22]. Related findings have been reported by Öztürk and Kış, who observed that higher early-phase fractal dimension values were associated with implant-related outcomes in their study population, with mean FD values of 1.13 ± 0.19 reported during the 2–3-month follow-up period. These observations suggest that early trabecular patterns captured by fractal analysis may reflect aspects of peri-implant bone organization described in the literature, without implying prognostic or survival-related conclusions within the context of the present study [33]. Similarly, Yurtoğlu et al. reported peri-implant fractal dimension values of 1.49 ± 0.15 measured three months after implant placement. These findings indicate that early-phase FD measurements around implants fall within ranges commonly reported in the literature and may be descriptively associated with trabecular patterns observed during the osseointegration period, without implying direct biological or clinical interpretation in the context of the present study [20]. Furthermore, Abdulhameed et al. reported that lower fractal dimension values were associated with reduced implant stability in their study population, highlighting a potential relationship between radiographic bone texture and implant-related outcomes [34]. In the present study, fractal dimension values calculated from the peri-implant region demonstrated a consistent pattern across all incremental measurement levels. The mean fractal dimension values were 1.466 ± 0.055 for FMD1, 1.595 ± 0.031 for FMD2, and 1.655 ± 0.046 for FMD3. These measurements describe a gradual increase in fractal dimension with incremental ROI expansion and fall within ranges commonly reported in previous studies evaluating peri-implant bone microarchitecture using fractal analysis, without implying clinical thresholds or predictive significance.
Given these observations, an important methodological consideration emerges regarding whether variation in ROI width may influence the relationship between fractal dimension and implant stability—a question that constituted a central focus of the present study. The methodological relevance of this issue is further supported by the work of Jolley et al., who demonstrated that variations in radiographic acquisition parameters—including angulation, tube potential, and exposure—do not result in meaningful changes in fractal dimension values. This finding suggests that discrepancies in FD measurements reported across studies are unlikely to be driven by technical imaging variables, thereby underscoring ROI definition—particularly ROI width and anatomical placement—as a major source of methodological variability in FA outcomes [35]. In previous studies, the use of ROIs selected from different anatomical regions and with varying dimensions—combined with the inclusion of implants with different diameters and from different manufacturers—has resulted in considerable methodological heterogeneity across the literature [19,20,21,22]. This variability indicates that a standardized protocol for assessing implant stability solely through radiographic fractal analysis—without the support of resonance frequency analysis—is not yet available for clinical application. Consequently, drawing reliable clinical inferences regarding implant stability based exclusively on fractal analysis derived from radiographs remains challenging due to methodological inconsistency.
In the present study, we aimed to address this methodological gap by standardizing the vertical dimension of the region of interest and varying only its horizontal width—implemented as incremental, software-defined expansions within the image-analysis framework. This design enabled a controlled evaluation of how ROI scaling influences the detectability of associations between fractal dimension values and implant stability.
An unadjusted analysis revealed a weak association only at the intermediate ROI level (FMD2), whereas no statistically significant associations were observed at the other ROI scales. One possible explanation for this scale-dependent behavior relates to the spatial characteristics of the peri-implant trabecular bone pattern captured within the selected region of interest. Another possible explanation for the disappearance of the association at the largest ROI level (FMD3) relates to the spatial extent of the analyzed bone region. As the ROI expands further from the implant surface, the analysis may progressively include trabecular bone areas that were not directly influenced by surgical trauma or the subsequent bone remodeling process associated with osseointegration. In such cases, the fractal dimension measurement may increasingly reflect the baseline trabecular architecture of the surrounding alveolar bone rather than implant-related structural changes. This phenomenon may partly explain why the correlation between fractal dimension and implant stability diminished at the largest ROI scale. A very narrow ROI, such as the 30 × 10-pixel configuration, may capture only a limited portion of the trabecular network and may therefore be more susceptible to local noise or minor structural irregularities. Conversely, a wider ROI, such as the 30 × 30-pixel configuration, may incorporate bone areas located farther from the immediate implant interface, potentially diluting structural changes associated with implant healing and remodeling. The intermediate ROI size (30 × 20 pixels) may therefore represent a methodological balance that captures a sufficient portion of the peri-implant trabecular architecture while remaining closely related to the biomechanically relevant region surrounding the implant neck. This pattern suggests that ROI width represents a critical methodological parameter in FA-based evaluations and that scale-dependent effects may influence whether relationships between radiographic bone texture and implant stability become detectable. Accordingly, the present study may contribute to the development of a more standardized and reproducible framework for integrating fractal analysis into implant-related assessments—while cautioning against the attribution of biological or clinical significance to absolute ROI dimensions defined by image-processing software. Future longitudinal studies incorporating multiple observation time points and more advanced statistical modeling may benefit from standardized incremental ROI approaches to better characterize the temporal evolution of peri-implant bone architecture and its relationship with implant stability.
5. Conclusions
In conclusion, although fractal dimension analysis performed on panoramic radiographs using an appropriately selected ROI may provide supplementary information on peri-implant bone characteristics related to implant stability, the weak nature of the observed associations indicates that radiographic fractal analysis alone cannot reliably predict implant stability and should be considered only as an adjunctive, not a substitute, tool to RFA.
6. Limitations
This study has several limitations that should be acknowledged when interpreting the findings. First, all analyses were restricted to mandibular implants, which may limit the extrapolation of the results to maxillary sites, where bone quality and trabecular architecture differ. Second, although the use of implants with the same brand and diameter enhanced methodological consistency, it precluded the evaluation of potential influences related to implant macro-design or surface characteristics.
Third, fractal analysis was performed on two-dimensional radiographic images, which provide only an indirect representation of trabecular architecture and do not capture three-dimensional structural complexity. In addition, ROI selection was limited to a fixed vertical dimension and a predefined range of horizontal widths; therefore, the potential effects of alternative ROI geometries or volumetric assessments were not explored.
Moreover, measurements were obtained only in the mesiodistal direction, which may not fully reflect the spatial complexity of peri-implant bone microstructure. The cross-sectional design with a single postoperative observation time point at three months, together with the moderate sample size, precludes assessment of the temporal dynamics of osseointegration and limits causal inference regarding changes in implant stability over time.
Although strict inclusion and exclusion criteria were applied to minimize biological confounding, this approach may reduce external validity and limit the generalizability of the findings to broader clinical populations. In addition, potentially relevant factors such as regional differences in bone quality, drilling protocols, and prosthetic loading conditions were not incorporated into the study design and therefore could not be controlled.
Future studies incorporating three-dimensional imaging modalities, multiple follow-up intervals and different implant systems are warranted to further clarify the relationship between peri-implant bone fractal characteristics and implant stability.
Author Contributions
D.D.Ü. conceived the research hypothesis and designed the study. D.D.Ü. performed the data analysis and prepared the figures. R.B. contributed to data acquisition. D.D.Ü., N.Ç. and B.S.İ. drafted and finalized the manuscript. All authors have read and agreed to the published version of the manuscript.
Funding
This study was not financially supported by any organization.
Institutional Review Board Statement
The study was conducted in accordance with the Declaration of Helsinki and approved by the Harran University Clinical Research Ethics Committee (Approval No. 07/10/2024-15; approval date: 7 October 2024).
Informed Consent Statement
Informed consent for participation was obtained from all subjects involved in the study.
Data Availability Statement
The data presented in this study are available on request from the corresponding author.
Conflicts of Interest
The authors have no conflicts of interest to disclose.
Abbreviations
The following abbreviations are used in this manuscript:
| FD | Fractal Dimension |
| FA | Fractal Analysis |
| ROI | Region of Interest |
| RFA | Resonance Frequency Analysis |
| ISQ | Implant Stability Quotient |
| FMD1–FMD3 | Fractal Dimension measurements derived from ROIs of increasing widths (10–30 pixels) |
| T0 | Baseline time point (immediately after implant placement or initial reference time depending on study context) |
| T1 | Three-month postoperative measurement time point |
References
- French, D.; Ofec, R.; Levin, L. Long term clinical performance of 10 871 dental implants with up to 22 years of follow-up: A cohort study in 4247 patients. Clin. Implant Dent. Relat. Res. 2021, 23, 289–297. [Google Scholar] [CrossRef] [Scilit]
- Hjalmarsson, L.; Gheisarifar, M.; Jemt, T. A systematic review of survival of single implants as presented in longitudinal studies with a follow-up of at least 10 years. Eur. J. Oral Implantol. 2016, 9, S155–S162. [Google Scholar]
- Parithimarkalaignan, S.; Padmanabhan, T.V. Osseointegration: An update. J. Indian Prosthodont. Soc. 2013, 13, 2–6. [Google Scholar] [CrossRef] [Scilit]
- Swami, V.; Vijayaraghavan, V.; Swami, V. Current trends to measure implant stability. J. Indian Prosthodont. Soc. 2016, 16, 124–130. [Google Scholar] [CrossRef] [Scilit]
- Friberg, B.; Sennerby, L.; Meredith, N.; Lekholm, U. A comparison between cutting torque and resonance frequency measurements of maxillary implants: A 20-month clinical study. Int. J. Oral Maxillofac. Surg. 1999, 28, 297–303. [Google Scholar] [CrossRef] [Scilit]
- Gupta, R.K.; Padmanabhan, T.V. Resonance frequency analysis. Indian J. Dent. Res. 2011, 22, 567–573. [Google Scholar] [CrossRef] [Scilit] [PubMed]
- Lindh, C.; Oliveira, G.H.; Leles, C.R.; do Carmo Matias Freire, M.; Ribeiro-Rotta, R.F. Bone quality assessment in routine dental implant treatment among Brazilian and Swedish specialists. Clin. Oral Implant. Res. 2014, 25, 1004–1009. [Google Scholar] [CrossRef] [Scilit] [PubMed]
- Quesada-García, M.P.; Prados-Sánchez, E.; Olmedo-Gaya, M.V.; Muñoz-Soto, E.; González-Rodríguez, M.P.; Valllecillo-Capilla, M. Measurement of dental implant stability by resonance frequency analysis: A review of the literature. Med. Oral Patol. Oral Cir. Bucal 2009, 14, e538–e546. [Google Scholar] [CrossRef] [Scilit] [PubMed]
- Comuzzi, L.; Tumedei, M.; D’Arcangelo, C.; Piattelli, A.; Iezzi, G. An In Vitro Analysis on Polyurethane Foam Blocks of the Insertion Torque (IT) Values, Removal Torque Values (RTVs), and Resonance Frequency Analysis (RFA) Values in Tapered and Cylindrical Implants. Int. J. Environ. Res. Public Health 2021, 18, 9238. [Google Scholar] [CrossRef] [Scilit]
- Halldin, A.; Jimbo, R.; Johansson, C.B.; Wennerberg, A.; Jacobsson, M.; Albrektsson, T.; Hansson, S. The effect of static bone strain on implant stability and bone remodeling. Bone 2011, 49, 783–789. [Google Scholar] [CrossRef] [Scilit]
- Monje, A.; Ravidà, A.; Wang, H.L.; Helms, J.A.; Brunski, J.B. Relationship Between Primary/Mechanical and Secondary/Biological Implant Stability. Int. J. Oral Maxillofac. Implant. 2019, 34, s7–s23. [Google Scholar] [CrossRef] [Scilit]
- Ersanli, S.; Karabuda, C.; Beck, F.; Leblebicioglu, B. Resonance frequency analysis of one-stage dental implant stability during the osseointegration period. J. Periodontol. 2005, 76, 1066–1071. [Google Scholar] [CrossRef] [Scilit]
- Brouwers, J.; Buis, S.; de Groot, P.G.; de Laat, B.; Remijn, J.A. Resonance frequency analysis with two different devices after conventional implant placement with ridge preservation: A prospective pilot cohort study. Clin. Implant Dent. Relat. Res. 2021, 23, 789–799. [Google Scholar] [CrossRef] [Scilit]
- Olmedo-Gaya, M.V.; Romero-Olid, M.N.; Ocaña-Peinado, F.M.; Vallecillo-Rivas, M.; Vallecillo, C.; Reyes-Botella, C. Influence of different surgical techniques on primary implant stability in the posterior maxilla: A randomized controlled clinical trial. Clin. Oral Investig. 2023, 27, 3499–3508. [Google Scholar] [CrossRef] [Scilit]
- Jenner, A.; Sabatini, G.P.; Abou-Ayash, S.; Couso-Queiruga, E.; Chappuis, V.; Raabe, C. Primary implant stability of two implant macro-designs in different alveolar ridge morphologies: An in vitro study. Int. J. Implant Dent. 2025, 11, 17. [Google Scholar] [CrossRef] [Scilit] [PubMed]
- Andersson, P.; Pagliani, L.; Verrocchi, D.; Volpe, S.; Sahlin, H.; Sennerby, L. Factors Influencing Resonance Frequency Analysis (RFA) Measurements and 5-Year Survival of Neoss Dental Implants. Int. J. Dent. 2019, 2019, 3209872. [Google Scholar] [CrossRef] [Scilit]
- Pérez-Pevida, E.; Monteagudo-Villalobos, I.; Chávarri-Prado, D.; Estrada-Martínez, A.; Beltrán-Guijarro, M.; Diéguez-Pereira, M.; Brizuela-Velasco, A. The Relationship Between Peri-Implant Marginal Bone Loss and Resonance Frequency Analysis. J. Funct. Biomater. 2025, 16, 71. [Google Scholar] [CrossRef] [Scilit]
- Lee, D.H.; Ku, Y.; Rhyu, I.C.; Hong, J.U.; Lee, C.W.; Heo, M.S.; Huh, K.H. A clinical study of alveolar bone quality using the fractal dimension and the implant stability quotient. J. Periodontal Implant Sci. 2010, 40, 19–24. [Google Scholar] [CrossRef] [Scilit]
- Soylu, E.; Coşgunarslan, A.; Çelebi, S.; Soydan, D.; Demirbaş, A.E.; Demir, O. Fractal analysis as a useful predictor for determining osseointegration of dental implant? A retrospective study. Int. J. Implant Dent. 2021, 7, 14. [Google Scholar] [CrossRef] [Scilit] [PubMed]
- Yurtoglu, N.; Tozum, T.F.; Uysal, S. Evaluation of Peri-Implant Bone Changes with Fractal Analysis. J. Clin. Med. 2025, 14, 3820. [Google Scholar] [CrossRef] [Scilit] [PubMed]
- Mishra, S.; Kumar, M.; Mishra, L.; Mohanty, R.; Nayak, R.; Das, A.C.; Mishra, S.; Panda, S.; Lapinska, B. Fractal Dimension as a Tool for Assessment of Dental Implant Stability—A Scoping Review. J. Clin. Med. 2022, 11, 4051. [Google Scholar] [CrossRef] [Scilit] [PubMed]
- Öztürk, K.; Kış, H.C. Peri-implant bone microstructural analysis and comparison of resonance frequency analysis before prosthetic placement: A retrospective study. Clin. Oral Investig. 2022, 26, 4967–4975. [Google Scholar] [CrossRef] [Scilit]
- White, S.C.; Rudolph, D.J. Alterations of the trabecular pattern of the jaws in patients with osteoporosis. Oral Surg. Oral Med. Oral Pathol. Oral Radiol. Endod. 1999, 88, 628–635. [Google Scholar] [CrossRef] [Scilit]
- Zhou, W.; Han, C.; Yunming, L.; Li, D.; Song, Y.; Zhao, Y. Is the osseointegration of immediately and delayed loaded implants the same?--comparison of the implant stability during a 3-month healing period in a prospective study. Clin. Oral Implant. Res. 2009, 20, 1360–1366. [Google Scholar] [CrossRef] [Scilit]
- Bafijari, D.; Benedetti, A.; Stamatoski, A.; Baftijari, F.; Susak, Z.; Veljanovski, D. Influence of Resonance Frequency Analysis (RFA) Measurements for Successful Osseointegration of Dental Implants During the Healing Period and Its Impact on Implant Assessed by Osstell Mentor Device. Open Access Maced. J. Med. Sci. 2019, 7, 4110–4115. [Google Scholar] [CrossRef] [Scilit]
- Boronat-López, A.; Peñarrocha-Diago, M.; Martínez-Cortissoz, O.; Mínguez-Martínez, I. Resonance frequency analysis after the placement of 133 dental implants. Med. Oral Patol. Oral Cir. Bucal 2006, 11, E272–E276. [Google Scholar] [PubMed]
- Khan, M.W.; Inayat, N.; Zafar, M.S.; Zaigham, A.M. A resonance frequency analysis to investigate the impact of implant size on primary and secondary stability. Pak. J. Med. Sci. 2024, 40, 1261–1266. [Google Scholar] [CrossRef] [Scilit] [PubMed]
- Su, Y.H.; Peng, B.Y.; Wang, P.D.; Feng, S.W. Evaluation of the implant stability and the marginal bone level changes during the first three months of dental implant healing process: A prospective clinical study. J. Mech. Behav. Biomed. Mater. 2020, 110, 103899. [Google Scholar] [CrossRef] [Scilit]
- Alzoubi, F.; Alhumaidan, A.A.; AlRumaih, H.S.; Alqarawi, F.K.; Omar, O. The relationship between the secondary implant stability quotient and oxidized implant-related factors: A retrospective study. Heliyon 2024, 10, e39156. [Google Scholar] [CrossRef] [Scilit]
- Cochran, D.L.; Schenk, R.K.; Lussi, A.; Higginbottom, F.L.; Buser, D. Bone response to unloaded and loaded titanium implants with a sandblasted and acid-etched surface: A histometric study in the canine mandible. J. Biomed. Mater. Res. 1998, 40, 1–11. [Google Scholar] [CrossRef] [Scilit]
- Kato, C.N.; Barra, S.G.; Tavares, N.P.; Amaral, T.M.; Brasileiro, C.B.; Mesquita, R.A.; Abreu, L.G. Use of fractal analysis in dental images: A systematic review. Dentomaxillofac. Radiol. 2020, 49, 20180457. [Google Scholar] [CrossRef] [Scilit]
- Suer, B.T.; Yaman, Z.; Buyuksarac, B. Correlation of Fractal Dimension Values with Implant Insertion Torque and Resonance Frequency Values at Implant Recipient Sites. Int. J. Oral Maxillofac. Implant. 2016, 31, 55–62. [Google Scholar] [CrossRef] [Scilit] [PubMed]
- Kış, H.C.; Güleryüz Gürbulak, A. Evaluation of the peri-implant bone trabecular microstructure changes in short implants with fractal analysis. Int. J. Implant Dent. 2020, 6, 13. [Google Scholar] [CrossRef] [Scilit] [PubMed]
- Abdulhameed, E.A.; Al-Rawi, N.H.; Uthman, A.T.; Samsudin, A.R. Bone Texture Fractal Dimension Analysis of Ultrasound-Treated Bone around Implant Site: A Double-Blind Clinical Trial. Int. J. Dent. 2018, 2018, 2672659. [Google Scholar] [CrossRef] [Scilit] [PubMed]
- Jolley, L.; Majumdar, S.; Kapila, S. Technical factors in fractal analysis of periapical radiographs. Dentomaxillofac. Radiol. 2006, 35, 393–397. [Google Scholar] [CrossRef] [Scilit]

Disclaimer/Publisher’s Note: The statements, opinions and data contained in all publications are solely those of the individual author(s) and contributor(s) and not of MDPI and/or the editor(s). MDPI and/or the editor(s) disclaim responsibility for any injury to people or property resulting from any ideas, methods, instructions or products referred to in the content. |
© 2026 by the authors. Licensee MDPI, Basel, Switzerland. This article is an open access article distributed under the terms and conditions of the Creative Commons Attribution (CC BY) license.