


Abstract
This study evaluated the impact of startup technology innovations and customer relationship management (CRM) performance on customer participation, value co-creation, and consumer purchase behavior (CPB). This analytical study empirically tested the proposed hypotheses using structural equation modeling (SEM) and SmartPLS 3 techniques. Moreover, we used a support vector machine (SVM) algorithm to verify the model’s accuracy. SVM algorithm uses four different kernels to check the accuracy criterion, and we checked all of them. This research used the convenience sampling approach in gathering the data. We used the conventional bias test method. A total of 466 respondents were completed. Technological innovations of startups and CRM have a positive and significant effect on customer participation. Customer participation significantly affects the value of pleasure, economic value, and relationship value. Based on the importance-performance map analysis (IPMA) matrix results, “customer participation” with a score of 0.782 had the highest importance. If customers increase their participation performance by one unit during the COVID-19 epidemic, its overall CPB increases by 0.782. In addition, our results showed that the lowest performance is related to the technological innovations of startups, which indicates an excellent opportunity for development in this area. SVM results showed that polynomial kernel, to a high degree, is the best kernel that confirms the model’s accuracy.
1. Introduction
On 11 March 2020, the World Health Organization declared an outbreak of COVID-19 as a pandemic [1]. The virus originated in China and spread rapidly worldwide, significantly impacting the world economy. Prolonged quarantines reduced consumption, disrupted production, and affected the global supply chain [2,3]. When the epidemic was announced in the same month, it reached Hungary, a small country in Central-Eastern Europe with a population of nearly 9.7 million.
The negative impact of the crisis on startup businesses around the world has led to 70% of these companies terminating their contracts and providing them with sufficient operational resources to deal with it in the next few months, as of July 2020 [4]. Although the epidemic’s effects on startups and customer buying behavior during the epidemic have been studied in detail inside and outside Europe [5,6,7,8,9], insufficient attention has been paid to the relationship between technological innovations of startups, their CRM performance, and customer buying behavior. Therefore, considering the mediating role of value creation and customer participation, this paper investigated the effects of the above factors on customer buying behavior during the COVID-19 pandemic in Hungary. This study defined startups simply as “all-new economic entities entering the market” [10] without limiting it to the information and communications technology (ICT) sector.
When it came to technological innovations during the pandemic, we saw businesses and startups that thrived despite economic problems, such as food delivery services, e-learning services, or programs that could address the need for personal human contacts, such as video calling services or online dating programs [6]. As part of customer relationship management, social media such as Facebook or Instagram also played a key role in retaining customers, encouraging audiences to stay in companies even during long quarantines. Relying on social media is an effective way to engage with customers even without a pandemic because, as Voramontri and Klieb [11] found, social media users find decision making more straightforward and enjoyable. They achieve a higher satisfaction level and confidence in their purchase than those who use other devices for the same purpose.
A quantitative research method was used to gather evidence from Hungary on how customers respond to technological innovations and the startup CRMs’ performance.
2. Background of the Study
In Hungary, startups and young companies are particularly important in the service sector. Young companies account for almost 50% of the total active companies and more than 25% of the total employment. As a result, the impact of particularly disrupted startup activities due to COVID-19 is expected in this area [12,13]. Startups, in particular, are likely to be severely affected because they are in a fragile phase of their life and are sensitive to disruptions in demand, supply, or credit conditions [14]. In Hungary, the most effective strategies seem to reduce the repulsion of young companies and motivate them to enter the business. This view has shown a significant improvement as the number of companies entering the economy increased rapidly in 2021 [12]. Consumers can become accustomed to new ways of shopping during the COVID-19 period. For example, buying food online with home delivery may become a daily chore. In such situations, grocery stores need to figure out how to shop online and personal shopping to motivate instant shopping. In addition, other past behaviors and times are changing consumers who may have become accustomed to exercising at home, attending online fitness classes, and may often buy an exercise bike at home instead of exercising at the gymnasium. Furthermore, customers are likely to be accustomed to having access to newly released films in their homes and are reluctant to return to the cinema [15]. Therefore, changes in consumer behavior have a direct and indirect impact on the performance of startups.
3. Literature Review and Hypotheses Development
3.1. Technological Innovations of Startups and Customer Participation
For a company to be considered innovative, it must perform at least one innovative job successfully [16]. Technology is a related dimension of innovation [17,18]. Adopting new technological tools is a vital source of competition and growth for companies [19]. By definition, technological innovation is the acceptance of new technological advances incorporated into services, products, or processes. Technological innovations arise from using a new procedure, tool, device, or system by which an organization improves its capabilities [20]. There is a close relationship between innovation capability and customer participation. A company that emphasizes innovation is likely to strive to increase the compatibility between its innovative services and customer needs [21]. Wang et al. [22] argued that the customer’s unwillingness to take risks to embrace new technological advances or new products requires encouraging them to engage deeply in developing a new supplier product to learn more about the new technology and product. According to Füller and Matzler [23], customers are empowered to experience the value of future products and product specifications by embedding new virtual products in the cybernetic world, which encourages them to discover all the everyday needs of new products.
Hypothesis 1 (H1).
Technological innovations of startups affect customer participation.
3.2. CRM Performance and Customer Participation
Suppose an efficient CRM leads to the bottom-line profit for the organization [24]. CRM systems help organizations acquire customer knowledge and produce continuously [25]. Eisingerich and Bell [26] stated that customer education is a strong determinant of customer participation in industrial and financial services. Eisingerich and Bell [26] explained that educated customers would be more confident in offering something and helping to serve effectively. Ahn and Rho [27] also pointed out that the value of relationship and interaction significantly affects the customer’s intention to participate in the confrontation. Ahn and Rho [28] argued that communication and empowerment interactions displayed by a service front end help activate customer engagement. Based on a study by Garrido-Moreno [29], Social CRM capabilities enhance customer interaction capabilities, engaging customers in shared conversations that promote WOM behaviors and recommendations.
Hypothesis 2 (H2).
CRM performance affects customer engagement.
3.3. Customer Participation and Value Co-Creation
According to the customer participation literature, customers show more motivation and commitment to co-creation by increasing the degree of customer participation [30]. Customers are no longer just recipients of services. Instead, they also help improve service quality in many ways [27]. Because customers are value co-creators, organizations need encouragement to involve their customers in the value creation procedure [22]. Customers are expected to participate as co-marketers who effectively promote or review their products and services and thus attract other people [31]. As shown by Fang et al. [32], the creation of new product value is influenced by customer participation by improving the effectiveness of the new product development process with an increased share of information and coordination between the customer and the supplier. Research shows that customer participation (as a source of information and as a co-developer) positively affects value co-creation [33]. It has been reported that the participation of Umrah travelers significantly affects the value of co-creation (hedonic value, price, and freshness) [34]. A previous study showed that customer participation in the co-created services increases their intention to create a joint venture in the future [30]. Nguyen Hau and Thuy [35] argued that actively and related participatory behaviors play an essential role in creating shared value. Customer participation has a significant positive relationship with the three dimensions of co-creating values (enjoyment, economic, and relationship value) [36,37].
Hypothesis 3 (H3).
Customer participation affects the value of enjoyment.
Hypothesis 4 (H4).
Customer participation affects economic value.
Hypothesis 5 (H5).
Customer participation affects relational value.
3.4. Value Co-Creation and Consumer Purchase Behavior
Co-creation infers to create value jointly between the customer and supplier [38]. The customer learning method in the customer value creation practices helps the customer gain a better understanding of the company and participation in the product or service offered by the company, which affects the intention to buy [39]. See-To and Ho [39] suggested that the co-creation of value affects purchasing intent. Presenting the co-creation behavior of consumers indicates their intention to buy products that are intended for co-creation [40]. Hsu [41] also provided evidence that value creation has a positive and significant effect on the purchasing intent of community members.
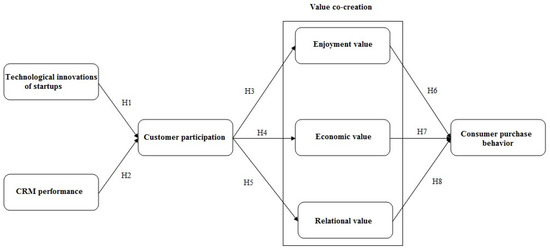
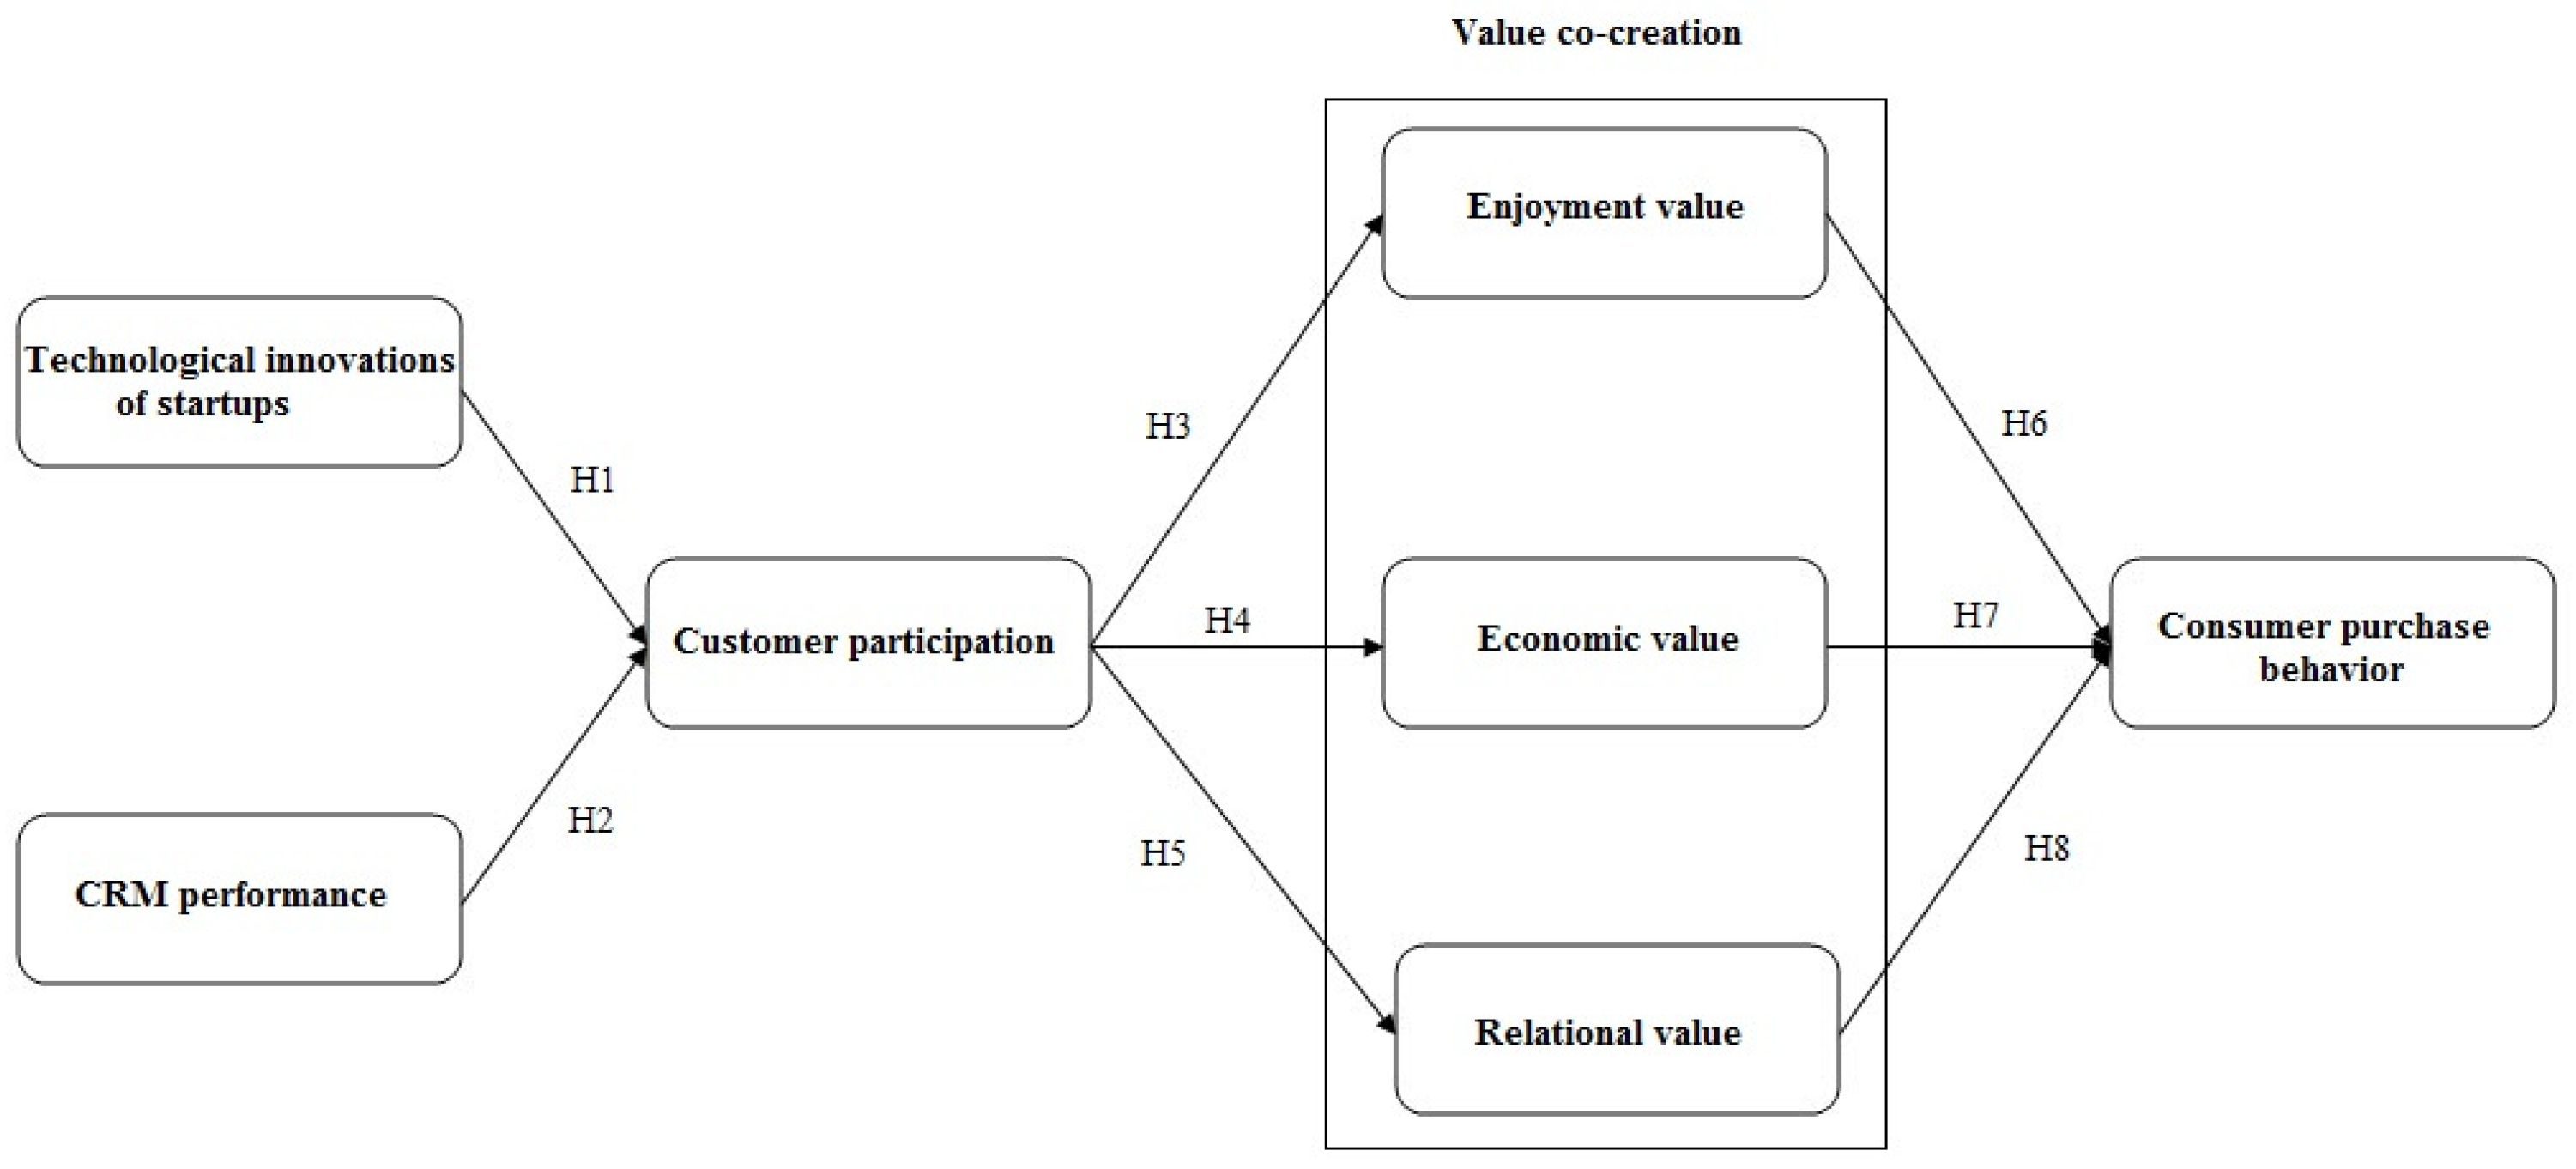
Blasco-Arcas et al. [42] reported that customers’ perceptions of their role in creating a shared experience affect their purchasing intent. The same authors suggested that creating a joint venture to shape customers’ purchases enhances their relationship with the company and influences their final decisions. The theoretical model of the research is shown in Figure 1.
Figure 1.
Theoretical model.
Hypothesis 6 (H6).
The value of enjoyment affects consumer purchase behavior.
Hypothesis 7 (H7).
The economic value affects consumer purchase behavior.
Hypothesis 8 (H8).
The relational value affects consumer purchase behavior.
3.5. Application of Machine Learning in Business
Machine learning is a term coined by Arthur Samuel in 1959. This technology is a sub-branch of artificial intelligence and computer science and plays a fundamental function in data science. It is essential to construct intelligent computers without directly learning how to behave [43]. Computers can automatically learn duplicated patterns without the help of humans through immense amounts of data [44]. The learning method of these algorithms is similar to human learning, and its accuracy increases with the strengthening of computer experiences [45]. Machine learning is a set of tools and methods to facilitate data analyzing and forecasting. This data are extracted from the Internet of Things, artificial intelligence, or other methods [46]. According to studies, machine learning applications in the business have increased in the last few decades. All businesses generate their data. The value of using data in artificial intelligence and machine learning has gradually become apparent [47]. Data such as purchase volume, payment information, and realized transactions or information of customers and even employees are a subset of business data, and their role should be considered in business strategies. Based on the analysis of this data, machine learning can predict the future of the business and suggest a specific solution for more sales [48]. Today, leading companies use machine learning to save capital, reduce investment costs, optimize productivity, and even enhance routine business processes [49].
The best application of machine learning in the industry is the ability to make quick decisions. Companies that use machine learning have achieved some of their objectives. Decisions in machine learning are very fast and accurate. Machine learning can predict how much it will cost to increase new customers and retain old ones [50]. Machine learning uses existing data to evaluate customer loyalty (when people are constantly buying from a property). Information analysis based on machine learning attracts new customers and improves the customer shopping experience [51]. The application of machine learning in business is generally divided into the following classes: (1) detection and classification of economic frauds, (2) algorithm-based business, and (3) products management. Today, budget funds worldwide use this technology to identify their financial strategies [52].
4. Research Method
4.1. Measures and Data Collection
The first part of the questionnaire aims to collect the subjects’ demographic data. Different online platforms were used to distribute questionnaires and online surveys.
Initially, the developed questionnaire was shared through an online response link on the online social platforms and in different groups. The highest participation rates were related to Facebook, Instagram, and Telegram platforms. While sharing the text, a meta-text was provided to the respondents on how to answer the questions and the purpose of the research. In addition, respondents (with at least one online shopping experience from various startups) were asked to answer the questions with full commitment and honesty. Therefore, in cases where respondents had questions about some items, the meaning of the item was explained to them separately. Additionally, one of the interesting points when collecting data was the attention of many users to machine learning algorithms in business and marketing to verify the model’s accuracy.
Of the respondents, 57.7% and 42.3% were male and female, respectively, in the studied samples. The age category of most respondents (42.1%) was 25–34 years. Additionally, 31.1% of the respondents had an associate’s degree, and 28.8% had a diploma or below diploma. Respondents were trained to pay attention to the actual situations of the COVID-19 pandemic’s influence while answering questions clearly and faithfully. Table 1 lists the demographic data of the fully described respondents.
Table 1.
Demographic data.
The purpose of designing the second part of the questionnaire was to obtain data related to variables. Survey questionnaire items were taken from previously tested scales. The technological innovations of startups were evaluated with three items suggested by Ebrahimi et al. [19]. Both CRM performance and customer participation were determined by four items recently used by Ebrahimi et al. [19]. Economic value (three items), enjoyment value (three items), and relational value (three items) were compiled based on Khajeheian and Ebrahimi’s [37] scale. Similarly, according to Ebrahimi et al. [53] and Kim et al. [54], the scale of consumer purchase behavior is estimated by three items.
The indices of the second part were measured using a 5-point Likert scale (ranging from 1—strongly disagree to 5—strongly agree). In this study, the statistical population consisted of Hungarians and internationals who answered online survey questionnaires at different stages of the COVID-19 pandemic. To ensure the validity of sampling and obtain more data in the miserable condition of COVID-19, data were collected sequentially to obtain more questionnaires.
The convenience sampling approach was used to collect data in our research. However, the widespread use of this method in quantitative research [55,56] also raises questions about the subjective nature of respondent selection and data bias. The Common Method Bias (CMB) Test [56,57] was used here to address such questions. Out of 510 disseminated surveys, a total of 466 respondents managed to complete the entire survey with a response rate of 91.3%. The Harman single factor was performed with seven variables to ensure that the data obtained did not have CMB, all loaded into a single factor. The analyzed data showed that the largest variance explained by the newly formed factor was 27.33%, which is less than the threshold value of 50% [57]. Therefore, CMB was not a concern in the data obtained. In addition, a pilot study was conducted to ensure the content validity and reliability of 25 sample sizes.
4.2. Unsupervised Machine Learning Algorithms
Unsupervised Learning is a class of machine learning methods for extracting patterns in data and has several applications such as customer clustering, consumer behavior analysis, employee records grouping, etc. [58]. The data fed to the unsupervised algorithms are not labeled, i.e., no corresponding output variable is specified for the input variable (X). In supervised learning, it is the task of the algorithm to discover interesting patterns in the data [59]. Yann LeCun, a French scientist and founder of convolutional neural networks (CNN), defines unsupervised learning: training machines without explicitly stating what they do is right or wrong. Unsupervised learning is the path to realizing “real” artificial intelligence [60]. Types of unsupervised learning algorithms include clustering (K-Means clustering algorithm [61], hierarchical clustering [62], t-SNE clustering [63], principal component analysis [64], self-organizing maps (SOM) [65], Apriori algorithm [66], Hebbian learning [67], dimensionality reduction algorithm [59], and artificial neural networks algorithm (often unsupervised) [68].
4.3. Supervised Machine Learning Algorithms
Supervised learning is a type of machine learning in which input and output are specified. In this method, an observer component provides information to the learner. The system’s main purpose is to learn the function or mapping from input to output [69]. In supervised learning, the system tries to learn from previously received examples. The supervised learning process begins with importing data sets, including training and target attributes [70]. The supervised learning algorithm extracts the specific relationship between the training examples and the corresponding target variables and uses the learned relationship to classify new data [71]. This algorithm consists of a target/output variable (dependent variable) predicted based on a set of predictors (independent variables). The developed function maps the inputs to the corresponding outputs based on these variables. The learning process continues until the model achieves the desired level of accuracy on the training data [72]. Some of the supervised learning algorithms are the linear regression algorithm [73], decision tree [74], random forest [75], K-Nearest Neighbors (KNN), [75], support vector machine algorithm [76], logistic regression [77], naive bayes classifier algorithm [78], and gradient descent [79]. To select an optimal algorithm for the problem, parameters such as accuracy, training time, linearity, number of parameters, and desired specific application must be considered [72].
5. Results
In the present study, structural equation modeling of partial least squares and SmartPLS 3 software [80] were used to estimate and evaluate the research model (Appendix A). The analysis was by the guidelines, procedures, and critical values provided by Hair et al. [81]. PLS-SEM demonstrates acceptable characteristics in dealing with anomalous data, complex models, and small samples [82]. PLS-SEM provides the fixed latent variable scores required for IPMA implementation. The latter compares the effect of the whole structural model on a predictor variable with the mean scores of the predictor hidden variable [83]. Table 2 represents significant values of means and standard deviations, variances of consumer purchase behavior (M = 4.460, SD = 0.621), technology innovations of startups (M = 4.244, SD = 0.735), CRM performance (M = 4.340, SD = 0.622), customer participation (M = 4.314, SD = 0.651), enjoyment value (M = 4.284, SD = 0.654), economic value (M = 4.325, SD = 0.637), and relational value (M = 4.364, SD = 0.569). According to the table, participants in this sample had fundamental differences in understanding the important role of consumer buying behavior during the COVID-19 pandemic. Therefore, the sample can be used correctly to test our hypotheses.
Table 2.
Measurement models.
5.1. Evaluation of Measurement Models
Reliability was assessed using Cronbach’s alpha, combined reliability (CR), and rho_A [84,85]. Convergent validity was assessed by the average extracted variance (AVE) scores and outer loadings. In SEM-PLS of SmartPLS software, Cronbach’s alpha, CR, and rho_A alpha values above 0.7 are considered acceptable for internal consistency [81,86,87]. In addition, the mean value of the extracted variance showed 0.5, acceptable and strong convergent validity [88] because it means that more than 50% of the changes in a particular structure are clarified by the specified indicators [89]. Meanwhile, all outer loadings were above the critical threshold of 0.7, indicating strong convergence validity (Table 2). Table 2 shows the multi-line result of the indicator with VIF. The VIF values were less than the critical value of 5 for items [90]. Meanwhile, the VIF values for variables less than 5 indicate that collinearity is not worrisome. In addition, values below 3 are the best values [91]. Differential validity was assessed using the Fornell-Larcker criterion. The Fornell-Larcker criterion requires that the AVE root for each structure must be higher than the inter-construct links [92]. Therefore, we conclude that discriminant validity was established (Table 3).
Table 3.
Discriminant validity.
By definition, differential validity is the amount by which a set of items can distinguish one variable from another. Cross-loading analysis showed that all indices had the highest load on their respective factors (see Table 4), although no significant cross-loading cases were detectable. Simply put, our research model demonstrates the acceptability of discriminant validity.
Table 4.
Cross loadings.
5.2. Structural Model Evaluation
Structural model evaluation includes collinearity among constructs (multilinear evaluation between structures of the independent variable structure of the structural model), importance and relationship of path coefficients, and predictive relationship (such as R², PLSpredict) [93]. The maximum structural model VIF was 3.177, which is clearly below threshold 5 [90]. Therefore, the results were not critically affected by the collinearity.
The common method variance (CMV) was examined by the technique proposed by Kock [94,95]. If VIF exceeds 3.3, it indicates that the model is contaminated with CMV and collinearity. In our study, since the model was CMV-free, all levels of the VIF factor obtained from the full alignment test were lower than the recommended threshold of 3.3 (the greatest VIF was 3.177). Therefore, CMV is not a concern in our research.
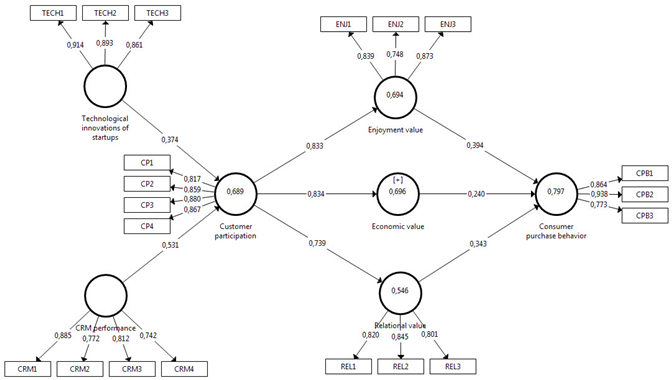
Significance testing uses a startup with 5000 sub-samples. Startup technology innovations (β = 0.374, CI = (0.286, 0.451)) and CRM performance (β = 0.531, CI = (0.463, 0.612)) had a positive and significant impact on customer participation. Therefore, H1 and H2 are supported. Customer participation significantly increased the value of enjoyment (β = 0.833, CI = (0.782, 0.869)), economic value (β = 0.834, CI = (0.767, 0.885)) and relational value (β = 0.739, CI = (0.644, 0.802)). Therefore, H3, H4, and H5 are positively supported. Enjoyment value (β = 0.394, CI = (0.315, 0.478)), economic value (β = 0.240, CI = (0.141, 0.325)) and relational value (β = 0.343, CI = (0.285, 0.410) had significantly positive effects on consumer buying behavior. Hence, H6, H7, and H8 are supported (See Table 5).
Table 5.
Results of research hypotheses and model fit.
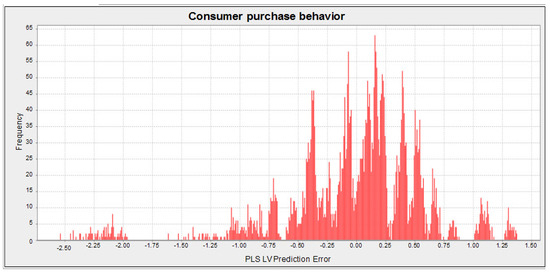
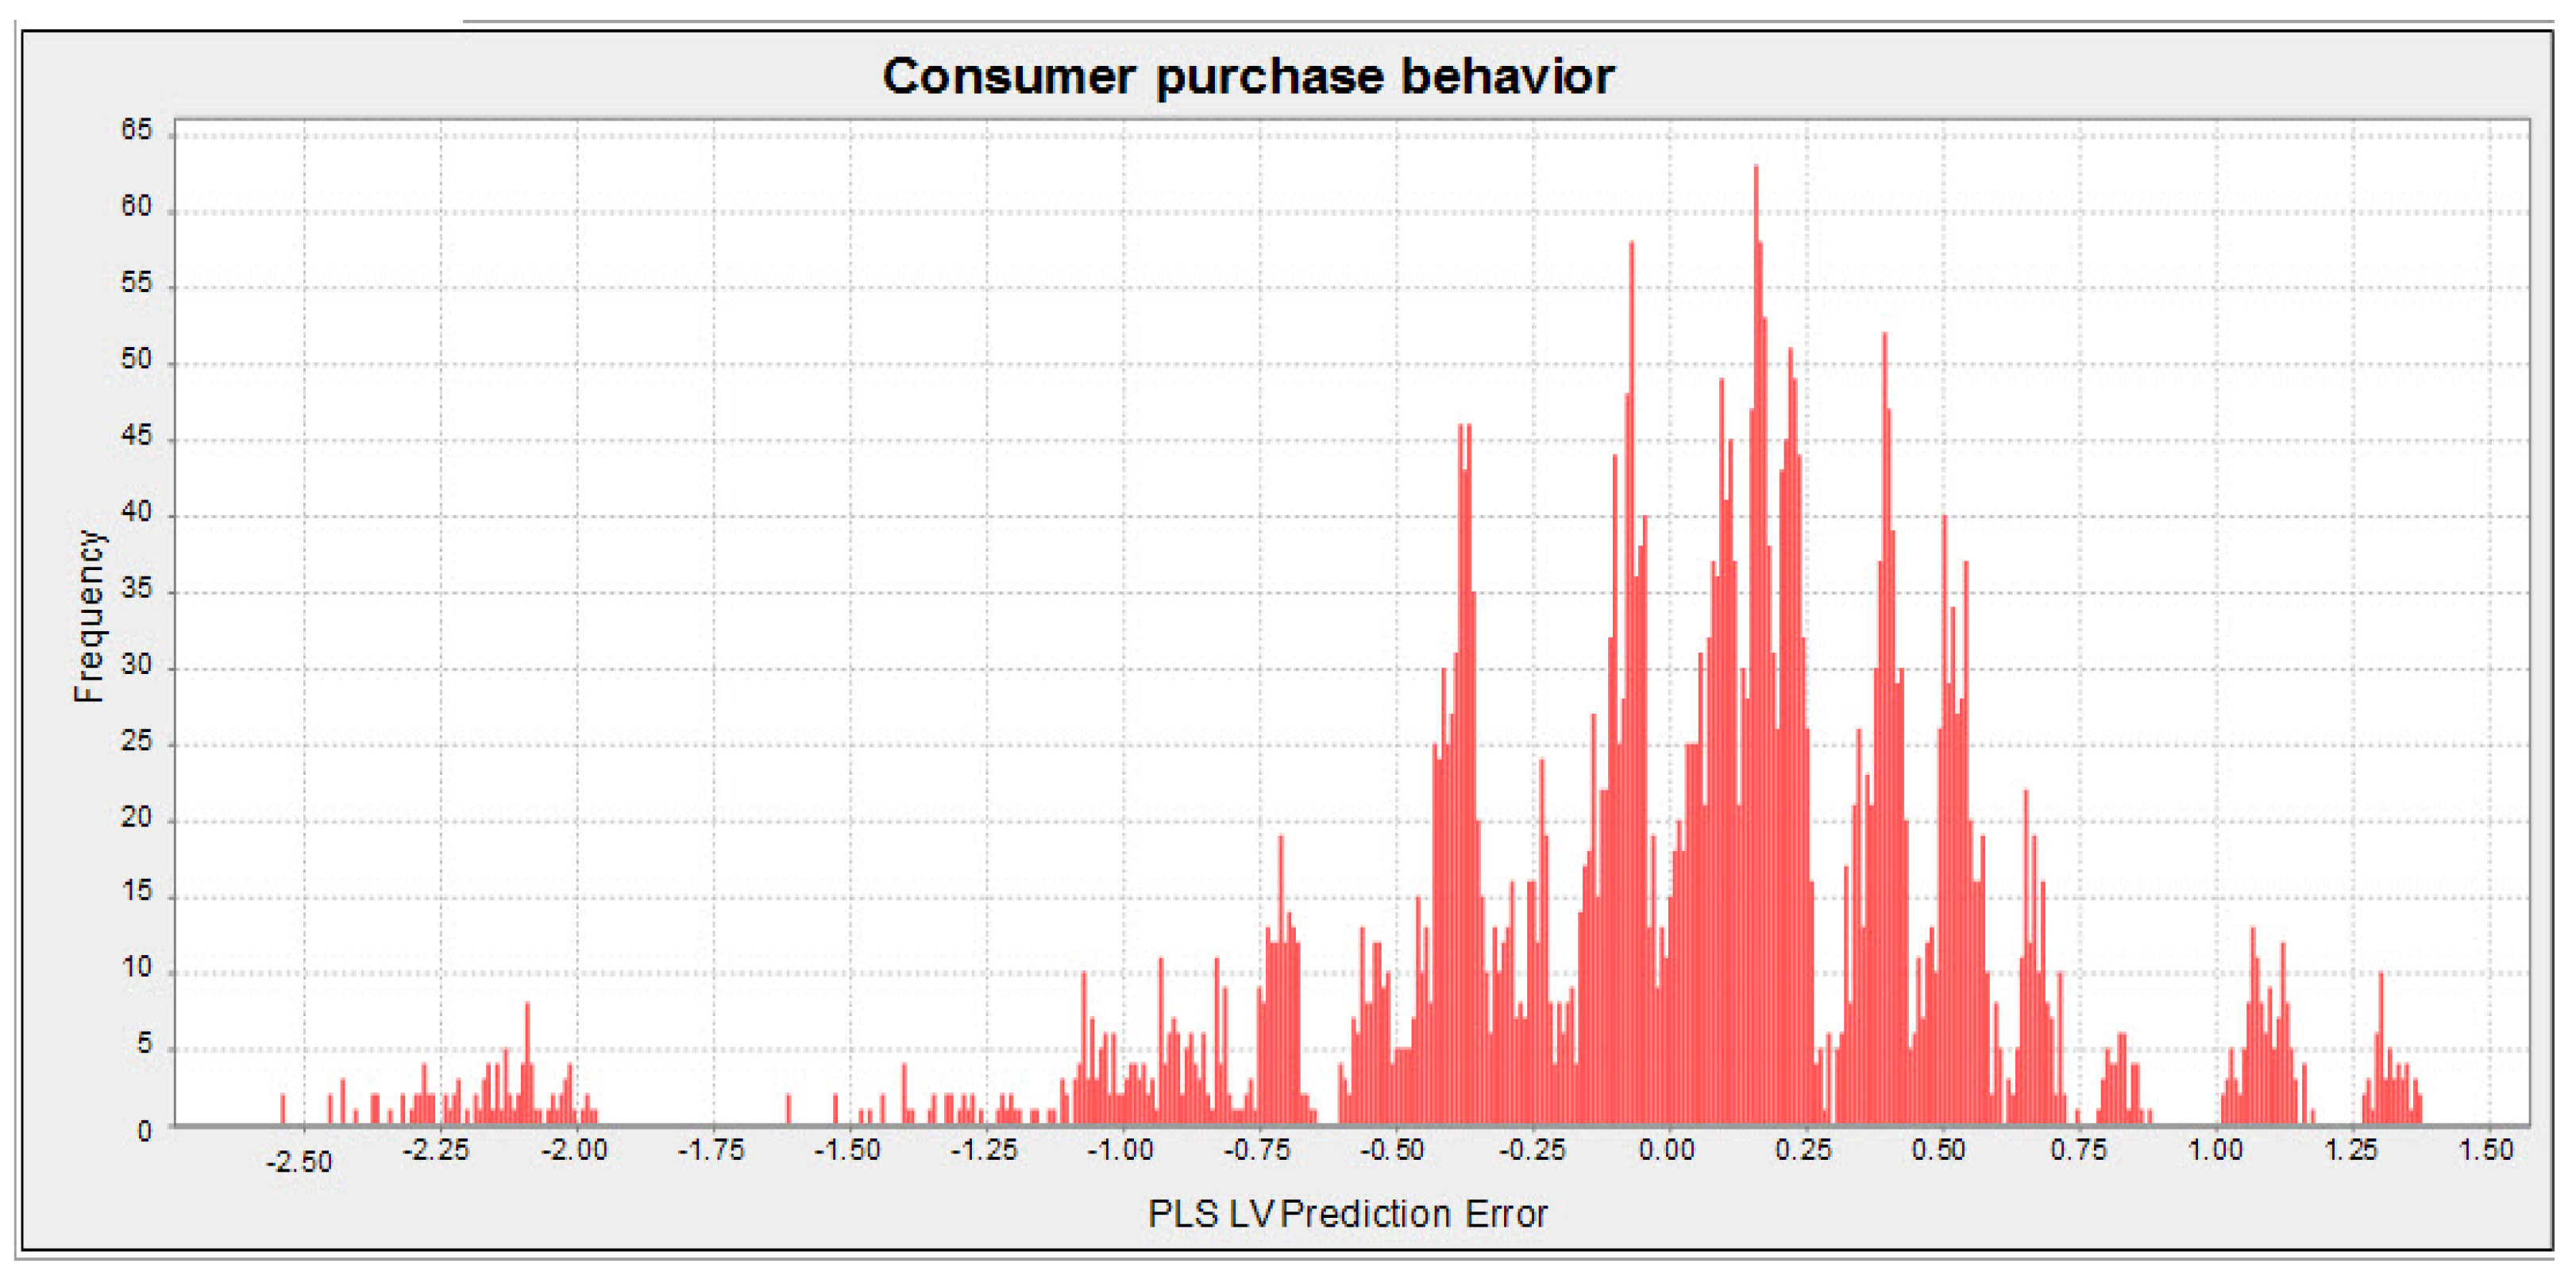
The model explained 79.7% of the variance in consumer purchase behavior. In addition, out-of-sample predictive power was determined using the PLSpredict method [96,97]. The Q2 forecast value was good consumer behavior above zero. Hence, the model had a predictive relationship. Consumer purchase behavior was considered as the only target structure of the model here. Since the linear model (LM) had a better root mean square error (RMSE) for all target structure indices than the PLS-SEM criterion (Table 6 and Figure 2), the predictive power of the model was high.
Table 6.
PLS predicted assessment of the manifest variable consumer purchase behavior.
Figure 2.
PLS LV prediction error of CPB.
Meanwhile, the model’s fit was evaluated by evaluating the standardized root mean square residual (SRMR) [98]. Since the SRMR value (0.078) for the present model was less than the threshold value of 0.08, it can be concluded that the model has a good model fit.
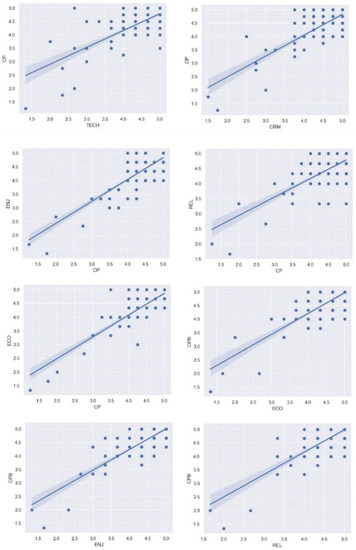
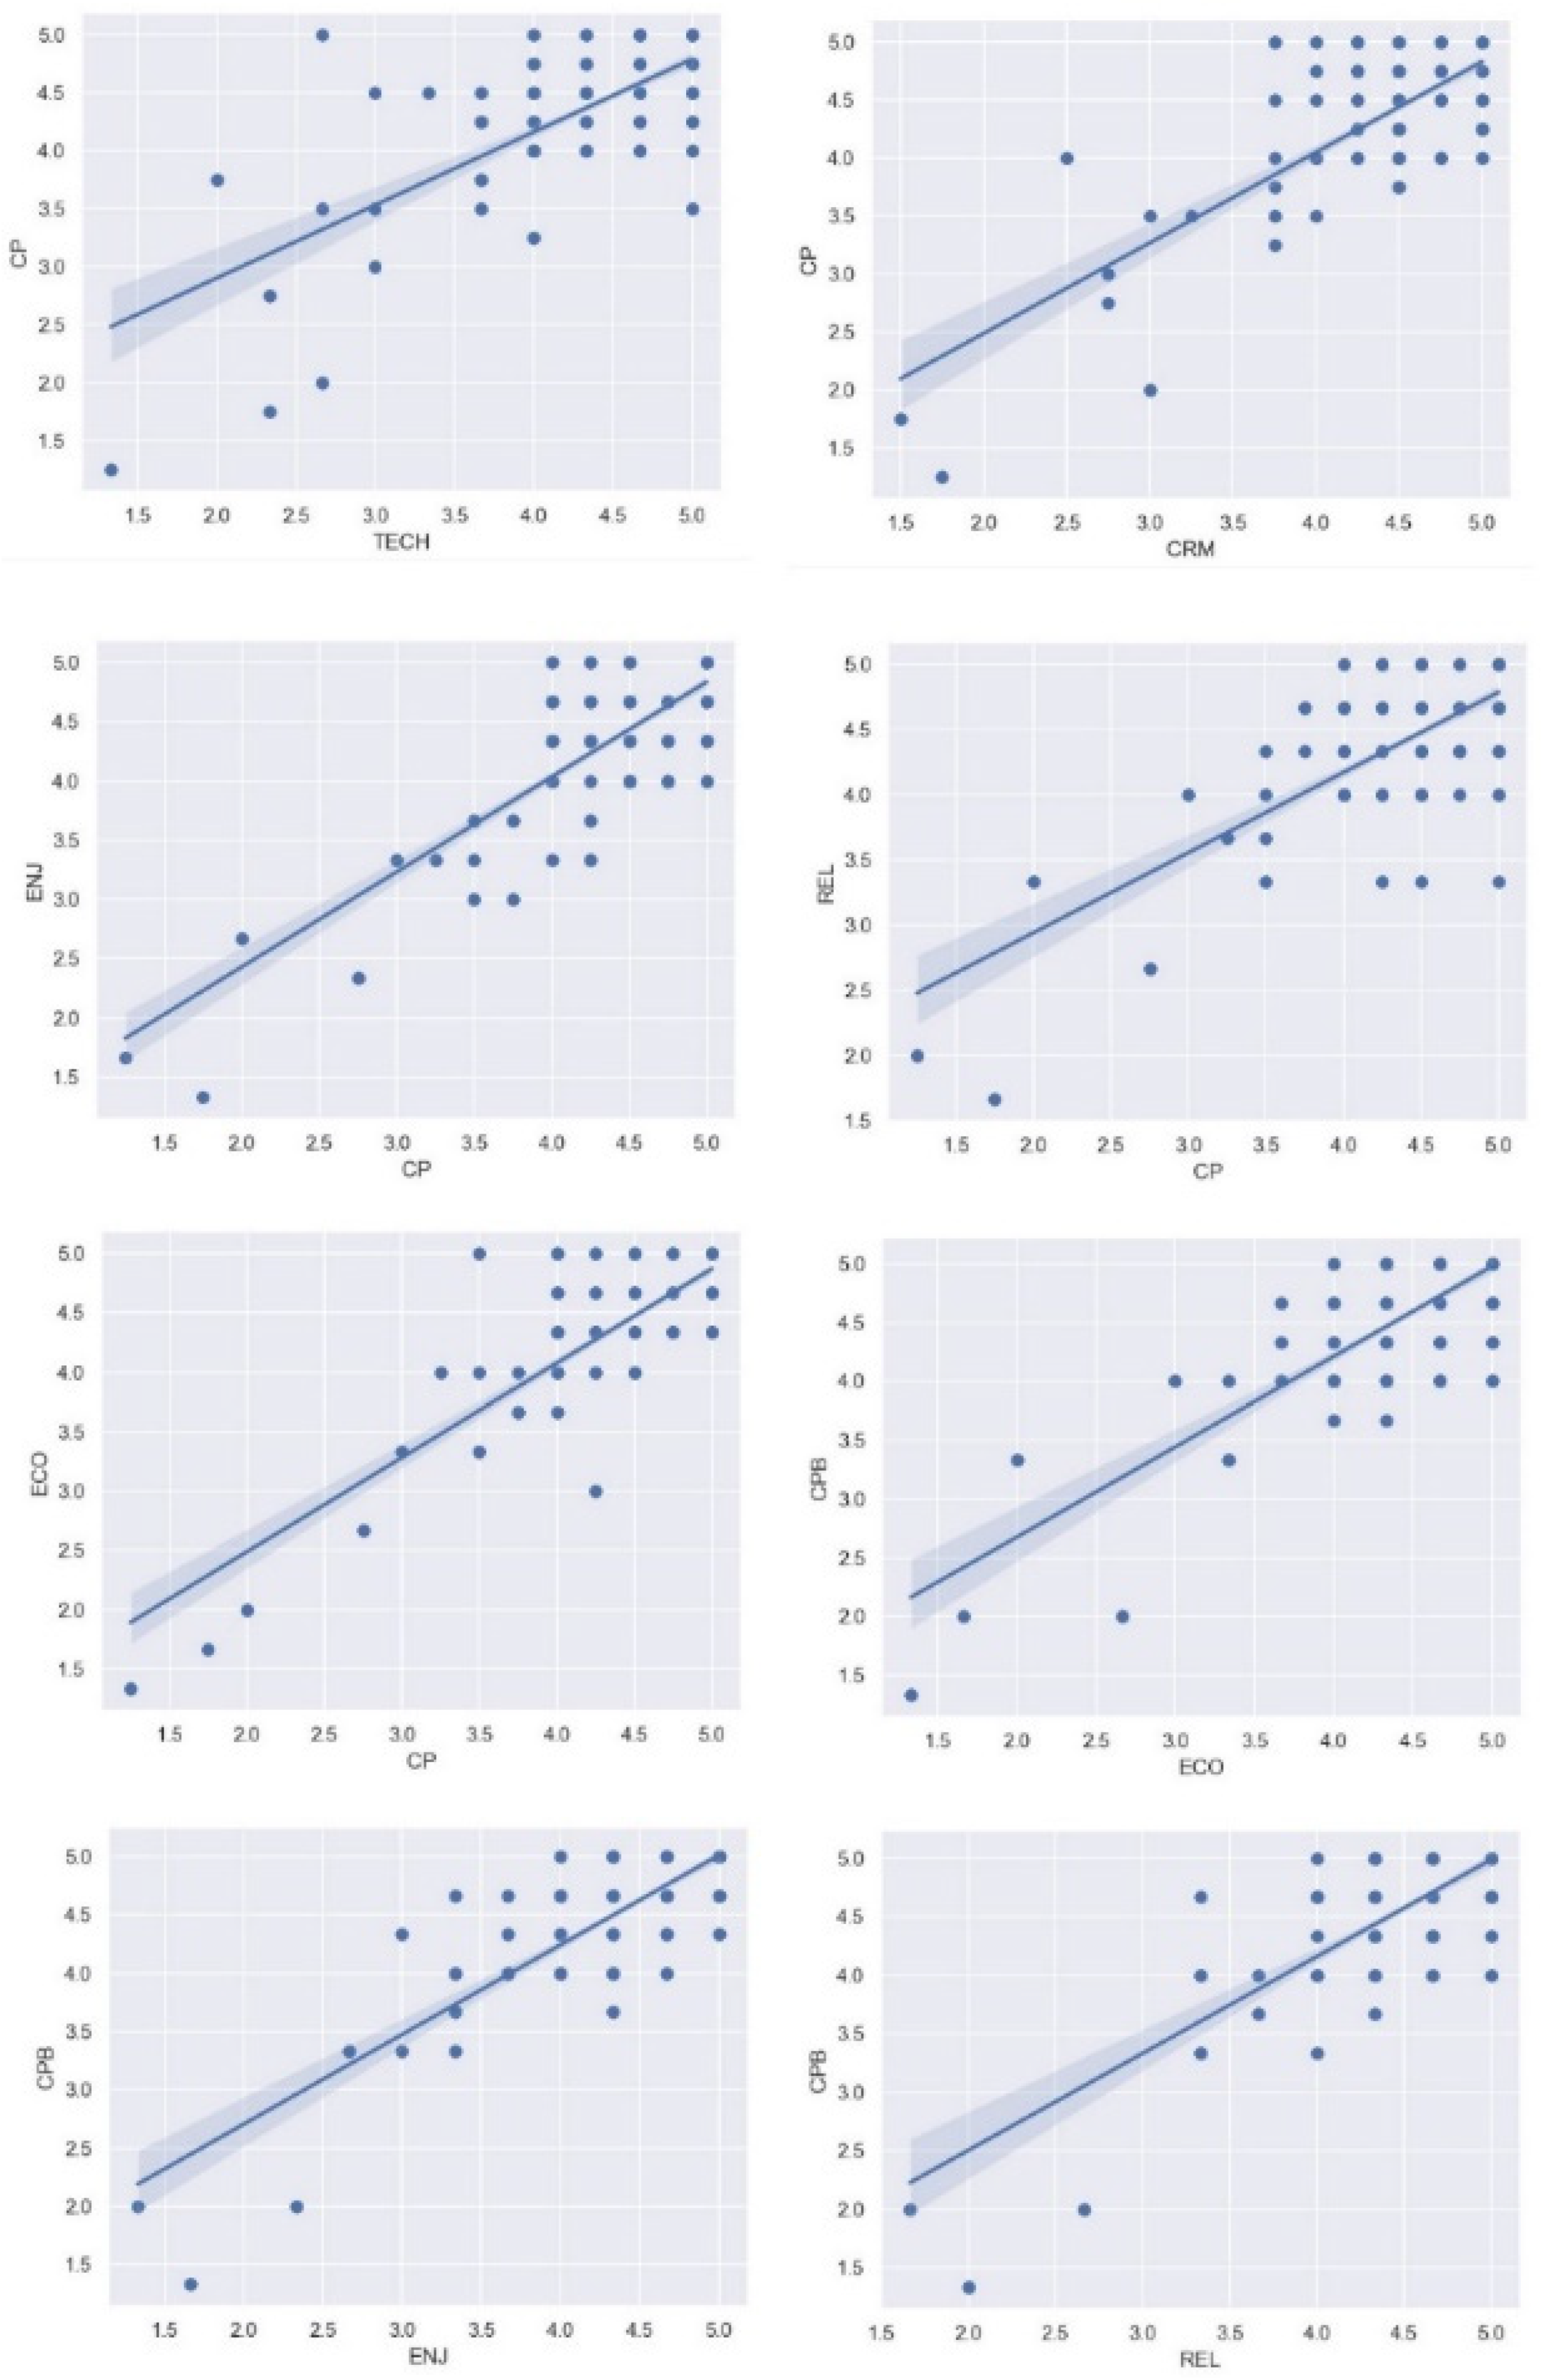
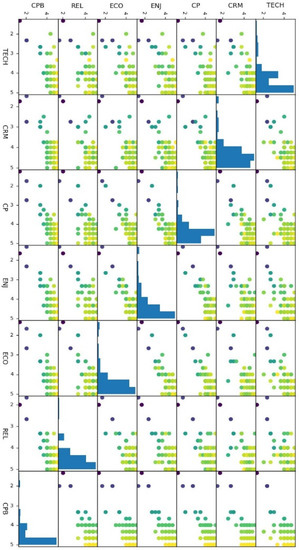
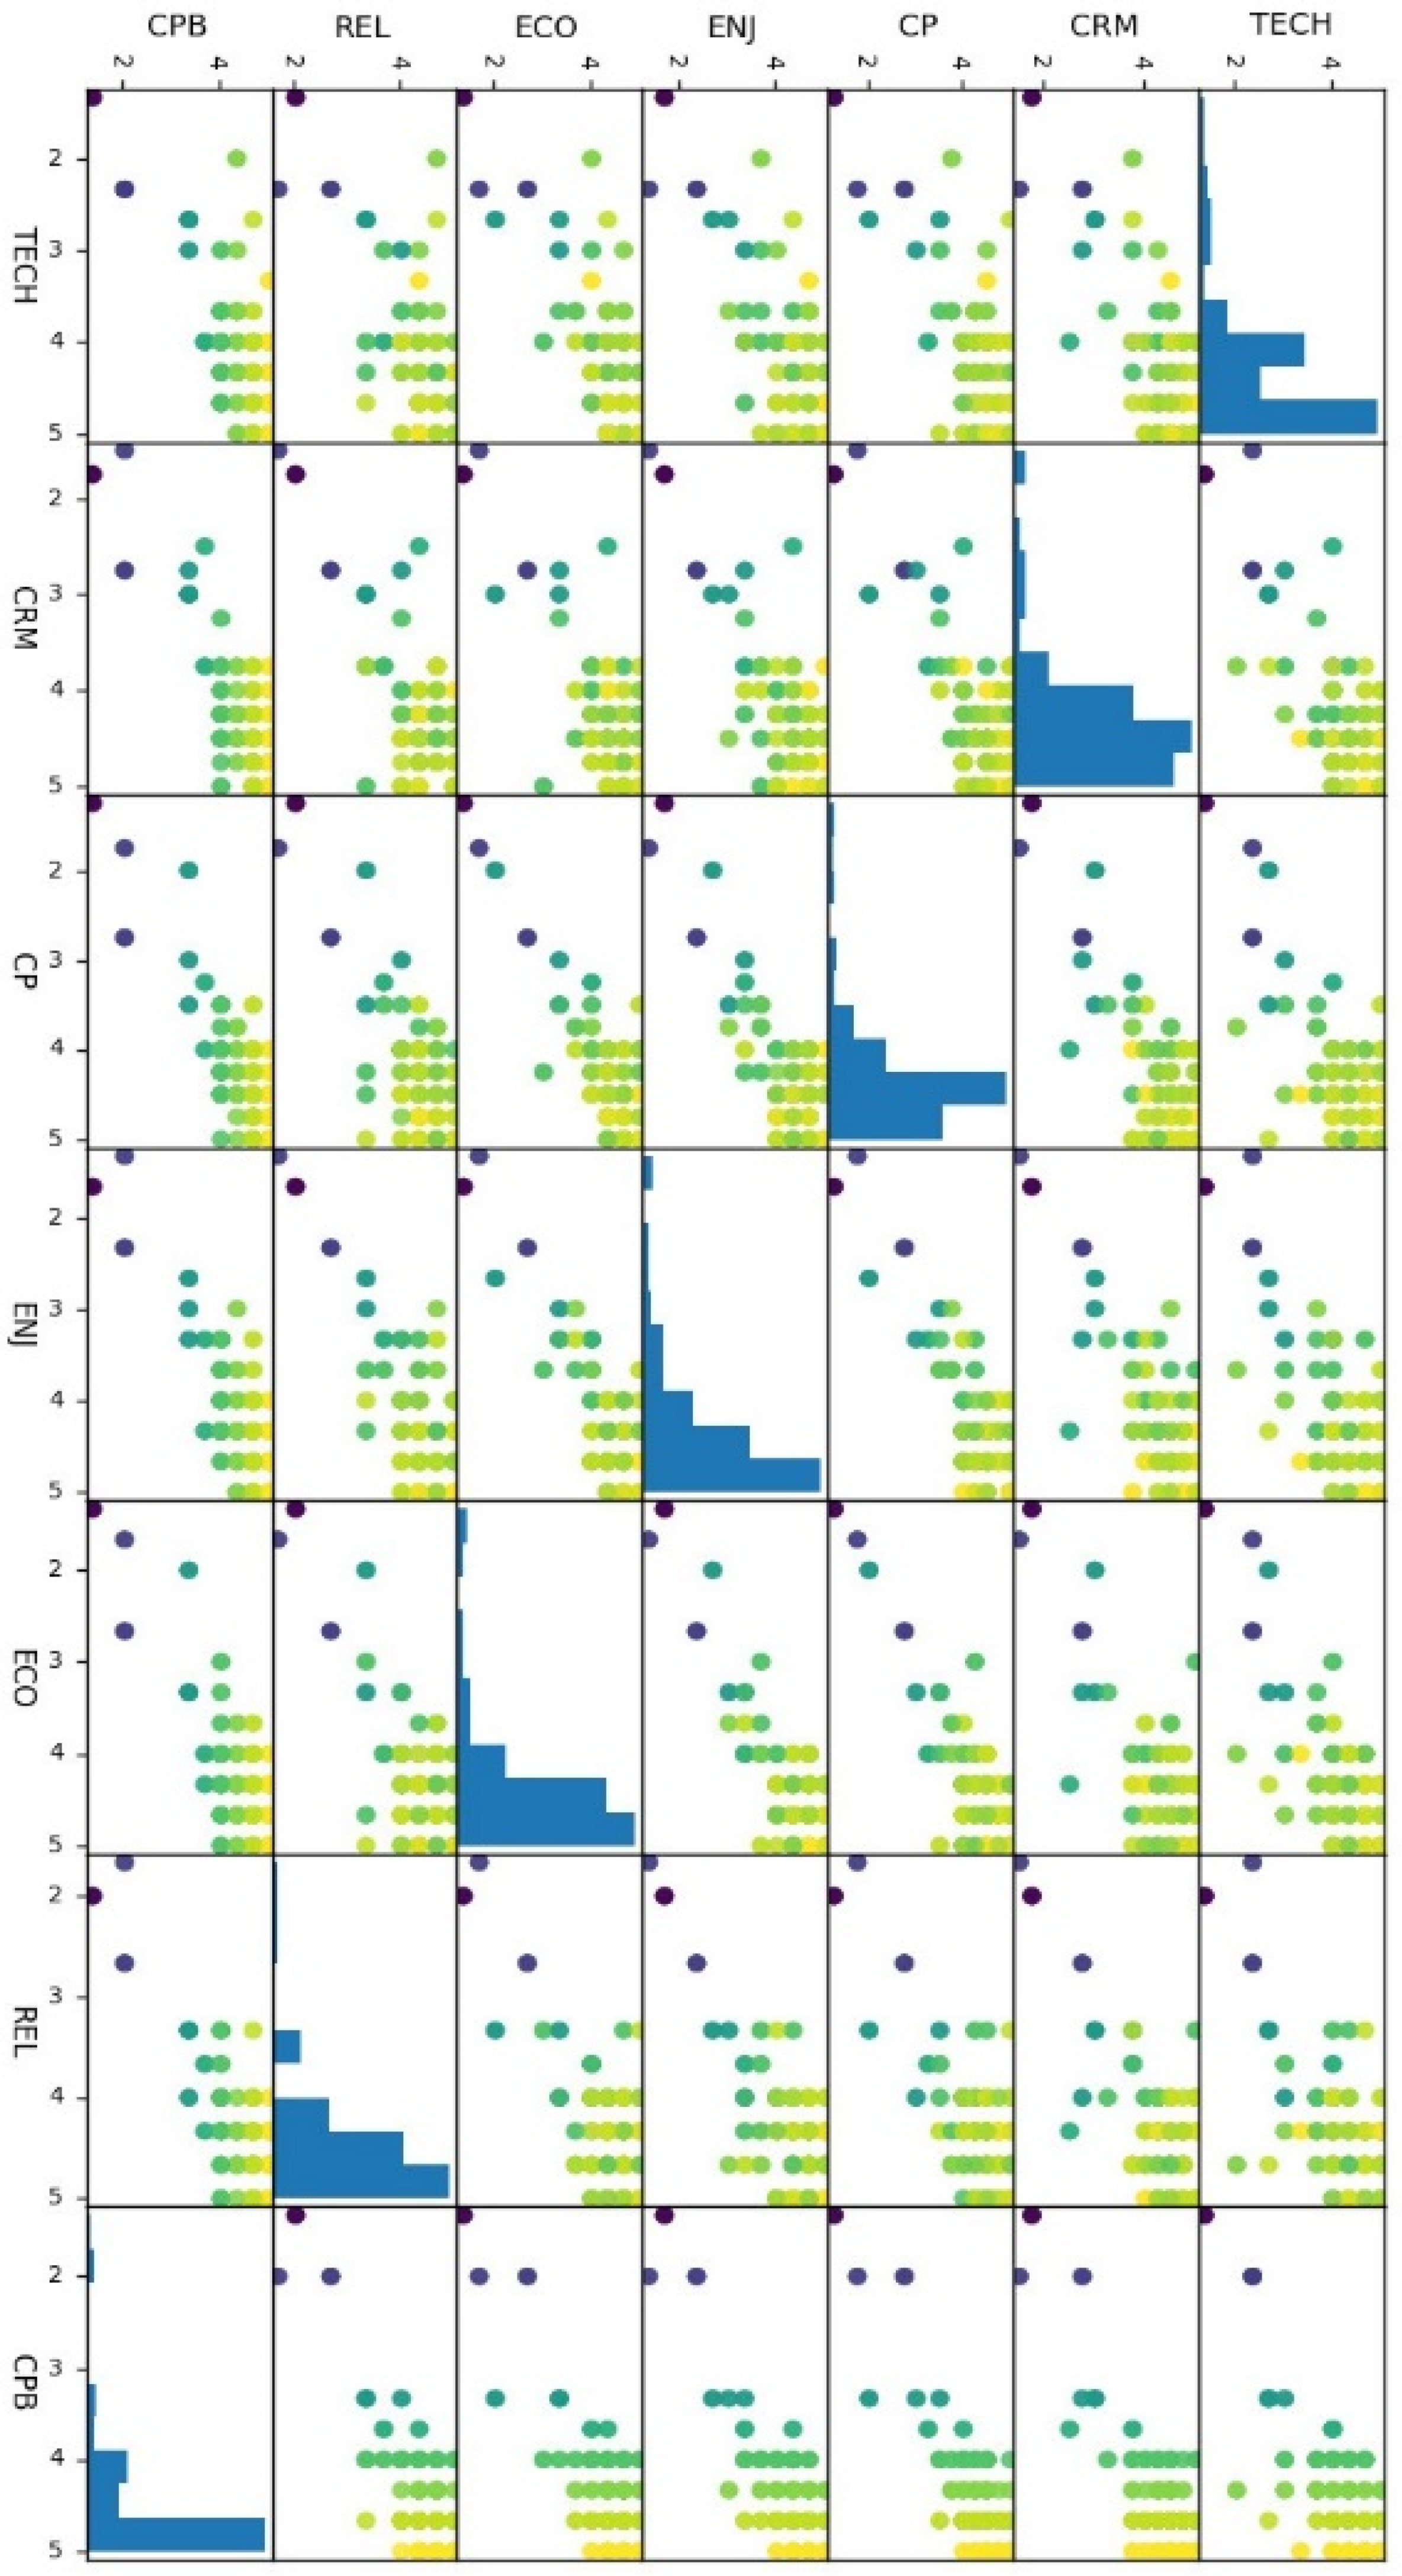
Figure 3 reflects the scatter plots related to the eight main research hypotheses. These plots were drawn using the seaborn library in python. The EDA (Exploratory Data Analysis) is also shown in Figure 4. The codes related to the plots is mentioned (Appendix B).
Figure 3.
Scatter plots (hypotheses), based on the seaborn package of Python.
Figure 4.
Exploratory data analysis, based on the seaborn package of Python.
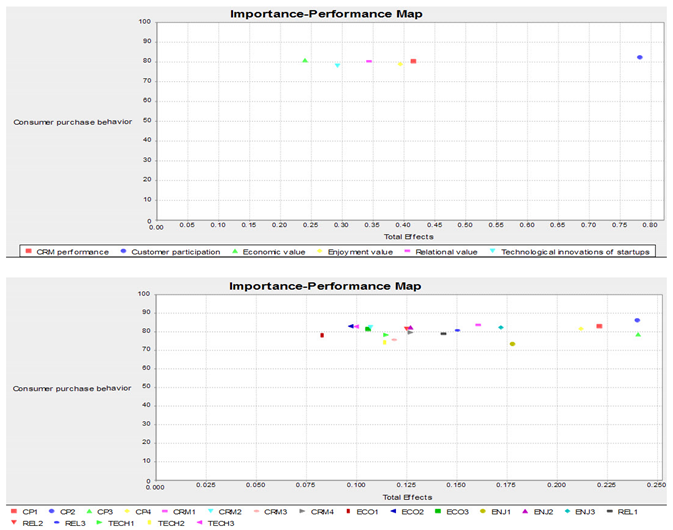
IPMA is a useful and powerful analytical approach in PLS-SEM that graphically extends the standard path coefficient in a more useful approach [83]. Our target structure is the consumer purchase behavior predicted by the four predecessors (see Appendix C).
It has been shown that “customer participation” had the highest score of 0.782. If customers improve their participation performance by one unit during the COVID-19 pandemic, its total CPB will increase by 0.782. In addition, the present findings showed that the lowest performance (78.087) belonged to the technological innovations of startups, which shows a great opportunity for development in this field. Table 7 lists the significance-performance values in full.
Table 7.
Importance-performance map analysis.
5.3. Support Vector Machine Algorithm (SVM)
Support vector machine is a supervised and unsupervised algorithm used for classification (unsupervised approach based on SVC) and regression (supervised approach based on SVR) problems. However, a support vector machine is often used in classification problems [76]. In the support vector machine algorithm, each data sample is considered a definite point in the n-dimensional space on the data scatter plot (n is the number of data sample attributes). The value of each data attribute specifies one of the components of the point coordinate on the plot. The algorithm then classifies the distinct data by drawing a straight line. Support vectors are the coordinates of a single observation [99]. The support vector machine is the boundary that separates the data sets. The support vector machine is a powerful classification algorithm that combines random forest methods and other machine learning tools to create a robust model for data classification [75].
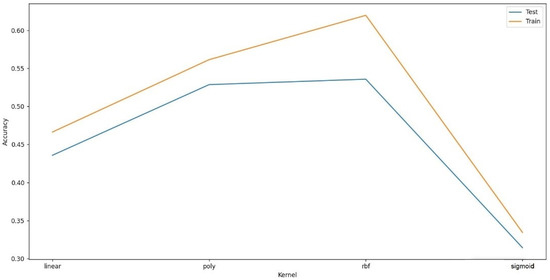
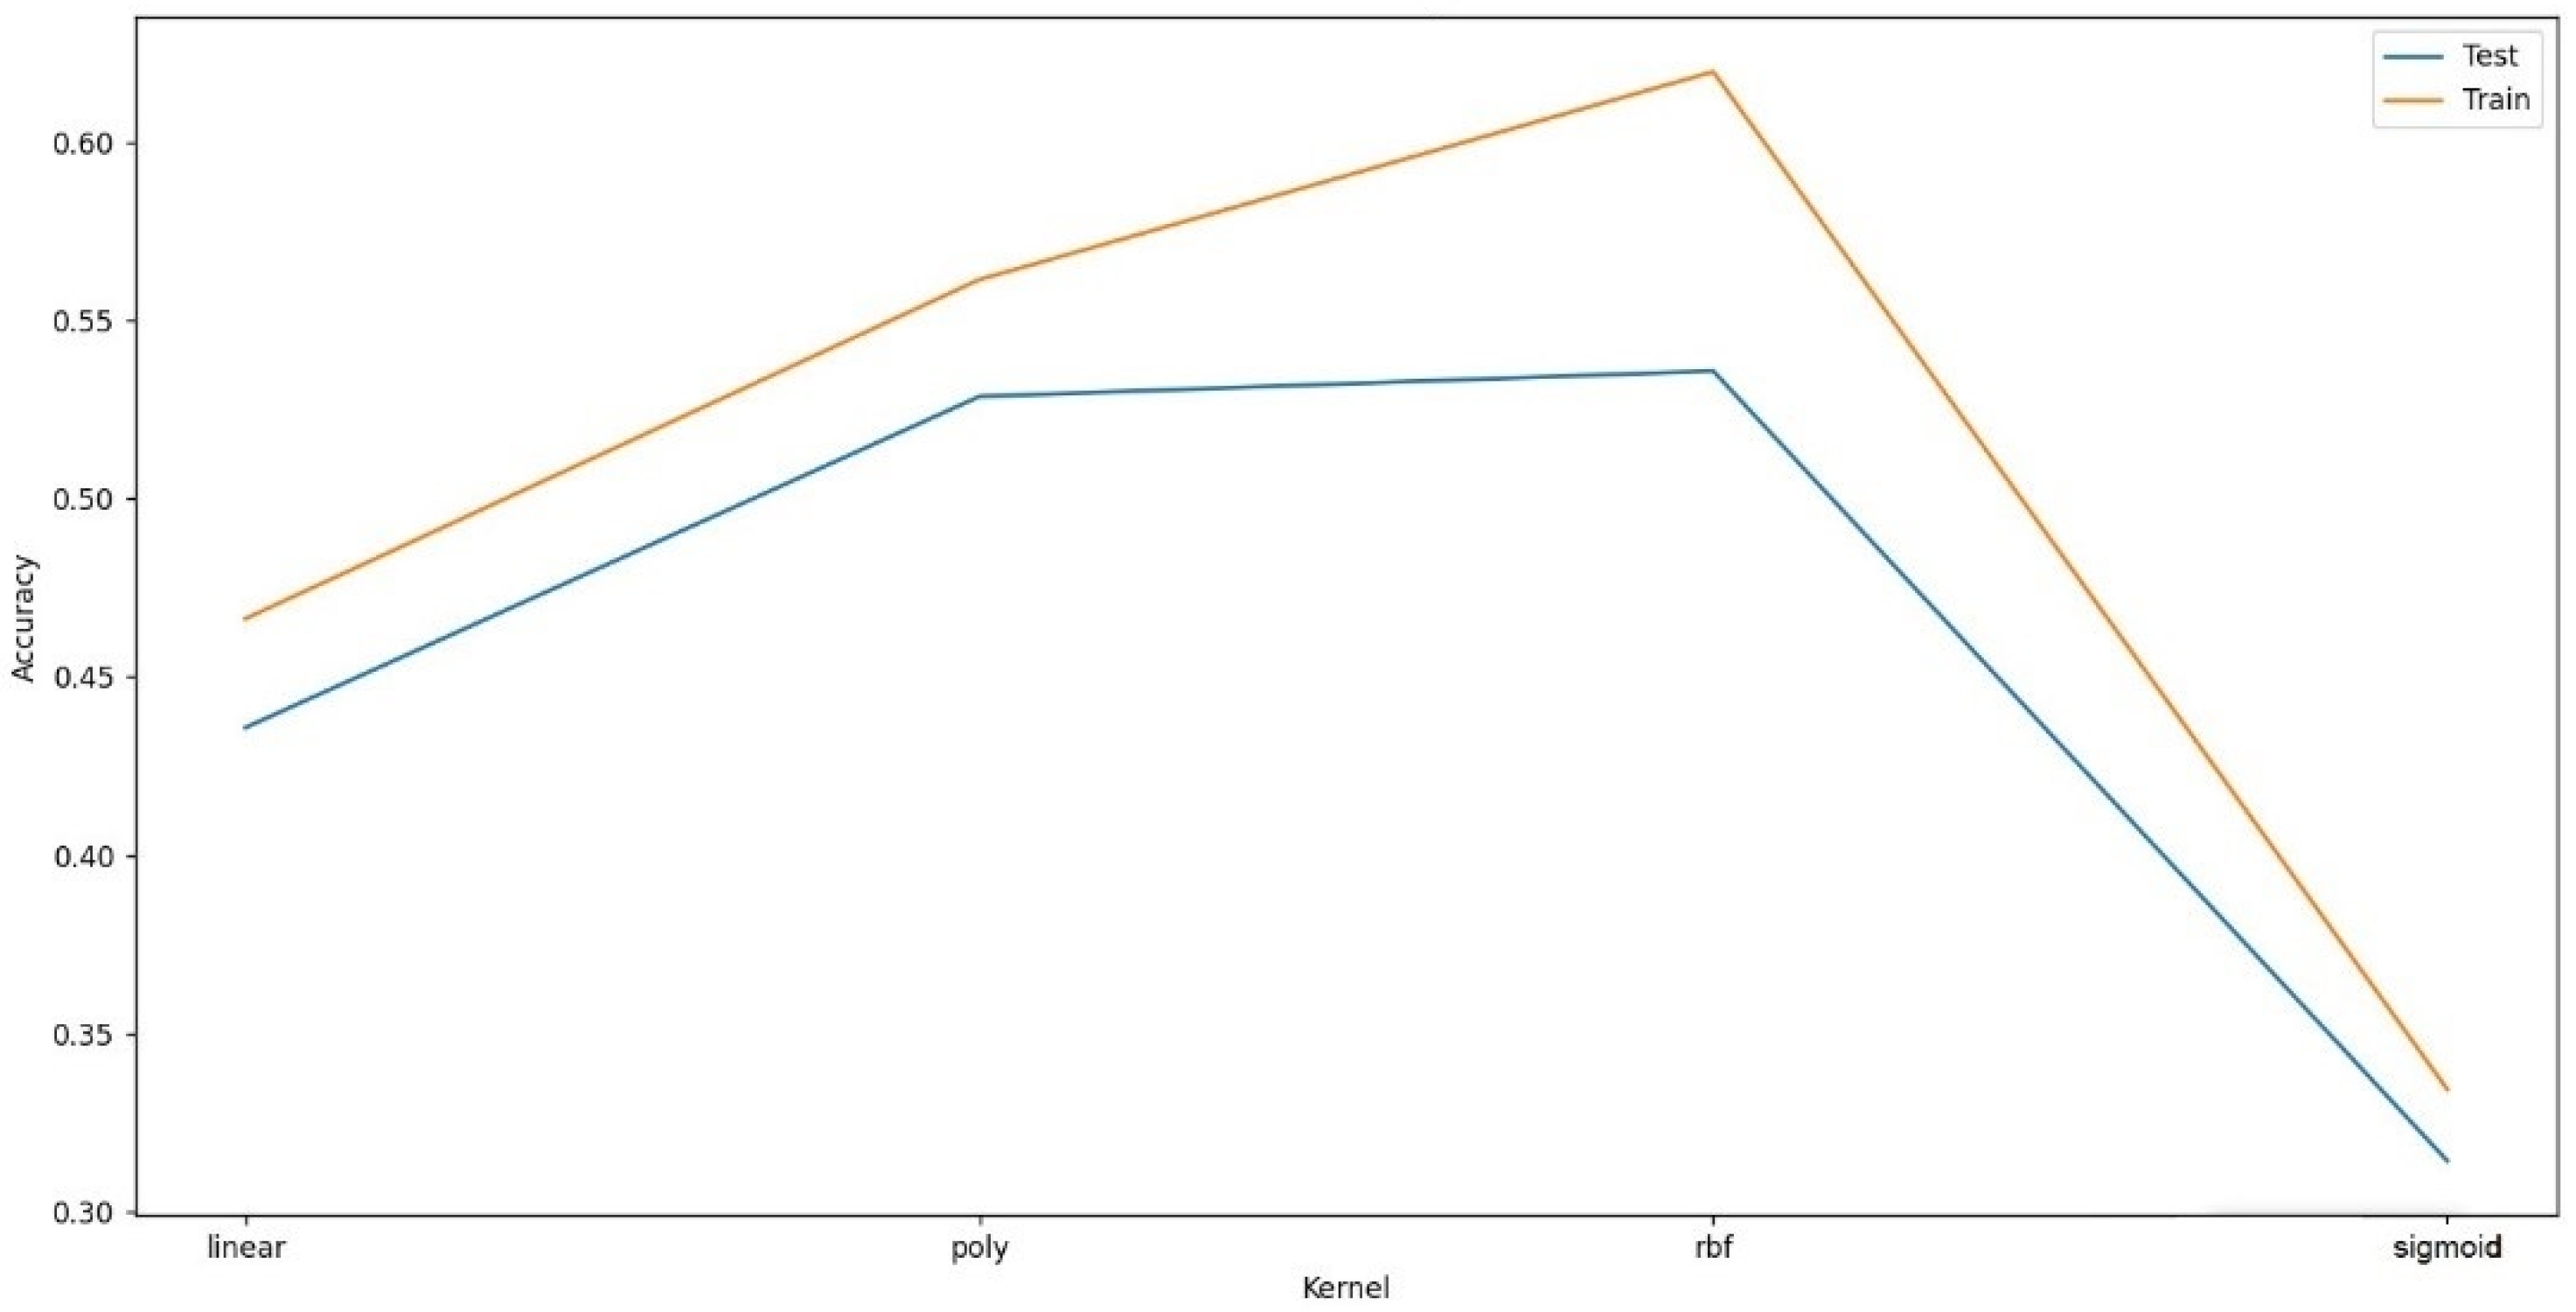
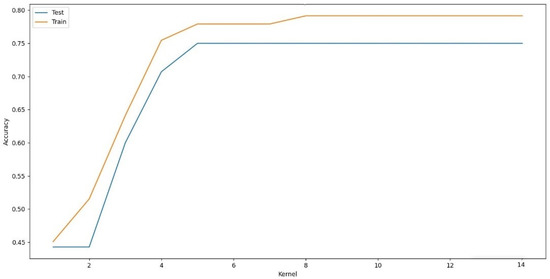
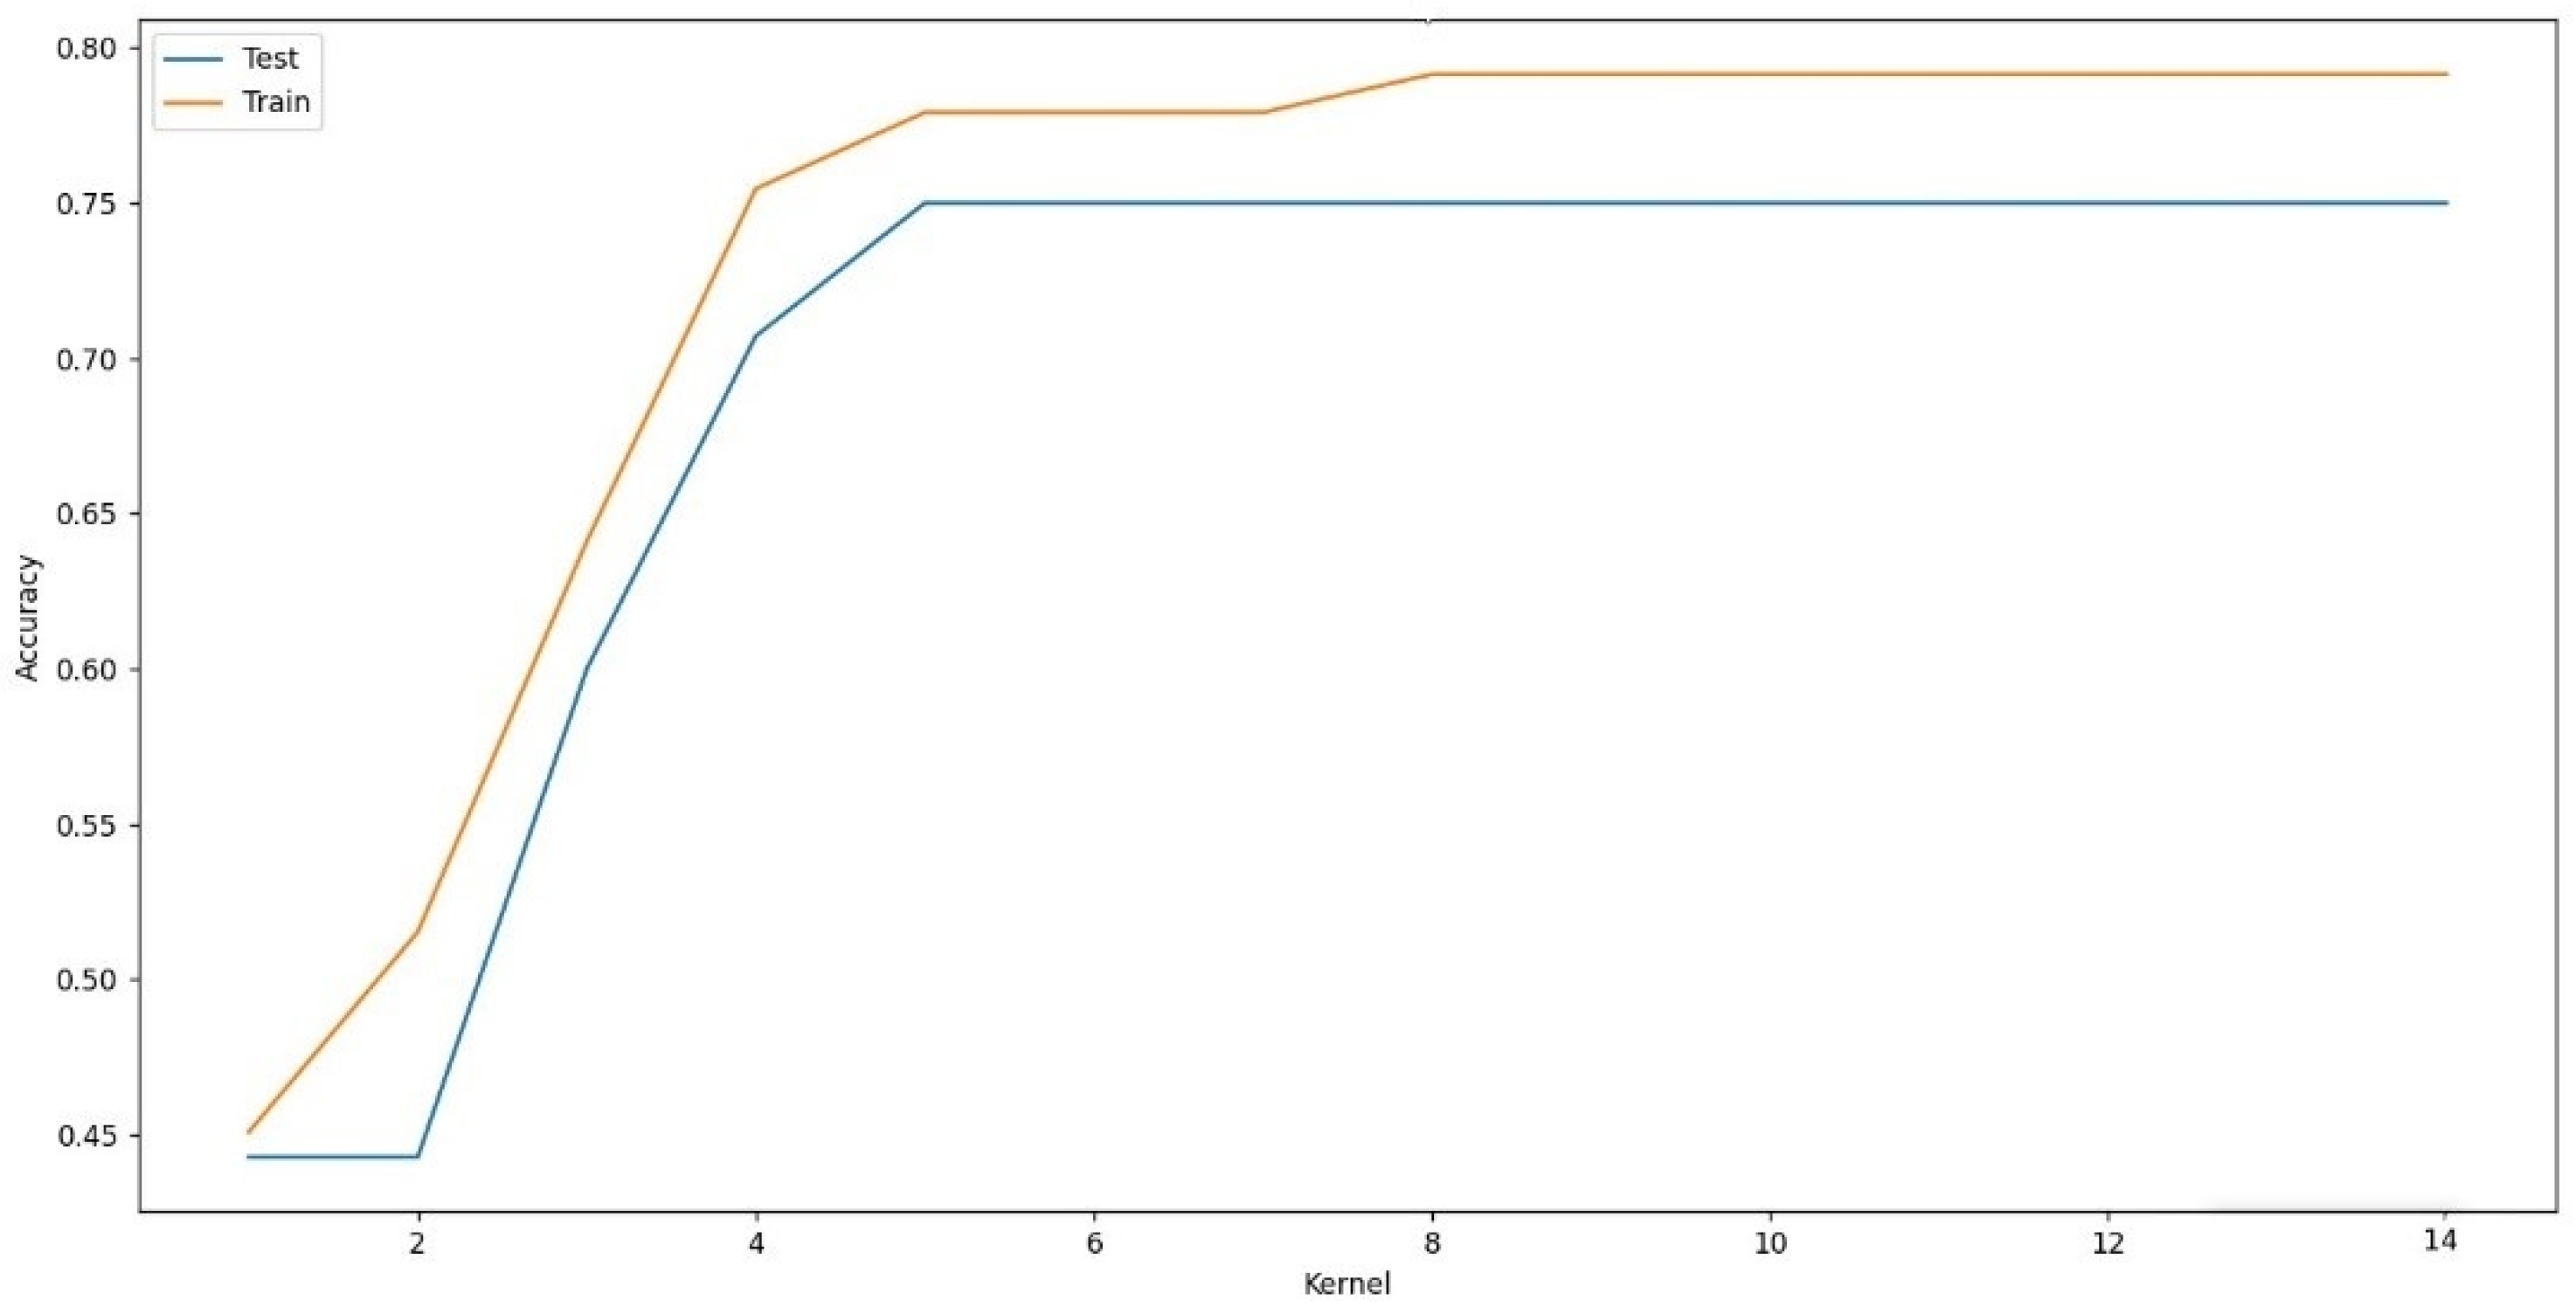
The SVM algorithm (Code 2, Appendix D) was used to verify the accuracy of the model. In this section, the media variable concerning the demographic variable is a target variable to examine the verification of the model (independent variables are: age, education, sex, and time on startups based on daily average). We asked respondents in the first part of the questionnaire which online social platforms if they follow the information about different startups or new startups the most. In addition, the SVM algorithm uses four different kernels to check the accuracy criterion. SVM codes based on different kernels are as follows (Code 2, Appendix D). According to the results of different kernels (Figure 5), the “rbf” kernel obtained the best accuracy (60%). After “rbf,” the polynomial kernel had the highest accuracy. It should be noted that the polynomial kernel can have different degrees of accuracy under the influence of degree. In the evaluation process, the degree was examined in a loop (Code 3, Appendix E). We also found that at degrees above 8 (Figure 6), the accuracy of the SVM model increased dramatically to over 80%. In general, it can be claimed that poly, to a high degree, is the best kernel that confirms the verification of the model.
Figure 5.
Accuracy of the model in different kernels based on demographic data.
Figure 6.
Accuracy of the model in different degrees of polynomial kernel.
6. Discussion
According to the results of this research, technological innovations of startups have a positive effect on customer participation. Thus, startups’ service, product, and process innovations can increase customer engagement during the COVID-19 crisis. Previous studies have also confirmed the positive impact of technological innovations on customer participation [21,22,23].
Our findings also showed a positive impact of CRM performance on customer engagement. Thus, it can be argued that startups’ efforts to improve the quality of services and goods, access customer profitability, use different marketing communications for different customers, and collect customer purchase information during the COVID-19 crisis can improve customer engagement. In other words, customers will respond to startup CRM activities through greater interactions and higher participation. Previous research has also supported the positive impact of CRM performance on customer engagement [26,27,28,29].
The present results showed that all three dimensions of value co-creation are positively affected by customer participation, affecting the startups’ enjoyment value. In other words, enjoyment value increases for other users by engaging customers on social media, including their feedback on startups’ products and services as well as news media content, following other customers’ opinions and comparing startups’ services, and commenting on articles and posts made by social media startups in the COVID-19 crisis. The results also confirmed the impact of customer participation on the economic value of startups. Based on this, it can be concluded that customer participation in social media can bring economic benefits to customers, startups, and other customers.
Undoubtedly, the successful status of such companies that seek to exploit the economic value of participatory activities depends on the number of customers who participate in value creation activities [100].
In addition, the positive impact of customer participation on the relationship value of startups with our findings was demonstrated. It explains that customer participation on startups’ social media during the COVID-19 crisis can expand customer interactions, make new friends, and help them find cost-effective ways of life. The literature supports the positive impact of co-creation experiences on customers’ future participation in social media [100,101]. Similarly, previous research has shown the positive impact of customer participation on value co-creation and its dimensions [30,32,33,34,35,36,37].
Based on the analysis of the effect of value creation dimensions on consumer purchase behavior, all three dimensions of pleasure value, economic value, and relationship value of startups positively affected consumer purchase behavior. This result shows that the values perceived by customers on social media can affect their buying behavior. In other words, customers ‘desire to buy from startups increases when they gain tangible (economic and relationship benefits) and intangible (enjoyment benefits) values from startups’ social media activities. There is evidence of a positive effect of shared value creation on consumer enjoyment behavior in the literature [40,41,42].
7. Conclusions
The results of the IPMA matrix showed that all the research variables in terms of performance in the COVID-19 pandemic in Hungary are in good condition, which shows the important role of startups in consumer purchase behavior during the epidemic. Due to the technological innovations of startups, items such as service innovations, product innovations, and process innovations are in good condition from the consumers’ point of view. Various Hungarian startups have considered them. In terms of customer participation, consumers tended to comment on the products and services of different startups on different social media. Most respondents stated that they followed other users’ opinions about startup products and services during the COVID-19 pandemic and considered the items in their purchases.
Our results also showed that the value of enjoyment plays an important role in consumer purchase behavior, and users of various startups in Hungary enjoy content shading and spending time on social media. In terms of economic value, startups have increased users’ interactions. In terms of CRM performance, startups have played an important functional role in providing new information and improving service and product delivery during the COVID-19 pandemic.
7.1. Managerial Implications
Although all the research variables were good, a closer look shows that the customer participation variable is very important. Hence, there is an urgent need for more managerial attention to invest more in this area. Users have a major role in consumer buying behavior by sharing their views on startups. Today, startups and online businesses need to invest specifically in this area. Online business executives need to consider user feedback carefully. Positive and negative reviews can affect the profitability of online businesses.
7.2. Limitations and Suggestions
There are some limitations to this study. Data were collected with a cross-sectional approach over a specific period of the COVID-19 pandemic, and future studies are recommended for the longitudinal approach. To generalize the results of this study, the respondents in this study, based on their experiences of using different startups in Hungary, answered the questionnaire questions, and different results or experiences can be seen in other countries. Future studies can also examine the moderating role of sex by permutation testing in SmartPLS 3 software. Prospective researchers are also advised to examine the demographic characteristics of other respondents (such as education or frequency of use of startups) with a multi-group analysis approach. One of our suggestions to future researchers is to use other supervised and unsupervised algorithms to predict consumer behavior and evaluate model validation. Additionally, using K-Means and DBSCAN algorithms for the customization and clustering of consumers can provide desirable results.
Author Contributions
Conceptualization, P.E., A.S. and M.F.-F.; methodology, P.E.; S.M.K.; software, P.E.; validation, A.S., M.S. and H.Z.; formal analysis, P.E.; investigation, M.S. and S.M.K.; resources, A.S. and M.F.-F.; data curation, M.S.; S.M.K. and H.Z.; writing—original draft preparation, P.E.; A.S. and M.S.; writing—review and editing, P.E.; A.S.; M.S. and M.F.-F.; visualization, P.E.; supervision, A.S. and M.F.-F.; project administration, A.S. and M.F.-F.; funding acquisition, A.S. All authors have read and agreed to the published version of the manuscript.
Funding
This research received no external funding.
Institutional Review Board Statement
Not applicable.
Informed Consent Statement
Not applicable.
Data Availability Statement
Not applicable.
Conflicts of Interest
The authors declare no conflict of interest.
Appendix A. Path Coefficients Model
Appendix B
| Algorithms A1: Code 1: Exploratory Data Analysis and plots |
| # import libraries import pandas as pd import matplotlib.pyplot as plt import seaborn as sb sb.set_theme(color_codes=True) # import data data = pd.read_excel(“data.xlsx”) x = data.drop(columns=[“CPB”]) y = data[“CPB”] sb.set_theme(color_codes=True) sb.regplot(x=“independent variables”, y=“CPB”, data=data) plt.show() # visualization: Exploratory Data Analysis (EDA) pd.plotting.scatter_matrix(data, c=y, figsize=[10, 10], s=150) plt.show() |
Appendix C
Appendix D
| Algorithms A2: Code 2: SVM algorithm |
| # import libraries import pandas as pd import matplotlib.pyplot as plt from sklearn.svm import SVC # Support vector Classifier from sklearn.model_selection import train_test_split from sklearn.metrics import accuracy_score # import data data = pd.read_excel(“data”) x = data.drop(columns=[“Media”]) y = data[“Media”] # Train and Test x_train, x_test, y_train, y_test = train_test_split(x, y, test_size=0.3) print(x_train.shape) print(x_test.shape) # Model fit, model accuracy and score test_accuracy = [] train_accuracy = [] Kernel = [] for i in [“linear”, “poly”, “rbf”, “sigmoid”]: model = SVC(kernel=i, degree=2) model.fit(x_train, y_train) y_predict = model.predict(x_test) # print (model.score(x_test, y_test)) score = accuracy_score(y_test, y_predict) test_accuracy.append(model.score(x_test, y_test)) train_accuracy.append(model.score(x_train, y_train)) Kernel.append(i) # print(f”test accuracy is: {test_accuracy}, train accuracy is: {train_accuracy}, final accuracy is: {score}”) # plots plt.plot(test_accuracy, label=“Test”) plt.plot(train_accuracy, label=“Train”) plt.xticks([0, 1, 2, 3], Kernel) plt.xlabel(“Kernel”) plt.ylabel(“Accuracy”) plt.legend() plt.show() |
Appendix E
| Algorithms A3: Code 3: Polynomial degree |
| for i in range(1, 15): model = SVC(kernel=“poly”, degree=i) model.fit(x_train, y_train) y_predict = model.predict(x_test) # print (model.score(x_test, y_test)) score = accuracy_score(y_test, y_predict) test_accuracy.append(model.score(x_test, y_test)) train_accuracy.append(model.score(x_train, y_train)) Degree.append(i) |
References
- WHO. Director-General’s Opening Remarks at the Media Briefing on COVID-19. 2020. Available online: https://www.who.int/director-general/speeches/detail/who-director-general-s-opening-remarks-at-the-media-briefing-on-covid-19---11-march-2020 (accessed on 11 December 2021).
- Fernandes, N. Economic effects of coronavirus outbreak (COVID-19) on the world economy. IESE Bus. Sch. Work. Pap. 2020, WP-1240-E. [Google Scholar] [CrossRef] [Scilit]
- Salamzadeh, A.; Dana, L.P. The coronavirus (COVID-19) pandemic: Challenges among Iranian startups. J. Small Bus. Entrep. 2021, 33, 489–512. [Google Scholar] [CrossRef] [Scilit]
- Rodrigues, C.D.; de Noronha, M.E.S. What companies can learn from unicorn startups to overcome the COVID-19 crisis. Innov. Manag. Rev. 2021; ahead-of-print. [CrossRef] [Scilit]
- Brown, R.; Rocha, A. Entrepreneurial uncertainty during the COVID-19 crisis: Mapping the temporal dynamics of entrepreneurial finance. J. Bus. Ventur. Insights 2020, 14, e00174. [Google Scholar] [CrossRef] [Scilit]
- Kalogiannidis, S.; Chatzitheodoridis, F.; Kontsas, S. An Eclectic Discussion of the Effects of COVID-19 Pandemic on the World Economy During the First Stage of the Spread. Int. J. Financ. Res. 2020, 11, 137. [Google Scholar] [CrossRef] [Scilit]
- Kuckertz, A.; Brändle, L.; Gaudig, A.; Hinderer, S.; Reyes, C.A.M.; Prochotta, A.; Steinbrink, K.M.; Berger, E.S. Startups in times of crisis–A rapid response to the COVID-19 pandemic. J. Bus. Ventur. Insights 2020, 13, e00169. [Google Scholar] [CrossRef] [Scilit]
- Kursan Milaković, I. Purchase experience during the COVID-19 pandemic and social cognitive theory: The relevance of consumer vulnerability, resilience, and adaptability for purchase satisfaction and repurchase. Int. J. Consum. Stud. 2021, 45, 1425–1442. [Google Scholar] [CrossRef] [Scilit]
- Eger, L.; Komárková, L.; Egerová, D.; Mičík, M. The effect of COVID-19 on consumer shopping behaviour: Generational cohort perspective. J. Retail. Consum. Serv. 2021, 61, 102542. [Google Scholar] [CrossRef] [Scilit]
- Skala, A. The startup as a result of innovative entrepreneurship. In Digital Startups in Transition Economies; Springer: Cham, Switzerland, 2019; pp. 1–40. [Google Scholar]
- Voramontri, D.; Klieb, L. Impact of social media on consumer behaviour. Int. J. Inf. Decis. Sci. 2019, 11, 209–233. [Google Scholar]
- Sterk, V.; Sedlacek, P.; Benedetti-Fasil, C. EU Start-Up Calculator: Impact of COVID-19 on Aggregate Employment: Scenario Analysis for Austria, Belgium, Germany, Hungary, Italy and Spain; JRC121715; Publications Office of the European Union: Brussels, Belgium, 2020.
- Pereira, J.; Aldina Correia, V.B.; Salamzadeh, A. Unboxing organisational complexity: How does it affect business performance during the COVID-19 pandemic? J. Entrep. Public Policy 2021, 10, 424–444. [Google Scholar] [CrossRef] [Scilit]
- Sedlacek, P.; Sterk, V. Startups and employment following the COVID-19 pandemic: A calculator. CEPR Discuss. Pap. 2020, 14671. Available online: https://ideas.repec.org/p/cpr/ceprdp/14671.html (accessed on 19 February 2022).
- Roggeveen, A.L.; Sethuraman, R. How the COVID-19 pandemic may change the world of retailing. J. Retail. 2020, 96, 169. [Google Scholar] [CrossRef] [Scilit]
- De Oliveira, P.H.; Terence, A.C.F. Innovation practices in small technology-based companies during incubation and post-incubation periods. Innov. Manag. Rev. 2018, 15, 174–188. [Google Scholar] [CrossRef] [Scilit]
- Zawislak, P.A.; Fracasso, E.M.; Tello-Gamarra, J. Technological intensity and innovation capability in industrial firms. Innov. Manag. Rev. 2018, 15, 189–207. [Google Scholar] [CrossRef] [Scilit]
- Bouzari, P.; Gholampour, A.; Ebrahimi, P. The Interaction between Human and Media in the Future of Banking Industry. In Contemporary Applications of Actor Network Theory; Springer: Cham, Switzerland, 2020; pp. 257–274. [Google Scholar]
- Ebrahimi, P.; Ahmadi, M.; Gholampour, A.; Alipour, H. CRM performance and development of media entrepreneurship in digital, social media and mobile commerce. Int. J. Emerg. Mark. 2019, 16, 25–50. [Google Scholar] [CrossRef] [Scilit]
- Abdallah, A.B.; Phan, A.C.; Matsui, Y. Investigating the effects of managerial and technological innovations on operational performance and customer satisfaction of manufacturing companies. Int. J. Bus. Innov. Res. 2016, 10, 153–183. [Google Scholar] [CrossRef] [Scilit]
- Ngo, L.V.; O’Cass, A. Innovation and business success: The mediating role of customer participation. J. Bus. Res. 2013, 66, 1134–1142. [Google Scholar] [CrossRef] [Scilit]
- Wang, X.; Arnett, D.B.; Hou, L. Using external knowledge to improve organizational innovativeness: Understanding the knowledge leveraging process. J. Bus. Ind. Mark. 2016, 31, 164–173. [Google Scholar] [CrossRef] [Scilit]
- Füller, J.; Matzler, K. Virtual product experience and customer participation—A chance for customer-centred, really new products. Technovation 2007, 27, 378–387. [Google Scholar] [CrossRef] [Scilit]
- Shahin, A.; Nikneshan, P. Integration of CRM and QFD: A novel model for enhancing customer participation in design and delivery. TQM J. 2008, 20, 68–86. [Google Scholar] [CrossRef] [Scilit]
- Khodakarami, F.; Chan, Y.E. Exploring the role of customer relationship management (CRM) systems in customer knowledge creation. Inf. Manag. 2014, 51, 27–42. [Google Scholar] [CrossRef] [Scilit]
- Eisingerich, A.B.; Bell, S.J. Relationship marketing in the financial services industry: The importance of customer education, participation and problem management for customer loyalty. J. Financ. Serv. Mark. 2006, 10, 86–97. [Google Scholar] [CrossRef] [Scilit]
- Ahn, J.; Rho, T. Influence of customer–firm relationships on customer participation in the service industry. Serv. Bus. 2016, 10, 113–133. [Google Scholar] [CrossRef] [Scilit]
- Hau, L.N.; Tram Anh, P.N.; Thuy, P.N. The effects of interaction behaviors of service frontliners on customer participation in the value co-creation: A study of health care service. Serv. Bus. 2017, 11, 253–277. [Google Scholar] [CrossRef] [Scilit]
- Garrido-Moreno, A.; García-Morales, V.; King, S.; Lockett, N. Social Media use and value creation in the digital landscape: A dynamic-capabilities perspective. J. Serv. Manag. 2020, 31, 313–343. [Google Scholar] [CrossRef] [Scilit]
- Dong, B.; Evans, K.R.; Zou, S. The effects of customer participation in co-created service recovery. J. Acad. Mark. Sci. 2008, 36, 123–137. [Google Scholar] [CrossRef] [Scilit]
- Danarahmanto, P.A.; Primiana, I.; Azis, Y.; Kaltum, U. The sustainable performance of the digital start-up company based on customer participation, innovation, and business model. Bus. Theory Pract. 2020, 21, 115–124. [Google Scholar] [CrossRef] [Scilit]
- Fang, E.; Palmatier, R.W.; Evans, K.R. Influence of customer participation on creating and sharing of new product value. J. Acad. Mark. Sci. 2008, 36, 322–336. [Google Scholar] [CrossRef] [Scilit]
- Park, C.; Lee, H.; Jun, J.; Lee, T. Two-sided effects of customer participation: Roles of relationships and social-interaction values in social services. Serv. Bus. 2018, 12, 621–640. [Google Scholar] [CrossRef] [Scilit]
- Mursid, A.; Wu, C.H.-J. Customer participation, value co-creation and customer loyalty: Evidence from Umrah travel agencies in Indonesia. J. Islamic Mark. 2022, 13, 628–648. [Google Scholar] [CrossRef] [Scilit]
- Le Hau, N.; Thuy, P.N. Customer participation to co-create value in human transformative services: A study of higher education and health care services. Serv. Bus. 2016, 10, 603–628. [Google Scholar]
- Chen, C.-F.; Wang, J.-P. Customer participation, value co-creation and customer loyalty–A case of airline online check-in system. Comput. Hum. Behav. 2016, 62, 346–352. [Google Scholar] [CrossRef] [Scilit]
- Khajeheian, D.; Ebrahimi, P. Media branding and value co-creation: Effect of user participation in social media of newsmedia on attitudinal and behavioural loyalty. Eur. J. Int. Manag. 2021, 16, 499–528. [Google Scholar] [CrossRef] [Scilit]
- Vega-Vazquez, M.; Revilla-Camacho, M.Á.; Cossío-Silva, F.J. The value co-creation process as a determinant of customer satisfaction. Manag. Decis. 2013, 51, 1945–1953. [Google Scholar] [CrossRef] [Scilit]
- See-To, E.W.; Ho, K.K. Value co-creation and purchase intention in social network sites: The role of electronic Word-of-Mouth and trust–A theoretical analysis. Comput. Hum. Behav. 2014, 31, 182–189. [Google Scholar] [CrossRef] [Scilit]
- Guzel, M.; Sezen, B.; Alniacik, U. Drivers and consequences of customer participation into value co-creation: A field experiment. J. Prod. Brand Manag. 2020, 30, 1047–1061. [Google Scholar] [CrossRef] [Scilit]
- Hsu, L.-C. Investigating community members’ purchase intention on Facebook fan page: From a dualistic perspective of trust relationships. Ind. Manag. Data Syst. 2017, 117, 766–800. [Google Scholar] [CrossRef] [Scilit]
- Blasco-Arcas, L.; Hernandez-Ortega, B.; Jimenez-Martinez, J. The online purchase as a context for co-creating experiences. Drivers of and consequences for customer behavior. Internet Res. 2014, 24, 393–412. [Google Scholar] [CrossRef] [Scilit]
- Kelleher, J.D.; Mac Namee, B.; D’Arcy, A. Fundamentals of Machine Learning for Predictive Data Analytics: Algorithms, Worked Examples, and Case Studies; MIT Press: Cambridge, MA, USA, 2020. [Google Scholar]
- Kitsios, F.; Kamariotou, M. Artificial intelligence and business strategy towards digital transformation: A research agenda. Sustainability 2021, 13, 2025. [Google Scholar] [CrossRef] [Scilit]
- Schmidt, J.; Marques, M.R.; Botti, S.; Marques, M.A. Recent advances and applications of machine learning in solid-state materials science. npj Comput. Mater. 2019, 5, 83. [Google Scholar] [CrossRef] [Scilit]
- Al-Anqoudi, Y.; Al-Hamdani, A.; Al-Badawi, M.; Hedjam, R. Using Machine Learning in Business Process Re-Engineering. Big Data Cogn. Comput. 2021, 5, 61. [Google Scholar] [CrossRef] [Scilit]
- Chen, Q.; Lee, S. A Machine Learning Approach to Predict Customer Usage of a Home Workout Platform. Appl. Sci. 2021, 11, 9927. [Google Scholar] [CrossRef] [Scilit]
- Cioffi, R.; Travaglioni, M.; Piscitelli, G.; Petrillo, A.; De Felice, F. Artificial intelligence and machine learning applications in smart production: Progress, trends, and directions. Sustainability 2020, 12, 492. [Google Scholar] [CrossRef] [Scilit]
- Wuest, T.; Weimer, D.; Irgens, C.; Thoben, K.-D. Machine learning in manufacturing: Advantages, challenges, and applications. Prod. Manuf. Res. 2016, 4, 23–45. [Google Scholar] [CrossRef] [Scilit]
- Duan, Y.; Edwards, J.S.; Dwivedi, Y.K. Artificial intelligence for decision making in the era of Big Data–evolution, challenges and research agenda. Int. J. Inf. Manag. 2019, 48, 63–71. [Google Scholar] [CrossRef] [Scilit]
- Obthong, M.; Tantisantiwong, N.; Jeamwatthanachai, W.; Wills, G.B. A Survey on Machine Learning for Stock Price Prediction: Algorithms and Techniques. In Proceedings of the FEMIB 2020—2nd International Conference on Finance, Economics, Management and IT Business, Prague, Czech Republic, 5–6 May 2020. [Google Scholar]
- Carvalho, T.P.; Soares, F.A.; Vita, R.; Francisco, R.D.P.; Basto, J.P.; Alcalá, S.G. A systematic literature review of machine learning methods applied to predictive maintenance. Comput. Ind. Eng. 2019, 137, 106024. [Google Scholar] [CrossRef] [Scilit]
- Ebrahimi, P.; Salamzadeh, A.; Gholampour, A.; Fekete-Farkas, M. Social networks marketing and Hungarian online consumer purchase behavior: The microeconomics strategic view based on IPMA matrix. Acad. Strateg. Manag. J. 2021, 20, 1–7. [Google Scholar]
- Kim, J.O.; Forsythe, S.; Gu, Q.; Moon, S.J. Cross-cultural consumer values, needs and purchase behavior. J. Consum. Mark. 2002, 19, 481–502. [Google Scholar] [CrossRef] [Scilit]
- Etikan, I.; Musa, S.A.; Alkassim, R.S. Comparison of convenience sampling and purposive sampling. Am. J. Theor. Appl. Stat. 2016, 5, 1–4. [Google Scholar] [CrossRef] [Scilit]
- Alshurideh, M.; Al Kurdi, B.; Salloum, S.A.; Arpaci, I.; Al-Emran, M. Predicting the actual use of m-learning systems: A comparative approach using PLS-SEM and machine learning algorithms. Interact. Learn. Environ. 2020, 2020, 1–15. [Google Scholar] [CrossRef] [Scilit]
- Podsakoff, P.M.; MacKenzie, S.B.; Lee, J.-Y.; Podsakoff, N.P. Common method biases in behavioral research: A critical review of the literature and recommended remedies. J. Appl. Psychol. 2003, 88, 879. [Google Scholar] [CrossRef] [Scilit]
- Addagarla, S.K.; Amalanathan, A. Probabilistic unsupervised machine learning approach for a similar image recommender system for E-commerce. Symmetry 2020, 12, 1783. [Google Scholar] [CrossRef] [Scilit]
- Wang, R.; Song, Q.; Liu, Z.; Ma, H.; Gupta, M.K.; Liu, Z. A Novel Unsupervised Machine Learning-Based Method for Chatter Detection in the Milling of Thin-Walled Parts. Sensors 2021, 21, 5779. [Google Scholar] [CrossRef] [Scilit] [PubMed]
- Baldominos, A.; Saez, Y.; Isasi, P. A survey of handwritten character recognition with mnist and emnist. Appl. Sci. 2019, 9, 3169. [Google Scholar] [CrossRef] [Scilit]
- Yuan, C.; Yang, H. Research on K-value selection method of K-means clustering algorithm. J 2019, 2, 226–235. [Google Scholar] [CrossRef] [Scilit]
- Jafarzadegan, M.; Safi-Esfahani, F.; Beheshti, Z. Combining hierarchical clustering approaches using the PCA method. Expert Syst. Appl. 2019, 137, 1–10. [Google Scholar] [CrossRef] [Scilit]
- Melit Devassy, B.; George, S.; Nussbaum, P. Unsupervised clustering of hyperspectral paper data using t-SNE. J. Imaging 2020, 6, 29. [Google Scholar] [CrossRef] [Scilit]
- Severson, K.A.; Molaro, M.C.; Braatz, R.D. Principal component analysis of process datasets with missing values. Processes 2017, 5, 38. [Google Scholar] [CrossRef] [Scilit]
- Li, M.; Kashef, R.; Ibrahim, A. Multi-level clustering-based outlier’s detection (MCOD) using self-organizing maps. Big Data Cogn. Comput. 2020, 4, 24. [Google Scholar] [CrossRef] [Scilit]
- Zhong, M.; Wang, J.; Jiang, T.; Huang, Z.; Chen, X.; Hong, Y. Using the apriori algorithm and Copula function for the bivariate analysis of flash flood risk. Water 2020, 12, 2223. [Google Scholar] [CrossRef] [Scilit]
- Comesaña-Campos, A.; Bouza-Rodríguez, J.B. An application of Hebbian learning in the design process decision-making. J. Intell. Manuf. 2016, 27, 487–506. [Google Scholar] [CrossRef] [Scilit]
- Chen, T.-C.T.; Liu, C.-L.; Lin, H.-D. Advanced artificial neural networks. Algorithms 2018, 11, 102. [Google Scholar] [CrossRef] [Scilit]
- Schaffer, J.D. Initial experiments evolving spiking neural networks with supervised learning capability. Procedia Comput. Sci. 2017, 114, 184–191. [Google Scholar] [CrossRef] [Scilit]
- Lee, J.H.; Shin, J.; Realff, M.J. Machine learning: Overview of the recent progresses and implications for the process systems engineering field. Comput. Chem. Eng. 2018, 114, 111–121. [Google Scholar] [CrossRef] [Scilit]
- Alsharif, M.H.; Kelechi, A.H.; Yahya, K.; Chaudhry, S.A. Machine learning algorithms for smart data analysis in internet of things environment: Taxonomies and research trends. Symmetry 2020, 12, 88. [Google Scholar] [CrossRef] [Scilit]
- Alimi, O.A.; Ouahada, K.; Abu-Mahfouz, A.M.; Rimer, S.; Alimi, K.O.A. A review of research works on supervised learning algorithms for SCADA intrusion detection and classification. Sustainability 2021, 13, 9597. [Google Scholar] [CrossRef] [Scilit]
- Aspuru, J.; Ochoa-Brust, A.; Félix, R.A.; Mata-López, W.; Mena, L.J.; Ostos, R.; Martínez-Peláez, R. Segmentation of the ECG signal by means of a linear regression algorithm. Sensors 2019, 19, 775. [Google Scholar] [CrossRef] [Scilit]
- Wu, X.; Gao, Y.; Jiao, D. Multi-label classification based on random forest algorithm for non-intrusive load monitoring system. Processes 2019, 7, 337. [Google Scholar] [CrossRef] [Scilit]
- Thanh Noi, P.; Kappas, M. Comparison of random forest, k-nearest neighbor, and support vector machine classifiers for land cover classification using Sentinel-2 imagery. Sensors 2018, 18, 18. [Google Scholar] [CrossRef] [Scilit]
- Senekane, M. Differentially private image classification using support vector machine and differential privacy. Mach. Learn. Knowl. Extr. 2019, 1, 483–491. [Google Scholar] [CrossRef] [Scilit]
- He, H.; Li, S.; Hu, L.; Duarte, N.; Manta, O.; Yue, X.-G. Risk factor identification of sustainable guarantee network based on logistic regression algorithm. Sustainability 2019, 11, 3525. [Google Scholar] [CrossRef] [Scilit]
- Rrmoku, K.; Selimi, B.; Ahmedi, L. Application of Trust in Recommender Systems—Utilizing Naive Bayes Classifier. Computation 2022, 10, 6. [Google Scholar] [CrossRef] [Scilit]
- Ma, S.; Yang, P.; Lai, B.; Su, C.; Zhao, W.; Yang, K.; Jin, R.; Cheng, T.; Xu, B. Adaptive gradient estimation stochastic parallel gradient descent algorithm for laser beam cleanup. Photonics 2021, 8, 165. [Google Scholar] [CrossRef] [Scilit]
- Ringle, C.M. Partial Least Squares Structural Equation Modelling (PLS-SEM) Using SmartPLS 3. 2015. Available online: http://www.smartpls.com (accessed on 14 November 2021).
- Hair, J.F., Jr.; Hult, G.T.M.; Ringle, C.M.; Sarstedt, M. A Primer on Partial Least Squares Structural Equation Modeling (PLS-SEM); Sage Publications: Thousand Oaks, CA, USA, 2017. [Google Scholar]
- Hair, J.F.; Risher, J.J.; Sarstedt, M.; Ringle, C.M. When to use and how to report the results of PLS-SEM. Eur. Bus. Rev. 2019, 31, 2–24. [Google Scholar] [CrossRef] [Scilit]
- Ringle, C.M.; Sarstedt, M. Gain more insight from your PLS-SEM results: The importance-performance map analysis. Ind. Manag. Data Syst. 2016, 116, 1865–1886. [Google Scholar] [CrossRef] [Scilit]
- Roshandel-Arbatani, T.; Kawamorita, H.; Ghanbary, S.; Ebrahimi, P. Modelling media entrepreneurship in social media: SEM and MLP-ANN Approach. AD-Minist. 2019, 34, 35–57. [Google Scholar]
- Ebrahimi, P.; Soleimani, M.; Kot, S.; Fekete-Farkas, M.; Alipour, H. COVID-19 crisis and online businesses resilience: A moderated mediation model. Eur. J. Int. Manag. 2021. [Google Scholar] [CrossRef] [Scilit]
- Gholampour, A.; Jamshidi, M.H.M.; Habibi, A.; Motamedi Dehkordi, N.; Ebrahimi, P. The Impact of Hospital Information System on Nurses’ Satisfaction in Iranian Public Hospitals: The Moderating Role of Computer Literacy. J. Inf. Technol. Manag. 2020, 12, 141–159. [Google Scholar]
- Moghadamzadeh, A.; Ebrahimi, P.; Radfard, S.; Salamzadeh, A.; Khajeheian, D. Investigating the role of customer co-creation behavior on social media platforms in rendering innovative services. Sustainability 2020, 12, 6926. [Google Scholar] [CrossRef] [Scilit]
- Janavi, E.; Soleimani, M.; Gholampour, A.; Friedrichsen, M.; Ebrahimi, P. Effect of social media adoption and media needs on online purchase behavior: The moderator roles of media type, gender, age. J. Inf. Technol. Manag. 2021, 13, 1–24. [Google Scholar]
- Rehman Khan, S.A.; Yu, Z. Assessing the eco-environmental performance: An PLS-SEM approach with practice-based view. Int. J. Logist. Res. Appl. 2021, 24, 303–321. [Google Scholar] [CrossRef] [Scilit]
- Liu, Y.; Ting, H.; Ringle, C. Appreciation to and behavior intention regarding upscale ethnic restaurants. J. Hosp. Tour. Res. 2021, 10963480211011544. [Google Scholar] [CrossRef] [Scilit]
- Sarstedt, M.; Hair, J.F., Jr.; Cheah, J.-H.; Becker, J.-M.; Ringle, C.M. How to specify, estimate, and validate higher-order constructs in PLS-SEM. Australas. Mark. J. AMJ 2019, 27, 197–211. [Google Scholar] [CrossRef] [Scilit]
- Fornell, C.; Larcker, D.F. Evaluating structural equation models with unobservable variables and measurement error. J. Mark. Res. 1981, 18, 39–50. [Google Scholar] [CrossRef] [Scilit]
- Manley, S.C.; Hair, J.F.; Williams, R.I.; McDowell, W.C. Essential new PLS-SEM analysis methods for your entrepreneurship analytical toolbox. Int. Entrep. Manag. J. 2021, 17, 1805–1825. [Google Scholar] [CrossRef] [Scilit]
- Kock, N. Common method bias in PLS-SEM: A full collinearity assessment approach. Int. J. E-Collab. IJEC 2015, 11, 1–10. [Google Scholar] [CrossRef] [Scilit]
- Raza, A.; Rather, R.A.; Iqbal, M.K.; Bhutta, U.S. An assessment of corporate social responsibility on customer company identification and loyalty in banking industry: A PLS-SEM analysis. Manag. Res. Rev. 2020, 43, 1337–1370. [Google Scholar] [CrossRef] [Scilit]
- Shmueli, G.; Ray, S.; Estrada, J.M.V.; Chatla, S.B. The elephant in the room: Predictive performance of PLS models. J. Bus. Res. 2016, 69, 4552–4564. [Google Scholar] [CrossRef] [Scilit]
- Shmueli, G.; Sarstedt, M.; Hair, J.F.; Cheah, J.-H.; Ting, H.; Vaithilingam, S.; Ringle, C.M. Predictive model assessment in PLS-SEM: Guidelines for using PLSpredict. Eur. J. Mark. 2019, 53, 2322–2347. [Google Scholar] [CrossRef] [Scilit]
- Henseler, J. Partial least squares path modeling: Quo Vadis? Qual. Quant. 2018, 52, 1–8. [Google Scholar] [CrossRef] [Scilit]
- Ye, K. Key feature recognition algorithm of network intrusion signal based on neural network and support vector machine. Symmetry 2019, 11, 380. [Google Scholar] [CrossRef] [Scilit]
- Zhang, H.; Lu, Y.; Wang, B.; Wu, S. The impacts of technological environments and co-creation experiences on customer participation. Inf. Manag. 2015, 52, 468–482. [Google Scholar] [CrossRef] [Scilit]
- Nambisan, S.; Baron, R.A. Interactions in virtual customer environments: Implications for product support and customer relationship management. J. Interact. Mark. 2007, 21, 42–62. [Google Scholar] [CrossRef] [Scilit]

Publisher’s Note: MDPI stays neutral with regard to jurisdictional claims in published maps and institutional affiliations. |
© 2022 by the authors. Licensee MDPI, Basel, Switzerland. This article is an open access article distributed under the terms and conditions of the Creative Commons Attribution (CC BY) license (https://creativecommons.org/licenses/by/4.0/).