


Abstract
Student retention analytics often treats withdrawal as a single outcome, although students may attribute dropout intention to personal, socioeconomic, and academic pressures simultaneously. We benchmarked nine supervised classifiers for identifying a concurrent three-domain attribution profile in a cross-sectional survey of 333 undergraduates at a Colombian public university campus. The response came from a semi-structured weight-allocation item; an audit found that literal label matching altered 21 classifications because of spelling variants and decimal notation. Nine classifiers—logistic regression, decision tree, random forest, neural network, Gaussian Naïve Bayes, k-nearest neighbors, AdaBoost, gradient boosting, and XGBoost—were fitted using six pre-specified predictors. Models were compared by repeated nested stratified cross-validation (five outer folds, three repeats), inner tuning, fold-contained preprocessing, and training-only threshold selection. The concurrent profile occurred in 256 students (76.9%). Logistic regression achieved the highest mean held-out ROC AUC (0.674, 95% CI 0.644–0.704), closely followed by random forest (0.671, 0.641–0.702); their paired difference was nonsignificant after Holm adjustment. Logistic regression had the highest F1 score (0.788), whereas random forest had the highest balanced accuracy (0.617). AdaBoost did not retain its apparent single-holdout advantage. Housing and financial aid had the largest held-out permutation importance. The predictors provided moderate discrimination of a perceptual profile, not a validated prediction of future dropout. Outcome auditing and leakage-free validation materially changed the model ranking.
1. Introduction
Student persistence has consequences for learners, higher education institutions, and the communities served by public universities. Leaving a degree unfinished can interrupt professional plans, increase the personal and household costs of study, and reduce the social return on public investment in higher education. These pressures are especially visible at regional campuses, where academic transition may coincide with limited household resources, transportation constraints, family responsibilities, and unfamiliarity with university procedures. Guzmán et al. [1] showed that dropout in rural higher education must be understood in relation to the territorial and institutional conditions surrounding students. Persistence is therefore increasingly treated as a multidimensional process shaped by interacting academic, personal, socioeconomic, and institutional factors rather than as a direct consequence of grades alone [2].
Educational data mining has expanded the use of classification models in early-warning and student-support systems. Available approaches range from interpretable statistical models to decision trees, ensembles, and neural networks, and they have been applied to administrative records, academic progress, virtual-learning-environment activity, and student engagement data [3,4]. Nevertheless, reported performance varies across institutions, populations, data sources, and outcome definitions. Recent higher education studies confirm that useful predictive signals may be available before withdrawal, but they also show that model rankings depend on the variables collected and the evaluation design [5,6]. Consequently, results from one institution or dataset cannot be transferred uncritically to another.
A further distinction is required between observed dropout and dropout intention. Observed dropout is a longitudinal event that can be verified through enrollment records after a student interrupts an academic trajectory. Dropout intention is a contemporaneous perception that may precede withdrawal, disappear as circumstances change, or indicate a need for support even when enrollment continues. Maluenda-Albornoz et al. [7] demonstrated that dropout intention is associated with early and changing socio-academic conditions. Motivation, integration, resilience, and available support may subsequently modify the trajectory expressed at the time of measurement [8,9]. A model trained on perceived intentions should therefore be interpreted as classifying a current attribution profile, not as forecasting confirmed attrition.
The dataset analyzed in this study was developed to document contextual and perceptual factors associated with student retention at Universidad Nacional de Colombia, Sede de La Paz. Its survey design, cleaning procedures, codebook, anonymization, and reuse conditions have already been reported in a dedicated data descriptor [10]. Using the same survey, López-López et al. [11] examined the relative weights assigned to personal, socioeconomic, and academic dropout-intention domains through compositional analysis. Those publications provide the descriptive and substantive background; the present article instead evaluates the reliability of supervised classifiers. The response distinguishes students who assigned a positive weight to all three domains from those who assigned a positive weight to two, one, or none. Thus, the positive class represents concurrent multidomain attribution rather than observed dropout or an individual probability of future withdrawal.
An initial workflow compared several classifiers after transforming the three-domain allocation into this binary response and appeared to favor AdaBoost. A methodological audit identified three reasons to re-estimate that comparison: synthetic oversampling had been conducted before the train–test split; model families had not always been evaluated on equivalent partitions; and the response parser expected exact Spanish labels and integer values even though the source field contained spelling variants and decimal allocations. These conditions can alter class membership and model rankings in a sample of 333 observations. Small datasets can support classification, but their performance estimates are sensitive to the observations assigned to each partition, while preprocessing or resampling performed before validation can transmit information from nominally unseen cases into model development [12,13]. Accordingly, every learned operation in the present benchmark was confined to the training data available within each validation cycle.
Model selection also depends on the criterion used for comparison. Accuracy may favor the majority class, whereas sensitivity and specificity address different institutional errors. The F1 score emphasizes positive-class precision and sensitivity, balanced accuracy weights both classes equally, and the Matthews correlation coefficient summarizes all four cells of the confusion matrix. ROC AUC evaluates ranking across thresholds, precision–recall AUC is responsive to class prevalence, and calibration examines whether predicted probabilities correspond to observed frequencies [14]. No single measure therefore identifies a universally preferable classifier. This is particularly relevant when flexible ensembles are compared with parsimonious statistical models: ensembles may capture nonlinear interactions, while simpler models may generalize competitively when the sample and predictor set are limited [15,16].
The study was guided by one research question: which of the nine supervised classifiers most reliably distinguishes students who assigned a positive weight to all three dropout-intention domains from those who assigned a positive weight to fewer domains when all data-dependent operations are contained within repeated nested cross-validation? The objective was to compare nine classifiers spanning linear, tree-based, ensemble, probabilistic, distance-based, and neural approaches under a common leakage-free validation design. Performance was assessed through held-out discrimination, threshold-dependent classification metrics, probability calibration, paired uncertainty, and the stability of predictor contributions.
The article makes four contributions. First, it audits and reconstructs the binary outcome directly from the semi-structured allocation field, treating response parsing as part of model validity. Second, it compares nine classifier families on identical outer partitions while confining preprocessing, tuning, and threshold selection to training data. Third, it reports complementary measures of discrimination, classification, calibration, and uncertainty rather than selecting a model from a single accuracy estimate. Fourth, it estimates held-out permutation importance for the six original predictors and interprets the predictions according to the measured construct, preserving the distinction between concurrent perceived attributions and longitudinally observed dropout.
2. From Multidimensional Persistence Mechanisms to Reliable Classification
The framework proceeds from the phenomenon being measured to the conditions needed to classify it credibly. The layered perspective synthesized by Guzmán et al. [1] motivates an outcome that recognizes simultaneous academic, socioeconomic, and personal relevance. The next step considers how model complexity, limited sample size, and class imbalance shape what can be learned from that outcome. The final step addresses validation and interpretation, because useful educational classification depends on preserving the meaning of the label, preventing leakage, and quantifying uncertainty as much as it depends on algorithm choice [12,13].
2.1. Student Persistence as a Convergence of Academic, Socioeconomic, and Personal Pressures
Persistence decisions arise within a network of conditions that can reinforce or offset one another. Academic difficulty may be manageable when advising, family support, and stable finances are available; the same difficulty may become decisive when transportation, housing, employment, or health pressures are also present. Studies of rural higher education have repeatedly identified this layered structure, with individual, institutional, academic, and socioeconomic factors operating together [1]. For that reason, a student who assigns some relevance to all three domains represents a qualitatively different attribution pattern from a student who assigns relevance to only one domain, even if neither pattern establishes that withdrawal will occur.
The personal domain includes motivation, wellbeing, self-efficacy, family circumstances, and the ability to adapt to university routines. Persistence among first-generation engineering students has been linked to forms of social capital that help learners interpret institutional expectations and access support [9]. Resilience-oriented learning analytics has similarly shown that behavioral and contextual information can identify students who need support without reducing their experience to a deficit label [8]. These findings matter in a regional campus where many students are navigating higher education within families and communities that have had limited prior access to university pathways.
The socioeconomic domain is not limited to income. Housing stability, transportation, food security, employment, and the availability of financial aid can determine whether students have the time and material conditions needed to participate in academic life. Financial support can function as a protective resource, but receiving aid may also identify students whose underlying economic vulnerability is greater. Accordingly, the direction of an association between financial aid and a multidomain attribution profile cannot be interpreted as the causal effect of aid. It may reflect targeting: assistance is directed toward students who already face financial pressure. Recent retention agendas therefore recommend evaluating how support is allocated and combined with academic and psychosocial services rather than treating any single benefit as sufficient [2].
Academic conditions include performance, workload, teaching practices, curricular sequencing, induction, and perceived labor-market relevance. Early-warning systems often rely heavily on grades and course activity because these variables are recorded routinely and can be updated over time. Learning analytics can identify students at risk when behavioral and performance indicators are integrated [17]. Other studies have shown that the predictive contribution of academic variables often increases once students have completed at least part of a semester [18,19]. Survey-based models complement those records by capturing perceptions before or alongside observed academic outcomes.
A three-domain allocation item offers a concise way to represent how students distribute perceived responsibility among personal, socioeconomic, and academic sources. Its value is conceptual rather than diagnostic. Positive weight in each domain indicates that the student recognizes concurrent relevance across the three areas. The allocation does not reveal whether the pressures are severe, whether they persist over time, or whether they will produce withdrawal. It also does not imply that students with one positive domain are free of problems in the other domains; they may simply have assigned zero weight in the forced allocation. The classifier in this study therefore targets a response pattern, not a latent clinical category.
This distinction helps avoid a common inferential shortcut. Predictive models are often described as detecting “dropout risk” even when the label is satisfaction, intention, current enrollment status, or a retrospective record. Maluenda-Albornoz et al. [7] treated dropout intention as an outcome in its own right and emphasized its association with changing conditions. The same discipline is followed here: model outputs are probabilities of a concurrent attribution profile. They may be useful for understanding multidimensional perceptions, but they require longitudinal linkage before they can be presented as probabilities of future attrition.
2.2. Model Complexity, Sample Size, and Imbalance in Educational Prediction
Educational classification studies have used nearly every major supervised-learning family. Logistic regression remains attractive because coefficients are interpretable and regularization can stabilize estimates. Decision trees generate transparent rules and capture interactions, but a single tree is sensitive to sampling variation. Random forests reduce that variance by averaging decorrelated trees, while boosting methods fit sequences of weak learners that focus on residual errors. Distance-based and probabilistic methods offer different inductive assumptions, and neural networks can represent complex nonlinear functions when sufficient data support their parameters.
Reviews of educational data mining show that no algorithm dominates across datasets. Performance depends on preprocessing, feature construction, class balance, and the institutional context as much as on the nominal classifier [4]. Comparative studies likewise report changing rankings across courses and populations, including hybrid regression and multilabel formulations [20,21,22]. This variability is expected: an algorithm is not intrinsically accurate; it is well or poorly matched to a specific data-generating process, sample size, and validation design.
The present sample is small relative to the flexibility of several candidate models. A neural network with many hidden units can memorize patterns that do not recur, and a deep tree can split on rare categories that are unstable across folds. Regularization, shallow structures, minimum leaf sizes, and small architectures are therefore important. Vabalas et al. [12] cautioned that limited samples amplify uncertainty in both model selection and performance estimation. In practical terms, an apparent AUC difference of several hundredths may disappear when the partition changes.
Class imbalance adds another layer. The positive class in this study contains roughly three quarters of the observations, so a classifier can achieve high accuracy or F1 by predicting the majority profile frequently. Precision–recall AUC also begins from a high baseline equal to the positive prevalence. Balanced accuracy and MCC are needed to show whether the minority class is recognized. MCC has been argued to be more informative than accuracy or F1 alone in binary tasks because it uses true and false predictions for both classes [14]. Reporting sensitivity and specificity separately further reveals the institutional trade-off produced by the chosen threshold.
Many retention studies address imbalance with random over- or undersampling, SMOTE, class weights, threshold adjustment, or ensemble design. These methods can be appropriate when applied exclusively within training folds. If synthetic observations are created before a split, however, neighboring synthetic cases can appear on both sides of the evaluation boundary and inflate performance. Kapoor and Narayanan [13] described this broader problem as a reproducibility threat across machine-learning science. The safe rule is straightforward: every learned transformation, including imputation, scaling, category encoding, resampling, feature selection, and threshold selection, belongs inside the training process.
The nine candidates were selected to test complementary assumptions rather than to privilege algorithmic complexity. Together, they represent additive log-odds, recursive partitions and ensembles, conditional probability, local neighborhoods, and compact nonlinear representations. Comparing these families on identical partitions therefore tests whether additional flexibility produces reproducible held-out gains in a small mixed-variable survey dataset.
Recent higher-education applications continue to report strong ensemble results, but they also demonstrate why context matters. Okoye et al. [15] combined machine-learning components to predict retention and graduation, and Hakkal and Ait Lahcen [23] used XGBoost to improve learner-performance prediction. Explainable ensemble studies have highlighted financial and academic factors [24,25]. In larger administrative datasets, these algorithms can exploit detailed nonlinear signals. In a compact survey benchmark with six predictors, the bias–variance balance may instead favor a regularized linear model or a constrained random forest.
2.3. Validation, Interpretability, and Institutional Use
A model intended to inform student support must be judged on unseen cases. Nested cross-validation separates two tasks that are frequently conflated: choosing hyperparameters and estimating generalization. The inner loop selects model settings using only the outer training data; the outer test fold remains untouched until the pipeline is fixed. Repeating the outer folds reduces dependence on one partition and yields paired estimates for every model on the same held-out cases. This design is particularly valuable when the dataset is too small to reserve a large final test set.
Validation must include threshold selection as well as hyperparameter tuning. ROC AUC does not require a class threshold, but sensitivity, specificity, F1, accuracy, and balanced accuracy do. Selecting a threshold on the test fold would overstate those metrics. The threshold should be chosen from training data, ideally from out-of-fold probabilities generated within the inner validation loop. The resulting threshold can differ markedly from 0.50 when prevalence is unequal or probability calibration differs among algorithms.
Interpretability also needs to be evaluated out of sample. Coefficients from logistic regression describe conditional associations under the fitted specification, but categorical reference levels and regularization complicate direct comparison across variables. Tree impurity measures can favor variables with more possible splits. Held-out permutation importance provides a common alternative: a feature is shuffled in the outer test fold, and the decrease in AUC estimates how much that trained pipeline relied on the feature for ranking. The measure is still association-based and can be diluted by correlated predictors, but it uses the same evaluation principle across model families.
Learning analytics can support targeted advising only when model outputs are connected to educational action and governance. Ifenthaler and Yau [3] emphasized that analytics should be integrated with study-success support rather than deployed as an isolated technical product. Early-warning systems also require transparent definitions, staff capacity, and procedures that prevent labels from becoming punitive; recent work on retention strategies similarly stresses that predictive signals need to be connected to concrete institutional responses [26]. Survey perceptions are especially sensitive: a student who acknowledges socioeconomic or personal pressures should not be treated as a likely dropout without further conversation and corroboration.
Institutional usefulness therefore depends on more than maximizing AUC. A model may be valuable as a population-level diagnostic, a tool for prioritizing voluntary outreach, or a prompt for reviewing support services. It may be unsuitable for individual decisions if uncertainty is high or the outcome is only a proxy. Recent work has moved toward combining prediction with explanation and intervention design [16,27,28]. The present benchmark follows that direction while maintaining a narrow claim: it evaluates the reproducibility of a survey-based classification task and identifies the contextual variables on which the leading models depend.
3. Methodology
The analysis was designed as a reproducible secondary benchmark of an anonymized cross-sectional survey. Descriptive characterization was intentionally limited because the dataset and the compositional structure of the three-domain allocation have been reported elsewhere [10,11]. The methodological emphasis was placed on the integrity of the binary outcome, the comparability of the classifiers, and the estimation of held-out performance under a common validation protocol.
Figure 1 summarizes the complete analytical sequence, from auditing the semi-structured outcome and constructing the binary response to fold-contained preprocessing, classifier tuning, repeated nested cross-validation, model comparison, and held-out interpretation. This structure was designed to ensure that every data-dependent operation was learned exclusively from the training data available within each validation cycle.
Figure 1.
Analytic workflow. Note: All learned preprocessing, hyperparameter tuning, and threshold selection were contained within the training portion of each outer split.
3.1. Data Source, Outcome Audit, and Analytic Variables
The source was the cleaned survey dataset on student retention at Universidad Nacional de Colombia, Sede de La Paz. The public release contains 333 records after duplicate removal and removal of direct identifiers. The survey covers sociodemographic background, material conditions, academic satisfaction, perceived intention to leave for personal, socioeconomic, and academic reasons, thematically coded open responses, and a final allocation of weights across the three domains. Data were collected through an online form and are available under a CC BY 4.0 license through the repository cited in the data descriptor [10].
The accompanying data descriptor preserves the original Spanish wording, provides English translations and a bilingual version of the questionnaire, and documents the variables through a codebook covering data types, coding conventions, and missing-value handling [10]. It also reports technical validation procedures comprising duplicate detection, range and category checks, composite-field parsing and integrity assessment, and privacy screening. These procedures support the consistency, traceability, and reproducibility of the released data but are distinct from psychometric validation of the questionnaire. Because the instrument combines background variables, ordinal single-item measures, open-ended responses, and a three-part allocation field rather than items intended to measure a single latent construct, a global internal-consistency coefficient is not applicable to the questionnaire as a whole. No independent psychometric validation study of the complete questionnaire is documented; accordingly, the present analysis treats its items as observed survey variables rather than as indicators of a validated latent scale.
The outcome was derived from the Spanish allocation field that records personal, socioeconomic, and academic weights in that order. The original text-processing rule searched for exact domain labels followed by integers. During the audit, 21 records were found to include variants such as missing letters, inflected labels, or decimal commas. A literal parser assigned zero when an expected label did not match, even when the numeric weight was visible. To reduce dependence on orthography, the primary parser extracted the first three numeric values by position, accepted decimal points or commas, and mapped them to personal, socioeconomic, and academic weights. The order was fixed by the survey prompt.
A student was assigned to the concurrent three-domain class when all three extracted weights were strictly greater than zero. Students assigning a positive weight to two, one, or none of the domains formed the comparison class. The seven non-concurrent presence patterns contained 20, 16, 15, 10, 9, 6, and 1 observations, respectively, compared with 256 observations in the all-positive pattern. Direct estimation of an eight-class model or of higher-order dependencies among the three domain labels would therefore rely on several sparsely populated outcome cells.
The binary target was specified to represent attribution breadth—whether all three domains received a positive weight—rather than attribution severity or the relative distribution of weights across domains. A compositional formulation characterizes variation in the three relative shares, as examined in the related compositional study [11], whereas a multilabel formulation estimates domain-specific presence and, where supported by the data, dependencies among those outcomes. These alternatives address estimands that differ from membership in the concurrent all-domain profile evaluated here. Accordingly, the binary recoding defines a deliberately restricted outcome rather than replacing compositional or multilabel frameworks. This specification improves estimability under the observed sparsity, but it removes information on weight magnitude and the identity of partial domain combinations; these losses delimit interpretation and support future analyses that preserve the full allocation structure in larger cohorts.
The audit also examined the allocation total. Under the position-based parser applied to the analysis file, 288 of the 333 records summed to 100, 20 summed to zero, and 25 had another total. The model did not require the weights to form a mathematically closed composition because the response depended only on whether each domain received a positive weight. Nevertheless, deviations from the intended sum are relevant to interpretation and reinforce the treatment of the outcome as a recorded survey attribution pattern rather than as an error-free composition. The original entries were retained, and both the position-based and literal classifications were preserved to document parser sensitivity.
Six predictors were frozen before the revalidation benchmark. They were the two 1–5 intention scores for socioeconomic and academic reasons, housing type, receipt of financial aid, the coded open-response category describing a socioeconomic reason for leaving, and academic program. These variables reproduce the compact predictor set carried forward in the prior modeling plan and cover ordinal, contextual, and categorical information. No additional full-sample significance screening or post hoc feature expansion was conducted in the present benchmark.
Grade point average, accumulated credits, course repetitions, learning-platform activity, and records of institutional interventions were not included because they are not contained in the public survey release and could not be linked without access to nonpublic administrative systems, additional governance procedures, and a different longitudinal design. Adding those variables would change the study from a reproducible survey-only benchmark into a linked administrative prediction study. Their exclusion preserves comparability with the published dataset but limits the attainable discrimination and the range of student trajectories represented by the models.
The analytic sample had no missing values in the six selected fields. Numeric variables were nevertheless processed with median imputation inside each training fold to make the pipeline robust to future reuse. Categorical variables were processed with most-frequent imputation and one-hot encoding with unknown-category handling. The two numeric scores were standardized using the mean and standard deviation estimated only from the corresponding training fold. Table 1 defines the outcome and predictor roles.
Table 1.
Outcome and predictors used in the benchmark.
3.2. Classifier Formulations and Tuning Spaces
Let denote the concurrent three-domain profile for student i, let be the preprocessed predictor vector, and let be the estimated probability that . The nine classifiers produced a probability or score that was converted to a class only after the training-derived threshold t was chosen: . Comparable educational benchmarks have used these model families to represent additive, local, probabilistic, and nonlinear decision structures [19,20,29].
For -regularized logistic regression, the probability and penalized estimator were
Here, is the intercept, contains the predictor coefficients, and controls shrinkage; the tuned parameter C is inversely related to . The decision tree instead partitioned the predictor space into terminal regions :
where is the positive-class proportion in leaf r and is its Gini impurity. Splits maximized the weighted impurity reduction. Random forest reduced single-tree variance by averaging B trees fitted to bootstrap samples and random predictor subsets,
Thus, B is the number of trees and is the bth randomized tree [21].
The neural network propagated the input through one or two hidden layers,
with , weights , biases , activation function , and an penalty on the weights. The deliberately small architectures limited the number of parameters relative to the sample size, consistent with the use of neural prediction in educational records described by Waheed et al. [30]. Gaussian Naïve Bayes selected the class with the largest product of class prior and feature-specific Gaussian densities,
where is the class prior, and are class-conditional moments, and is the tuned smoothing term. KNN used the Minkowski distance and a local weighted vote,
where contains the K nearest training cases, or 2 gives Manhattan or Euclidean distance, and is uniform or inverse-distance weighting [21,22].
AdaBoost formed an additive score from weak trees. At iteration m, its weighted error and learner weight were
where are observation weights, is a weak learner, is the learning rate, and M is the number of learners. Gradient boosting instead fitted each tree to the negative loss gradient,
with pseudo-residual and step size . XGBoost retained this additive structure but minimized a regularized second-order objective,
where is the new tree, T its number of leaves, the leaf scores, and and penalize complexity. Hakkal and Ait Lahcen [23] illustrates the educational use of this regularized boosting formulation; related comparisons show why boosting should still be evaluated against simpler models on identical partitions [6,15,27].
The tuning ranges were intentionally compact to limit selection variance in the small sample. Logistic regression and the decision tree considered both unweighted and balanced specifications in the inner loop, whereas random forest used balanced class weights in all candidate specifications. Every classifier used a threshold derived only from training predictions. No synthetic oversampling was used in the primary benchmark, removing synthetic-neighbor leakage and keeping the comparison focused on the nine fitted model families. Table 2 records the candidate settings; the broad comparison reflects current educational classification practice rather than an assumption that greater complexity must produce better generalization [31].
Table 2.
Classifier families and pre-specified inner-loop tuning spaces.
The candidate values in Table 2 were fixed before outer-loop evaluation and should not be interpreted as universal optimal settings. They define compact search spaces selected to cover constrained and moderately flexible specifications while limiting selection variance. The value retained for a given outer split was chosen only from that split’s inner training folds by ROC AUC; consequently, selected settings legitimately depend on the available training observations and can vary across splits.
3.3. Leakage-Free Repeated Nested Validation and Threshold Selection
Generalization was estimated with repeated nested stratified cross-validation. The outer loop used five folds repeated three times, producing 15 paired test partitions for every model. In each outer split, approximately 80% of observations were used for training and 20% were held out. The same outer partitions were supplied to all nine algorithms, so performance differences were evaluated on equivalent cases. Stratification preserved the class proportion as closely as possible.
Within each outer training set, a three-fold stratified inner loop selected hyperparameters by ROC AUC. Preprocessing was part of the estimator pipeline and was re-estimated in every inner fold. The selected pipeline was then used to generate inner out-of-fold probabilities for the outer training observations. These probabilities were not predictions for the outer test fold; they were used exclusively to choose a classification threshold.
The threshold maximized balanced accuracy over a dense grid consisting of values from 0.05 to 0.95 and the distinct inner out-of-fold probabilities. When two thresholds produced the same balanced accuracy, the threshold with higher sensitivity was selected. The final model was refitted on the complete outer training set with the chosen hyperparameters and evaluated once on the untouched outer test fold using that threshold. This sequence separated preprocessing, tuning, threshold selection, and performance estimation.
The design follows recommendations for limited-sample validation [12] and directly addresses leakage concerns described in machine-learning research [13]. It also avoids a hidden source of optimism in threshold-dependent metrics. Selecting a 0.50 threshold by convention would be reproducible but not necessarily appropriate for a 76.9% positive prevalence; selecting it on the test fold would be inappropriate. Training-only optimization provides a fair compromise, although thresholds estimated from a small sample remain variable.
The selected hyperparameters were data-dependent within each outer training set and were summarized only as a stability diagnostic. Logistic regression selected without class weights in 12 of 15 outer splits. KNN selected 25 Manhattan-distance neighbors with uniform weighting in 14 splits. Random forest most often selected depth 6, square-root feature sampling, and a minimum leaf size of 8; balanced class weights were fixed across its candidate specifications and were therefore not a data-selected hyperparameter. These frequencies were not treated as inferential evidence or as settings that should transfer automatically to another cohort; they indicate whether the inner loop repeatedly favored constrained or highly flexible specifications in the present data.
3.4. Performance Measures, Uncertainty, and Reproducibility
ROC AUC was the primary performance measure because it evaluates ranking independently of the selected threshold. Precision–recall AUC was also reported, with the recognition that its no-skill reference is the positive prevalence of 0.769 rather than 0.50. Threshold-dependent measures included balanced accuracy, accuracy, F1, sensitivity, specificity, precision, and MCC. Brier score summarized squared probability error, with lower values indicating better probability accuracy.
The earlier modeling terminology included Hamming loss and exact match ratio. In a single-output binary task, exact match ratio is mathematically identical to accuracy, and Hamming loss equals one minus accuracy. They are retained in the comparative table for continuity, but they are not interpreted as independent validation criteria. Their usual distinct role applies to genuine multilabel problems in which each case has multiple simultaneous binary outputs. This clarification is important because the present outcome is one binary recoding of a three-domain allocation.
For each model and metric, the mean and standard deviation across the 15 outer splits were calculated. A nonparametric bootstrap of the 15 split-level values, with 3000 resamples, produced percentile 95% confidence intervals for the mean. Because outer folds within repeated cross-validation are not fully independent, these intervals are descriptive measures of resampling uncertainty rather than exact population confidence intervals.
Paired model comparisons used the 15 matched ROC AUC values. The model with the highest mean AUC was compared with every other model using two-sided paired Wilcoxon signed-rank tests, followed by Holm adjustment across eight comparisons. These tests were treated as secondary and exploratory because the reference model was selected from the same benchmark. A finding was interpreted as evidence of a persistent difference only when the adjusted p value was below 0.05 and the magnitude was consistent with the confidence intervals.
Permutation importance was calculated separately in every outer test fold using five permutations of each original predictor and ROC AUC as the scoring function. Because permutation was applied to the complete trained pipeline, the result represents the contribution of a raw variable, even when the variable expanded into several dummy indicators. Importance values were averaged across the 15 splits, and bootstrap intervals were calculated over split-level means. Negative or near-zero importance indicates that a variable did not improve held-out ranking consistently; it does not prove absence of a substantive relationship.
After the benchmark, the preferred model was chosen through a transparent hierarchy. Mean outer-fold ROC AUC was the primary criterion; when leading models were statistically indistinguishable, F1, balanced accuracy, MCC, Brier score, parsimony, and interpretability were treated as secondary considerations. A shallow regression-tree surrogate was then fitted to student-level probabilities averaged across the three held-out predictions from the selected model. The tree used the same six raw predictors, had a maximum depth of three, and required at least 20 students per terminal node. Five-fold cross-validation quantified probability error and agreement with the selected model’s majority held-out decision. These fidelity measures quantify only how closely the surrogate approximates the selected classifier. They do not validate the tree against the empirical data-generating process, establish causal structure, or provide an additional estimate of dropout-prediction performance. The surrogate did not enter tuning or model ranking.
All analyses were conducted in R version 4.6.0 [32]. The reproducible script implements data import, outcome reconstruction, repeated nested resampling, fold-contained preprocessing, model tuning, threshold selection, performance estimation, paired statistical comparisons, permutation importance, surrogate-tree generation, and figure export. The complete computational workflow is summarized in Appendix A. Random seeds were fixed, tuning grids and validation settings were recorded, and the analysis-ready dataset was included in the reproducibility package. The public source dataset should be cited when the code or processed data are reused [10].
4. Results
The results follow the evidentiary sequence of the benchmark. The outcome audit first establishes class membership and the sensitivity of the target to parsing. The nine classifiers are then compared on the same 15 outer splits, after which paired uncertainty, threshold behavior, and the selection of a preferred benchmark are examined. A compact tree-based surrogate translates the selected model’s repeated held-out decisions into readable pathways, and the section closes with held-out feature importance. Descriptive quantities are limited to those needed to understand prevalence, sparse predictor levels, and metric baselines, so the conclusions rest on matched out-of-sample evidence rather than on a favorable single partition.
4.1. Outcome Integrity and Minimal Sample Profile
The position-based parser classified 256 of 333 students (76.9%) in the concurrent three-domain profile and 77 (23.1%) in the comparison group. The literal label parser classified 235 students as concurrent and 98 as comparison, changing 21 labels. The affected records contained visible nonzero values that were missed by exact label matching or integer-only extraction. Because class membership changed for 6.3% of the sample, parser design was not a negligible preprocessing detail.
Housing and financial aid differed descriptively between the two groups. Among students in the concurrent profile, 165 of 256 (64.5%) reported family-owned or own housing and 151 (59.0%) reported financial aid. In the comparison group, the corresponding counts were 36 of 77 (46.8%) and 32 (41.6%). The median socioeconomic dropout-intention score was 3 in the concurrent group and 4 in the comparison group; the median academic score was 4 and 5, respectively. These directions do not mean that lower intention scores produce a broader attribution profile. The outcome represents whether all domains received positive weight, whereas the two scores measure the reported intensity of considering withdrawal for a specific reason.
Academic-program counts ranged from 37 students in Cultural and Communication Management to 87 in Mechatronics Engineering. The concurrent profile was present in all programs, with proportions varying from 64.6% in Geography to 86.2% in Statistics. Several categories of the coded socioeconomic withdrawal factor were rare. For example, health or wellbeing was represented by one record and lack of government support by two. One-hot encoding with regularized or constrained models reduced, but did not eliminate, the uncertainty created by these small cells.
4.2. Comparative Discrimination and Classification Performance
Logistic regression had the highest mean held-out ROC AUC at 0.674 (bootstrap 95% CI 0.644–0.704), followed closely by random forest at 0.671 (0.641–0.702). XGBoost and KNN had mean AUCs of 0.653 and 0.652, respectively. Gradient boosting, AdaBoost, and Naïve Bayes were between 0.632 and 0.640. The decision tree and neural network were lowest at approximately 0.60. Figure 2 shows the fold-mean estimates and uncertainty intervals.
Figure 2.
Mean held-out ROC AUC across 15 outer splits with bootstrap 95% confidence intervals. Note: The dashed vertical line represents chance discrimination.
The AUC ranking did not translate directly into the same ranking for threshold-dependent metrics. Random forest had the highest mean balanced accuracy (0.617), narrowly above logistic regression (0.614). Logistic regression achieved the highest mean accuracy/exact match ratio (0.693) and F1 score (0.788), largely because its mean sensitivity was 0.759. Its specificity was lower at 0.470. Random forest traded sensitivity (0.654) for higher specificity (0.581), producing a more even class balance but a lower F1 score of 0.731.
XGBoost provided the lowest mean Brier score (0.169), followed by gradient boosting (0.170), logistic regression (0.174), AdaBoost (0.174), and KNN (0.175). Naïve Bayes had a markedly worse Brier score of 0.601, reflecting unstable probability estimates even though its AUC remained above chance. The positive-class prevalence explains the high precision–recall AUC values, which ranged from 0.820 to 0.868. Because the baseline PR AUC was 0.769, the absolute gains were more modest than the raw values might suggest.
Table 3 presents the complete comparison. Accuracy and exact match ratio share the same column, and Hamming loss is their complement. Figure 3 highlights the divergence between balanced accuracy and F1. The neural network and AdaBoost illustrate why relying on F1 alone can be misleading: both could classify the majority profile often enough to obtain an F1 above their balanced accuracy, while minority-class recognition remained limited.
Table 3.
Mean held-out performance across repeated nested cross-validation.
Figure 3.
Mean held-out balanced accuracy and F1 score. Note: Their divergence reflects the high prevalence of the positive class and differences in sensitivity–specificity trade-offs.
4.3. Stability, Paired Comparisons, and Threshold Behavior
The logistic and random-forest AUC confidence intervals overlapped almost completely, and their paired difference was not significant (Holm-adjusted ). Logistic regression also did not remain significantly different from XGBoost, KNN, gradient boosting, or Naïve Bayes after multiplicity correction. It was significantly higher than AdaBoost (), the decision tree (), and the neural network (). These comparisons support a top tier rather than a single unequivocal winner, with logistic regression favored for parsimony and probability quality and random forest favored for balanced accuracy and specificity.
AUC variability was substantial. Logistic-regression split values ranged from 0.593 to 0.781, and random forest ranged from 0.585 to 0.774. The decision tree had the broadest instability among the simpler models, while the neural network was consistently weak and reached an AUC below 0.50 in one split. This spread shows how a single holdout can produce an optimistic or pessimistic ranking. An AdaBoost split reached 0.744, close to its earlier holdout result, but its mean across all splits was only 0.637.
Training-only thresholds were generally above 0.50 because the positive profile was common and probability scales differed among estimators. The mean threshold was 0.672 for logistic regression, 0.542 for random forest, 0.699 for AdaBoost, 0.757 for gradient boosting, and 0.757 for XGBoost. KNN averaged 0.735. Naïve Bayes thresholds varied from 0 to 1, consistent with its poor Brier score and unstable posterior probabilities. Threshold variability should be considered before operational deployment, because a single fixed cutoff may not transfer to another cohort.
Figure 4 plots ROC curves from repeated out-of-fold probabilities averaged at the student level. The pooled curves are descriptive and do not replace the split-level primary analysis. Random forest had a slightly higher pooled AUC than logistic regression, even though logistic regression had the higher mean outer-fold AUC. The difference arises because averaging repeated predictions and pooling all students weights observations differently from averaging 15 fold-specific AUC values. Both summaries place the two models in the same performance tier.
Figure 4.
ROC curves based on student-level averages of repeated held-out probabilities. Note: Values in the legend are pooled out-of-fold AUCs and are provided for visualization; inferential comparisons use the 15 paired outer-split AUCs.
4.4. Preferred Model Selection and Decision-Tree Representation
Mean outer-fold ROC AUC was the primary selection criterion, so logistic regression was retained as the preferred benchmark. Its AUC of 0.674 was only 0.003 above random forest and the paired difference was nonsignificant; the choice therefore does not imply universal superiority. Logistic regression was favored because it also had the highest F1 (0.788), accuracy (0.693), and MCC (0.219), a competitive Brier score (0.174), and the most direct interpretation. Random forest remains a co-leading alternative when specificity or balanced accuracy is the institutional priority.
To provide a rule-based representation, a shallow regression-tree surrogate was fitted to the mean of each student’s three held-out logistic probabilities. The mean decision threshold was 0.672. In five-fold cross-validation, the surrogate achieved a mean absolute error of 0.071 and an of 0.454 for those probabilities. After applying the 0.672 threshold, it reproduced 79.9% of the logistic model’s student-level majority decisions, with balanced fidelity of 0.812. These quantities measure approximation fidelity to the fitted logistic classifier; they are not evidence that the tree recovers the underlying empirical data-generating process, and they are not independent estimates of classification performance or future dropout.
Figure 5 places the reported socioeconomic withdrawal reason at the root, followed mainly by housing and financial aid. Among students who named a socioeconomic reason and lived in rented housing, the mean selected-model probability rose from 0.657 without financial aid to 0.750 with aid. For those in family-owned or own housing, the corresponding leaves were 0.821 outside Biology and 0.719 in Biology. The branches summarize fitted associations and do not identify causal effects of aid, housing, or program membership.
Figure 5.
Shallow decision-tree surrogate for the preferred logistic-regression benchmark. Note: The symbol p denotes the mean of three repeated held-out logistic probabilities; leaves are labeled with the mean held-out threshold of 0.672. The tree approximates the fitted model’s decision surface and should not be interpreted as the data-generating process, a causal structure, or an independently validated dropout classifier.
When no specific socioeconomic reason was reported, rented housing produced the lowest leaf probability (0.533). Within family-owned or own housing, the probability was 0.735 when the academic withdrawal-intention score was at most 4.5 and 0.616 when it was higher. This direction reflects the distinction between breadth and intensity: the target records positive weight across all three domains, whereas the academic score measures intensity within one domain. The tree therefore explains how the selected classifier organizes the available information without converting the perceptual profile into a longitudinal risk rule.
4.5. Held-Out Feature Importance
Permutation importance for logistic regression identified housing type as the most consistent contributor to held-out discrimination (Figure 6). Permuting housing reduced AUC by a mean of 0.044 (95% CI 0.029–0.057). Financial aid was second at 0.033 (0.026–0.041), followed by the coded socioeconomic withdrawal factor at 0.025 (0.008–0.040). These three contextual variables had intervals above zero.
Figure 6.
Held-out raw-feature permutation importance for logistic regression. Note: Results are shown for the model with the highest mean outer-fold ROC AUC. Points are mean decreases in ROC AUC; bars are bootstrap 95% confidence intervals over outer splits.
Academic program had a mean importance of 0.017, but its interval crossed zero ( to 0.036), indicating variation across partitions. The academic and socioeconomic 1–5 intention scores had mean decreases of 0.010 and 0.007, respectively, with intervals touching or crossing zero. Their low permutation importance does not contradict group differences in medians. Once housing, aid, program, and the coded socioeconomic factor were available, the ordinal scores added little stable ranking information to the fitted logistic pipeline.
The random-forest importance ordering was similar: housing and financial aid were first, followed by program and the two intention scores. Agreement across the two leading models increases confidence that the contextual variables were not merely artifacts of a particular functional form. Still, permutation importance does not identify causal effects. Housing and aid may be proxies for broader economic circumstances, and correlated information can be distributed across predictors.
5. Discussion
The findings indicate that concurrent multidomain dropout-intention attribution is better approached through reliable model comparison than through a search for a single dominant algorithm. Logistic regression and random forest formed the leading group under leakage-free validation, but their relative advantages depended on the evaluation criterion and the institutional consequences of different errors. Interpretation must therefore integrate the modest magnitude of discrimination, the sensitivity of rankings to validation design, the contextual meaning of the predictors, and the methodological and ethical limits of any future application.
5.1. Model Performance and the Meaning of a Preferred Classifier
Under the leakage-free repeated nested design, the initial single-holdout advantage of AdaBoost did not persist. Logistic regression and random forest formed the leading group, with nearly identical mean ROC AUCs and overlapping uncertainty. Logistic regression achieved the highest mean F1 score, accuracy, and MCC, whereas random forest produced the highest balanced accuracy and greater specificity.
Selecting logistic regression as the preferred benchmark is consequently a decision under near-equivalence rather than evidence that the remaining classifiers are uniformly inferior. ROC AUC was designated as the primary criterion, and logistic regression combined the highest mean value with a parsimonious structure and stable threshold-dependent performance. Random forest remains an equally defensible option when institutional priorities assign greater value to recognizing students outside the concurrent three-domain group. This interpretation is more informative than selecting a winner by counting the number of unrelated metrics led by each algorithm [33].
Absolute performance remained moderate. Mean ROC AUCs close to 0.67 and balanced accuracy near 0.62 indicate discrimination above chance, but they do not justify automated or high-stakes individual decisions. These results position the models as methodological baselines rather than as state-of-the-art predictive systems. Their principal contribution lies in showing that outcome reconstruction, leakage control, paired resampling, and training-only threshold selection can materially alter an apparently favorable model ranking. The observed magnitude is credible for a model based on six predictors, 333 respondents, and a subjective allocation profile rather than a longitudinally verified behavioral outcome. Limited-sample research has shown that apparent performance differences can be unstable, while reviews of learning analytics emphasize that predictive outputs are most defensible when they support, rather than replace, professional judgment and student-centered intervention [3].
The outcome audit was as consequential as the algorithm comparison. Literal matching changed 21 classifications and therefore modified class prevalence, fitted boundaries, and subsequent estimates of performance. The data descriptor and compositional analysis document the survey field and the substantive meaning of the three-domain allocation; the present audit extends that work by showing that spelling variants, grammatical forms, and decimal values must be preserved when the response is reconstructed [10,11]. Model validity in this setting begins with a reproducible definition of the outcome, not with the choice of classifier.
5.2. Why the Apparent Model Ranking Changed
Partition dependence was the first mechanism. With only 77 comparison-class observations under the primary parser, each outer test fold contained relatively few such cases. Moving a small number of difficult observations between training and testing was sufficient to change specificity, balanced accuracy, and ROC AUC, occasionally reversing the order of the leading models. Reusing the same 15 outer splits separated algorithmic differences from sample-composition effects and made paired uncertainty estimable. This behavior is consistent with evidence that limited samples require repeated evaluation and with recent retention studies that use nested cross-validation to reduce optimistic model selection [12,28].
The order of oversampling and partitioning was a second mechanism. Synthetic observations created before a holdout can remain closely related to cases later assigned to the evaluation set, weakening the intended separation between model development and testing. Kapoor and Narayanan [13] showed that preprocessing and resampling leakage can produce optimistic machine-learning results even when individual analytical steps appear reasonable. Accordingly, future comparisons of SMOTE, weighting, or other imbalance treatments should estimate those operations exclusively within each training fold.
Sample size constrained both the usable feature space and the precision with which high-capacity models could be evaluated. The six raw predictors expanded to 20 columns after one-hot encoding, while only 77 observations belonged to the comparison class and several categorical levels contained one or two cases. Flexible trees, boosting sequences, and neural networks could therefore fit many split or weight parameters from limited minority-class information, increasing variance across folds and making feature contributions less stable. The repeated outer splits quantify part of this uncertainty, but they cannot supply the independent information that a larger and more diverse cohort would provide.
The leading models were also well matched to the information available. After categorical encoding, much of the stable signal was approximately additive, favoring regularized logistic regression. Random forest remained competitive because aggregation and minimum-leaf constraints reduced the variance of individual trees. In contrast, a single tree lacked that averaging, and the neural network had insufficient information to estimate a stable nonlinear surface. Recent educational comparisons demonstrate that tree ensembles and boosting can perform strongly, but their advantage depends on sample size, predictor richness, outcome definition, and validation design rather than on algorithmic complexity alone [23,34].
5.3. Substantive Interpretation of Predictors and Decision Pathways
Housing type and financial aid were the most stable contributors to held-out ranking, but both should be interpreted as markers of material context rather than isolated causes. Family-owned or own housing may represent residential stability and family support, while rented housing may reflect financial strain, geographic mobility, autonomy, or proximity to campus. Similarly, students receiving aid may be more likely to exhibit the concurrent profile because assistance is targeted toward previously recognized need, not because the aid itself produces dropout intention. Romero and Liao [16] and Rabelo and Zárate [35] likewise identified financial and socioeconomic conditions as relevant to higher-education dropout models; the former further estimated a protective association for scholarship receipt after adjustment for observed confounding. The contrast with the present predictive association reinforces the importance of distinguishing an intervention effect on observed dropout from a marker of vulnerability within a cross-sectional perception profile.
The coded socioeconomic withdrawal reason added information beyond the two ordinal intention scores. This result is consistent with recent explainable models in which contextual categories and feature-level explanations contributed information not captured by standardized academic measures alone [24,25]. In the surrogate tree, reporting a specific socioeconomic reason created the first split, after which housing and aid differentiated the selected model’s mean probabilities. The tree is useful only as an approximation of interactions in the fitted logistic decision surface. Its cross-validated fidelity describes agreement with that model, not recovery of the true empirical data-generating process; accordingly, the branches are neither causal pathways nor an independent competitor in the benchmark.
Academic program appeared in one surrogate branch even though its permutation-importance interval crossed zero. This contrast illustrates why a local split should not be interpreted as a stable program-level effect. Program categories may proxy differences in workload, cohort composition, curricular sequencing, or unmeasured selection, and the broad uncertainty argues against labeling any program as intrinsically problematic. The two domain-specific intention scores also contributed little stable ranking information once contextual variables were included, possibly because they represent intensity within individual domains whereas the outcome represents breadth across all three domains.
5.4. Implications for Retention Analytics and Institutional Use
The findings complement research based on administrative and digital traces. Prior grades, course completion, and engagement sequences can provide stronger temporal signals, whereas surveys capture perceptions, family circumstances, and stated reasons that are usually absent from routine information systems [36]. A prospective combination of these sources may improve discrimination while preserving the contextual information required to design humane and appropriately targeted support.
Recent comparative research often reports an advantage for ensembles, but the conditions of those studies differ materially from the present task. Umendu et al. [28] and Okoye et al. [15] reported strong ensemble performance in multiclass retention and retention–graduation settings based on substantially larger datasets and broader predictor spaces. The present results do not contradict that finding. Instead, they show that a compact survey dataset with six original predictors may favor a regularized linear model, and that algorithm rankings should not be transferred across institutions without matching the outcome, prevalence, predictors, and validation procedure.
Metric context is equally important. A PR AUC near 0.86 appears high until it is compared with the positive-class prevalence of 0.769, whereas studies with rare positive outcomes face the opposite interpretive problem. Reporting prevalence, ROC AUC, PR AUC, balanced accuracy, sensitivity, specificity, calibration error, and MCC prevents one favorable number from determining the narrative. Metric selection should also correspond to the intended retention activity: broad voluntary outreach may prioritize sensitivity, while resource-intensive support may require greater precision or specificity [2,14].
Repeated nested validation provides a distribution of plausible performance rather than a single favorable score, but it does not constitute prospective deployment evidence. Given the moderate discrimination, the most defensible immediate application is at the aggregate level, where institutions can examine whether housing, financial-aid, and socioeconomic-support services correspond to the concerns reported by students. Any future individual-level pilot should be evaluated in a later cohort, align classification thresholds with the available advising capacity, and use model outputs only to invite students to voluntary and supportive conversations. The resulting signal should be corroborated with each student’s own account rather than treated as a definitive assessment. Institutions should also document whether outreach was accepted and useful, monitor calibration, sensitivity, false-positive rates, and performance disparities across student groups, and suspend the system if predictive quality or equity deteriorates. A survey-based score should not be used to restrict enrollment, financial assistance, or academic opportunity; its appropriate role is carefully governed support under uncertainty rather than automated classification of students as likely to leave.
5.5. Limitations and Future Research
The study is cross-sectional, single-institutional, and based on self-reported perceptions. The outcome represents concurrent attribution across three dropout-intention domains rather than observed withdrawal, and no temporal ordering supports causal interpretation. The 333 respondents may also differ systematically from students who did not participate, limiting population-level generalization. Although the released dataset underwent documented technical validation, the published documentation does not report an independent psychometric validation study of the complete heterogeneous questionnaire. Differences in item interpretation, measurement error, and social-desirability effects may therefore attenuate or distort the modeled associations.
The positive class is common, several categorical levels are sparse, and binary recoding removes the magnitude and identity of the partial combinations contained in the original three-part allocation. The survey-only predictor set excludes grade point average, credit progression, course repetitions, learning-platform activity, and documented institutional interventions; those variables may provide stronger temporal information than the six public survey predictors. The confidence intervals derived from repeated outer folds summarize empirical variability but should remain descriptive because fold estimates are not fully independent. The surrogate tree further simplifies the selected model and does not reproduce every feature contribution or probability boundary. Prospective performance in routine practice is unknown and may be lower than the internal estimates; the present results do not support operational individual-level decision support without temporal and external validation.
Future work should link survey responses to semester-by-semester enrollment outcomes, preserve the full compositional or multilabel structure in larger cohorts, and compare fold-contained imbalance treatments. External validation at another campus or in a later semester should precede threshold adoption. Prospective studies should also evaluate temporal calibration, subgroup fairness, intervention effects, and the incremental value of combining survey, administrative, and learning-platform data. These extensions would determine whether the current benchmark can evolve from a reproducible classification exercise into a transparent and ethically governed retention-support instrument.
6. Conclusions
This study compared nine supervised classifiers after auditing the response and applying a common repeated nested validation design. Logistic regression was selected as the preferred benchmark because it had the highest mean outer-fold ROC AUC and the strongest F1, accuracy, and MCC, although random forest remained statistically indistinguishable and achieved the best balanced accuracy. The most accurate interpretation is therefore a leading pair with different operating strengths rather than an unequivocal algorithmic winner.
The leakage-free validation workflow materially changed the model ranking. Robust parsing, fold-contained preprocessing, paired partitions, inner tuning, and training-only threshold selection reduced the optimism associated with the earlier single-holdout result. The shallow decision-tree surrogate reproduced most student-level held-out logistic decisions and made the fitted pathways easier to inspect, but it did not create an additional predictive claim. For small educational datasets, the evaluation protocol and the integrity of the label can matter as much as model complexity.
Housing, financial aid, and the reported socioeconomic withdrawal reason were the most stable contributors to discrimination. These variables indicate where voluntary academic, financial, and psychosocial support may need to be coordinated, but their associations are not causal and should not be used to stigmatize students or programs. The selected model estimates a perceptual pattern in which all three domains receive positive weight; it does not estimate the probability of confirmed future withdrawal.
The next evidentiary step is longitudinal and external validation. Larger cohorts should preserve the original domain weights, incorporate academic trajectories and engagement indicators, and examine calibration and differential error. The present AUC values are modest and should not be interpreted as evidence that the model is ready for operational individual-level decision support. Within these limits, the benchmark contributes a reproducible method for auditing labels and comparing classifiers transparently, providing a foundation for future retention analytics centered on voluntary outreach, coordinated student support, and protection against automated exclusion.
Author Contributions
Conceptualization, O.E.B.-C. and C.D.C.-Á.; methodology, O.E.B.-C.; formal analysis, M.A.G.-G.; data curation, C.D.C.-Á.; writing—original draft, O.E.B.-C. and M.A.G.-G.; writing—review and editing, C.D.C.-Á.; visualization, M.A.G.-G.; supervision, O.E.B.-C. and C.D.C.-Á. All authors have read and agreed to the published version of the manuscript.
Funding
This research received no external funding.
Data Availability Statement
The dataset supporting the results of this study is publicly available in the Mendeley Data repository [37]. The repository contains the cleaned survey dataset and accompanying documentation describing the dataset structure and variables.
Acknowledgments
During the preparation of this manuscript, the author used ChatGPT (version 5.5, OpenAI) for limited language editing and stylistic refinement. No generative AI tools were used for study design, data collection, data analysis, or interpretation of results. The authors reviewed and edited all AI-assisted outputs and take full responsibility for the content of this publication.
Conflicts of Interest
The authors declare no conflicts of interest.
Appendix A. Pseudocode for the Reproducible Classification Benchmark
This appendix summarizes the computational workflow implemented in the reproducible R script. The pseudocode emphasizes the operations required to avoid data leakage, including fold-contained preprocessing, inner-loop hyperparameter tuning, threshold selection based only on training predictions, and held-out evaluation in repeated outer folds.
| Algorithm A1 Leakage-free benchmarking workflow used for concurrent multidomain dropout-intention attribution |
|
References
- Guzmán, A.; Barragán, S.; Cala-Vitery, F. Dropout in rural higher education: A systematic review. Front. Educ. 2021, 6, 727833. [Google Scholar] [CrossRef] [Scilit]
- Gonçalves, G.S.; Serra, F.A.R.; Storopoli, J.E.; Scafuto, I.C.; Rafael, D.N. Undergraduate student retention activities: Challenges and research agenda. SAGE Open 2024, 14, 1–21. [Google Scholar] [CrossRef] [Scilit]
- Ifenthaler, D.; Yau, J.Y.-K. Utilising learning analytics to support study success in higher education: A systematic review. Educ. Technol. Res. Dev. 2020, 68, 1961–1990. [Google Scholar] [CrossRef] [Scilit]
- Namoun, A.; Alshanqiti, A. Predicting student performance using data mining and learning analytics techniques: A systematic literature review. Appl. Sci. 2021, 11, 237. [Google Scholar] [CrossRef] [Scilit]
- Vaarma, M.; Li, H. Predicting student dropouts with machine learning: An empirical study in Finnish higher education. Technol. Soc. 2024, 76, 102474. [Google Scholar] [CrossRef] [Scilit]
- Carballo-Mendívil, B.; Arellano-González, A.; Ríos-Vázquez, N.J.; Lizardi-Duarte, M.d.P. Predicting student dropout from day one: XGBoost-based early warning system using pre-enrollment data. Appl. Sci. 2025, 15, 9202. [Google Scholar] [CrossRef] [Scilit]
- Maluenda-Albornoz, J.; Infante-Villagrán, V.; Galve-González, C.; Flores-Oyarzo, G.; Berríos-Riquelme, J. Early and dynamic socio-academic variables related to dropout intention: A predictive model made during the pandemic. Sustainability 2022, 14, 831. [Google Scholar] [CrossRef] [Scilit]
- Russell, J.-E.; Smith, A.; Larsen, R. Elements of success: Supporting at-risk student resilience through learning analytics. Comput. Educ. 2020, 152, 103890. [Google Scholar] [CrossRef] [Scilit]
- Martin, J.P.; Stefl, S.K.; Cain, L.W.; Pfirman, A.L. Understanding first-generation undergraduate engineering students’ entry and persistence through social capital theory. Int. J. STEM Educ. 2020, 7, 37. [Google Scholar] [CrossRef] [Scilit]
- López-López, E.M.; Bru-Cordero, O.E.; Correa-Álvarez, C.D. A survey dataset on student retention in higher education: A Colombian public university case. Data 2026, 11, 75. [Google Scholar] [CrossRef] [Scilit]
- López-López, E.M.; Bru-Cordero, O.E.; Correa-Álvarez, C.D. Perceived factors associated with dropout intention: Compositional evidence for sustainable higher education from a Colombian public university. Sustainability 2026, 18, 4151. [Google Scholar] [CrossRef] [Scilit]
- Vabalas, A.; Gowen, E.; Poliakoff, E.; Casson, A.J. Machine learning algorithm validation with a limited sample size. PLoS ONE 2019, 14, e0224365. [Google Scholar] [CrossRef] [Scilit] [PubMed]
- Kapoor, S.; Narayanan, A. Leakage and the reproducibility crisis in machine-learning-based science. Patterns 2023, 4, 100804. [Google Scholar] [CrossRef] [Scilit] [PubMed]
- Chicco, D.; Jurman, G. The advantages of the Matthews correlation coefficient (MCC) over F1 score and accuracy in binary classification evaluation. BMC Genom. 2020, 21, 6. [Google Scholar] [CrossRef] [Scilit] [PubMed]
- Okoye, K.; Nganji, J.T.; Escamilla, J.; Hosseini, S. Machine learning model (RG-DMML) and ensemble algorithm for prediction of students’ retention and graduation in education. Comput. Educ. Artif. Intell. 2024, 6, 100205. [Google Scholar] [CrossRef] [Scilit]
- Romero, S.; Liao, X. Statistical and machine learning models for predicting university dropout and scholarship impact. PLoS ONE 2025, 20, e0325047. [Google Scholar] [CrossRef] [Scilit] [PubMed]
- Akçapınar, G.; Altun, A.; Aşkar, P. Using learning analytics to develop early-warning system for at-risk students. Int. J. Educ. Technol. High. Educ. 2019, 16, 40. [Google Scholar] [CrossRef] [Scilit]
- Segura, M.; Mello, J.; Hernández, A. Machine learning prediction of university student dropout: Does preference play a key role? Mathematics 2022, 10, 3359. [Google Scholar] [CrossRef] [Scilit]
- Sandoval-Palis, I.; Naranjo, D.; Vidal, J.; Gilar-Corbi, R. Early dropout prediction model: A case study of university leveling course students. Sustainability 2020, 12, 9314. [Google Scholar] [CrossRef] [Scilit]
- Kabathova, J.; Drlik, M. Towards predicting student’s dropout in university courses using different machine learning techniques. Appl. Sci. 2021, 11, 3130. [Google Scholar] [CrossRef] [Scilit]
- Yağcı, M. Educational data mining: Prediction of students’ academic performance using machine learning algorithms. Smart Learn. Environ. 2022, 9, 11. [Google Scholar] [CrossRef] [Scilit]
- Alshanqiti, A.; Namoun, A. Predicting student performance and its influential factors using hybrid regression and multi-label classification. IEEE Access 2020, 8, 203827–203844. [Google Scholar] [CrossRef] [Scilit]
- Hakkal, S.; Ait Lahcen, A. XGBoost to enhance learner performance prediction. Comput. Educ. Artif. Intell. 2024, 7, 100254. [Google Scholar] [CrossRef] [Scilit]
- Mustofa, S.; Emon, Y.R.; Mamun, S.B.; Akhy, S.A.; Ahad, M.T. A novel AI-driven model for student dropout risk analysis with explainable AI insights. Comput. Educ. Artif. Intell. 2025, 8, 100352. [Google Scholar] [CrossRef] [Scilit]
- Khatun, M.R.; Mim, M.A.; Tasin, M.M.; Hossain, M.M. A hybrid framework of statistical, machine learning, and explainable AI methods for school dropout prediction. PLoS ONE 2025, 20, e0331917. [Google Scholar] [CrossRef] [Scilit] [PubMed]
- Tang, Z.; von Seekamm, K.; Colina, F.E.; Chen, L. Enhancing student retention with machine learning: A data-driven approach to predicting college student persistence. J. Coll. Stud. Retent. Res. Theory Pract. 2025. advance online publication. [Google Scholar] [CrossRef] [Scilit]
- Jiménez-Gutiérrez, A.L.; Mota-Hernández, C.I.; Mezura-Montes, E.; Alvarado-Corona, R. Application of the performance of machine learning techniques as support in the prediction of school dropout. Sci. Rep. 2024, 14, 3957. [Google Scholar] [CrossRef] [Scilit] [PubMed]
- Umendu, E.C.; Ghanzanfar, M.; Kans, A.; Ahad, M.A.R. Enhancing student retention in higher education institutions (HEIs): Machine learning approach. Electronics 2026, 15, 734. [Google Scholar] [CrossRef] [Scilit]
- Oqaidi, K.; Aouhassi, S.; Mansouri, K. Towards a students’ dropout prediction model in higher education institutions using machine learning algorithms. Int. J. Emerg. Technol. Learn. 2022, 17, 103–117. [Google Scholar] [CrossRef] [Scilit]
- Waheed, H.; Hassan, S.-U.; Aljohani, N.R.; Hardman, J.; Alelyani, S.; Nawaz, R. Predicting academic performance of students from VLE big data using deep learning models. Comput. Hum. Behav. 2020, 104, 106189. [Google Scholar] [CrossRef] [Scilit]
- Hassan, M.A.; Muse, A.H.; Nadarajah, S. Predicting student dropout rates using supervised machine learning: Insights from the 2022 National Education Accessibility Survey in Somaliland. Appl. Sci. 2024, 14, 7593. [Google Scholar] [CrossRef] [Scilit]
- R Core Team. R: A Language and Environment for Statistical Computing; R Foundation for Statistical Computing: Vienna, Austria, 2026; Available online: https://www.R-project.org/ (accessed on 18 February 2026).
- Psyridou, M.; Prezja, F.; Torppa, M.; Lerkkanen, M.-K.; Poikkeus, A.-M.; Vasalampi, K. Machine learning predicts upper secondary education dropout as early as the end of primary school. Sci. Rep. 2024, 14, 12956. [Google Scholar] [CrossRef] [Scilit] [PubMed]
- Guanin-Fajardo, J.H.; Guaña-Moya, J.; Casillas, J. Predicting academic success of college students using machine learning techniques. Data 2024, 9, 60. [Google Scholar] [CrossRef] [Scilit]
- Rabelo, A.M.; Zárate, L.E. A model for predicting dropout of higher education students. Data Sci. Manag. 2025, 8, 72–85. [Google Scholar] [CrossRef] [Scilit]
- Marcolino, M.R.; Porto, T.R.; Primo, T.T.; Targino, R.; Ramos, V.; Queiroga, E.M.; Muñoz, R.; Cechinel, C. Student dropout prediction through machine learning optimization: Insights from Moodle log data. Sci. Rep. 2025, 15, 9840. [Google Scholar] [CrossRef] [Scilit] [PubMed]
- Correa, C. Survey Dataset on Student Retention at the National University of Colombia, La Paz Campus (2025). Mendeley Data. Version 2. 2026. Available online: https://data.mendeley.com/datasets/kxgrpy8sfp/2 (accessed on 20 May 2026). [CrossRef]
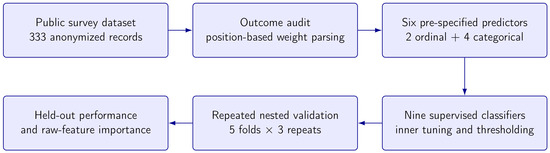
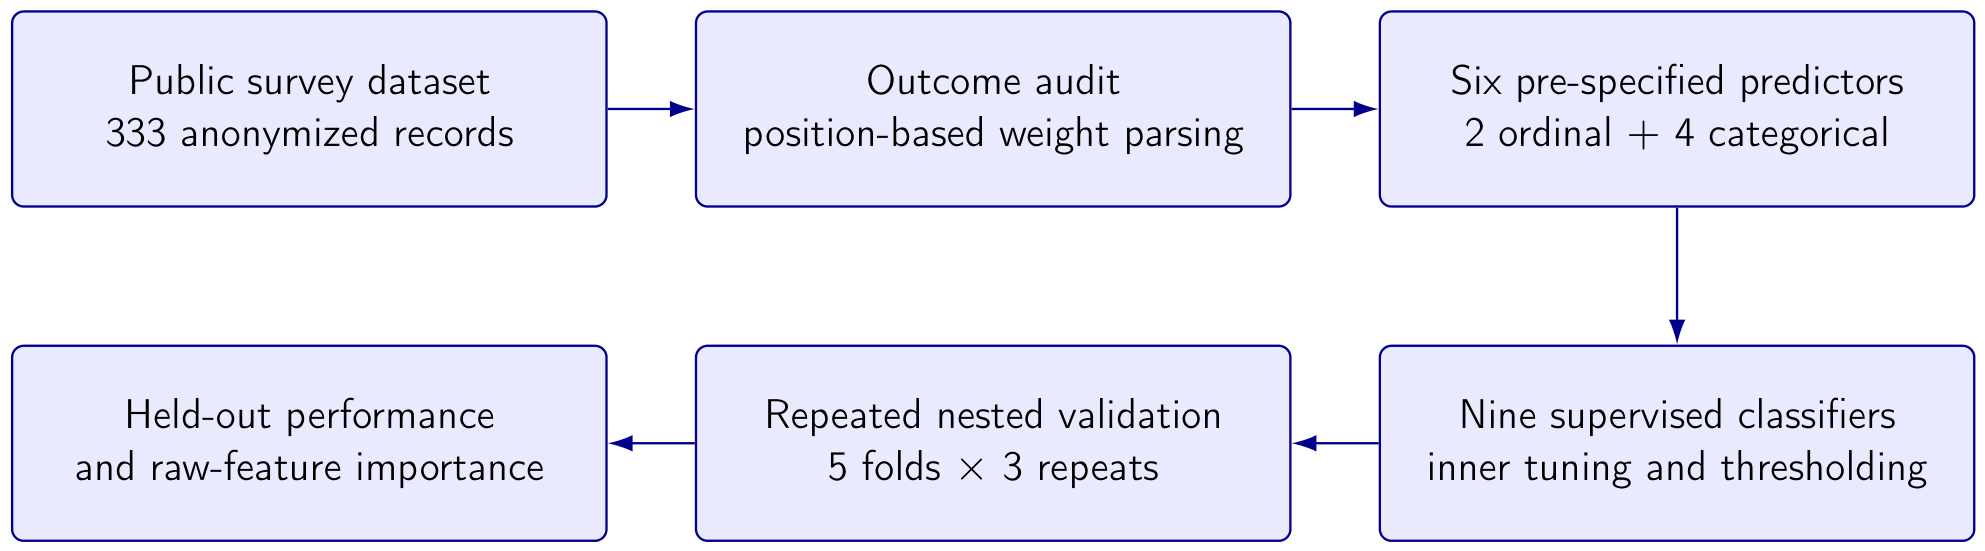
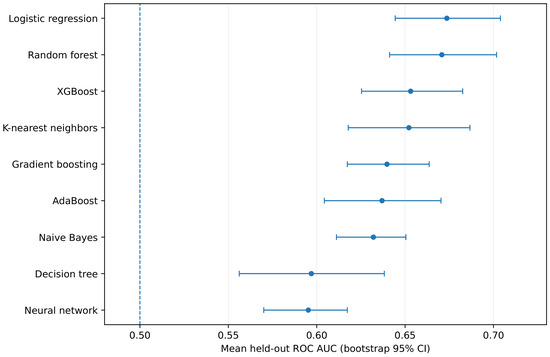
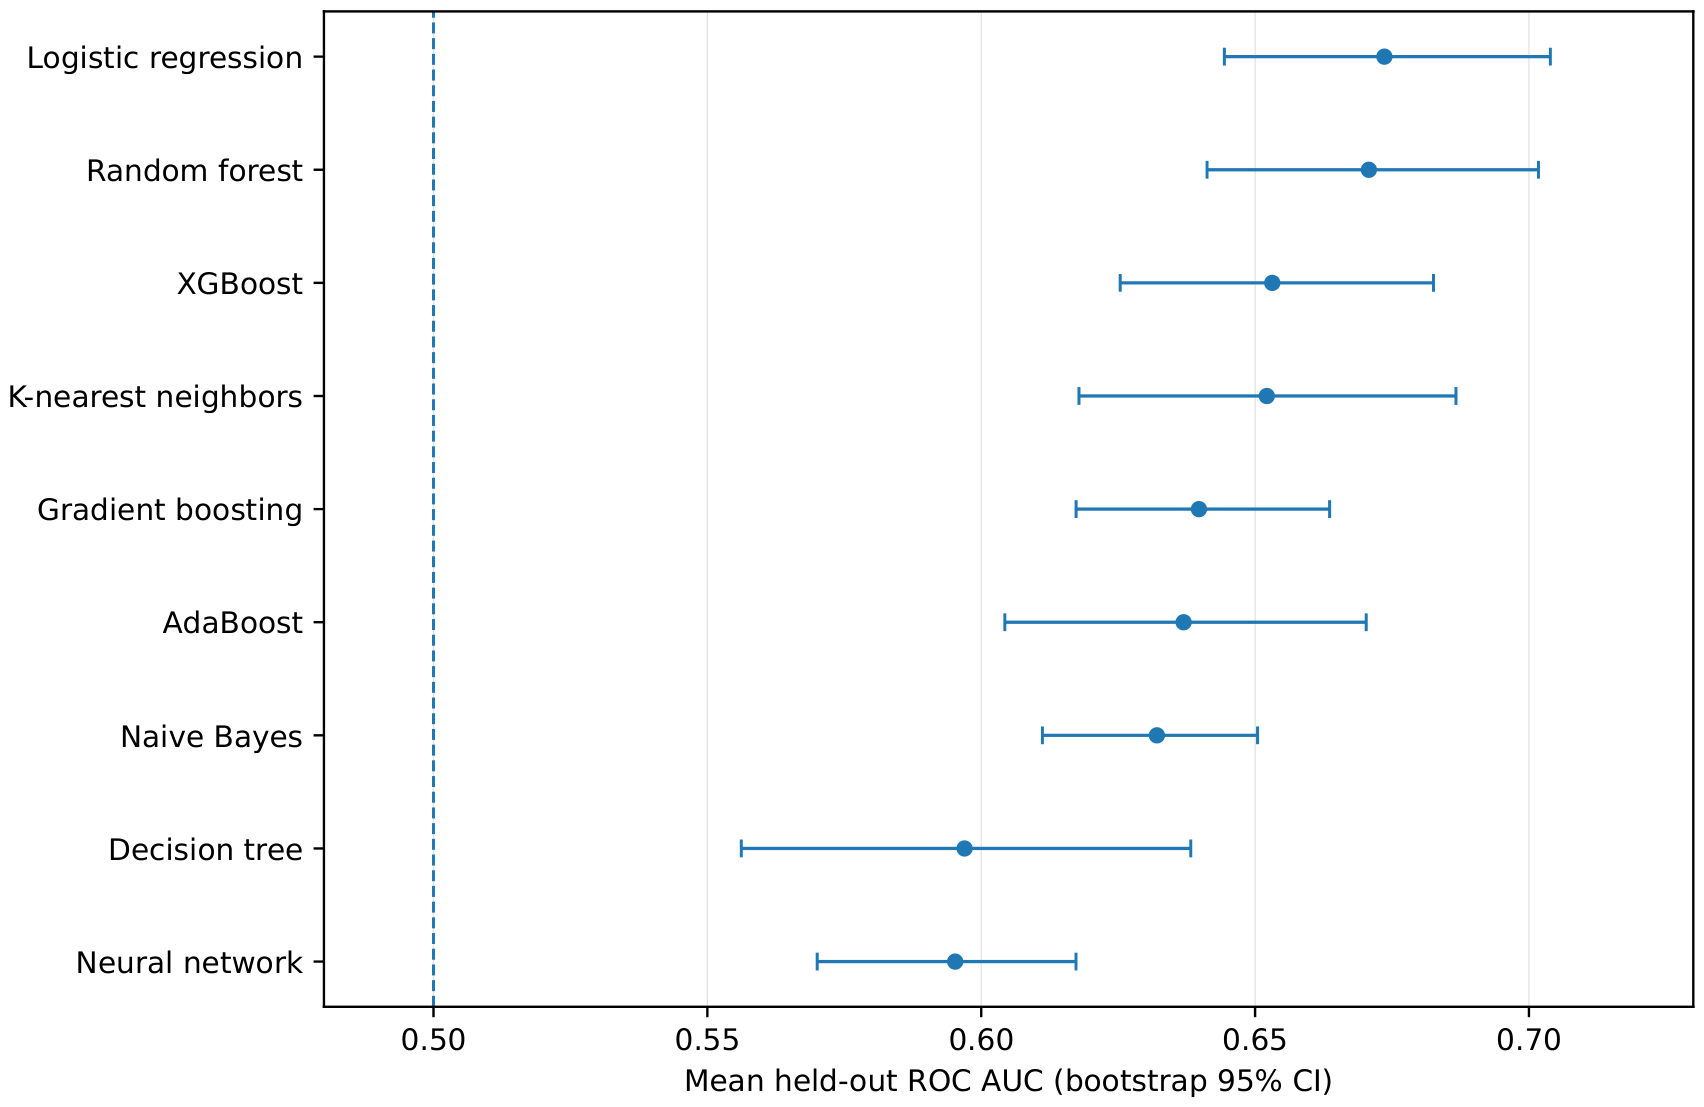
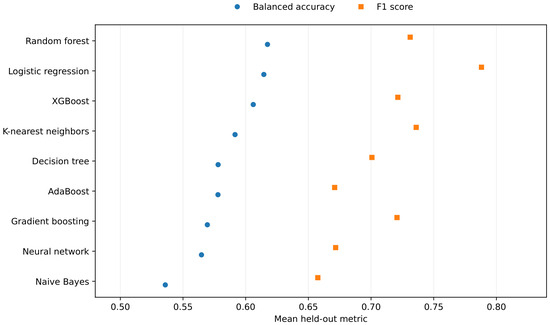
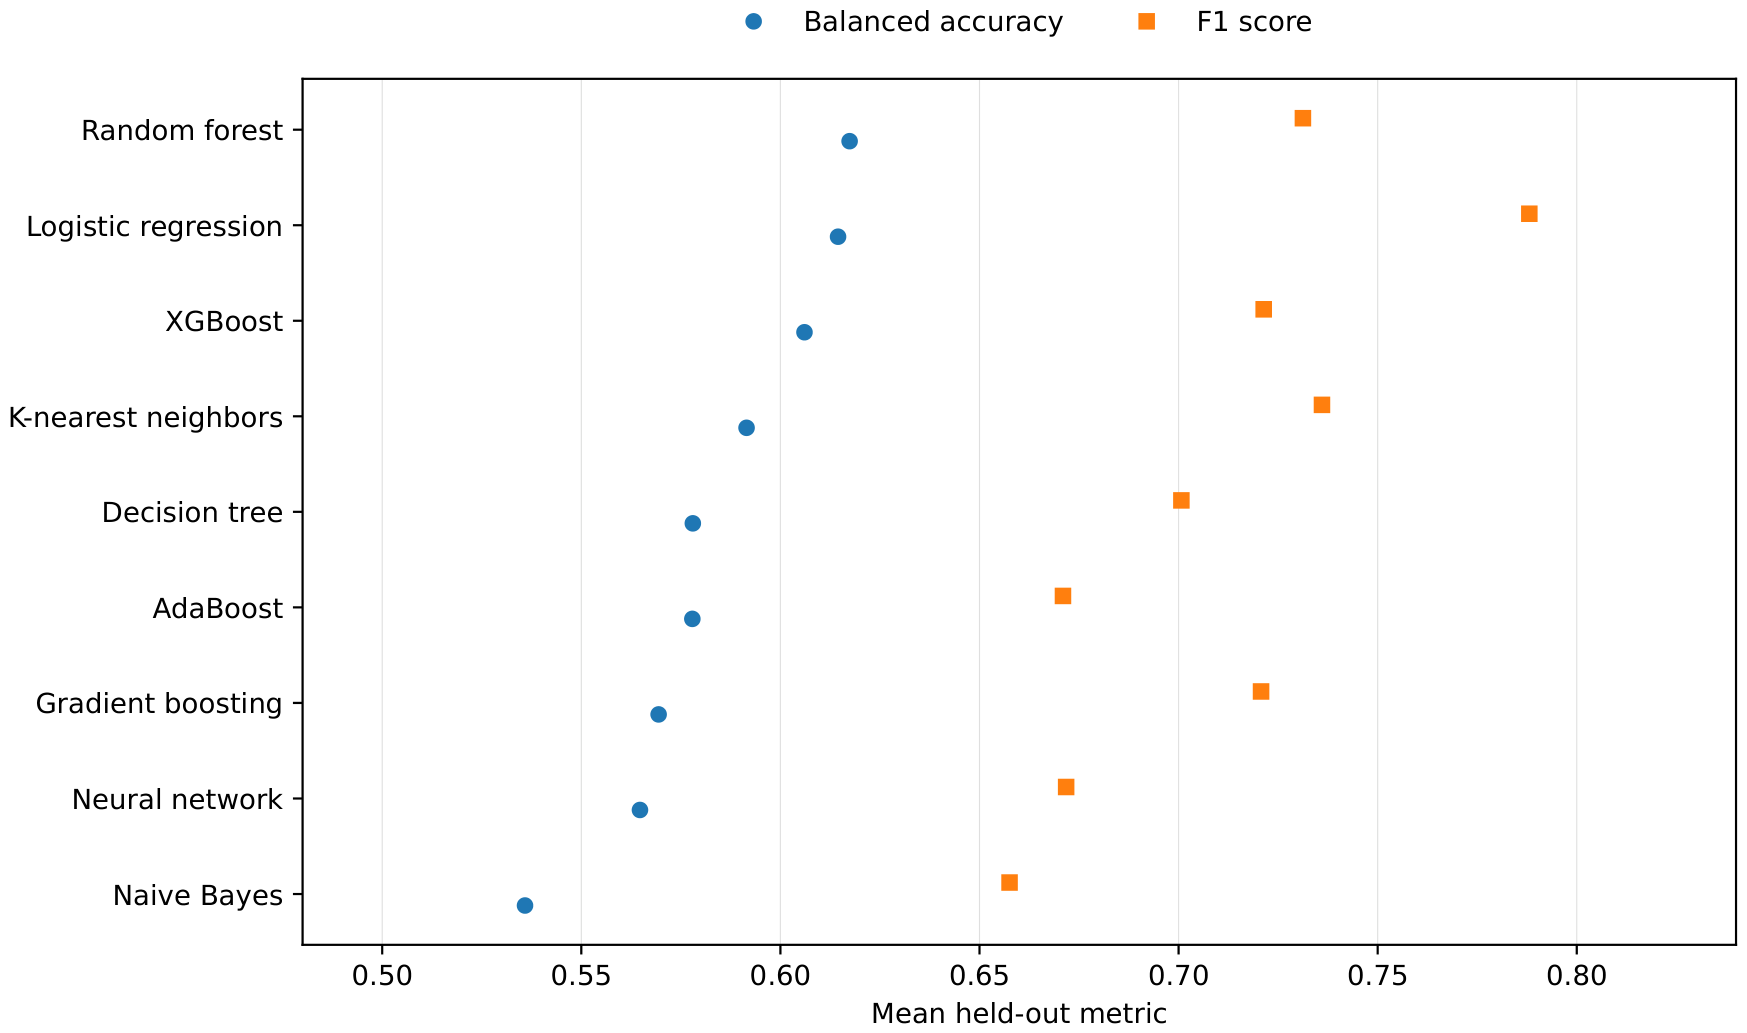
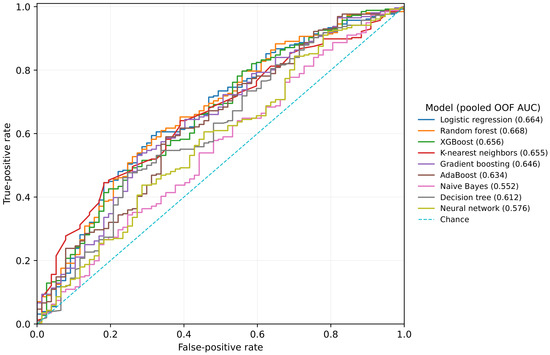
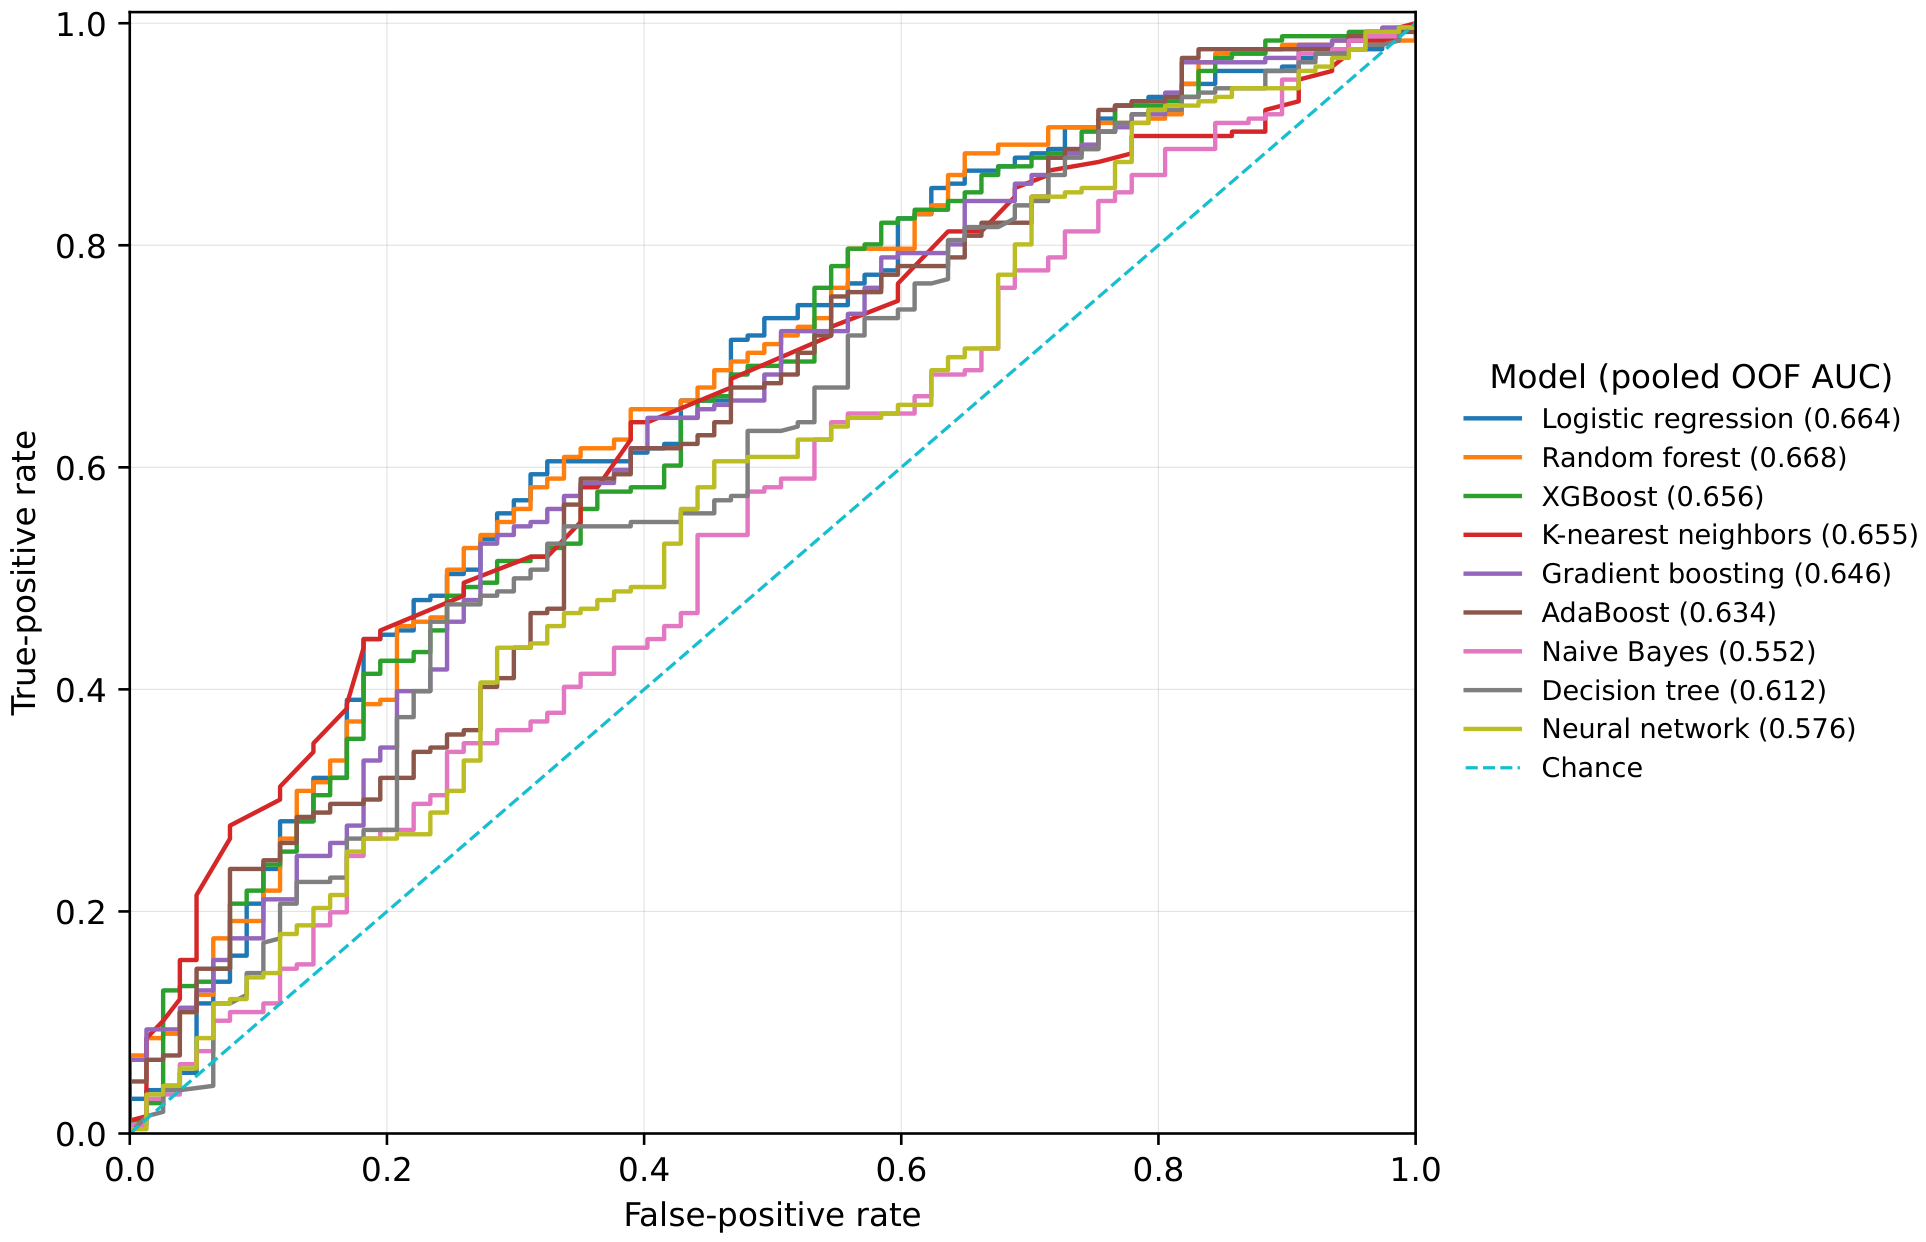
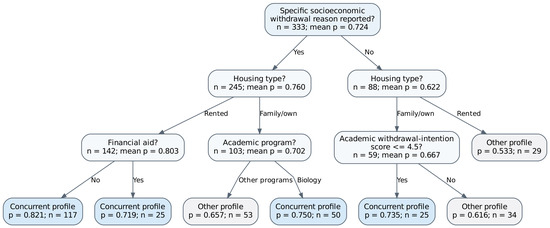
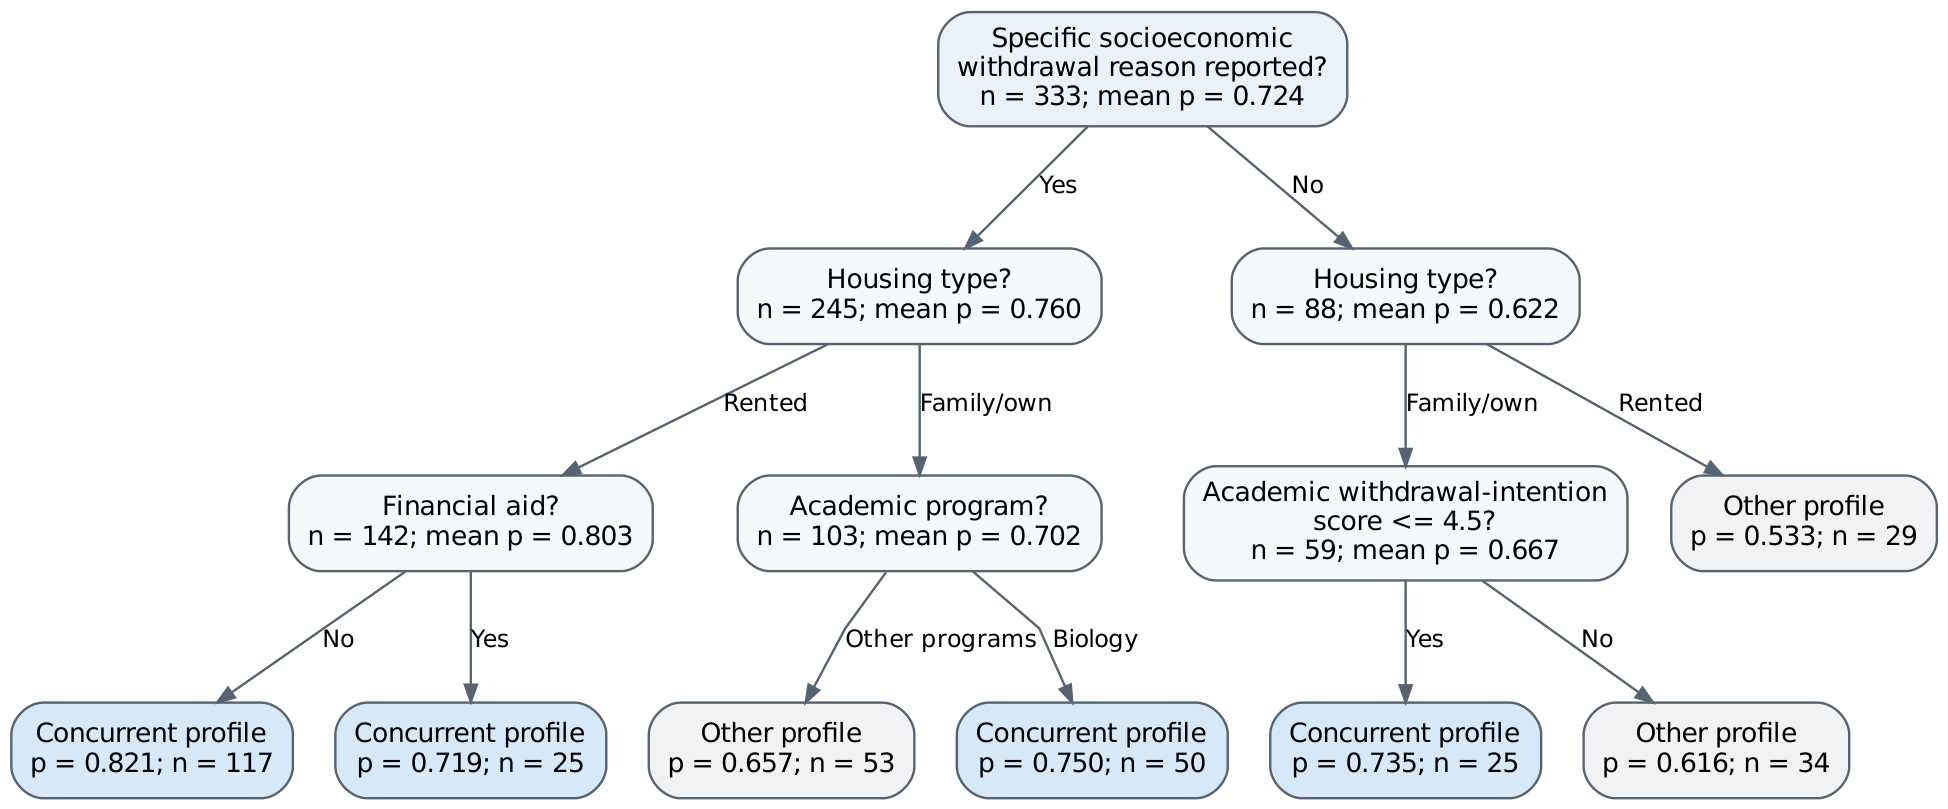
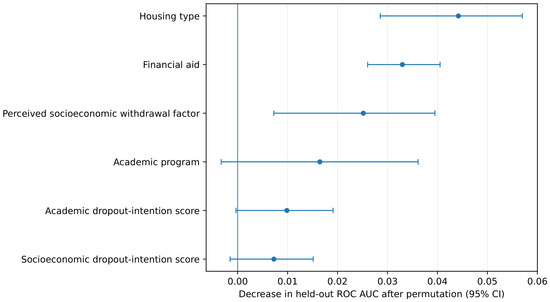
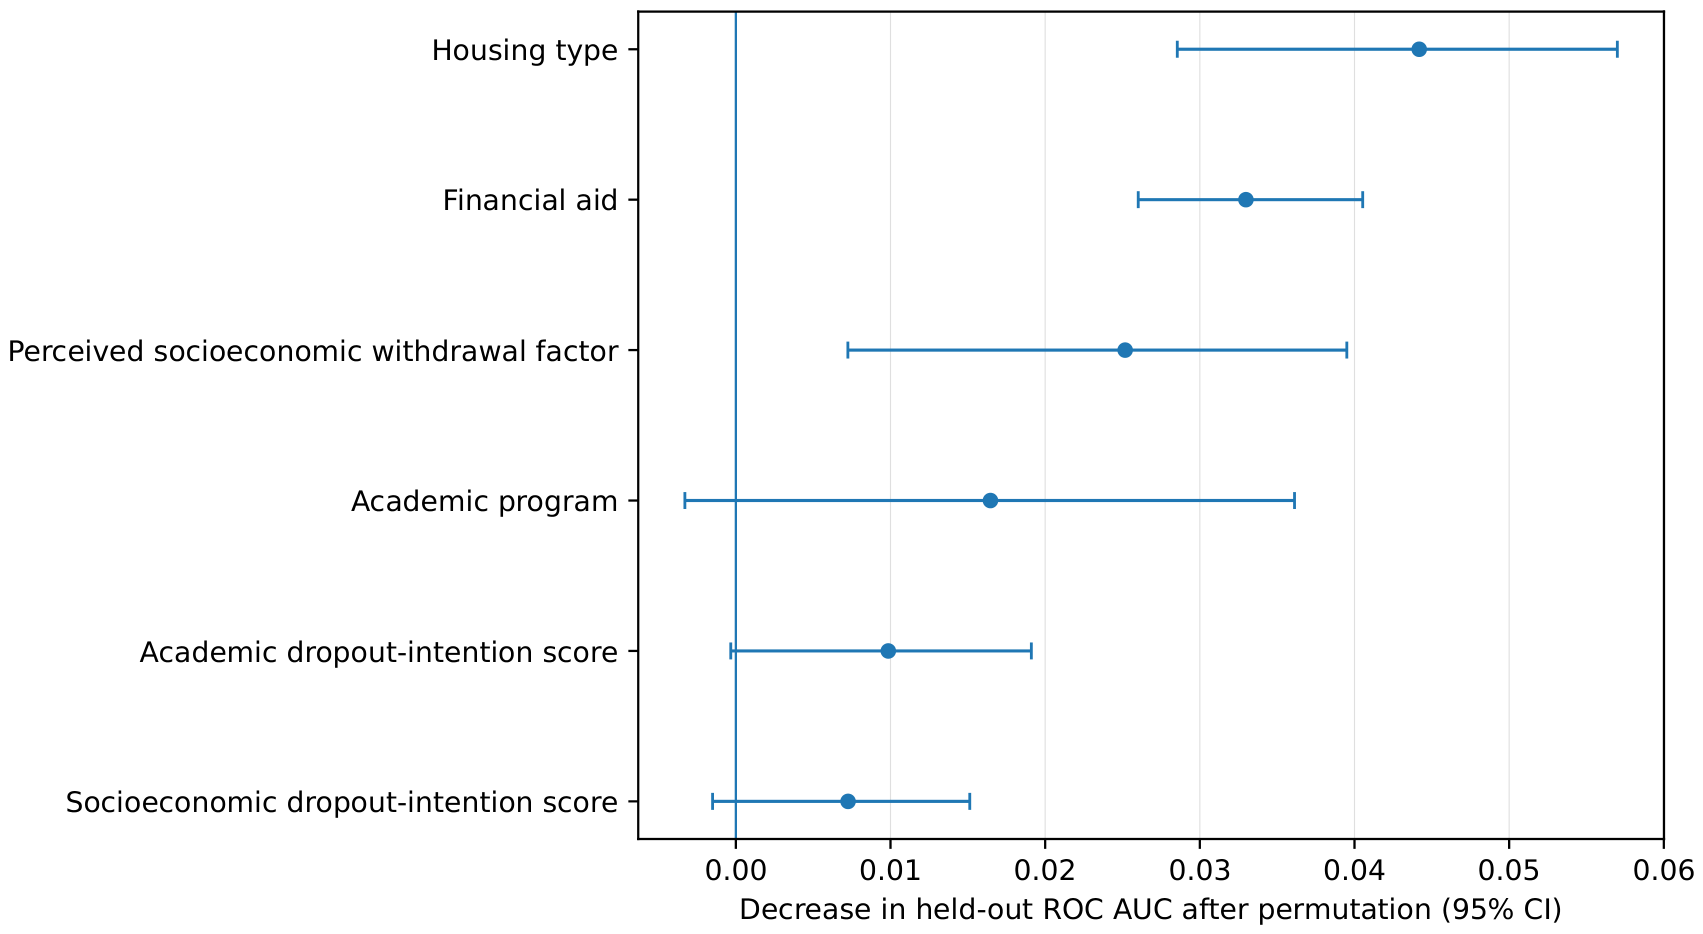

Disclaimer/Publisher’s Note: The statements, opinions and data contained in all publications are solely those of the individual author(s) and contributor(s) and not of MDPI and/or the editor(s). MDPI and/or the editor(s) disclaim responsibility for any injury to people or property resulting from any ideas, methods, instructions or products referred to in the content. |
© 2026 by the authors. Licensee MDPI, Basel, Switzerland. This article is an open access article distributed under the terms and conditions of the Creative Commons Attribution (CC BY) license.