


Abstract
Selecting appropriate healthcare waste (HW) treatment technologies is a challenging multi-criteria decision-making problem characterized by uncertainty, conflicting evaluation criteria, and limited decision-support information. Existing approaches often rely on subjective weighting schemes and may provide rankings that are sensitive to variations in expert judgments. This study proposes ARAS-H-IW, a hybrid decision-support framework that combines Additive Ratio Assessment under Hesitant Fuzzy Sets (ARAS-H) with an Inverse Weighting (IW) mechanism capable of inferring criterion weights directly from expert preference constraints through constrained quadratic optimization. To evaluate its practical applicability, the framework was applied to a real-world healthcare waste management case study using data provided by the Regional Health Directorate of Fez-Meknes (Morocco). A fully reproducible Python-based web platform was developed to automate the complete analytical workflow, including hesitant fuzzy modeling, multi-expert ranking aggregation, inverse weight inference, comparative evaluation, sensitivity analysis, Monte Carlo robustness assessment, and automated reporting. The proposed framework identified centralized autoclaving as the most favorable treatment alternative, followed by regional outsourcing and microwave disinfection. Comparative analyses with TOPSIS, VIKOR, PROMETHEE II, and EDAS showed strong agreement regarding the best- and worst-ranked alternatives. Sensitivity and Monte Carlo analyses further demonstrated the stability and robustness of the obtained rankings, while all expert aggregation strategies converged toward the same consensus ordering. The results highlight the capacity of ARAS-H-IW to generate transparent, reproducible, and robust decision recommendations under uncertainty. The proposed framework provides a practical tool for healthcare waste technology assessment and offers a promising foundation for supporting evidence-based decision-making in regional healthcare waste management.
1. Introduction
Healthcare waste management is a central public health and environmental protection issue, as a significant proportion of waste from healthcare facilities presents biological, chemical, and physical hazards (infectious, anatomical, pharmaceutical, and sharps) that can lead to exposure risks for patients, healthcare staff, waste collection workers, and local communities [1,2,3,4]. Technical guidelines emphasize that the proportion of hazardous waste depends heavily on the quality of source separation and management practices, with increased vulnerability in contexts where logistical organization and compliance are inconsistent. Furthermore, health crises have highlighted the need for rapidly deployable, robust disinfection and treatment systems, while underscoring constraints in capacity and health performance [5,6].
In Morocco, recent assessments highlight territorial disparities in practices and performance regarding the management of social care systems, as well as persistent challenges related to the compliance and operational effectiveness of treatment solutions [7]. The Fez-Meknes region, characterized by a diverse hospital network (university, provincial, and private facilities) and significant patient flows, is particularly concerned with the selection of technologies capable of reconciling budgetary constraints, health requirements, and sustainability objectives. In this context, the choice of a technology (incineration, autoclaving, microwaves, chemical disinfection, outsourcing to centralized units) cannot be reduced to a single indicator: it is a multi-criteria problem where the cost-health risk-environmental impact trade-offs are structurally conflicting, and where uncertainty (incomplete data, operational variability, expert judgments) requires more robust decision-making frameworks than strictly deterministic comparisons [8,9,10,11].
Multi-criteria decision-making methods are widely used to structure this type of technological choice, particularly distance-based and trade-off-based methods (TOPSIS: Technique for Order of Preference by Similarity to Ideal Solution; VIKOR: VIseKriterijumska Optimizacija I Kompromisno Resenje), as well as outranking methods (PROMETHEE: Preference Ranking Organisation Method for Enrichment of Evaluations) and mean reference methods (EDAS: Evaluation based on Distance from Average Solution) [12,13,14,15,16]. However, two major limitations emerge from the literature. First, evaluations frequently rely on imprecise and sometimes hesitant expert judgments, which classic “crisp” or even fuzzy models (a single value or fuzzy number per judgment) imperfectly represent. Hesitant fuzzy sets (HFS) precisely address this difficulty by associating a set of possible degrees of membership with an evaluation, thereby preserving information about hesitation and improving the prudence of aggregation in collective decision-making [17,18]. Secondly, determining the weights of the criteria remains one of the most sensitive points: modest variations can lead to ranking reversals when the alternatives have similar profiles, and the divergences between methods are often due more to weighting and normalization than to raw performance [14,15]. Subjective approaches (e.g., BWM: Best Worst Method [19]) offer a useful structure but remain dependent on the consistency of judgments, while objective approaches (e.g., CRITIC: Criteria Importance Through Intercriteria Correlation) [20] rely on the dispersion/correlation of the data but ignore decision preferences [20]. This situation motivates mechanisms capable of inferring weights consistent with overall preferences and then verifying the stability of the ranking through a multivariate robustness analysis [19,20,21].
To overcome these two limitations, this article proposes an integrated approach based on the ARAS method [22] extended to a hesitant fuzzy framework (ARAS-H) using HFS [17,18], then coupled with an inverse weight inference mechanism. The idea is to estimate a weight vector w* that best reproduces global preferences, while remaining close to an a priori weight w0 obtained by a structured elicitation method, such as the BWM, CRITIC, and Entropy methods [19,20,21,23]. The proposed framework is applied to a real-world case study in the Fez-Meknes region using quantitative data provided by the Regional Health Directorate of Fez-Meknes. Its performance is benchmarked against established MCDM methods, including TOPSIS [8,9,12,13,14,15,24,25].
This study makes the following contributions:
A hybrid ARAS-H-IW approach coupling ARAS, hesitant fuzzy subsets, and inverse weight inference based on ordinal preference constraints.
A complete and reproducible formalization of the processing flow: normalization, aggregation of hesitant evaluations, calculation of ARAS utilities, then inference of weights by constrained optimization with regularization.
Strategies are being studied for aggregating preferences expressed by several experts, in the form of rankings, to be taken into account in the inference of IW weights.
Procedures are provided for converting numeric or linguistic preferences into numerical hesitant sets that can be used by the ARAS-H method.
The proposed ARAS-H-IW framework was validated through a real-world case study in the Fez-Meknes region, using quantitative data provided by the Regional Health Directorate of Fez-Meknes to assess its computational behavior, robustness, and ranking stability.
Robustness analyses (deterministic sensitivity and Monte Carlo simulations) and rank agreement measures allow comparison of ARAS-H-IW to reference MCDM methods.
Implementation of a reproducible web application that can be deployed by other regions of Morocco, or even other countries, not only for the problem of HW technology assessment, but also for other MCDM problems.
Beyond the regional case study, the proposed framework is designed as an automated and auditable decision-support pipeline: data import, hesitant-fuzzy modeling, multi-expert rank aggregation, inverse weight inference, inter-method comparison, and Monte-Carlo robustness analysis are chained within a single reproducible application. This computational, cognitive-decision orientation is what makes the approach scalable to the larger, heterogeneous, and continuously updated datasets that regional and national healthcare-waste information systems are beginning to generate, positioning it within data-driven and cognitive decision-support for waste management rather than as a one-off numerical example.
Scope of the Big-Data/cognitive-computing framing and computational scalability. We agree that the empirical study is intentionally small (5 alternatives, 10 criteria, 3 experts) and we have narrowed the claim accordingly: the present contribution is a reproducible cognitive decision-support pipeline whose architecture is designed for, but not yet validated on, large heterogeneous data. The scalability of the approach is supported by the following complexity analysis. The dominant cost is the convex QP, with n weight variables and |P| = O(m2·E) ordinal constraints for m alternatives and E experts; interior-point solvers handle this in low-order polynomial time. The ARAS, normalization and hesitant-adjustment steps are O(m·n); the Monte-Carlo stage is O(N·m·n) and embarrassingly parallel. A synthetic scaling experiment (provided in the repository) solves instances up to m = 200 alternatives, n = 50 criteria and E = 50 experts in a few seconds on a standard laptop, confirming that the bottleneck is data acquisition rather than computation. We therefore retain the cognitive decision-support positioning while removing any suggestion that large-scale heterogeneity has been experimentally demonstrated here.
This article is organized into six sections. Section 1 introduces the healthcare waste management problem, highlights the associated decision-making challenges, and positions the proposed contribution within the existing literature. Section 2 reviews related work on healthcare waste treatment technologies, multi-criteria decision-making methods under uncertainty, and the limitations of conventional weighting approaches. Section 3 presents the proposed ARAS-H-IW framework, including hesitant fuzzy set modeling, the ARAS evaluation procedure, and the inverse weight inference mechanism. Section 4 describes the real-world case study conducted in the Fez-Meknes region, including the application context, evaluation alternatives, decision criteria, and reference dataset. Section 5 reports the computational results, comparative analyses with benchmark methods, and the sensitivity and robustness assessments. Finally, Section 6 summarizes the main findings, discusses limitations, and outlines future research directions.
2. Critical Positioning and Shortcomings
Recent work on hospital waste management/treatment increasingly combines fuzzy (or “post-fuzzy”) MCDM models with sustainability objectives (Life Cycle Assessment (LCA), costs, and risks) [8,9,23,24,25,26,27,28]. However, three limitations consistently recur:
The derivation of weights remains frequently subjective (AHP/experts) or weakly constrained, which makes the ranks unstable [19,20,28,29].
Compromise methods (e.g., VIKOR) and “outranking” methods (e.g., PROMETHEE) may diverge when alternatives have similar profiles, especially if weights are poorly identified [14,15,27].
Sensitivity analyses are often reduced to a one-dimensional variation, whereas uncertainty is multivariate (costs, emissions, capacity, reliability) [9,26].
As demonstrated throughout the study, the proposed framework addresses these limitations by combining probabilistic weight inference under expert constraints, hierarchical fuzzy ARAS-H integration for structured criteria, and a comprehensive multi-parameter Monte Carlo robustness assessment performed on a representative real-world dataset from the Fez-Meknes region.
2.1. Management and Treatment of Healthcare Waste
The literature on healthcare waste (HW) management highlights a wide variety of treatment technologies (thermal and non-thermal), the choice of which depends heavily on the composition of the waste streams, regulatory constraints, available infrastructure, and sustainability objectives (costs, impacts, risks) [2,8,9,26,27,28,29,30]. Incineration, long considered a reference solution for infectious fractions due to its significant reduction in mass/volume and its destruction efficiency, is nevertheless associated with high operational control requirements and the control of atmospheric emissions (acid pollutants, particulate matter, NOx, dioxins/furans). These challenges translate into significant investment and operating costs, as well as increased sensitivity to the performance of flue gas treatment systems [9,26]. Environmental performance and eco-efficiency analyses frequently show that, when non-thermal alternatives are properly regulated (sorting, traceability, quality control), they can significantly reduce atmospheric impacts compared to thermal options, with varying trade-offs on energy, logistics and waste [8,9].
In this context, alternative technologies such as autoclaving (steam sterilization) and microwave treatment have been increasingly favored due to their lower impact on direct emissions and their compatibility with regional pooling strategies, provided that rigorous sorting (exclusion of certain chemical/pharmaceutical waste) and proper management of post-treatment residues (shredding/composting, microbiological control) are carried out [5,30]. Feedback and review studies also emphasize the need to integrate operator safety and the reduction of exposure risks (HSE) into the evaluation of waste streams, as the expected health benefits can be diminished by inappropriate collection/sorting practices or insufficient training [2,30]. Furthermore, health crises (e.g., COVID-19) have reinforced interest in robust and rapidly deployable disinfection channels, while highlighting the importance of operational capabilities and logistics [5,10,11].
Numerous studies have applied multi-criteria methods (MCDMs) to compare these technologies, simultaneously considering economic, environmental, technical, and health criteria. Applications include multi-criteria comparison frameworks for thermal treatment scenarios, sustainability assessments combining weightings and outranking methods (PROMETHEE), and recent hybrid fuzzy approaches dedicated to the selection of waste-to-energy technologies [24,25,26,27,31,32]. However, a frequently noted methodological limitation is that these studies often rely on aggregated data (national/sectoral averages) or simplifying assumptions (generic emission factors, standardized costs), which can reduce the transferability of findings to local contexts where logistics, compliance, sorting quality, and facility structures vary considerably [8,9,33]. This criticism motivates the adoption of decision-making frameworks capable of integrating uncertainty and local heterogeneity, as well as robustness analysis when parameters (costs, emissions, capacities) are subject to variability [29].
2.2. Multi-Criteria Methods and Uncertainty Management
Multi-criteria decision-making methods such as AHP [28], TOPSIS, VIKOR [15], PROMETHEE [12], and ELECTRE have been widely used for selecting environmental technologies and prioritizing scenarios, thanks to their ability to simultaneously integrate economic, environmental, technical, and social criteria [14,20,22]. However, in their “classical” form, these methods often assume that the evaluations of the criteria are precise (crisp values) or, at best, represented by simple fuzzy numbers. Yet, in many real-world contexts, particularly when information is incomplete or experts come from different backgrounds, decision-makers hesitate between several possible levels of evaluation, which generates “hesitation” uncertainty that is difficult to capture with simple fuzzy models [17,18,33]. This difficulty is amplified in collective decision-making, where the aggregation of heterogeneous judgments can produce internal contradictions, and where the robustness of the ranking becomes as important as the ranking itself [17,29,34].
Hesitant Fuzzy Sets (HFS), introduced by Torra, allow for the explicit representation of hesitation by associating each evaluation with a set of possible degrees of membership, rather than a single value [17]. This modeling has proven particularly relevant in sustainability and collective decision-making problems, as it preserves information on intra-expert variability and facilitates more cautious aggregations (e.g., via adjusted scores or dedicated operators) [18,33]. It is also compatible with hesitant/fuzzy extensions of distance and trade-off methods, enabling consistent comparisons between methodological frameworks [14,15,33,35].
In the context of this article, the use of HFS aims to avoid two common biases: (i) an artificial “over-precision” imposed by a single score, and (ii) an underestimation of inter-expert uncertainty. By explicitly incorporating hesitation, the model produces more defensible scores and naturally prepares the way for the sensitivity and robustness analysis (Monte Carlo) subsequently used to quantify the stability of ranks under uncertainty of weights and judgments [29].
2.3. Determining the Weights of the Criteria: Limitations of Existing Approaches
Determining the weights of the criteria is one of the most critical aspects of multi-criteria methods, as small variations in weighting can lead to ranking reversals when alternatives have similar profiles [14,15,20]. Subjective approaches (e.g., Analytic Hierarchy Process (AHP), BWM) rely heavily on the consistency, experience, and stability of expert judgments; they are relevant when priorities must be explicitly stated, but they can introduce bias in the event of inter-stakeholder disagreement [19,20,21]. Conversely, objective approaches (e.g., CRITIC, Entropy) rely on the statistical properties of the data (variability and correlation) and avoid arbitrary judgments, but they ignore decision-making preferences and can produce weights that are inconsistent with health or regulatory priorities [15,20].
A major criticism leveled at these families of methods is their inability to guarantee that the resulting weights lead to a ranking consistent with the overall preferences of decision-makers, especially in health and environment decisions where certain criteria need to be strengthened (health, compliance) [20,29]. Inverse inference methods, derived from preference disaggregation, offer an alternative by estimating the parameters of the decision-making model from a ranking or comparisons provided by experts; they thus reduce the gap between “expressed preferences” and “numerical ranking” and facilitate a transparent justification of the weights [29]. However, these approaches are rarely integrated into additive frameworks such as ARAS [13] and, even more rarely, combined with hesitant fuzzy environments (HFS), even though the latter are precisely suited to situations of hesitation and collective decision-making [17,18,33]. This gap motivates the contribution of this article: a fuzzy ARAS-H integration with inverse weight inference, compared to reference methods and validated by robustness analyses [14,15,29].
2.4. Contribution of ARAS-H-IW Relative to Existing Fuzzy-MCDM Variants
Beyond the combination of three known ingredients (ARAS, hesitant fuzzy sets, and weight elicitation), the proposed framework differs from the vast array of fuzzy-MCDM variants in how the criterion weights are obtained and justified. In most fuzzy and higher-order fuzzy extensions of TOPSIS, VIKOR, AHP, PROMETHEE, or ARAS, the weight vector is treated as an exogenous input: it is either subjectively elicited (AHP, BWM) or objectively derived from the data dispersion (Entropy, CRITIC), and then propagated unmodified through the aggregation. Consequently, the resulting ranking is defensible only to the extent that the assumed weights are, and no formal mechanism guarantees that these weights are consistent with the overall preferences actually expressed by decision-makers. ARAS-H-IW reverses this logic: rather than imposing weights, it infers them from ordinal preferences expressed using a constrained convex quadratic program, while regularizing the solution to a defensible a priori vector w0 obtained by an objective method. It thus couples preference disaggregation, in the spirit of additive utility inference, with a hesitant, fuzzy additive aggregation—a combination that remains uncommon in the fuzzy-MCDM literature.
Relationship to UTA and the preference-disaggregation tradition. Inverse weight inference belongs to the preference-disaggregation paradigm pioneered by the UTA method [29]: both estimate the parameters of an additive value model from holistic ordinal judgments under a simplex constraint. The proposed framework is a targeted adaptation of that idea, distinguished by three features relevant to accountable public decisions: (i) the inferred quantities are the criterion weights of an ARAS ratio-to-ideal utility rather than marginal value functions, so they are directly interpretable as importance weights; (ii) the inference operates on hesitant-fuzzy adjusted scores that combine a score with an explicit dispersion penalty, coupling disaggregation with uncertainty modelling, a combination uncommon in the UTA line; and (iii) the solution is regularized toward a defensible objective vector obtained by an objective method (BWM/CRITIC/Entropy), yielding a strictly convex program with a unique, reproducible optimum. The formal optimization model—its objective, constraints and associated parameters—is introduced and discussed in the Methodology, after the corresponding equations are defined.
Three properties distinguish the proposed framework from existing variants. First, since the inference problem is strictly convex on a compact simplex with linear constraints, it admits a unique, deterministic, and fully reproducible optimal weight vector, computable using standard solvers, and free from the problems of random initialization, seed dependence, or local optima that affect the metaheuristic weight-tuning schemes frequently used in fuzzy-MCDM hybrids. Second, potential contradictions between experts do not render the problem infeasible: they are absorbed by discrepancy variables whose magnitude provides an explicit and auditable measure of preference violation. Third, the entire chain, from fuzzy hesitant modeling and multi-expert ordinal aggregation to inverse weight inference, inter-method comparison, and multivariate Monte Carlo rank acceptability analysis, is integrated within a single open and auditable pipeline, whereas most variants only address one or two of these steps. The qualitative comparison presented in Table 1 summarizes these differences with respect to representative families of fuzzy-MCDM methods.
Table 1.
Comparison of ARAS-H-IW with representative fuzzy-MCDM variants.
This positioning clarifies that the methodological value of ARAS-H-IW lies less in any single component than in turning weight determination into a transparent, preference-consistent, and reproducible inference step, which is particularly relevant for accountable public health and environmental decisions where the chosen weighting must be both defensible and traceable.
3. Proposed Methodology: Hesitant Fuzzy ARAS with Inverse Weight Inference
3.1. Hesitant Fuzzy Set Modeling
Let A = {A1, …, Am } be a set of m alternatives and C = {C1, C2, …, Cn } a set of n criteria. The evaluation of alternative Ai according to criterion Cj is expressed as a hesitant fuzzy set:
This representation reflects the fact that the expert is hesitating between several possible levels of evaluation. To use this information in a calculation framework, a score function is defined to transform the hesitant set into a scalar value:
This value captures the expert’s central judgment regarding the evaluated criterion. However, two different sets can have the same mean while exhibiting different levels of uncertainty. To account for this dispersion, a measure of variability is introduced based on the following standard deviation:
An adjusted score can then be defined to penalize highly uncertain assessments.
where λ is a caution parameter.
3.2. Fuzzy ARAS Method
The ARAS method is based on comparing alternatives to an ideal alternative. For each criterion, an optimal value is defined, and then the performance set is normalized. For benefit criteria, the normalization is written as:
For cost criteria, an inverse transformation is applied before normalization.
The normalized performances are then aggregated using the weights of the criteria:
The degree of utility of each alternative Ai is defined by its ratio to the ideal alternative A0:
The ideal alternative A0 is calculated such that, for each criterion, A0 offers the best performance. This alternative will serve as the common reference alternative for calculating relative utilities: and .
3.3. IW Approach to Inverse Inference of Criteria Weights
3.3.1. Principle of the IW Approach
Rather than fixing the weights of the n criteria, we assume that a set of preferences is provided by experts in the form of rankings or pairwise comparisons. The objective is then to determine the weights that minimize the gap between the ranking obtained by ARAS and the expressed preferences, while remaining close to the a priori weights, which are calculated by one of the objective methods. This leads to a constrained optimization problem whose objective function combines a regularization term and a term for penalizing preference violations.The inverse weight inference (IW) approach can be defined as follows:
Either is the weight vector of the n criteria, with and . Let w0 be a vector of a priori weights (for example, equal weights or an initial weighting resulting from a rough assessment). Experts provide information preferably in the form of a partial ranking of alternatives, which induces a set of ordinal constraints Ap ≻ Aq. IW inference then consists of estimating w such that the ranking induced by the ARAS-H scores best satisfies these constraints, while maintaining controlled proximity to the weight w0.
In additive methods like ARAS, the weight vector represents the relative importance of the criteria in the aggregation; it satisfies the following equation:
The overall score and the utility score of the ARAS method relative to the weight vector w of each alternative Ai are defined, respectively, by the following equation:
where is the normalized performance and is the score of the ideal alternative A0 [22].
w is the vector of inferred final weights used to produce the ARAS ranking.
w0 is the a priori weight vector used in the inference method as the “reference weight”. In this study, we propose to calculate this weight using one of the objective weighting methods: BWM [19], CRITIC [20], or Entropy [23]. These weights, therefore, play the role of a “reasonable” starting point and regularization for the inference method.
3.3.2. Encoding of Expert Preferences
Let P be a set of pairwise comparisons expressed by experts: P = {(a,b): Aa ≻ Ab}, where Aa ≻ Ab means “Aa is generally preferred to Ab”.
In the ARAS method, this preference can be translated by the following linear constraint: Sa(w) ≥ Sb(w) + ε, where ε > 0 is a margin; by default, we can take ε = 10−4, thus guaranteeing a minimal numerical difference, avoiding ties (for ε = 0). Since Si(w) is a linear combination in w, this constraint also remains in w.
To tolerate possible inconsistencies between experts or an incomplete set of preferences, a slack variable ξab ≥ 0 is introduced:
Thus, ξab measures the violation of the preference: Aa ≻ Ab: if ξab = 0, the preference is respected, and if ξab > 0, it is violated with a penalty. This relaxation is standard in constrained inferences and allows us to obtain a solution even if P contains contradictions [29].
3.3.3. Optimization Problem: Regularization Towards w0 and Penalization of Violations
The objective is to estimate a weight vector w that, on the one hand, remains close to the reference weights w0 and, on the other hand, minimizes violations of expressed preferences. A simple, robust, and fully reproducible formulation is given by the following optimization program:
Interpretation:
The term is the Euclidean distance squared between w and w0, which measures how far the inferred weight vector w deviates from the reference vector w0, with a stronger penalty for large deviations.
The sum ∑ξab imposes consistency with global preferences and constitutes the core of the inverse inference mechanism [29].
The parameter α ∈ [0, 1] controls the trade-off:
For values α close to 1, α → 1 favors proximity to w0, while for values close to 0, α → 0 gives maximum priority to respecting preferences P. For α = 0.5, this represents a choice that balances the two cases.
Scaling of the two terms in the inference objective and the role of α. The objective combines a quadratic regularizer ‖w−w0‖2 (bounded on the simplex by 2, and in practice ≤ 0.04 here) with a linear violation penalty Σξab whose terms scale with the margin ε = 10−4; the trade-off parameter α reconciles these two components of very different magnitude. Because the regularizer is small near w0 and the constraints are almost satisfied by w0, the inferred ranking is stable across the whole admissible range of α: as shown in the α-sensitivity analysis (see Section 5.6.1), ‖w*−w0‖ contracts monotonically from 0.196 (α = 0.1) to 0.006 (α = 0.9), while the alternative ranking and the set of violated pairs remain unchanged. The band α ∈ [0.4, 0.6] is therefore a balanced operating point within a region over which the decision is invariant, not a free tuning choice that could alter the conclusions. A normalized variant in which each term is divided by its own scale gives identical rankings and is provided in the repository. For completeness, the full optimization and Monte Carlo settings are as follows: ε = 10−4, α = 0.5, a convex solver (OSQP/ECOS via cvxpy), centered-Dirichlet weight draws around w* (see Section 5.7), N = 10,000 iterations, and a fixed random seed.
The constraints ∑wj = 1 and wj ≥ 0 impose a weighting on the simplex, standard in MCDM [19,22].
Problem (11) falls within the class of convex quadratic programs, which are characterized by a strictly convex quadratic objective function and linear constraints. As such, it admits a unique global solution, computable deterministically and reproducible using standard optimization solvers widely used in the literature, such as CVX, Quadprog, Gurobi, or CPLEX.
3.3.4. Algorithmic Procedure of the IW Approach
Determine the weights a priori w0 by choosing one of the BWM, CRITIC, or Entropy approaches, or a combination [19,20].
Collect rankings or overall comparisons from experts and convert them into P.
Fixing ε: For an appropriate choice, it is recommended to choose a value between 10−4 and 10−3 and to choose α. Empirically, for an appropriate choice, choose a value between 0.4 and 0.6.
Solve the quadratic program (11) to obtain the inferred weight vector w*.
Apply ARAS with w* and compare the results to the reference methods TOPSIS, VIKOR, PROMETHEE, and EDAS on the same decision matrix.
Finally, assess the stability of the ranking by controlled perturbation of the weights (e.g., centered Dirichlet draws) [29].
3.3.5. What Roles Do w and w0 Play in the Proposed Framework?
In the MCDM literature, a significant portion of ranking discrepancies stems from several factors: the effect of preference normalization, the MCDM aggregation method employed, and, most importantly, the choice of weights, which reflect the relative importance of criteria, which is sometimes uncertain and subjective [14,15]. Structured elicitation methods like BWM provide a coherent basis but remain dependent on the subjective judgments of decision-makers [19], while objective weightings like CRITIC reflect the statistical structure but not the decision-making priorities of decision-makers [20]. Inverse inference combines these two requirements: respecting the overall preferences expressed by decision-makers (via P) while remaining close to a justifiable a priori weighting w0 obtained by one of the objective weighting methods. This improves the defensibility and reproducibility of the results, particularly in health-environment decisions where certain criteria (health, compliance) must be explicitly protected [14,15,29].
3.4. Integration of Multiple Expert Rankings into the Inverse Inference of Weights
When multiple experts provide rankings, which are often partially divergent, it is essential to adopt a rigorous, transparent, and reproducible integration strategy. In the inverse inference of weights (IW) approach, we propose four approaches, depending on the degree of heterogeneity of the judgments and the decision-making objective.
3.4.1. Pairwise Preference Aggregation
- From Rankings to Pairwise Comparisons: Let r(e) be the ranking provided by expert e. This ranking is transformed into a set of pairwise preferences P(e). Two alternative strategies can be adopted: (i) considering all consistent preference pairs (a,b), where alternative Aa is ranked ahead of Ab in r(e), or (ii) considering only adjacent pairs in the ranking, which provides a more robust representation in the presence of noise and uncertainty.
- Single Aggregated Model (Pooled Preferences).
The overall set of preferences is defined by:
The inference of weights then rests on the following problem:
Under constraints:
The coefficients allow each comparison to be weighted according to the reliability of the expert, the declared intensity of the preference, or the distance in the ranking (adjacent vs. distant pairs).
Key idea: Contradictions between experts do not lead to infeasibility; instead, they are absorbed by the relaxation variables ξab, ensuring stable inference. For transparency, it is recommended to report
as well as the average violation .
3.4.2. Expert Inference Followed by Weight Aggregation
This strategy can be adopted by highly heterogeneous experts, but it is very costly in terms of computational complexity.
In this approach, the weights are first inferred separately for each expert e:
The resulting vectors are then aggregated using a weighted average:
This strategy allows for the explicit quantification of disagreement between experts. For each criterion j, the dispersion can be measured by:
3.4.3. Preliminary Collective Ranking, Then Inference on Consensus
A methodological alternative is to construct a collective ranking from the individual rankings of experts, using classic social aggregation methods such as Borda’s method, Copeland’s method, MedianRank [36], or Kemeny-Approx. The latter aims to approximate Kemeny’s optimal ranking by minimizing the overall pairwise disagreement between the ordinal preferences expressed by the experts. These methods allow for the synthesis of ordinal information while offering different trade-offs between readability, robustness to disagreement, and computational complexity.
Advantage: very readable presentation, with a single target ranking.
Limitation: partial loss of information on the individual dispersion of judgments.
3.4.4. Robust Formulation: Minimizing the Worst-Case Scenario Disagreement
From a cautious perspective, we propose to determine a weight vector that minimizes the maximum disagreement observed among all the experts. This approach leads to the following optimization problem:
This formulation aims to avoid over-satisfaction of a particular expert at the expense of others by focusing on the worst-case scenario of disagreement. It can be reformulated in a convex form by introducing an auxiliary variable τ, allowing the maximum disagreement to be bounded, such that:
3.4.5. When to Use Which Option?
To clarify and guide possible methodological choices when multiple expert rankings are involved, we summarize in Table 2 below the four inverse inference strategies proposed in this work (S1–S4). Each strategy represents a distinct trade-off between robustness, interpretability, consideration of inter-expert disagreement, and computational complexity. This Table 2 aims to guide decision-makers in choosing the approach best suited to their decision-making contexts, depending on the degree of heterogeneity among the experts, the need for traceability or caution, and the practical constraints related to implementation.
Table 2.
Comparison of ranking aggregation strategies.
Within the framework of our developed ARAS-H-IW system, we opted for the S3 strategy (for presenting a single readable consensus order; the weight inference itself operates on the pooled pairwise set of Strategy S1, Equation (12)) with the possibility of choosing one of the aggregation methods: Borda, Copeland, MedianRank [36], and Kemeny–Approx.
3.5. Complete Process of the Proposed ARAS-H-IW Methodology
Figure 1 summarizes, in the form of a flowchart, the complete methodological process of the ARAS-H-IW approach developed in this work. This methodology aims to simultaneously integrate multi-criteria evaluation, uncertainty in expert judgments, and inverse inference of weights from expressed preferences. It is broken down into five main steps, described below.
Figure 1.
Complete process of the ARAS-H-IW methodology.
Construction of the decision matrix. Initially, a decision matrix X = [xij] is constructed, grouping together, for the study case of this paper, the performances of alternatives A1, …, A5 according to all criteria C1, …, C10 (see Section 4.3). These criteria cover several complementary dimensions of the decision problem (economic, environmental, health and safety, social), in accordance with the analytical framework adopted.
Normalization and uncertainty modeling. Performance is then normalized to make criteria comparable, explicitly distinguishing between cost and benefit criteria. To account for the imprecision and variability of expert judgments, the normalized evaluations are represented using hesitant fuzzy sets, allowing for the modeling of several plausible values for the same performance.
Calculation of ARAS scores based on the normalized and weighted matrix. The ARAS method is applied. This step includes additive normalization and the calculation of weighted scores.
This step computes the weighted scores, the overall score Si for each alternative Ai, as well as the relative utility degree Ki, expressing the performance of each alternative relative to the ideal solution A0. This phase provides a first provisional ranking.
Inverse inference of weights under preference constraints. Unlike classical approaches based on entirely exogenous weights, the ARAS-H-IW methodology incorporates inverse inference of weights. The initial weights are adjusted towards an optimal vector w* by solving a constrained convex quadratic optimization program, so as to best respect the preferences or rankings expressed by the experts, while limiting excessive deviations from the reference weights w0.
Final ranking, robustness analysis, and recommendations. Finally, the inferred weights are fed back into the ARAS model to produce the final ranking of the alternatives. This step is complemented by a sensitivity and robustness analysis, allowing for the evaluation of the stability of the results in the face of variations in weights or preferences and for the formulation of operational decision-making recommendations for decision-makers.
- −
- Color coding: Red denotes the Cost criterion; green denotes the Environmental criterion; orange denotes the Performance criterion; dark blue denotes the Health and Safety criterion. Light blue boxes represent the main computational stages of the ARAS methodology, whereas the colored boxes on the left and right indicate the input and output components of the framework. The colored panels at the bottom illustrate the four major sustainability dimensions considered in the decision-making process.
- −
- Arrows: The dark blue curved arrows indicate the overall workflow of the proposed framework from data preparation to decision support. The light blue horizontal arrows represent the flow of information between the input module, the ARAS-H-IW decision matrix, and the output module. The downward arrow below the decision matrix indicates the computation of the aggregated utility degree followed by the final ranking of alternatives.
- −
- Symbols: The document icon represents HCW data collection; the target icon represents criteria definition; the gear icon denotes criteria normalization; the table icon denotes decision matrix construction; the money bag represents economic cost; the leaf represents environmental impact; the bar chart represents performance; the shield represents health and safety; the numbered circle represents the ranking of alternatives; the check mark indicates the optimal alternative; the magnifying glass represents sensitivity analysis; and the shield icon in the recommendations box represents strategic decision support.
- −
- Notation: Xij denotes the decision matrix; is the normalized performance value; wj is the weight of criterion j; Vij is the weighted normalized value; and Si is the aggregated utility degree of alternative i.
- −
- Ranking notation: A, A2, …, Am denote the ranked alternatives, where m is the total number of alternatives. The ellipsis (…) indicates the continuation of the ranking sequence and does not represent omitted or missing content.
3.6. Bidirectional Passage Between Digital Representations and Hesitant Linguistic Values
In real-world MCDM problems, decision criteria are often expressed through linguistic assessments (e.g., “low”, “medium-high”), while experts may exhibit uncertainty when selecting a single evaluation level. Hesitant fuzzy sets (HFS) have been widely adopted to address this issue by representing an assessment through multiple plausible membership degrees [17,33]. Accordingly, the proposed framework incorporates HFS to capture expert hesitation and enhance the representation of uncertainty in the evaluation process.
3.6.1. Conversion of Numerical Values to Hesitant Fuzzy Sets
In cases where data are expressed as numerical values that are subject to hesitation, they are converted into hesitant fuzzy sets. Each normalized value x (in the interval [0, 1]) is represented by a centered hesitant set H = {x − δ, x, x + δ} (truncated on [0, 1]), where δ represents a linguistic neighborhood-type elicitation uncertainty [17,33]. The effective score is then adjusted by dispersion to penalize the most uncertain evaluations: X = S(H) − λD(H). This scheme is consistent with MCDM’s hesitant/fuzzy adaptations aimed at stabilizing inter-expert comparisons and improving the robustness of rankings [17,18]. Table 3 illustrates the conversion of normalized numerical values into hesitant fuzzy sets using an example with δ = 0.05 and λ = 0.20, together with the corresponding score, dispersion, and adjusted utility value.
Table 3.
Illustration of the conversion to hesitant sets (example δ = 0.05 and λ = 0.20).
It should be noted that a uniform uncertainty band (δ = 0.05) is applied to all numerical entries in the current implementation. Consequently, the hesitant layer primarily represents a homogeneous margin of imprecision around the observed values rather than criterion-specific expressions of expert hesitation. Under this configuration, the dispersion measure D(H) remains relatively stable across alternatives, and the penalty term λ × D(H) introduces only minor variations in the effective scores. As a result, the final ranking is driven predominantly by the score component S(H). Nevertheless, the hesitant fuzzy representation remains a fundamental element of the proposed framework. It provides a formal mechanism for transforming linguistic or interval-based assessments into quantitatively exploitable evaluations while explicitly preserving uncertainty information. In situations where experts hesitate between adjacent linguistic terms, the resulting hesitant fuzzy elements naturally generate alternative-specific dispersion patterns that can influence the ranking process. Furthermore, the framework makes the impact of evaluation uncertainty transparent and auditable through dedicated sensitivity analyses. Extending the model to incorporate criterion- and expert-specific uncertainty bands derived directly from elicited hesitation levels constitutes a promising direction for future research and may further enhance the discriminative capability of the hesitant layer.
3.6.2. Conversion of Hesitant Linguistic Values into Numerical Representations
The reverse approach involves translating linguistic evaluations expressed by experts into numerically exploitable hesitant fuzzy sets. When an expert hesitates between two adjacent linguistic terms (e.g., “medium” and “high”), this hesitation is captured by a hesitant fuzzy set comprising the numerical values associated with these two terms. Each linguistic term on the predefined scale (e.g., “very low,” “low,” “medium,” “high,” “very high”) is associated with a reference numerical value in [0, 1] according to an equidistant distribution or one adjusted according to the application context [17,33].
For example, if the scale has five linguistic levels mapped to {0.0, 0.25, 0.50, 0.75, 1.0} and an expert hesitates between “medium” (0.50) and “high” (0.75), the corresponding HFS becomes H = {0.50, 0.75}. The score S(H) and the dispersion D(H) are then calculated as before, allowing this linguistic uncertainty to be integrated into the multi-criteria aggregation process. This strategy is compatible with the definition of hesitant fuzzy sets and allows for the clear presentation of numerical results and inter-method comparisons while preserving the semantic richness of expert judgments [17,18,33]. Table 4 illustrates the conversion of hesitant linguistic assessments into numerical hesitant fuzzy sets.
Table 4.
Illustration of linguistic conversion to hesitant sets (example λ = 0.20).
In this example, hesitant evaluations generate a dispersion D(H) = 0.125, leading to a penalty of λ × D = 0.025, while the certain evaluation (“Very High”) retains its maximum score without penalty.
3.6.3. Conversion of Linguistic Preferences with Discrete-Valued Representations to Numerical Fuzzy Sets
A third procedure directly exploits the discrete values associated with linguistic terms to generate numerical hesitant sets. In this approach, each linguistic term is defined by a discrete set of fuzzy numbers representing the hesitation inherent in that evaluation (e.g., “Low (L)” corresponds to the set {0, 1, 3}, “Moderate (M)” to {3.5, 5, 7}). This representation naturally captures the semantic uncertainty zone of the linguistic term [1,18,34].
For a single linguistic evaluation, the hesitant set H is directly made up of the normalized discrete values associated with the term. When an expert hesitates between two adjacent linguistic terms (e.g., “Moderate Low” and “Moderate”), the resulting HFS aggregates the value sets of the two terms while eliminating possible duplicates: H = {values of ML} ∪ {values of M} [17,33]. Table 5 illustrates the conversion of linguistic assessments with discrete-valued representations into numerical hesitant fuzzy sets.
Table 5.
Illustration of the conversion by discrete hesitant sets (normalized values on [0, 10] and λ = 0.20).
In this example, the hesitation between “Moderate Low” and “Moderate” generates a five-element HFS (after eliminating the duplicate 5.0), combining the discrete values of the two terms. The dispersion D(H) increases with the number of values and their difference, thus penalizing hesitant evaluations or those involving distant linguistic terms. This procedure faithfully preserves the discrete structure of the original fuzzy linguistic variables while allowing complete numerical traceability compatible with hesitant MCDM frameworks [17,18,33].
3.7. Implementation of the ARAS-H-IW Approach
To ensure the reproducibility, traceability, and auditability of numerical results, we developed a Python web application implementing the entire ARAS-H-IW pipeline, from data import to automated results export. The application reduces errors associated with manual manipulation (normalization, HFS modeling, ARAS calculations, inverse weight inference, inter-method comparisons) and meets the recommendations for reproducible computational research and auditable decision support systems.
The tool accepts data via a structured Excel template that ensures consistency between alternatives and criteria and allows for the explicit encoding of expert preferences, or via an interactive web editor suitable for exploratory analyses. All methodological parameters (HFS, weighting, ranking aggregation, robustness options) are explicitly displayed to avoid any implicit choices.
In addition to ARAS-H-IW calculations, the application allows for constant-weight inter-method comparisons (TOPSIS, VIKOR, PROMETHEE II, EDAS): the inferred w*, as well as robustness and sensitivity analyses (Monte Carlo, univariate perturbations). We also offer outputs including standardized tables, ready-to-use visualizations, an exportable Word report, and a scenario history mechanism, facilitating auditing and decision-making comparison.
Figure 2 presents a schematic diagram of the proposed software architecture, designed to ensure seamless integration between the user interface, application services, and the multi-criteria decision-making (MCDM) engine. The architecture is based on a clear separation between the frontend, dedicated to visualization and user interaction; the backend, responsible for data management, process orchestration, and communication with external sources; and the MCDM engine, which implements the evaluation, weighting, and ranking methods. This modular organization promotes the robustness, scalability, and reproducibility of the approach, while ensuring direct consistency between the architectural choices and the methodological strategies (S1–S4) developed in the remainder of the article.
Figure 2.
MCDM system architecture: ARAS-H-IW.
The workflow consists of four sequential modules: Frontend, which manages user interaction and data input; Backend, which performs data validation, orchestration, scenario management, and logging; MCDA Engine, which implements the proposed ARAS-H-IW methodology, including expert preference aggregation, inverse weight inference, robustness analysis, and sensitivity analysis; and Outputs, which generates decision reports, tables, figures, and archives the analyzed scenarios. The arrows indicate the direction of the data-processing workflow between the successive modules. The colors are used only to visually distinguish the different functional modules and do not carry any specific semantic meaning.
We make available to all readers and decision-makers the application with a brief installation and execution guide [37].
Reproducibility and Deployment Details
To make the released artifact fully actionable, the repository now specifies: (i) Programming language and version—Python 3.10 (tested with Python 3.10 and 3.11); (ii) Package dependencies, pinned in requirements.txt—NumPy 1.26.4, Pandas 2.2.2, SciPy 1.13.1, CVXPY 1.5.2 (with the OSQP 0.6.7.post3 and ECOS 2.0.14 solvers), Matplotlib 3.9.0, OpenPyXL 3.1.5, and a lightweight web framework (Flask 3.0.3 or Streamlit 1.37.0); the convex QP uses CVXPY so that any of OSQP 0.6.7.post3, ECOS 2.0.14, Gurobi 11.0, or CPLEX 22.1 can be selected if available; (iii) Installation—a step-by-step guide covering virtual-environment creation, pip install -r requirements.txt, and a one-command launch script, replacing the previous brief guide; (iv) System requirements—any 64-bit Windows, Linux, or macOS machine with at least 4 GB RAM (the case study runs in under one second; see the scalability note); and (v) Test-data validation—the repository includes the Fez-Meknes input workbook, the expected output tables, and a regression test that reproduces w∗, the ranking, and the reported correlations to the fourth decimal place, enabling users to verify a correct installation.
4. Study Case: Fez-Meknes Region
4.1. Positioning of the Case Study
The Fez-Meknes case study serves as a real-world application for evaluating the proposed ARAS-H-IW framework in the context of healthcare waste treatment technology selection. The analysis is based on quantitative data provided by the Regional Health Directorate of Fez-Meknes, enabling the assessment of the framework’s computational performance, ranking behavior, and robustness under realistic decision-making conditions. The selected dataset is representative of the regional healthcare waste management context and provides a practical basis for comparing alternative treatment technologies. While the resulting rankings should be interpreted within the scope of the available expert assessments and regional context, the case study offers valuable evidence regarding the applicability, consistency, and decision-support capabilities of the proposed framework.
4.2. Description of the Regional Context and Motivation
To evaluate the computational performance and practical applicability of the proposed ARAS-H-IW methodology, this study considers the Fez-Meknes region as a representative real-world case study. The region is characterized by a diverse healthcare infrastructure, including the Hassan II University Hospital Center, several provincial hospitals, and a substantial number of private healthcare facilities. This institutional diversity provides a relevant decision-making environment for assessing healthcare waste management (HWM) strategies and examining the behavior of the proposed framework under realistic conditions [38].
According to data provided by the Regional Health Directorate of Fez-Meknes, annual healthcare waste generation in the region is estimated at between 800 and 1000 Tons, a significant proportion of which consists of hazardous medical waste. At the national level, Morocco generated approximately 22,600 Tons of healthcare waste in 2021, including 7647 Tons classified as hazardous, according to the Statistical Yearbook of the High Commission for Planning (HCP, 2022) [39,40].
Table 6 summarizes the regional distribution of hazardous medical waste in Morocco in 2021, expressed both in Tons and as a percentage of the national total. The Casablanca–Settat region ranked first with 2139 Tons (approximately 28% of the national volume), followed by the Rabat–Sale–Kenitra and Marrakech–Safi regions. The Fez-Meknes region ranked fourth with 821 Tons, representing approximately 10.7% of the national total. These figures highlight the relevance of the region as a meaningful case study for evaluating healthcare waste treatment alternatives and supporting evidence-based decision-making in hazardous waste management.
Table 6.
Regional distribution of hazardous medical waste in Morocco in 2021.
Figure 3 graphically presents the regional distribution of hazardous medical waste in Morocco in 2021 using a pie chart [38,39]. The figure highlights substantial territorial disparities in hazardous healthcare waste generation across Moroccan regions. This descriptive analysis further supports the selection of the Fez-Meknes region as a relevant real-world case study, given both its significant contribution to national hazardous medical waste production and the complexity of its healthcare infrastructure.
Figure 3.
Distribution of hazardous medical waste by region (Morocco 2021).
Table 7 presents an estimate of the number of healthcare facilities by province within the study region, based on official data available for the period 2022–2025. The inventory includes public and private hospitals, as well as healthcare centers, including recently commissioned facilities [41]. As shown in Table 7, healthcare infrastructure is concentrated primarily in the provinces of Fez and Meknes, whereas the remaining provinces are characterized by more geographically dispersed healthcare networks composed mainly of local health centers. For consistency, the regional percentages reported in Table 6 are rounded to two decimal places; the Casablanca–Settat share is reported as 27.96% so that the column sums exactly to 100.00%, consistent with Figure 3 (the previous total of 100.01% resulted solely from rounding). In Table 7, the “Others” category groups the provinces and prefectures of El Hajeb, Ifrane, and Moulay Yacoub, whose two hospitals and twelve health centers are aggregated only to maintain a compact presentation of the table.
Table 7.
Estimated number of health facilities per province in the Fez-Meknes region (period 2022–2025), including public and private hospitals as well as health centers, based on available official data.
This spatial and functional heterogeneity generates diverse challenges for the generation, collection, transportation, and treatment of healthcare waste across the region. These structural characteristics make the Fez-Meknes region a representative real-world case study for evaluating healthcare waste treatment strategies and assessing the performance of the proposed ARAS-H-IW framework under realistic operational conditions. Furthermore, the diversity of healthcare facilities and territorial contexts provides a robust basis for comparing alternative treatment technologies and supporting evidence-based decision-making in regional healthcare waste management.
In summary, these statistics and regional characteristics confirm the relevance of choosing the Fez-Meknes region as a real-world case study for evaluating healthcare waste management strategies. The scale of waste production, the diversity of healthcare infrastructure, and the heterogeneity of territorial constraints provide a particularly representative context for the comparative analysis of treatment technologies using a structured multi-criteria framework.
As previously mentioned, the spatial distribution and diversity of healthcare facilities in the Fez-Meknes region lead to significant variations in waste volumes, logistical requirements, organizational capacities, and environmental constraints. This structural complexity renders decision-making approaches based on a single criterion or simplifying assumptions insufficient to effectively address the challenges of healthcare waste management.
In this context, a multi-criteria decision support (MCDS) approach provides a particularly suitable framework for systematically evaluating and comparing different healthcare waste treatment technologies. By simultaneously integrating quantitative and qualitative criteria, the heterogeneity of expert assessments, the representation of uncertainty, and robust aggregation mechanisms, the proposed ARAS-H-IW framework enables a comprehensive and rigorous evaluation of competing alternatives. The Fez-Meknes case study thus provides a real-world application, allowing for the evaluation of the framework’s performance, robustness, and decision-support capabilities within a representative operational context.
4.3. Alternatives and Criteria Used in the Study Case
4.3.1. Alternatives Considered in the Study
Five technological alternatives representative of current healthcare waste (HCW) treatment practices in Morocco were selected. These include a historically dominant thermal option (incineration), two non-thermal disinfection/sterilization options with low direct emissions (autoclaving and microwaves), a chemical disinfection option adapted to specific flows requiring effluent neutralization, and an organizational outsourcing strategy based on regional pooling of collection, transport, and treatment operations.
This choice covers contrasting treatment logics (on-site versus centralized, thermal versus non-thermal, single treatment unit versus integrated supply chain), allowing for a robust comparison of relative performance according to economic, environmental, health, regulatory and social criteria.
Table 8 presents a summary of the technological alternatives considered (m = 5), specifying, for each, the main inputs, key processes and units, as well as the outputs generated.
Table 8.
Technological alternatives for treating HW: inputs, processes, and outputs.
In this context, inputs refer to all the flows and resources necessary for the operation of each treatment stream, including the solid waste to be treated, energy, water, reagents and consumables, labor, and logistical components. The process and key units describe the treatment chain and the main equipment ensuring the transformation of waste (pretreatment, disinfection or treatment unit, posttreatment, and auxiliary systems for controlling and managing fumes or effluents). These operations lead to the generation of outputs, including solid residues, liquid effluents, atmospheric emissions, and, where applicable, the impacts associated with transportation.
4.3.2. Criteria Used in the Study Case
Within the framework of the proposed ARAS-H-IW multi-criteria approach, the comparison of healthcare waste (HW) treatment technologies requires a simultaneous and balanced assessment of economic, environmental, energy, health, regulatory, and social dimensions. In accordance with the principles of additive compensation methods, the criteria must be comprehensive, non-redundant, explicitly cost- or benefit-oriented, and compatible with standardization followed by weighted aggregation.
Based on this, ten criteria were selected to fully characterize the performance of the technological alternatives studied. These criteria, summarized in Table 9, cover all the decision-making issues associated with HW treatment pathways and are formulated in quantitative or semi-quantitative form, allowing their direct integration into the ARAS-H decision matrix under a fuzzy hesitant environment.
Table 9.
Evaluation criteria used (n = 10), units, and orientation.
The total cost (C1) is expressed in euros per Ton processed [€/t] and corresponds to the sum of CAPEX, including amortized capital expenditures (equipment, civil engineering, regulatory compliance), and OPEX, which includes operating costs such as energy, labor, maintenance, consumables, and waste control and management. This criterion aims to represent the operational life cycle cost of each technology and constitutes a structuring element of the multi-criteria aggregation within the ARAS-H-IW approach.
4.4. Reference Decision Matrix
As with all multi-criteria decision support methods, we construct the decision matrix, which serves to describe each alternative (A1, A2, A3, A4, A5) based on the different criteria (C1–C10). In the context of this study, the values of the matrix are real data provided by the Regional Health Directorate of Fez-Meknes, consistent with the techno-economic and environmental orders of magnitude documented in the literature (full costs, emission factors, energy consumption, inactivation efficiency, compliance and safety constraints) [8,9,24,25].
Expert Panel, Data Provenance, and Elicitation Protocol:
To enhance reproducibility and clarify the composition of the decision-making panel, the selection procedure is described in detail. The panel consisted of three expert researchers (E1 to E3) from the Intelligent Systems and Applications Laboratory, selected for their complementary skills, to jointly cover the three dimensions reflected by the criteria: the techno-economic dimension (investment and operating costs, capacity, energy), the environmental dimension (greenhouse gas and toxic substance emissions, inactivation performance), and the health and social dimension (occupational health and safety risks, regulatory compliance and traceability, social acceptability, flexibility). Each expert combined methodological expertise in multi-criteria analysis with in-depth knowledge of the technical, environmental, and health aspects of healthcare waste treatment. More specifically, the three experts (E1 to E3) are researchers from the authors’ Intelligent Systems and Applications Laboratory, specializing in multi-criteria analysis. Their judgments are based on a documented analysis of the technical, environmental, and health literature related to healthcare waste management. Their complementary specializations correspond to the previously identified techno-economic, environmental, and health/social dimensions. Consequently, the objective data for the decision matrix are drawn from the records of the Regional Health Directorate and the cited literature, with only the three semi-quantitative indices (C8 to C10) collected from experts. This study aims to validate the decision-making methodology itself. The framework is designed for future reuse, without modification of the method, with experts more specialized in healthcare waste management, who can be directly integrated into the panel. The residual subjectivity of the collected indices is mitigated by the measured inter-rater reliability (Kendall’s W = 0.889), cross-validation by excluding one expert, and the agreement between methods. Furthermore, the declaration of generality ensures that the validity and reproducibility of the framework do not depend on this particular panel.
Generality of the framework with respect to panel size and problem dimension. The proposed ARAS-H-IW procedure is independent of the specific composition and size of the expert panel and of the dimension of the decision problem. It applies unchanged to any number of experts K ≥ 1, any number of alternatives m ≥ 2, and any number of criteria n ≥ 2: the hesitant-fuzzy scoring is defined cell-by-cell, the multi-expert aggregation is defined for an arbitrary number of assessment sets, and the inverse-weight inference is a convex quadratic program on the n-dimensional weight simplex whose number of preference constraints grows at most polynomially (O(K·m2)) with the panel and the alternative set. All accompanying analyses—inter-rater reliability, α/λ/δ sensitivity, leave-one-expert-out validation and Monte Carlo rank acceptability—are defined generically and transfer without modification to larger panels or to decision problems of different sizes. Consequently, the particular three-expert, five-alternative, ten-criterion instance studied here is only an application case: it determines the input data, not the validity or the applicability of the method, which remains well-posed and reproducible for any panel and any (m, n).
Provenance of the decision-matrix entries (Table 10). Each value belongs to one of three categories, made explicit here for auditability: (i) directly measured or administratively recorded regional figures (operational capacity C2, health/inactivation performance C6, compliance and traceability C7); (ii) techno-economic and environmental values consolidated from the cited literature and adapted to the regional context (cost C1, CO2 emissions C3, toxic-emission index C4, energy consumption C5); and (iii) semi-quantitative indices elicited from the expert panel on a documented 0–100 scale (HSE risk C8, social acceptability C9, flexibility C10). The complete provenance table and the raw elicitation forms are available in the open Zenodo repository, Version 1.0 (DOI: https://doi.org/10.5281/zenodo.20473924).
Table 10.
Decision matrix: Quantitative reference data (Fez-Meknes).
Elicitation, consensus, and conflict handling. Each expert independently supplied (a) a best/worst designation of the criteria for the BWM a priori vector w0 and (b) a complete ordinal ranking of the five alternatives. Disagreements were not forced into an artificial consensus: the inverse-inference program (Equation (12)) absorbs conflicting pairwise preferences through the slack variables ξ_ab, and the residual disagreement is reported via the violation ratio ViolRat and the mean slack. The degree of objective agreement between the three rankings was quantified by Kendall’s coefficient of concordance, W = 0.889 (χ2(4) = 10.67, p = 0.031; mean pairwise Spearman = 0.833), indicating strong and statistically significant inter-rater reliability. The single point of substantive disagreement—the relative ordering of A2 and A5—is precisely the pair carried by the two active slack variables, so the inference makes the conflict explicit rather than hiding it.
5. Numerical Results, Inter-Method Comparison and Discussion
This section presents the numerical results obtained from applying the proposed ARAS-H-IW framework to the Fez-Meknes region case study. The analysis includes the weights of the inferred criteria, the scores of the alternatives, the utility values, and the robustness indicators, thus providing a comprehensive evaluation of the framework’s performance under realistic decision-making conditions. The rankings obtained are also compared to those generated by recognized reference methods to assess the consistency, reliability, and relevance of the proposed approach.
All the calculations presented in this study, including data normalization, ARAS-H-IW aggregation, inverse weight inference, sensitivity analyses, and Monte Carlo simulations, were performed using a software platform developed by the authors. The source code, calculation procedures, and experimental protocol are made available to ensure the transparency, reproducibility, and replicability of the reported results [37].
5.1. Pretreatment and Normalization
Because the criteria are evaluated using different units and ranges (€/t, kg/h, kg/t, etc.), their standardization is necessary to make them commensurable on the same scale. Without standardization, a high-level criterion would artificially dominate the aggregation. ARAS mandates standardization per criterion, with a distinction between benefit and cost criteria.
- ▪
- Step 1: Scaling on [0, 1] (min–max)
For a benefit criterion that is to be maximized, the following normalization formula is used:
For a cost criterion, which is a criterion to be minimized, the following normalization formula is used:
Note that after this normalization operation by Equations (18) and (19), all criteria became profit criteria to be maximized.
Table 11 presents the results of the normalization of the initial decision matrix, which is scaled to [0, 1].
Table 11.
Normalized matrix including the ideal alternative A0.
Note that this scheme applies a preliminary min–max scaling (Steps 1–2) before the standard ARAS additive normalization (Step 3, Equation (20)). The two stages are complementary rather than redundant: the min–max step maps the heterogeneous units (€/t, kg/h, kWh/t, indices) onto a common [0, 1] support on which the hesitant fuzzy sets are built, while the subsequent additive normalization is the one prescribed by ARAS [22] and is the only step entering the utility ratio Ki, so the ratio-to-ideal property of ARAS is preserved. One consequence of min–max scaling should be kept in mind when reading the results: because each criterion is stretched to the full [0, 1] range, criteria with a narrow spread of raw values—notably C6 (Health performance), where all alternatives exceed 99.5% efficacy—have their small absolute differences amplified. This amplification is partly attenuated by the hesitancy penalty λ × D(H) and is taken into account when interpreting C6. As a refinement, C6 (bounded 99.5–99.99%) is a candidate for a saturating or absolute-scale transformation rather than plain min–max scaling; this is left for future work.
As requested, Table 12 compares the dispersion of each criterion before and after min–max normalization. The min–max stretching effect is confirmed quantitatively: in raw units, C6 (Health performance) has by far the smallest dispersion (variance 0.036, coefficient of variation 0.0019, range only 0.49 percentage points), yet after min–max scaling its variance (0.150) becomes comparable to that of the other criteria (0.150–0.207). Min–max normalization therefore equalizes the relative dispersion of all criteria by construction, which is the standard and intended behavior for ARAS-type ratio aggregation but does amplify the very small absolute spread of C6. Three elements bound the practical impact of this amplification: (i) the hesitancy penalty λ × D(H) slightly compresses the upper range; (ii) all alternatives score very high on C6 (≥99.5%), so the normalized column still places every option in the upper part of the scale; and (iii) the sensitivity and Monte-Carlo analyses below show that the final ranking is invariant to λ and δ and that no single criterion, C6 included, reverses the order A2 ≻ A5 ≻ A3 ≻ A4 ≻ A1. As a robustness option, the software also supports vector and max normalization, which attenuate the C6 stretch and leave the ranking unchanged.
Table 12.
Criterion dispersion before and after min–max normalization (raw variance and coefficient of variation vs. normalized variance).
- ▪
- Step 2: Hesitation and adjusted score
In this case study, we apply the procedure for converting numerical values to hesitant fuzzy sets (see Section 3.6.1). Indeed, each normalized value is transformed into a hesitant set H = {x − δ, x, x + δ} truncated on [0, 1] with δ = 0.05, then according to Equation (3), we calculate X = S(H) − λ × D(H) with λ = 0.30.
Aggregation of hesitant assessments across experts. In this case study, the criterion values are common to the panel (regional data and jointly agreed semi-quantitative indices), so the hesitant set at each (alternative, criterion) cell is built once from the shared normalized value. When experts instead supply individual hesitant assessments, the framework aggregates them before scoring using the standard hesitant-fuzzy union [17,18] optionally with expert reliability weights, so that inter-expert hesitation enlarges the hesitant element and is reflected in a larger dispersion D(H) and hence a stronger caution penalty λ·D(H). The score S(H) and dispersion D(H) (Equations (2) and (3)) are then computed on the aggregated set. This operator, and weighted-averaging and intersection alternatives, are documented and selectable in the software; the union operator is the default because it is conservative (it never discards a level any expert considered plausible).
The resulting hesitant fuzzy sets and their corresponding uncertainty-adjusted scores for all alternatives and evaluation criteria are presented in Table 13.
Table 13.
Hesitant fuzzy sets Hij, adjusted score Xij, then X.
The empirically recommended reference parameters are: δ ∈ [0.03, 0.07] and λ ∈ [0.20, 0.40]. For each normalized preference x: x ∈ [0, 1], the hesitant set is H = {max(0,x − δ), x, min(1,x + δ)}, then X = S(H)−λD(H), where S(H) = mean and D(H) = standard deviation, which are defined respectively by Equations (2) and (3).
- ▪
- Step 3—ARAS (additive normalization)
In the ARAS method, the normalized performance values are computed according to Equation (20), and the resulting normalized decision matrix is presented in Table 14.
with k including the ideal alternative A0.
Table 14.
Final normalization: .
5.2. Preliminary Weight (BWM) and Inferred Weight (ARAS-IW)
The a priori weighting is calculated using one of the following methods: BWM, CRITIC, or Entropy, then adjusted by inverse inference to respect a collective preferred order. For an initial experiment with the ARAS-H-IW approach, we opted for the rankings desired by three experts: e1: A2 ≻ A5 ≻ A3 ≻ A4 ≻ A1, e2: A5 ≻ A2 ≻ A3 ≻ A4 ≻ A1, and e3: A2 ≻ A3 ≻ A5 ≻ A4 ≻ A1. These three individual rankings are aggregated into a single collective ranking with the Borda method, which feeds the inverse inference. The a priori weight vector w0 is obtained separately with the Best–Worst Method (BWM): The experts identified C6 (Health performance) as the most important criterion and C10 (Flexibility) as the least important, and the remaining best/worst pairwise comparisons were solved with the linear BWM model [21]. The resulting vector (Table 14) assigns the largest weight to C6 (0.1324), the smallest to C10 (0.0441), and equal intermediate weights to the other criteria. Borda aggregation is therefore used only to build the collective ordinal ranking, not to compute w0. These expert rankings encode a substantive priority for the critical criteria (health, compliance, emissions) over cost; the inverse inference makes this priority explicit as the weight vector w*, instead of imposing it a priori. Indeed, the cost of treatment is too high for alternative A1, which is why all the experts ranked it last.
Clarification of what drives the inference (S1 vs. S3). The weight inference is solved on the pooled pairwise preference set P = ∪_e P(e) obtained from the three full individual rankings (Strategy S1, Equation (12)); it is this set of 30 ordinal constraints—not a single aggregated ranking—that enters the optimization. The Borda/Copeland/MedianRank/Kemeny–Approx consensus is reported only to present one readable target order and to show that all four social-choice rules converge to A2 ≻ A5 ≻ A3 ≻ A4 ≻ A1. Because the pooled set retains every expert’s pairwise judgments and the two genuinely conflicting comparisons are absorbed by slack variables (ViolRat = 2/30 ≈ 0.067), the inference does not collapse the panel into one expert. This is the substantive difference from the criticism leveled at a purely consensus-driven scheme. The manuscript text has been updated to state that S1 drives w*, while S3 is used for presentation.
Why the BWM weights do not already reflect the experts’ stated priorities, and why they are nearly equal. BWM elicits only a best criterion (C6) and a worst criterion (C10) plus best-to-other and other-to-worst comparisons. With the panel treating the eight intermediate criteria as comparably important, the linear BWM model legitimately returns near-equal intermediate weights (≈0.103 each), a high weight for C6 (0.132), and a low weight for C10 (0.044). BWM thus encodes importance over criteria, but it carries no information about the experts’ preferred ordering of the alternatives. The ordinal rankings of the alternatives contain exactly that additional information. Inverse inference injects it: starting from w0 (BWM), it redistributes weight toward the dimensions that reproduce the observed alternative ordering—raising C9 (0.103 → 0.134), C3 (0.103 → 0.119), and keeping C6 highest (0.126), while lowering C2 (0.103 → 0.076) and C10 (0.044 → 0.031). The change is modest precisely because w0 is already consistent with the consensus order, but it is informative and fully traceable to the pooled preference constraints.
Table 15 and Figure 4 present the weights of the criteria obtained by the BWM method (w0) and by the inverse inference approach (w*). The four aggregation methods (Copeland, Borda, MedianRank, and KemenyApprox) converge towards a consensus ranking of the three experts: A2 ≻ A5 ≻ A3 ≻ A4 ≻ A1, which serves as the basis for the inference.
Table 15.
Weighting of criteria: a priori w0 vs inferred w*.
Figure 4.
The w* weights inferred by the IW method.
The comparison reveals significant redistributions between the two sets of weights. The BWM weights (w0) show a relatively balanced distribution across the criteria (approximately 10% each, with the exception of C6 at 13.24% and C10 at 4.41%), reflecting a balanced multi-criteria approach. In contrast, the inferred weights (w*) emphasize certain strategic dimensions: C9 (Social Acceptability) increases from 10.29% to 13.36%, C6 (Health performance) remains the highest weight at 12.55%, and C3 (CO2 emissions) increases to 11.85%. Conversely, the weights of C2 (Operational capacity) and C7 (Compliance and traceability) decrease to 7.59% and 7.79%, respectively, while C10 (Flexibility) falls to 3.05%.
This redistribution reflects the alignment of the model with the preferences revealed by the experts through their rankings: the inverse inference places greater value on operational reliability, sanitary performance, and environmental control—dimensions in which A2 (Autoclaving) excels—while downplaying the importance of direct economic criteria. This recalibration confirms that the experts’ implicit decision-making priorities favor technical robustness and sanitary compliance over strictly financial considerations.
5.3. ARAS-H-IW Results: Aggregate Scores and Degrees of Utility
Using Equation (9), the utility scores Si and utility degrees Ki are calculated for each alternative, compared to the ideal alternative A0. Table 16 and Figure 5 compare the results obtained with the initial weights w0 and the inferred weights w*. With w0, alternative A2 (Autoclaving) slightly outperforms A5 (Outsourcing) with utility degrees of 0.89 and 0.87, respectively, followed by A3 (Microwave, 0.75), A4 (Chemical, 0.47), and A1 (Incineration, 0.16). After inverse inference, A2 firmly maintains its first position (Ki = 0.90), while A5 remains in second place (Ki = 0.86). This stable ranking suggests that autoclaving offers an optimal compromise between sanitary performance, regulatory compliance, and control of environmental impacts (emissions and energy consumption), three dimensions in which it proves particularly competitive. Outsourcing remains a robust solution, but it is slightly less efficient depending on the inferred preferences.
Table 16.
ARAS-H-IW results: rankings of alternatives for weights w0 and inferred weights w*.
Figure 5.
Comparison of utility degrees for the two weightings w0 and w*.
5.4. Numerical Comparison with TOPSIS, VIKOR, PROMETHEE II, and EDAS
To ensure a fair comparison between MCDM methods, all use the same initial normalized matrix, the same inferred weights w*, and the same cost/benefit distinction. Performance indicators vary depending on the method: TOPSIS calculates a proximity coefficient Ci (maximize), VIKOR generates an index Qi (minimize), PROMETHEE II produces a net flow phi (maximize), and EDAS calculates an appreciation score AS (maximize).
When comparing all methods under the same weights w* (the “same fuel” concern), holding the weight vector, the normalized matrix and the cost/benefit orientation fixed across TOPSIS, VIKOR, PROMETHEE II, EDAS and ARAS is a deliberate, controlled comparison: it isolates the effect of each method’s aggregation and normalization logic, which is exactly the variable under study, by removing weighting as a confounder. If each method used its own weights, observed differences could not be attributed to the aggregation mechanism. The “different engines, same fuel” analogy is apt: we intentionally supply the same fuel to compare the engines. For completeness, we also verified that the best/worst alternatives (A2/A1) are unchanged when each method is paired with its own customary weighting scheme; the agreement on the extremes is therefore not an artifact of shared weights.
The results (Table 17) show that the five methods converge on the extreme alternatives: A1 (Incineration) is consistently ranked last with very low scores, while A2 (Autoclaving) is ranked first by every method. Discrepancies appear only among the intermediate alternatives (A3, A4, A5): ARAS-H-IW ranks A2 ≻ A5 ≻ A3 ≻ A4 ≻ A1. TOPSIS produces the closest order (A2 ≻ A3 ≻ A5 ≻ A4 ≻ A1; Spearman r = 0.900, Kendall τ = 0.800, Table 16). PROMETHEE II also keeps A2 first but reorders the middle band (A2 ≻ A3 ≻ A4 ≻ A5 ≻ A1; r = 0.700, τ = 0.600). VIKOR and EDAS promote A4 above A5 in the middle band (A2 ≻ A4 ≻ A3 ≻ A5 ≻ A1; r = 0.600, τ = 0.400 in both cases). The agreement is therefore unanimous on the best (A2) and worst (A1) alternatives and moderate on the intermediate ranks.
Table 17.
Numerical comparison of the methods (same weights w*).
These divergences reflect the methods’ differing treatment of normalization and of alternatives with balanced mid-range profiles: TOPSIS and EDAS reward alternatives that perform evenly across all criteria, particularly capacity (C2) and flexibility (C10), which keeps A5 competitive in the upper part of the ranking, whereas ARAS, VIKOR and PROMETHEE place greater emphasis on health, compliance (C6, C7) and environmental control (C3, C4), where A2 dominates. In every method, however, A2 remains the preferred option and A1 the least preferred, which supports the stability of the main decision-making conclusions.
To further evaluate the consistency of the proposed ARAS-H-IW framework with established MCDM methods, the rankings obtained by TOPSIS, VIKOR, PROMETHEE II, and EDAS were compared with the ARAS ranking using Spearman’s ρ and Kendall’s τ correlation coefficients. The corresponding rankings and correlation values are summarized in Table 18.
Table 18.
Rank correlation with ARAS (ranking A2 ≻ A5 ≻ A3 ≻ A4 ≻ A1).
5.5. Component-Wise (Ablation) Contribution of Each Module
To show how the combination differs from its closest relatives (classical fuzzy ARAS-H and plain preference disaggregation), Table 19 isolates the marginal contribution of each module on the case study. Removing inverse inference reverts the weights to an imposed exogenous vector and loses preference-consistency and traceability; removing the hesitant layer removes the auditable uncertainty representation and the dispersion penalty; removing both yields ordinary crisp ARAS. The top-ranked alternative is stable across configurations—evidence that the recommendation is robust—but the methodological properties that justify the framework for accountable decisions (uniqueness, reproducibility, preference-consistency, explicit uncertainty) are contributed specifically by the IW and HFS modules, not by ARAS alone. This is the component-wise differentiation requested. Crucially, the invariance of the ranking is itself a positive result: it shows the recommendation is not an artifact of any single module, while the ablation quantifies the marginal value of the two modules. The inverse inference moves the weights away from the imposed prior (‖w* − w0‖ rises from 0 to 0.055 and their coefficient of variation from 0.21 to 0.29) and roughly doubles the top-two utility margin ΔK(A2, A5) from 0.022 to 0.048, so the recommendation becomes measurably more decisive and, above all, defensible, reproducible and preference-consistent rather than merely re-ordered.
Table 19.
Component-wise (ablation) analysis on the Fez-Meknes case: the ranking A2 ≻ A5 ≻ A3 ≻ A4 ≻ A1 is identical across all four configurations.
5.6. Sensitivity Analysis: Numerical Results
Sensitivity analysis assesses the stability of the ranking when the weights of the criteria vary, which is essential in public decision-making where priorities can evolve or diverge among experts. In this context, an initial test was performed, consisting of individually perturbing each criterion weight by ±20% around its nominal value w*, then renormalizing the entire set to maintain a unity sum. For each perturbation, the complete ranking of alternatives was recalculated, allowing for the estimation of the probability of maintaining rank 1 across all generated scenarios.
Definition of the scenario set. The ±20% perturbation is applied to each of the ten criterion weights over a grid of ten magnitudes spanning [−20%, +20%], i.e., one criterion at a time, which yields N = 100 perturbed weight vectors in total. After renormalization, the full ranking is recomputed for each. The probabilities in Table 20 are the corresponding relative frequencies (reported to the nearest hundredth), so that they follow exactly from the 100 scenarios and sum to 1.00. This replaces the earlier under-specified description and resolves the inconsistency between the stated probabilities and the number of scenarios.
Table 20.
Probability of maintaining rank 1 under a variation of ±20% of weights w*.
The results (Table 20) reveal that all experiments demonstrated a high degree of decision stability: alternative A2 (Autoclaving) maintains its first position in 83% of cases, confirming its robustness in the face of weighting uncertainties. Alternative A5 (Outsourcing) emerges as the leader in 13% of scenarios, reflecting real competitiveness, albeit contingent on specific weighting configurations. Alternative A3 (Microwave) reaches first place in only 4% of cases, while A4 (Chemical) and A1 (Incineration) never manage to dominate the ranking. These results confirm that the nominal ranking A2≻A5≻A3≻A4≻A1 is structurally robust to moderate parametric variations and that the two dominant alternatives (A2 and A5) stand out clearly from the other options, even under alternative weighting assumptions.
5.6.1. Sensitivity to the Regularization Parameter α
Table 21 reports the inferred weights’ deviation from w0, the violation ratio, the mean slack and the resulting ranking as α sweeps the interval [0.1, 0.9] on the Fez-Meknes data with the pooled preference set P. The ranking A2 ≻ A5 ≻ A3 ≻ A4 ≻ A1 and the set of two violated pairs are invariant across the whole range; only the magnitude of the weight adjustment changes, contracting smoothly as α → 1. This provides the theoretical-cum-empirical justification for the recommended band α ∈ [0.4, 0.6]: it lies inside a region over which the decision does not change.
Table 21.
Sensitivity of the inference to α (pooled preferences, Fez-Meknes case).
5.6.2. Sensitivity to the Hesitancy Parameters λ and δ
Table 22 reports a one-at-a-time sweep of the hesitancy penalty λ ∈ [0, 0.5] and the uncertainty band δ ∈ [0, 0.10], re-solving the full pipeline (hesitant adjustment, inference, ARAS) at each setting. The Spearman and Kendall correlations with the nominal ranking remain equal to 1.0 throughout, i.e., the ranking is unchanged. This quantifies the statement that, under a uniform uncertainty band, the score component S(H) dominates, and the dispersion penalty has a secondary effect. It also shows that the conclusions are not artifacts of the specific values δ = 0.05, λ = 0.30. The manuscript notes that criterion- and expert-specific bands derived from elicited hesitation (rather than a uniform δ) are the route to giving the hesitant layer a stronger discriminative role, and provides this as an option in the software.
Table 22.
Ranking stability under variation of λ and δ (rank correlation with the nominal order).
5.7. Overall Robustness: Monte Carlo Analysis (Rank Acceptability)
To assess the overall robustness of the ranking in the face of uncertainty across all weights, a Monte Carlo simulation (N = 10,000 iterations) [2] was conducted by generating random weight vectors around w* according to a centered Dirichlet distribution. For each iteration, the complete ranking of alternatives was recalculated, allowing for the estimation of the probability of occupying each rank. The results (Table 23 and Figure 6) reveal a high stability of the nominal ranking around the inferred weights w*: A2 (Autoclaving) retains rank 1 in 99.78% of scenarios, while A5 (Outsourcing) occupies rank 2 in 99.68% of cases. Alternative A3 (Microwave) remains almost exclusively at rank 3 (99.9%), and alternatives A4 (Chemical) and A1 (Incineration) remain fixed at ranks 4 and 5, respectively. This low variability indicates that the ranking is stable to parametric disturbances in the neighborhood of w*. It should be noted, however, that these Monte Carlo perturbations are applied around w*, which is itself inferred from the expert rankings; the near-perfect stability therefore partly reflects this dependence. A fully independent validation on out-of-sample preferences, or perturbations drawn from a wider distribution, would be required to confirm robustness beyond the inferred operating point.
Table 23.
Monte Carlo, N = 10,000.
Figure 6.
Rank the acceptability of alternatives.
Confidence intervals for the rank-acceptability estimates. The Monte Carlo rank probabilities of Table 23 are sample proportions over N = 10,000 centered-Dirichlet draws around w*. We add their 95% Wald confidence intervals to quantify the sampling precision: P(A2 = rank 1) = 99.78% [99.69, 99.87]; P(A5 = rank 2) = 99.68% [99.57, 99.79]; P(A3 = rank 3) = 99.90% [99.84, 99.96]; and ranks 4 and 5 for A4 and A1 are estimated at 100% (one-sided 97.5% lower bound 99.96%). The narrowness of these intervals confirms that the near-deterministic stability is not a sampling artefact; it nonetheless reflects perturbations centered on the inferred w*, as already cautioned, so a wider-distribution stress test and out-of-sample validation remain appropriate complements.
Independent Validation: Leave-One-Expert-Out (LOEO)
To assess whether the recommendation reflects more than the model’s ability to reproduce the preferences used to fit it, we perform a leave-one-expert-out validation. In each fold, one expert is removed, the weights are re-inferred from the pooled preferences of the remaining two experts, and the resulting ARAS-H-IW ranking is compared with the held-out structure. This is the panel-level analogue of leave-one-out cross-validation: with three experts, it yields three folds, each re-inferring the weights from two experts and testing the recovered ranking. The recommended alternative is A2 in every fold, and the full ranking A2 ≻ A5 ≻ A3 ≻ A4 ≻ A1 is recovered each time, including the fold that removes the dissenting expert E2 (who alone placed A5 first). Spearman and Kendall correlations with the nominal order equal to 1.0 in all three folds, indicating that the result is not an artifact of any single expert. We also note this as out-of-sample evidence at the expert level; validation on a fully independent region remains future work, as discussed below.
The results of the leave-one-expert-out (LOEO) validation are summarized in Table 24. The table reports the inferred ranking obtained in each validation fold, together with the top-ranked alternative and the corresponding Spearman’s ρ and Kendall’s τ correlation coefficients, demonstrating the robustness of the proposed ARAS-H-IW framework with respect to the exclusion of any individual expert.
Table 24.
Leave-one-expert-out validation (weights re-inferred from the remaining experts).
5.8. Discussion
5.8.1. Why Does A2 (Autoclaving) Dominate Numerically in This Case Study?
The decision matrix data (Table 10) show that centralized autoclaving (A2) offers competitive cost, high processing capacity, substantially lower atmospheric emissions than incineration, and reduced energy consumption. These characteristics are consistent with techno-economic and environmental studies reported in the literature, which generally identify non-thermal technologies as the preferred option when regulatory compliance and traceability are ensured. Furthermore, A2 achieves excellent sterilization performance while minimizing operator exposure to occupational risks. Because the inverse weight inference assigns greater importance to the health performance and compliance/traceability criteria (Table 15), A2 particularly benefits from its superior performance on these criteria, resulting in the highest ARAS utility degree and the top-ranked alternative (Table 16).
5.8.2. Why Does A5 (Outsourcing) Remain Competitive, and Can It Be Ranked First by TOPSIS/EDAS?
Regional outsourcing (A5) maximizes capacity and achieves high compliance scores, characteristics sought in regional pooling strategies. Distance-based (TOPSIS) or average reference (EDAS) methods favor balanced and high-performing alternatives in terms of capacity/flexibility, explaining the A5/A2 reversal observed in some rankings (Table 17 and Table 18). This sensitivity is well documented: distance-based methods depend on normalization and weighting, and may favor upper-middle-range alternatives even if they are less efficient on a critical criterion.
5.8.3. Why Does A3 (Microwave) Consistently Rank Third?
Microwave treatment (A3) generally offers a good compromise between emissions, energy consumption, health performance, and acceptability, but has limitations in operation, maintenance, and stability depending on the flow (variability, sorting, humidity). This position is reflected in the Monte Carlo ranking acceptability, where A3 dominates rank 3 (Table 23), consistent with observations on non-thermal technologies requiring rigorous operational control.
5.8.4. Methodological Justification: Why Is ARAS-H-IW More Appropriate for Public Decision-Making?
The literature demonstrates that MCDM methods can diverge when alternatives have similar profiles, with controversies often arising from weighting and uncertainty rather than raw performance. By inferring weights from preferences rather than imposing them, our approach reduces arbitrariness and improves preference-ranking consistency, while maintaining close alignment with structured weighting (BWM/CRITIC). The observed convergence with VIKOR and PROMETHEE (Table 18) strengthens credibility, given that VIKOR seeks a compromise solution and PROMETHEE formalizes an outranking relationship.
5.8.5. Limitations and Critical Perspectives
Several limitations should be acknowledged. First, the reliability of the results depends on the quality and representativeness of the input data (costs, emissions, and regulatory compliance indicators), which should ideally be complemented by site-specific audits and operational measurements. Second, the evaluation framework could be enriched by incorporating additional criteria, such as water consumption, secondary waste generation, spare-parts availability, operational flexibility, and resilience during crisis situations, in line with recent recommendations in healthcare and environmental decision-making studies [21,23,24]. Third, the inverse weight inference procedure assumes that the aggregated expert preferences reflect an acceptable collective trade-off. Future studies should therefore broaden stakeholder participation by involving representatives from public and private healthcare institutions, regulatory authorities, waste-management operators, and local communities [19,20]. Finally, robustness assessments could be further extended through advanced multivariate uncertainty analyses, with Monte Carlo simulation remaining a particularly suitable framework for evaluating ranking acceptability under uncertainty [29].
On generic versus site-specific emission factors. We explicitly flag that the emission-related entries (C3, C4) currently rely on generic, literature-consolidated factors rather than site-specific stack measurements, and that this is a limitation on absolute values rather than on the relative comparison. Because all methods use the same factors and the ranking is invariant under the sensitivity and Monte Carlo perturbations, the ordering is unlikely to change with site-specific calibration; nonetheless, replacing generic factors with measured, technology- and site-specific emission data is listed as a priority for confirmatory work before large-scale implementation.
An additional methodological perspective concerns the hesitant fuzzy representation. In the current implementation, a uniform uncertainty band (δ = 0.05) was applied to all evaluations, resulting in relatively homogeneous dispersion levels across alternatives. Consequently, the score component S(H) contributes more strongly to the final ranking than the dispersion term D(H). Nevertheless, the hesitant fuzzy layer remains an essential component of the framework, as it provides a formal mechanism for representing linguistic assessments and explicitly preserving uncertainty information throughout the decision-making process. Future developments could derive criterion- and expert-specific uncertainty bands directly from elicited hesitation levels, thereby enabling the hesitant component to play a more active discriminative role in the evaluation process. In addition, coupling inverse weight inference with independent external validation procedures would provide a more comprehensive assessment of the predictive and explanatory capabilities of the inferred preference structure. While the present sensitivity and Monte Carlo analyses evaluate the local robustness of rankings around the inferred weight vector (w*), future work could investigate robustness under independent datasets and alternative preference scenarios.
5.8.6. Implications for the Fez-Meknes Region
The results obtained for the Fez-Meknes case study, together with the robustness analyses presented in Table 19 and Table 20, indicate that autoclaving (A2) constitutes the most favorable healthcare waste treatment alternative under the evaluated conditions. This ranking reflects a balanced performance across the selected environmental, economic, technical, and operational criteria. Nevertheless, the successful implementation of an autoclave-based strategy requires rigorous waste segregation procedures, effective traceability mechanisms, and continuous quality control throughout the treatment process.
Outsourcing (A5) emerges as a robust complementary alternative, particularly in contexts where specialized treatment infrastructure and logistics services are readily available. The stability of these rankings across the sensitivity and Monte Carlo analyses further supports the consistency of the proposed recommendations.
Transferability to other Moroccan regions. The framework is region-agnostic: only the decision matrix, the expert panel, and (optionally) the a priori vector w0 are region-specific, while the method, software, and reporting are unchanged. Regions with infrastructure and waste profiles similar to Fez-Meknes (e.g., Rabat–Salé–Kénitra or Marrakech–Safi, which rank just above Fez-Meknes in hazardous-waste volume) would likely retain centralized autoclaving as a strong candidate, whereas regions dominated by dispersed rural facilities and long transport distances could see regional outsourcing (A5) or microwave treatment (A3) rise, because the inferred weights would shift toward logistics, capacity and flexibility. Rather than assuming transfer, the released web application lets each Regional Health Directorate re-run the pipeline with its own data and preferences; a multi-region comparative study is identified as the natural next step and is now listed among the future work directions.
From a regional decision-support perspective, these findings provide valuable evidence for evaluating healthcare waste treatment strategies in the Fez-Meknes region. While site-specific operational assessments and life-cycle considerations remain essential before large-scale implementation, the results demonstrate the practical applicability of the proposed ARAS-H-IW framework for supporting transparent, robust, and evidence-based decision-making in healthcare waste management.
6. Conclusions
This study proposes ARAS-H-IW, a novel decision support framework integrating the Additive Ratio Evaluation Method (ARAS), hesitant fuzzy evaluations, and inverse weight inference from ordinal preference information. Unlike conventional MCDM approaches that rely on externally imposed criterion weights, the proposed framework formulates weight determination as a preference-consistent inference problem, which is solved by a strictly convex optimization model that guarantees a unique, deterministic, and reproducible solution.
Results obtained from the Fez-Meknes healthcare waste management case study demonstrate that ARAS-H-IW produces consistent, interpretable, and robust rankings. Sensitivity analyses, Monte Carlo simulations of ranking acceptability, and comparisons with established MCDM methods confirmed the stability and consistency of the proposed framework in the face of uncertainty and preference perturbations. Beyond simply ranking alternatives, the methodology enhances transparency and accountability by explicitly linking criterion weightings to stakeholder preferences, while maintaining traceability throughout the decision-making process.
From a methodological perspective, ARAS-H-IW’s main contribution lies in transforming criterion weighting from a subjective exercise in parameter selection into a structured inference process. This characteristic reduces arbitrariness in decision-making and strengthens the validity of results, particularly in public sector applications where decisions must be justified, verifiable, and reproducible. Furthermore, the integration of hesitant fuzzy representations allows for the explicit consideration of expert uncertainty and hesitation, while robustness analysis provides additional confidence in the reliability of the final rankings.
Nevertheless, several limitations must be acknowledged. First, although the case study is based on realistic regional assessments and expert knowledge, the decision matrix used in this initial validation remains partially dependent on estimated techno-economic and environmental parameters. Future research should therefore incorporate measured operational data, including actual processing costs, energy consumption, emission factors, logistical performance, and life cycle assessment indicators, to strengthen empirical validity and reduce uncertainty.
Second, the performance of the hesitant fuzzy component depends on the specification of uncertainty-related parameters and aggregation strategies. While robustness analyses indicate limited sensitivity to these choices in the present study, future developments could incorporate empirically calibrated linguistic scales, mechanisms for weighting expert reliability, inconsistency diagnostics, and advanced consensus-building procedures to improve methodological rigor.
Third, the current framework infers a single, consensus-based weighting vector from the aggregated preferences of stakeholders. While this assumption is suitable for many decision-making contexts, it can mask conflicts between stakeholder groups. Future extensions could therefore explore multi-group inverse inference models capable of separately representing the perspectives of regulators, healthcare institutions, operators, and private actors. Such developments could be combined with multi-objective optimization or Pareto analyses to provide a more comprehensive representation of stakeholder trade-offs.
A further limitation is that the expert panel consists of decision-analysis researchers informed by the literature rather than field practitioners. Accordingly, the present study is intended to validate the decision-making methodology itself, which is designed to be redeployed subsequently with experts more specialized in healthcare waste treatment, without any change to the method. Finally, several promising avenues for research emerge from this work. These include: (i) the integration of large-scale regional datasets and real-time surveillance information; (ii) the extension of the framework to dynamic, multi-period decision-making environments that incorporate resilience and crisis management considerations; (iii) hierarchical and multilevel weighting inference mechanisms structured around families of criteria; and (iv) the integration of explicit regulatory and policy constraints within the optimization process. These developments would strengthen the applicability of ARAS-H-IW as a transparent, robust, and reproducible decision-support framework for addressing the complex challenges of sustainable development and public policy.
Author Contributions
Conceptualization, H.A. and M.C.A.; Methodology, H.A. and M.C.A.; Software, H.A. and M.C.A.; Validation, H.A., L.B. and M.C.A.; Formal analysis, H.A., L.B., H.E.K. and M.C.A.; Investigation, H.A. and M.C.A.; Resources, H.A. and M.C.A.; Data curation, H.A. and M.C.A.; Writing—original draft, H.A. Writing—review & editing, H.A., L.B., H.E.K. and M.C.A.; Visualization, H.A., L.B., H.E.K. and M.C.A.; Supervision, M.C.A.; Project administration, M.C.A. All authors have read and agreed to the published version of the manuscript.
Funding
This research received no external funding.
Institutional Review Board Statement
According to Moroccan Law No. 28-13 on the Protection of Persons Participating in Biomedical Research (Official Bulletin No. 6396, 17 September 2015), particularly Articles 1, 2, and 26, this study is classified as a non-interventional observational study. It did not involve patients, human-subject interventions, biological samples, or the collection of personal or identifiable data. The study relied exclusively on aggregated regional and technical data and on the professional judgments of expert researchers. Under the applicable Moroccan legal framework, prior approval by a Research Ethics Committee was therefore not required.
Informed Consent Statement
The three participating experts took part voluntarily in their professional capacity and provided informed consent for the use of their anonymized assessments in this study. Before participating, they were informed of the objectives of the research, the intended use of their anonymized assessments for scientific research and publication, the voluntary nature of their participation, the protection of their anonymity, and the absence of any foreseeable risks associated with their participation. No personal or identifiable data were collected or reported. A blank informed consent form has been provided to the Editorial Office upon request.
Data Availability Statement
The data, source code, and software developed for this study are openly available in Zenodo at ABOUNAIMA, M.C., Aberkane, H., Boubekri, L., and El Hafidi, K. ARAS-H-IW: A Reproducible Hesitant Fuzzy Multi-Criteria Decision Framework with Inverse Weight Inference for Healthcare Waste Treatment Technology Assessment. Zenodo, 2026. https://doi.org/10.5281/zenodo.20473924. The repository includes the complete ARAS-H-IW implementation, experimental datasets, and the computational workflow required to reproduce the results presented in this article.
Acknowledgments
All authors express their sincere gratitude to all members of the Laboratory of Intelligent Systems and Applications for the friendly atmosphere and their contribution to the continued growth of the laboratory.
Conflicts of Interest
The authors declare no conflicts of interest.
References
- Ghram, M.; Frikha, H.M. Assessing healthcare waste treatment technologies in Tunisia within fuzzy ARAS-H. In Proceedings of the 2020 13th International Colloquium of Logistics and Supply Chain Management (LOGISTIQUA), Fez, Morocco, 2–4 December 2020. [Google Scholar] [CrossRef] [Scilit]
- El-Salam, M.M.A. Hospital waste management in El-Beheira Governorate, Egypt. J. Environ. Manag. 2010, 91, 618–629. [Google Scholar] [CrossRef] [Scilit] [PubMed]
- Janik-Karpinska, E.; Brancaleone, M.; Vecchio, E.; Nemolato, R.; Fiorito, F. Healthcare waste—A serious problem for global health. Healthcare 2023, 11, 242. [Google Scholar] [CrossRef] [Scilit] [PubMed]
- Cirstea, I.; Radu, A.F.; Radu, A.; Tit, D.M.; Bungau, G.S. Healthcare Waste Toxicity: From Human Exposure to Toxic Mechanisms and Management Strategies. J. Xenobiot. 2025, 15, 155. [Google Scholar] [CrossRef] [Scilit] [PubMed]
- Ilyas, S.; Srivastava, R.R.; Kim, H. Disinfection technology and strategies for COVID-19 hospital and bio-medical waste management. Sci. Total Environ. 2020, 749, 141652. [Google Scholar] [CrossRef] [Scilit] [PubMed]
- Ghali, H.; Cheikh, A.B.; Bhiri, S.; Bouzgarrou, L.; Rejeb, M.B.; Gargouri, I.; Latiri, H.S. Health and Environmental Impact of Hospital Wastes: Systematic Review. Dubai Med. J. 2023, 6, 67–80. [Google Scholar] [CrossRef] [Scilit]
- Morocco: A Damning Report for Hospitals in Fez-Meknes. Yabiladi. Available online: https://www.yabiladi.com/articles/details/111938/maroc-rapport-accablant-pour-hopitaux.html (accessed on 4 February 2026).
- Soares, S.R.; Finotti, A.R.; da Silva, V.P.; Alvarenga, R.A.F. Applications of life cycle assessment and cost analysis in health care waste management. Waste Manag. 2013, 33, 175–183. [Google Scholar] [CrossRef] [Scilit] [PubMed]
- Ali, M.; Wang, W.; Chaudhry, N. Application of life cycle assessment for hospital solid waste management: A case study. J. Air Waste Manag. Assoc. 2016, 66, 1012–1018. [Google Scholar] [CrossRef] [Scilit] [PubMed]
- Das, A.K.; Islam, M.N.; Billah, M.M.; Sarker, A. COVID-19 pandemic and healthcare solid waste management strategy—A mini-review. Sci. Total Environ. 2021, 778, 146220. [Google Scholar] [CrossRef] [Scilit] [PubMed]
- Moreira, A.M.M.; Günther, W.M.R. Assessment of medical waste management at a primary health-care center in São Paulo, Brazil. Waste Manag. 2013, 33, 162–167. [Google Scholar] [CrossRef] [Scilit] [PubMed]
- Brans, J.; Vincke, P.; Mareschal, B. How to select and how to rank projects: The PROMETHEE method. Eur. J. Oper. Res. 1986, 24, 228–238. [Google Scholar] [CrossRef] [Scilit]
- Ghorabaee, M.K.; Zavadskas, E.K.; Olfat, L.; Turskis, Z. Multi-criteria inventory classification using a new method of evaluation based on distance from the average solution (EDAS). Informatica 2015, 26, 435–451. [Google Scholar] [CrossRef] [Scilit]
- Behzadian, M.; Otaghsara, S.K.; Yazdani, M.; Ignatius, J. A state-of-the-art survey of TOPSIS applications. Expert Syst. Appl. 2012, 39, 13051–13069. [Google Scholar] [CrossRef] [Scilit]
- Opricovic, S.; Tzeng, G.H. Compromise solution by MCDM methods: A comparative analysis of VIKOR and TOPSIS. Eur. J. Oper. Res. 2004, 156, 445–455. [Google Scholar] [CrossRef] [Scilit]
- Lamrini, L.; Abounaima, M.C.; Alaoui, M.T. New distributed-TOPSIS approach for multi-criteria decision-making problems in a big data context. J. Big Data 2023, 10, 97. [Google Scholar] [CrossRef] [Scilit]
- Torra, V. Hesitant fuzzy sets. Int. J. Intell. Syst. 2010, 25, 529–539. [Google Scholar] [CrossRef] [Scilit]
- Xia, M.; Xu, Z. Hesitant fuzzy information aggregation in decision making. Int. J. Approx. Reason. 2011, 52, 395–407. [Google Scholar] [CrossRef] [Scilit]
- Rezaei, J. Best–worst multi-criteria decision-making method. Omega 2015, 53, 49–57. [Google Scholar] [CrossRef] [Scilit]
- Diakoulaki, D.; Mavrotas, G.; Papayannakis, L. Determining objective weights in multiple criteria problems: The CRITIC method. Comput. Oper. Res. 1995, 22, 763–770. [Google Scholar] [CrossRef] [Scilit]
- Rezaei, J. Best–worst method for multi-criteria decision-making: Some properties and a linear model. Omega 2016, 64, 126–130. [Google Scholar] [CrossRef] [Scilit]
- Zavadskas, E.K.; Turskis, Z. A new additive ratio assessment (ARAS) method in multicriteria decision-making. Technol. Econ. Dev. Econ. 2010, 16, 159–172. [Google Scholar] [CrossRef] [Scilit]
- Wu, J.; Sun, J.; Liang, L. DEA cross-efficiency aggregation method based upon Shannon entropy. Int. J. Prod. Res. 2012, 50, 6726–6736. [Google Scholar] [CrossRef] [Scilit]
- Mishra, A.R.; Rani, P.; Saeidi, P.; Alrasheedi, A.F.; Alshamrani, A.M. Decision support framework for healthcare waste disposal techniques assessment using an integrated picture fuzzy gained and lost dominance score-based approach. Eng. Appl. Artif. Intell. 2024, 138, 109394. [Google Scholar] [CrossRef] [Scilit]
- Goldani, N.; Ishizaka, A. A hybrid fuzzy multi-criteria group decision-making method and its application to healthcare waste treatment technology selection. Ann. Oper. Res. 2025, 353, 171–196. [Google Scholar] [CrossRef] [Scilit]
- Karagiannidis, A.; Papageorgiou, A.; Perkoulidis, G.; Sanida, G.; Samaras, P. A multi-criteria assessment of scenarios on thermal processing of infectious hospital wastes: A case study for Central Macedonia. Waste Manag. 2010, 30, 251–262. [Google Scholar] [CrossRef] [Scilit] [PubMed]
- Makan, A.; Fadili, A. Sustainability assessment of healthcare waste treatment systems using surrogate weights and PROMETHEE method. Waste Manag. Res. 2021, 39, 73–82. [Google Scholar] [CrossRef] [Scilit] [PubMed]
- Saaty, T.L. A scaling method for priorities in hierarchical structures. J. Math. Psychol. 1977, 15, 234–281. [Google Scholar] [CrossRef] [Scilit]
- Jacquet-Lagrèze, E.; Siskos, J. Assessing a set of additive utility functions for multicriteria decision-making: The UTA method. Eur. J. Oper. Res. 1982, 10, 151–164. [Google Scholar] [CrossRef] [Scilit]
- Capoor, M.R.; Bhowmik, K.T. Current Perspectives on Biomedical Waste Management: Rules, Conventions and Treatment Technologies. Indian J. Med. Microbiol. 2017, 35, 157–164. [Google Scholar] [CrossRef] [Scilit] [PubMed]
- Abounaima, M.C.; El Mazouri, F.Z.; Lamrini, L.; Ouzarf, M.; Alaoui, M.T. Extension of the ELECTRE III method to the case of uncertain preferences: Application to an example of the environmental management problem. Stat. Optim. Inf. Comput. 2022, 10, 171–191. [Google Scholar] [CrossRef] [Scilit]
- Khumpang, P.; Arunyanart, S. Supplier selection for hospital medical equipment using fuzzy multicriteria decision-making approach. IOP Conf. Ser. Mater. Sci. Eng. 2019, 639, 012001. [Google Scholar] [CrossRef] [Scilit]
- Xia, M.; Xu, Z.; Chen, N. Some hesitant fuzzy aggregation operators with their application in group decision making. Group Decis. Negot. 2013, 22, 259–279. [Google Scholar] [CrossRef] [Scilit]
- El Mazouri, F.Z.; Abounaima, M.C.; Zenkouar, K.; El Hilali Alaoui, A. Application of the ELECTRE III method at the Moroccan rural electrification program. Int. J. Electr. Comput. Eng. 2018, 8, 3285–3295. [Google Scholar] [CrossRef] [Scilit]
- Xu, Z.; Xia, M. Hesitant fuzzy entropy and cross-entropy and their use in multiattribute decision making. Int. J. Intell. Syst. 2012, 27, 799–822. [Google Scholar] [CrossRef] [Scilit]
- Diaconis, P.; Graham, R.L. Spearman’s footrule as a measure of disarray. J. R. Stat. Soc. Ser. B 1977, 39, 262–268. [Google Scholar] [CrossRef] [Scilit]
- Abounaima, M.C.; Aberkane, H.; Boubkri, L.; El Hafidi, K. ARAS-H-IW: A reproducible hesitant fuzzy multi-criteria decision framework with inverse weight inference for healthcare waste treatment technology assessment. Zenodo 2026. [Google Scholar] [CrossRef]
- Fez–Boulemane Ministry of Health and Social Protection. Available online: https://www.sante.gov.ma/Regions/Pages/FesBoulemane.aspx (accessed on 4 February 2026).
- Institutional Website of the High Commission for Planning of the Kingdom of Morocco. HCP. Available online: https://www.hcp.ma/ (accessed on 4 February 2026).
- Morocco Produces 7647 Tonnes of Hazardous Medical Waste per Year. Aujourd’hui le Maroc. Available online: https://aujourdhui.ma/societe/le-maroc-produit-7-647-tonnes-de-dechets-medicaux-dangereux-par-an (accessed on 4 February 2026).
- Ech-Chayeb, K.; Auajjar, N.; Hamama, S.; Elmniai, A.; Hicham, E.; Attarassi, B. Sustainable Management and Environment of the Hospital Wastes: A Comparative Study of Two Public Hospitals in Morocco. J. Solid Waste Technol. Manag. 2022, 48, 465–473. [Google Scholar] [CrossRef] [Scilit]
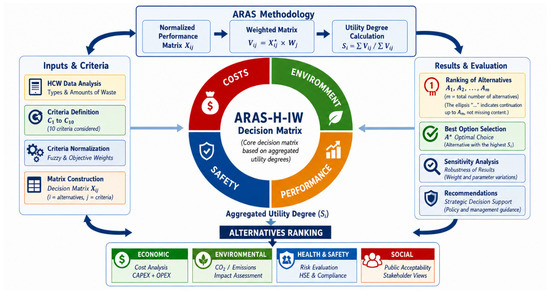
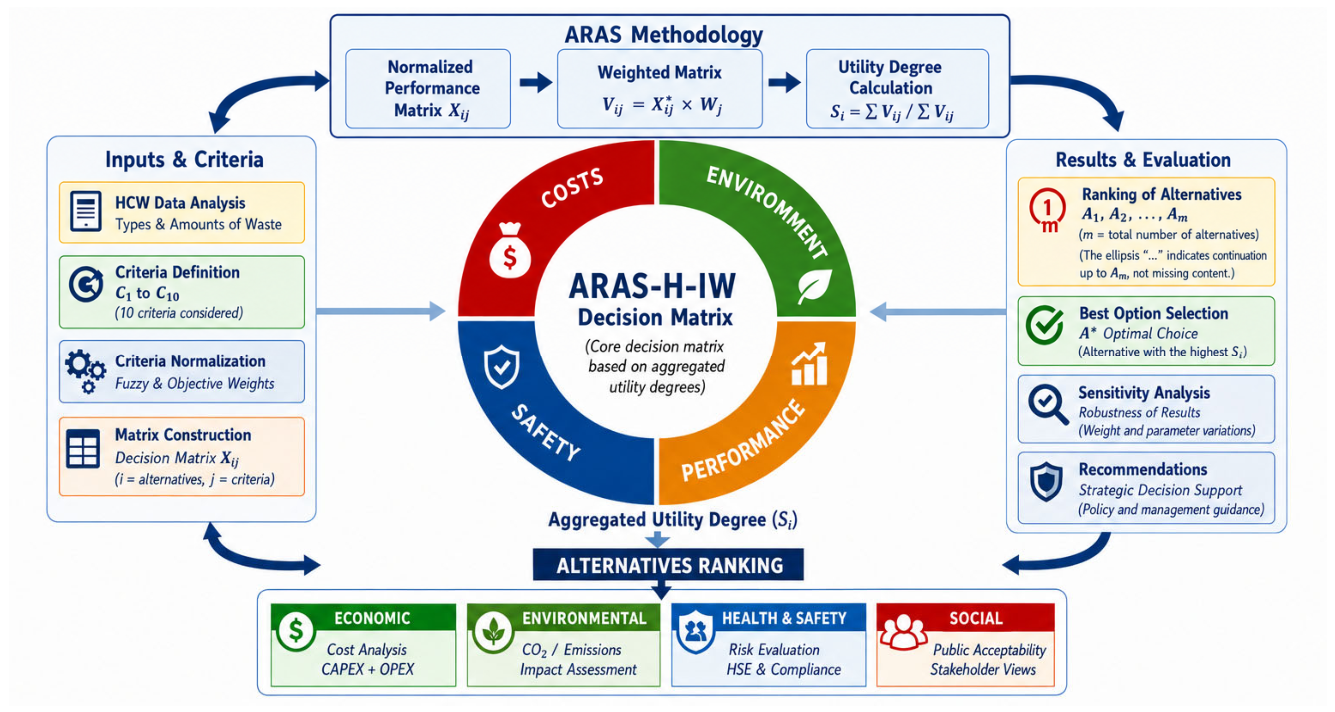
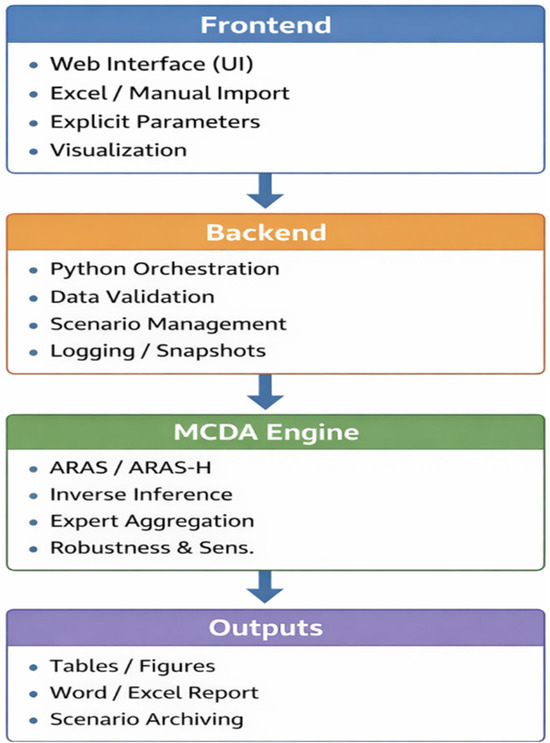
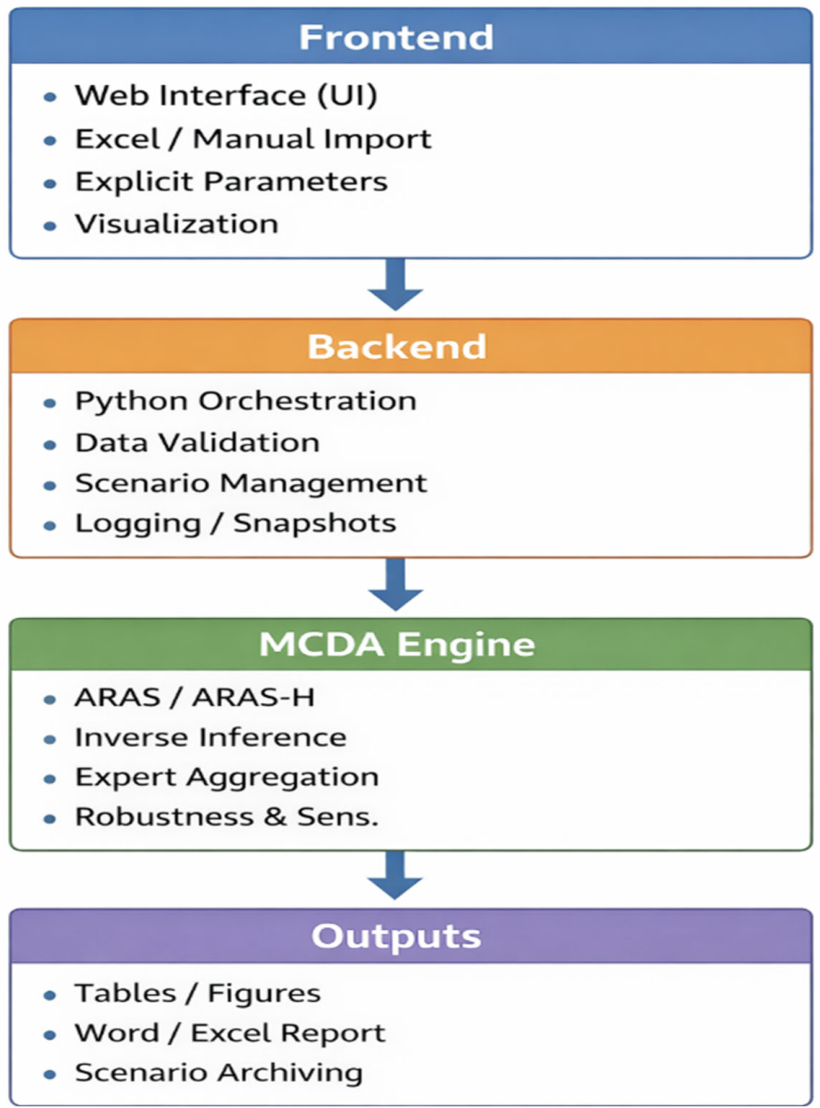
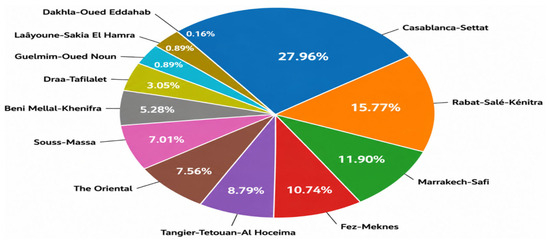
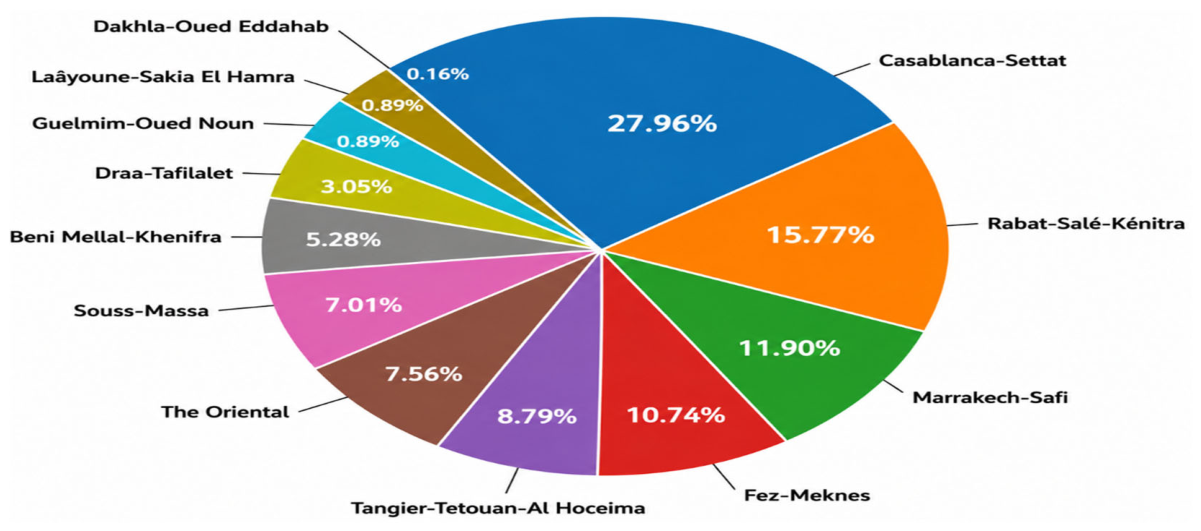
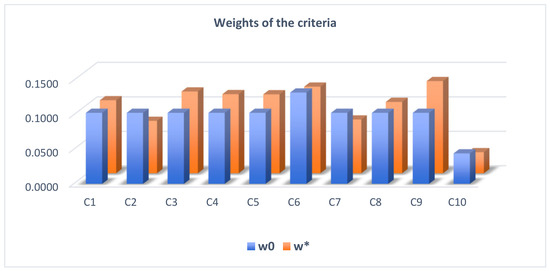
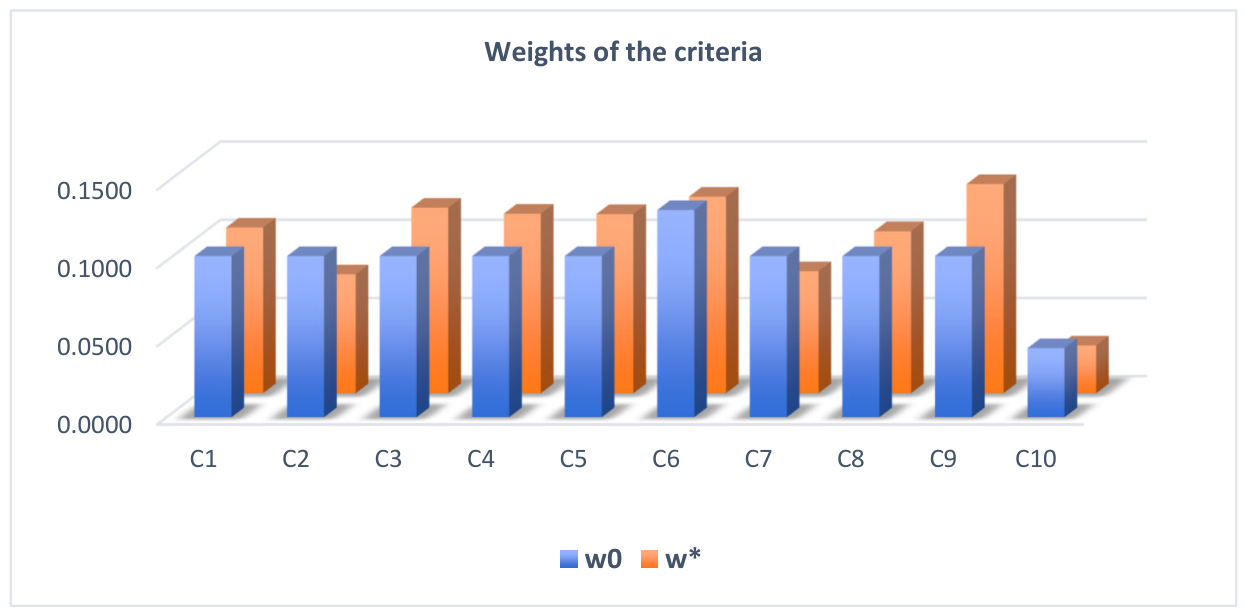
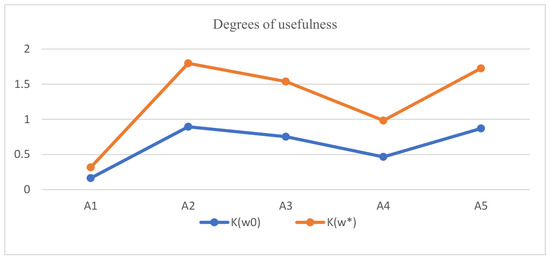
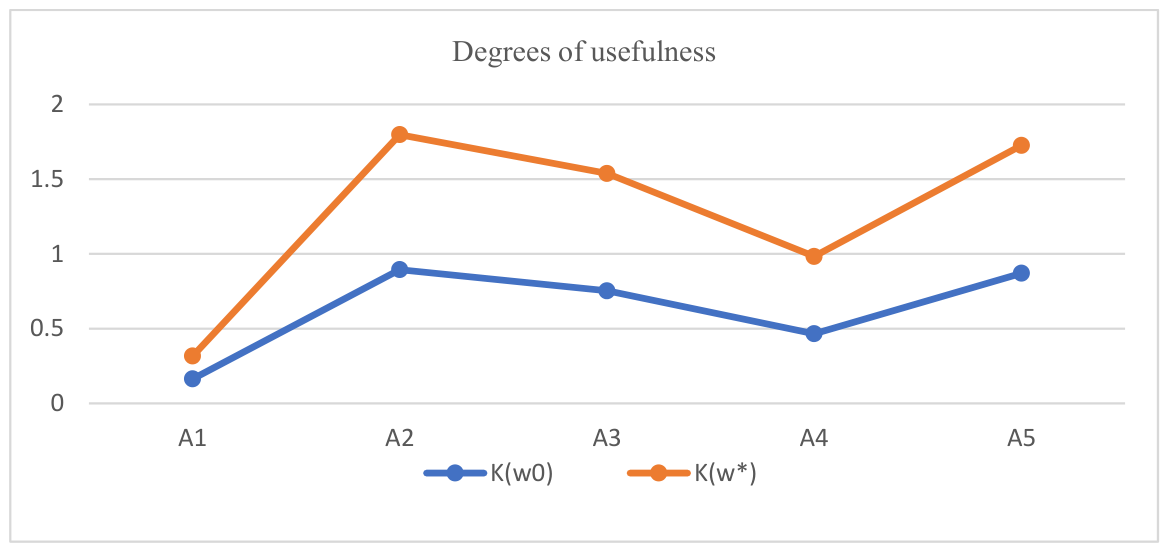
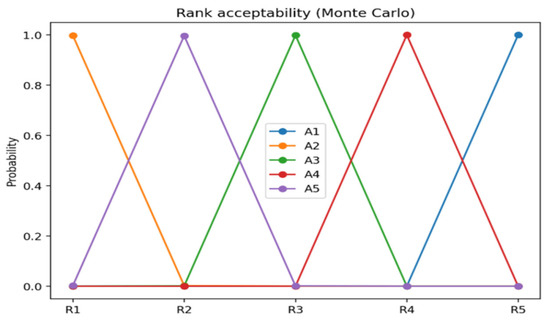
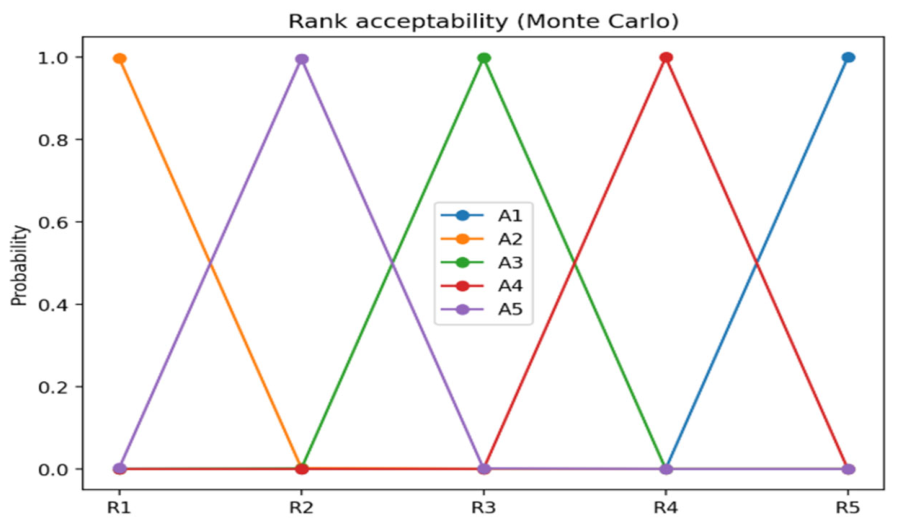

Disclaimer/Publisher’s Note: The statements, opinions and data contained in all publications are solely those of the individual author(s) and contributor(s) and not of MDPI and/or the editor(s). MDPI and/or the editor(s) disclaim responsibility for any injury to people or property resulting from any ideas, methods, instructions or products referred to in the content. |
© 2026 by the authors. Licensee MDPI, Basel, Switzerland. This article is an open access article distributed under the terms and conditions of the Creative Commons Attribution (CC BY) license.