


Abstract
Neonatal hypoxic–ischemic encephalopathy (HIE) remains a critical neurological emergency resulting from perinatal asphyxia, often leading to lifelong neurodevelopmental disabilities or mortality. The accurate and timely grading of HIE severity is paramount for initiating therapeutic interventions such as therapeutic hypothermia. This work proposes a diagnostic framework that uses long-duration electroencephalogram (EEG) recordings through a hierarchical classification strategy and advanced sequence modeling. A Hybrid Mamba-inspired architecture was developed to effectively capture long-range temporal dependencies in multi-channel neonatal EEG while maintaining computational efficiency. In order to enhance clinical consistency and initialize the models appropriately, a Self-Supervised Learning step based on Masked Signal Modeling is implemented with a mask ratio of 30%. The model structure takes into consideration clinically verified biomarkers, including the suppression ratio, Delta–Alpha Ratio, Spectral Edge Frequency, and Rhythmicity Index, extracted from signals at a microvolt level prior to normalization for physiological interpretability purposes. These features are combined with waveforms using feature gating. In an experiment conducted on a dataset of 169 records using 5-fold subject-wise cross-validation, the designed Hybrid Mamba-based model achieves significant stability and generalizability, achieving an accuracy score of 90%, with an average accuracy of 88.45% ± 6.8% per hierarchical level.
1. Introduction
Neonatal hypoxic–ischemic encephalopathy (HIE) is a serious condition among newborns that results due to the poor oxygenation of tissues along with impaired blood flow to the brain. Though advances have been made in treating babies at intensive care units, HIE is still one of the causes of mortality and disability among infants. It results in conditions such as cerebral palsy and epilepsy, apart from mental retardation. While the treatment of HIE includes the application of hypothermia to protect the neurons, this process should be administered within six hours after occurrence to reduce brain damage. Hence, the accurate assessment of the degree of encephalopathy is crucial.
However, clinical care often depends on neuroimaging modalities like Magnetic Resonance Imaging (MRI); nonetheless, MRI can only offer an image of structural damage in a static manner after several days from the insult, thus potentially missing out on an ideal window of neuroprotection. On the other hand, an electroencephalogram (EEG) offers continuous functional imaging of the electrical state of the brain. In NICUs, EEG monitoring becomes essential for the evaluation of brain state changes, background suppression, burst suppression phenomena, and sub-clinical seizures. However, EEG interpretation is complicated and subjective and can vary between individuals, especially when subspecialists are not available for a continuous 24 h.
The automated grading of hour-long neonatal EEG recordings is a viable solution but remains computationally and methodologically challenging due to:
- Complex Temporal Dynamics: Long-duration temporal sequences spanning several hours contain evolving background patterns that are difficult to model with standard fixed-window approaches.
- Signal Volatility: Nonstationary signal characteristics and a high susceptibility to physiological (e.g., movement, respiration) and environmental artifacts.
- Data Scarcity and Imbalance: Significant class imbalance, particularly in terminal/inactive cases (Grade 4), which often leads to model bias toward healthy patterns.
- Physiological Preservation: The need for mathematical consistency in automated biomarker extraction, ensuring that amplitude-based clinical rules are not lost during signal processing.
- Transparency Requirements: The inherent black-box nature of deep sequence models, which limits clinical trust and interpretability in critical care environments.
The central hypothesis of this work is that a hybrid sequence modeling approach—combining data-driven deep learning with absolute clinical biomarkers—can overcome the limitations of short-window analysis to provide stable, clinically aligned HIE grading. To address these challenges, we propose a hierarchical diagnostic framework driven by a Hybrid Mamba-inspired architecture. The specific contributions of this paper are:
- The introduction of a dual-path system that captures long-range temporal dependencies in multi-channel EEG while maintaining computational efficiency through selective state space modeling.
- A Self-Supervised Learning (SSL) phase using Masked Signal Modeling (MSM) to learn latent electrophysiological representations from 169 long-duration recordings, mitigating the scarcity of labeled data in rare HIE grades.
- A feature gating mechanism that preserves physiological consistency by extracting clinical biomarkers—such as the suppression ratio (SR), DAR, and DTR—from microvolt-scale signals prior to channel-wise normalization.
- A multi-level explainable AI (XAI) strategy to validate the faithfulness of automated decisions against clinical neonatal protocols, evaluated using a rigorous subject-wise 5-fold cross-validation protocol to ensure generalizability.
2. Literature Survey
Numerous studies have been conducted on HIE in newborns with the objective of improving lesion localization, grading, and prognosis using neuroimaging and electrophysiological methods. Despite the outstanding effectiveness of deep learning techniques, especially CNNs, in the automation of medical image processing in different clinical fields [1], their usage in the field of long-term neonatal electrophysiology still constitutes a relatively new field of study.
The predominant focus of these early studies was the use of prognostic biomarkers extracted from Magnetic Resonance Imaging (MRI). The possibility of using structured imaging features for stratification was highlighted by Weiss et al. [2] through the application of machine learning algorithms to MRI data from multiple sites to predict neurodevelopmental outcomes. Similarly, Zheng et al. [3] demonstrated the ability of using cerebral perfusion derived using PASL imaging for prediction purposes. While such studies confirmed the critical role played by MRI in assessing brain injuries, they relied heavily on feature engineering.
In comparison to the abundant literature on neuroimaging studies, studies on automated HIE grade determination through continuous EEG recordings are limited due to the nonstationarity of EEG readings and computationally intensive process involved. In regard to the automated four-class HIE classification problem, Raurale et al. [4] employed a CNN classifier based on quadratic time–frequency distributions, which demonstrated superior performance compared to traditional feature classifiers. However, the black-box structure of CNN classifiers hindered understanding.
Recent advancements in the field of HIE studies utilizing standard repositories such as the BONBID-HIE dataset [5] mostly advanced studies on MRI analysis, resulting in models like ParadiseNet [6] for the segmentation of lesion regions. Even though the MRI analysis models obtained promising accuracy rates, they had problems with class imbalances and segmenting the borders of regional lesions.
The study of complementary physiological signals has seen recent advancements. For instance, in their study, Ashoori et al. [7] proved the efficacy of combining data from multiple modalities through feature extraction using the XGBoost algorithm for predicting brain oxygenation levels. In the field of automatic EEG classification, previous work combined multi-class support vector machine models with short (8 s) and long (64 s) features, reaching an accuracy of 79.5% [8]. Later on, end-to-end one-dimensional convolutional neural network models trained on raw multi-channel signal slices achieved an accuracy of 81.5% with a two-step voting process [9]. However, despite such progress, these models still work within the framework of 5 min segments and cannot capture the long-range temporal dynamics of hour-long signals.
Current research efforts concentrate on improving the quality of EEG recordings through the application of CNNs and ROCKET for identifying artifacts [10]. Although significant advances have been made in removing artifacts from EEG recordings, several grading systems still rely on majority voting using a sliding window approach, limiting their applicability in real-time NICU monitoring. Furthermore, conventional deep learning methods such as BiLSTM and Multihead Transformers face significant computational constraints when dealing with lengthy sequences of EEG signals.
Despite all of these developments, there is still a significant drawback: the majority of models based on EEG data employ RNNs to capture temporal information or CNNs to extract local spatial information. CNNs are limited by the wide time range of the NICU dataset, despite their ease of extracting local morphological information. RNNs and Transformers, on the other hand, are constrained by their quadratic computational complexity. State space models (SSL) like Mamba, which allow for linear-time sequence modeling, are one potential remedy for this issue, although their use in newborn EEG models has not yet been investigated. The lack of SSL techniques like Masked Signal Modeling, which results in inadequate model initialization for HIE grades, is another significant obstacle.
3. Methodology
3.1. Dataset Description
The functional assessment was conducted using the neonatal EEG dataset from the INFANT Research Centre, University College Cork (UCC), Ireland. The recordings were obtained at the Cork University Maternity Hospital under a protocol approved by the Cork Research Ethics Committee, with written informed consent obtained from the parents or guardians of all participants.
3.1.1. Dataset Characteristics
- Total EEG recordings: 169.
- Subjects: 53 full-term neonates (≥37 weeks gestation) diagnosed with hypoxic–ischemic encephalopathy (HIE).
- Recording duration: 1 h per recording.
- Multi-channel EEG: Acquired using a neonatal 10–20 montage (including electrodes F3, F4, C3, C4, T3, T4, O1, O2).
- Severity grading: 4-class background abnormality scale based on independent expert consensus.
Each recording was originally captured at a sampling frequency of 256 Hz and subsequently downsampled to 64 Hz for computational modeling. On average, the dataset contains 3 recordings per subject. Ground-truth labels were assigned by two independent expert neonatal electroencephalographers. In cases of disagreement, a joint review was conducted to reach a consensus grade. The grading system evaluates specific neurophysiological attributes, such as amplitude and frequency distribution, background continuity, sleep–wake cycling, symmetry, and synchrony. Each recording is classified on the basis of neonatal background EEG characteristics as:
- Grade 1—Normal or mildly abnormal HIE case.
- Grade 2—Moderately abnormal HIE case.
- Grade 3—Severely abnormal HIE case (e.g., burst suppression).
- Grade 4—Inactive EEG (near-isoelectric).
3.1.2. Class Distribution
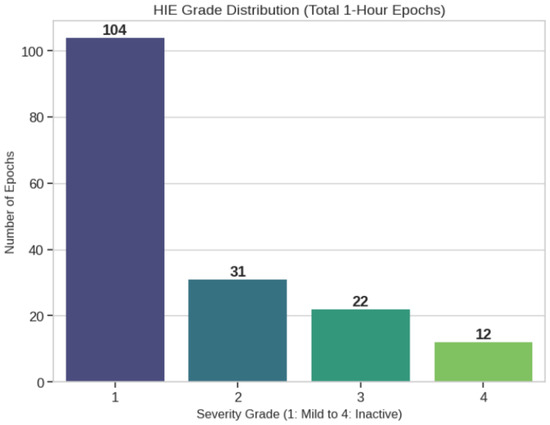
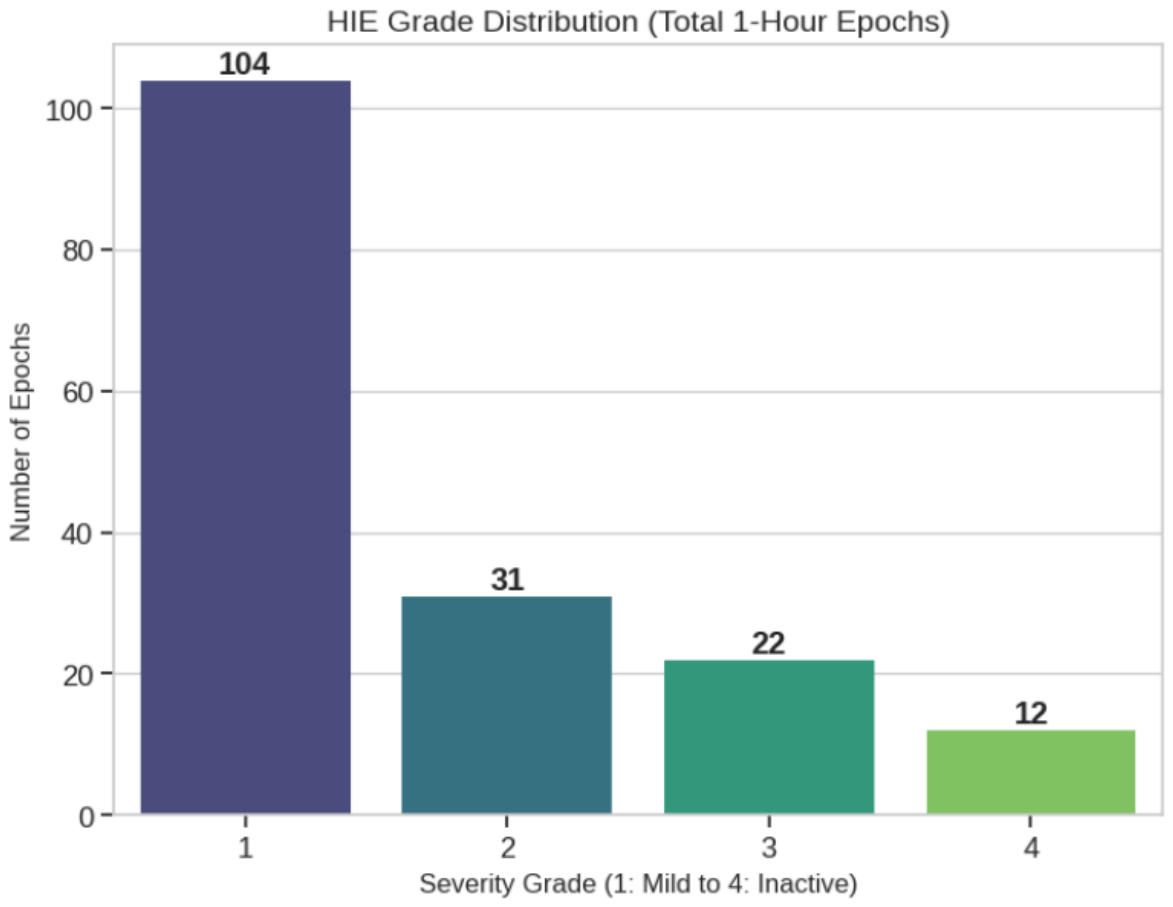
The class-wise distribution of the dataset is given in Figure 1.
Figure 1.
The distribution of EEG severity grades in the UCC dataset.
The dataset exhibits a class imbalance, with Grade 4 being underrepresented (12 recordings) and Grade 1 being dominant. To reduce bias, weighted loss functions, hierarchical modeling, and a weighted random sampler are needed during training. To prevent data leakage between training and validation sets and ensure clinical generalizability, subject-wise 5-fold cross-validation was chosen, ensuring that all recordings from a single patient remain within the same fold to avoid subject-specific memorization.
3.2. Preprocessing Pipeline
Neonatal EEG signals recorded over an extended period of time exhibit nonstationarity, low amplitude, and sensitivity to environmental and physiological disturbance. Neonates’ brain activity differs from adults’ in terms of discontinuity, burst suppression waves, and variations in frequency spectra with time. A number of preprocessing techniques were used to enhance the input signal’s quality and make it suitable for deep model training.
Preprocessing techniques like bandpass filtering, resampling, artifact removal, standardization, and temporal window segmentation are included in this workflow.
3.2.1. Bandpass Filtering
For each of the EEG channels, a digital bandpass filter from 0.5 to 30 Hz was utilized to reduce noise without losing physiological neonatal activity. The 30 Hz cutoff frequency removes the electromyography artifacts, high-frequency noise, and harmonic frequencies produced by the power line. The 0.5 Hz cutoff frequency reduces the baseline drift, motion artifacts, and low-frequency noise that could be a source of a systematic error in amplitude measurements. This particular frequency range maintains the clinically important frequency bands of the neonatal EEG, namely, theta (4–8 Hz), which shows transitional maturation; alpha (8–13 Hz), which is often decreased due to hypoxic injury; beta (13–30 Hz) with faster background activity; and delta (0.5–4 Hz), which shows prominent background activity and a strong correlation with the severity of encephalopathy.
3.2.2. Resampling
Depending on the acquisition parameters, the sample frequencies of the original EEG recordings may vary. All signals were resampled to 64 Hz in order to ensure consistent model input dimensions and save computational cost. The sampling rate of 64 Hz was selected to strike a balance between computational efficiency and the preservation of clinically relevant high-frequency beta activity (up to 30 Hz). This rate comfortably satisfies the Nyquist–Shannon sampling theorem for the filtered range while reducing the memory footprint for long-duration sequence modeling by 75% compared to the original 256 Hz acquisition.
At 64 Hz, each 10 s window contains the following:
3.2.3. Artifact Suppression
EEG recordings from neonates are usually affected by abnormalities such as flat-line segments due to weak electrode contact, high-amplitude fluctuations due to electrode displacement, and movement-related interruptions. This was addressed by using amplitude-based thresholding to find windows that exceeded physiological amplitude limitations and by detecting continuous near-zero voltage segments to detect flat-line abnormalities. To reduce noise-induced bias and preserve data volume, only the affected windows were attenuated or masked during training, rather than deleting complete recordings. Since features like the suppression ratio are extremely amplitude-sensitive, and deep learning models would otherwise acquire artifact patterns as deceptive discriminative features, artifact suppression is crucial.
3.2.4. Normalization
For each EEG signal, channel-wise Z-score normalization was performed to minimize inter-subject amplitude deviation. Crucially, to preserve the clinical validity of amplitude-dependent features, all handcrafted biomarkers (Path B) were extracted from the microvolt-scale signal prior to this normalization step. Normalization was applied only to the raw waveform data (Path A) to facilitate stable deep learning convergence.
where x is the raw EEG sample, is the mean amplitude of the channel and is the standard deviation of the channel.
3.2.5. Window Segmentation
Each 1 h EEG recording was divided into non-overlapping 10 s windows. A window length of 10 s was chosen as it represents a “quasistationary” interval for neonatal EEG. This duration is long enough to capture discrete bursts and rhythmic discharges characteristic of HIE background patterns yet short enough to allow the model to identify rapid transitions in state, such as those seen in intermittent suppression.
Each window has the following dimensions:
The segmentation technique has several advantages: it allows for the extraction of local features at physiologically significant intervals, uses less memory than processing full-hour recordings directly, and maintains the temporal structure for long-range modeling. The proposed structure preserves the sequential ordering of all 360 windows, in comparison to other methods that handle short 8–64 s windows separately. This enables the Hybrid Mamba model to capture changing background patterns and long-term burst suppression changes across the whole recording.
3.3. Hybrid Dual-Path Representation
Neonatal neurophysiology significantly relies on observed quantitative indicators like spectral ratios and suppression ratios, even though deep learning algorithms may automatically identify distinct temporal patterns from raw waveforms. A Hybrid Dual-Path Representation was created to bridge the gap between clinically grounded reasoning and data-driven learning. This framework executes the following processes concurrently:
- Path A: Raw multi-channel EEG waveforms (data-driven representation).
- Path B: Handcrafted clinical EEG markers (domain-informed representation).
3.3.1. Path A: Raw EEG Modeling
Every 10 s EEG frame in Path A preserves its whole multi-channel waveform structure:
where C is the number of EEG channels, and L is the number of samples per window (640 at 64 Hz).
By modeling raw EEG data, the network can learn non-linear inter-channel interactions, recognize small variations in waveform shape, identify rhythmic continuity from discontinuity, and record burst suppression transitions. Raw signals, in contrast to handcrafted features, maintain complete temporal resolution, allowing the model to identify hidden patterns that might not be clearly represented by predefined descriptors.
3.3.2. Path B: Handcrafted Clinical Markers
EEG indicators that have been clinically verified were calculated for every 10 s window. These indicators are directly related to newborn HIE grading standards and serve as domain-informed inputs to the hybrid architecture.
- Suppression Ratio (SR)
The suppression ratio measures the percentage of a window’s duration during which the EEG amplitude remains below a designated low-voltage threshold.
Mathematically,
where
- represents the discrete EEG signal amplitude at time index t.
- L is the total number of samples per window ( at 64 Hz).
- is the clinical low-voltage threshold, set to 10 μV. Crucially, this threshold was applied to the raw microvolt-scale signal before Z-score normalization to ensure physiological consistency.
- is an indicator function that returns 1 if the condition is met and 0 otherwise.
- is the constant window duration of 10 s.
Clinical Significance: The SR is a robust indicator of encephalopathy severity and reflects background continuity. A low SR indicates continuous background activity (Mild HIE); intermittent suppression characterizes Moderate HIE; high SR is consistent with a burst suppression pattern (severe HIE); and SR values approaching 1.0 indicate near-isoelectric or inactive states (Grade 4).
- 2.
- Delta–Alpha Ratio (DAR)
The Delta–Alpha Ratio measures the relative dominance of slow-wave activity compared to faster oscillations.
where
- is the Power Spectral Density estimated via Welch’s method.
- is the integrated power in the delta band (0.5–4 Hz).
- is the integrated power in the alpha band (8–13 Hz).
Clinical Interpretation: While healthy newborns exhibit a balanced spectral distribution, HIE is characterized by spectral slowing. A higher DAR is associated with worse neurological outcomes as delta activity increases in dominance with injury severity.
- 3.
- Spectral Edge Frequency (SEF95)
The Spectral Edge Frequency at 95% (SEF95) is the frequency below which 95% of the total spectral power is contained.
Formally,
where is the Nyquist frequency (32 Hz), and is the power spectrum of the 10 s window.
Clinical Significance: SEF95 provides a global overview of the spectral distribution. Higher values indicate preserved high-frequency activity, whereas lower values indicate the spectral shift toward lower frequencies typically observed in severe HIE background depression.
- 4.
- Rhythmicity Index (R)
The Rhythmicity Index measures the regularity and periodic consistency of EEG waves within a window using the normalized autocorrelation function.
where
- is the discrete signal at time index t.
- is a time-lag corresponding to the dominant rhythmic components, typically identified in the 0.5–4 Hz range.
- L is the window length of 640 samples.
Clinical Interpretation: Mild cases exhibit ordered, rhythmic background activity, whereas severe or inactive cases lack distinct rhythmic structure or show highly fractured patterns.
- 5.
- Delta–Theta Ratio (DTR)
The Delta-Theta Ratio measures the relative distribution of power between the two most dominant frequency bands in neonatal EEG. It is a critical marker for identifying background slowing and encephalopathy severity.
where:=
- is the integrated power in the delta band (0.5–4 Hz).
- is the integrated power in the theta band (4–8 Hz).
- is the Power Spectral Density of the 10 s window.
Clinical Interpretation: Theta waves in mature infants represent transitional development and normal background rhythms; on the other hand, a rise in the DTR denotes the development of a pathological process towards delta waves. An elevated DTR is usually seen in moderately or severely affected patients of HIE, which means that faster background rhythms have been lost due to hypoxic damage.
- 6.
- Root Mean Square (RMS) Amplitude
RMS amplitude measures the effective power and overall voltage intensity of the EEG signal within a temporal window.
where
- represents the microvolt-scale signal amplitude at time index t.
- L is the window length of 640 samples.
Clinical Interpretation: RMS amplitude is directly proportional to the level of background voltage. The electroencephalograms of healthy newborn babies show strong high amplitude. With an increasing severity of HIE, there is a marked suppression of cerebral background activity. A markedly depressed RMS value is an indicator of the low-voltage or inactive type of EEG (Grade 4), implying a severe reduction in the electrical activity of the brain due to widespread damage to the cortex.
- 7.
- Total Delta Power ()
Total Delta Power represents the absolute magnitude of the signal’s energy within the 0.5–4 Hz frequency range.
where is the Power Spectral Density of the 10 s window.
Clinical Interpretation: The delta wave is the most prominent rhythm in a newborn’s brain. However, when there is a high amount of absolute delta wave activity or presence of monomorphic delta waves, this condition is regarded as a sign of encephalopathy. When a child suffers from hypoxic–ischemic encephalopathy (HIE), the high level of delta activity denotes the slowing of background activity, which implies that the brain experiences difficulty generating faster rhythms. This feature helps to differentiate normal patterns from those with slow waves during Stage 1 triage.
3.4. Overall System Architecture
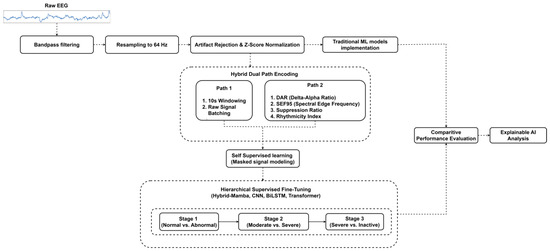
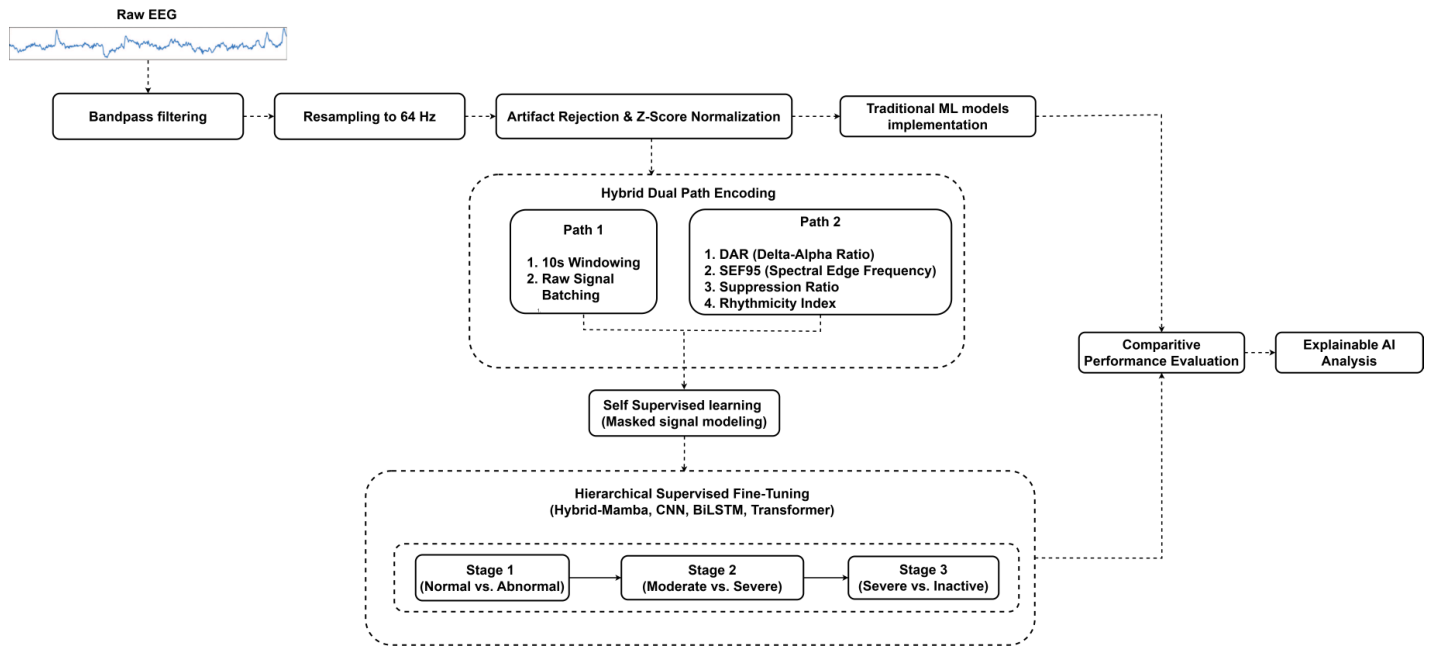
Figure 2 illustrates the complete EEG-based HIE grading framework.
Figure 2.
The overall EEG processing and modeling framework, highlighting the six-stage pipeline: (1) preprocessing, (2) dual-path encoding, (3) feature-gated fusion, (4) sequence modeling, (5) hierarchical classification, and (6) explainable AI analysis.
The system design consists of a modular six-layer pipeline architecture. First, raw hourly EEG signals are preprocessed using bandpass filter, resampling, artifact removal, normalization, and window segmentation operations. Second, two parallel paths known as Path A (deep waveform representation) and Path B (extraction of clinical biomarkers) operate on each window for encoding. In the third stage, feature integration is performed by a projection operation, which allows clinical characteristics to control the learned deep representation vectors. In the fourth stage, 360 window representations of each signal are modeled sequentially using long-range neural networks. The fifth stage involves a hierarchical classification step (mild vs. abnormal; moderate vs. severe/inactive; severe vs. inactive) that enables clinically sound categorization. Finally, explainable AI methods provide global and temporal explanations.
3.5. Model Architectures
Both conventional machine learning (ML) and deep learning (DL) models were evaluated. While DL architectures handle sequential window-level data to capture temporal continuity, ML models utilize aggregated feature vectors as statistical baselines.
3.5.1. Machine Learning Models
Traditional classification algorithms were employed by averaging handcrafted features over all possible windows per subject. The implemented algorithms include Random Forest, XGBoost, support vector machine with a radial basis function (RBF) kernel, Logistic Regression, and K-Nearest Neighbor. These models assume that each recorded instance is represented by a static vector and act as baseline models demonstrating the importance of sequence modeling.
3.5.2. Deep Learning Architectures
Unlike ML methods, DL approaches work directly on windowed embeddings and capture time-dependent information. Baseline models were trained from scratch using the UCC corpus to facilitate a fair comparison. To make sure that the evaluation is done in a fair way, the hyperparameters for each baseline method (CNN, BiLSTM, and Transformer) were exhaustively tuned using the grid search technique with respect to learning rates ( to ), dropout rates (0.1 to 0.5), and hidden layer dimensions. This guarantees that the superior performance of the Hybrid Mamba model is achieved due to its architecture and not because of the inferior tuning of other models.
CNN Baseline
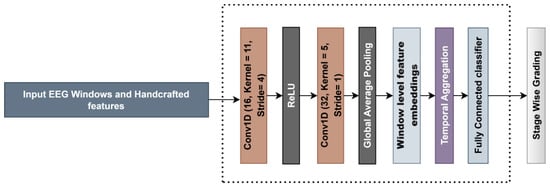
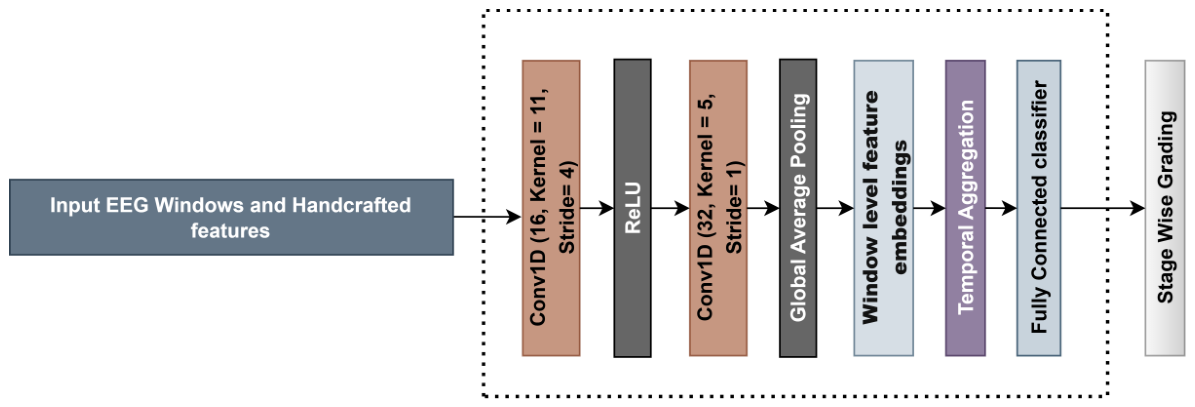
The CNN baseline consists of stacked 1D convolutional layers applied along the temporal axis of each EEG window as shown in Figure 3. It utilizes ReLU activation and Global Average Pooling to condense window-level features into a compact embedding [11].
Figure 3.
CNN architecture for EEG modeling.
Bidirectional LSTM (BiLSTM)
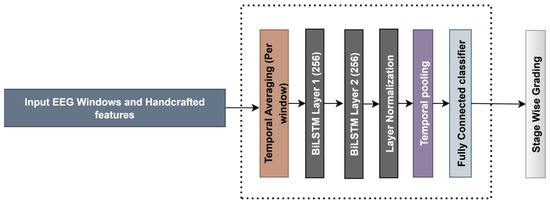
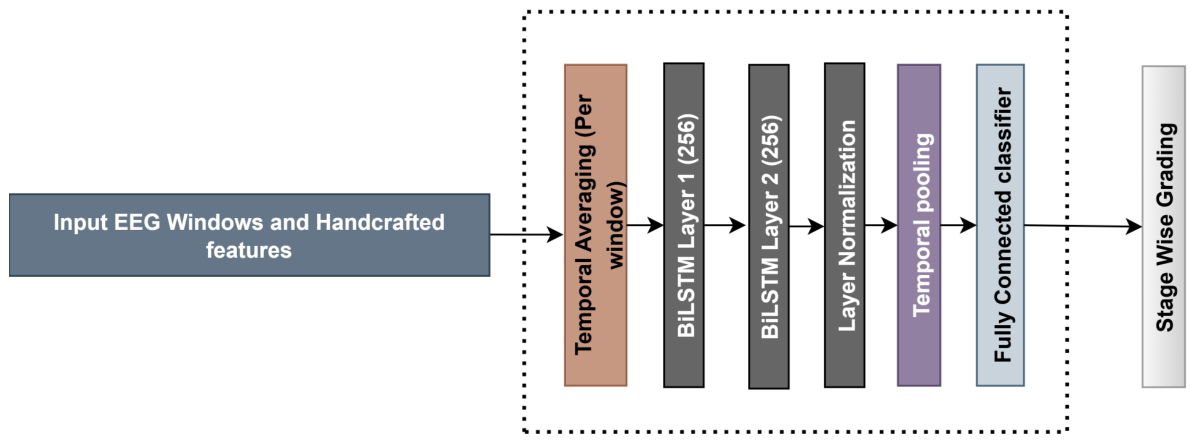
The BiLSTM processes window embeddings sequentially in both the forward and backward directions [12]. The architecture diagram is shown in Figure 4:
The gated operations within the cell are defined as follows:
where W and U are learnable weight matrices, b represents bias vectors, and is the sigmoid activation function.
Figure 4.
Bidirectional LSTM architecture.
Multihead Transformer
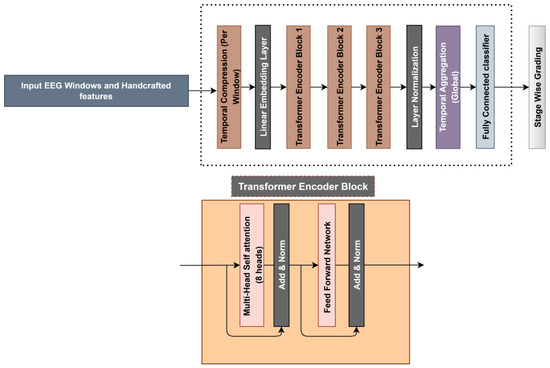
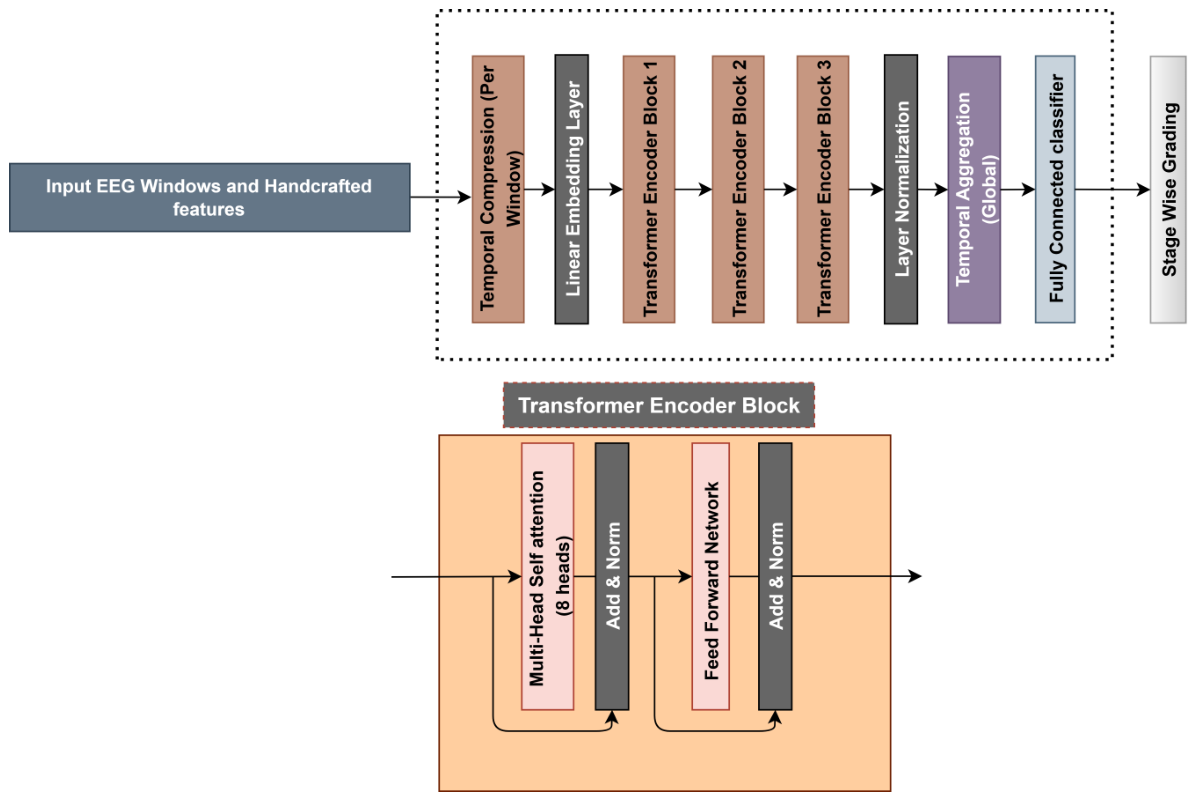
The Transformer baseline [13] utilizes self-attention to process the sequence and the architecture is shown in Figure 5. Scaled dot-product attention is computed as follows:
where are Query, Key, and Value matrices projected from the input embeddings, and is the scaling dimension.
Figure 5.
Multihead Transformer architecture.
Proposed Hybrid Mamba-Inspired Model
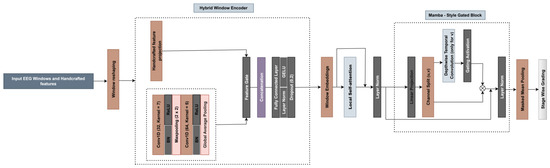
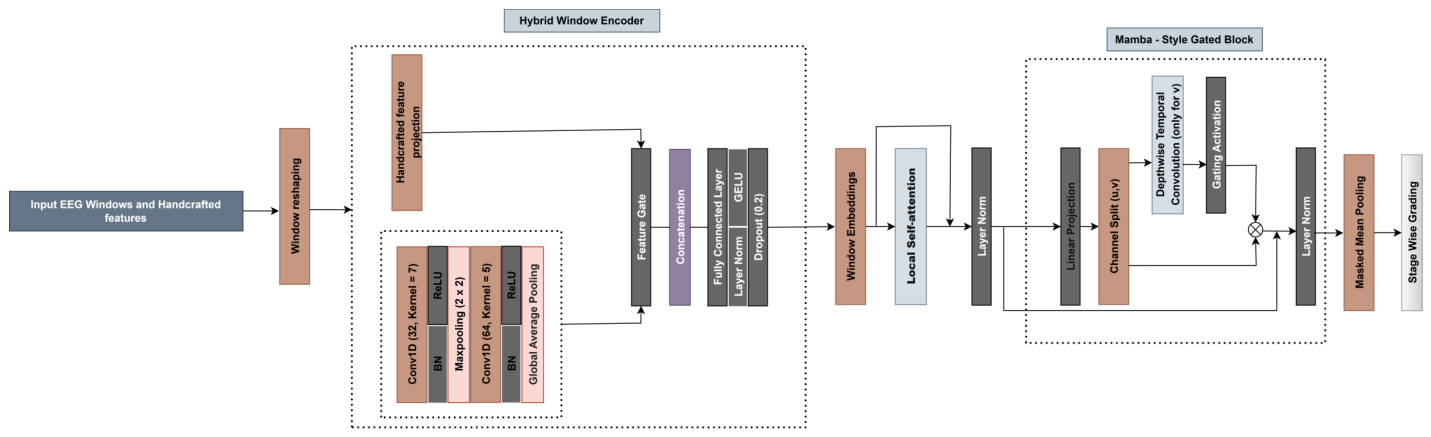
The Hybrid Mamba-inspired model incorporates the selective state space (S6) foundation of the Mamba architecture but introduces custom modifications for neonatal EEG. The detailed architecture is shown in Figure 6.
Figure 6.
Hybrid Mamba-inspired architecture.
Within the hybrid window encoder, raw windows are processed via a custom 1D-CNN. Simultaneously, handcrafted features are projected and fused using a custom feature gating mechanism:
where is the waveform embedding, is a learnable weight matrix, and ⊙ denotes element-wise multiplication. This allows clinical biomarkers to modulate the data-driven representations.
The fused embeddings are processed by a Mamba-style gated block. After linear projection and channel splitting, gating is applied as follows:
where u and v are split projections, and is the depthwise convolution output. Finally, window embeddings are aggregated via **masked mean pooling**:
where is a binary mask used during the SSL phase.
3.5.3. Self-Supervised Learning (SSL) Using Masked Signal Modeling
The Hybrid Mamba model underwent a Self-Supervised Learning (SSL) phase to improve feature robustness and address the scarcity of labeled Grade 4 data. Thirty percent of the 10 s EEG frames in a series were randomly masked in accordance with the principles of Masked Signal Modeling (MSM). The latent representation of these masked segments had to be reconstructed by the model. Before starting the supervised hierarchical grading task, the encoder was able to learn consistent electrophysiological characteristics throughout the 53-subject dataset thanks to this pre-training.
3.6. Hierarchical Grading Framework
To improve reliability, a three-stage hierarchical approach was employed. Normal and abnormal records are separated in Stage 1. Abnormal cases are separated into moderate and severe/inactive categories in Stage 2. Severe (Grade 3) and inactive (Grade 4) are distinguished in Stage 3. This structure is in line with the step-by-step clinical diagnosis process and lessens adjacent-grade confusion.
3.7. Hyperparameter Configuration
Model selection was carried out utilizing an inner validation loop within each fold to guarantee reproducible results. If validation loss did not improve for 20 consecutive epochs, early stopping was initiated. The hyperparameters are shown in Table 1. A weighted random sampler was used to solve class imbalance, guaranteeing that rare Grade 4 recordings were sampled at the same frequency as Grade 1 throughout training.
Table 1.
EEG model hyperparameters.
4. Result and Analysis
4.1. Machine Learning Results
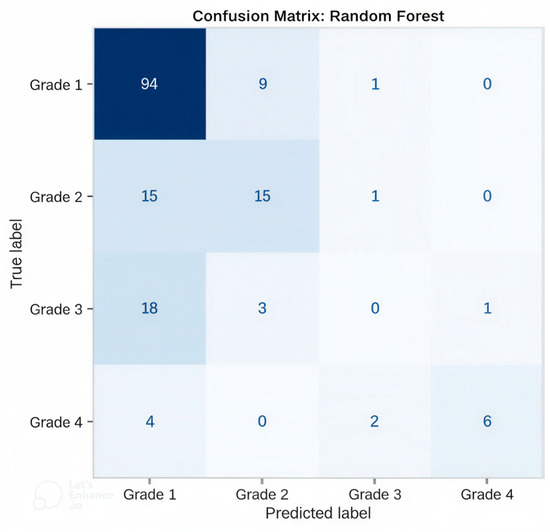
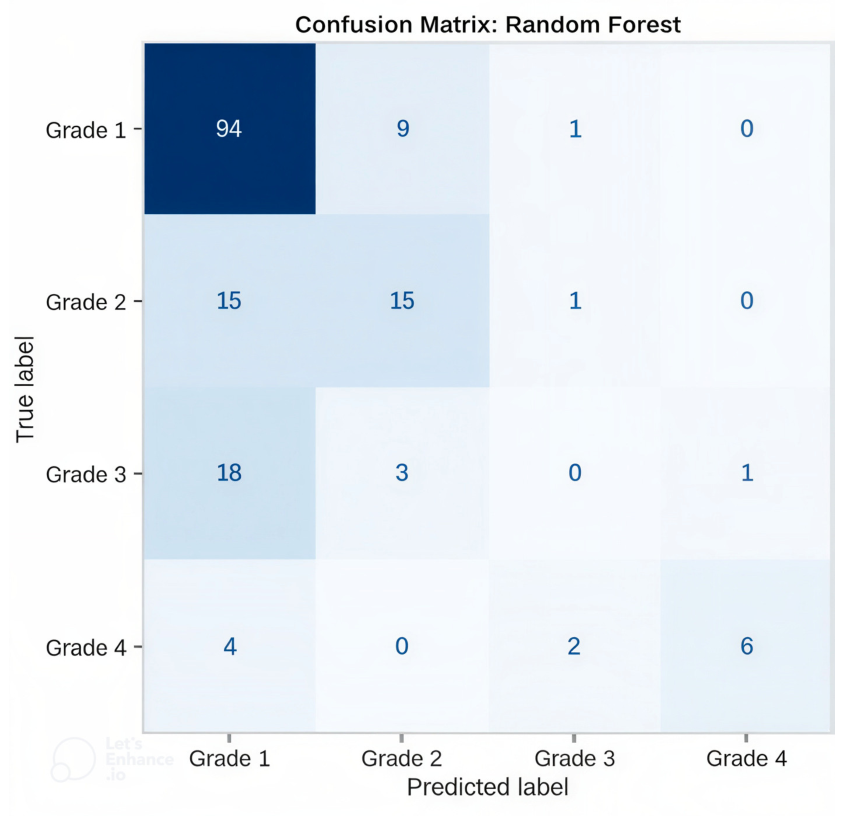
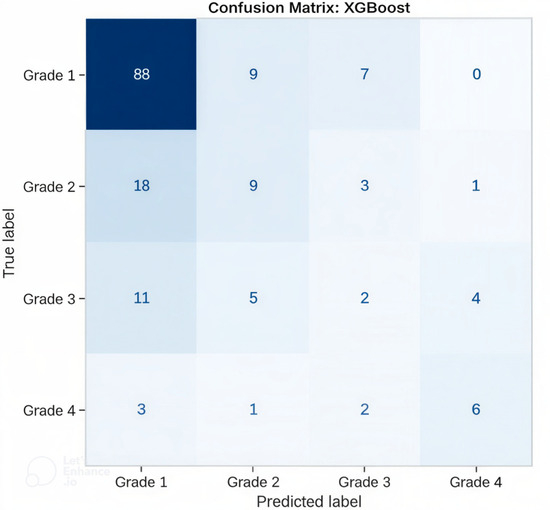
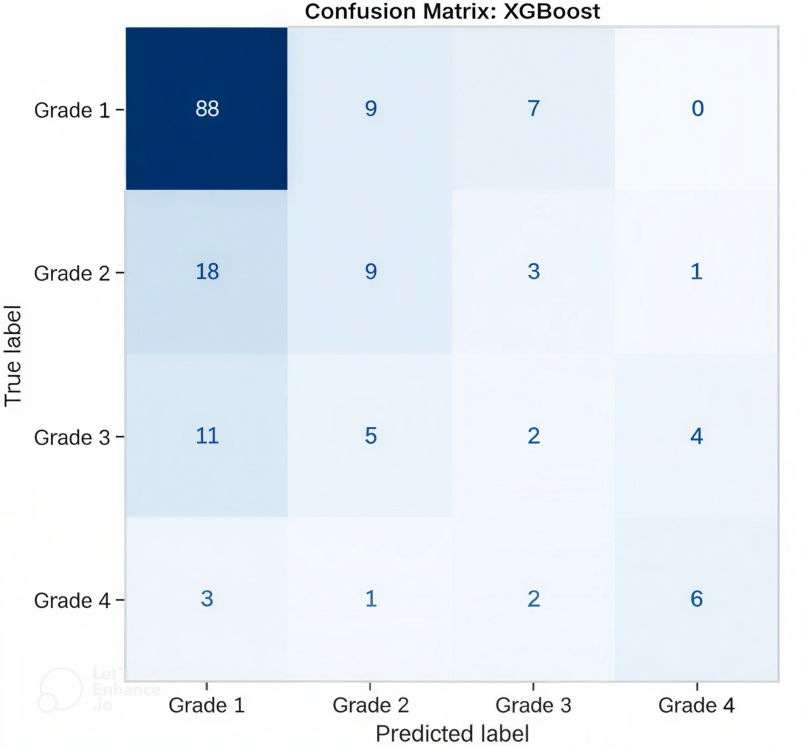
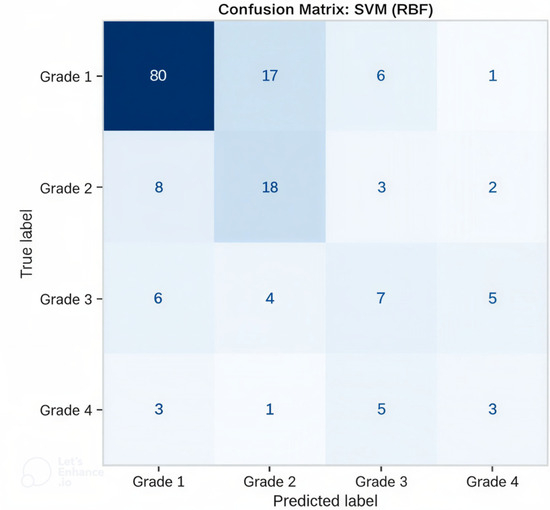
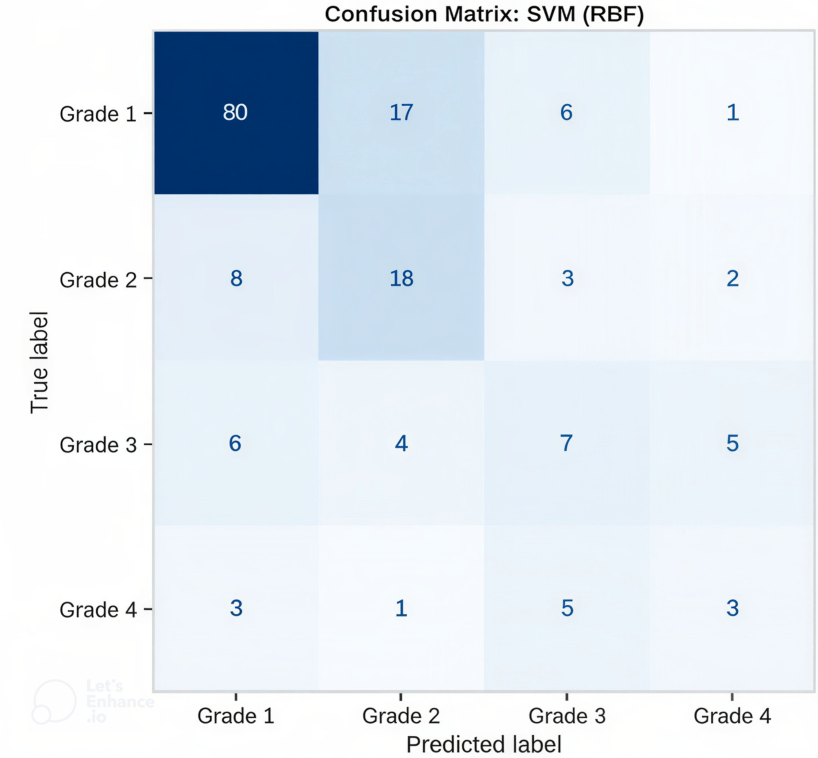
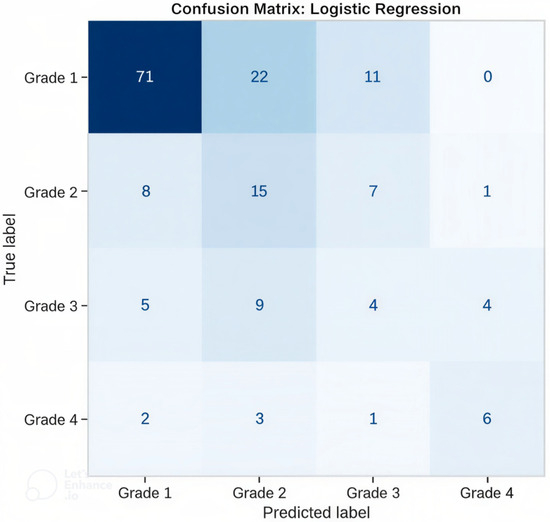
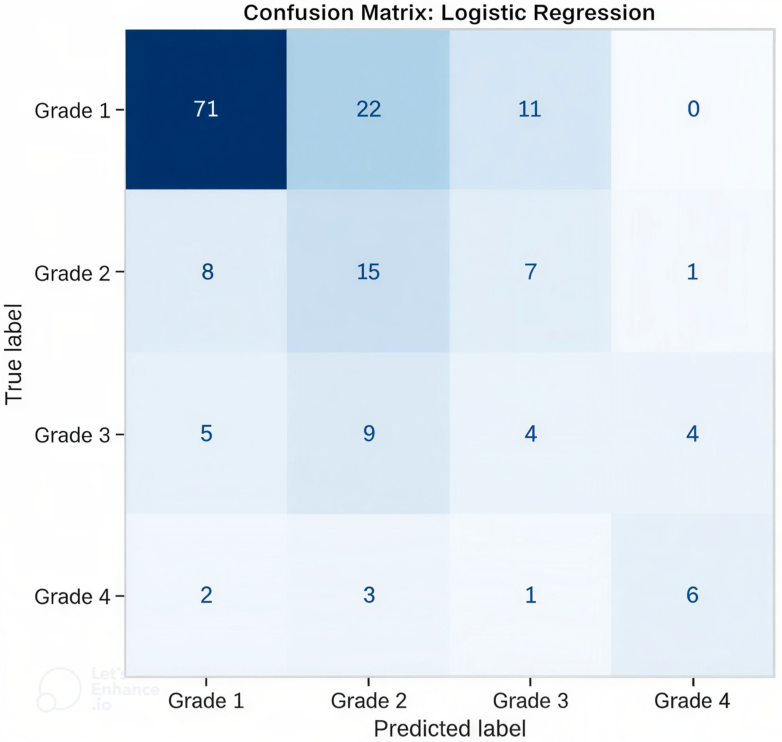
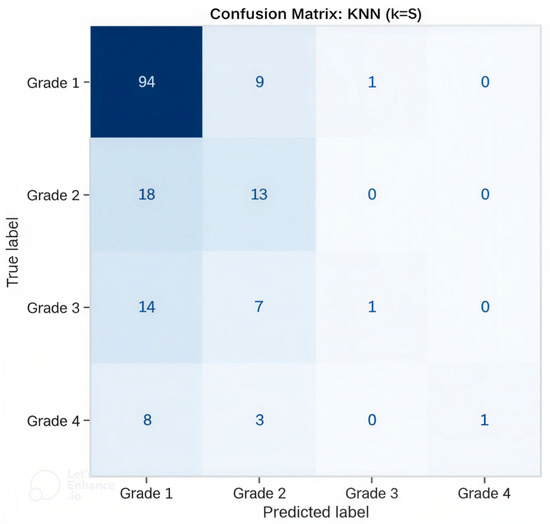
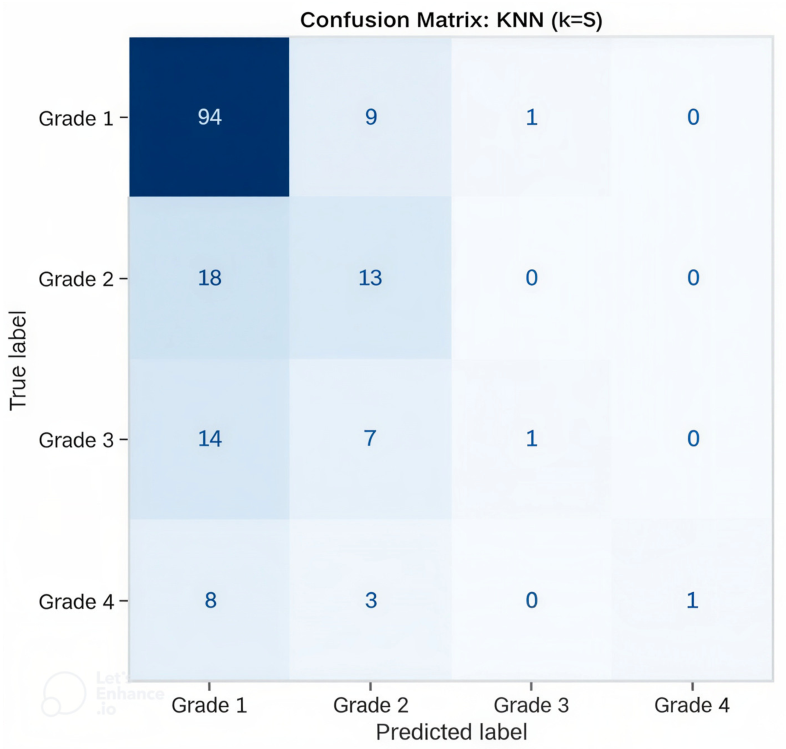
The machine learning models provide moderate classification performance. However, since these approaches operate on aggregated feature vectors and do not explicitly model long-range temporal dependencies, their ability to capture evolving EEG background dynamics is limited. Table 2 represents the performance of the machine learning models, and Figure 7, Figure 8, Figure 9, Figure 10 and Figure 11 represent the confusion matrices of the machine learning models.
Table 2.
Machine learning model performance (subject-wise aggregated).
Figure 7.
Confusion matrix for Random Forest.
Figure 8.
Confusion matrix for XGBoost.
Figure 9.
Confusion matrix for support vector machine.
Figure 10.
Confusion matrix for Logistic Regression.
Figure 11.
Confusion matrix for K-Nearest Neighbors.
4.2. Deep Learning Results
The deep learning architectures demonstrate improved modeling capacity compared to traditional ML approaches. To ensure a rigorous evaluation given the class imbalance, all reported Precision, Recall and F1-scores represent macro-averages calculated across the four severity grades. The performance results of the deep learning models are shown in Table 3. Among all evaluated models, the proposed Hybrid Mamba architecture achieved the highest overall performance.
Table 3.
Deep learning model performance (mean ± SD across 5-fold subject-wise CV).
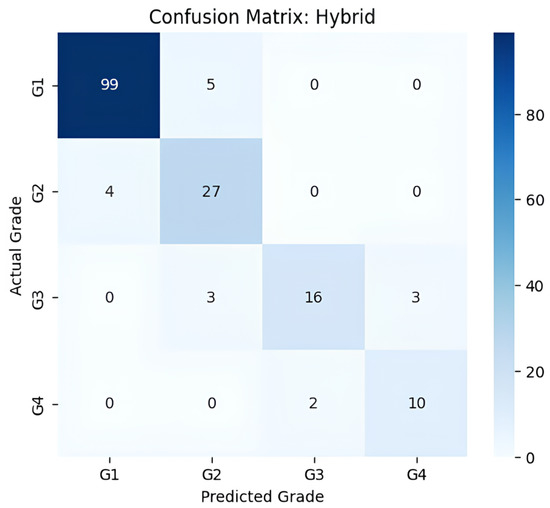
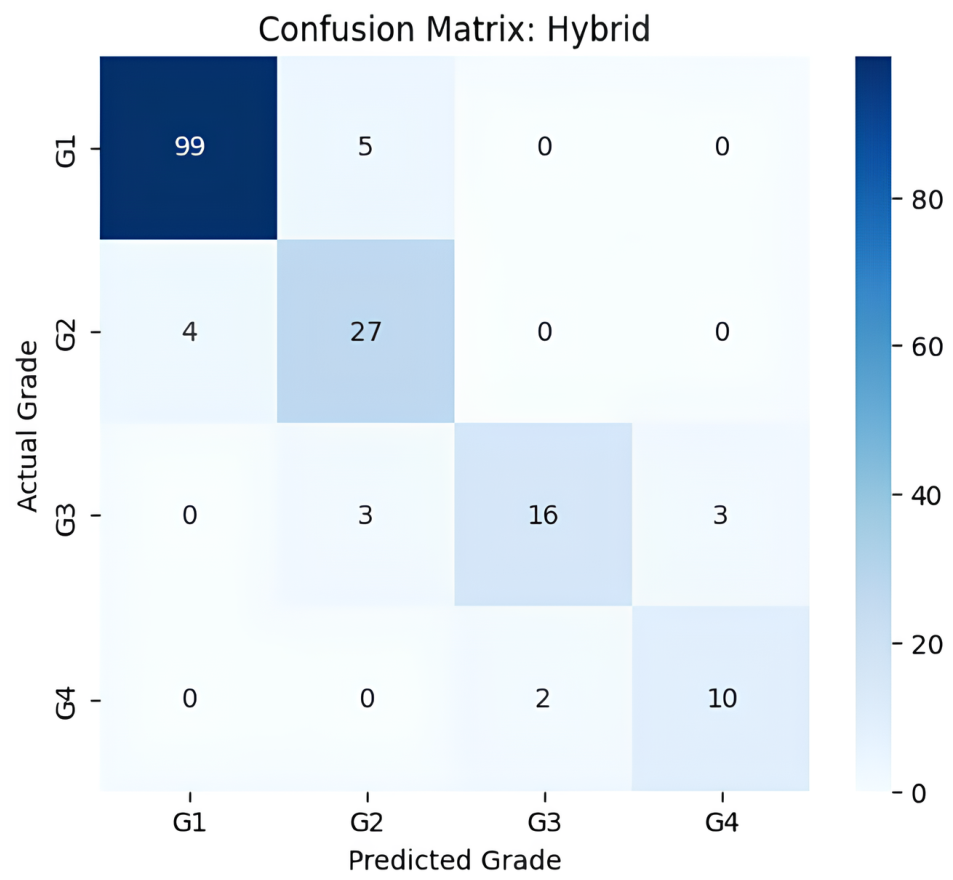
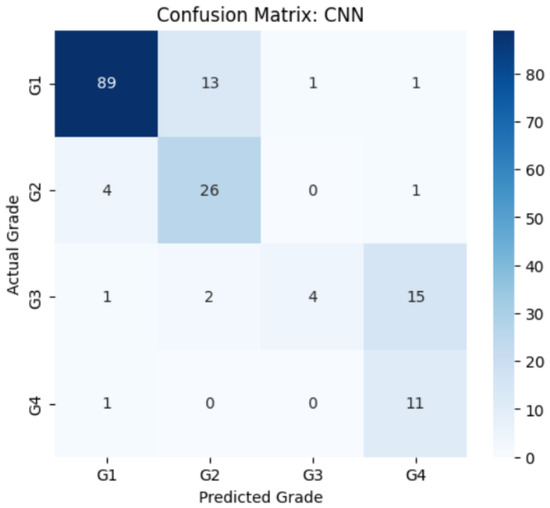
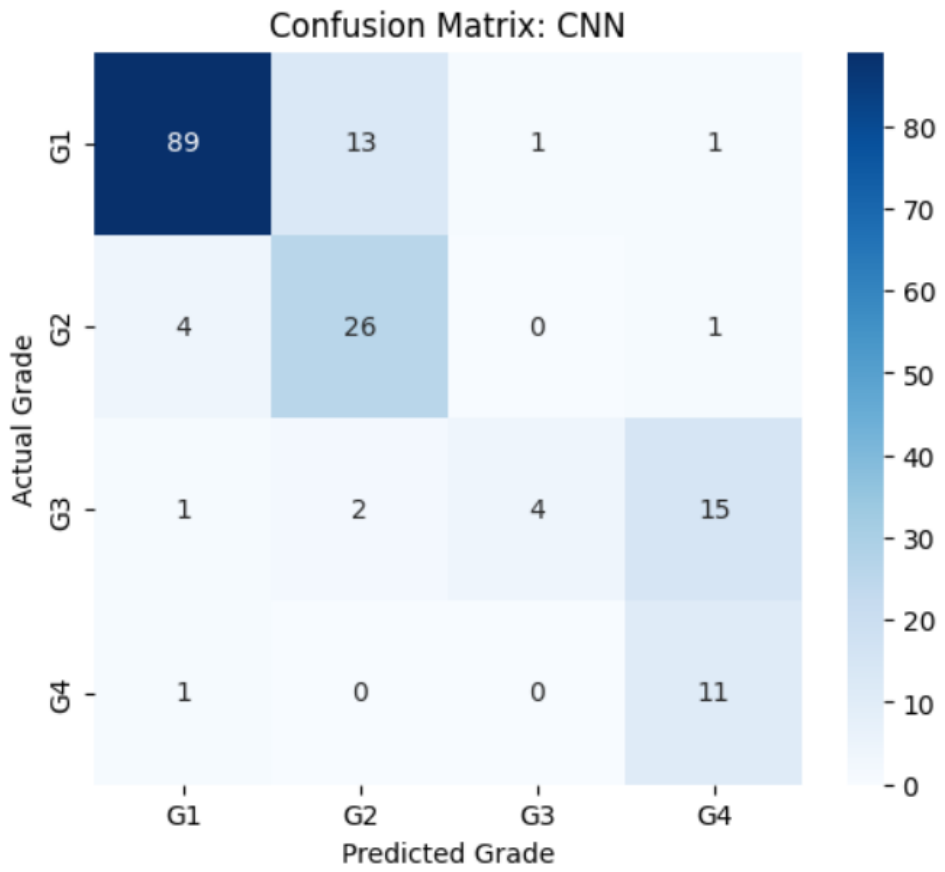
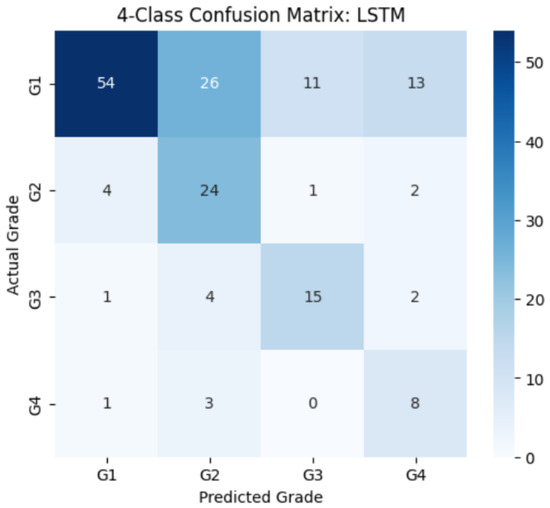
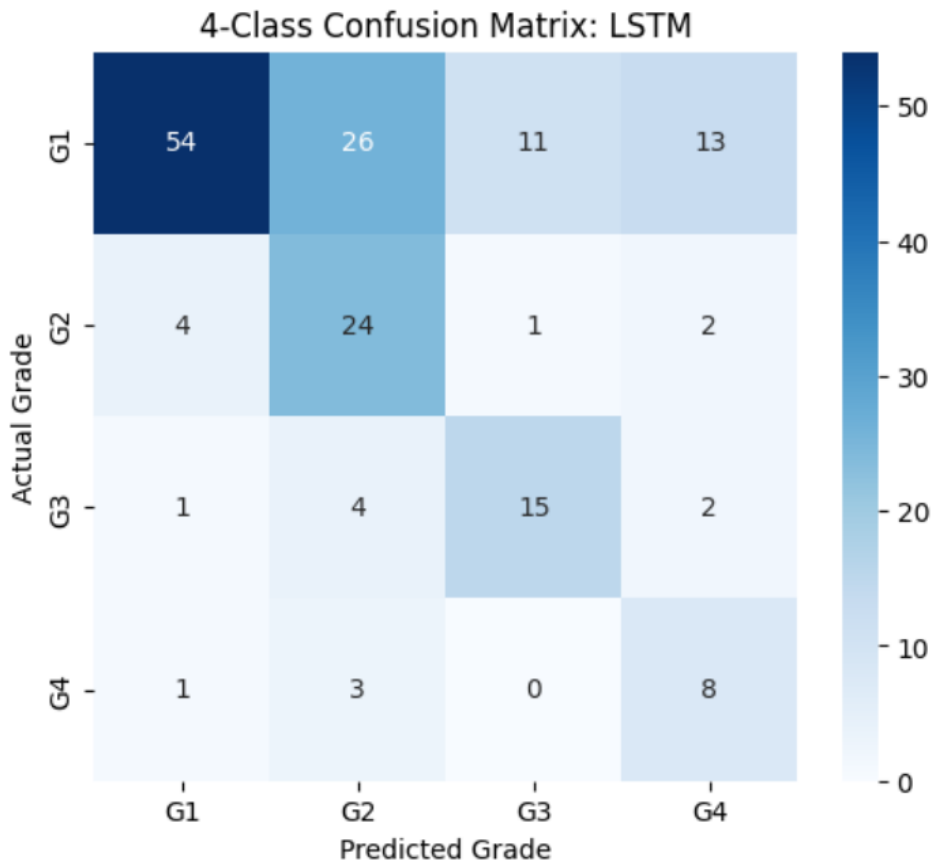
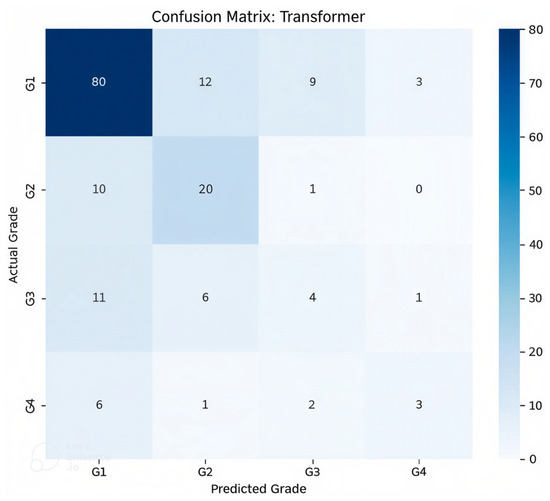
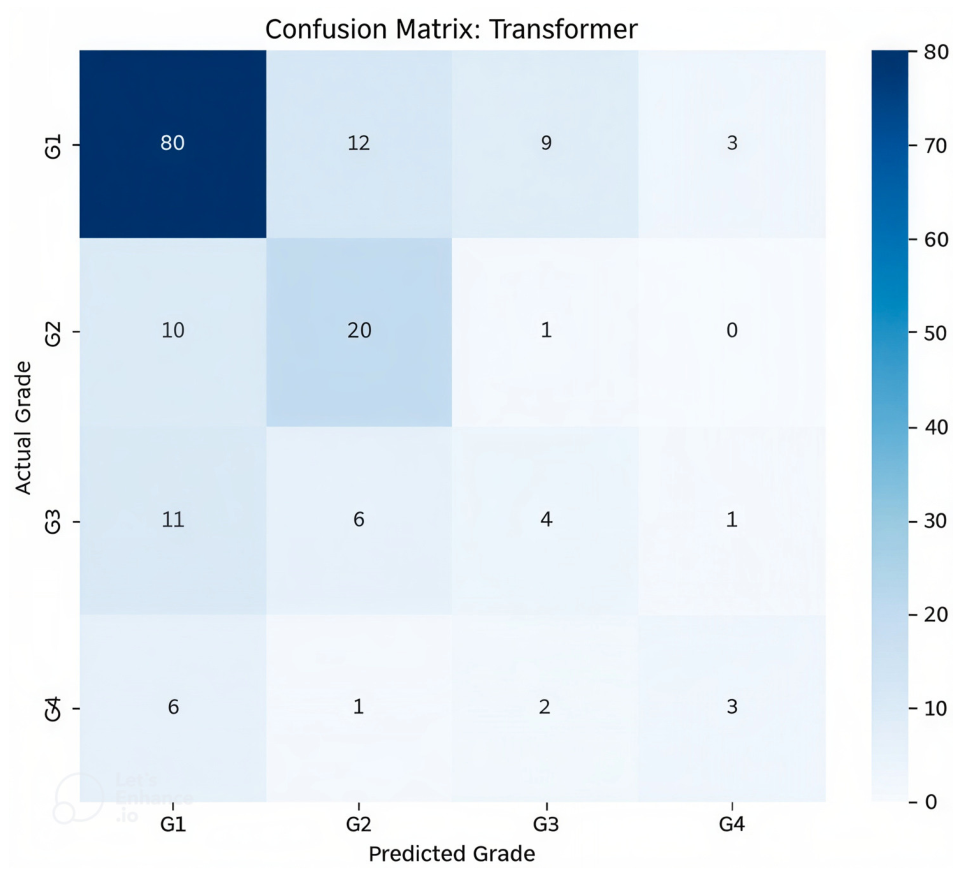
The confusion matrices displayed below (Figure 12, Figure 13, Figure 14 and Figure 15) represent aggregated out-of-fold predictions from the 5-fold cross-validation, summing to the total dataset size of 169 recordings. This ensures that every sample is evaluated as a held-out test subject exactly once, providing an unbiased view of the system’s generalizability.
Figure 12.
Confusion matrix for Hybrid Mamba.
Figure 13.
Confusion matrix for CNN.
Figure 14.
Confusion matrix for BiLSTM.
Figure 15.
Confusion matrix for Transformer.
Hybrid Mamba demonstrates the highest overall accuracy, reduced adjacent grade confusion, and improved clinical grading stability compared to other models.
4.3. Ablation Analysis and Mechanistic Support
To investigate the contribution of individual architectural components to the overall 90% accuracy, an ablation study was performed (Table 4).
Table 4.
Ablation study of architectural components.
The findings reveal that while the Mamba block efficiently models long-term temporal correlations, the key source of performance gain lies in the use of the Clinical Feature Gating technique. Unlike conventional concatenation, the gating unit allows the physiological features to gate the deep features learned by the network. This is especially important in Stage 3 (severe vs. inactive) where the suppression ratio becomes an essential gate for the neural network’s ability to detect the nearly isoelectric activity.
5. Explainable AI Analysis
In order to make the models more transparent and trusted by clinicians, an XAI framework involving multiple layers was adopted. Interpretability was explored at the decision layer, temporal window layer, sequence attention layer, and handcrafted feature layer.
5.1. Hierarchical Decision Transparency
The four-category classification model was developed using a three-tiered decision structure that entailed: (i) Stage 1—mild vs. abnormal; (ii) Stage 2—moderate vs. severe/inactive; and (iii) Stage 3—severe vs. inactive. Probability values, threshold comparisons, branch choices, predicted category, true category, and correctness for each dataset were tabulated during each stage of processing. The probabilistic flow control approach guarantees total visibility into the decision sequence, allowing for the full traceability of the process through which the model makes its way to the final grade category classification. The hierarchical decision-making of a sample is illustrated in Table 5.
Table 5.
Hierarchical decision analysis for sample 62 (ID21_epoch3).
5.2. Window-Level Gradient Attribution
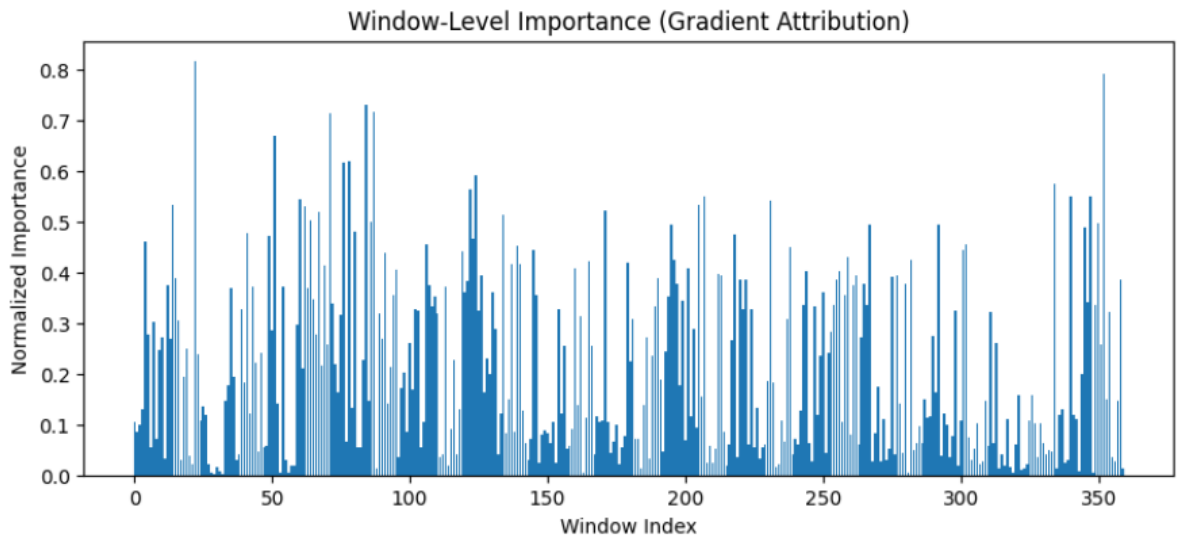
To identify which temporal segments influenced model predictions, gradient-based attribution was computed with respect to the raw EEG windows. The gradients of the predicted class logit were backpropagated to the raw input, and window importance was calculated as follows:
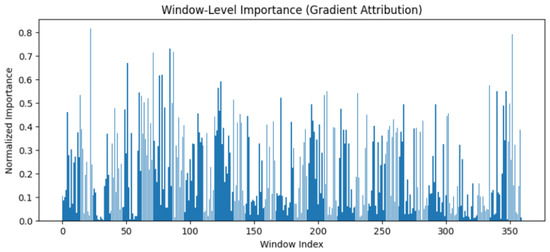
The resulting bar plot shown in Figure 16 highlights the relative contribution of each temporal window, enabling the identification of critical pathological segments and distinguishing localized versus distributed decision patterns.
Figure 16.
Window-level gradient attribution: temporal importance across EEG windows.
To validate the faithfulness of these attributions, we cross-referenced high-importance windows with the underlying EEG morphology. In Grade 3 (severe) and Grade 4 (inactive) cases, the attribution scores peaked during high-amplitude bursts and periods of profound voltage suppression, respectively. Stability analysis was performed by adding Gaussian noise to non-critical windows, which resulted in minimal shifts in the importance rankings, confirming that the model’s focus is anchored in physiologically significant temporal segments rather than stochastic noise.
5.3. Attention-Based Sequence Reasoning
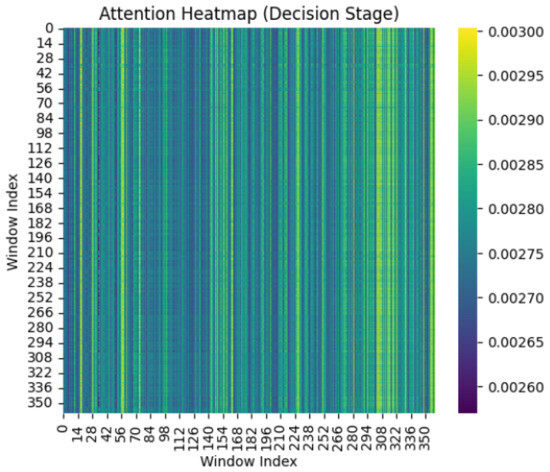
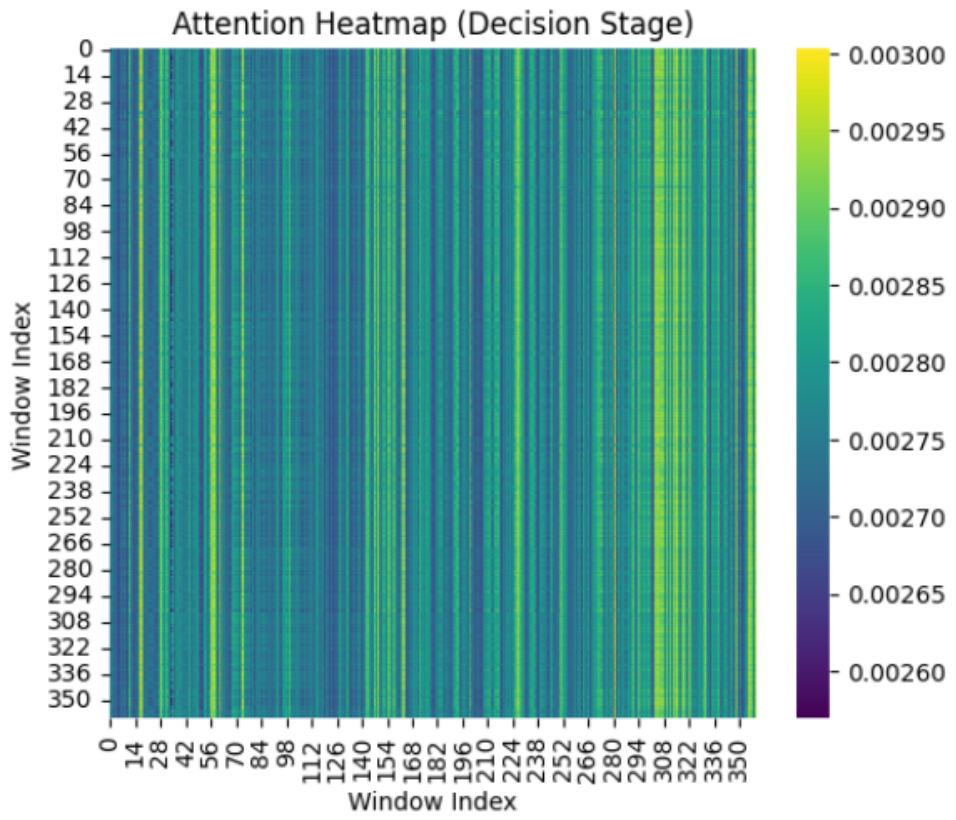
Attention weights were extracted from the Multihead Attention layer of the decision stage model to analyze inter-window dependencies.
The heatmap shown in Figure 17 illustrates how windows pay attention to other windows, thus helping us to understand the long-term temporal dependencies and sequence-level thinking of the model.
Figure 17.
Attention heatmap showing inter-window dependencies.
In addition, the heatmap provides an understanding of why there is improved performance in the case of Hybrid Mamba. For example, CNN baseline models can only utilize local receptive fields; however, the weights from the attention process show that the model takes into consideration features from far away windows. Similarly, such global reasoning corresponds to the way continuity is assessed in medical practice.
5.4. Handcrafted Feature Attribution
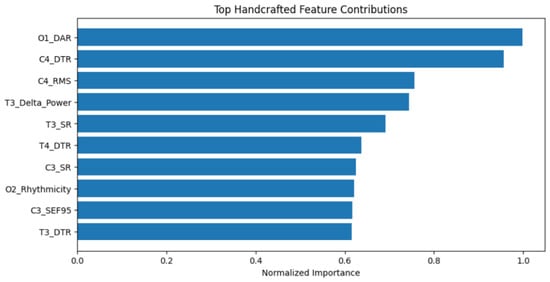
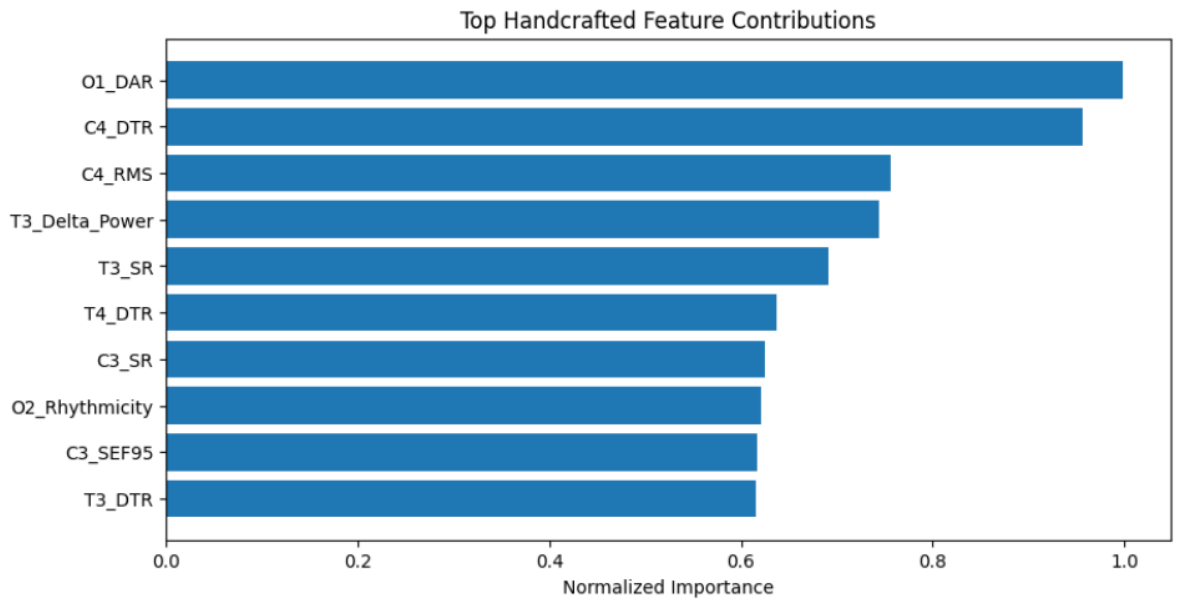
In order to measure the importance of physiological EEG features, a gradient-based approach was used on the handcrafted feature tensor. The gradients of the logit output with respect to each handcrafted feature were estimated, and then mean absolute gradients were obtained per window:
Figure 18 shows the top features used by the model in its classification decision. Consistent with existing HIE biomarkers in the clinical literature, the Delta–Alpha Ratio (DAR) and Delta–Theta Ratio have emerged as the leading predictors for triaging patients at an early stage. In predicting the severe/inactive classes, the suppression ratio (SR) and RMS amplitude are shown to have the highest feature attribution. Notably, the presence of the SR at the top ranking is evidence that the model utilizes the absolute threshold of voltages before normalizing them, hence allowing for physiological consistency in Grade 3 vs. Grade 4 categorization.
Figure 18.
Channel-specific handcrafted feature attribution.
5.5. Clinical Implementation and Real-World Utility
In the real-world setting of an NICU environment, the framework can operate as a continuous bedside clinical decision support system. In contrast to experts’ inability to provide 24/7 monitoring of multi-channel recordings, the proposed model provides a quick and automated triage. With the ability to detect pathological temporal windows and quantify a confidence level using a probabilistic score, the tool allows practitioners to focus on more dangerous neonate cases for an assessment of therapeutic hypothermia treatment. While the model achieved 90% alignment with expert consensus, its primary role is intended to augment the clinical workflow by providing objective, quantitative background grading in resource-limited settings where 24 h subspecialist coverage is unavailable.
6. Conclusions
This paper proposes an effective and explainable deep learning model for the evaluation of HIE in terms of its functional activity based on extended EEG data analysis. This research addresses several gaps in current research, specifically the lack of attention paid to long-range dependencies as well as the lack of physiological consistency of automatic biomarkers. Using EEG data spanning one hour, the model facilitates detailed brain dynamic modeling that is vital for the accurate evaluation of the patient’s condition. Furthermore, several recent studies have explored related machine learning and deep learning methodologies for biomedical signal analysis and classification tasks, highlighting the growing importance of robust and interpretable AI-driven frameworks in healthcare applications [14,15,16,17,18,19,20,21,22,23,24,25,26,27,28,29,30,31].
A comparative study was conducted between conventional machine learning algorithms and deep sequence models. In order to ensure generalizability, all models were tested through a 5-fold cross-validation strategy based on data collected from 169 segments of 53 patients. Although conventional machine learning algorithms provided a benchmark for performance, they were limited in modeling the time-based evolution of underlying processes. Conventional deep learning models such as CNNs, BiLSTM, and Transformer, while effective in modeling time dependency, suffered from either computational limitations or failure to incorporate contextual information in feature engineering.
A novel hybrid architecture based on the Mamba model was presented to overcome these limitations. The framework uses a unique dual-path feature gating method while utilizing the linear temporal complexity provided by selective state space (S6) modeling. As a result, it makes it easier to employ clinically accepted characteristics like as the DAR, SR, and SEF95 that are derived from microvolt-level measurements prior to normalization in conjunction with raw EEG data. Additionally, the use of Masked Signal Modeling for Self-Supervised Learning (SSL) during pre-training enhanced model initialization and robustness to the inherent class imbalance issue present in newborn HIE grades. The experimental results demonstrated that the proposed model achieved a peak accuracy of 90%, with a robust mean performance of 88.45% ± 6.8% across hierarchical stages. To ensure an unbiased clinical evaluation, all reported metrics, including F1-scores, were calculated using macro-averaging to reflect performance across all severity grades equally.
Additionally, this strategy emphasizes clinical interpretability through a multi-layered explainable AI analysis. The temporal segments and biomarkers that serve as the foundation for the model’s logic are clearly demonstrated by the hierarchical scoring system and the attribution maps examined based on faithfulness. The tool is more dependable and trustworthy due to the alignment of deep learning characteristics with clinical Sarnat grading norms. Overall, this study provides an important contribution to the development of reliable techniques for neurological assessment.
Author Contributions
Conceptualization, A.C. and C.R.; Methodology, A.C., C.T. and C.N.; Software, L.C.R. and C.T.; Investigation, A.C., C.T. and C.R.; Resources, L.C.R.; Data Curation, L.C.R.; Supervision, C.N. and C.R.; Project Administration, C.R. All authors have read and agreed to the published version of the manuscript.
Funding
This research received no external funding.
Institutional Review Board Statement
No participants were involved in this study. Hence, ethical approval, informed consent, and adherence to institutional or licensing regulations are not applicable.
Informed Consent Statement
Informed consent was not required for this study because the analysis was conducted on a publicly available dataset obtained from the Zenodo repository. The dataset contains de-identified neonatal EEG recordings and does not include any personally identifiable information. No new data were collected from human participants, and this study involved a secondary analysis of previously recorded data. Therefore, informed consent from individual participants was not required for this research.
Data Availability Statement
The dataset analyzed during this study is publicly available in the Zenodo repository at https://zenodo.org/records/7477575 (accessed on 20 December 2025).
Conflicts of Interest
The authors declare no conflicts of interest.
References
- Randieri, C.; Perrotta, A.; Puglisi, A.; Bocci, M.G.; Napoli, C. CNN-Based Framework for Classifying COVID-19, Pneumonia, and Normal Chest X-Rays. Big Data Cogn. Comput. 2025, 9, 186. [Google Scholar] [CrossRef] [Scilit]
- Weiss, R.J.; Bates, S.V.; Song, Y.; Zhang, Y.; Herzberg, E.M.; Chen, Y.C.; Gong, M.; Chien, I.; Zhang, L.; Murphy, S.N.; et al. Mining multi-site clinical data to develop machine learning MRI biomarkers: Application to neonatal hypoxic ischemic encephalopathy. J. Transl. Med. 2019, 17, 385. [Google Scholar] [CrossRef] [Scilit] [PubMed]
- Zheng, Q.; Martin-Saavedra, J.S.; Saade-Lemus, S.; Vossough, A.; Zuccoli, G.; Gonçalves, F.G.; Freeman, C.W.; Ouyang, M.; Singh, V.; Padula, M.A.; et al. Cerebral pulsed arterial spin labeling perfusion weighted imaging predicts language and motor outcomes in neonatal hypoxic-ischemic encephalopathy. Front. Pediatr. 2020, 8, 576489. [Google Scholar] [CrossRef] [Scilit]
- Raurale, S.A.; Boylan, G.B.; Mathieson, S.R.; Marnane, W.P.; Lightbody, G.; O’Toole, J.M. Grading hypoxic-ischemic encephalopathy in neonatal EEG with convolutional neural networks and quadratic time-frequency distributions. J. Neural Eng. 2021, 18, 046007. [Google Scholar] [CrossRef] [Scilit] [PubMed]
- Tian, T.; Gan, T.; Chen, J.; Lu, J.; Zhang, G.; Zhou, Y.; Li, J.; Shao, H.; Liu, Y.; Zhu, H.; et al. Graphic Intelligent Diagnosis of Hypoxic-Ischemic Encephalopathy Using MRI-Based Deep Learning Model. Neonatology 2023, 120, 441–449. [Google Scholar] [CrossRef] [Scilit]
- Bao, R.; Song, Y.; Bates, S.V.; Weiss, R.J.; Foster, A.N.; Jaimes, C.; Sotardi, S.; Zhang, Y.; Hirschtick, R.L.; Grant, P.E.; et al. Boston neonatal brain injury data for hypoxic ischemic encephalopathy (BONBID-HIE): I. MRI and lesion labeling. Sci. Data 2025, 12, 53. [Google Scholar] [CrossRef] [Scilit]
- Bao, R.; Weiss, R.J.; Bates, S.V.; Song, Y.; He, S.; Li, J.; Bjornerud, A.; Hirschtick, R.L.; Grant, P.E.; Ou, Y. PARADISE: Personalized and regional adaptation for HIE disease identification and segmentation. Med. Image Anal. 2025, 102, 103419. [Google Scholar] [CrossRef] [Scilit]
- Ashoori, M.; O’Toole, J.M.; Garvey, A.A.; O’Halloran, K.D.; Walsh, B.; Moore, M.; Pavel, A.M.; Boylan, G.B.; Murray, D.M.; Dempsey, E.M.; et al. Machine learning models of cerebral oxygenation (rcSO2) for brain injury detection in neonates with hypoxic-ischaemic encephalopathy. J. Physiol. 2024, 602, 6347–6360. [Google Scholar] [CrossRef] [Scilit]
- Lewis, J.D.; Miran, A.A.; Stoopler, M.; Branson, H.M.; Danguecan, A.; Raghu, K.; Ly, L.G.; Cizmeci, M.N.; Kalish, B.T. Automated Neuroprognostication Via Machine Learning in Neonates with Hypoxic-Ischemic Encephalopathy. Ann. Neurol. 2025, 97, 791–802. [Google Scholar] [CrossRef] [Scilit]
- Lew, C.O.; Calabrese, E.; Chen, J.V.; Tang, F.; Chaudhari, G.; Lee, A.; Faro, J.; Juul, S.; Mathur, A.; McKinstry, R.C.; et al. Artificial Intelligence Outcome Prediction in Neonates with Encephalopathy (AI-OPiNE). Radiol. Artif. Intell. 2024, 6, e240076. [Google Scholar] [CrossRef] [Scilit]
- Kiranyaz, S.; Ince, T.; Gabbouj, M. Real-time patient-specific ECG classification by 1-D convolutional neural networks. IEEE Trans. Biomed. Eng. 2015, 63, 664–675. [Google Scholar] [CrossRef] [Scilit]
- Hochreiter, S.; Schmidhuber, J. Long short-term memory. Neural Comput. 1997, 9, 1735–1780. [Google Scholar] [CrossRef] [Scilit]
- Vaswani, A.; Shazeer, N.; Parmar, N.; Uszkoreit, J.; Jones, L.; Gomez, A.N.; Kaiser, Ł.; Polosukhin, I. Attention is all you need. Adv. Neural Inf. Process. Syst. 2017, 30. [Google Scholar] [CrossRef] [Scilit]
- Prakash, J.; Arun, A.; Ravi, V.; Sowmya, V.; Soman, K.P. Stacked ensemble learning based on deep convolutional neural networks for pediatric pneumonia diagnosis using chest X-ray images. Neural Comput. Appl. 2023, 35, 8259–8279. [Google Scholar] [CrossRef] [Scilit]
- Guo, J.; Cheng, X.; Wu, D. Grading method for hypoxic-ischemic encephalopathy based on neonatal EEG. Comput. Model. Eng. Sci. 2020, 122, 721–742. [Google Scholar] [CrossRef] [Scilit]
- Raurale, S.A.; Boylan, G.B.; Lightbody, G.; O’Toole, J.M. Grading the severity of hypoxic-ischemic encephalopathy in newborn EEG using a convolutional neural network. In 2020 42nd Annual International Conference of the IEEE Engineering in Medicine & Biology Society (EMBC); IEEE: New York, NY, USA, 2020; pp. 6103–6106. [Google Scholar]
- O’Sullivan, M.E.; Lightbody, G.; Mathieson, S.R.; Marnane, W.P.; Boylan, G.B.; O’Toole, J.M. Development of an EEG artefact detection algorithm and its application in grading neonatal hypoxic-ischemic encephalopathy. Expert Syst. Appl. 2023, 213, 118917. [Google Scholar] [CrossRef] [Scilit]
- Cornet, M.C.; Numis, A.L.; Wusthoff, C.J.; Bernardo, D.; Mietzsch, U.; Thomas, C.; Natarajan, N.; Ahmad, K.A.; Scheffler, A.; Juul, S.E.; et al. Automated EEG Background Analysis and 2-Year Outcomes in Neonatal Hypoxic-Ischemic Encephalopathy. JAMA Netw. Open 2025, 8, e2548321. [Google Scholar] [CrossRef] [Scilit] [PubMed]
- Nair, S.S.; Sowmya, V.; Gopalakrishnan, E.A.; Gupta, S.; Khanna, N. Effect of Segmentation on Skin Lesion Classification Using Multi-Scale Convolution Neural Networks. In 2024 IEEE 21st India Council International Conference (INDICON); IEEE: New York, NY, USA, 2024; pp. 1–6. [Google Scholar]
- Ganeshkumar, M.; Ravi, V.; Sowmya, V.; Gopalakrishnan, E.A.; Soman, K.P.; Chakraborty, C. Identification of intracranial haemorrhage (ICH) using ResNet with data augmentation using CycleGAN and ICH segmentation using SegAN. Multimed. Tools Appl. 2022, 81, 36257–36273. [Google Scholar] [CrossRef] [Scilit]
- Madan, Y.; Veetil, I.K.; Sowmya, V.; Gopalakrishnan, E.A.; Soman, K.P. Synthetic data augmentation of MRI using generative variational autoencoder for Parkinson’s disease detection. In Evolution in Computational Intelligence (FICTA 2021); Springer: Berlin/Heidelberg, Germany, 2022; pp. 171–178. [Google Scholar]
- Chou, J.-L.; Huang, Y.-L.; Hsieh, C.-Y.; Huang, J.-X.; Wei, C.-S. Accelerating brain research using explainable artificial intelligence. In 2022 IEEE International Conference on Multimedia and Expo Workshops (ICMEW); IEEE: New York, NY, USA, 2022; p. 1. [Google Scholar]
- Nyrup, R.; Robinson, D. Explanatory pragmatism: A context-sensitive framework for explainable medical AI. Ethics Inf. Technol. 2022, 24, 13. [Google Scholar] [CrossRef] [Scilit]
- Yang, G.; Ye, Q.; Xia, J. Unbox the black-box for the medical explainable AI via multi-modal and multi-centre data fusion: A mini-review, two showcases and beyond. Inf. Fusion 2022, 77, 29–52. [Google Scholar] [CrossRef] [Scilit] [PubMed]
- Sakshi, S.; Verma, G. Explainable Artificial Intelligence in Healthcare: Transparency and Trustworthiness. Artif. Intell. Cybersecur. Healthc. 2025, 243–272. [Google Scholar] [CrossRef] [Scilit]
- Widjaja, G.; Wahid, N.; Raha, S.; Pande, S.D.; Manerkar, S.G.V. An exhaustive exploration of explainable AI-driven applications in healthcare, enhancing diagnostic accuracy, treatment efficacy, and patient trust. In Explainable Artificial Intelligence for Biomedical and Healthcare Applications; CRC Press: Boca Raton, FL, USA, 2024; pp. 230–248. [Google Scholar]
- Amin, A.; Hasan, K.; Hossain, M.S. XAI-empowered MRI analysis for consumer electronic health. IEEE Trans. Consum. Electron. 2024, 71, 1423–1431. [Google Scholar] [CrossRef] [Scilit]
- Charaabi, H.; Mzoughi, H.; Hamdi, R.; Njah, M. Explainable Artificial Intelligence (XAI) for MRI brain tumor diagnosis: A survey. In 2023 International Conference on Cyberworlds (CW); IEEE: New York, NY, USA, 2023; pp. 171–178. [Google Scholar]
- Madapatha, S.; Fernando, P. A systematic literature review of XAI-based approaches on brain disease detection using brain MRI images. In 2024 4th International Conference on Advanced Research in Computing (ICARC); IEEE: New York, NY, USA, 2024; pp. 19–24. [Google Scholar]
- Nicolaou, A.; Pantzaris, M.; Loizou, C.P.; Kakas, A.; Pattichis, C.S. An Explainable AI model in the assessment of Multiple Sclerosis using clinical data and Brain MRI lesion texture features. In 2023 IEEE EMBS International Conference on Biomedical and Health Informatics (BHI); IEEE: New York, NY, USA, 2023; pp. 1–4. [Google Scholar]
- Fontes, M.; Almeida, J.D.S.D.; Cunha, A. Application of example-based explainable artificial intelligence (XAI) for analysis and interpretation of medical imaging: A systematic review. IEEE Access 2024, 12, 26419–26427. [Google Scholar] [CrossRef] [Scilit]

Disclaimer/Publisher’s Note: The statements, opinions and data contained in all publications are solely those of the individual author(s) and contributor(s) and not of MDPI and/or the editor(s). MDPI and/or the editor(s) disclaim responsibility for any injury to people or property resulting from any ideas, methods, instructions or products referred to in the content. |
© 2026 by the authors. Licensee MDPI, Basel, Switzerland. This article is an open access article distributed under the terms and conditions of the Creative Commons Attribution (CC BY) license.