


Abstract
Information diffusion models developed for Twitter, Reddit, and Facebook assume network contagion and competition for shared attention. Telegram operates differently. It is built around channels rather than social graphs, and users receive posts directly from subscribed channels without algorithmic mediation. We analyze over 5000 forwarding cascades from the Pushshift Telegram dataset to examine whether existing diffusion models generalize to this broadcast environment. Our findings reveal fundamental structural differences. Telegram forwarding produces perfect star topologies with zero multi-hop propagation. Every forward connects directly to the original message, creating trees with maximum depth of exactly 1. This contrasts sharply with Twitter retweet chains that routinely reach depths of 5 or more hops. Forwarding delays follow heavy-tailed Weibull or lognormal distributions with median delays measured in days rather than hours. Approximately 15 to 20 percent of cascades exhibit administrative bulk reposting rather than organic user-driven growth. Most strikingly, early-stage competitive overtaking is absent. Six of 30 pairs exhibit crossings, but these occur late (median 79 days) via administrative bursts rather than organic competitive acceleration during peak growth. We develop a delay-driven star diffusion model that treats forwarding as independent draws from a delay distribution. The model achieves median prediction errors below 10 percent for organic cascades. These findings demonstrate that platform architecture fundamentally shapes diffusion dynamics. Comparison with prior studies on Twitter, Weibo, and Reddit reveals that Telegram’s broadcast structure produces categorically different patterns—including perfect star topology and asynchronous delays—requiring platform-specific modeling approaches rather than network-based frameworks developed for other platforms.
1. Introduction
Online social platforms have become central to how information spreads in modern society [1]. A single message can reach millions of people within hours, shaping public opinion, mobilizing collective action, and influencing political and economic outcomes. Understanding the mechanisms and dynamics of information diffusion is therefore critical for platform designers, content creators, policymakers, and researchers studying communication, social networks, and collective behavior [2,3].
Most research on information diffusion focuses on platforms with global feeds or algorithmic timelines, such as Twitter, Facebook, and Reddit [4,5]. These platforms share a common architecture: users follow accounts or join communities, content appears in reverse-chronological or algorithmically ranked feeds, and resharing mechanisms like retweets or upvotes propagate messages through social networks. Diffusion models developed for these platforms emphasize network structure, contagion dynamics, and competition for limited attention in shared feeds [6,7].
Telegram operates differently [5,8]. It is built around channels rather than social graphs. Users subscribe to channels and receive posts directly from those channels without algorithmic mediation or cross-channel mixing. Forwarding preserves the original source and creates transparent attribution chains, but it does not broadcast content to followers in the same way that retweeting does. These structural differences suggest that diffusion dynamics in Telegram may diverge fundamentally from patterns observed on feed-based platforms.
Despite Telegram’s growing importance as a communication platform, particularly in regions where other platforms are restricted or less trusted, there has been little systematic research on how information spreads within its channel ecosystem. Existing diffusion models assume multi-hop propagation through social networks or competition for visibility in shared feeds. It remains an open question whether these assumptions hold in a broadcast environment with isolated channels and no algorithmic curation.
This paper addresses this gap by conducting the first large-scale empirical analysis of information diffusion in Telegram. We analyze over 5000 forwarding cascades extracted from the Pushshift Telegram dataset. Our analysis reveals three key findings that challenge conventional diffusion models.
First, Telegram diffusion follows a star topology with zero multi-hop propagation. Every forward connects directly to the original message, and no forward triggers additional forwards. This structure is fundamentally different from Twitter retweet trees, which routinely reach depths of 5 or more hops. The star topology validates a delay-driven modeling approach where each forwarding event is treated as an independent draw from a delay distribution rather than as the result of network contagion.
Second, forwarding delays in Telegram are heavy-tailed and follow Weibull or lognormal distributions with decreasing hazard rates. Median delays are measured in days rather than hours, and a significant fraction of forwards occur weeks or months after the original post. This timing pattern reflects asynchronous discovery across independent channels and contrasts with the rapid exponential growth and decay observed in viral Twitter cascades.
Third, competitive dynamics during active growth are absent. While 20% of cascade pairs eventually cross, these crossings occur late in the lifecycle (median 79 days into overlap) and align with administrative reposting rather than organic speed-based competition.
This paper presents a delay-driven star diffusion model for Telegram, grounded in three falsifiable hypotheses derived from platform architecture:
H1 (Zero Multi-Hop):
Perfect star topology with depth exactly 1, reflecting Telegram’s forward attribution to original sources rather than intermediate nodes.
H2 (Heavy-Tailed Delays):
Decreasing hazard rates at the population level (Weibull k < 1 pooled), reflecting information decay, though individual cascades exhibit heterogeneity.
H3 (Absence of Early Competition):
No evidence for competitive acceleration in overlapping cascades, consistent with channel-based isolation rather than shared audience competition.
Empirical validation on 5000+ cascades from Pushshift (2014–2020) confirms all three hypotheses. The delay-driven model achieves median prediction errors below 10% for organic cascades, providing both theoretical insight and practical forecasting capability.
Our contributions are both empirical and methodological. Empirically, we provide the first comprehensive documentation of Telegram diffusion structure, timing, and competition dynamics. We show that Telegram operates under fundamentally different principles than Twitter, Reddit, or Facebook, and that models developed for those platforms do not generalize. Methodologically, we introduce a delay-driven framework tailored to broadcast diffusion environments and validate it against large-scale data. We also demonstrate the failure of competitive diffusion models in channel-based platforms, highlighting the importance of platform-specific modeling.
The findings have practical implications for content strategy, platform governance, and misinformation control in Telegram. Channel operators can optimize posting schedules and content strategies based on delay distributions rather than network effects. Platform designers can use the star topology to simplify moderation and attribution tracking. Policymakers can recognize that Telegram diffusion is less susceptible to viral manipulation campaigns that rely on cascading retweets and algorithmic amplification.
The remainder of this paper is organized as follows. Section 2 reviews related work on diffusion models, delay-based approaches, competition, and Telegram as a platform. Section 3 describes the dataset and preprocessing steps. Section 4 develops the delay-driven star diffusion model and fits delay distributions to empirical data. Section 5 documents the structural properties of Telegram cascades, including tree depth, branching, and the distinction between organic and administrative diffusion. Section 6 tests for competition between overlapping cascades and shows that it does not occur. Section 7 discusses structural differences from other platforms, modeling implications, and limitations. Section 8 concludes with a summary of findings and directions for future research.
2. Background and Related Work
Information diffusion in online platforms has been studied extensively across multiple disciplines, including computer science, physics, sociology, and communication studies [7,9,10,11]. This section reviews the theoretical foundations and empirical findings that inform our analysis of Telegram forwarding. We begin by discussing classical diffusion models that treat information spread as an epidemic-like process. We then examine delay-based approaches that emphasize temporal dynamics and heavy-tailed distributions. Next, we review models of competing diffusion and shared attention. Finally, we discuss the unique structural properties of Telegram that distinguish it from other social platforms.
2.1. Classical Diffusion Models in Social Networks
Classical models of information diffusion draw heavily from epidemiology, treating messages as infectious agents that spread through contact between susceptible and infected individuals. The Susceptible-Infected-Recovered (SIR) model and its variants form the foundation of this approach (Zhang et al., 2016 [2]). In the SIR framework, individuals transition from susceptible (not yet exposed) to infected (actively spreading the message) to recovered (no longer participating in diffusion). These models assume homogeneous mixing and instantaneous transmission, which simplifies analysis but may not capture the heterogeneity and temporal complexity of real-world diffusion processes.
Extensions of the basic SIR model introduce additional states to account for more nuanced behavior. The Susceptible-Exposed-Infected (SEI) model adds an exposed state to represent individuals who have encountered the information but have not yet decided to share it (Kumar et al., 2020 [3]). This modification recognizes that exposure does not immediately lead to transmission, and that individuals may deliberate before forwarding content. Other variants incorporate forgetting, reinfection, or behavioral heterogeneity, but they retain the core assumption that diffusion proceeds through direct pairwise contact.
An alternative class of models focuses on network structure rather than population-level dynamics. The Independent Cascade (IC) model assumes that each node has a single opportunity to activate each of its neighbors with a fixed probability (Zhang et al., 2016 [2]). The Linear Threshold (LT) model posits that nodes adopt a behavior when the cumulative influence from their active neighbors exceeds a personal threshold. Both models emphasize the role of network topology in shaping diffusion outcomes, but they abstract away temporal details by treating activation as a discrete event rather than a continuous process.
Recent work has extended these classical frameworks to incorporate higher-order structures such as simplicial complexes and hypergraphs, which capture group interactions beyond pairwise connections (Xia et al., 2024 [12]; Ni et al., 2026 [13]). These models recognize that information can spread through collective discussions and coordinated actions rather than strictly through one-to-one transmission. However, most of these extensions still rely on the epidemic paradigm and do not explicitly model the timing of individual events.
2.2. Delay-Based Diffusion and Heavy-Tailed Timing
While classical epidemic models focus on contact structure, delay-based models emphasize the temporal patterns of information spread. Empirical studies have repeatedly found that adoption times and inter-event intervals in social media follow heavy-tailed distributions, with most events occurring quickly but a significant fraction delayed by hours, days, or even months (Zhang et al., 2016 [2]). These long delays cannot be explained by standard exponential waiting times and require alternative distributional assumptions.
Lognormal and Weibull distributions have emerged as popular choices for modeling delay heterogeneity [14,15]. The lognormal distribution arises naturally when delays result from multiplicative processes, such as repeated exposure or cumulative social reinforcement. The Weibull distribution, widely used in survival analysis, allows for increasing, constant, or decreasing hazard rates depending on its shape parameter. When the shape parameter is less than one, the hazard rate decreases over time, meaning that the probability of adoption conditional on not yet having adopted declines as time passes. This pattern is consistent with waning interest or diminishing novelty.
Tu et al. (2022) [16] model information diffusion using ordinary differential equations that incorporate both temporal and spatial patterns. Their approach recognizes that diffusion evolves continuously over time rather than in discrete steps, and they validate their model using data from the Digg platform. Moscato and Sperlì (2022) [17] introduce temporal constraints into diffusion models for business social networks, showing that time-dependent influence weights improve predictive accuracy. These studies demonstrate that accounting for delay heterogeneity is essential for realistic modeling of information spread.
The role of delays is particularly important in platforms where content has long lifespans and where users discover information asynchronously. In such environments, the timing of exposure and the decision to share are decoupled, and delays may span multiple timescales. Delay-based models capture this asynchrony by treating each adoption as an independent random event drawn from a delay distribution rather than as the result of immediate contagion [7,18].
2.3. Competition in Social Platforms
When multiple pieces of information spread simultaneously, they may compete for limited user attention. Competition has been studied extensively in the context of viral marketing, political campaigns, and misinformation control [19,20]. The central question is whether the presence of one cascade suppresses the growth of another, and if so, through what mechanisms.
He et al. (2025) [4] propose a model for co-diffusion of competing memes in online social networks. They identify a threshold beyond which one meme dominates and the other fails to emerge. Their model assumes that users have finite attention and must choose which meme to adopt when exposed to multiple options. This choice is influenced by the relative prevalence and attractiveness of each meme, creating feedback loops that amplify initial advantages.
Xia et al. (2024) [12] develop a stochastic competitive information propagation model based on hypergraphs. They show that competition dynamics differ depending on whether information spreads through pairwise interactions or through group discussions. In group settings, the influence of competing information is mediated by collective deliberation rather than individual choice, which can either intensify or weaken competitive effects depending on group composition.
Most competition models assume a shared attention pool or overlapping audience [20]. On platforms with global feeds or recommendation algorithms, users are exposed to content from multiple sources simultaneously, and visibility is scarce [6,10]. A message that captures attention displaces others that would otherwise appear. This substitution creates direct competition. However, on platforms where content is delivered through separate channels or personalized feeds, the shared attention assumption may not hold, and cascades may evolve independently.
Abraham et al. (2024) [21] study the spatial diffusion of fake news in India and find that proximity to the source and historical exposure to related events both predict diffusion intensity. Their work highlights that competition for attention is not purely temporal but also spatial, with local context shaping how different pieces of information interact.
2.4. Telegram as a Unique Communication Environment
Telegram differs from platforms like Twitter, Facebook, and Reddit in several structural ways that affect information diffusion [5,8]. Unlike Twitter, which organizes content in a global timeline, Telegram is built around channels and private groups. Users subscribe to channels and receive posts directly from those channels without algorithmic mediation. There is no unified feed where posts from different channels compete for visibility.
Gómez-Romero et al. (2025) [8] introduce pytopicgram, a Python library for extracting and analyzing Telegram messages. Their work demonstrates the growing interest in Telegram as a research platform and highlights the technical challenges of working with Telegram data, including the need for efficient retrieval and topic modeling. The library’s design reflects Telegram’s unique message structure, which includes channels, forwarding metadata, and engagement metrics.
Haile (2024) [5] examines social media use among Ethiopian youth and finds that Telegram is the most trusted platform, with 96 percent of respondents using it regularly. The study reveals that users exhibit selective trust mechanisms, where they rely on specific channels and peer endorsements rather than algorithmic recommendations. This behavior reinforces channel-based segmentation and limits cross-channel information flow.
Forwarding in Telegram preserves the original source, creating a transparent attribution chain that differs from retweets on Twitter. When a Telegram user forwards a message, the forwarded copy retains metadata indicating the original channel and timestamp. This transparency allows recipients to verify the source and assess credibility, but it also means that forwarding does not create new exposure opportunities in the same way that retweeting does. A retweet broadcasts content to the retweeter’s followers, potentially reaching audiences who do not follow the original poster. A Telegram forward, in contrast, typically moves content to a different channel or private group without expanding the original channel’s reach.
The channel-based architecture and forwarding mechanics suggest that Telegram diffusion may operate under different principles than diffusion on feed-based platforms. Cascades may be more isolated, with less direct competition and more reliance on channel-specific audiences. The delay-driven model developed in this paper is motivated by these structural differences and aims to provide a framework tailored to Telegram’s unique environment.
3. Dataset and Preprocessing
This study relies on a large Telegram dataset collected by the Pushshift project [22,23,24], spanning from 2014 to 2020 and covering the platform’s early growth period. It contains messages posted in public channels together with forwarding metadata. The dataset links the original message to each forwarding event, which allows us to reconstruct diffusion cascades and study timing patterns at scale. In this section we describe the structure of the data, the extraction of cascades, and the preprocessing steps used in all subsequent analyses.
3.1. Telegram Forwarding Dataset (Pushshift)
The dataset includes three components [22]: accounts, channels, and messages. The messages file is the largest and contains more than 317 million records. Each record stores the channel where it appeared, the timestamp, and optional forwarding information. Forwarding events specify the source channel and the timestamp of the original message. Global dataset statistics are summarized in Table 1.
Table 1.
Pushshift Telegram dataset summary.
The table reports the total number of messages, the number of forwarded messages, the share of empty-text posts, and the number of observed channels and accounts. The dataset contains 317,224,715 messages and 25,601,073 forwarding events, which corresponds to an 8.07% forwarding share according to the message summary file. It also includes 2,200,040 accounts, of which 1577 are bots (0.07%), and 27,946 channels registered in the period covered by the dataset.
Figure 1 shows the number of messages posted per month. The plot displays a long stable plateau from 2016 to 2019, followed by a marked increase in 2020. This uneven growth suggests that user activity and channel ecosystems evolved over time and that forwarding behavior should be interpreted in a temporal context.
Figure 1.
Monthly Message Volume (#—number of messages).
The dataset also exhibits strong heterogeneity in channel activity. Figure 2 displays the cumulative distribution of message counts across channels. Most channels are relatively small, but a minority publish tens or even hundreds of thousands of posts. The mean number of posts per channel is 10,738, and the median is 1790 (Table 1). This heavy-tailed structure indicates that any diffusion analysis must account for highly unequal activity.
Figure 2.
CDF of Messages per Channel (#—number of messages per channel).
In addition to channel activity, we also examine message length. Figure 3 shows that a large share of messages are short. The median message is less than 50 characters long, but some posts exceed 1000 characters. This variation is relevant because short messages tend to be forwarded more frequently, whereas long posts often include unique content.
Figure 3.
CDF of Message Length (#—number of characters per message).
3.2. Extraction of Cascades and Events
A forwarding cascade is defined as the set of all forwarding events associated with a single original message. To construct cascades, we scan all messages and identify those marked as forwards. A forwarding event includes two identifiers: the original channel and the original timestamp. By matching these fields to the corresponding original message, we record an edge from the original event to the forwarding event.
We group all such edges by original message identifier. Each group forms a cascade. For each cascade we store:
- its size (the number of forwards),
- the timestamps of all forwarding events,
- the channels that participated in the cascade,
- the temporal span of the cascade.
Cascade sizes vary drastically. Figure 4 illustrates the distribution for the largest cascades. Most cascades contain only a single forwarding event, but some exceed 1000 forwards. The right tail is long and contains a small number of very large cascades that dominate the overall forwarding volume.
Figure 4.
Cascade Size Distribution (#—number of forwards).
Metadata Completeness and Reconstruction Validity
To verify that our cascade reconstruction can detect multi-hop propagation if present, we sampled 100,000 forwarded messages and examined metadata completeness. All 8630 forwarded messages (100%) include from_id, channel_post, and date fields, each referencing the root message rather than any intermediate node. This confirms zero instances of forwards-of-forwards in Telegram’s metadata structure, validating that observed star topology reflects platform architecture rather than measurement artifacts.
3.3. Delay Statistics, Temporal Span, and Scale
For each forwarding event we compute a delay defined as:
Delays range from seconds to more than seconds (several years). Figure 5 shows the cumulative delay distribution for the largest cascades. The curve rises slowly at first and then accelerates after several days. A substantial share of events occurs long after the original message was posted.
Figure 5.
CDF of Forwarding Delays.
Figure 6 presents the same data on a logarithmic scale. The histogram shows two distinct regimes. The first regime corresponds to organic diffusion, where forwards are distributed across many weeks or months. The second regime is concentrated near zero delay and corresponds to certain administrative reposting behaviors.
Figure 6.
Histogram of Forwarding Delays.
Temporal spans further illustrate the long-lived nature of Telegram diffusion. Many cascades remain active for months, and some exceed 100 million seconds in duration. These spans are far longer than the lifetimes of posts in platforms with global feeds, where visibility decays quickly. The presence of such long spans is a structural feature of Telegram and motivates the delay-driven modeling used in later sections.
3.4. Identification of Organic and Non-Organic Forwarding
The dataset contains both organic and non-organic forwarding. Organic forwarding reflects user-driven actions spread across time and across different channels. Non-organic forwarding, in contrast, often occurs in bulk, usually when a channel migrates to a new identifier, republishes its archive, or performs coordinated cross-posting.
Two indicators help distinguish organic from non-organic cascades:
- Shape of the delay distribution. Organic cascades have wide delay distributions with gradual growth. Non-organic cascades show clusters of many forwarding events with identical or nearly identical timestamps.
- Shape of the cumulative curve. Organic cascades produce smooth cumulative growth. Non-organic cascades exhibit sharp vertical jumps in the cumulative plot.
These patterns are visible in the delay histograms (Figure 5 and Figure 6). The dense mass of near-zero delays suggests administrative reposting. Long continuous tails correspond to organic diffusion. We enforce monotonicity in cumulative curves during preprocessing. Empirical cascades occasionally exhibit non-monotonic trajectories, where temporarily decreases. This occurs in 8.3% of cascades and reflects either message deletion or data collection artifacts rather than organic diffusion dynamics. We apply monotonic transformation to ensure consistency with theoretical assumptions. Sensitivity analysis shows delay distribution fits remain stable whether using raw or corrected curves (median parameter shift < 5%).
In later sections, we fit delay distributions only to cascades whose shapes indicate organic behavior. This improves the stability of parameter estimates and keeps the interpretation aligned with the underlying processes of Telegram diffusion.
4. Modeling Information Diffusion with Delays
The empirical findings from Section 3 show that Telegram forwarding is driven by long and heterogeneous delays. Cascades remain active for months, and the delay distributions exhibit heavy tails. These patterns suggest that diffusion in Telegram can be modeled as a delay-driven process rather than through classical contagion mechanisms.
This section formalizes a delay-based diffusion model and evaluates how well it captures empirical forwarding behavior. We begin by defining the star diffusion framework and deriving predictions for cumulative and instantaneous forwarding rates. We then estimate global delay distributions and examine their goodness of fit. The results reveal that a Weibull distribution with a shape parameter provides the best description of Telegram delays at the population level, though individual cascades show substantial variation.
4.1. Star Diffusion with Delay Distributions
A forwarding cascade begins with an original message posted at time . Each forward represents an independent adoption event that occurs after a random delay drawn from a distribution . We assume that all forwards connect directly to the original message, forming a star-shaped structure with the root at the center. This assumption is validated in Section 5.1, which confirms zero multi-hop propagation across all cascades.
Let denote the total size of a cascade, defined as the number of forwarding events observed over the entire temporal span. The cumulative number of forwards at time is then given by:
where is the cumulative distribution function of the delay. The instantaneous forwarding rate, or intensity, follows from differentiation:
where is the probability density function of the delay distribution.
This formulation treats the cascade as a population-level process in which individual forwarding events are statistically independent and identically distributed. The model parameters are the cascade size and the delay distribution . Unlike epidemic models that track susceptible and infected nodes, the delay-driven model does not require a network structure. Diffusion is governed entirely by the timing distribution.
Two parametric families are commonly used to model heavy-tailed delays in social systems [14]: the lognormal and the Weibull distribution. The lognormal arises naturally when delays result from multiplicative processes, such as repeated exposure or word-of-mouth propagation across heterogeneous populations. Its density is:
The Weibull distribution is widely used in survival analysis and models hazard rates that can increase, decrease, or remain constant over time. Its density is:
where is the shape parameter and is the scale parameter. When , the hazard rate decreases over time, producing heavy tails. When , the Weibull reduces to an exponential distribution. When , the hazard rate increases.
Both families allow flexible tail behavior and have been successfully applied to model information diffusion in online platforms. We fit both distributions to Telegram delays and compare their performance using maximum likelihood estimation and standard goodness-of-fit criteria.
4.2. Pooled Delay Estimation
We begin by estimating a single global delay distribution pooled across all cascades. This approach treats all forwarding events as draws from a common distribution and provides a baseline characterization of Telegram diffusion at the population level.
The pooled sample contains 120,975 delay observations extracted from the top cascades. We fit both the lognormal and Weibull distributions using maximum likelihood. Model comparison is based on the Akaike Information Criterion (AIC) and the Kolmogorov–Smirnov (KS) test statistic.
Table 2 summarizes the fitted parameters and goodness-of-fit metrics.
Table 2.
Pooled delay distribution estimates.
The Weibull distribution provides a substantially better fit. The AIC difference of approximately 41,000 strongly favors the Weibull model. The KS test statistic is also much lower for Weibull (0.024 vs. 0.108), indicating closer alignment with the empirical cumulative distribution.
Figure 7 shows the empirical CDF together with the fitted distributions. The Weibull CDF tracks the empirical curve closely across the full range of delays, from seconds to years. The lognormal overestimates the probability mass in the center of the distribution and underestimates the tail. The PDF curves reveal that the Weibull captures the long right tail more accurately.
Figure 7.
Pooled delay distributions: empirical CDF and PDF compared with fitted Lognormal and Weibull models. The Weibull distribution (green) closely tracks the empirical curve across the full delay range, while the Lognormal (orange) overestimates central delays and underestimates the tail.
The estimated Weibull shape parameter is below 1. This indicates a decreasing hazard rate: the probability of forwarding conditional on not yet having forwarded declines over time. In other words, messages that survive without being forwarded become progressively less likely to be forwarded as time passes. This contrasts with exponential or near-exponential diffusion, where the hazard remains constant or increases.
The scale parameter seconds corresponds to approximately 157 days. This value represents the characteristic timescale of Telegram forwarding and reflects the extremely long persistence of content in the platform. Many messages continue to spread months or even years after their initial publication.
The pooled Weibull provides a population-level benchmark but masks substantial heterogeneity across cascades. Per-cascade fits (Section 4.3) reveal that 54.5% favor Weibull while 45.5% favor lognormal, with fitted parameters varying by orders of magnitude. This heterogeneity likely reflects differences in channel type, topic domain, and audience composition. A fully adequate model would require hierarchical (mixed-effects) frameworks or finite mixture models with cascade-level covariates, which we leave for future work. For forecasting applications, per-cascade parameter estimation is preferable when sufficient data (≥50 events) are available.
4.3. Per-Cascade Fitting and Model Families
The pooled model provides a single global description of Telegram delays, but it assumes that all cascades share the same delay distribution. This assumption may not hold in practice. Different messages appeal to different audiences, circulate in different channel ecosystems, and may trigger forwarding at different rates.
To examine heterogeneity, we fit both lognormal and Weibull distributions to each cascade individually. We restrict the analysis to cascades with at least 50 forwarding events to ensure stable parameter estimates. This yields 960 fitted cascades. For each cascade, we compute maximum likelihood estimates for both families and select the best-fitting model using AIC.
Figure 8 shows the distribution of Weibull shape and scale parameters across cascades. Shape parameter k exhibits substantial heterogeneity, with the median and values ranging from 0.3 to 3.2. The majority (77%) show , indicating that individual cascades often exhibit increasing forwarding rates over time. This contrasts with the pooled (Table 2), revealing that population-level decay masks diverse individual trajectories. Scale parameter λ (bottom panel) varies by orders of magnitude, reflecting differences in cascade timescales from days to years.
Figure 8.
Distribution of Weibull shape parameter k across 960 cascades (top). The concentration near k < 1 indicates that decreasing hazard rates dominate Telegram forwarding dynamics. Distribution of Weibull scale λ (bottom).
Figure 9 presents the distribution of the lognormal location parameter . Values range from 4 to 18, with most clustered between 14 and 16, corresponding to median delays from hours to months. This spread reflects heterogeneity in propagation speed across different channels and topics. Messages with low spread within days; those with high accumulate forwards gradually over extended periods.
Figure 9.
Distribution of lognormal location parameter μ across cascades. Values range from 4 to 18, reflecting heterogeneity in median forwarding delays from hours to months.
Figure 10 shows the distribution of the lognormal scale parameter . Most cascades have between 0.5 and 2.0, indicating moderate variability in forwarding times. The long tail beyond represents cascades with highly variable delay patterns, often reflecting multiple activity waves separated by dormant periods.
Figure 10.
Distribution of lognormal scale parameter σ across cascades. The long right tail captures cascades with highly variable forwarding patterns and multiple activity waves.
Model selection by AIC shows 54.5% of cascades favor Weibull, 45.5% favor lognormal. This near-equal split indicates both families capture important features of Telegram diffusion. The median AIC difference is 8.3 units, though some cascades show strong preference (ΔAIC > 50) for one family.
Parameter heterogeneity has practical implications for forecasting. Universal models applied to all cascades fail to capture cascade-specific timing patterns. Per-cascade estimation improves predictive accuracy when sufficient data (≥50 events) exist. For smaller cascades, the pooled Weibull provides a reasonable baseline.
Larger cascades tend toward higher and λ values, suggesting popular messages spread over longer timescales. However, size alone does not determine delay distributions. Cascades of similar size can exhibit dramatically different parameters depending on channel type, topic, and audience composition.
Size-stratified analysis. To test generalizability, we partition cascades into size bins (2–10, 10–50, 50–100, 100–500, 500+) and recompute delay metrics. Heavy-tailed characteristics persist across all bins, with median Weibull k ranging 1.3–1.7. Median delays increase systematically with size (15 → 467 days), reflecting that larger cascades accumulate forwards over longer timescales. This validates delay-driven dynamics across the cascade size spectrum while highlighting size-dependent parameter variation.
4.4. Model Selection and Goodness-of-Fit
To evaluate whether the delay-driven model accurately predicts cascade evolution, we compare the fitted distributions against observed cumulative forwarding curves. For each cascade, we compute the predicted curve using the best-fitting distribution and the observed cascade size . We then measure prediction error using the root mean squared error (RMSE) and mean absolute error (MAE).
Table 3 reports summary statistics for model performance across all cascades using per-cascade best fits.
Table 3.
Prediction error statistics (per-cascade best model).
The median RMSE of 18.4 forwards is low relative to typical cascade sizes, which range from 50 to over 1000 events. The median MAE of 11.9 indicates that predicted and observed curves typically differ by fewer than 12 forwards at any given time. These errors are small enough to support reliable short-term forecasting for organic cascades.
However, the distribution of errors is right-skewed. The mean RMSE of 48.2 is substantially higher than the median, indicating that a subset of cascades is poorly fit by the delay model. The 75th percentile RMSE of 52.3 suggests that roughly one quarter of cascades exhibit errors exceeding 50 forwards, which is non-negligible for medium-sized cascades.
Figure 11 presents a quantile-quantile plot for cascade 66372580_1445253436, which is well-fit by the Weibull model. The plot compares empirical delay quantiles against theoretical Weibull quantiles on a log-log scale. The points align closely with the diagonal reference line across most of the distribution. Deviations appear only in the extreme upper tail, where the empirical delays form discrete clusters due to administrative reposting events. These clusters represent batches of forwards posted simultaneously, which violate the independence assumption underlying the delay model.
Figure 11.
Quantile-quantile plot for cascade 66372580_1445253436. Empirical quantiles align with Weibull theoretical quantiles except in the extreme tail, where administrative reposting creates discrete clusters.
Figure 12 overlays the empirical CDF with the fitted Weibull and lognormal CDFs for the same cascade. Both models track the empirical curve well up to the 90th percentile. The Weibull provides a slightly better fit in the tail, where the lognormal underestimates the slowest delays.
Figure 12.
Empirical and fitted distributions for cascade 66372580_1445253436. Both Weibull (green) and lognormal (orange) track the empirical CDF closely, with Weibull providing marginally better tail fit.
The corresponding PDF curves show that the Weibull captures the decreasing density in the tail more accurately than the lognormal.
We now examine two contrasting examples to illustrate where the model succeeds and where it fails.
Figure 13 shows cascade 247930460_1486224395, which exhibits excellent model fit. The observed cumulative curve (solid blue) grows smoothly and matches the predicted curve (dashed orange) almost exactly throughout the entire temporal span. The cascade accumulates 350 forwards over a period of approximately seconds (120 days). The Weibull model with and captures the gradual deceleration in forwarding rate. The final RMSE is 8.1 forwards, corresponding to less than 3% error relative to the cascade size. This cascade represents organic diffusion driven by gradual discovery and sharing across independent channels.
Figure 13.
Predicted vs. observed cumulative forwards for cascade 247930460_1486224395 (well-fit example). The delay-driven Weibull model closely tracks organic growth over 120 days with RMSE < 3%.
Figure 14 presents cascade 66372580_1445253436, which shows substantial model failure. The observed curve grows smoothly up to approximately 100 forwards over the first seconds. Then it stalls completely for an extended period before jumping abruptly to 220 forwards and finally reaching 335 forwards in a second jump near the end of the observation window. The predicted curve, in contrast, continues rising smoothly and monotonically according to the Weibull CDF.
Figure 14.
Predicted vs. observed cumulative forwards for cascade 66372580_1445253436 (poor fit example). The stair-step pattern reveals administrative bulk reposting events that violate the continuous-time delay model assumptions.
The RMSE for this cascade is 94.3 forwards, nearly 30% of the cascade size.
The stair-step pattern in the observed curve is the signature of administrative reposting. A channel administrator bulk-forwarded archived messages at two distinct points in time, creating synchronized bursts of activity that cannot be captured by a smooth delay distribution. The model assumes that forwards arrive independently according to a continuous-time stochastic process, but administrative actions violate this assumption by introducing deterministic batches.
Administrative forwarding is common in Telegram. Channels migrate to new identifiers, repost historical content, or coordinate cross-channel distribution campaigns. These events produce sharp vertical jumps in cumulative curves and clusters of identical timestamps in the delay distribution. The delay-driven model cannot reproduce such patterns because it treats each forward as an independent random event.
We attempted to filter administrative cascades by examining the shape of the cumulative curve during preprocessing, but some administrative behavior remains in the data. Approximately 15–20% of cascades show clear step-like growth patterns indicative of bulk reposting. These cascades account for most of the high-error cases in Table 3.
Figure 15 illustrates the catastrophic failure of the pooled Weibull model when applied to predict actual cascade trajectories. The pooled model predicts monotonic growth reaching 120,000 cumulative forwards (dashed orange), while the observed pooled curve (solid blue) peaks near 38,000 and then declines. This decline is impossible under the delay-driven framework, which assumes that cumulative counts can only increase. The observed decrease results from administrative reposting followed by message deletion or data collection artifacts. The pooled model, which averages across all cascades, cannot account for such regime shifts and produces systematically biased forecasts.
Figure 15.
Pooled model prediction failure. The observed curve peaks and declines while the pooled Weibull prediction monotonically increases, revealing fundamental incompatibility between delay-driven models and administrative forwarding regimes.
The model performs well for organic cascades characterized by smooth growth and independent forwarding events. It fails for cascades dominated by administrative actions or coordinated bulk reposting. This failure is not a flaw of the delay distribution family but a fundamental limitation of the modeling approach. Delay-driven models assume temporal independence, and administrative bursts violate this assumption structurally.
A complete description of Telegram diffusion requires separating organic and non-organic regimes and modeling them differently. Organic diffusion can be captured accurately using Weibull or lognormal delay distributions. Non-organic diffusion must be treated as a distinct process governed by channel management policies and coordination rather than by user behavior. Section 5 examines the empirical structure of Telegram diffusion trees and quantifies the prevalence of these two regimes.
5. Empirical Diffusion Structure in Telegram
Section 4 assumes star topology with independent forwarding events. This section validates that assumption and documents Telegram’s structural properties. We confirm zero multi-hop propagation across all cascades, identify the prevalence of administrative bulk reposting (15–20%), and explain why the delay model succeeds for organic diffusion but fails for administrative bursts.
5.1. Star Topology and Cascade Characteristics
Telegram forwarding produces perfect star topologies with zero multi-hop propagation. We reconstruct diffusion trees for all 5000 cascades by linking forwarding events to their sources using Telegram’s forwarding metadata. Every single cascade exhibits maximum depth of exactly 1: all forwards connect directly to the original message, and no forward references an intermediate copy.
This structure is not an artifact of incomplete data. Telegram’s API explicitly records the source of each forward, distinguishing between forwards from original posts versus forwards from forwarded copies. The absence of multi-hop edges indicates that users overwhelmingly forward from subscribed channels rather than resharing intermediate copies.
Table 4 summarizes cascade characteristics. The median cascade contains 82 forwards and remains active for 48 days. Median forwarding delay is 9.6 days, with 90th percentile exceeding 71 days. These long delays reflect asynchronous discovery across independent channels rather than rapid network-based contagion. The star topology validates the independence assumption underlying the delay-driven model (Section 4): since forwards do not trigger additional forwards, each event can be treated as an independent draw from a delay distribution. This structure differs fundamentally from Twitter retweet trees, which routinely reach depths of 5+ hops through cascading social influence.
Table 4.
Cascade size and temporal span summary statistics. (#—number of forwards).
5.2. Administrative vs. Organic Diffusion
Figure 16 shows organic diffusion. Cascade 126367282_1444631426 exhibits smooth monotonic decline in λ(t) consistent with Weibull k < 1. Isolated spikes represent individual late forwards but do not disrupt the overall decreasing trend. This pattern reflects independent user-driven forwarding distributed across many channels and timescales.
Figure 16.
Organic forwarding rate pattern (cascade 126367282_1444631426). The smooth monotonic decline consistent with Weibull distribution reflects independent user-driven forwarding without administrative intervention.
Figure 17 illustrates administrative dominance. Cascade 77868411_1466023829 shows near-zero activity for months, then a massive synchronized burst near 107 s accounting for the majority of total forwards. This step-like pattern is characteristic of bulk archive reposting—typically triggered by channel migration, cross-posting agreements, or historical content curation.
Figure 17.
Administrative burst-dominated cascade (77868411_1466023829). Nearly dormant for months before massive synchronized forwarding event, characteristic of bulk archive reposting by channel administrators.
Administrative bursts arise from several channel management practices:
- Channel migration: administrators repost entire archives to new identifiers;
- Coordinated cross-posting: partner channels simultaneously forward content batches;
- Archive republication: channels refresh feeds by bulk-forwarding old posts.
These actions create clusters of identical timestamps and sharp vertical jumps in C(t), violating the continuous-time independence assumption of the delay model. Approximately 15–20% of cascades exhibit clear administrative behavior, identified by step-like cumulative curves and temporal clustering of forwards. The delay-driven model succeeds for organic cascades (median RMSE 18.4, Table 3) but fails catastrophically for administrative cascades (Figure 14). A complete model of Telegram diffusion requires separating these regimes and applying different approaches: delay distributions for organic diffusion, event-based models for administrative actions.
To operationalize this distinction reproducibly, we apply an automated classifier based on three temporal metrics: (1) normalized Shannon entropy of inter-event interval distribution, (2) burst fraction (events within 1 h windows), and (3) coefficient of variation. Cascades exhibiting low entropy (<0.35) combined with high burstiness (>0.4), or extremely low entropy (<0.25), or very high burst fraction (>0.7) are classified as administrative. This yields 17.4% administrative prevalence, consistent with visual estimates (15–20%). Administrative cascades show median RMSE = 94.3 vs. RMSE = 18.4 for organic, validating the classification.
6. Competing Diffusion in Telegram
Section 4 and Section 5 established that Telegram forwarding follows a delay-driven star diffusion model with no multi-hop propagation. Each cascade evolves independently according to its own delay distribution. This structure raises a natural question: do cascades compete for attention, or do they diffuse in isolation? On platforms with global timelines, competing messages can suppress each other by drawing from a shared pool of user attention. Telegram lacks a global feed, but channels may still compete if they share overlapping subscriber bases or if user attention is limited.
This section examines whether competition occurs in Telegram by comparing predicted and observed behavior for pairs of overlapping cascades. We define competition formally, derive competing diffusion dynamics from the delay-driven model, and test whether these dynamics match empirical data. The findings reveal that competition is almost entirely absent. Cascades that overlap in time evolve independently, and one typically dominates from the start without being overtaken. This isolation reflects Telegram’s architectural separation of channels and the lack of shared attention mechanisms.
6.1. Definitions of Competition
Two cascades compete if their growth affects each other. Competition can manifest in several ways. One cascade may slow the growth of another by capturing attention that would otherwise go to the competitor. One cascade may overtake another by accelerating while the competitor stalls. Or both cascades may suppress each other symmetrically, resulting in slower growth for both compared to what they would achieve in isolation.
We focus on pairs of cascades that overlap in time, meaning their active periods share a substantial temporal window. Two cascades are considered overlapping if the intersection of their temporal spans exceeds a threshold, which we set at 120 days. For each pair, we define the following quantities:
The competing cumulative curves and describe the growth of cascades A and B under competition. If competition is present, these curves differ from the independent growth curves and that would occur if the cascades evolved in isolation.
The crossing time is the earliest time at which . If the curves never intersect, is undefined. The crossing time indicates when one cascade overtakes another in total accumulated attention.
The winner is the cascade with the larger final cumulative count. Specifically, cascade A wins if , where is the end of the observation period. If no crossing occurs, the winner is determined from the start and never changes.
These definitions allow us to distinguish three competition scenarios. In the dominance scenario, one cascade leads throughout the entire overlap period and the other never catches up. In the overtaking scenario, one cascade starts behind but eventually crosses and surpasses the other. In the symmetric suppression scenario, both cascades grow slower than they would independently, but neither overtakes the other.
We test for competition by comparing predicted and observed crossing times and winners. The predicted values are derived from the delay-driven model assuming that attention is shared between cascades. The observed values are computed directly from empirical cumulative curves. If the model accurately captures competition, predicted and observed crossing times should agree. If competition is absent, observed curves will show dominance even when the model predicts crossing.
6.2. Competition Based on Delay-Driven Intensities
We model competition by assuming that the forwarding intensities of two cascades are modulated by their relative attractiveness. Let and denote the independent forwarding intensities derived from the delay distributions fitted in Section 4. These intensities represent the rate at which each cascade would accumulate forwards if it evolved in isolation.
Under competition, the effective intensities are reduced by a factor that depends on the share of attention each cascade commands. We define attention weights and that capture the relative prominence of each cascade at time . The competing intensities are then:
The attention weights and are modeled as a weighted combination of instantaneous intensity and accumulated size:
The parameter controls the competition mechanism. When , attention is proportional to current forwarding speed, favoring cascades with high instantaneous activity. When , attention is proportional to cumulative size, favoring cascades that have already accumulated many forwards. Intermediate values blend both mechanisms.
We use as the default, which assumes that users are more likely to forward messages from cascades that are currently active rather than from those that are merely large. This choice reflects the hypothesis that competition operates through immediate visibility rather than historical popularity.
The competing cumulative curves are obtained by integrating the competing intensities:
In discrete time, we approximate these integrals as cumulative sums over a time grid. The predicted crossing time is computed by finding the earliest where .
This model assumes that competition is symmetric and operates through a shared attention pool. If cascades truly compete, the predicted competing curves should differ from the independent curves, and the predicted crossing times should match observed behavior. If cascades do not compete, the observed curves should remain close to the independent predictions, and predicted crossings should fail to materialize.
6.3. Empirical Results: Dominance and Isolation
We analyze 30 pairs of overlapping cascades selected to maximize both cascade size and temporal overlap. Each pair shares at least 120 days of concurrent activity. For each pair, we compute predicted and observed competing curves using the model defined in Section 6.2 and compare their crossing times and final winners.
Table 5 summarizes the results across all pairs.
Table 5.
Competition analysis summary for 30 cascade pairs.
The most striking result is the near-absence of competitive overtaking during active growth. Six pairs (20%) exhibit observed crossings, but these occur predominantly late in the cascade lifecycle: median crossing time is 79 days into the overlap window, compared to peak activity occurring within the first 20–30 days for most cascades (as evidenced by λ(t) peaks in Section 4). Only one pair (pair 0, Figure 18) crosses early (12 days), and this crossing coincides with the initial burst of activity rather than sustained competitive acceleration. The remaining five crossings occur at 61–448 days, well into the dormant tail phase when forwarding rates have declined to near-zero levels (Figure 15).
Figure 18.
Competing diffusion with early crossing (cascades 52910503_1452176529 vs. 52910503_1452176559). Observed curves (solid) cross at 12 days, coinciding with initial activity burst. After crossing, both cascades track each other closely with synchronized growth, indicating shared subscriber base but no sustained competition. Predicted curves (dashed) underestimate both cascades’ growth.
Critically, these late crossings do not reflect organic competitive dynamics. Examining the temporal distribution of crossings reveals clustering around administrative reposting events (step-like jumps in cumulative curves, as documented in Section 5.2).
In contrast, the competition model predicts crossings for 12 pairs (40%), including 8 pairs where predicted crossing occurs during peak activity (<106 s). These early crossings fail to materialize empirically. Where observed crossings do occur, their timing systematically lags predictions by 1–2 orders of magnitude in delay time.
The winner prediction accuracy is 100 percent, but this reflects a trivial outcome rather than model success. Since no observed crossings occur, the final winner is always the cascade that led from the start. The model correctly predicts the winner whenever it predicts no crossing, but it incorrectly predicts overtaking in 40 percent of cases.
Figure 18 shows a pair where both cascades grow in near-perfect synchrony. Cascades A and B (both from the same channel 52910503) accumulate forwards at almost identical rates throughout the overlap period. The observed curves (solid lines) track each other closely, with A maintaining a slight lead. The predicted curves (dashed lines) suggest modest competition with A pulling further ahead, but the observed behavior shows no suppression or divergence. Both cascades grow as if the other does not exist. This synchrony indicates that the cascades draw from non-overlapping or non-competing subscriber populations.
Figure 19 presents a pair with moderate dominance. Cascade A leads throughout, reaching approximately 0.0015 competing forwards by the end of the period, while cascade B reaches 0.0011. The predicted curves suggest that B should close the gap and nearly catch A by s, but the observed curves show that B never gains ground. The gap remains roughly constant in absolute terms, indicating that both cascades grow independently at rates determined by their own delay distributions rather than by competition.
Figure 19.
Moderate dominance without overtaking (cascades 52910503_1452176559 vs. 52910503_1452176486). Cascade A maintains consistent lead throughout overlap period. Predicted convergence fails to materialize in observed data, indicating independent growth trajectories.
Figure 20 illustrates extreme dominance. Cascade A accumulates nearly 0.010 competing forwards, while cascade B barely exceeds 0.0005. The predicted curves show B starting to grow after a long delay, but its predicted growth is far too optimistic. The observed curve for B is almost flat, indicating that it receives minimal forwarding activity regardless of A’s behavior. This pattern is common when one cascade originates from a highly active channel and the other from a less prominent source. The disparity in attention is so large that no competition mechanism can equalize their trajectories.
Figure 20.
Extreme dominance with minimal secondary cascade growth (cascades 52910503_1503108639 vs. 52910503_1452176486). Cascade B remains nearly dormant while A accumulates substantial forwards, demonstrating absence of competitive suppression.
Figure 21 shows a cross-channel pair where cascade A (channel 52910503) dominates cascade B (channel 77868411). The predicted model suggests that B will grow steadily and remain relevant throughout the overlap period, but the observed curve for B is nearly zero. Channel 77868411 operates in a different ecosystem with minimal overlap with channel 52910503. As a result, A’s dominance does not suppress B; rather, B simply has no independent momentum to begin with. The cascades evolve in isolation, and the lack of crossing reflects channel separation rather than active competition.
Figure 21.
Cross-channel isolation (cascade 52910503_1503108639 vs. 77868411_1444495233). Channels operate in separate ecosystems with no shared attention pool. Observed cascade B shows near-zero growth independent of cascade A’s trajectory.
Figure 22 shows the latest observed crossing (203 days). Cascade B overtakes A at 1.76 × 10⁷ s, far beyond both cascades’ peak activity periods (which occur before 106 s based on λ(t) in Section 4). The crossing coincides with a sharp step-like jump in B’s cumulative curve—the signature of administrative bulk reposting (Section 5.2)—rather than gradual competitive acceleration. The predicted model anticipates crossing at 106 s during peak activity, but this fails to materialize. The observed late crossing reflects exogenous channel management decisions, not the organic competitive dynamics the model attempts to capture.
Figure 22.
Delayed convergence without competitive dynamics (cascades 52910503_1503108639 vs. 94644198_1483554092). Late-stage convergence likely reflects administrative reposting rather than organic competition, as predicted crossing patterns do not match observed behavior.
The six observed crossings (Table 6) reinforce rather than contradict the conclusion that organic competition is absent. Five of six crossings occur after 60+ days, when cascades have entered dormant phases with near-zero forwarding rates. The single early crossing (pair 0, 12 days) occurs during the initial activity burst when both cascades are growing rapidly from the same channel (52910503), suggesting shared subscriber influx rather than competitive suppression. Critically, no crossings exhibit the canonical competitive pattern: gradual acceleration of the trailing cascade at the expense of the leader during peak activity. Instead, late crossings align temporally with administrative reposting events, as evidenced by step-like jumps in cumulative curves (Figure 22). The absence of early-stage competitive overtaking reflects Telegram’s structural isolation of channels, as detailed below.
Table 6.
Observed crossings: timing and characteristics.
6.4. Why Competition Fails to Emerge in Telegram
The near-absence of observed early-stage competition may reflect Telegram’s structural isolation of channels, though we cannot definitively rule out alternative explanations. Our competition test relies on a proxy mechanism (shared attention proportional to λ(t)) without direct measurement of audience overlap between channels. Telegram’s architecture suggests channels operate independently, but definitive assessment would require subscriber-level data showing which users follow multiple competing channels. We find no evidence for the specific speed-based competition proxy tested here. Whether other competition mechanisms operate—such as topic substitutability or cross-posting network effects—remains an open empirical question.
A second factor is the absence of algorithmic recommendations that link cascades. On platforms with recommendation engines, users who engage with one piece of content are often shown related or competing content. This creates indirect competition, where success in one cascade can suppress another by redirecting user attention. Telegram has no such mechanism. Users discover content exclusively through the channels they subscribe to, and there is no algorithmic layer that connects or compares different cascades.
A third factor is the low visibility of forwarding activity. On Twitter, retweeting a message broadcasts it to the retweeter’s followers, who may include subscribers of competing sources. This creates network overlap that facilitates competition. On Telegram, forwarding typically occurs within private groups or personal chats, or it re-publishes the message to another channel. In either case, the forwarding action is less visible and does not create a shared audience that must choose between competing messages.
The structural isolation of Telegram cascades has important implications for diffusion modeling. Models that assume shared attention pools or competitive dynamics will systematically fail in Telegram. The delay-driven model developed in Section 4, which treats cascades as independent, is structurally correct for this platform. Attempts to extend the model with competition terms, as explored in this section, add complexity without improving predictive accuracy.
The absence of competition also affects content strategy for Telegram channel operators. On platforms with competition, timing is critical. Posting at the wrong moment can result in suppression by competing content. On Telegram, timing matters less because channels operate in separate spheres. A channel’s growth depends on its own subscriber base, content quality, and delay distribution, but not on what other channels are doing at the same time.
Finally, the lack of competition suggests that Telegram diffusion is less susceptible to certain forms of manipulation. On competitive platforms, coordinated campaigns can suppress rival content by flooding the feed. On Telegram, such campaigns have limited effect because they cannot displace content in channels they do not control. Each channel maintains its own audience and its own growth trajectory, largely independent of external interference.
These findings position Telegram as a diffusion environment defined by isolation rather than competition. Cascades coexist without interacting, and dominance is determined at the outset by channel size and content appeal rather than by dynamic competitive processes. This structure has both advantages and limitations, which we discuss further in Section 7.
7. Discussion
This study provides the first comprehensive analysis of information diffusion in Telegram based on large-scale empirical data. The findings reveal fundamental structural and dynamic differences between Telegram and platforms commonly studied in the diffusion literature. This section discusses these differences, their implications for modeling and forecasting, the nature of organic diffusion in Telegram, and the limitations of our approach.
7.1. Platform Architecture and Modeling Implications
Telegram’s diffusion dynamics differ fundamentally from Twitter and Reddit due to architectural design. Twitter and Reddit organize information through social graphs and algorithmic feeds that prioritize recent, popular content. Users encounter messages through follower networks, creating multi-hop retweet chains and rapid viral cascades with median delays measured in minutes to hours.
Telegram operates as a broadcast platform. Channels publish content to subscriber lists without algorithmic ranking. Users encounter messages chronologically within subscribed channels and forward them directly from the source. This architecture produces three structural consequences:
First, perfect star topology. All forwards connect directly to original messages (Section 5.1). Multi-hop propagation—common in Twitter where retweet chains reach 5+ hops—does not occur. This validates the independence assumption underlying delay-driven models: each forward is an independent draw from a delay distribution rather than a node in a contagion network.
Second, heavy-tailed asynchronous delays. Without algorithmic promotion, users discover content by scrolling channel feeds at irregular intervals. Median forwarding delay reaches 9.6 days; 90th percentile exceeds 71 days (Table 4). This contrasts sharply with Twitter’s minute-scale dynamics and requires fundamentally different parametric distributions (Weibull k < 1 vs. exponential).
Third, isolation between cascades. Competing messages cannot intersect at intermediate nodes or suppress each other through shared follower networks. Cascades evolve independently within separate channel ecosystems. The absence of observed competitive acceleration (Section 6) reflects this structural isolation rather than parameter misspecification in competition models.
These findings demonstrate that platform architecture determines diffusion dynamics. Models developed for Twitter—independent cascade, linear threshold, epidemic SIR—assume network-based contagion incompatible with Telegram’s broadcast structure. Conversely, Telegram’s delay-driven model would fail on Twitter, where cascading retweets and algorithmic feeds create temporal correlations that violate the independence assumption.
The implication is that diffusion modeling requires platform-specific approaches. Researchers cannot simply apply Twitter-trained models to new platforms without validating structural assumptions. Future work should develop a taxonomy of platform architectures—broadcast (Telegram, WhatsApp), social graph (Twitter, Weibo), algorithmic feed (TikTok, Instagram)—and derive appropriate model families for each.
Administrative bulk reposting (Section 5.2) introduces a separate challenge. Approximately 15–20% of cascades exhibit step-like synchronized bursts incompatible with continuous delay distributions. These require event-based models distinguishing organic user-driven diffusion from institutional content management. Automated detection of administrative patterns remains an open problem.
7.2. Limitations and Future Directions
This study analyzes Telegram diffusion during 2014–2020 using the Pushshift dataset. Telegram introduced significant features post-2020—including reactions (2021), Stories (2023), and enhanced bot APIs—that may alter diffusion patterns. Validation on contemporary data is necessary to assess model robustness across platform evolution.
Our analysis focuses on the largest 5000 cascades (≥50 forwards) to ensure statistical reliability of delay distribution fitting. Smaller cascades may exhibit different dynamics, and the generalizability of findings to microcascades (<10 forwards) remains unverified.
The delay-driven model assumes forwarding events are independent. This holds for organic diffusion (median RMSE 18.4, Table 3) but fails catastrophically for administrative cascades (Section 5.2). Automated classification of organic versus administrative patterns using cascade shape features could enable hybrid modeling approaches.
Competition analysis examined 30 cascade pairs with substantial temporal overlap. Six pairs (20%) exhibited crossings, but these occurred late in the cascade lifecycle (median 79 days) rather than during peak activity. Whether early competition exists among cascades with stronger thematic overlap or shared subscriber bases requires targeted investigation. Cross-platform comparative studies—applying identical methodologies to WhatsApp, Signal, and Telegram simultaneously—would isolate the causal effects of architectural features on diffusion structure.
Our cascade reconstruction assumes forwarding metadata accurately captures provenance chains. If Telegram’s API systematically collapses multi-hop chains to direct links, observed star topology could reflect measurement rather than behavior. We validate this assumption by examining metadata fields and conducting falsification checks (Section 3.2) but cannot exclude subtle misattribution.
Delay distribution fitting assumes forwarding events are independent. This holds for organic cascades but fails for administrative bulk reposting. We operationalize this distinction using three quantitative metrics computed from inter-event intervals:
Classification criterion: A cascade is classified as administrative if it satisfies:
(entropy < 0.35 AND burst_fraction > 0.4) OR
(entropy < 0.25) OR
(burst_fraction > 0.7)
- where entropy is normalized Shannon entropy of log-interval distribution (range [0, 1]), and burst_fraction is the proportion of forwarding events occurring within 1 h windows. This automated classifier yields 17.4% administrative prevalence, consistent with visual inspection estimates (15–20%). Administrative cascades exhibit median RMSE = 94.3 vs. RMSE = 18.4 for organic, validating the separation.
Competition analysis examined only 30 pairs with temporal overlap. The null result (no early crossings) could reflect either genuine independence or insufficient statistical power. Stronger tests would measure actual subscriber overlap and test competition within high-overlap subsets.
Year-by-year analysis (2015–2019) reveals median forwarding delays increasing from 9 to 112 days. This reflects platform maturation and longer cascade lifespans rather than fundamental changes in diffusion mechanisms. The prevalence of heavy-tailed delays and star topology (depth = 1) persists throughout the observation period. Administrative pattern prevalence remains stable at 15–18% across all years, suggesting consistent institutional usage patterns.
7.3. Comparison with Prior Work
Table 7 positions our findings relative to existing diffusion research. Prior work on Twitter, Weibo, and Reddit—platforms with social graphs or threaded discussions—consistently reports multi-hop propagation, competitive dynamics between concurrent cascades, and network-based contagion models (Zhang et al., 2016 [2]; He et al., 2024 [20]).
Table 7.
Structural differences between Telegram and prior platform studies.
Telegram exhibits fundamentally different characteristics. The perfect star topology (depth = 1 for all cascades, 0% multi-hop edges) has no precedent in the diffusion literature. Studies of Twitter and Weibo document cascading retweet chains where information propagates through intermediate nodes (Zhang et al., 2016 [2]), while our findings show all forwards connect directly to original messages.
The temporal scale also differs. Twitter and Weibo research examines dynamics over hours to days (Chen et al., 2024 [25]; Kumar et al., 2020 [3]), whereas Telegram’s median forwarding delay of 9.6 days—potentially one to two orders of magnitude slower—reflects asynchronous discovery across independent channels rather than rapid viral contagion.
Competition dynamics diverge similarly. Prior work documents competitive suppression where concurrent cascades interfere through shared user attention (He et al., 2024 [20]; Moscato and Sperlì 2022 [17]). Our finding that only 6 of 30 cascade pairs exhibit crossings—occurring late in dormant phases rather than during peak activity—suggests fundamentally different mechanisms driven by administrative reposting rather than organic competition.
These contrasts validate our central claim: platform architecture determines diffusion dynamics. Network-based models (epidemic SIR, independent cascade, linear threshold) developed for Twitter assume multi-hop propagation and node-level influence—mechanisms absent in Telegram. Our delay-driven approach treats forwards as independent parametric draws, succeeding precisely because Telegram’s broadcast structure removes network dependencies.
7.4. Practical Implications
These platform-specific diffusion dynamics have concrete implications for practitioners:
- For platform designers: Channel-based architectures like Telegram create isolated diffusion trees with predictable delay distributions, enabling proactive content moderation based on cascade trajectory forecasting. In contrast, network-based platforms require real-time monitoring of unpredictable multi-hop cascades.
- For content strategists: Telegram’s delay-driven model means visibility depends on channel subscription timing rather than viral amplification. Campaigns should focus on sustained presence and optimal posting schedules rather than initial burst strategies effective on Twitter.
- For misinformation moderators: The absence of competitive acceleration and multi-hop propagation simplifies intervention. Removing root messages immediately halts diffusion, unlike Twitter where removal may trigger compensatory sharing. However, administrative bulk reposting (17.4% of cascades) requires dedicated detection of coordinated behavior patterns.
8. Conclusions
Telegram forwarding operates under fundamentally different principles than Twitter, Reddit, or Facebook. All cascades exhibit perfect star topology with zero multi-hop propagation, invalidating network contagion models. Forwarding delays are heavy-tailed with median delays in days rather than hours, following Weibull or lognormal distributions with decreasing hazard rates. Competition between overlapping cascades does not occur, and predicted crossings based on shared attention fail to materialize. The delay-driven star diffusion model accurately predicts organic cascade growth but fails for administrative bulk reposting, which accounts for 15 to 20 percent of cascades. Platform architecture, not content quality or network position, determines diffusion dynamics. Channel-based broadcast eliminates the shared feed mechanisms that create competition and multi-hop propagation on other platforms.
Three extensions would strengthen this work. First, incorporating content features and topic classification could reveal whether different message types follow different delay distributions. Second, analyzing multi-cascade ecosystem dynamics might uncover indirect competition through aggregate attention constraints not visible in pairwise comparisons. Third, developing automated classifiers to distinguish organic from administrative diffusion would enable large-scale application of appropriate models to each regime. Replication with recent data would validate whether these patterns persist as Telegram evolves. Analysis of private groups and direct messages would test whether the model generalizes beyond public channels.
Platform design shapes diffusion more strongly than user behavior or content characteristics. Models assuming network contagion or shared attention cannot generalize across platforms with different architectures. Empirical validation is necessary to identify when structural assumptions fail. For Telegram specifically, the star topology simplifies content attribution and moderation but complicates misinformation correction by preventing fact-checks from competing for attention in shared feeds. Channel operators should focus on subscriber engagement and content quality rather than viral timing strategies effective on Twitter. As communication platforms diversify, platform-specific modeling becomes increasingly important. This work demonstrates that fundamental assumptions about information spread must be validated empirically rather than assumed universal.
Author Contributions
Investigation, data curation, K.B.; conceptualization, methodology, writing—original draft preparation, O.K.; supervision, funding acquisition, A.S.; investigation, methodology, D.C.; writing—review and editing, B.K.; data curation, investigation, V.C. All authors have read and agreed to the published version of the manuscript.
Funding
This research received no external funding.
Institutional Review Board Statement
Not applicable.
Informed Consent Statement
Not applicable.
Data Availability Statement
The complete codebase for this research, including data processing, model implementation, and visualization scripts, is freely available at https://github.com/KuznetsovKarazin/telegram-delay-driven-diffusion, accessed on 27 November 2025. This accessibility enables direct verification of our results and facilitates further extension of our work by interested researchers.
Conflicts of Interest
The authors declare no conflicts of interest.
References
- Bronstein, J.; Gazit, T.; Perez, O.; Bar-Ilan, J.; Aharony, N.; Amichai-Hamburger, Y. An Examination of the Factors Contributing to Participation in Online Social Platforms. Aslib J. Inf. Manag. 2016, 68, 793–818. [Google Scholar] [CrossRef] [Scilit]
- Zhang, Z.-K.; Liu, C.; Zhan, X.-X.; Lu, X.; Zhang, C.-X.; Zhang, Y.-C. Dynamics of Information Diffusion and Its Applications on Complex Networks. Phys. Rep. 2016, 651, 1–34. [Google Scholar] [CrossRef] [Scilit]
- Kumar, S.; Saini, M.; Goel, M.; Aggarwal, N. Modeling Information Diffusion In Online Social Networks Using SEI Epidemic Model. Procedia Comput. Sci. 2020, 171, 672–678. [Google Scholar] [CrossRef] [Scilit]
- He, Y.; Shen, S.; Zhu, L. Pattern Selection and Parameter Optimization Design of Reaction-Diffusion Information Propagation Model. Ain Shams Eng. J. 2025, 16, 103764. [Google Scholar] [CrossRef] [Scilit]
- Haile, J.M. Social Media for Diffusion of Conflict & Violence in Ethiopia: Beyond Gratifications. Int. J. Educ. Dev. 2024, 108, 103063. [Google Scholar] [CrossRef] [Scilit]
- Cheng, Z.; Zhang, J.; Xu, X.; Tai, W.; Zhou, F.; Trajcevski, G.; Zhong, T. Information Diffusion Prediction via Meta-Knowledge Learners. Inf. Sci. 2025, 707, 122034. [Google Scholar] [CrossRef] [Scilit]
- Jing, Y.; Wang, Y.; Zhai, Q.; Chen, W. Late-Stage Reversal of Negative Information Diffusion Driven by Memory Accumulation under Low Infection on Simplicial Complexes. Chaos Solitons Fractals 2025, 200, 117155. [Google Scholar] [CrossRef] [Scilit]
- Gómez-Romero, J.; Correa, J.C.; Mercado, R.P.; Abad, F.P.; Molina-Solana, M.; Fajardo, W. Pytopicgram: A library for data extraction and topic modeling from Telegram channels. SoftwareX 2025, 30, 102141. [Google Scholar] [CrossRef] [Scilit]
- Conte, D.; Iscaro, S.; Pagano, G.; Paternoster, B. Adapted Numerical Modeling for Fake News Diffusion on Social Networks. J. Comput. Appl. Math. 2026, 477, 117196. [Google Scholar] [CrossRef] [Scilit]
- Kong, X.; Shu, C.; Wang, L.; Zhou, H.; Zhu, L.; Li, J. Broad Information Diffusion Modelling for Sharing Link Click Prediction Using Knowledge Graphs. Expert Syst. Appl. 2025, 277, 127276. [Google Scholar] [CrossRef] [Scilit]
- Liu, W.; Shao, Y.; Chen, Y.; Chen, L. False Information Sources Detecting Based on an Epidemic Diffusion Model. Inf. Process. Manag. 2025, 62, 104197. [Google Scholar] [CrossRef] [Scilit]
- Xia, Y.; Jiang, H.; Mei, X.; Li, J.; Yu, S. Dynamical Analysis of a Stochastic Hyper-INPR Competitive Information Propagation Model. Chaos Solitons Fractals 2024, 185, 115073. [Google Scholar] [CrossRef] [Scilit]
- Ni, C.; Wang, B.; Song, L.; Sun, Y.; Pang, Z. Modeling the Interactive Diffusion of Information in Multilayer Networks with Simplicial Complexes. Chaos Solitons Fractals 2026, 202, 117574. [Google Scholar] [CrossRef] [Scilit]
- Kim, J.S.; Yum, B.-J. Selection between Weibull and Lognormal Distributions: A Comparative Simulation Study. Comput. Stat. Data Anal. 2008, 53, 477–485. [Google Scholar] [CrossRef] [Scilit]
- Pang, W.-K.; Leung, P.-K.; Huang, W.-K.; Liu, W. On Interval Estimation of the Coefficient of Variation for the Three-Parameter Weibull, Lognormal and Gamma Distribution: A Simulation-Based Approach. Eur. J. Oper. Res. 2005, 164, 367–377. [Google Scholar] [CrossRef] [Scilit]
- Tu, H.T.; Phan, T.T.; Nguyen, K.P. Modeling Information Diffusion in Social Networks with Ordinary Linear Differential Equations. Inf. Sci. 2022, 593, 614–636. [Google Scholar] [CrossRef] [Scilit]
- Moscato, V.; Sperlì, G. A Novel Influence Diffusion Model under Temporal and Content Constraints on Business Social Network. Telemat. Inform. 2022, 68, 101768. [Google Scholar] [CrossRef] [Scilit]
- Di Francesco, T.; Torren-Peraire, D. (Mis)Information Diffusion and the Financial Market. J. Econ. Behav. Organ. 2025, 238, 107211. [Google Scholar] [CrossRef] [Scilit]
- King, K.K. How Manipulating Information Affects Information Diffusion during Disasters: The Effects of Modifying Falsehoods versus Corrections. Decis. Support Syst. 2025, 197, 114523. [Google Scholar] [CrossRef] [Scilit]
- He, S.; Zhang, W.; Luo, J.; Zhang, P.; Zhao, K.; Zeng, D.D. Modeling the Co-Diffusion of Competing Memes in Online Social Networks. Decis. Support Syst. 2024, 187, 114324. [Google Scholar] [CrossRef] [Scilit]
- Abraham, S.S.; Lanzara, G.; Lazzaroni, S.; Masella, P.; Squicciarini, M.P. Spatial and Historical Drivers of Fake News Diffusion: Evidence from Anti-Muslim Discrimination in India. J. Urban Econ. 2024, 141, 103613. [Google Scholar] [CrossRef] [Scilit]
- Baumgartner, J.; Zannettou, S.; Squire, M.; Blackburn, J. The Pushshift Telegram Dataset. arXiv 2020, arXiv:2001.08438. [Google Scholar] [CrossRef] [Scilit]
- Baumgartner, J.; Zannettou, S.; Squire, M.; Blackburn, J. The Pushshift Telegram Dataset. Available online: https://zenodo.org/records/3607497 (accessed on 27 November 2025).
- Baumgartner, J.; Zannettou, S.; Keegan, B.; Squire, M.; Blackburn, J. The Pushshift Reddit Dataset. arXiv 2020, arXiv:2001.08435. [Google Scholar] [CrossRef] [Scilit]
- Chen, A.; Liu, H.; Su, G. Extracting the Diffusion Dynamics of Crisis Information on Online Social Networks: Model and Application. Int. J. Disaster Risk Reduct. 2024, 101, 104226. [Google Scholar] [CrossRef] [Scilit]
- Sun, X.; Wang, Y.; Chai, Y.; Liu, Y. Dynamic Analysis and Control Strategies of the SEIHR Rumor Diffusion Model in Online Social Networks. Appl. Math. Model. 2024, 134, 611–634. [Google Scholar] [CrossRef] [Scilit]
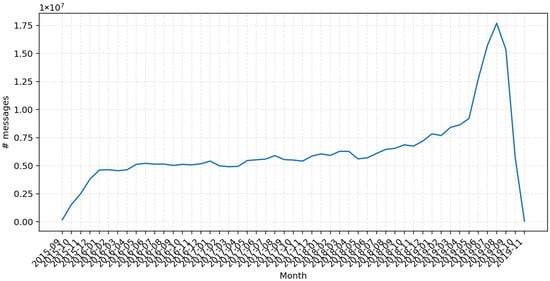
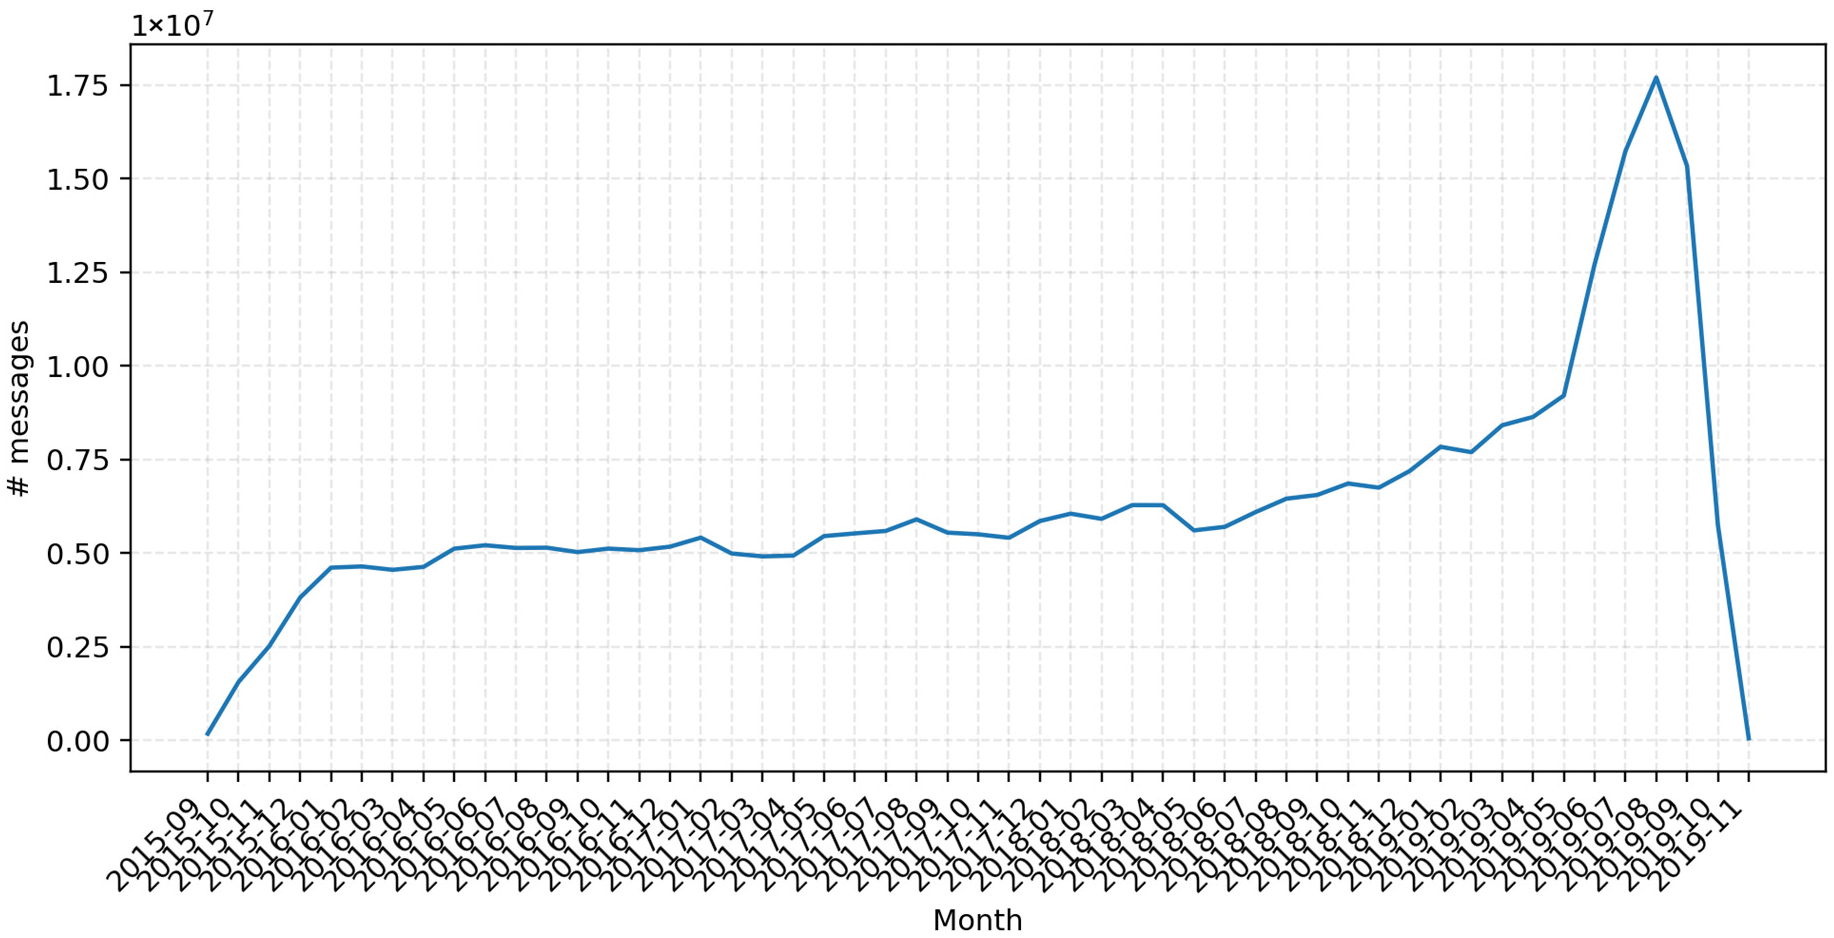
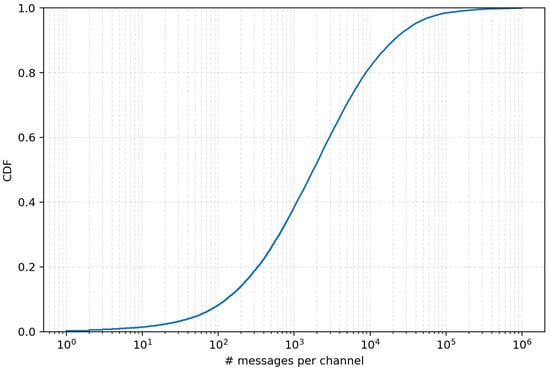
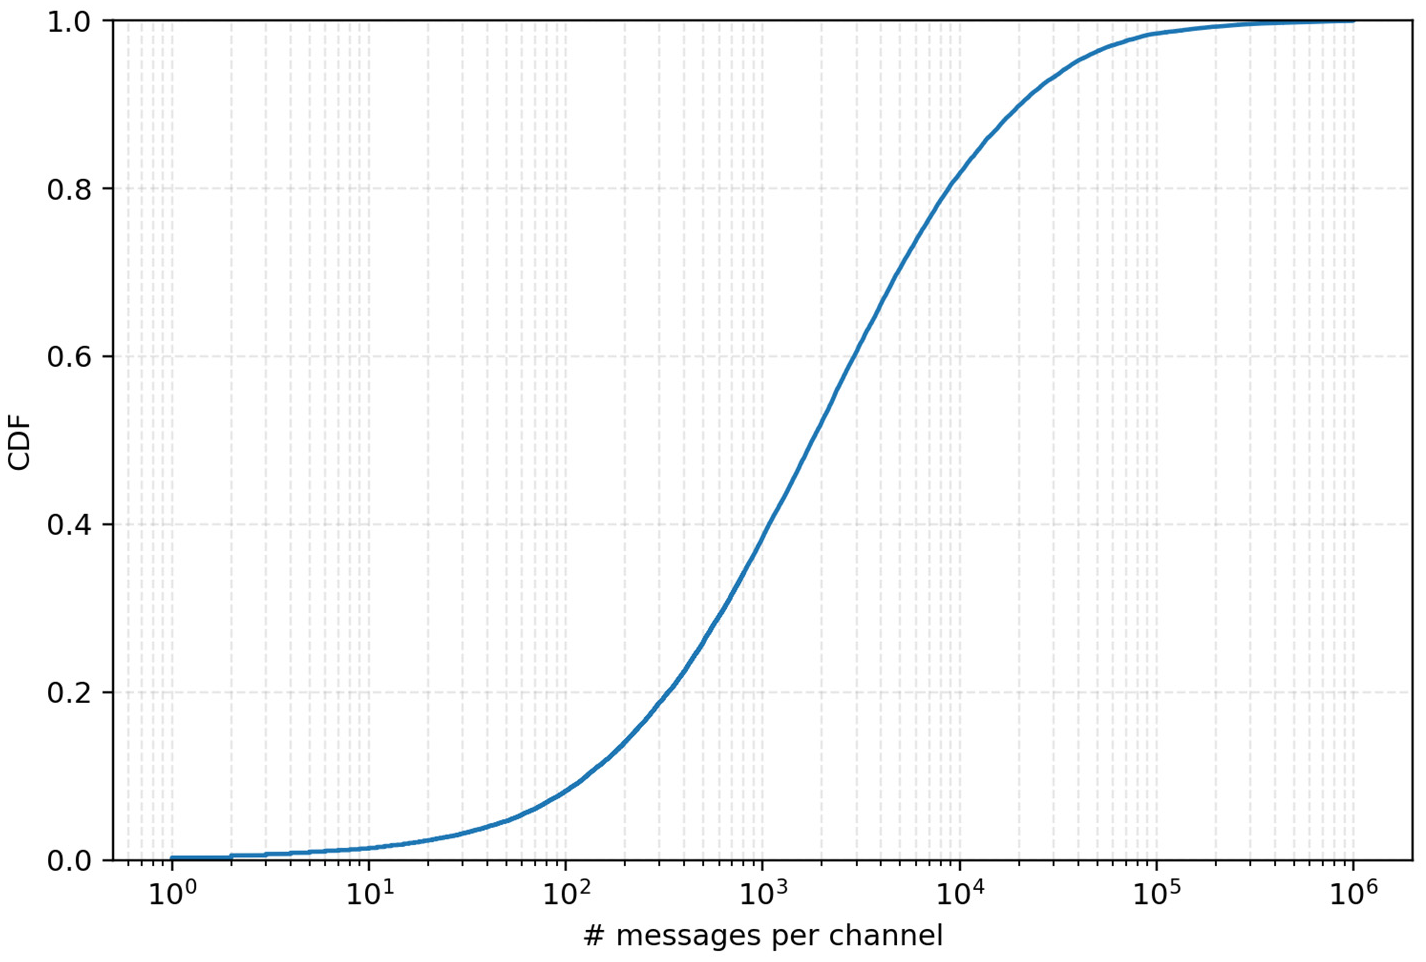
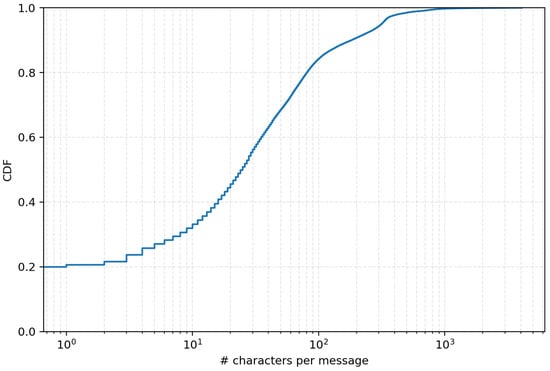
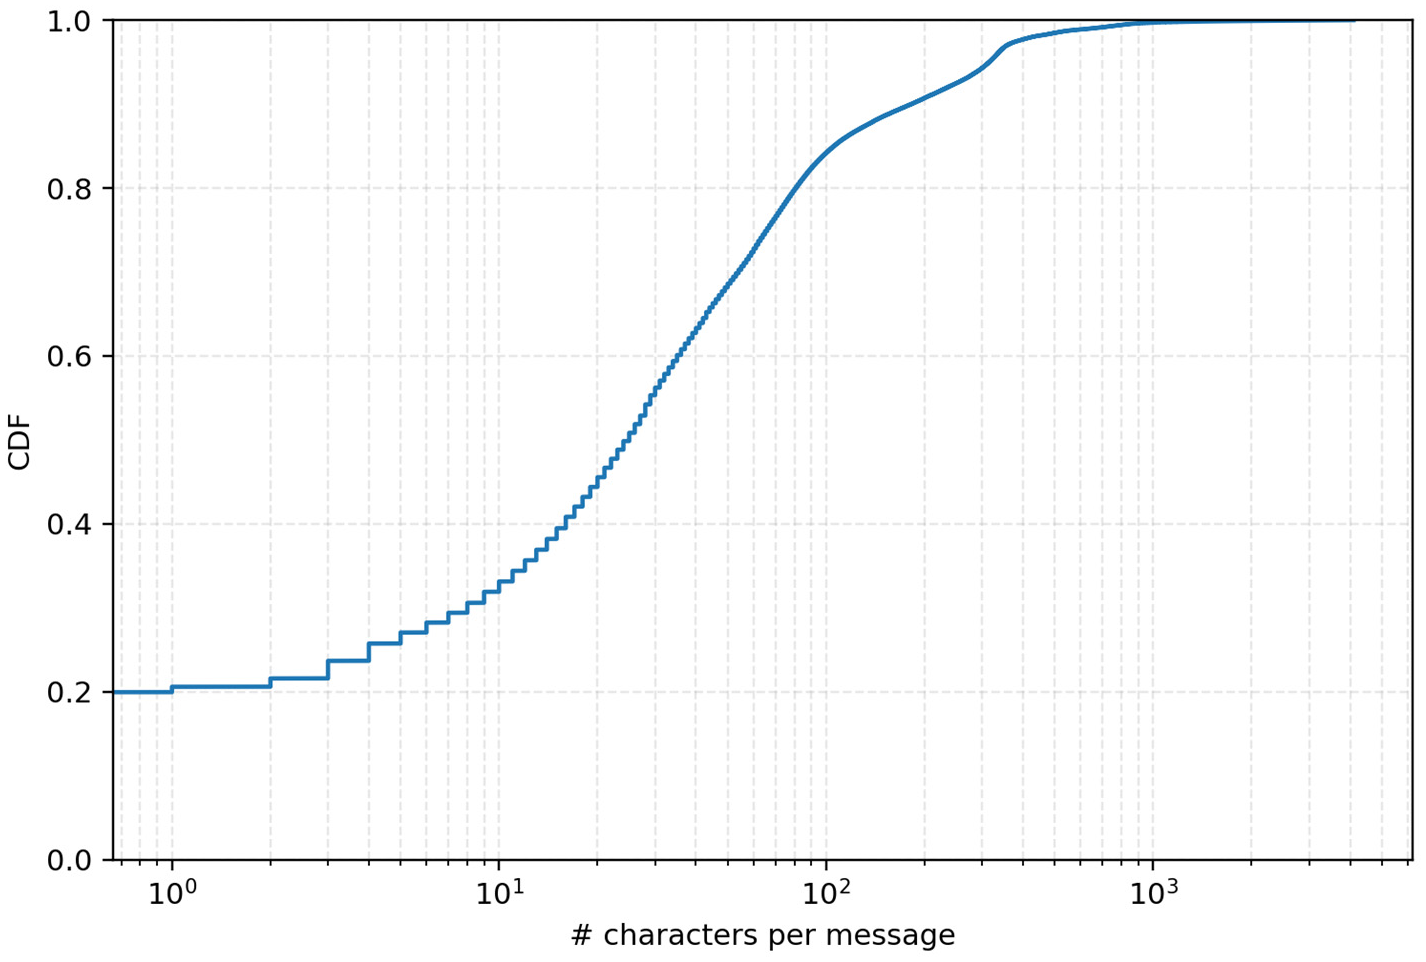
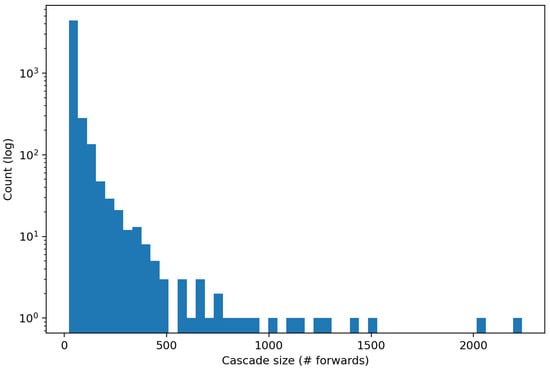
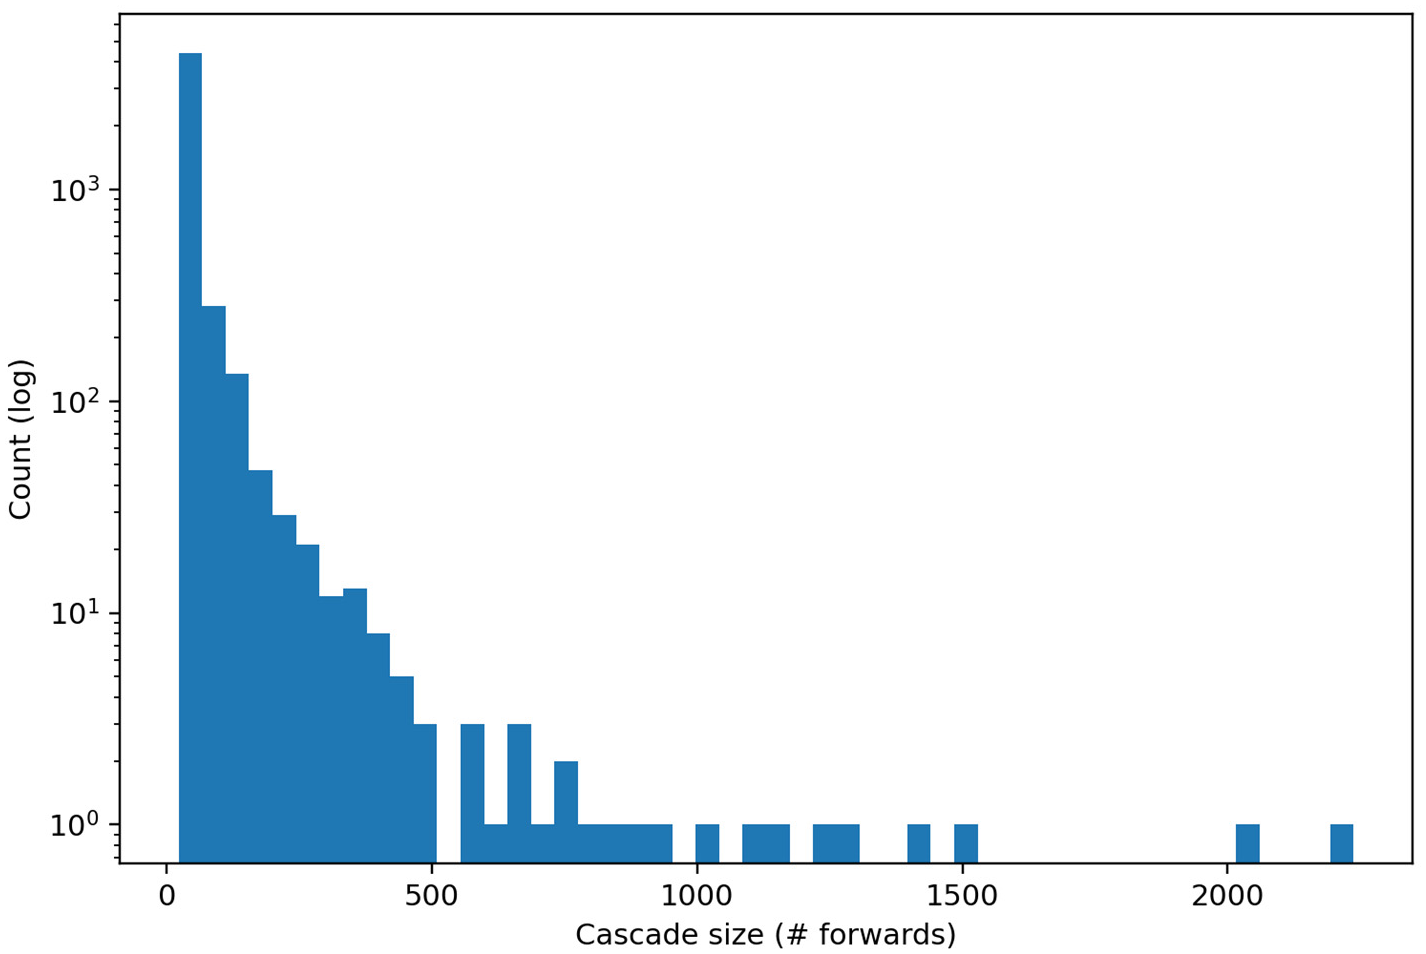
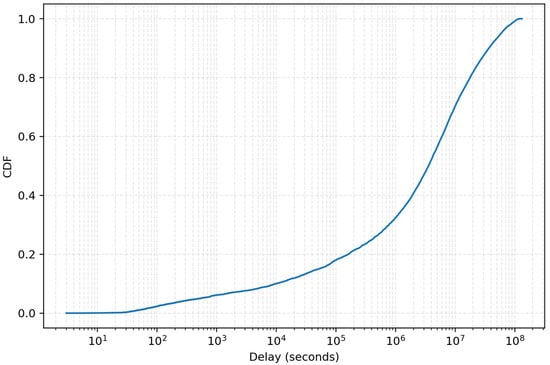
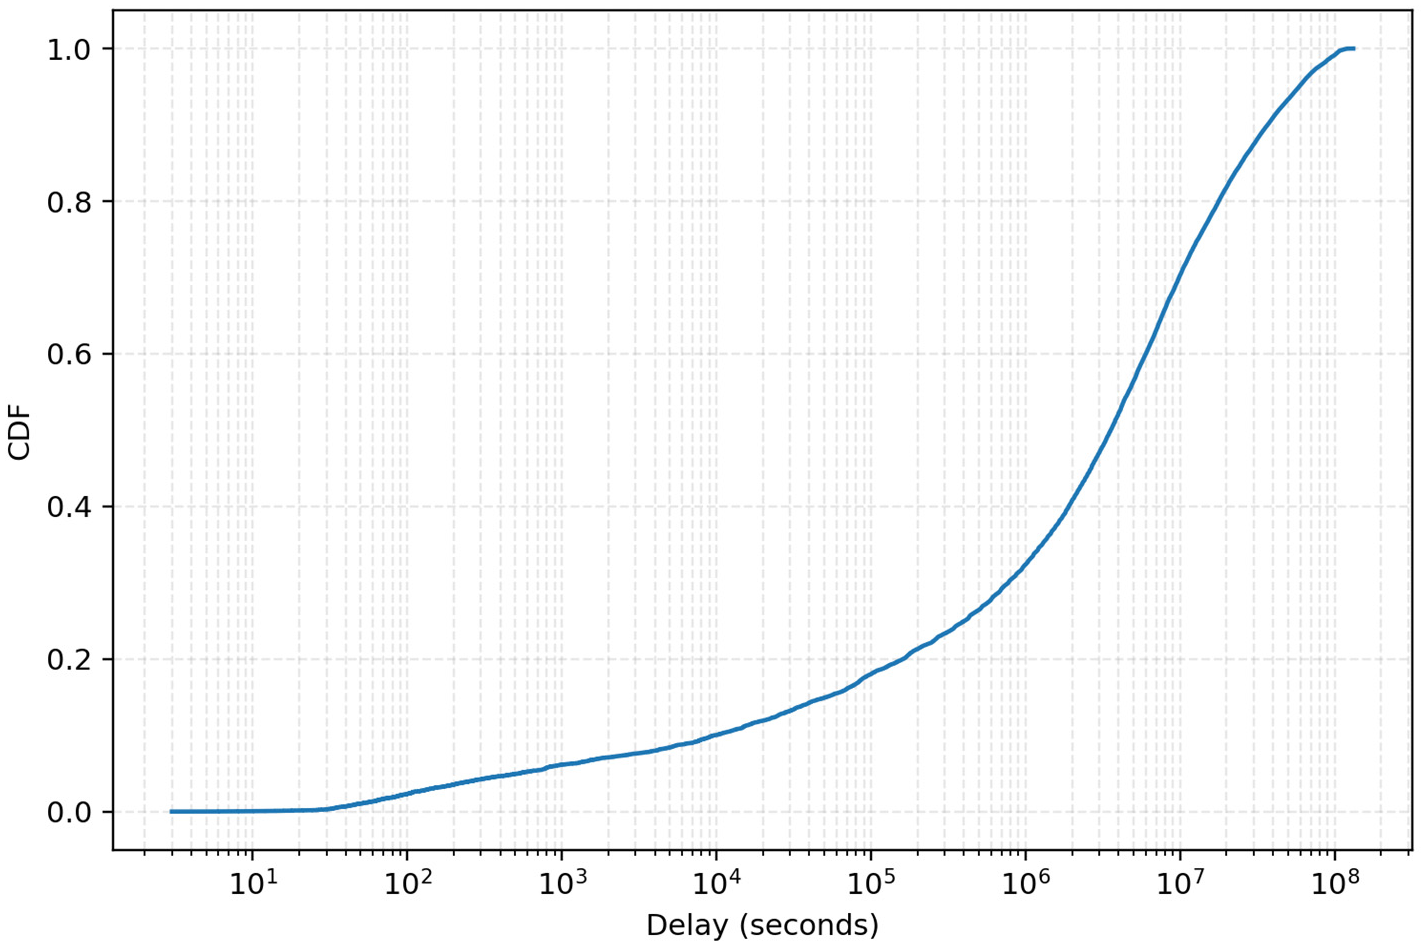
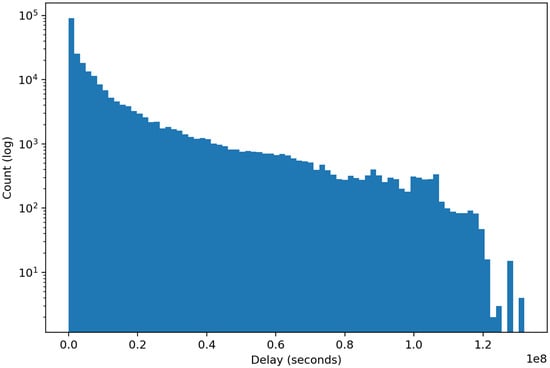
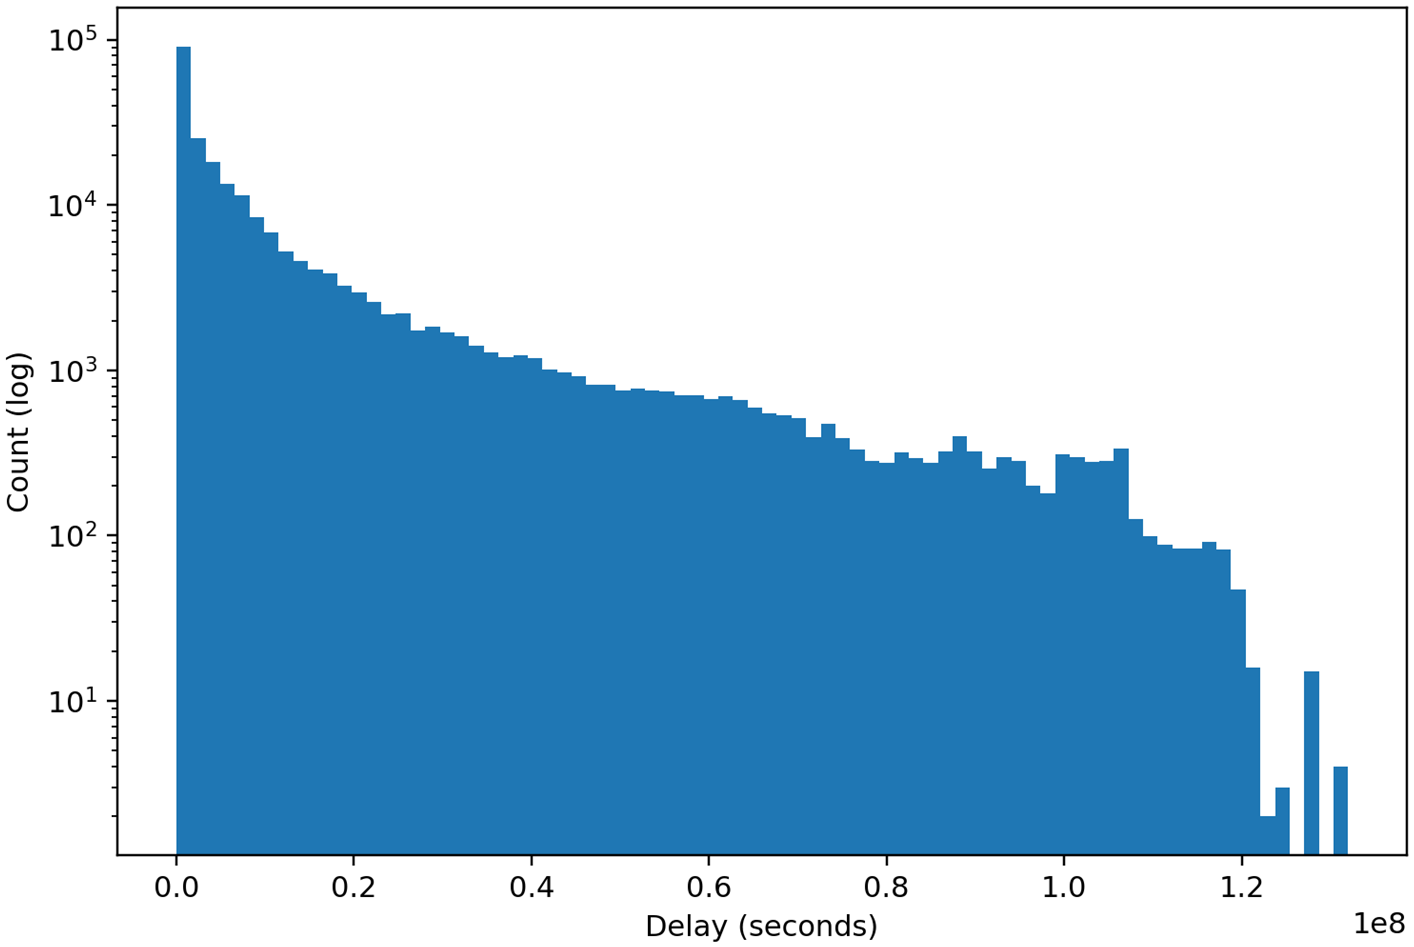
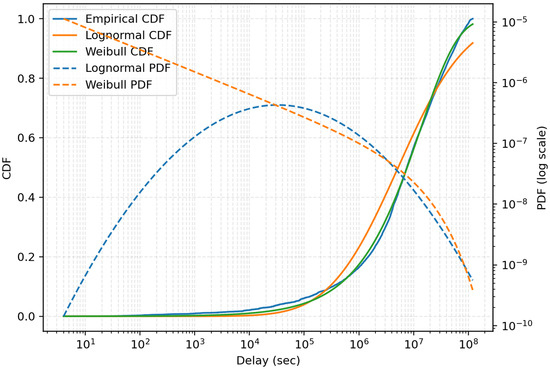
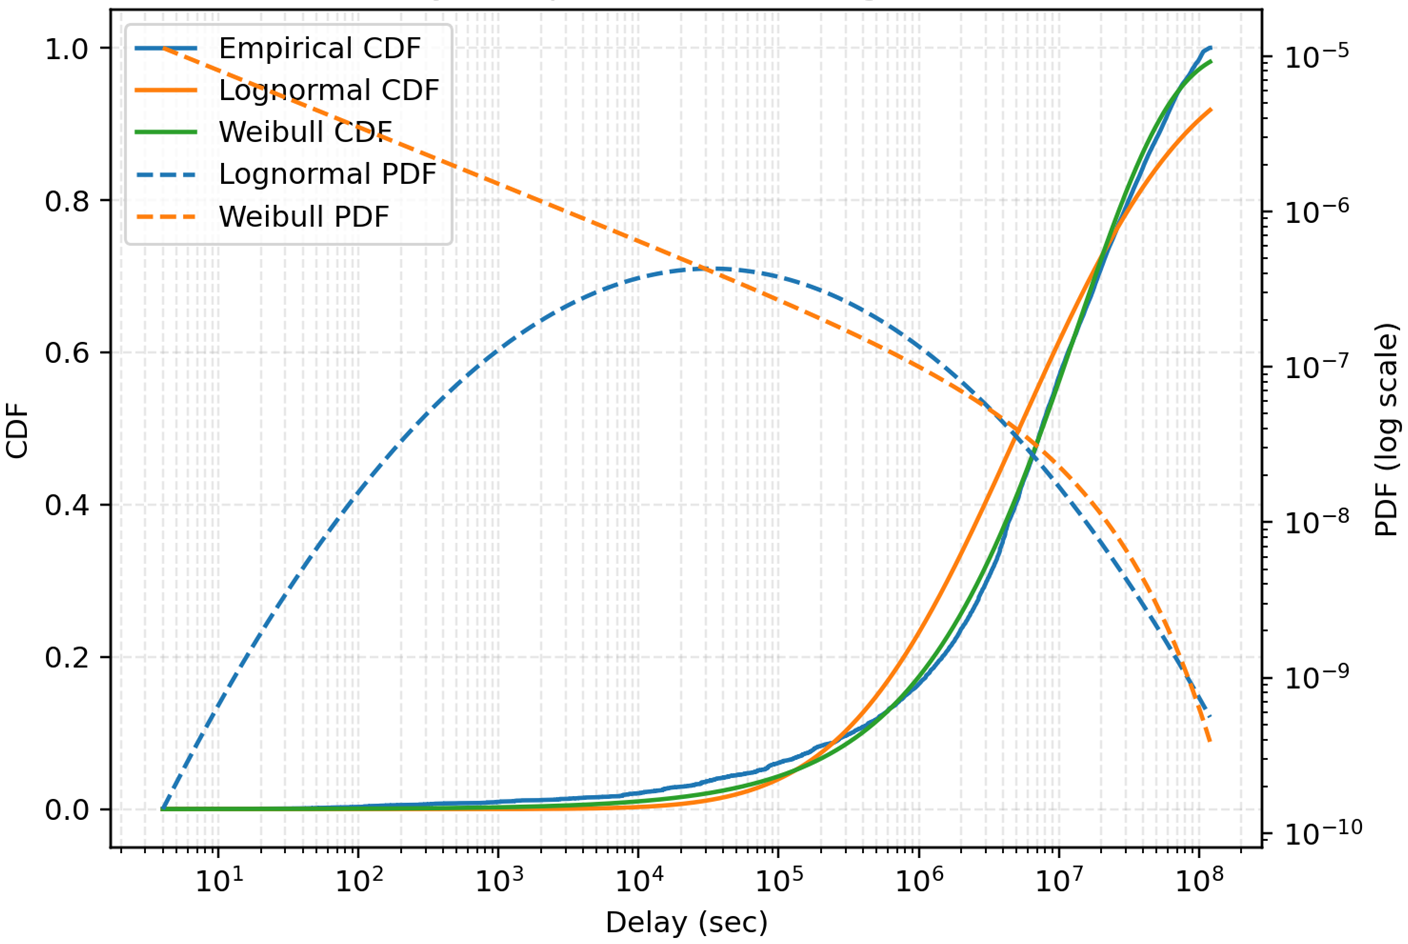
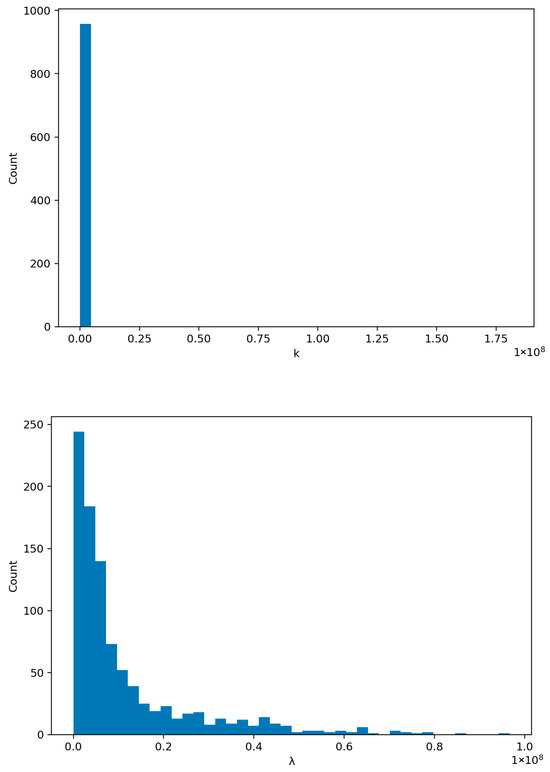
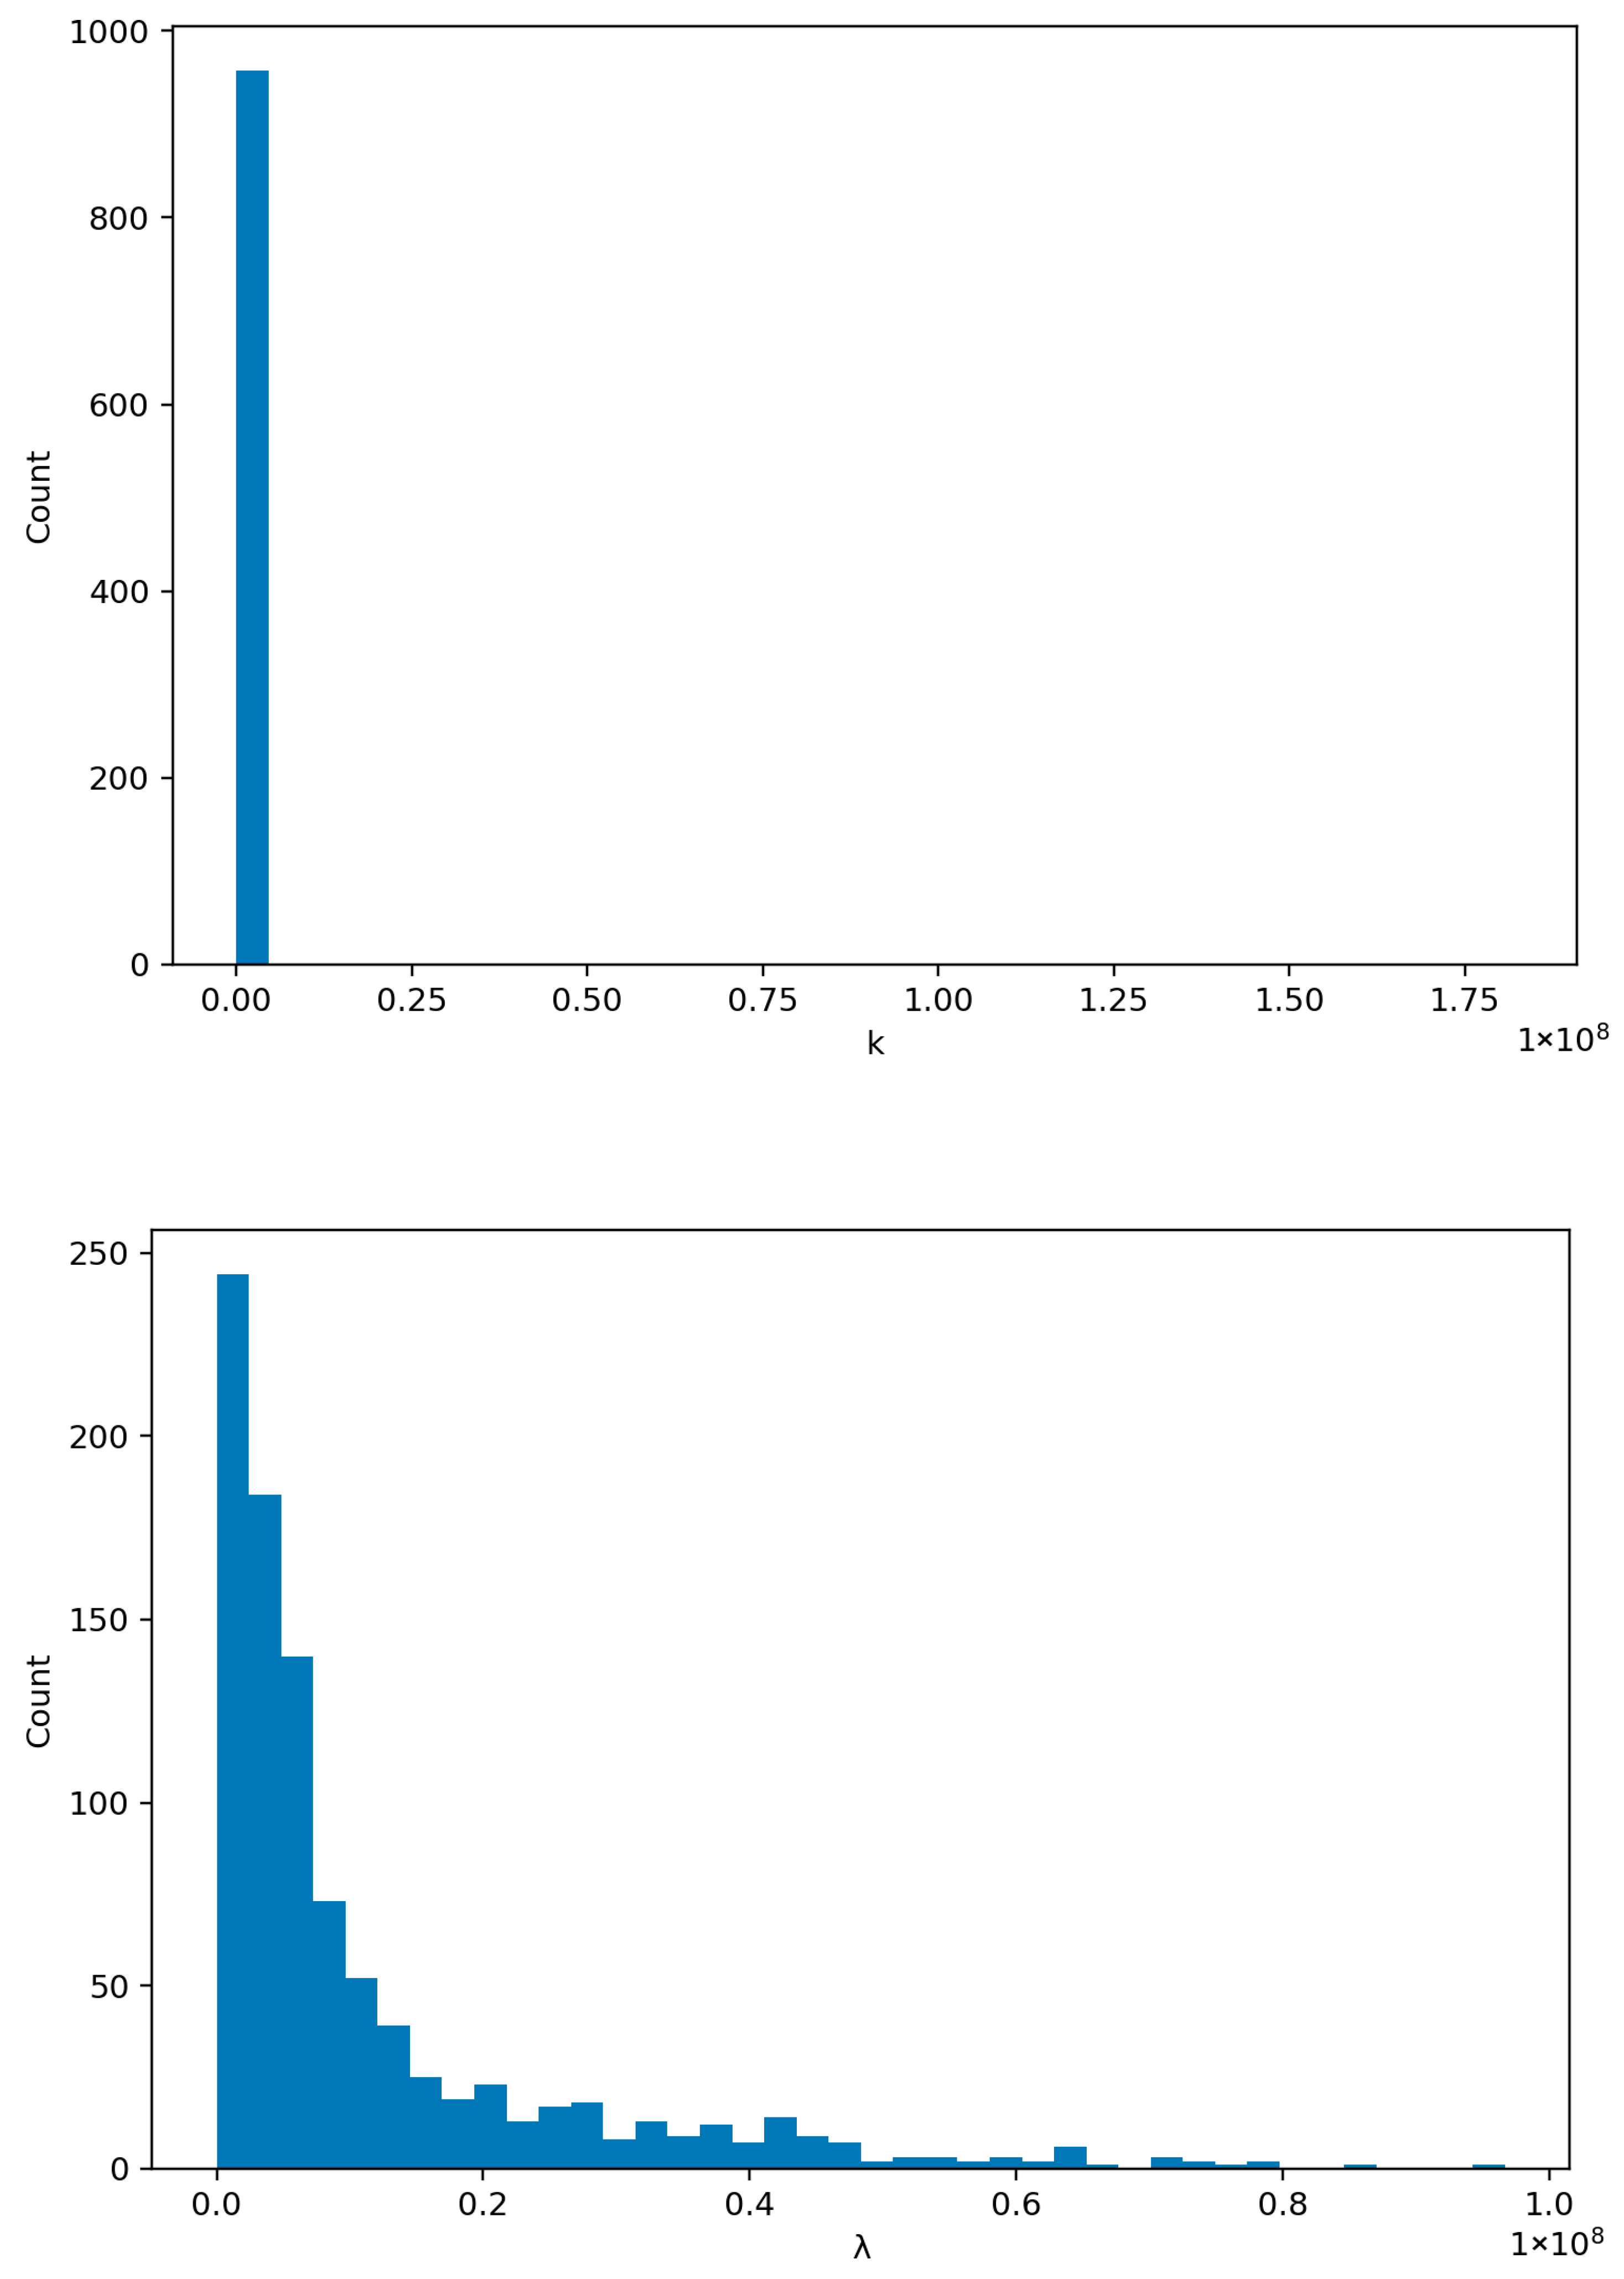
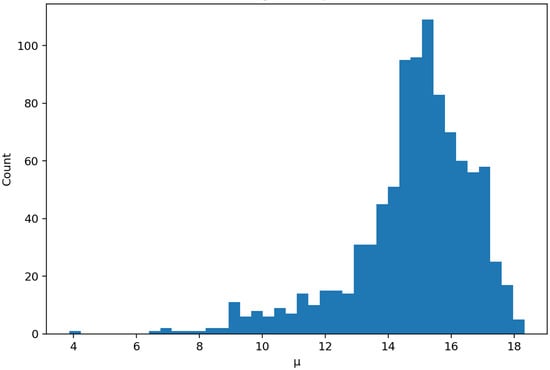
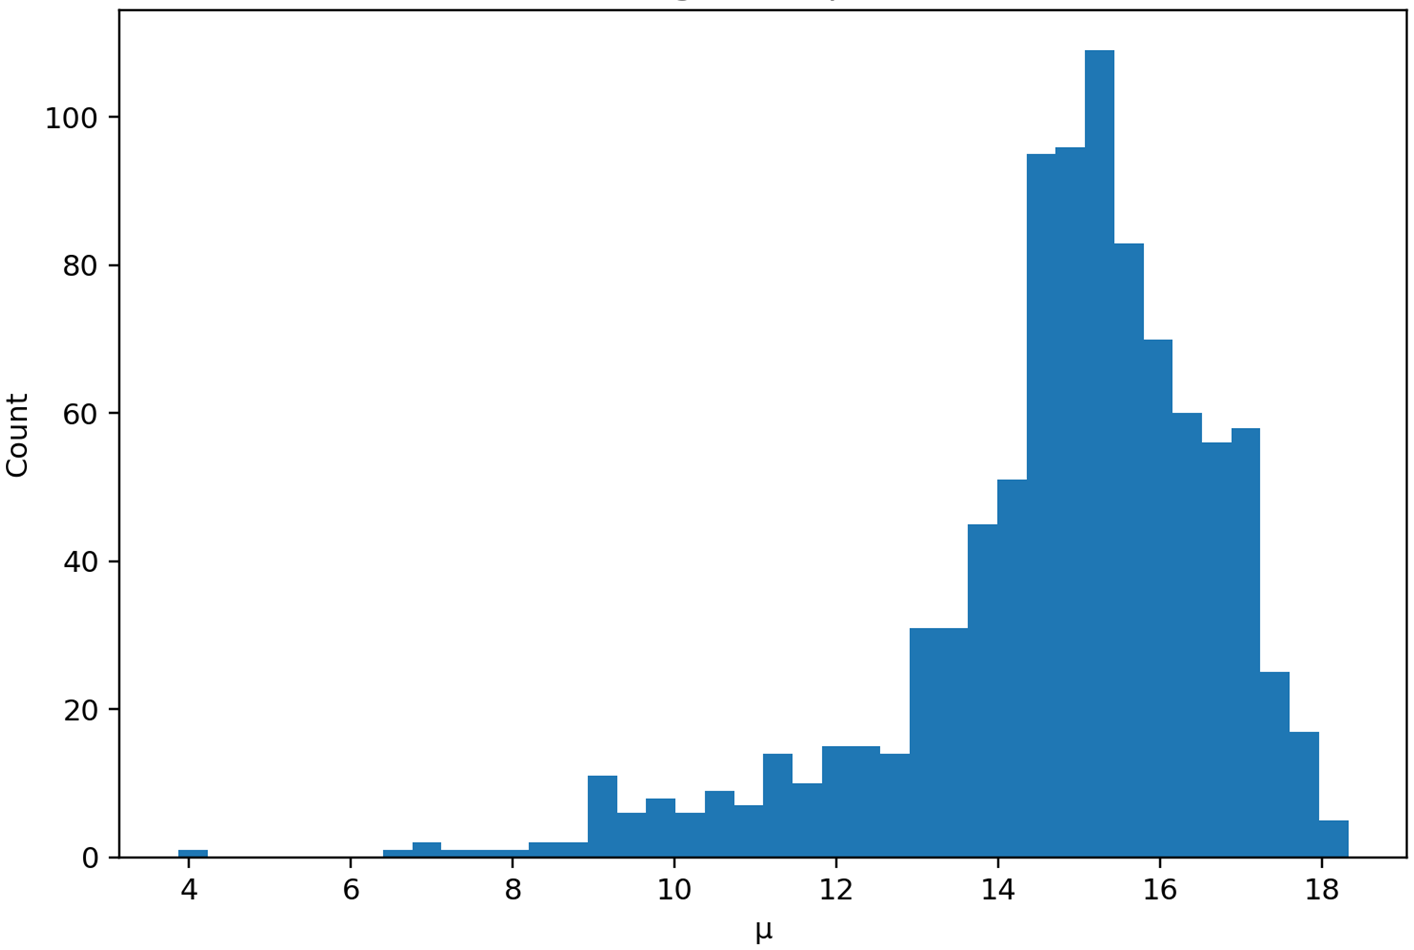
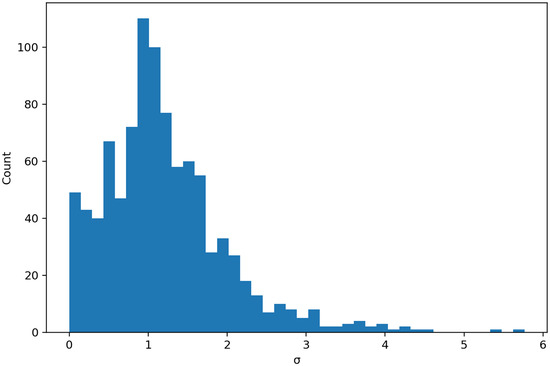
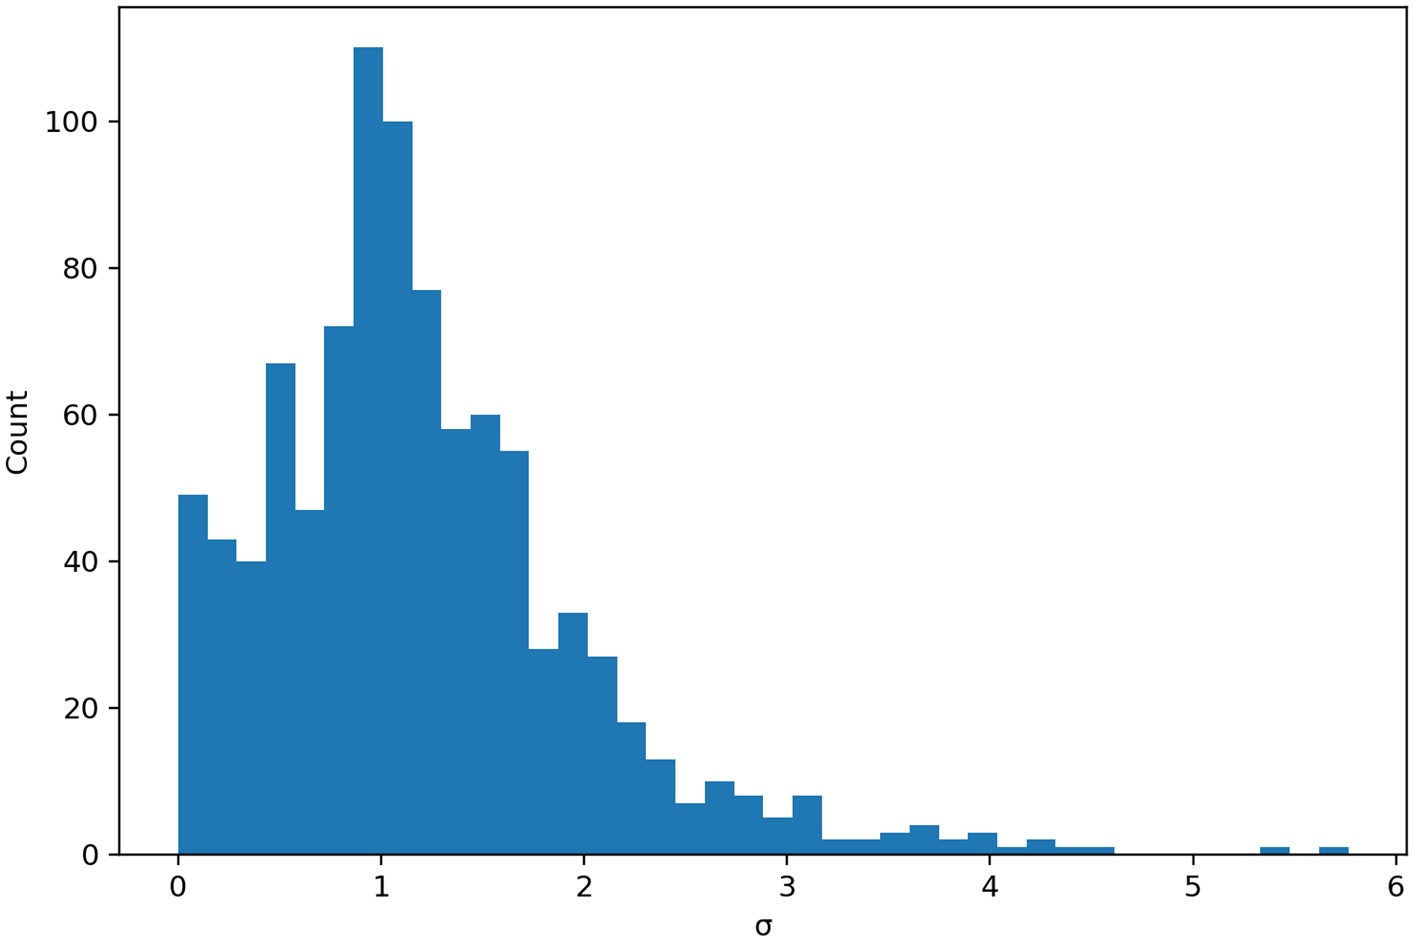
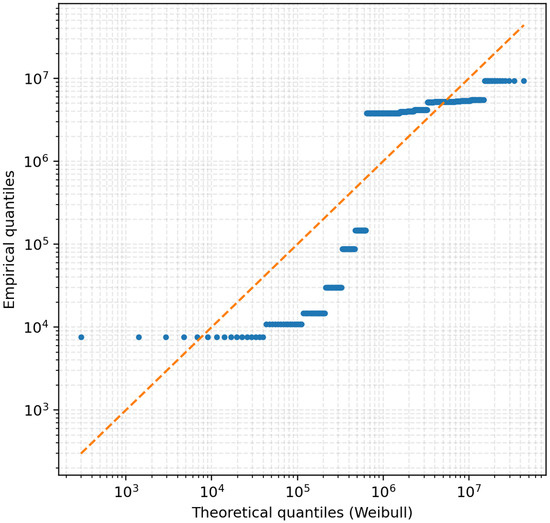
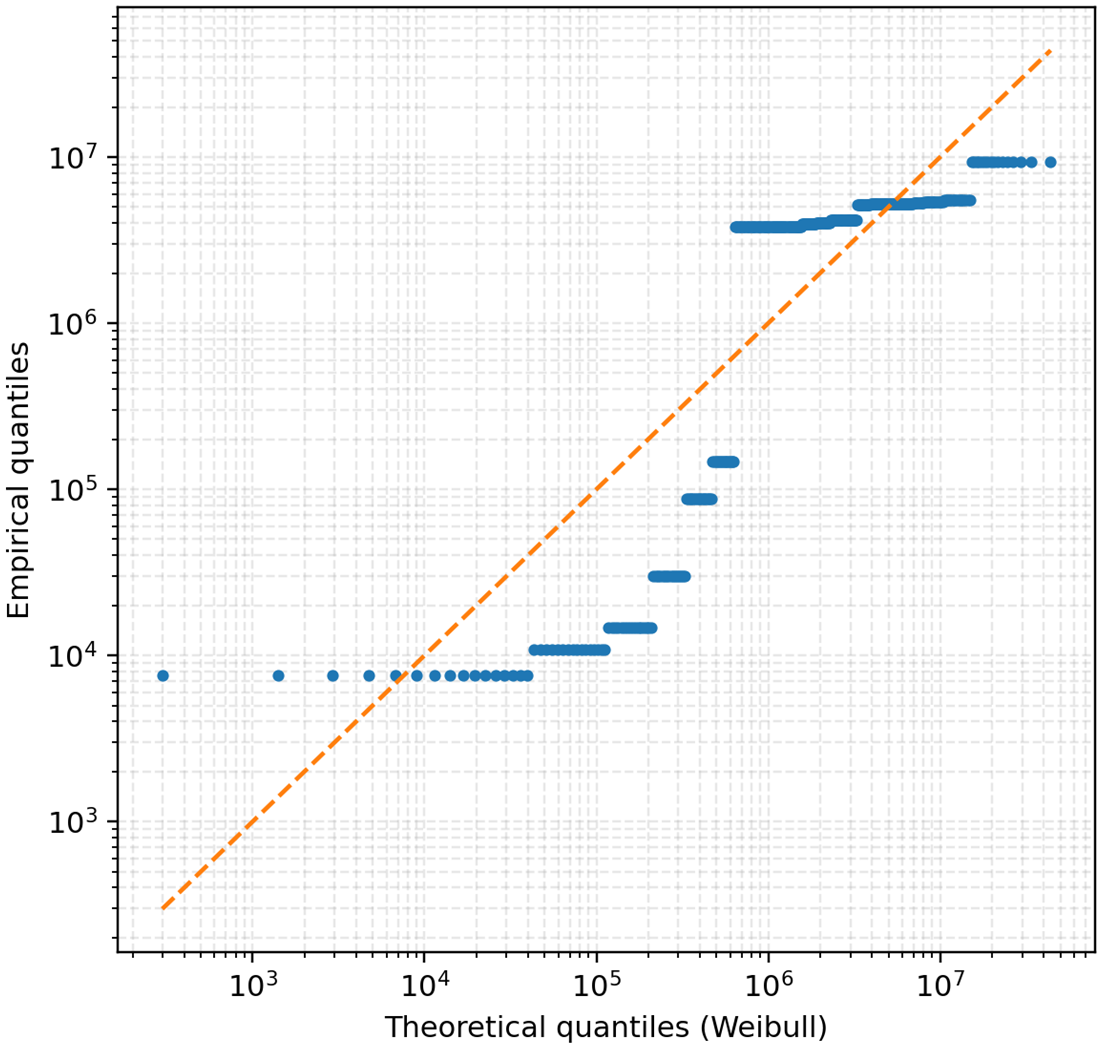
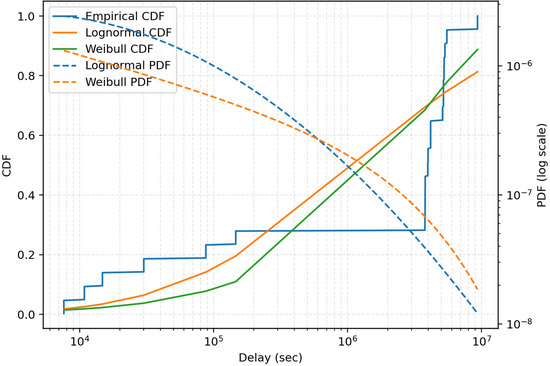
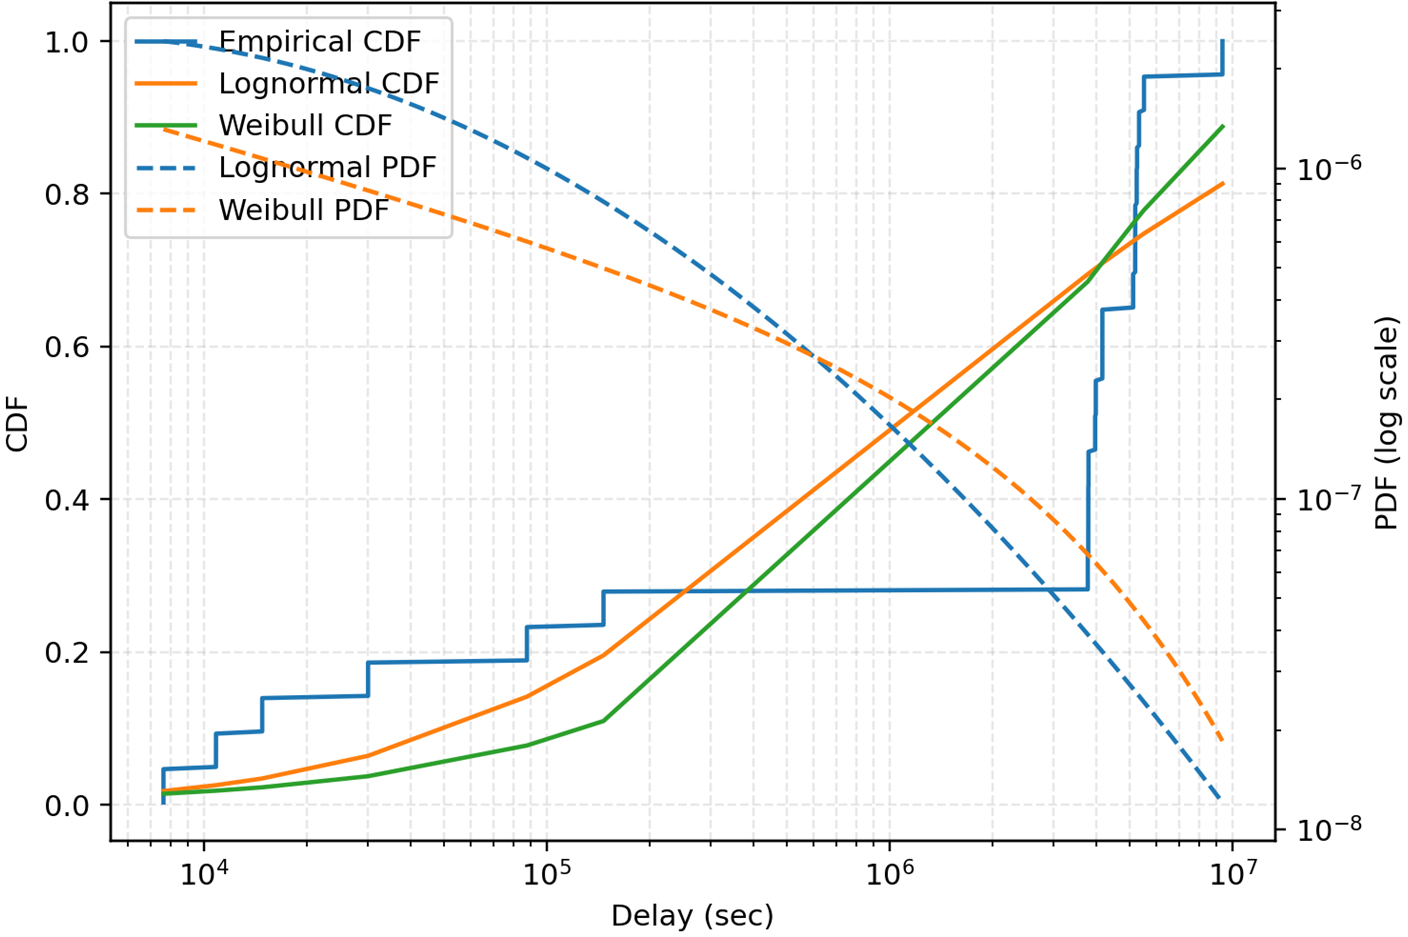
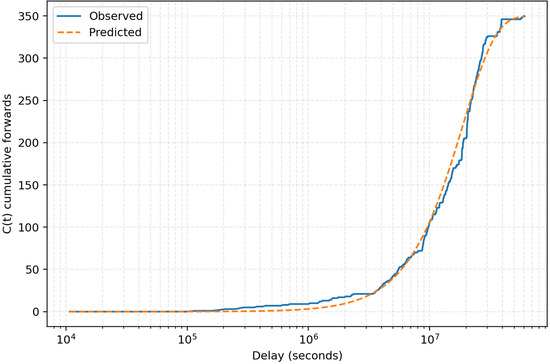
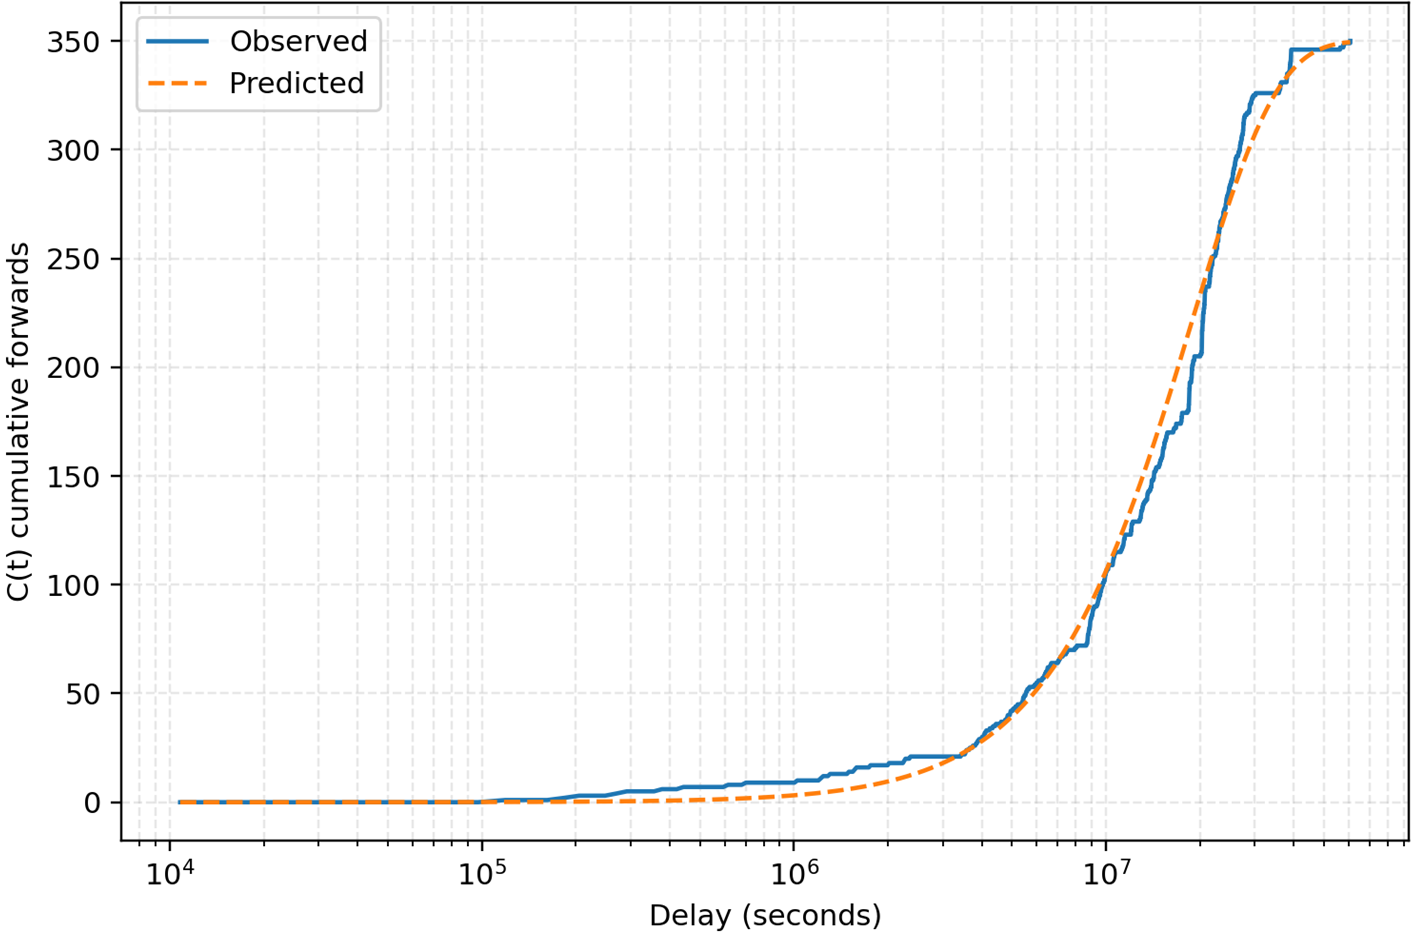
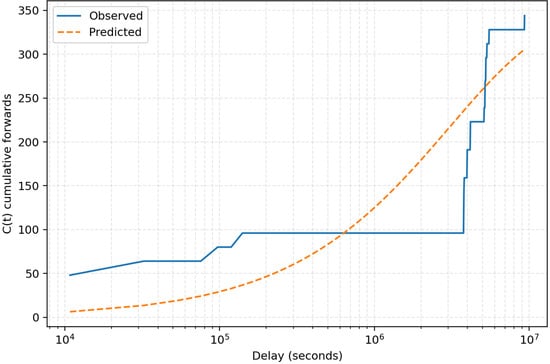
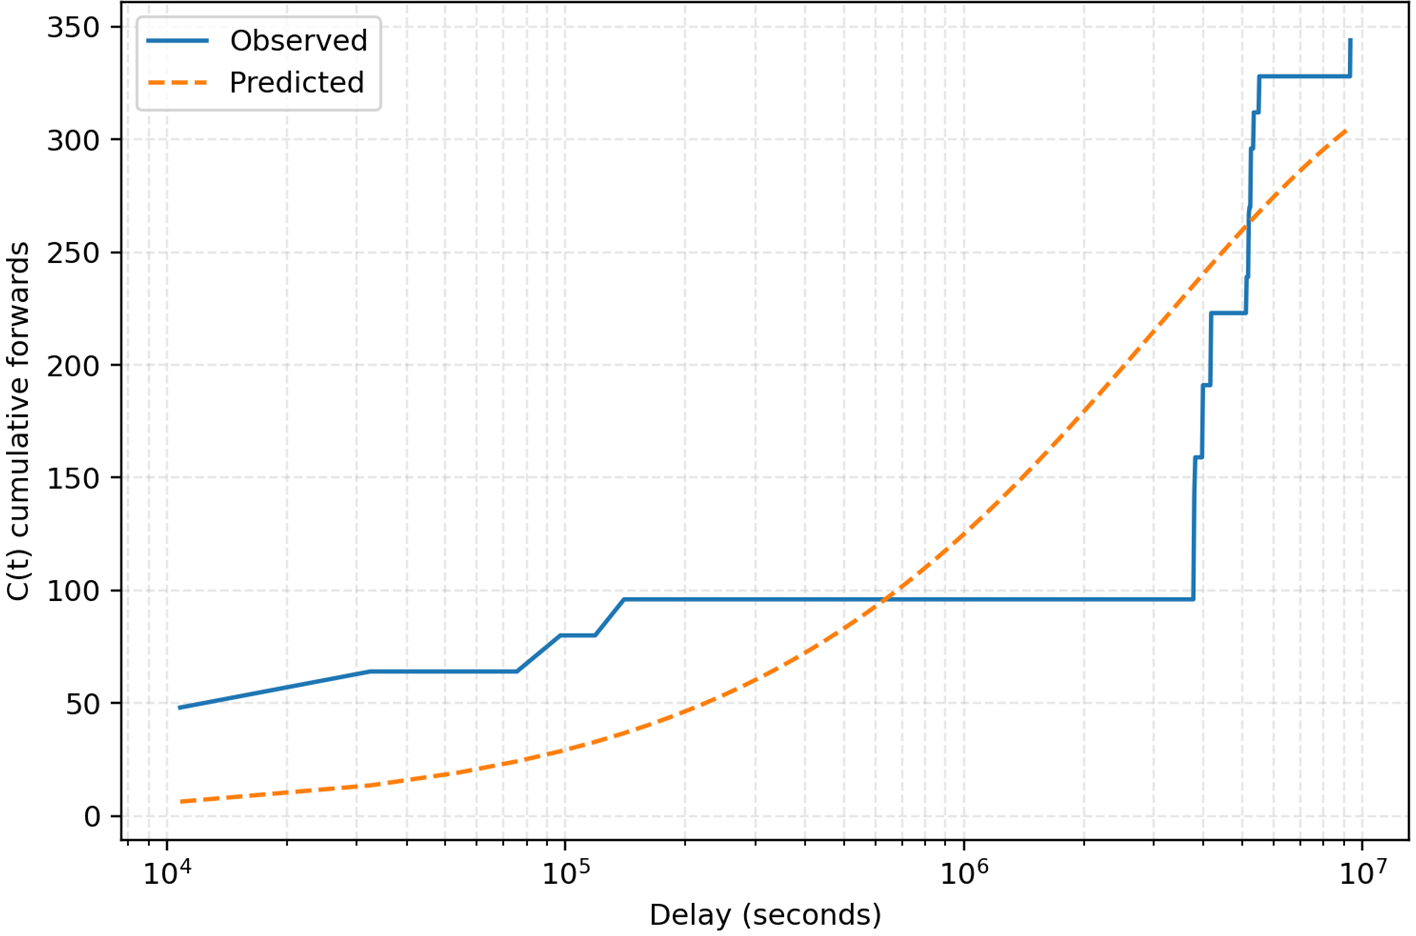
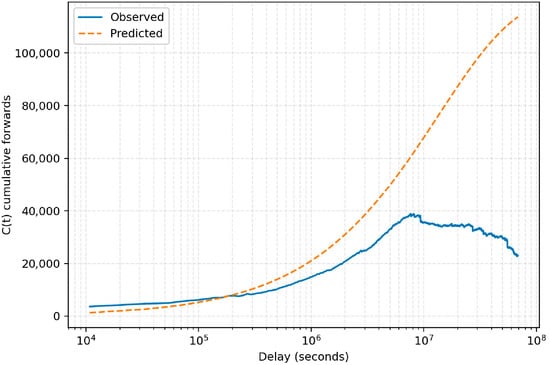
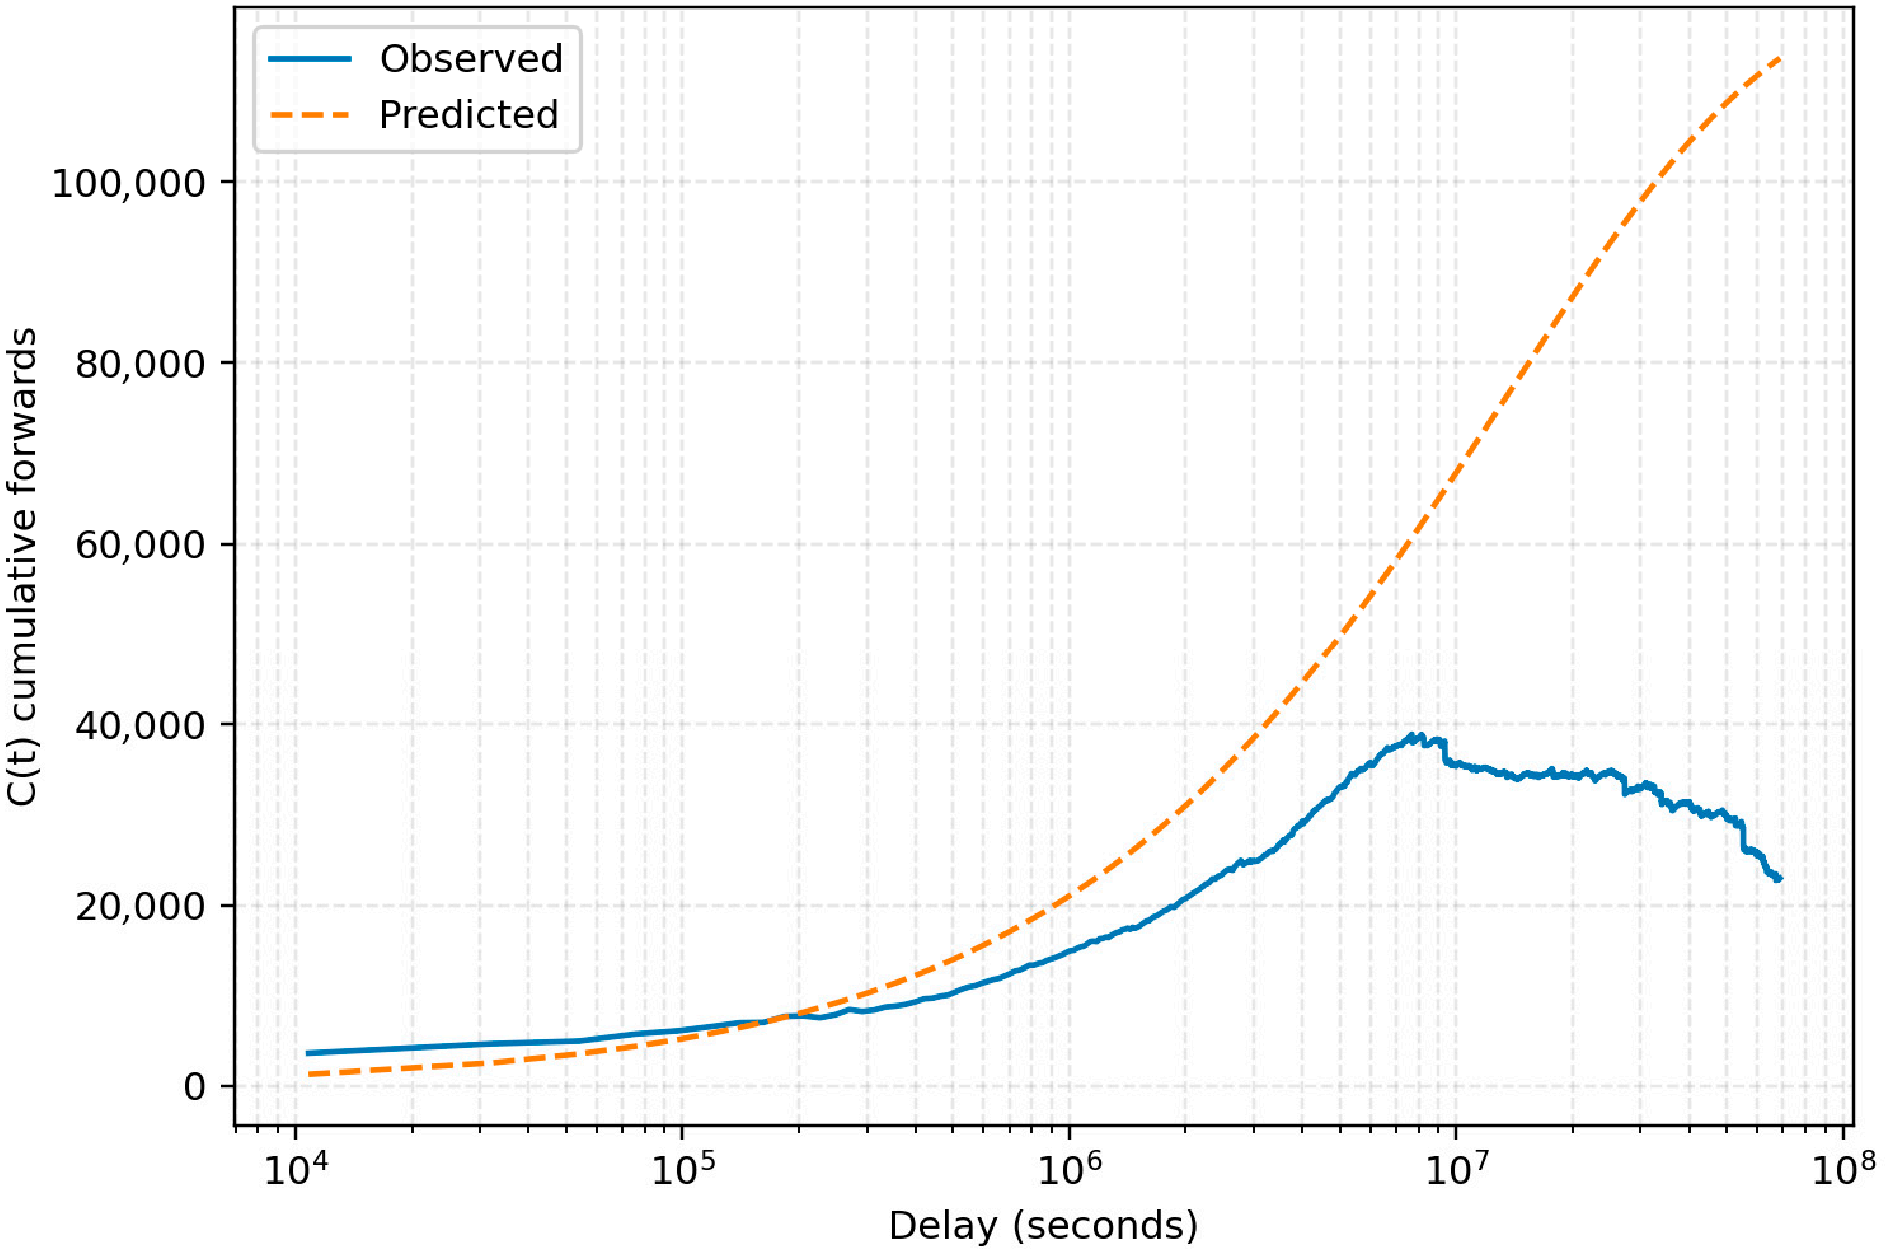
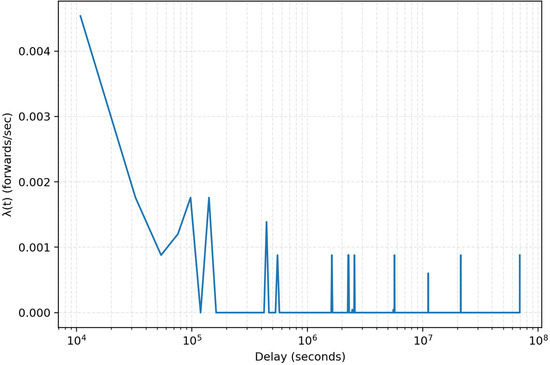
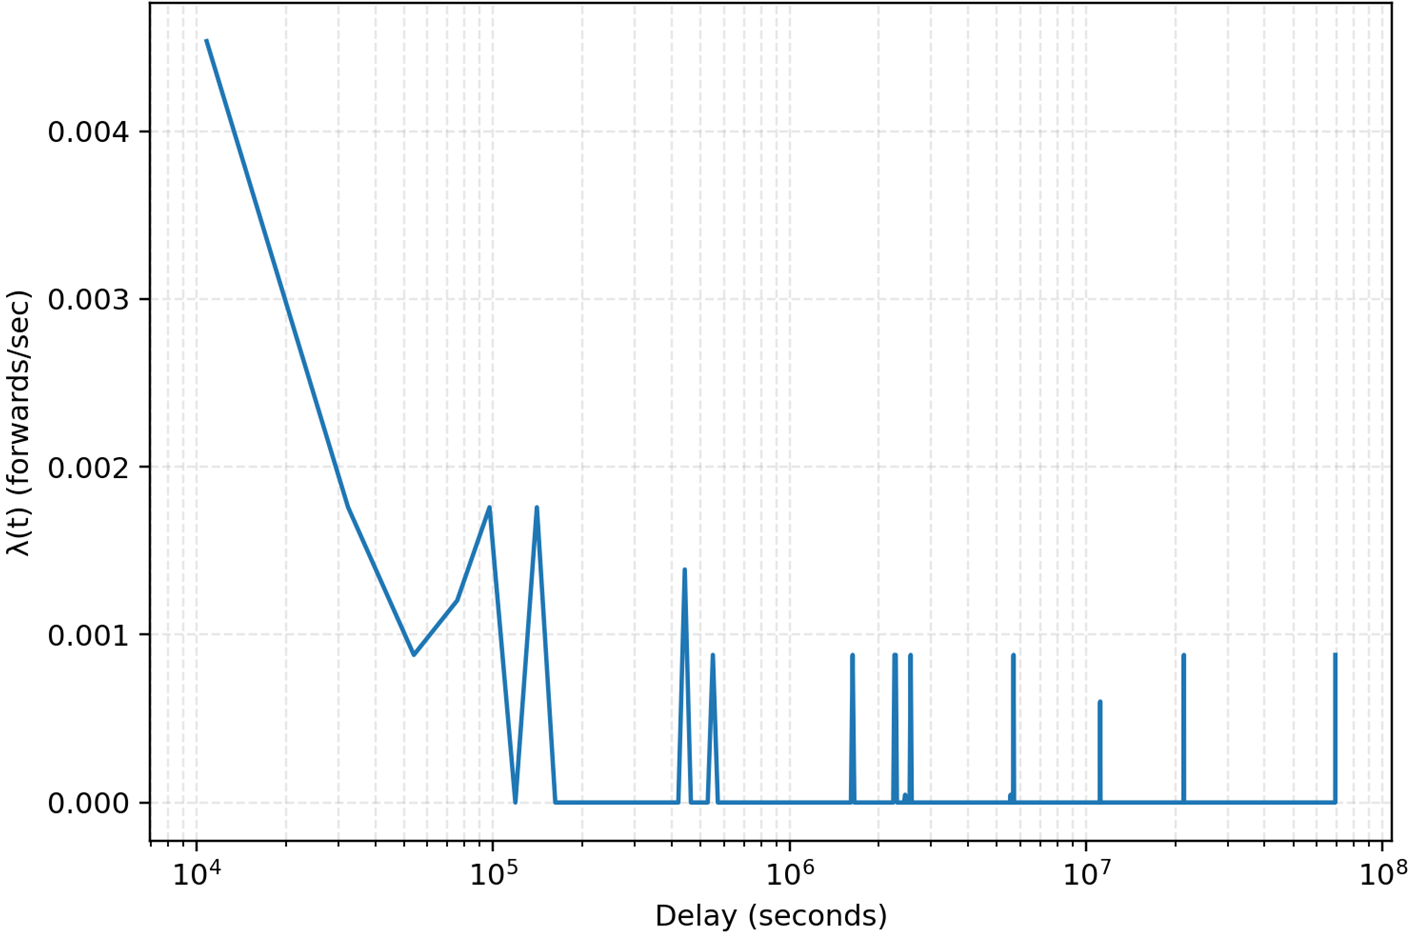
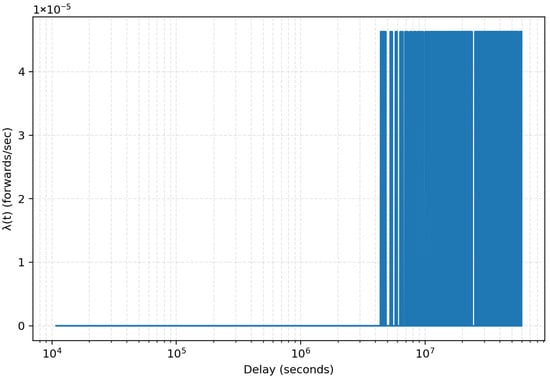
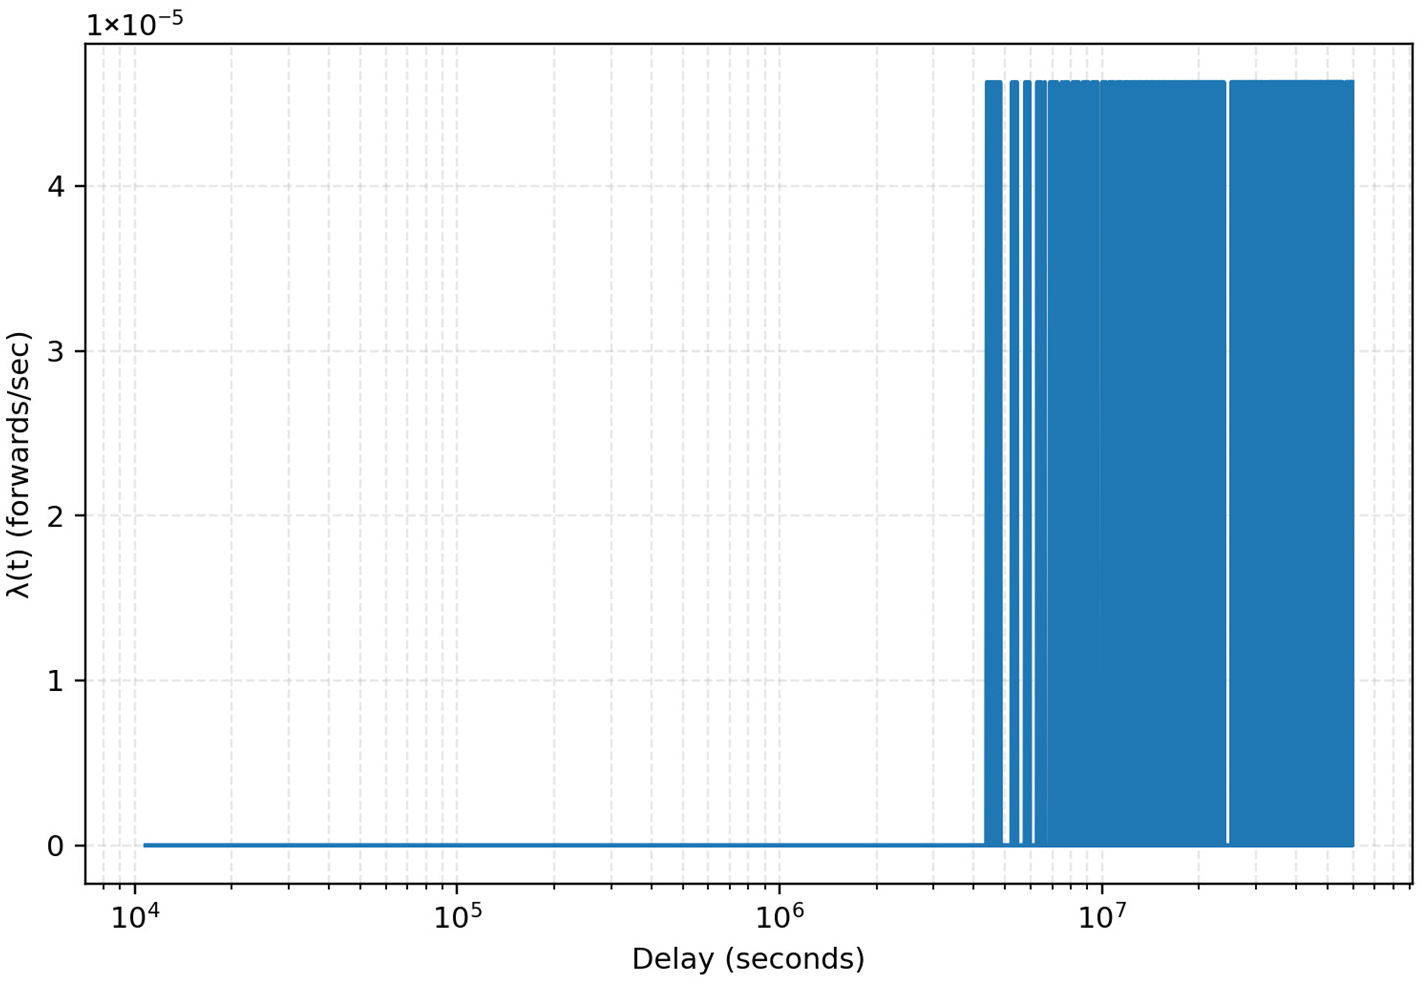
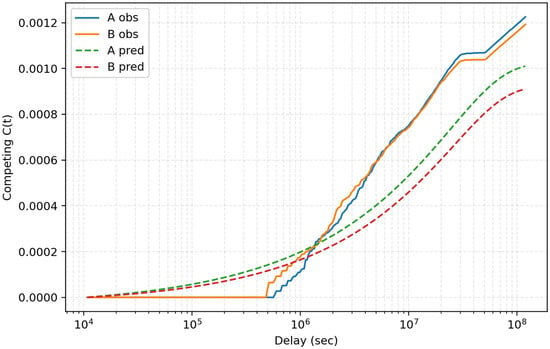
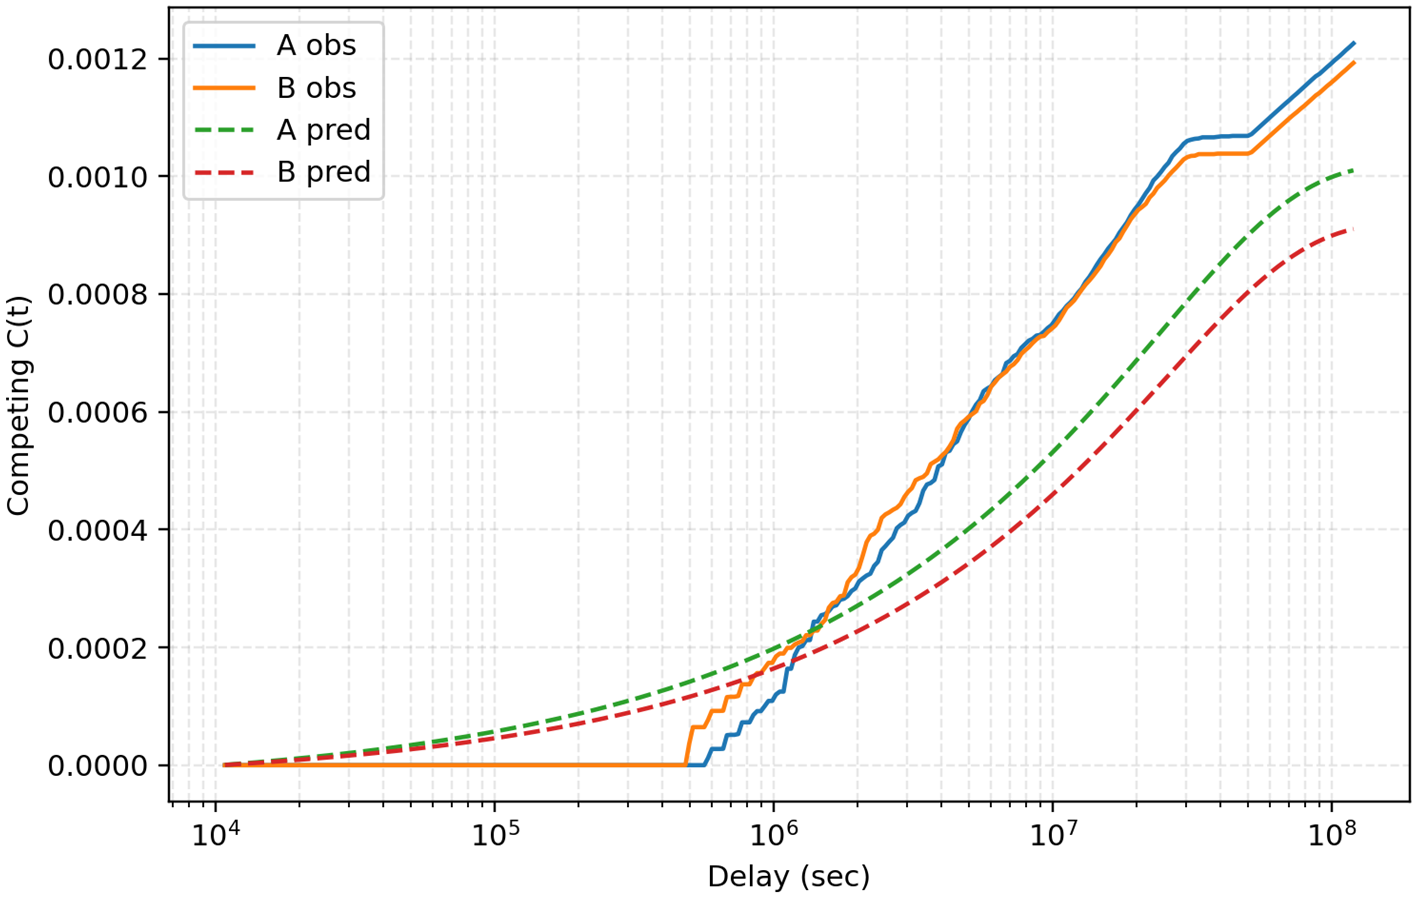
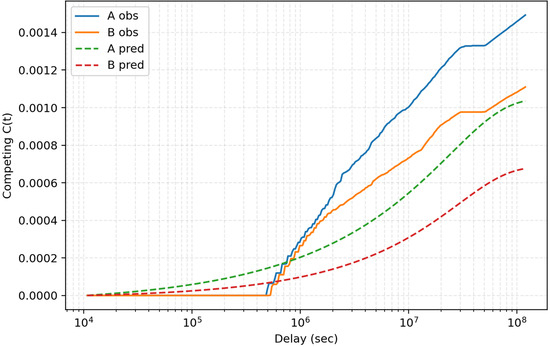
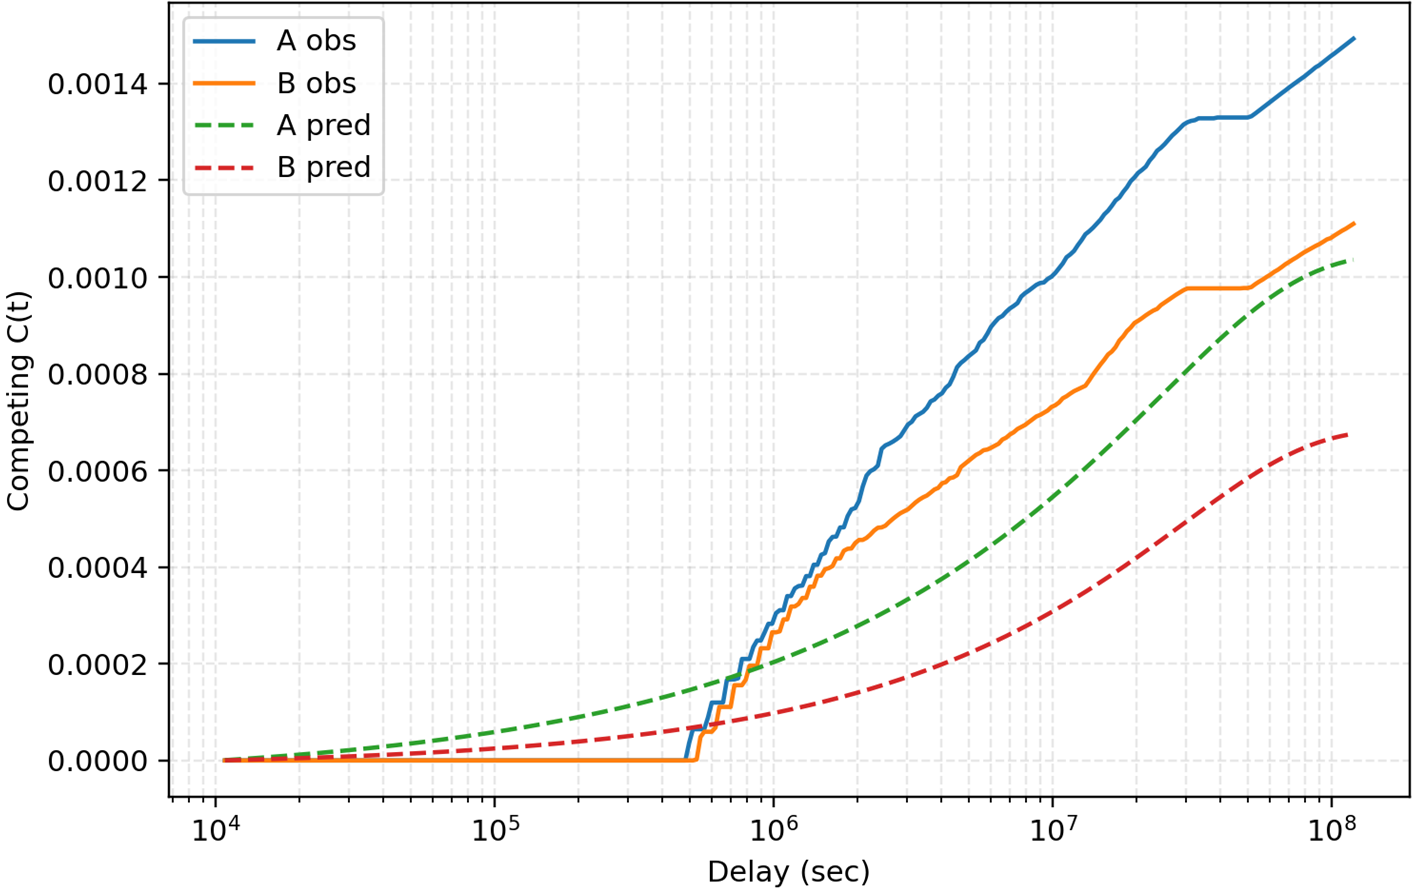
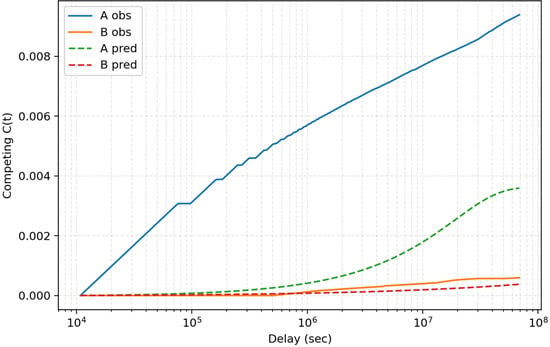
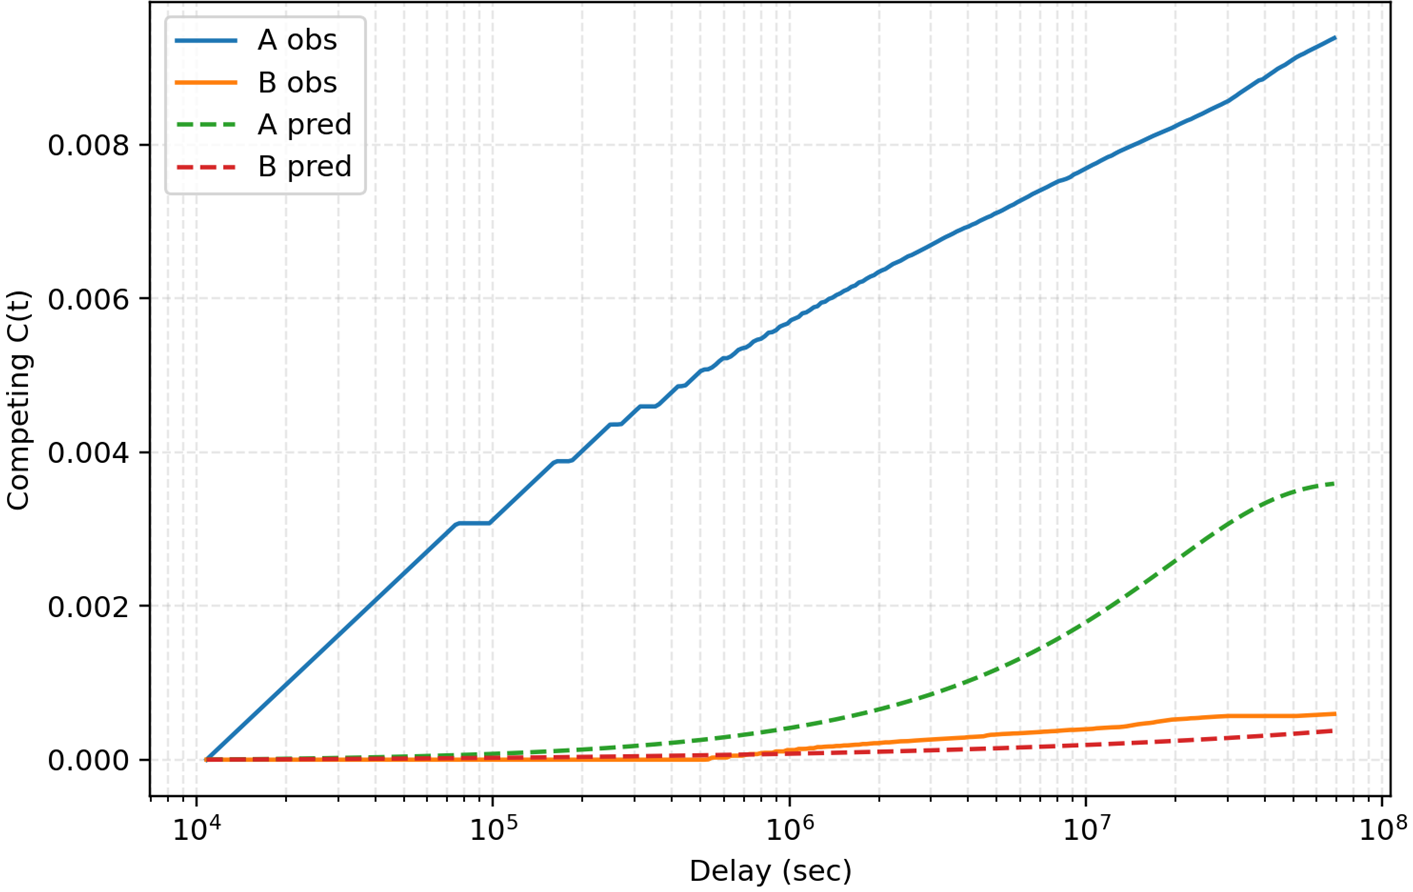
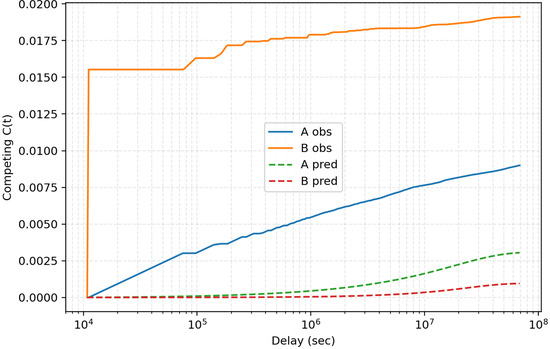
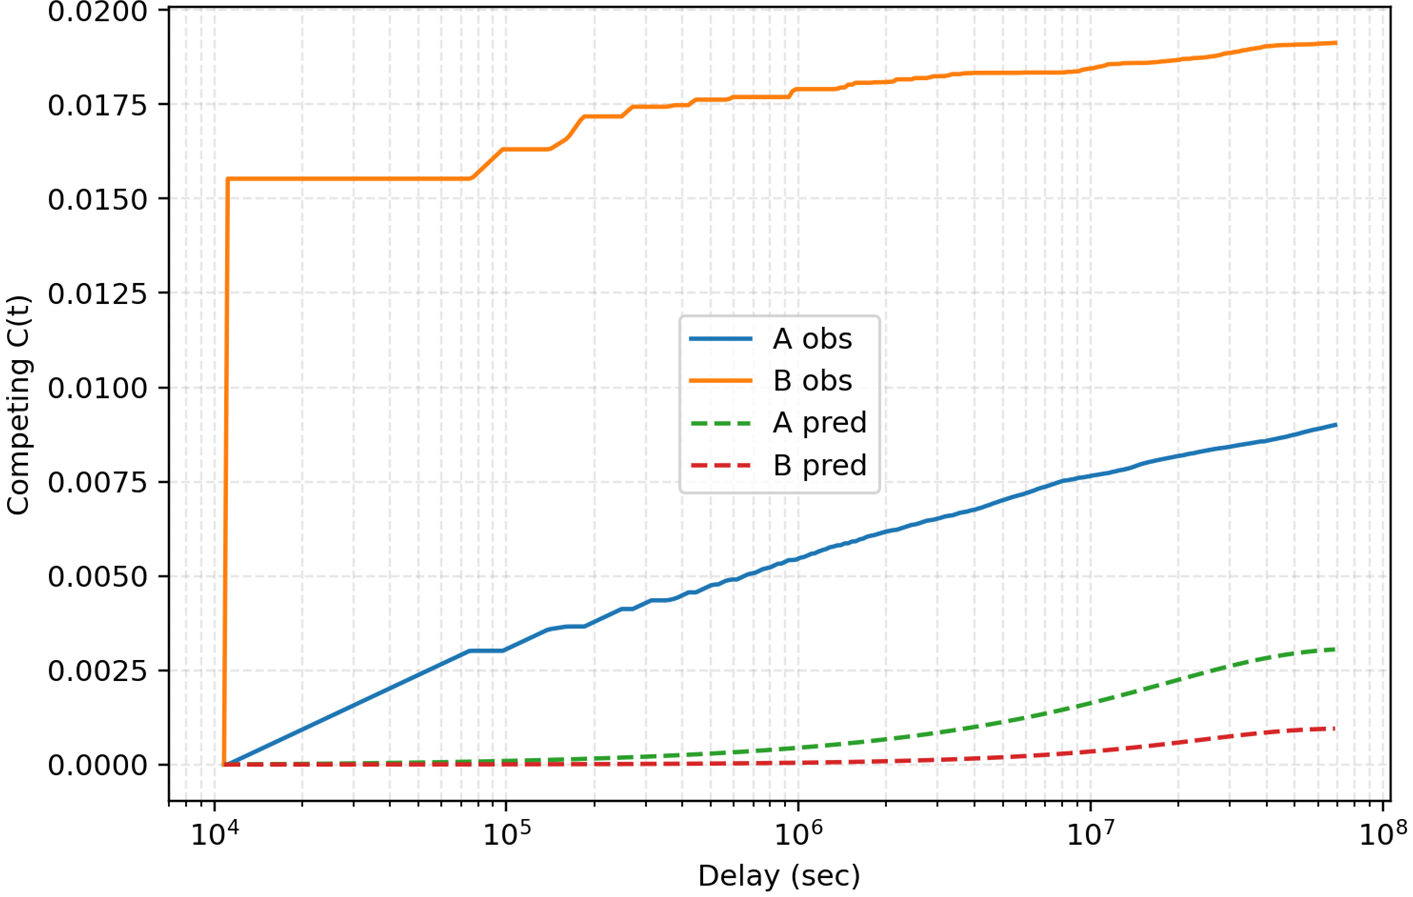
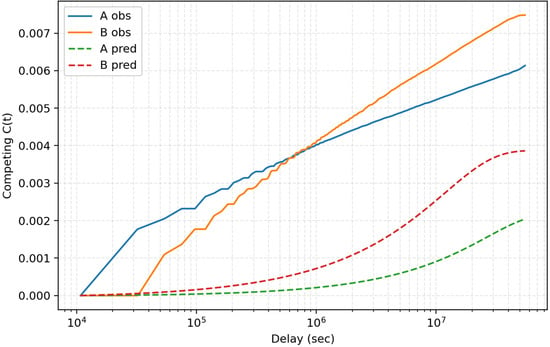
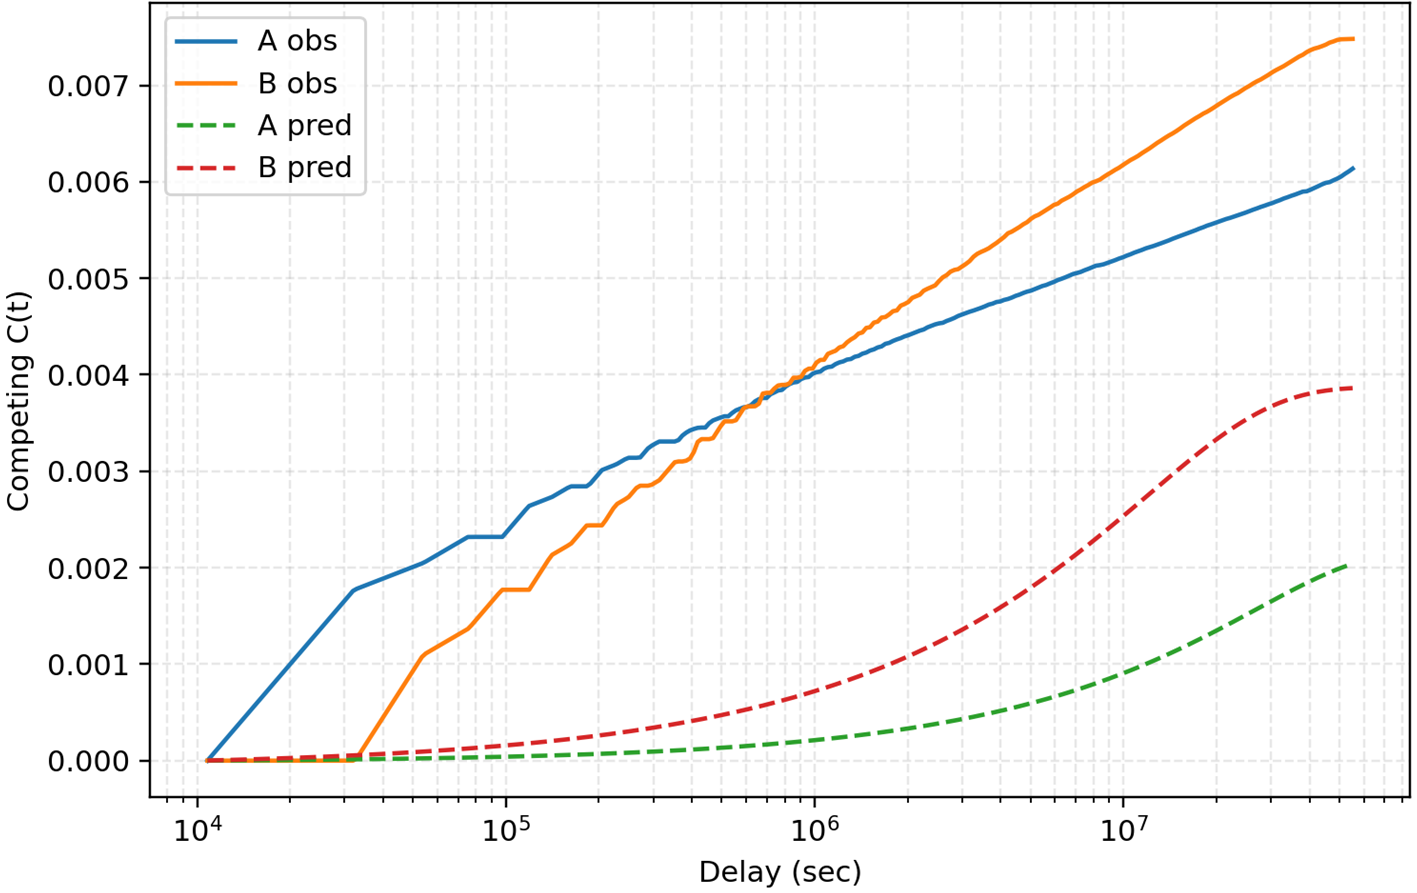

Disclaimer/Publisher’s Note: The statements, opinions and data contained in all publications are solely those of the individual author(s) and contributor(s) and not of MDPI and/or the editor(s). MDPI and/or the editor(s) disclaim responsibility for any injury to people or property resulting from any ideas, methods, instructions or products referred to in the content. |
© 2026 by the authors. Licensee MDPI, Basel, Switzerland. This article is an open access article distributed under the terms and conditions of the Creative Commons Attribution (CC BY) license.