


Abstract
Computed tomography (CT)-guided procedures require close proximity to the CT gantry or patient, increasing occupational exposure to scattered radiation. Even though radiation-protective equipment is commonly used, the optimization of CT fluoroscopic techniques remains important. Partial-angle CT (PACT) employs a limited exposure angle, producing cumulative scattered radiation distributions that vary with the selected angle and are difficult to estimate in advance. I aimed to develop an augmented reality (AR)-based visualization method for cumulative scattered radiation distributions during PACT and to evaluate its ergonomic feasibility as a proof of concept for occupational exposure reduction. An AR display system was developed to overlay cumulative scattered radiation distributions onto physical space using AR glasses. Workload was assessed using the NASA Task Load Index (NASA-TLX), and usability was assessed using the System Usability Scale (SUS). Compared with non-virtual conditions using radiation-protective glasses alone, AR-assisted visualization was associated with increased perceived workload, and usability scores were lower than those reported in previous AR studies. These findings indicate that, for AR display systems to support occupational exposure reduction, perceived task demands must be comparable to conventional protection strategies. Further improvements in visualization methods, user familiarity with AR environments, and ergonomic optimization are required to facilitate clinical implementation.
1. Introduction
Computed tomography (CT)-guided procedures enable diagnostic or therapeutic interventions to be performed safely under CT fluoroscopic image guidance [1,2] and are designed to minimize patient invasiveness. However, CT fluoroscopy involves continuous X-ray exposure, and relatively high radiation exposure to medical staff has been reported [3,4,5]. In conventional CT fluoroscopy, X-ray irradiation is applied continuously throughout the procedure, and greater procedural complexity and longer procedural times are associated with increased occupational exposure among medical staff. To address this issue, intermittent CT fluoroscopy techniques were introduced and are now widely used [6,7]. From a regulatory perspective, accumulating international evidence on radiation protection in interventional radiology (IVR) has strengthened protective measures for medical staff. In 2011, the International Commission on Radiological Protection (ICRP) recommended an equivalent dose limit for the lens of the eye of 20 mSv/year, averaged over defined periods of 5 years, with no single year exceeding 50 mSv [8]. Following this recommendation, the threshold dose for tissue reactions involving the eye lens was revised, and corresponding amendments were made to national regulations in Japan, resulting in a substantial reduction in the equivalent dose limit. Concurrently, personal dosimeters were developed to measure lens dose. In 2020, revisions to the Ordinance for Enforcement of the Medical Care Act concerning medical radiation were implemented, indicating that medical institutions should ensure the safe management of medical exposure based on diagnostic reference levels [9].
In CT-guided procedures, technologies such as partial-angle CT (PACT), which limit the X-ray scan range to 180° plus the fan angle required for image reconstruction, have been introduced to reduce occupational exposure [10,11,12]. In addition to the use of appropriate radiation-protective equipment, optimization of imaging parameters, including image quality, is essential for reducing radiation exposure to medical staff during IVR using X-ray CT. Some CT systems provide exposure modes that restrict the X-ray irradiation range, reducing radiation dose to both patients and medical staff during IVR. In CT examinations, real-time imaging may be performed using half-scan CT data (approximately 240° of data acquisition). CT fluoroscopy employing this approach is referred to as half-scan CT fluoroscopy. PACT extends this concept by allowing selection of the X-ray exposure range within the half-scan, with exposure angles adjustable in 30° increments. Similar to angular beam modulation using tube current modulation [6], PACT produces scattered radiation distributions that differ from those generated by full-scan CT (360° data acquisition), thereby influencing the occupational exposure of medical staff. Appropriate selection of the X-ray exposure range, with consideration of procedural conditions, is essential. Previous studies reported reduced occupational exposure at certain X-ray tube positions during PACT [12]. The half-scan angle is not fixed and can be adjusted arbitrarily. Without continuous perception of cumulative scattered radiation distributions, occupational exposure reduction may not be consistently achieved. Because cumulative scattered dose distributions vary depending on the selected exposure range, visualization of these distributions is necessary. To address this, numerical simulations of scattered radiation distributions for each X-ray exposure range were calculated using the Monte Carlo particle transport code PHITS [13]. Based on these data, a device was developed in an augmented reality (AR) environment to overlay cumulative scattered radiation distributions onto physical space.
Previous AR-based radiation visualization systems have primarily focused on real-time dose display using spatial representations of scattered radiation distributions [14,15]. Although these systems enhance radiation visualization perception, they do not address the angle-dependent cumulative scatter radiation characteristics specific to PACT. In PACT, occupational exposure varies depending on the selected X-ray exposure angle, and understanding cumulative scattered radiation distributions is essential for proactive dose management. To my knowledge, no previous study has integrated Monte Carlo-derived scattered radiation distributions specific to PACT with AR-based visualization for occupational exposure management in CT-guided interventions. AR is a semi-immersive environment that enhances visual perception by overlaying computer-generated (CG) information onto the physical space. In fully virtual environments, immersion is achieved by reproducing audio-visual sensations that differ from reality. Similar to virtual reality (VR), AR has been applied to first-person experiences in medical education [16,17,18,19,20], surgical assistance [21,22,23,24,25], and rehabilitation [26,27,28,29,30], providing a safe and effective practice environment. VR typically uses head-mounted displays to deliver fully immersive experiences. AR employs eyeglass-type display devices that allow simultaneous use of radiation-protective glasses, even within radiation fields, making it more suitable for clinical settings. When medical staff perform procedures using AR glasses, workload-related factors—including potential user discomfort such as cybersickness—must also be considered [31,32,33,34,35].
To make PACT effective for reducing occupational exposure, medical staff must be able to visually recognize cumulative scattered radiation distributions to identify safe working areas and avoid high-dose regions. Currently, no technology adequately addresses this issue. This paper presents a proof-of-concept (PoC) evaluation of AR glasses designed to enable medical staff to proactively manage occupational exposure by visualizing cumulative scattered radiation distributions overlaid on physical space. The feasibility of clinical implementation was assessed by evaluating the workload associated with AR use to determine whether effective occupational exposure management could be achieved. Additionally, workload [36] and usability [37,38] were examined to provide a preliminary, hypothesis-generating evaluation of the application and its technical components.
I aimed to leverage AR technology to develop a reliable method for visualizing cumulative scattered radiation distributions and to evaluate the ergonomics of a novel system designed to reduce occupational exposure among medical staff. The research question was whether visualizing scattered radiation distributions using AR glasses affects subjective workload during clinical tasks. I hypothesized that the perceived workload when using AR glasses would not differ significantly from that in a standard working environment, represented in this study by the use of radiation-protective glasses alone.
2. Materials and Methods
2.1. AR Visualization of the Cumulative Scattered Radiation Dose Distribution
The AR display system consisted of AR glasses (Nreal Light; XREAL Inc., Tokyo, Japan) connected via USB Type-C to a smartphone (Galaxy S22; Samsung Electronics Japan Co., Ltd., Tokyo, Japan) running an AR application. The application was developed using Unity (version 2021.3.5f1 LTS) with NRSDK for Unity (version 1.10.2) to support the AR glasses. The NRSDK development kit included a marker-based tracking function, which enables AR visualization by displaying CG objects when the camera recognizes a pre-registered marker. The position and orientation of the marker in physical space serve as the origin of the CG coordinate system. By mapping CG-generated cubes onto the coordinate system, the system visualized fixed scattered radiation distributions in physical space. Markers were color JPEG images (210 mm × 297 mm), which could be printed using a standard printer. To improve spatial registration accuracy, three markers were placed around the CT system: one defined the coordinate system origin, whereas the remaining two markers were used to correct marker orientation. The origin of the coordinate system was located on the CT table with a 700 mm leftward offset. CG cubes displayed in the AR environment were arranged in a grid pattern to represent the scattered radiation dose distribution, and both the positions and dimensions of the CG cubes were configurable.
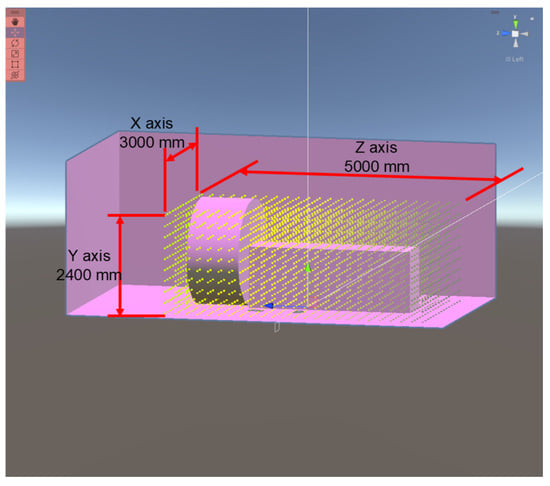
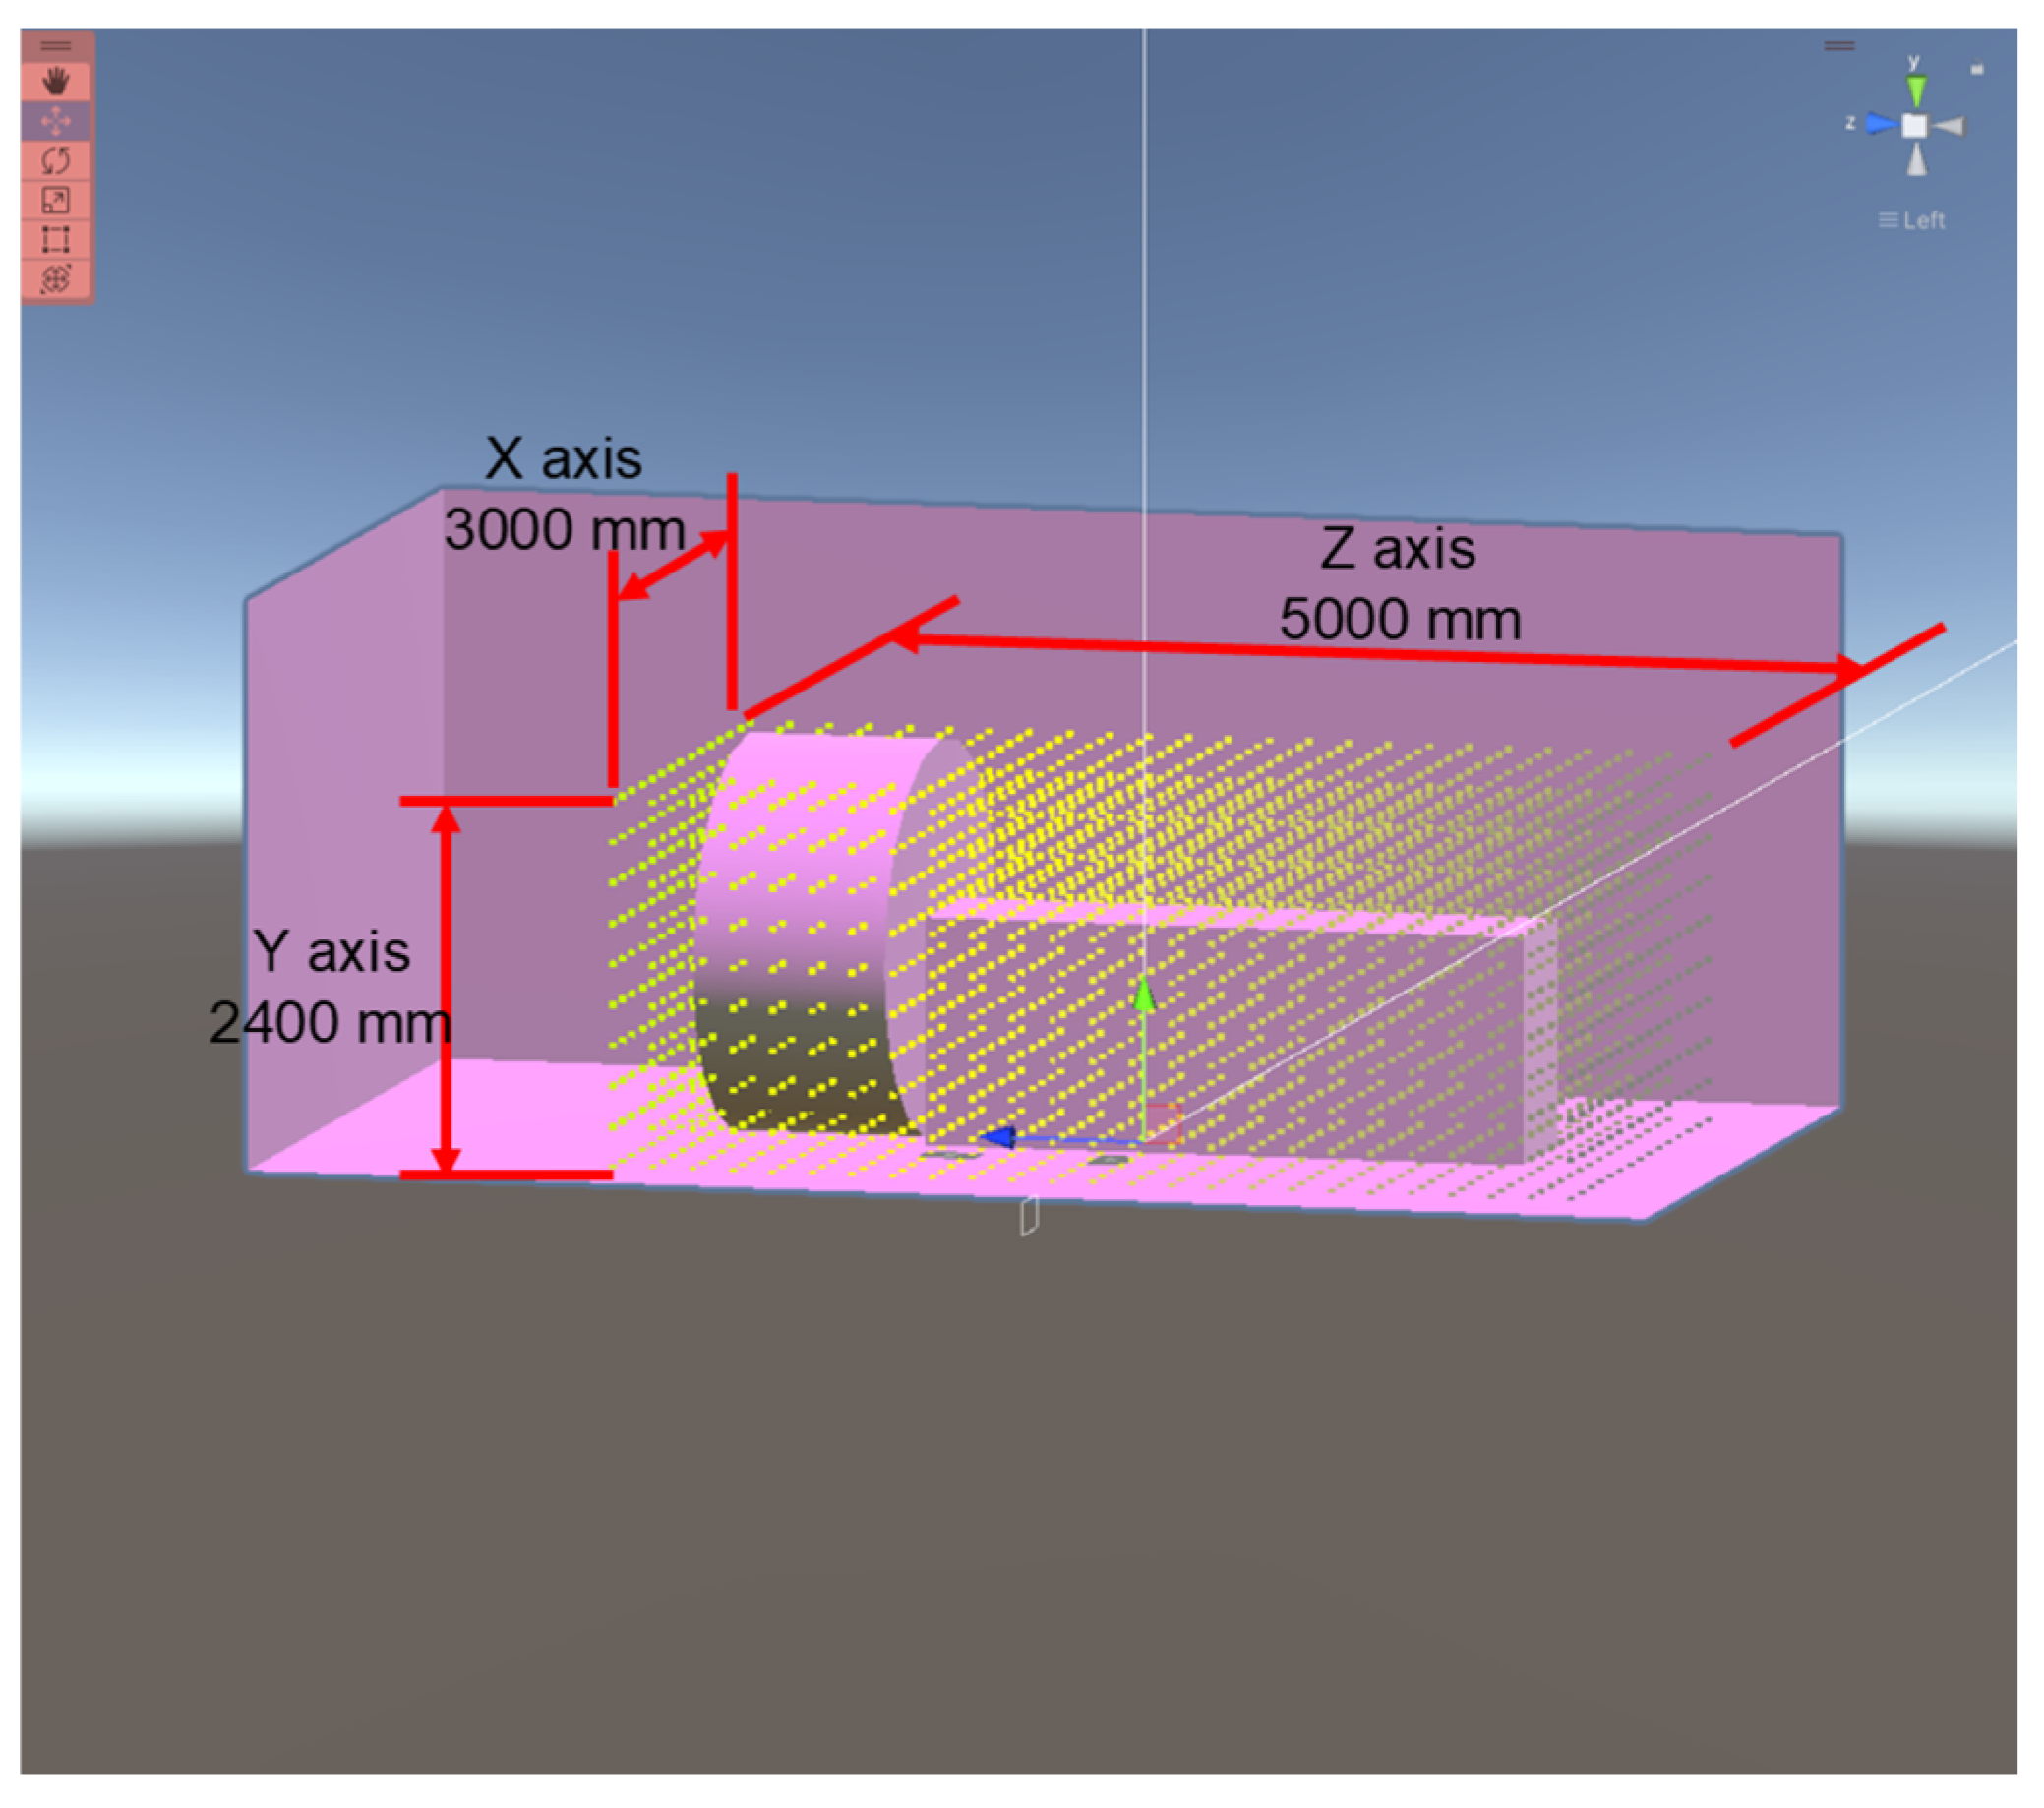
Each cube contained a scattered radiation dose distribution generated using the Monte Carlo particle transport simulation code PHITS (version 3.300). PHITS models the behavior of various types of radiation within arbitrary geometries using reaction models and nuclear data. It has been applied in accelerator shielding design, radiation therapy planning, and radiation protection. One advantage of PHITS is the relative simplicity of the simulation setup, in which users prepare an input file describing the geometry and simulation conditions, which is then loaded into the PHITS executable. Simulation outputs include numerical data as well as image files, enabling straightforward visual verification of the results. PHITS was developed by Japanese research institutions and is supported extensively in Japan. The PACT X-ray exposure parameters used in the simulations are listed in Table 1. X-ray energy spectra were calculated using the Birch–Marshall theoretical formulation for continuous X-rays emitted from an X-ray tube [39]. Continuous X-ray conditions included a tube voltage of 120 kV, a tungsten anode, an anode target angle of 8°, inherent filtration equivalent to 2.5 mm Al, and constant-voltage rectification. Under these conditions, the half-value layer of aluminum was 5.0 mm. The dimensions of the simulation space used to visualize scattered radiation dose distribution are shown in Figure 1.
Table 1.
X-ray exposure conditions for PACT simulations.
Figure 1.
Dimensions of the simulation space used to model the scattered radiation dose distribution.
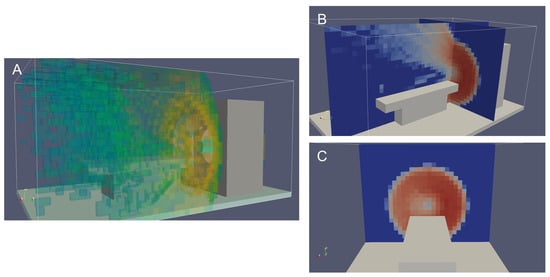
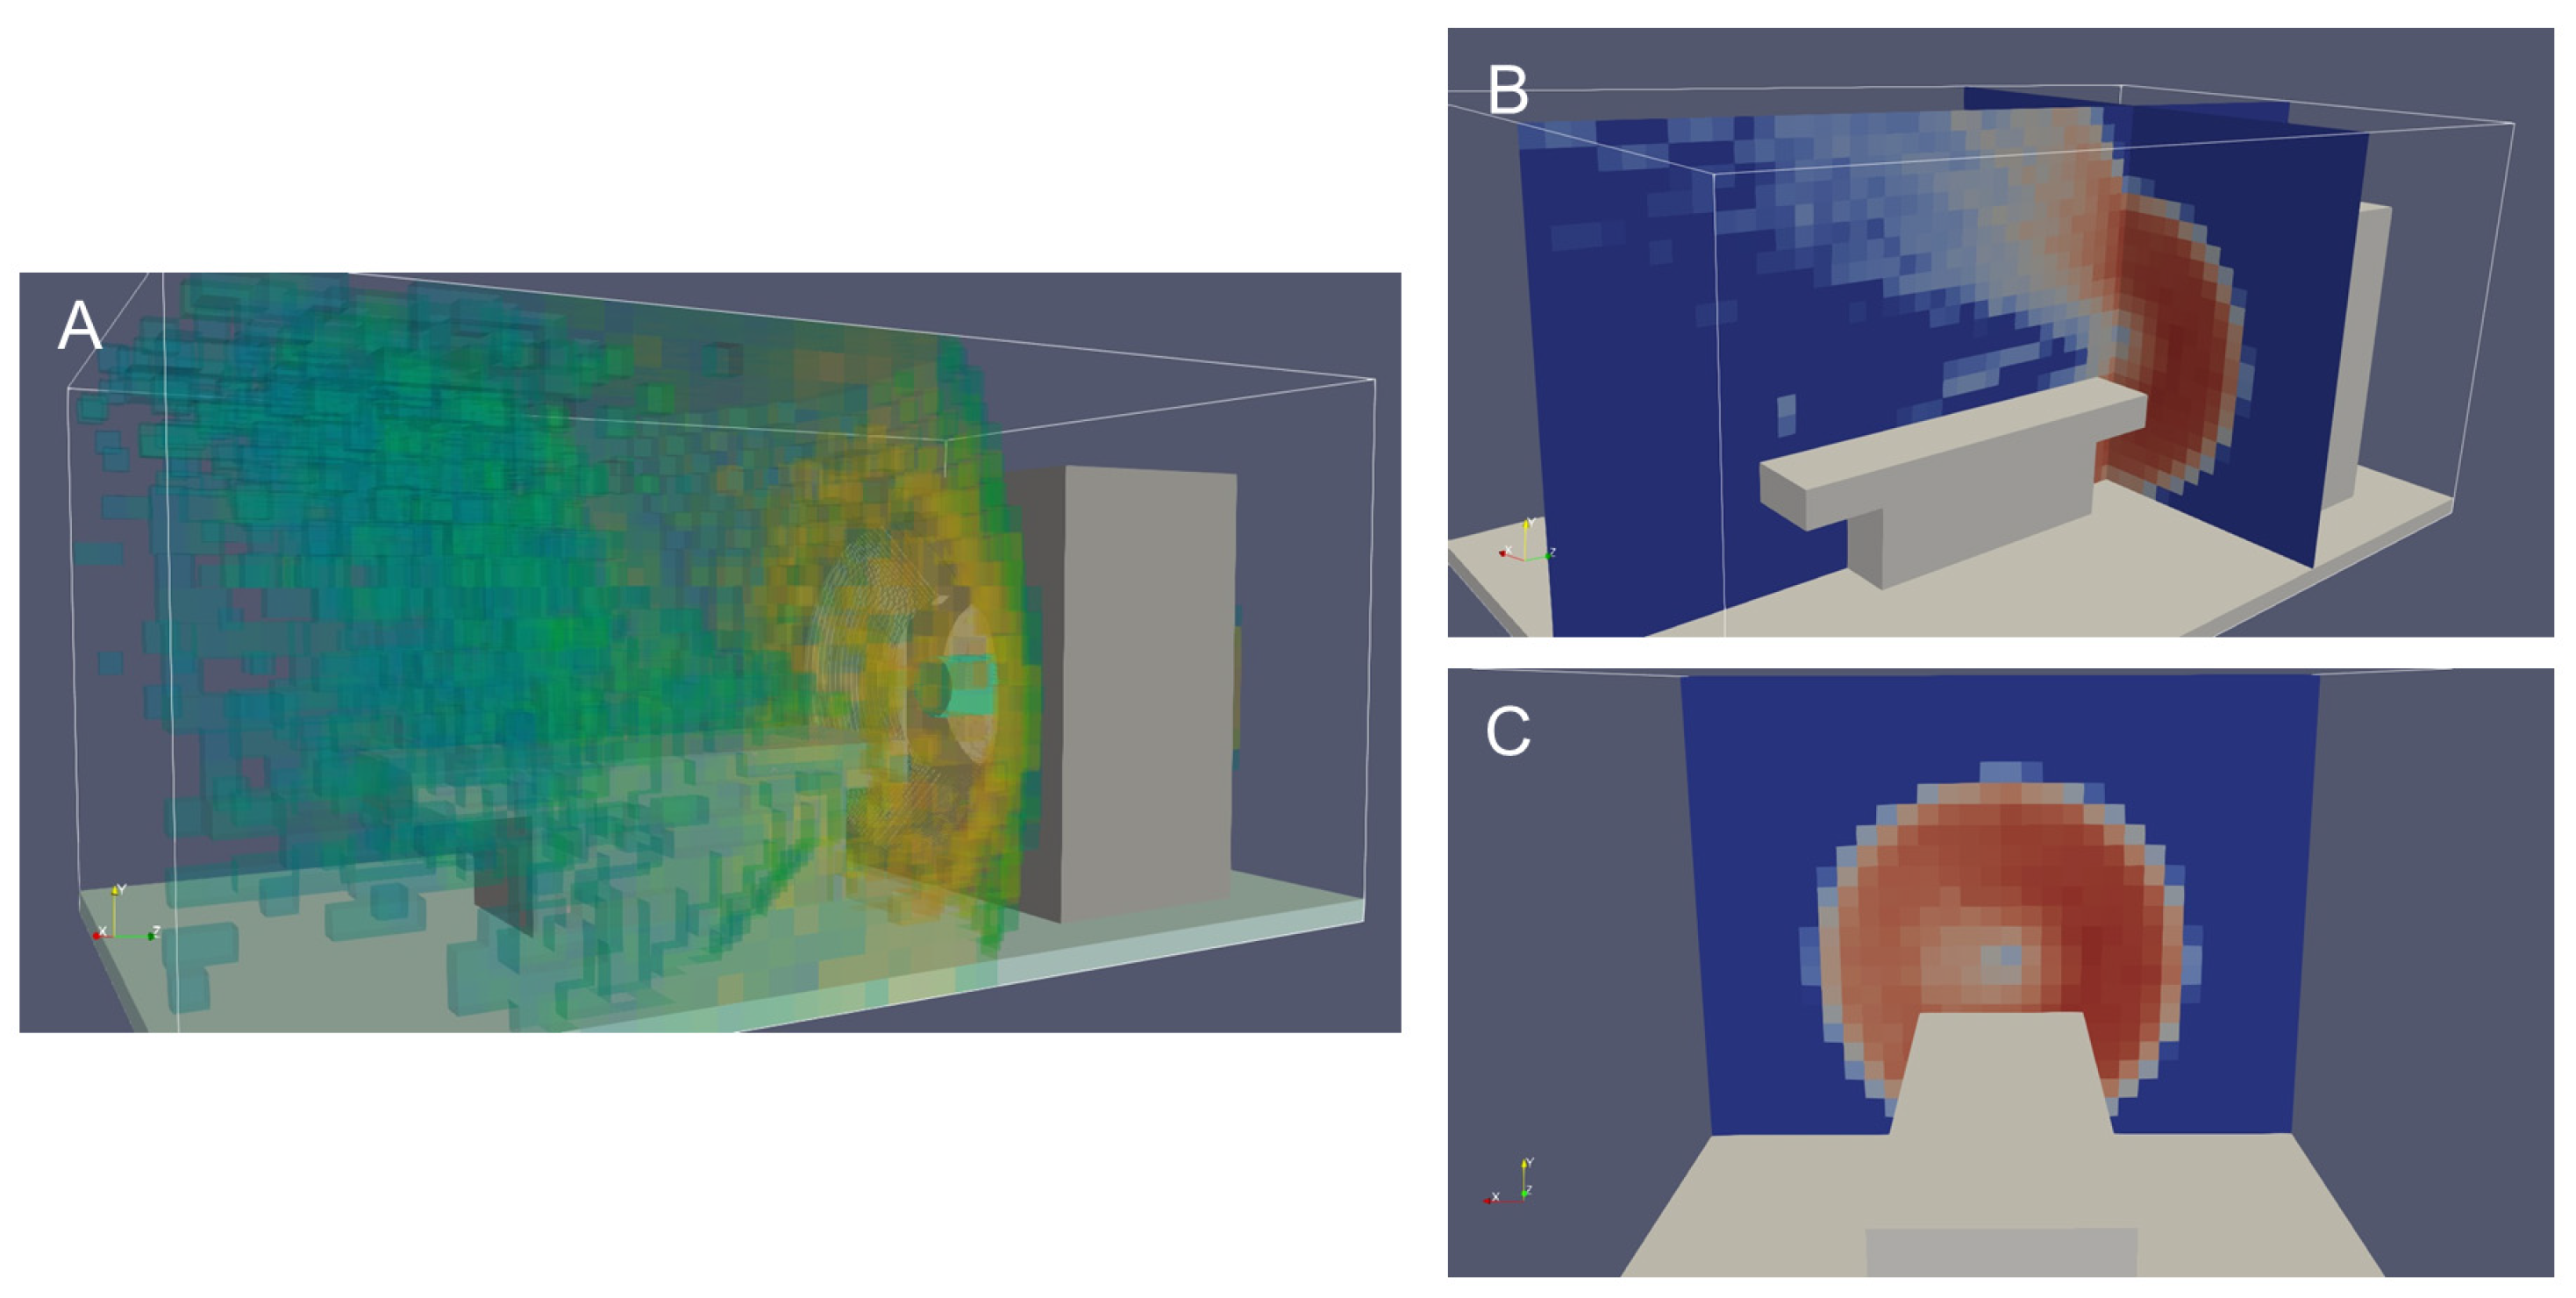
In PHITS, the simulation domain is divided into small virtual regions (tallies) within which photon transport information is recorded. The gantry and CT table were modeled as iron structures, and a cylindrical polymethyl methacrylate (PMMA) phantom (30 cm diameter × 10 cm length) was placed at the center of the gantry. Visualization of the simulation results was performed using ParaView 5.10.1 (Kitware, Inc., Clifton Park, NY, USA), an open-source software for visualizing numerical simulation data (Figure 2). Figure 2A shows a three-dimensional visualization of the scattered radiation dose distribution under PACT conditions, while Figure 2B and Figure 2C present two-dimensional views from the lateral side of the CT table and the front of the gantry, respectively. In these images, red indicates high-dose regions and blue indicates low-dose regions. In conventional CT imaging, scattered radiation distributions near the gantry are generally uniform in all directions. As shown in Figure 2C, PACT produced a semicircular high-dose region extending approximately clockwise from the 12 o’clock to the 6 o’clock position (the right half of the gantry). For coordinate definition, the longitudinal axis of the table was used as the Z-axis, the left–right direction as the X-axis, and the vertical direction as the Y-axis. The tally mesh was set to 30 × 24 × 50 pixels along the X, Y, and Z axes, respectively. The number of tallies corresponds to the number of CG cubes, which was adjusted to balance visualization resolution with computational performance limitations of the hardware.
Figure 2.
Simulation of scattered dose distribution in PACT using PHITS. (A) 3D visualization; (B,C) 2D visualizations from the lateral side of the CT table and front of the gantry, respectively. Abbreviations: PACT, partial-angle computed tomography; PHITS, Particle and Heavy Ion Transport code System; 3D, three-dimensional; 2D, two-dimensional; CT, computed tomography.
Scattered radiation dose distribution was stored as text files corresponding to each PACT X-ray exposure range and saved in the smartphone’s internal storage. A graphical user interface was developed on the smartphone to allow users to input X-ray exposure parameters, including tube voltage, tube current, exposure time, and exposure range. The application loads the corresponding text file based on these inputs. Scattered radiation distributions represent cumulative information; additional X-ray exposures can be sequentially added, with previously loaded dose data summed and reflected in the updated AR visualization of cumulative scattered radiation.
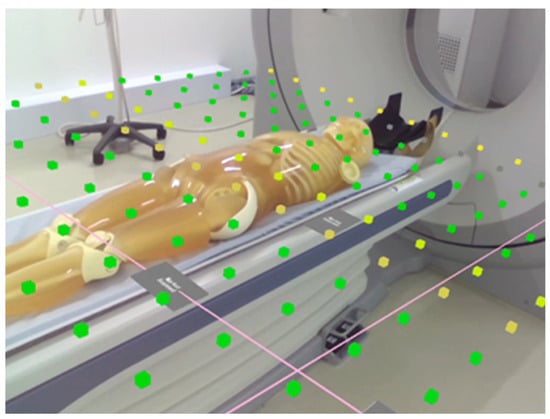
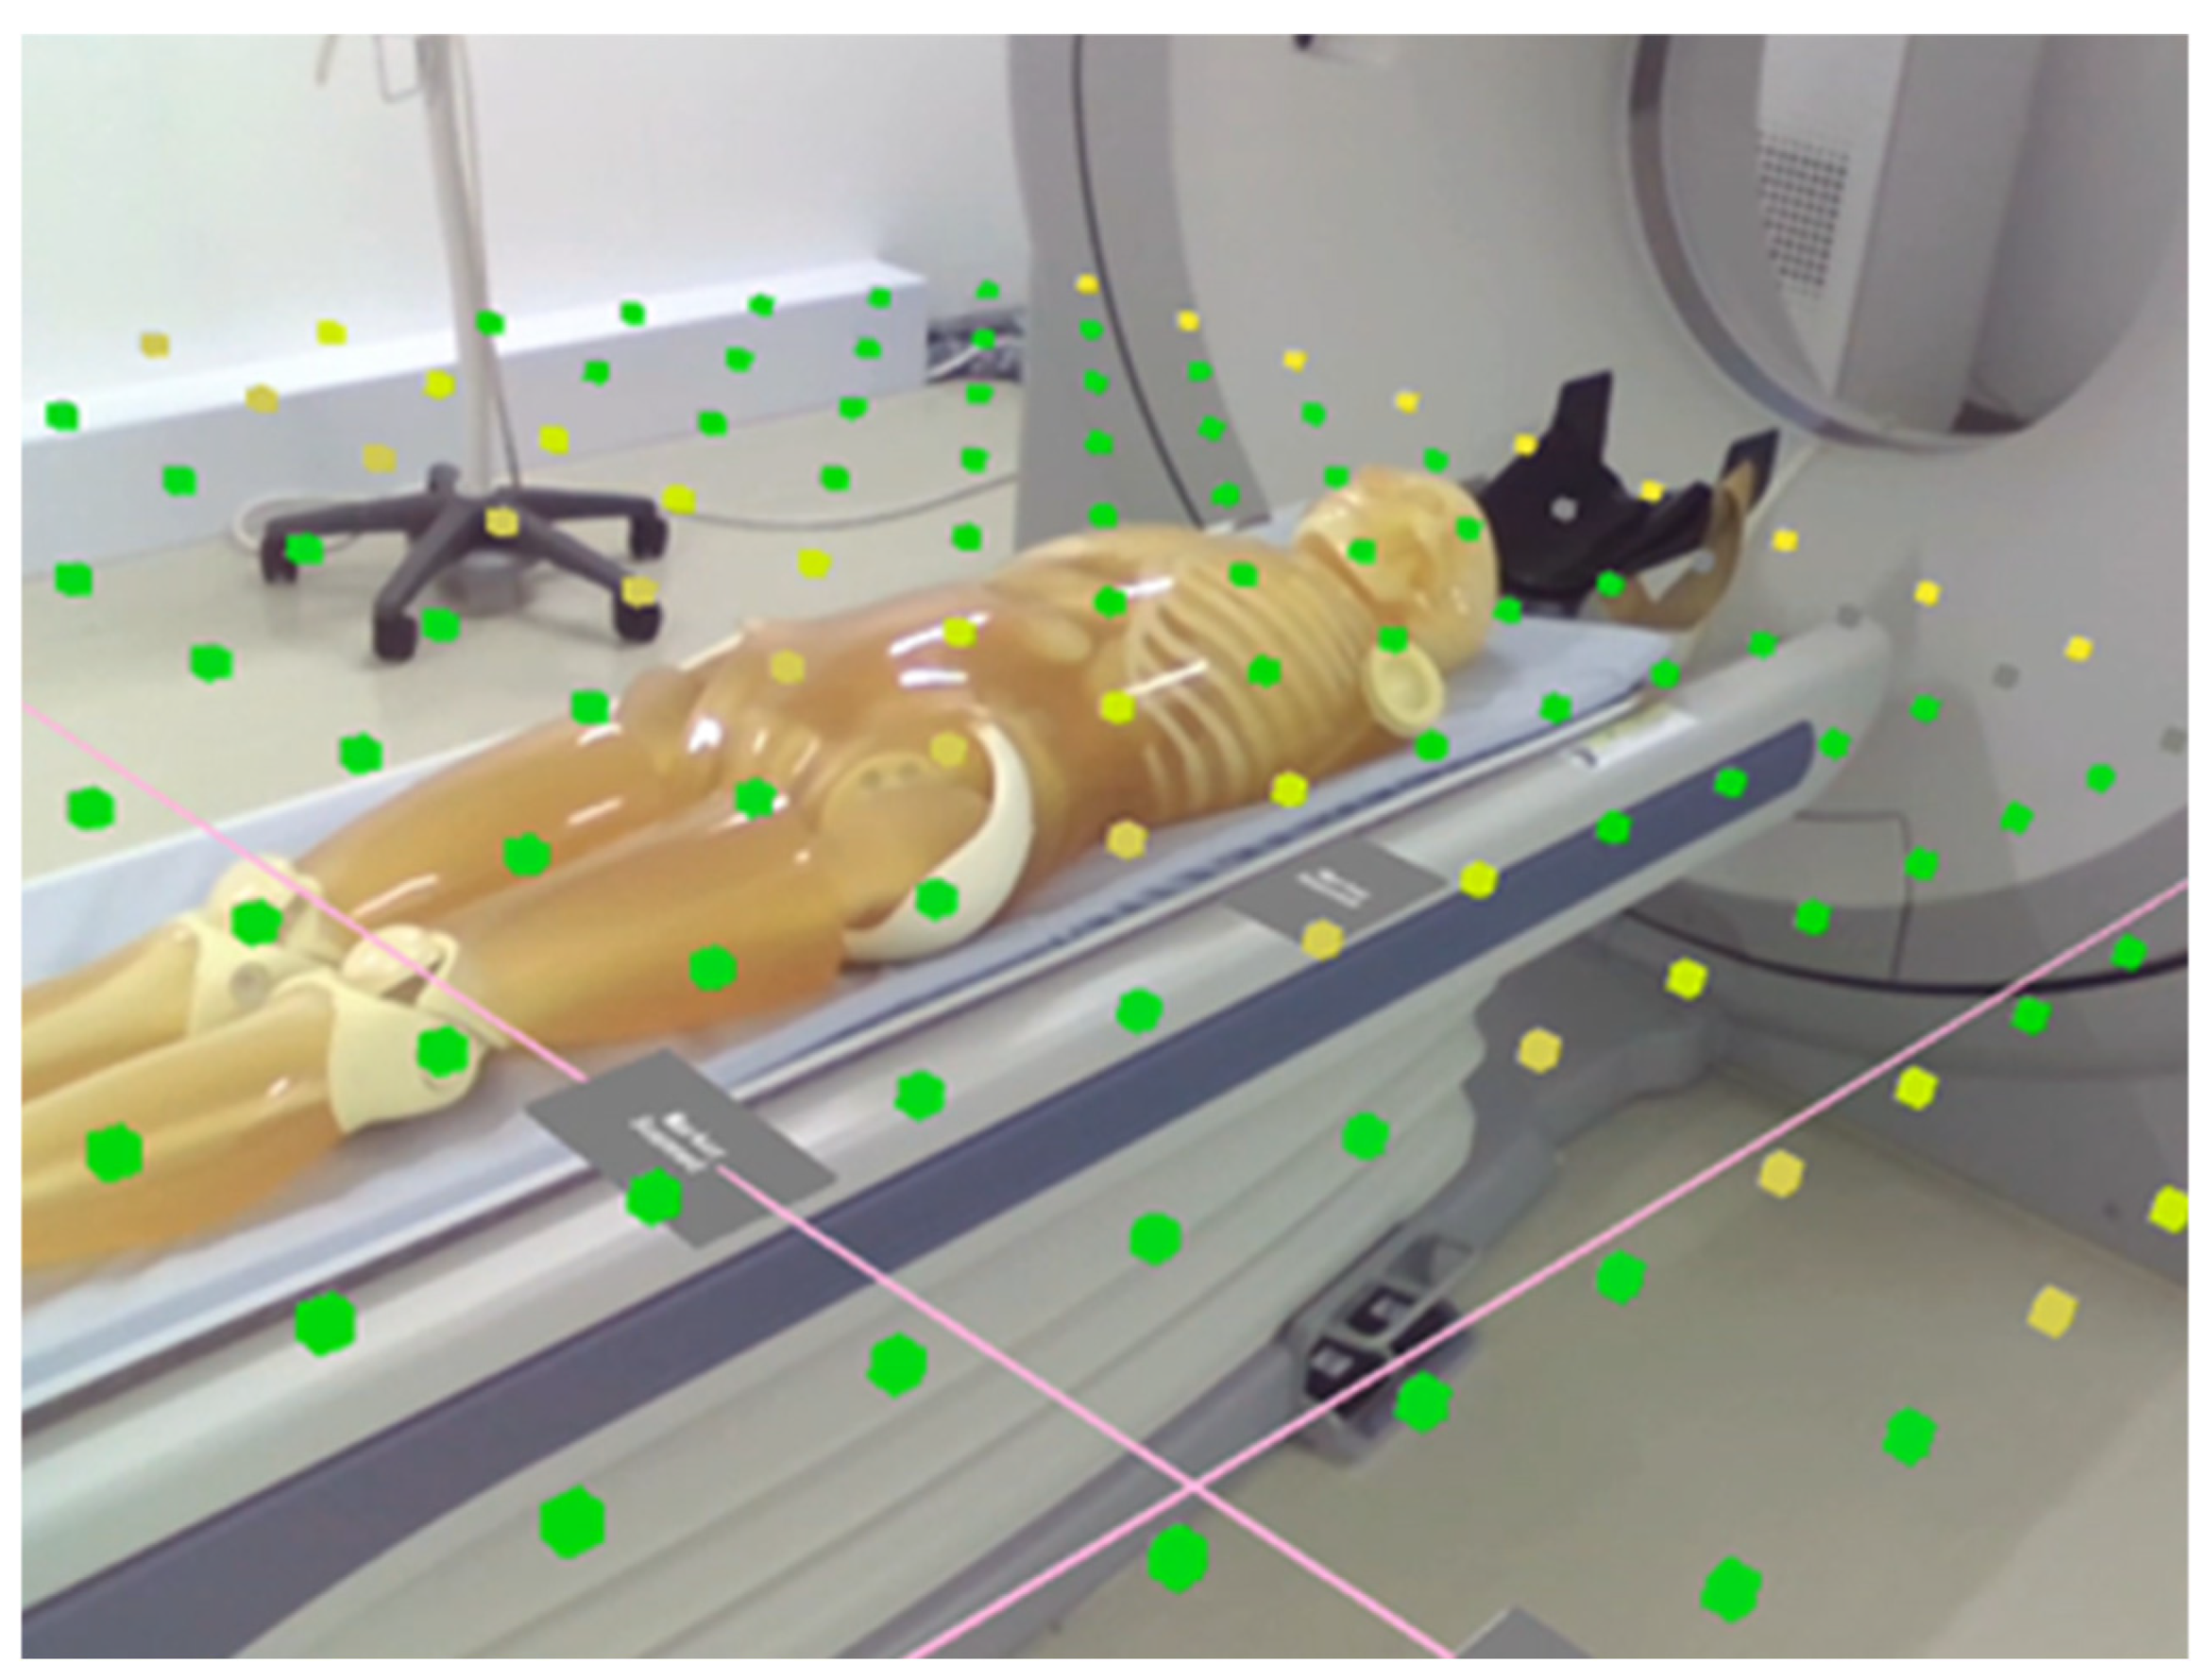
AR-displayed cubes change color according to the radiation dose. Colors are expressed using seven levels based on Red–Green–Blue (RGB) values, linearly mapped to the scattered radiation dose calculated with PHITS. In this PoC study, cube size, spatial spacing, and color mapping were fixed across participants to ensure consistent visualization of Monte Carlo-derived cumulative scatter radiation distributions and to minimize experimental variability. Transparency was selected as the primary adjustable parameter because it directly influences visibility of the physical space, which is critical for safety during CT-guided procedures. Users can identify high-dose regions based on color differences. Figure 3 provides an example of AR visualization, showing the display state when the implemented clipping function is applied. Not all CG cubes are displayed, and the cube colors do not represent actual radiation dose. The clipped view in this figure is provided to clearly illustrate the size and spacing of the CG cubes. During the ergonomic assessment, participants viewed the full set of CG cubes. Alternative visualization methods, such as surface heatmaps, were considered; however, CG cubes were chosen to enable three-dimensional perception of dose distributions while preserving spatial perception.
Figure 3.
AR visualization of the cumulative scattered radiation distribution. For clarity of presentation, the clipping display function was applied in this figure [40]. Clipping was applied in this illustration only to improve visual clarity.
2.2. Workload Assessment
Workload during the AR experience was assessed using the NASA Task Load Index (NASA-TLX), a subjective tool consisting of six subscales: mental demand, physical demand, temporal demand, performance, effort, and frustration level (Table 2). Each subscale is rated on a scale ranging from 0 to 100. Subsequently, participants performed pairwise comparisons for all 15 possible combinations of the six subscales to determine which factors contributed more strongly to perceived workload in each comparison. The number of times each subscale was selected was used as a weighting factor (0–5). Weighted scores for the six subscales were calculated accordingly. The overall weighted task load (OWTL), ranging from 0 to 100, was obtained by multiplying each subscale rating by its weighting factor, summing the results, and dividing by 15.
Table 2.
NASA-TLX rating scale definitions.
2.3. Usability Assessment
Usability was assessed using the System Usability Scale (SUS), developed by Brooke in 1986 [41]. The SUS has been widely applied to assess the usability of e-learning [42,43] and web-based systems [44,45]. Its practical advantages include rapid administration and scoring, making it well-suited for user experience assessment. Bangor et al. reported correlations between SUS scores and adjective-based rating scales, demonstrating that the SUS can accurately characterize system usability [46]. The SUS is a 10-item questionnaire designed to assess subjective usability. The standard items are as follows:
Question 1 (Q1): I think I would like to use this product frequently.
Question 2 (Q2): I found the product unnecessarily complex.
Question 3 (Q3): I thought the product was easy to use.
Question 4 (Q4): I think I would need the support of a technician to use this product.
Question 5 (Q5): I found that various functions of the product were well integrated.
Question 6 (Q6): I thought there was too much inconsistency in this product.
Question 7 (Q7): I imagine that most people would learn to use this product very quickly.
Question 8 (Q8): I found the product very awkward to use.
Question 9 (Q9): I felt very confident using the product.
Question 10 (Q10): I needed to learn many things before I could get going with this product.
The SUS questionnaire consists of 10 items, with positively and negatively worded questions presented alternately. Responses were recorded on a five-point Likert scale (1 = strongly disagree, 2 = disagree, 3 = neither agree nor disagree, 4 = agree, and 5 = strongly agree). Raw responses were converted into adjusted scores ranging from 0 to 4. For positively worded items (odd-numbered questions), 1 was subtracted from the response score; for negatively worded items (even-numbered questions), the response score was subtracted from 5. The overall SUS score was calculated by multiplying the sum of the adjusted item scores by 2.5, as shown in Equation (1):
where denotes the score for the -th questionnaire item.
2.4. Participants
As this study involved a subjective assessment of the AR display system under non-clinical settings, participation by licensed medical professionals was not required. To minimize variability in task performance due to differences in clinical experience, undergraduate students were selected, assuming a relatively uniform skill level for the target tasks. Eligible participants were fourth-year students enrolled in the radiological technologist education program at the Department of Radiological Sciences and Informatics, School of Health Sciences, International University of Health and Welfare, Narita Campus. A total of 53 eligible fourth-year students were informed about the study. Among them, 24 students voluntarily provided written informed consent and were enrolled. All enrolled participants completed the experimental protocol and were included in the final statistical analysis. A power analysis was conducted to determine the required sample size. Assuming a medium effect size (Cohen’s d = 0.5), a significance level of α = 0.05, and a target statistical power of 0.80, the minimum required sample size was calculated to be 24 participants. Students who routinely required prescription glasses for daily activities were excluded.
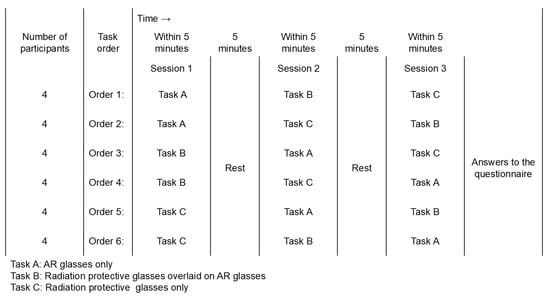
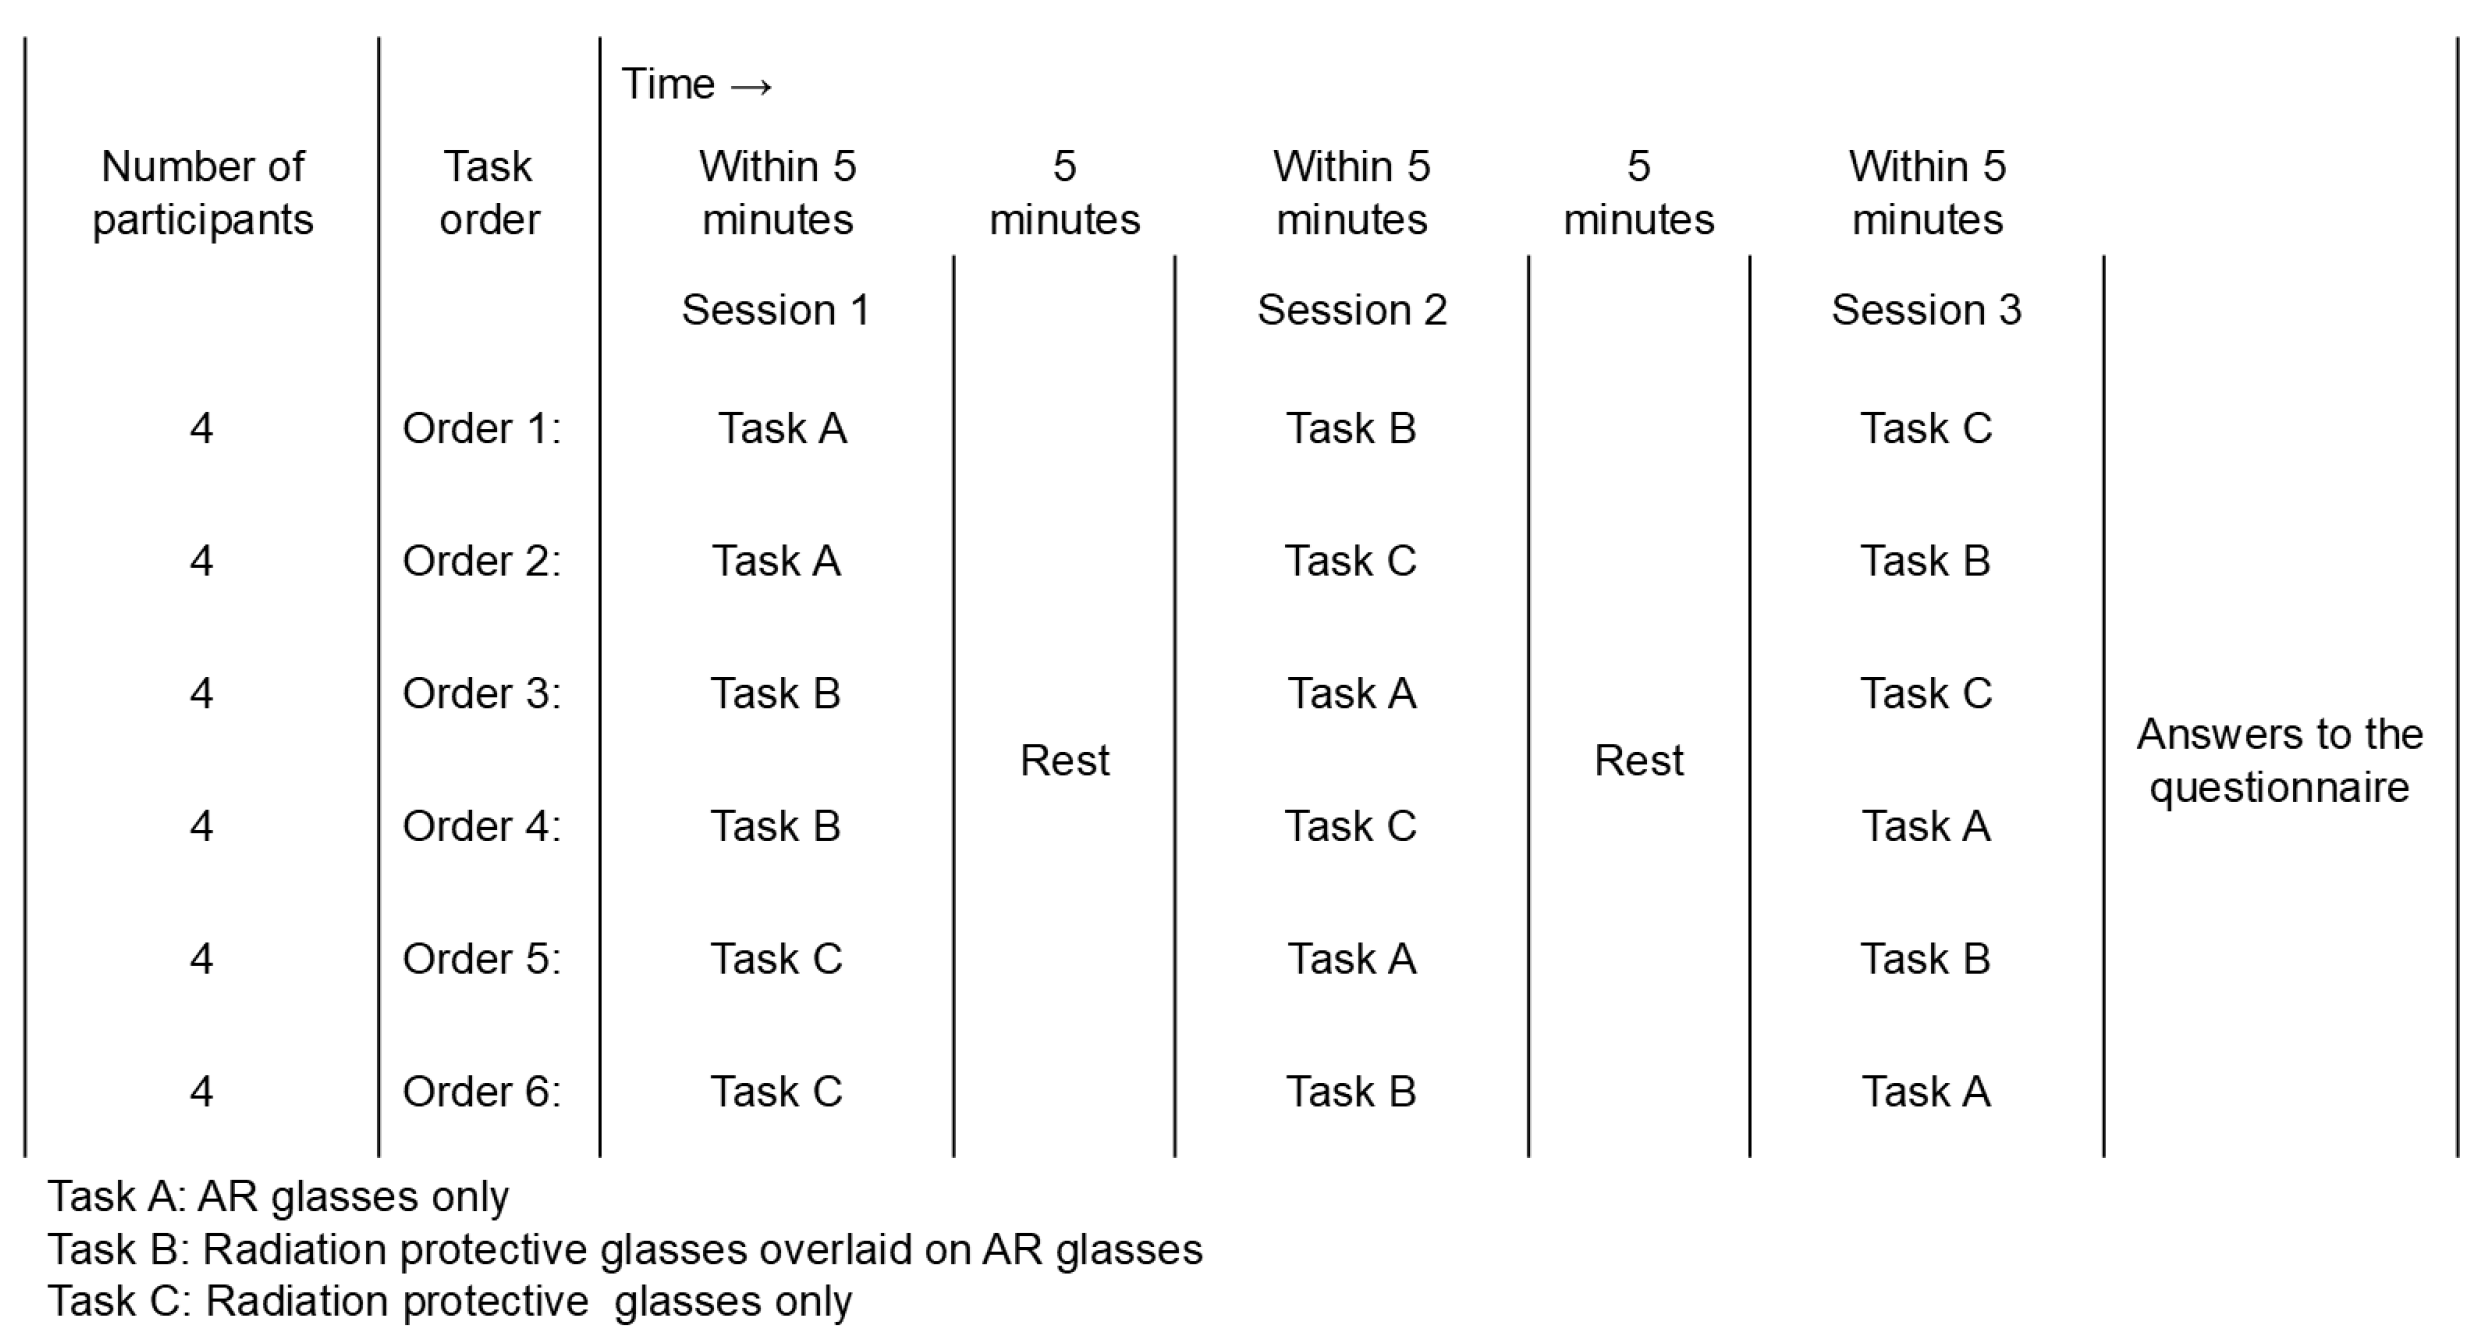
A workload assessment was designed to reflect realistic usage scenarios. Three experimental conditions were established: AR glasses alone, AR glasses combined with radiation-protective glasses, and radiation-protective glasses alone. In CT-guided procedures, medical staff typically wear radiation-protective glasses over prescription glasses. The workload under this clinically assumed condition, which involved positioning a phantom head, was assessed for comparison. Specifically, participants visually aligned the orbitomeatal line of a head phantom placed on a CT table using infrared laser guidance from the left and right sides, adjusted the table height to position the head at the center of the gantry, and completed the task by defining the reference line position as the zero position along the table movement axis. This task represents a routine clinical procedure in CT examinations and was designed to be completed within approximately 5 min. Task duration was limited to avoid excessive visual demands associated with AR glasses. Immediately after completing each task, participants completed a questionnaire-based assessment in Japanese. Prior to the experiment, participants received instructions regarding the study purpose, questionnaire content, operation of AR glasses, display methods, and adjustment of transparency for scattered radiation dose visualization. AR visualization requires spatial registration between the AR display system and physical space using markers. The assessment focused on task performance and did not include marker alignment. To control for order effects, the presentation order of the three experimental conditions was counterbalanced. All six possible task sequences were prepared in advance, with four participants randomly assigned to each sequence. Usability was assessed only under the AR glasses-only condition. Statistical analyses were performed using JMP version 14.2.0 (SAS Institute Inc., Cary, NC, USA). A flowchart of the workload assessment experiment is shown in Figure 4.
Figure 4.
Flowchart of experimental conditions. All possible combinations of the three task conditions (A, B, C) were presented to participants to control for order effects.
3. Results
The simulated task, designed to represent a routine clinical procedure, was relatively simple, and all participants completed it within approximately 5 min. All participants had completed clinical training, and none experienced difficulty performing the task. After completing the three experimental conditions, all participants responded to all questionnaire items. The final sample comprised 24 participants (14 men and 10 women). As an indicator of academic performance among university students, the mean functional grade point average (fGPA) was 2.79 (standard deviation [SD], 0.43; median, 2.79) for men and 2.56 (SD, 0.40; median, 2.52) for women. For all participants combined, the mean fGPA was 2.69 (SD, 0.42; median, 2.66). The fGPA was calculated by summing the product of the grade points (ranging from 0 to 4.5) assigned to each completed course and the corresponding number of credits, then dividing this sum by the total number of completed credits.
The internal consistency of workload-related questionnaire responses was evaluated for the three task conditions. Cronbach’s alpha coefficients were 0.75 for the AR glasses-only condition, 0.76 for the AR glasses combined with radiation-protective glasses condition, and 0.87 for the radiation-protective glasses-only condition, indicating sufficient internal consistency. Scores for the six NASA-TLX subscales (Mental Demand, Physical Demand, Temporal Demand, Own Performance, Effort, and Frustration Level) without weighting were referred to as the raw task load (RTL). The overall score obtained by applying weighting coefficients derived from pairwise comparisons is referred to as the OWTL. Descriptive statistics for both RTL and OWTL are presented in Table 3.
Table 3.
Descriptive statistics of the NASA Task Load Index under different eyewear conditions.
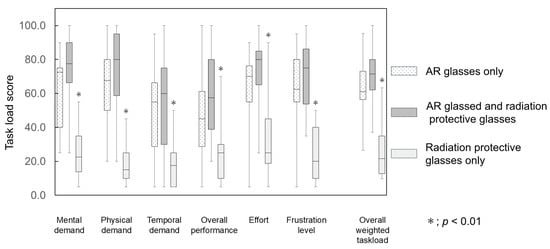
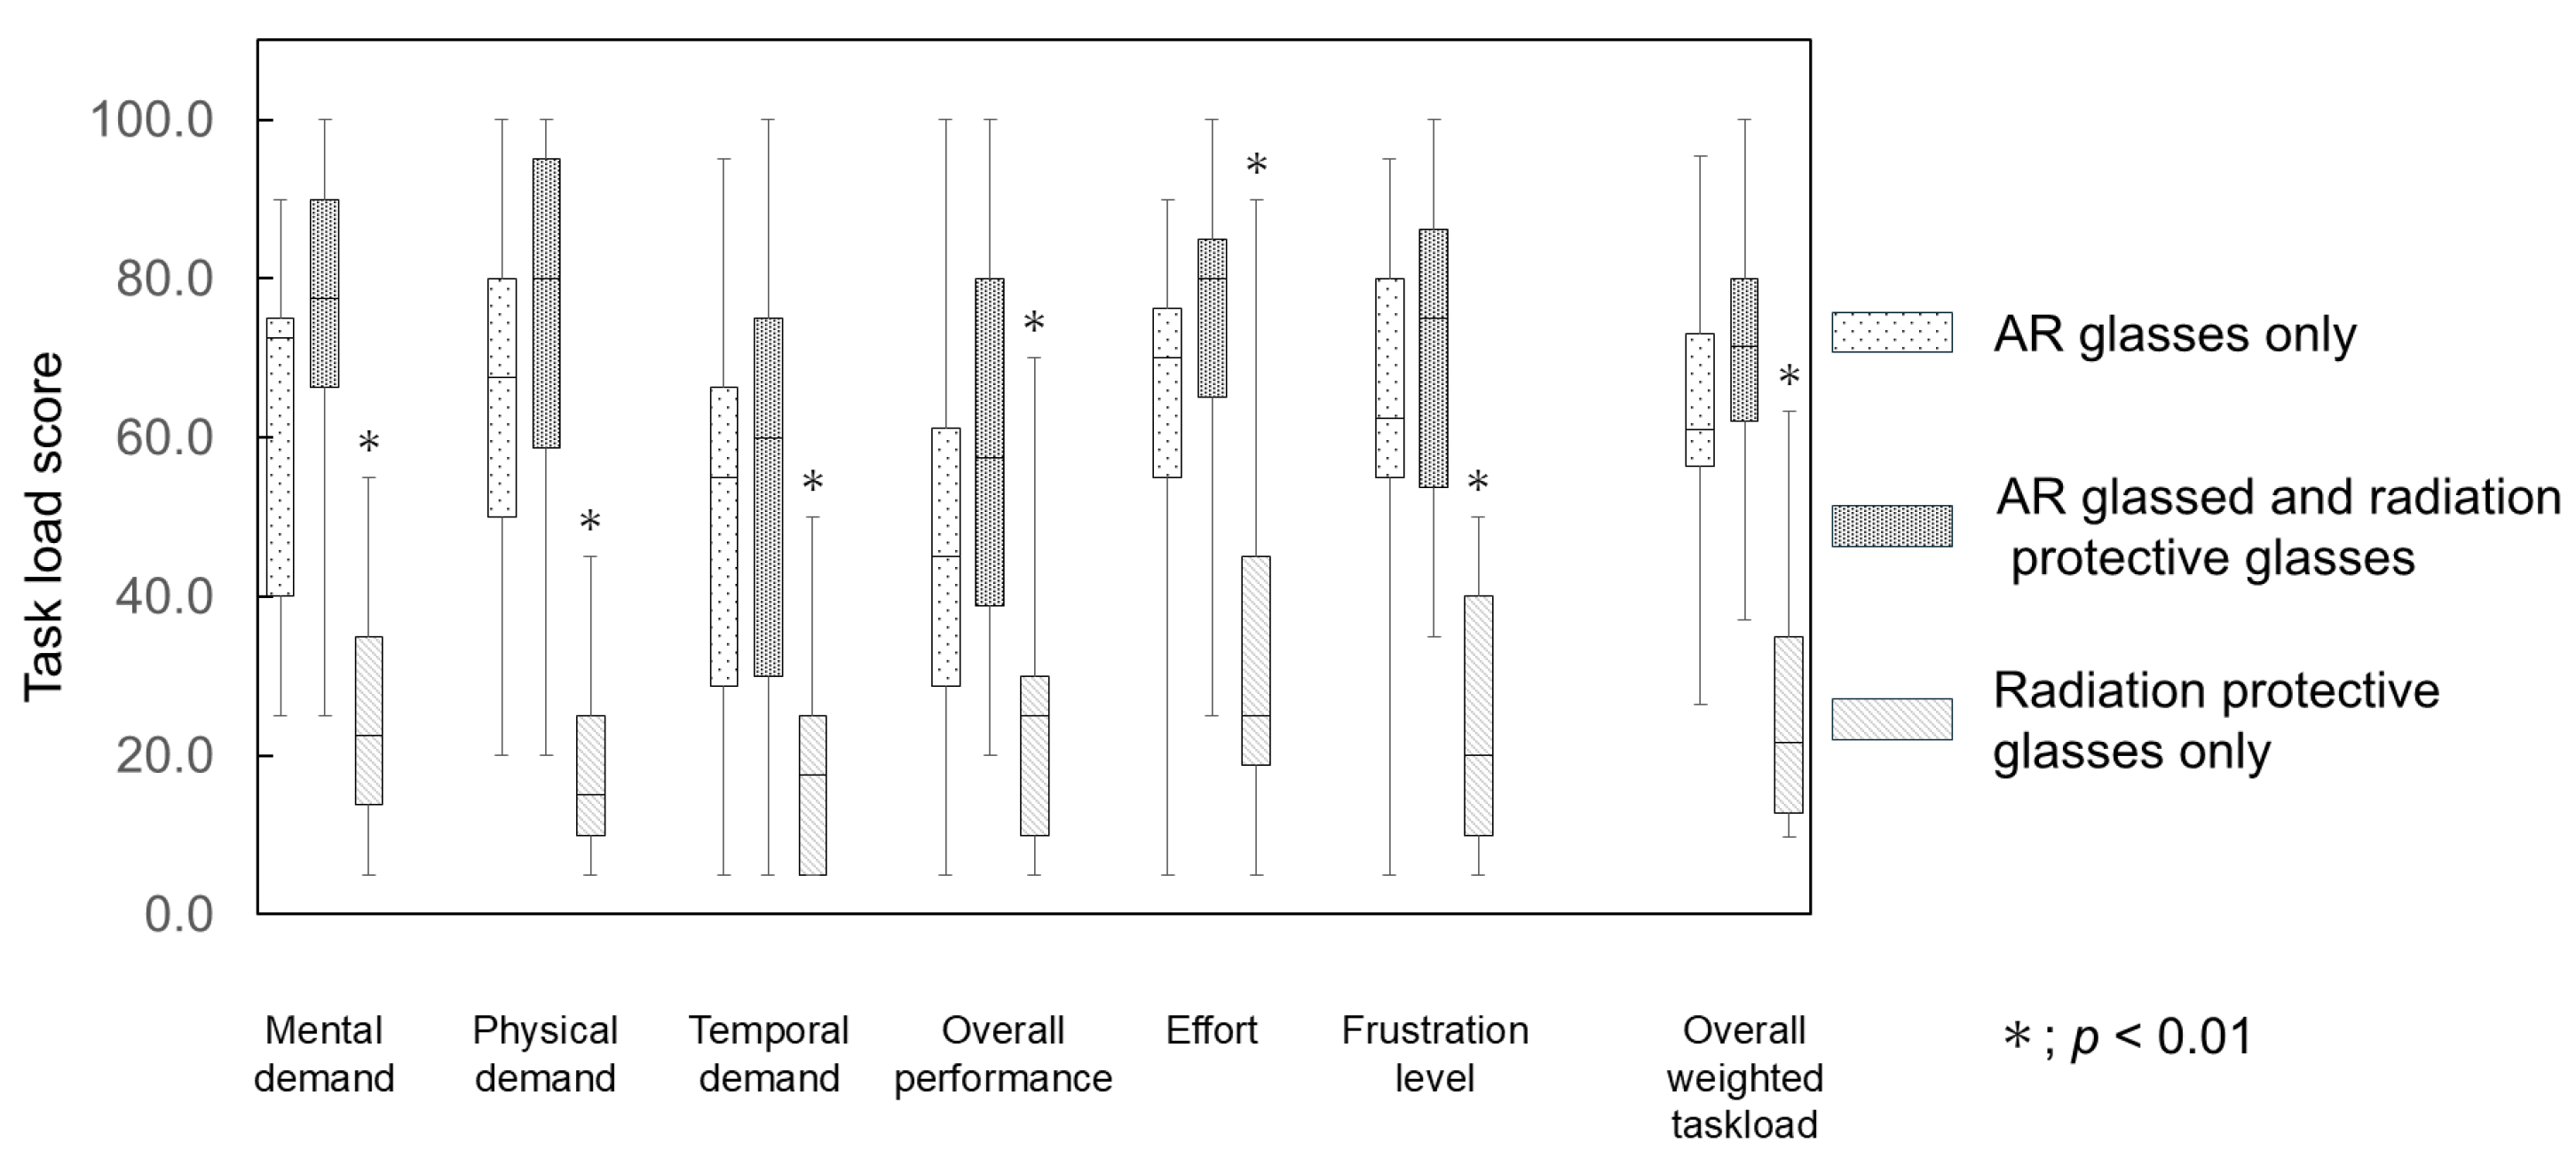
Normality was evaluated using the Shapiro–Wilk test, and several variables violated the normality assumption. Accordingly, nonparametric multiple comparisons were performed using the Steel–Dwass test, with the AR glasses-only condition serving as the control. For both RTL and OWTL, statistically significant differences (p < 0.01) were observed between the radiation-protective glasses-only condition and the AR glasses-only condition (Figure 5). No statistically significant differences were observed between the AR glasses-only condition and the AR glasses combined with radiation-protective glasses condition. Table 4 presents the coefficients of multiple determination (r2) and standardized partial regression coefficients (β weights) obtained from multiple regression analyses, with OWTL as the dependent variable and the six RTL subscale scores as independent variables. Strong positive correlations between RTL and OWTL were observed for all eyewear conditions. In the AR glasses-only and AR glasses combined with radiation-protective glasses conditions, RTL scores for physical demand and frustration level were significantly associated with OWTL. Under the radiation-protective glasses-only condition, significant associations with OWTL were observed for all subscales except temporal demand and frustration level.
Figure 5.
Task load scores under different eyewear conditions. Neither the raw task load nor the overall weighted task load showed statistically significant differences when radiation-protective glasses were used in combination with AR glasses, as compared with the use of AR glasses alone. Statistically significant differences were observed when radiation-protective glasses were used alone (*). Abbreviations: AR, augmented reality.
Table 4.
Coefficients of multiple determination (r2) and standardized partial regression coefficients (β weights) for the six NASA-TLX subscales regressed on OWTL.
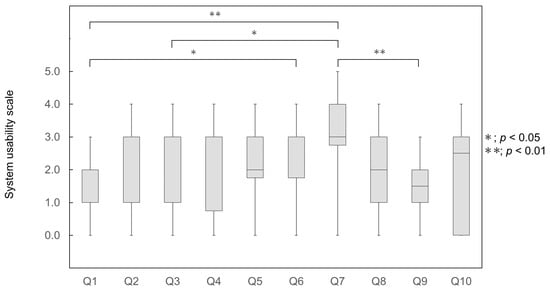
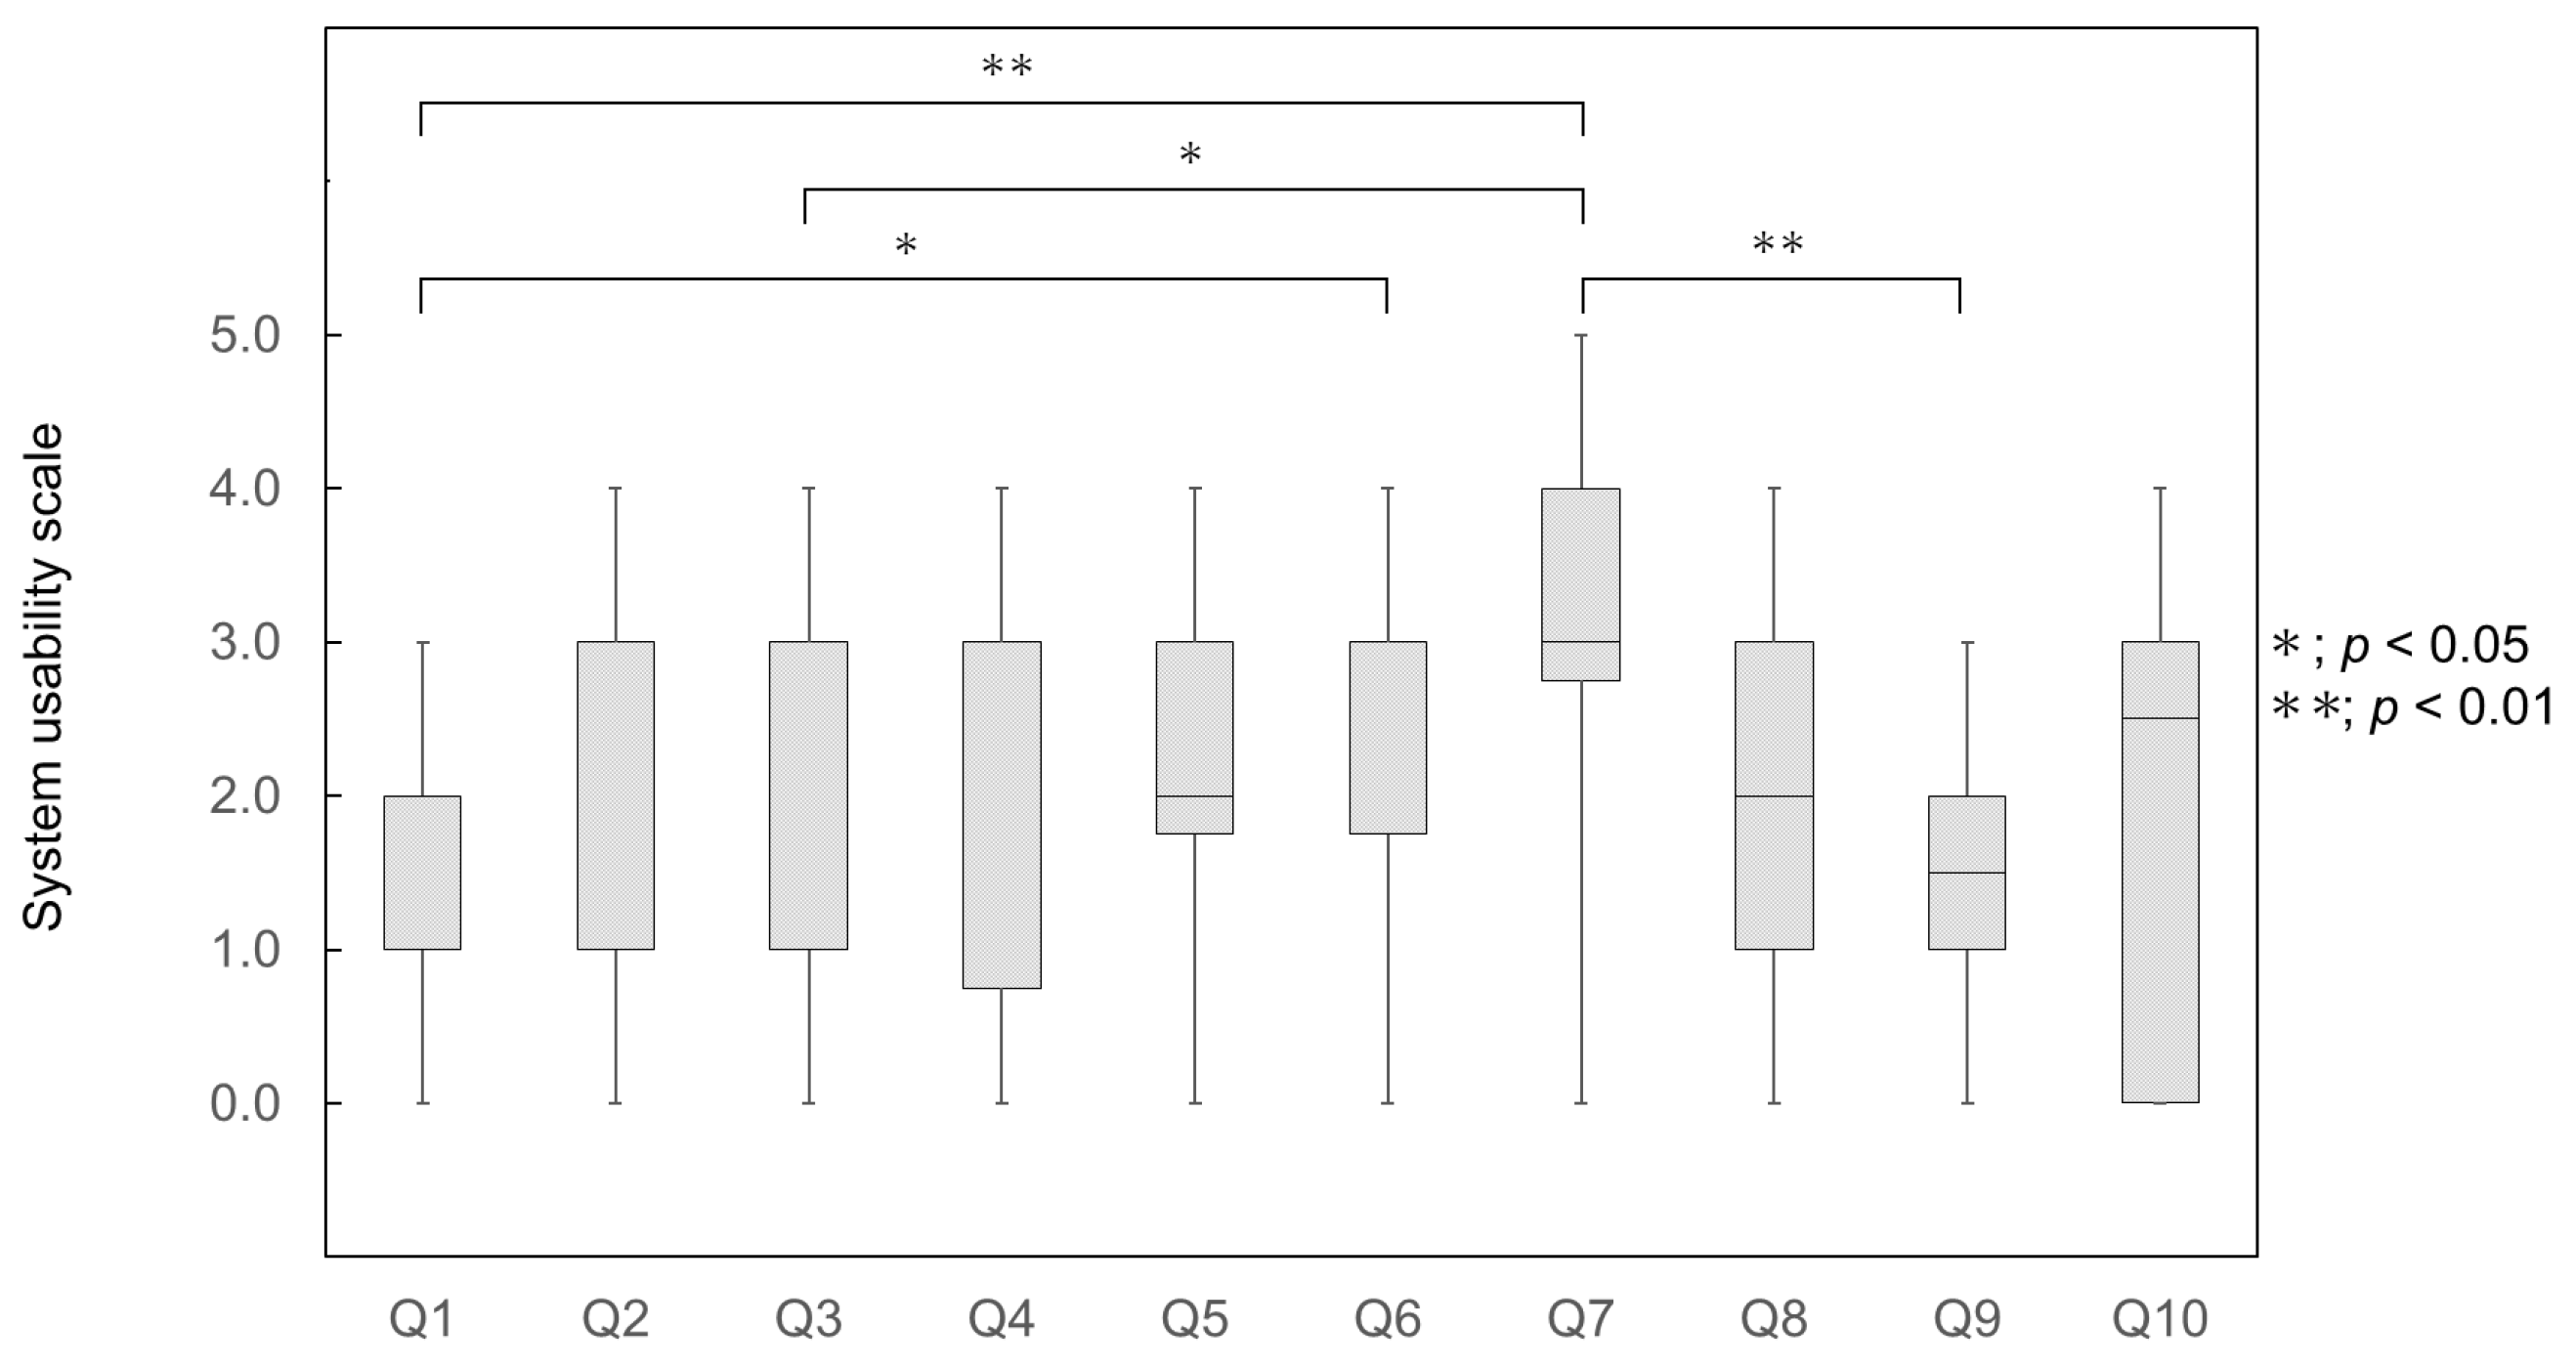
The results of the usability assessment are summarized in Table 5. The internal consistency of the SUS responses was evaluated, yielding a Cronbach’s alpha coefficient of 0.75, indicating adequate reliability. For the adjusted scores, the minimum value across items was 0. The maximum adjusted scores were 3 for Questions 1–9 and 4 for all other items. Based on these adjusted scores, the minimum and maximum SUS scores were 15 and 80, respectively. The mean SUS score for the 24 participants was 49.8 ± 17.2. Homogeneity of variance was examined using Levene’s test, which was significant (F(9, 230) = 4.31, p < 0.01), indicating heteroscedasticity. Welch’s analysis of variance revealed a significant effect (F(9, 93.4) = 5.46, p < 0.01). Normality was further evaluated using the Shapiro–Wilk test, with violations identified. Post hoc comparisons of item scores were performed using the nonparametric Tukey–Kramer test. Statistically significant differences were observed at the 1% significance level between Questions 1 and 7 and between Questions 1 and 6, and at the 5% significance level between Questions 3 and 7 and between Questions 7 and 9 (Figure 6).
Table 5.
Adjusted scores and descriptive statistics of the SUS for AR glasses.
Figure 6.
Ratings for individual questions on the SUS during AR glasses use. Abbreviations: AR, augmented reality; SUS, System Usability Scale.
4. Discussion
The primary novelty of this study lies not merely in the application of AR technology, but in the integration of Monte Carlo-derived, angle-dependent cumulative scattered radiation distributions unique to PACT into an AR-based decision-support framework. Previous AR applications in radiation-related fields have emphasized real-time dose feedback or visualization of scattered radiation distributions. The present system visualizes pre-calculated cumulative scatter radiation distributions that vary according to selectable exposure angles, thereby supporting occupational exposure management during CT-guided interventions. This angle-dependent radiation visualization approach represents a conceptual advancement beyond conventional AR-based visualization methods.
Reducing occupational exposure during CT-guided procedures is a critical aspect of radiation safety management. To address this issue, a PoC ergonomic evaluation was conducted using AR glasses designed to visualize scattered radiation distributions within the CT suite during PACT procedures. AR glasses allow medical staff to see temporally changing dose distributions, enabling adjustments to imaging protocols with the goal of minimizing occupational exposure. Subjective user experience is a key factor in clinical implementation. The workload and usability were assessed using the NASA-TLX and the SUS.
In the NASA-TLX assessment, both RTL and OWTL scores were the lowest when radiation-protective glasses were used alone. Contrary to my initial hypothesis, the use of AR glasses increased perceived workload, offering no apparent advantage over conventional radiation-protective glasses. Previous studies in medical settings that evaluated AR glasses using the NASA-TLX have reported lower workload with AR use than that observed under control conditions, attributing this effect to enhanced cognitive support provided by AR visualization [47,48]. In contrast, other studies have shown that increased visual perception can elevate perceived workload [49,50]. The increased workload observed with AR glasses in this study is likely attributable to the addition of scattered radiation dose distribution to the visual field, which increased overall visual perception. It should also be noted that visualization parameters such as cube size, spatial spacing, and color mapping were not systematically optimized in this study. Part of the observed workload increase may reflect a non-optimized graphical representation rather than the intrinsic characteristics of AR itself.
An increase in perceived workload is not necessarily detrimental. In cognitive ergonomics, additional mental demand may represent either extraneous workload unrelated to task goals or necessary cognitive effort that supports improved decision-making [51,52]. In the present context, part of the increased workload may reflect device-related or visual constraints, which would be undesirable, whereas increased cognitive engagement associated with heightened radiation visualization perception may constitute task-relevant effort. If such effort contributes to safer angle selection or reduced occupational exposure, a moderate increase in workload may be justified. Therefore, the clinical effectiveness of AR-based radiation visualization should be evaluated by balancing subjective workload against objective metrics, including measurable reductions in radiation dose.
Studies comparing virtual and non-virtual environments have also reported that differences in spatial perception associated with information volume can influence workload [53]. Furthermore, the physical characteristics of devices used to construct virtual environments have been reported to affect physical workload [54]. One structural limitation of the AR glasses used in this study was their lower transparency than that of conventional radiation-protective glasses. Although the application allowed AR content to be hidden and the transparency of CG elements to be adjusted, the inherent transparency of the AR glasses remained lower, reducing visibility of the surrounding physical space. Additionally, the AR glasses were connected to a smartphone via a wired connection, and display settings required interaction with the smartphone application, which may have further contributed to increased workload. For the participants, operating an unfamiliar application may have contributed to the increased workload. The selected task, phantom head positioning, was brief and did not strongly require radiation-related decision-making. The added visualization of scattered radiation distributions may not have provided substantial cognitive support within this experimental context. In relatively low-complexity tasks, AR-based visual overlays may function primarily as additional visual perception, thereby increasing cognitive workload. In contrast, during more complex CT-guided procedures involving prolonged fluoroscopy, angle-dependent radiation visualization may enhance situational perception and support radiation-aware decision-making. Thus, task complexity likely moderates the balance between AR-induced workload and its clinical effectiveness. Radiation-protective glasses, which maintain high transparency and are lighter than AR glasses, impose lower visual and physical demands. The condition in which radiation-protective glasses were worn over AR glasses most closely approximated the anticipated clinical implementation scenario. The workload under this condition did not differ from that observed with AR glasses alone. This finding suggests that, when AR glasses are used, the presence or absence of radiation-protective glasses has little impact on perceived workload, indicating a substantial difference in subjective user experience between AR glasses and radiation-protective glasses. However, the lack of a statistically significant difference between the “AR glasses” and “AR glasses + radiation-protective glasses” conditions should be interpreted with caution. Rather than reflecting true ergonomic equivalence, this result may stem from the limited sensitivity of subjective assessment scales in a small sample or from a “saturation effect”, whereby the baseline associated with AR glasses masks the incremental workload imposed by radiation-protective glasses. In other words, the inherent physical and visual demands of the current AR glasses may be sufficiently high so that the addition of radiation-protective glasses does not further increase the perceived workload to a measurable extent.
The experience generated by the AR glasses was less immersive than that produced by VR-based virtual environments. VR does not allow visualization of the physical space; however, it has been shown to be effective in medical education settings where experiential freedom is prioritized [55]. AR must preserve real-world visibility to ensure safety during clinical tasks. In clinical applications, AR serves as an auxiliary source of visual perception, with interaction with the physical space remaining primary, making AR more suitable than VR for such contexts. AR has also been reported to improve work efficiency and safety. In this study, AR glasses were developed to visualize scattered radiation distributions without interfering with real-world task performance. To enable clinical implementation, increases in perceived demand should be minimized so that workload remains comparable to that experienced when using radiation-protective glasses alone. Improvements in application operability and visualization methods are required to reduce the workload gap between AR and radiation-protective glasses. Future studies should also examine the relationship between increased workload and reductions in occupational exposure, with the aim of optimizing both factors concurrently. These findings suggest several practical design requirements for clinical settings. Because radiation-protective glasses are routinely worn during CT-guided procedures, AR glasses must be ergonomically compatible with layered conditions. A preliminary ergonomic benchmark may be that the combined use of AR glasses and radiation-protective glasses should not impose a workload exceeding that of radiation-protective glasses alone. Designs that substantially reduce visibility of the physical space, increase visual perception beyond task-relevant needs, or introduce additional physical workload under layered conditions should be avoided unless clear safety or performance benefits are demonstrated. Establishing such ergonomic thresholds may help define minimum requirements for a clinical AR display system.
System usability is defined in ISO 9241-11:2018 as “the extent to which a system, product, or service can be used by specific users to achieve specific goals with effectiveness, efficiency, and satisfaction in a specific context of use” [56]. In this study, usability was evaluated from the perspectives of effectiveness, efficiency, and satisfaction. Among usability metrics, the SUS was selected because it is widely used and enables rapid assessment. Although SUS scores are strongly influenced by user preferences, the simplicity of the questionnaire facilitates efficient assessment. Among the 10 SUS items, the highest score was observed for Question 7 (“I imagine that most people would learn to use this product very quickly”), indicating that participants perceived the system as relatively easy to learn. Lower scores were observed for items such as Question 1 (“I think that I would like to use this product frequently”) and Question 9 (“I felt very confident using the product”). These findings suggest that enhancing users’ understanding of the importance of reducing occupational radiation exposure through visualization of scattered radiation distributions is critical for improving perceived usability. Educational interventions related to radiation safety management may be required to enhance these evaluations. Assessing users’ baseline understanding of radiation protection and providing additional education, when necessary, may facilitate more effective use of AR-based visualization for reducing occupational exposure. Consistent with this interpretation, previous research has demonstrated that pre-training is effective for knowledge acquisition and transfer in immersive environments [57]. Lower SUS scores to use the system may also be associated with the increased workload observed in this study. The NASA-TLX results shown in Figure 4 indicate that physical demand contributed substantially to the overall workload, suggesting that reduced visibility of the physical space and the method used to visualize scattered radiation distributions may have affected task performance. The AR display system provides adjustable parameters—including color schemes, cube dimensions, spatial spacing, and transparency. Only transparency was modified in the present study. Consequently, reduced visibility of the surrounding physical space may have contributed to the increased perceived demand. Overall, the SUS scores were relatively lower than those reported previously. According to the evaluation criteria proposed by Bangor et al. [44], the SUS score obtained in this study corresponds to “Not acceptable” in acceptability ranges and “Poor” in the adjective rating scale. Previous analyses have suggested that SUS scores of 61 or higher indicate marginal acceptability, and scores of 70 or higher are considered acceptable. Additionally, large-scale studies have reported a median SUS score of approximately 68 [58]. These comparisons indicate that the usability of the AR glasses evaluated in this study was relatively low. Consistent with prior reports, user preferences and prior experiences are known to influence SUS scores [59,60]. Even if a certain degree of visual discomfort associated with AR use is tolerated, further improvements in AR visualization functionality remain necessary. Although AR was selected to balance visibility of the physical space with CG overlays, reduced visibility persisted when the AR display was activated. When AR visualization is used concurrently with task execution, system settings should be optimized to approximate the sensory experience of not wearing AR glasses as closely as possible. Previous studies have reported correlations between SUS scores and Intrinsic Motivation Inventory (IMI) scores [61]. The IMI, based on self-determination theory, may serve as a complementary tool for multidimensional usability evaluation [62]. Enhancing users’ understanding of the significance of visualizing scattered radiation distributions—and fostering such visualization can contribute to reducing occupational exposure—may improve system usability by increasing intrinsic motivation.
It must be acknowledged that the statistical processing of NASA-TLX and SUS data, specifically, the transformation of Likert scales into interval scales for regression analysis, carries inherent methodological limitations. Given the small sample size and non-normal distribution of the data, the regression results should be interpreted as an exploratory analysis of the internal structure of the subjective workload within this specific cohort rather than as definitive evidence of generalized causal relationships. Future studies with larger and more diverse samples are required to confirm these correlations using more robust statistical methods, such as Pearson correlation analysis, once statistical reliability is established.
This study has some limitations. First, the participants were undergraduate students rather than medical professionals. Although the selection of students allowed for a relatively uniform level of knowledge and skills, their lack of practical experience with CT-guided procedures limited the ability to evaluate the influence of clinical expertise on the results. This may have contributed to higher perceived frustration and lower performance scores on the NASA-TLX, as the students were less familiar with clinical procedures. The observed workload and usability results primarily reflect subjective responses in a non-clinical setting and may differ for experienced medical professionals. The use of undergraduate students may therefore limit the external validity of the findings. Medical professionals familiar with CT-guided workflows may perceive lower cognitive workload owing to procedural expertise and routine multitasking under fluoroscopic conditions. Future studies involving licensed medical professionals are necessary to determine how clinical experience, risk perception, and professional motivation influence the acceptance and effectiveness of AR-based radiation visualization systems. Second, the task duration was limited to 5 min, which resulted in minimal interaction with the smartphone application. The application offers adjustable parameters, including cube color, size, and spacing; optimization of these parameters was not examined in this study. Increasing the number of grid points used to represent scattered radiation distributions increases the number of displayed CG cubes, which may influence subjective assessments. This finding highlights the need to determine the minimum CG representation required to effectively convey scattered radiation distributions. It should be noted that in this PoC study, quantitative evaluation of AR registration overlay accuracy was not performed, as the focus was on subjective workload and usability under non-clinical settings. For clinical applications, accurate spatial registration is critical to ensure that users can reliably interpret scattered radiation distributions. Additional studies should include evaluation of AR-to-physical space registration to prevent misinterpretation of high-dose areas in CT-guided procedures. Third, the assessment methods were limited to the NASA-TLX and SUS. In particular, the SUS results were interpreted on the basis of item scores, and the inclusion of free-text responses might have provided more detailed insights into specific aspects of the system requiring improvement. Objective performance metrics such as task completion time, positioning accuracy, gaze behavior, or quantitative dose reduction were not evaluated. Because this study was designed as an initial ergonomic PoC focused on subjective feasibility, performance-based evaluations were beyond its scope. Future investigations should integrate objective performance metrics and dose indices to better determine the clinical effectiveness of AR-based radiation visualization systems. Finally, it should be emphasized that the primary contribution of this study lies in ergonomic and human–computer interaction evaluation. The Monte Carlo-derived scattered radiation distributions were used as pre-calculated data and were not validated or adapted to clinical settings. Therefore, the present findings should be interpreted within the scope of a PoC study focusing on user experience and feasibility. The absence of occupational radiation exposure monitoring integration limits the generalizability of the results to diverse procedural settings. Future research should investigate under actual clinical settings to enhance technical robustness and external validity.
5. Conclusions
This study evaluated workload and system usability using the NASA-TLX and SUS for AR glasses designed to virtually overlay scattered radiation distributions during PACT, with the goal of reducing occupational exposure among medical staff performing CT-guided procedures. Regarding workload, a statistically significant reduction was observed when radiation-protective glasses were used alone, compared with both the AR glasses-only condition and the condition in which radiation-protective glasses were worn in combination with AR glasses. From a workload perspective, it is desirable that the perceived demand of wearing AR glasses—whether alone or in combination with radiation-protective glasses—be comparable to that experienced with radiation-protective glasses alone. This condition may serve as a preliminary ergonomic threshold for clinical implementation, given that radiation-protective glasses are routinely required during CT-guided procedures. AR glasses intended for clinical use should be compatible with layered eyewear and avoid imposing additional visual or physical workload beyond that associated with radiation-protective glasses. System usability scores were relatively lower than those reported in previous studies, indicating that improvements in user satisfaction are necessary. Collectively, these findings highlight several areas for enhancement in the developed AR display system. Visualization of scattered radiation distributions inherently increases visual perception; therefore, modifications are required to improve the compatibility between CG visualization and physical space visibility, thereby minimizing visual demand and avoiding interference with task performance. Comprehensive optimization of both the AR glasses and their associated applications is required, alongside strategies to facilitate user adaptation to increased visual perception. Enhancing users’ understanding of the effectiveness of visualizing scattered radiation distributions for occupational exposure reduction is expected to improve user satisfaction, with intrinsic motivation likely contributing to overall system usability. Future PoC studies incorporating multidimensional ergonomic evaluations are warranted to address the challenges identified here. Resolving these issues will likely improve the feasibility of implementing virtual technologies for reducing occupational exposure.
Funding
This work was supported by JSPS KAKENHI Grant Number 22K07703.
Institutional Review Board Statement
This study was approved by the Ethics Review Committee of Chiba District, International University of Health and Welfare (approval number: 24–CC–017; 10 October 2024). Prior to participation, students who expressed willingness to participate in the study received both oral and written explanations. The study was conducted only after obtaining informed consent from all participants.
Informed Consent Statement
Informed consent was obtained from all subjects involved in the study.
Data Availability Statement
The original contributions presented in this study are included in the article. Further inquiries can be directed to the corresponding author.
Conflicts of Interest
The author declares no conflicts of interest.
Abbreviations
The following abbreviations are used in this manuscript:
| AR | Augmented reality |
| CG | Computer-generated |
| CI | Confidence interval |
| CT | Computed tomography |
| fGPA | Functional grade point average |
| IMI | Intrinsic motivation inventory |
| NASA-TLX | National Aeronautics and Space Administration Task Load Index |
| OWTL | Overall weighted task load |
| PACT | Partial-angle CT |
| PHITS | Particle and Heavy Ion Transport Code System |
| RTL | Raw task load |
| SD | Standard deviation |
| SUS | System Usability Scale |
References
- Haaga, J.R.; Alfidi, R.J. Precise biopsy localization by computer tomography. Radiology 1976, 118, 603–607. [Google Scholar] [CrossRef] [Scilit]
- Silverman, S.G.; Tuncali, K.; Adams, D.F.; Nawfel, R.D.; Zou, K.H.; Judy, P.F. CT fluoroscopy-guided abdominal interventions: Techniques, results, and radiation exposure. Radiology 1999, 212, 673–681. [Google Scholar] [CrossRef] [Scilit]
- Froelich, J.J.; Saar, B.; Hoppe, M.; Ishaque, N.; Walthers, E.M.; Regn, J.; Klose, K.J. Real-time CT-fluoroscopy for guidance of percutaneous drainage procedures. J. Vasc. Interv. Radiol. 1998, 9, 735–740. [Google Scholar] [CrossRef] [Scilit]
- Kim, G.R.; Hur, J.; Lee, S.M.; Lee, H.J.; Hong, Y.J.; Nam, J.E.; Kim, H.S.; Kim, Y.J.; Choi, B.W.; Kim, T.H.; et al. CT fluoroscopy-guided lung biopsy versus conventional CT-guided lung biopsy: A prospective controlled study to assess radiation doses and diagnostic performance. Eur. Radiol. 2011, 21, 232–239. [Google Scholar] [CrossRef] [Scilit]
- Prosch, H.; Stadler, A.; Schilling, M.; Burklin, S.; Eisenhuber, E.; Schober, E.; Mostbeck, G. CT fluoroscopy-guided vs. multislice CT biopsy mode-guided lung biopsies: Accuracy, complications and radiation dose. Eur. J. Radiol. 2012, 81, 1029–1033. [Google Scholar] [CrossRef] [Scilit]
- Hohl, C.; Suess, C.; Wildberger, J.E.; Honnef, D.; Das, M.; Mühlenbruch, G.; Schaller, A.; Günther, R.W.; Mahnken, A.H. Dose reduction during CT fluoroscopy: Phantom study of angular beam modulation. Radiology 2008, 246, 519–525. [Google Scholar] [CrossRef] [Scilit]
- Zanca, F.; Jacobs, A.; Crijns, W.; De Wever, W. Comparison of measured and estimated maximum skin doses during CT fluoroscopy lung biopsies. Med. Phys. 2014, 41, 073901. [Google Scholar] [CrossRef] [Scilit] [PubMed]
- International Commission on Radiological Protection (ICRP). Statement on tissue reactions/early and late effects of radiation in normal tissues and organs-threshold doses for tissue reactions in a radiation protection context, ICRP Publication 118. Ann. ICRP 2012, 411, 1–322. [Google Scholar] [CrossRef] [Scilit]
- Japan Network for Research and Information on Medical Exposure (J-RIME). National Diagnostic Reference Levels in Japan (2025) Japan DRLs 2025. Available online: https://j-rime.qst.go.jp/report/JapanDRLs2025_en.pdf (accessed on 22 December 2025).
- Takiguchi, K.; Urikura, A.; Yoshida, T.; Nakaya, Y.; Endo, M.; Aramaki, T. Radiation dose and image quality of CT fluoroscopy with partial exposure mode. Diagn. Interv. Radiol. 2020, 26, 333–338. [Google Scholar] [CrossRef] [Scilit]
- Kinoshita, E.; Miyazaki, H.; Ogawa, K.; Komiya, I.; Kato, T. Reduction of operator exposure radiation dose and evaluation of image quality using half scan in CT fluoroscopy. Nihon Hoshasen Gijutsu Gakkai Zasshi 2020, 76, 1266–1275. [Google Scholar] [CrossRef] [Scilit]
- Knott, E.A.; Rose, S.D.; Wagner, M.G.; Lee, F.T., Jr.; Radtke, J.; Anderson, D.R.; Zlevor, A.M.; Lubner, M.G.; Hinshaw, J.L.; Szczykutowicz, T.P. CT fluoroscopy for image-guided procedures: Physician radiation dose during full-rotation and partial-angle CT scanning. J. Vasc. Interv. Radiol. 2021, 32, 439–446. [Google Scholar] [CrossRef] [Scilit]
- Sato, T.; Iwamoto, Y.; Hashimoto, S.; Ogawa, T.; Furuta, T.; Abe, S.I.; Kai, T.; Matsuya, Y.; Matsuda, N.; Hirata, Y.; et al. Recent improvements of the Particle and Heavy Ion Transport code System—PHITS version 3.33. J. Nucl. Sci. Technol. 2024, 61, 127–135. [Google Scholar] [CrossRef] [Scilit]
- Takata, T.; Nakabayashi, S.; Kondo, H.; Yamamoto, M.; Furui, S.; Shiraishi, K.; Kobayashi, T.; Oba, H.; Okamoto, T.; Kotoku, J. Mixed reality visualization of radiation dose for health professionals and patients in interventional radiology. J. Med. Syst. 2021, 45, 38. [Google Scholar] [CrossRef] [Scilit]
- Fujibuchi, T. Study on radiation protection educational tool using real-time scattering radiation distribution calculation method with ray tracing technology. Information 2025, 16, 266. [Google Scholar] [CrossRef] [Scilit]
- Mao, R.Q.; Lan, L.; Kay, J.; Lohre, R.; Ayeni, O.R.; Goel, D.P.; Sa, D. Immersive virtual reality for surgical training: A systematic review. J. Surg. Res. 2021, 268, 40–58. [Google Scholar] [CrossRef] [Scilit]
- Jiang, H.; Vimalesvaran, S.; Wang, J.; Lim, K.; Mogali, S.; Car, L. Virtual reality in medical students’ education: Scoping review. JMIR Med. Educ. 2022, 8, e34860. [Google Scholar] [CrossRef] [Scilit]
- Mergen, M.; Graf, N.; Meyerheim, M. Reviewing the current state of virtual reality integration in medical education—A scoping review. BMC Med. Educ. 2024, 24, 788. [Google Scholar] [CrossRef] [Scilit] [PubMed]
- Sung, H.; Kim, M.; Park, J.; Shin, N.; Han, Y. Effectiveness of virtual reality in healthcare education: Systematic review and meta-analysis. Sustainability 2024, 16, 8520. [Google Scholar] [CrossRef] [Scilit]
- Li, T.; Yan, J.; Gao, X.; Liu, H.; Li, J.; Shang, Y.; Tang, X. Using virtual reality to enhance surgical skills and engagement in orthopedic education: Systematic review and meta-analysis. J. Med. Internet Res. 2025, 27, e70266. [Google Scholar] [CrossRef] [Scilit] [PubMed]
- Wanzel, K.R.; Hamstra, S.J.; Caminiti, M.F.; Anastakis, D.J.; Grober, E.D.; Reznick, R.K. Visual-spatial ability correlates with efficiency of hand motion and successful surgical performance. Surgery 2003, 134, 750–757. [Google Scholar] [CrossRef] [Scilit]
- Vávra, P.; Roman, J.; Zonča, P.; Ihnát, P.; Němec, M.; Kumar, J.; Habib, N.; El-Gendi, A. Recent development of augmented reality in surgery: A review. J. Healthc. Eng. 2017, 2017, 4574172. [Google Scholar] [CrossRef] [Scilit]
- Schmidt, M.W.; Köppinger, K.F.; Fan, C.; Kowalewski, K.F.; Schmidt, L.P.; Vey, J.; Proctor, T.; Probst, P.; Bintintan, V.V.; Müller-Stich, B.P.; et al. Virtual reality simulation in robot-assisted surgery: Meta-analysis of skill transfer and predictability of skill. BJS Open 2021, 5, zraa066. [Google Scholar] [CrossRef] [Scilit]
- Gendia, A.; Rehman, M.; Cota, A.; Gilbert, J.; Clark, J. Can virtual reality technology be considered as a part of the surgical care pathway? Ann. R. Coll. Surg. Engl. 2023, 105, 2–6. [Google Scholar] [CrossRef] [Scilit] [PubMed]
- Soffar, A.; Elkohail, A.; Elbanna, M.; Kassem, H.A.; Murhekar, S.; Millat, M.S.; Sayed, A.; Shehata, R.; Ali Hamoud, M.; Khalil, N. Virtual reality simulation for orthopedic surgical training: A narrative review of current evidence and educational impact. Cureus 2025, 17, e99367. [Google Scholar] [CrossRef] [Scilit]
- Feng, H.; Li, C.; Liu, J.; Wang, L.; Ma, J.; Li, G.; Gan, L.; Shang, X.; Wu, Z. Virtual reality rehabilitation versus conventional physical therapy for improving balance and gait in Parkinson’s disease patients: A randomized controlled trial. Med. Sci. Monit. 2019, 25, 4186–4192. [Google Scholar] [CrossRef] [Scilit]
- Lin, R.C.; Chiang, S.L.; Heitkemper, M.M.; Weng, S.M.; Lin, C.F.; Yang, F.C.; Lin, C.H. Effectiveness of early rehabilitation combined with virtual reality training on muscle strength, mood state, and functional status in patients with acute stroke: A randomized controlled trial. Worldviews Evid. Based Nurs. 2020, 17, 158–167. [Google Scholar] [CrossRef] [Scilit] [PubMed]
- Park, M.; Ha, Y. Effects of virtual reality-based cognitive rehabilitation in stroke patients: A randomized controlled trial. Healthcare 2023, 11, 2846. [Google Scholar] [CrossRef] [Scilit] [PubMed]
- Prajjwal, P.; Chandrasekar, K.K.; Battula, P.; Gaviria, E.; Awe, M.O.; Inban, P.; Almutairi, A.S.; Das, A.; Tekuru, Y.; Marsool, M.D.M.; et al. The efficacy of virtual reality-based rehabilitation in improving motor function in patients with stroke: A systematic review and meta-analysis. Ann. Med. Surg. 2024, 86, 5425–5438. [Google Scholar] [CrossRef] [Scilit]
- Wang, S.; Meng, H.; Zhang, Y.; Mao, J.; Zhang, C.; Qian, C.; Ma, Y.; Guo, L. Effect of virtual reality-based rehabilitation on mental health and quality of life of stroke patients: A systematic review and meta-analysis of randomized controlled trials. Arch. Phys. Med. Rehabil. 2025, 106, 607–617. [Google Scholar] [CrossRef] [Scilit]
- Oh, H.; Son, W. Cybersickness and its severity arising from virtual reality content: A comprehensive study. Sensors 2022, 22, 1314. [Google Scholar] [CrossRef] [Scilit]
- Ramaseri Chandra, A.N.; El Jamiy, F.; Reza, H. A systematic survey on cybersickness in virtual environments. Computers 2022, 11, 51. [Google Scholar] [CrossRef] [Scilit]
- Laessoe, U.; Abrahamsen, S.; Zepernick, S.; Raunsbaek, A.; Stensen, C. Motion sickness and cybersickness—Sensory mismatch. Physiol. Behav. 2023, 258, 114015. [Google Scholar] [CrossRef] [Scilit] [PubMed]
- Simón-Vicente, L.; Rodríguez-Cano, S.; Delgado-Benito, V.; Ausín-Villaverde, V.; Cubo Delgado, E. Cybersickness. A systematic literature review of adverse effects related to virtual reality. Neurologia 2024, 39, 701–709. [Google Scholar] [CrossRef] [Scilit] [PubMed]
- Smith, S.P.; Nalivaiko, E.; Owen, S.; Depireux, D.; Flynn, M. Exploring vestibular stimulation to reduce the influence of cybersickness on virtual reality experiences. Front. Virtual Real. 2025, 5, 1478106. [Google Scholar] [CrossRef] [Scilit]
- Hart, S.G.; Staveland, L.E. Development of NASA-TLX (Task Load Index): Results of empirical and theoretical research. Adv. Psychol. 1988, 52, 139–183. [Google Scholar] [CrossRef] [Scilit]
- O’Brien, H.L.; Cairns, P.; Hall, M. A practical approach to measuring user engagement with the refined user engagement scale (UES) and new UES short form. Int. J. Hum.-Comput. Stud. 2018, 112, 28–39. [Google Scholar] [CrossRef] [Scilit]
- Schrepp, M.; Hinderks, A.; Thomaschewski, J. Design and evaluation of a short version of the user experience questionnaire (UEQ-S). Int. J. Interact. Multimed. Artif. Intell. 2017, 4, 103. [Google Scholar] [CrossRef] [Scilit]
- Birch, R.; Marshall, M. Computation of bremsstrahlung X-ray spectra and comparison with spectra measured with a Ge(Li) detector. Phys. Med. Biol. 1979, 24, 505–517. [Google Scholar] [CrossRef] [Scilit]
- Hasegawa, H. A novel approach to reducing physician’s radiation exposure in X-ray CT-guided procedures. Med. Sci. Digest 2025, 51, 45–47. [Google Scholar]
- Brooke, J. SUS: A quick and dirty usability scale. Usabil. Eval. Ind. 1996, 189, 4–7. [Google Scholar]
- Davids, M.R.; Chikte, U.M.; Halperin, M.L. Effect of improving the usability of an e-learning resource: A randomized trial. Adv. Physiol. Educ. 2014, 38, 155–160. [Google Scholar] [CrossRef] [Scilit]
- Böhm, A.; Lux, T. Digital case oriented teaching and learning in healthcare: Evaluating usability. Stud. Health Technol. Inform. 2025, 327, 1098–1099. [Google Scholar] [CrossRef] [Scilit] [PubMed]
- Jamal, A.; Tharkar, S.; Alenazi, H.; Julaidan, B.S.; Al Hindawi, D.A.; AlAkeel, N.S.; AlNuhayer, O.M.; AlDubaikhi, R.H. Usability analysis of a health sciences digital library by medical residents: Cross-sectional survey. JMIR Form. Res. 2021, 5, e23293. [Google Scholar] [CrossRef] [Scilit]
- Sigle, S.; Barriga, P.; Correa Fernández, F.J.; Juhra, C.; Härtel, S.; Fegeler, C. Evaluating online consumer medication information systems: Comparative online usability study. JMIR mHealth uHealth 2020, 8, e16648. [Google Scholar] [CrossRef] [Scilit] [PubMed]
- Bangor, A.; Kortum, P.T.; Miller, J.T. An empirical evaluation of the System Usability Scale. Int. J. Hum.-Comput. Interact. 2008, 24, 574–594. [Google Scholar] [CrossRef] [Scilit]
- Lim, A.K.; Ryu, J.; Yoon, H.M.; Yang, H.C.; Kim, S.K. Ergonomic effects of medical augmented reality glasses in video-assisted surgery. Surg. Endosc. 2022, 36, 988–998. [Google Scholar] [CrossRef] [Scilit]
- Liao, S.C.; Shao, S.C.; Gao, S.Y.; Lai, E.C. Augmented reality visualization for ultrasound-guided interventions: A pilot randomized crossover trial to assess trainee performance and cognitive load. BMC Med. Educ. 2024, 24, 1058. [Google Scholar] [CrossRef] [Scilit]
- Wu, Y.; Zhang, Y.; Zheng, B. Workload assessment of operators: Correlation between NASA-TLX and pupillary responses. Appl. Sci. 2024, 14, 11975. [Google Scholar] [CrossRef] [Scilit]
- Recarte, M.A.; Pérez, E.; Conchillo, A.; Nunes, L.M. Mental workload and visual impairment: Differences between pupil, blink, and subjective rating. Span. J. Psychol. 2008, 11, 374–385. [Google Scholar] [CrossRef] [Scilit]
- Wong, S.W.; Crowe, P. Cognitive ergonomics and robotic surgery. J. Robot. Surg. 2024, 18, 110. [Google Scholar] [CrossRef] [Scilit] [PubMed]
- Merriweather, C.A., Jr.; Lyytinen, K.; Aron, D.; Cauley, M.R. When better data meets better design: How EHR data usability and system usability shape physicians’ cognitive load. npj Digit. Med. 2026, 9, 104. [Google Scholar] [CrossRef] [Scilit]
- Xi, N.; Chen, J.; Gama, F.; Riar, M.; Hamari, J. The challenges of entering the metaverse: An experiment on the effect of extended reality on workload. Inf. Syst. Front. 2023, 25, 659–680. [Google Scholar] [CrossRef] [Scilit] [PubMed]
- Dominic, J.; Tubre, B.; Kunkel, D.; Rodeghero, P. The human experience of comprehending source code in virtual reality. Empir. Softw. Eng. 2022, 27, 173. [Google Scholar] [CrossRef] [Scilit] [PubMed]
- Jeffri, N.F.S.; Awang Rambli, D.R. A review of augmented reality systems and their effects on mental workload and task performance. Heliyon 2021, 7, e06277. [Google Scholar] [CrossRef] [Scilit] [PubMed]
- ISO 9241-11:2018; Ergonomics of Human-System Interaction Part 11: Usability: Definitions and Concepts. International Organization for Standardization: Geneve, Switzerland, 2018.
- Meyer, O.A.; Omdahl, M.K.; Makransky, G. Investigating the effect of pre-training when learning through immersive virtual reality and video: A media and methods experiment. Comput. Educ. 2019, 140, 103603. [Google Scholar] [CrossRef] [Scilit]
- Sauro, J.; Lewis, J. Quantifying the User Experience: Practical Statistics for User Research; Elsevier/Morgan Kaufmann: Burlington, MA, USA, 2012. [Google Scholar] [CrossRef] [Scilit]
- Sauro, J. A Practical Guide to the System Usability Scale: Background, Benchmarks & Best Practices; Measuring Usability LLC: Denver, CO, USA, 2011. [Google Scholar]
- McLellan, S.; Muddimer, A.; Peres, S. The effect of experience on system usability scale ratings. J. Usabil. Stud. 2012, 7, 56–67. [Google Scholar]
- Knippenberg, E.; Lamers, I.; Timmermans, A.; Spooren, A. Motivation, usability, and credibility of an intelligent activity-based client-centred training system to improve functional performance in neurological rehabilitation: An exploratory cohort study. Int. J. Environ. Res. Public Health 2021, 18, 7641. [Google Scholar] [CrossRef] [Scilit]
- Bosch, C. Assessing the psychometric properties of the intrinsic motivation inventory in blended learning environments. J. Educ. e-Learn. Res. 2024, 11, 263–271. [Google Scholar] [CrossRef] [Scilit]

Disclaimer/Publisher’s Note: The statements, opinions and data contained in all publications are solely those of the individual author(s) and contributor(s) and not of MDPI and/or the editor(s). MDPI and/or the editor(s) disclaim responsibility for any injury to people or property resulting from any ideas, methods, instructions or products referred to in the content. |
© 2026 by the author. Licensee MDPI, Basel, Switzerland. This article is an open access article distributed under the terms and conditions of the Creative Commons Attribution (CC BY) license.