


Abstract
With the phenomenon of urban heat island and thermal discomfort felt in urban areas, exacerbated by climate change, it is necessary to best estimate the air temperature in every part of an area, especially in the context of the on-going rationalization weather stations network. In addition, the comprehension of air temperature patterns is essential for multiple applications in the fields of agriculture, hydrology, land development or public health. Thus, this study proposes to estimate the air temperature from 28 explanatory variables, using multiple linear regressions. The innovation of this study is to integrate variables from remote sensing into the model in addition to the variables traditionally used like the ones from the Land Use Land Cover. The contribution of spectral indices is significant and makes it possible to improve the quality of the prediction model. However, modeling errors are still present. Their locations and magnitudes are analyzed. However, although the results provided by modelling are of good quality in most cases, particularly thanks to the introduction of explanatory variables from remote sensing, this can never replace dense networks of ground-based measurements. Nevertheless, the methodology presented, applicable to any territory and not requiring specific computer resources, can be highly useful in many fields, particularly for urban planners.
1. Introduction
According to Météo-France’s regional models, temperature increases are expected to continue in France for decades to come [1]. Indeed, at the scale of the Rhône-Alpes region, the work of Météo France [2] and the results of regional climate models for Europe, integrating RCP (Representative Concentration Pathways) scenarios 4.5 and 8.5 of the Intergovernmental Panel on Climate Change foresees an increase in annual and seasonal temperatures [1]. Summer temperatures are expected to rise by between 0.5 and 2 °C by 2050 compared to the 1976–2005 reference period [3]. This results in a probability of heat waves increase and intensification. Indeed, the phenomena of regional heat waves are superimposed on the microclimatic features of local urban environments [4,5,6]. These heat waves are exacerbated in urban areas by the urban heat island phenomenon (UHI) [7]. This UHI concept refers to the observed temperature differences between urban and surrounding rural areas [8].
Consequently, accurate knowledge of temperatures is a necessity both for the environment and for health policies. This knowledge depends directly on the density of the measurement network. This is not a new phenomenon and multiple studies have studied this question, through classical spatial interpolations (deterministic [9] or stochastic [9,10]) or multiple regressions [11,12,13,14,15], for example. This issue is very important in the context of climate change and the rise of heat waves, particularly with the closure of several Météo-France measurement stations [16,17].
Several studies show the relative contribution of land use and land cover (LULC), topography data and urban typologies to UHI development [12,13,18]. However, very few studies tried to model air temperature using land surface temperature (LST) obtained from remote sensing data, like the NEX (NASA Earth Exchange) Gridded Daily Meteorology (NEX-GDM) model [19,20,21] over the United States. This study showed the importance of the spatially continuous data sets. In addition, no studies in France, to our knowledge, tried to incorporate into these models spectral indices or other products obtained for remote sensing, apart from LST, such as reflectance, Modified Normalized Difference Water Index (MNDWI), Normalized Difference Bareness Index (NDBaI) or Normalized Difference Moisture Index (NDMI) [22,23,24,25]. Moreover, products derived from remote sensing have never had such a temporal and spatial resolution and the data on the state of the Earth’s surface, compiled in multiple bases from several satellites, have never been so numerous. This is a real opportunity, especially because air temperature changes at the microscale level, less than 100 m [26,27].
Consequently, the aim of this study is to evaluate the benefit of integrating remote sensing variables into the modeling of air temperature, using heterogeneous but complementary sources of information [28] using multiple regressions [28,29]. Thus, this study targets to provide a valuable source of information of air temperature distribution. This knowledge is fundamental to research and practical applications in agriculture, ecology, hydrology, climatology, land development and public health, for example, especially over artificialized areas, to contribute to the improvement of urban planning in the context of UHI mitigation. Firstly, the study area is presented, as well as the remote-sensing data and statistical methods. Secondly, the results are shown and analyzed to discuss the contribution of each predictors to modelling air temperature. Thirdly, the contribution to the improvement of urban planning in the context of climate change and UHI mitigation are explored.
2. Methodology
2.1. The Spatial and Temporal Extent of the Study
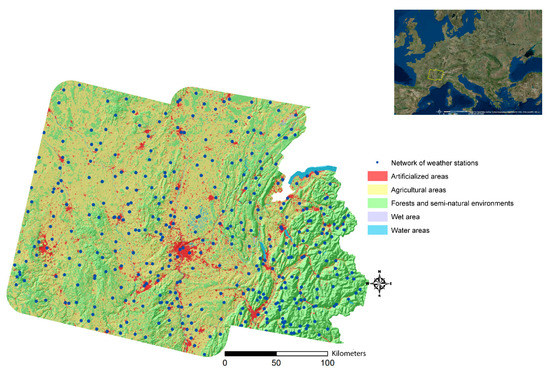
The study area is a part of Rhône-Alpes county, located in southeastern France, corresponding to the Landsat 196-28 and 197-28 (path-row) tiles. This area is interesting because it gathers a diversity of Land Use Land Cover (LULC) associated with topographic and hydrological heterogeneity. In addition, the Lyon metropolis, which is the second biggest in France with 1.3 million of inhabitants, lies in its centre (Figure 1). The air temperature, the dependent variable, is estimated from the 391 meteorological stations (Météo-France network) located in the study area (Figure 1).
Figure 1.
Méteo-France network used and land use on the right-of-way of Landsat 196-28 and 197-28 tiles (data: Météo-France [30] and Corine Land Cover, 2012 [31]).
Most of the selected weather stations are located either in artificialized zones, or in agricultural zones (Table 1). More precisely, the proportion of weather stations in the agricultural zone is 45.5% (which represents 178 stations) and 38.6% for weather stations located in artificialized zones (151 stations).
Table 1.
Location of weather stations studied depending on the type of Land Use Land Cover (LULC).
In addition, the study days must have a cloud cover less than or equal to 10% to present quality remote sensing data. As a result, for this study, six measurement days have been retained during the year 2013, over a period of six months (April to September) and two different seasons (spring and summer): 25 April, 14 July, 21 July, 15 August the 22 August and 23 September (Table 2).
Table 2.
Meteorological parameters of study days at the Lyon-Bron station at 12:00 p.m. (data: Météo-France [30]).
2.2. Twenty-Eight Explanatory Variables Selected from the Literature
Twenty-eight explanatory variables are used to estimate the air temperature over the study area. They have been selected from the literature [22,23,24,25,26,29,32,33,34,35,36,37,38,39,40,41,42,43,44,45]. The variables belong to various categories and can directly be obtained from the supplying organizations or produced by geomatics or remote sensing (Table 3). The remote sensing data is from the United States Geological Survey (USGS) EarthExplorer platform. The Landsat data were chosen because of their thermal band and 30 m resolution. More precisely, Landsat 8 carries two sensors: Operational Land Imager (OLI) and Thermal Infrared Sensor (TIRS). Visible, near infrared, short wavelength infrared, panchromatic, and cirrus bands have a spatial resolution of 30 m. The TIRS bands, used here to retrieve the surface temperature using the single channel algorithm, are at a 100 m resolution, but at 30 m resolution in the delivered data product after resampling with cubic convolution by the United States Geological Survey [46]. The topographic data is provided by the French Geographic Institute (IGN) and the LULC is obtained from the Corine Land Cover platform. The Corine Land Cover classification is detailed according to the biophysical occupation of the land. Thus, at the first level, used in this study, this classification is structured around 5 different levels, namely artificial territories, agricultural territories, forests and semi-natural environments, wetlands (such as marshes or peatlands) and water areas (such as rivers or water bodies).
Table 3.
List of explanatory variables selected to estimate fine-scale air temperature.
Since the variables follow a normal distribution, according to the Shapiro Wilk test (valuable for samples with fewer than 5000 observations [47]), a Pearson correlation matrix is used to detect collinear data for each day. For each pair of indicators presenting a |r| > 0.7, one of the two is removed. The value of the variance inflation factor (VIF) is also controlled and should not be greater than 5 [48]. Finally, the explanatory model of the dependent variable is obtained by multiple linear regression (MLR) of the remaining explanatory variables by integrating a stepwise sorting algorithm which consists of selecting the variables according to their respective contributions to the model. This selection of the model was chosen after having made a sensitivity analysis also on the ascending and descending model. Other statistical regressions were considered, such as the Lasso regression. It has the advantage of selecting only certain explanatory variables in the presence of collinearity. However, Lasso regression is usable only when the number of predictors is greater than the number of observations [49,50]. However, in this study, the number of observations is much higher than the number of predictors. For example, the day of 15 August 2013 includes 112 observations for 28 predictor variables. The number of these stays the same for all of the days.
Moreover, a cross validation is still performed due to its ability to detect over fitting of multiple regression, although multiple regression provides internal validation and randomization [51,52]. In this way, the cross validation presents a more conservative estimate of predictive power. To perform this cross validation, the data have been randomly split each into ‘training’ and ‘testing’ tables consisting of 80% of the data and 20% of the data, respectively. The normality of the residues was verified by analyzing them with the Shapiro–Wilk [47] normality test. The independence of the residues was also checked using the Durbin–Watson test [53].
In order to study the contribution of the explanatory variables not only on a global scale but also in function of the type of LULC, the air temperature modelling have also been made into three zones, depending on the location of the meteorological stations (artificial areas, agricultural areas and forest or semi-natural areas). The modelling has not been carried out over the wet areas and water areas because not enough stations were available.
2.3. A Sensitivity Analysis to Measure the Contribution of Remote Sensing Variables to Air Temperature Estimation
In addition, in order to study the contribution of adding variables from remote sensing data, a sensitivity analysis is performed based on different sets of explanatory variables. Indeed, 6 models with different data sets are performed:
- air temperature modelling with all variables,
- air temperature modelling with only remote sensing variables,
- air temperature modelling without remote sensing variables,
- air temperature modelling with remote sensing variables but without surface temperature,
- air temperature modelling with all variables except surface temperature,
- simple linear regression between air temperature and surface temperature.
2.4. Location of the Underestimation or Overestimation of Air Temperature Modelling Compared to In Situ Measurements at Météo France’s Weather Stations
The first part of this section is dedicated to the quantification of the underestimation or overestimation of the air temperature model using relative difference. Then, in a second step, these errors are spatialized using LISA and Getis Ord Gi*.
2.4.1. Quantifying the Underestimation or Overestimation of Air Temperatures through a Statistical Model
The variables retained in the multiple linear regressions make it possible to establish a statistical model for estimating air temperatures for a specific day. However, this model may contain estimation errors. These errors can be either a negative difference (model underestimation) or a positive difference (overestimation). This relative difference is given as a percentage and is calculated from the following Equation (1):
2.4.2. Geographical Identification of Statistically Similar Zones: The Use of LISA and Getis Ord Gi*
The spatial autocorrelation of the difference between the modelled air temperature and the air temperature measured at the Météo France weather station is determined, on one hand, by using the local spatial association indicator (Anselin Local Moran I-LISA [54]), and, on the other hand, thanks to the degree of grouping of high and low intensity values by the Getis Ord General G [55,56].
LISA makes it possible to group, for statistically significant results (p < 0.05), the similarity of a spatial unit with its neighbours. It is calculated from Equation (2):
where xi is the value of a variable given in point i, x is the average of this attribute, Wi,j is the weight (coefficient) applied to the comparison between the two locations i and j, and n is the total number of observations. In addition, S2i is calculated by the following Equation (3):
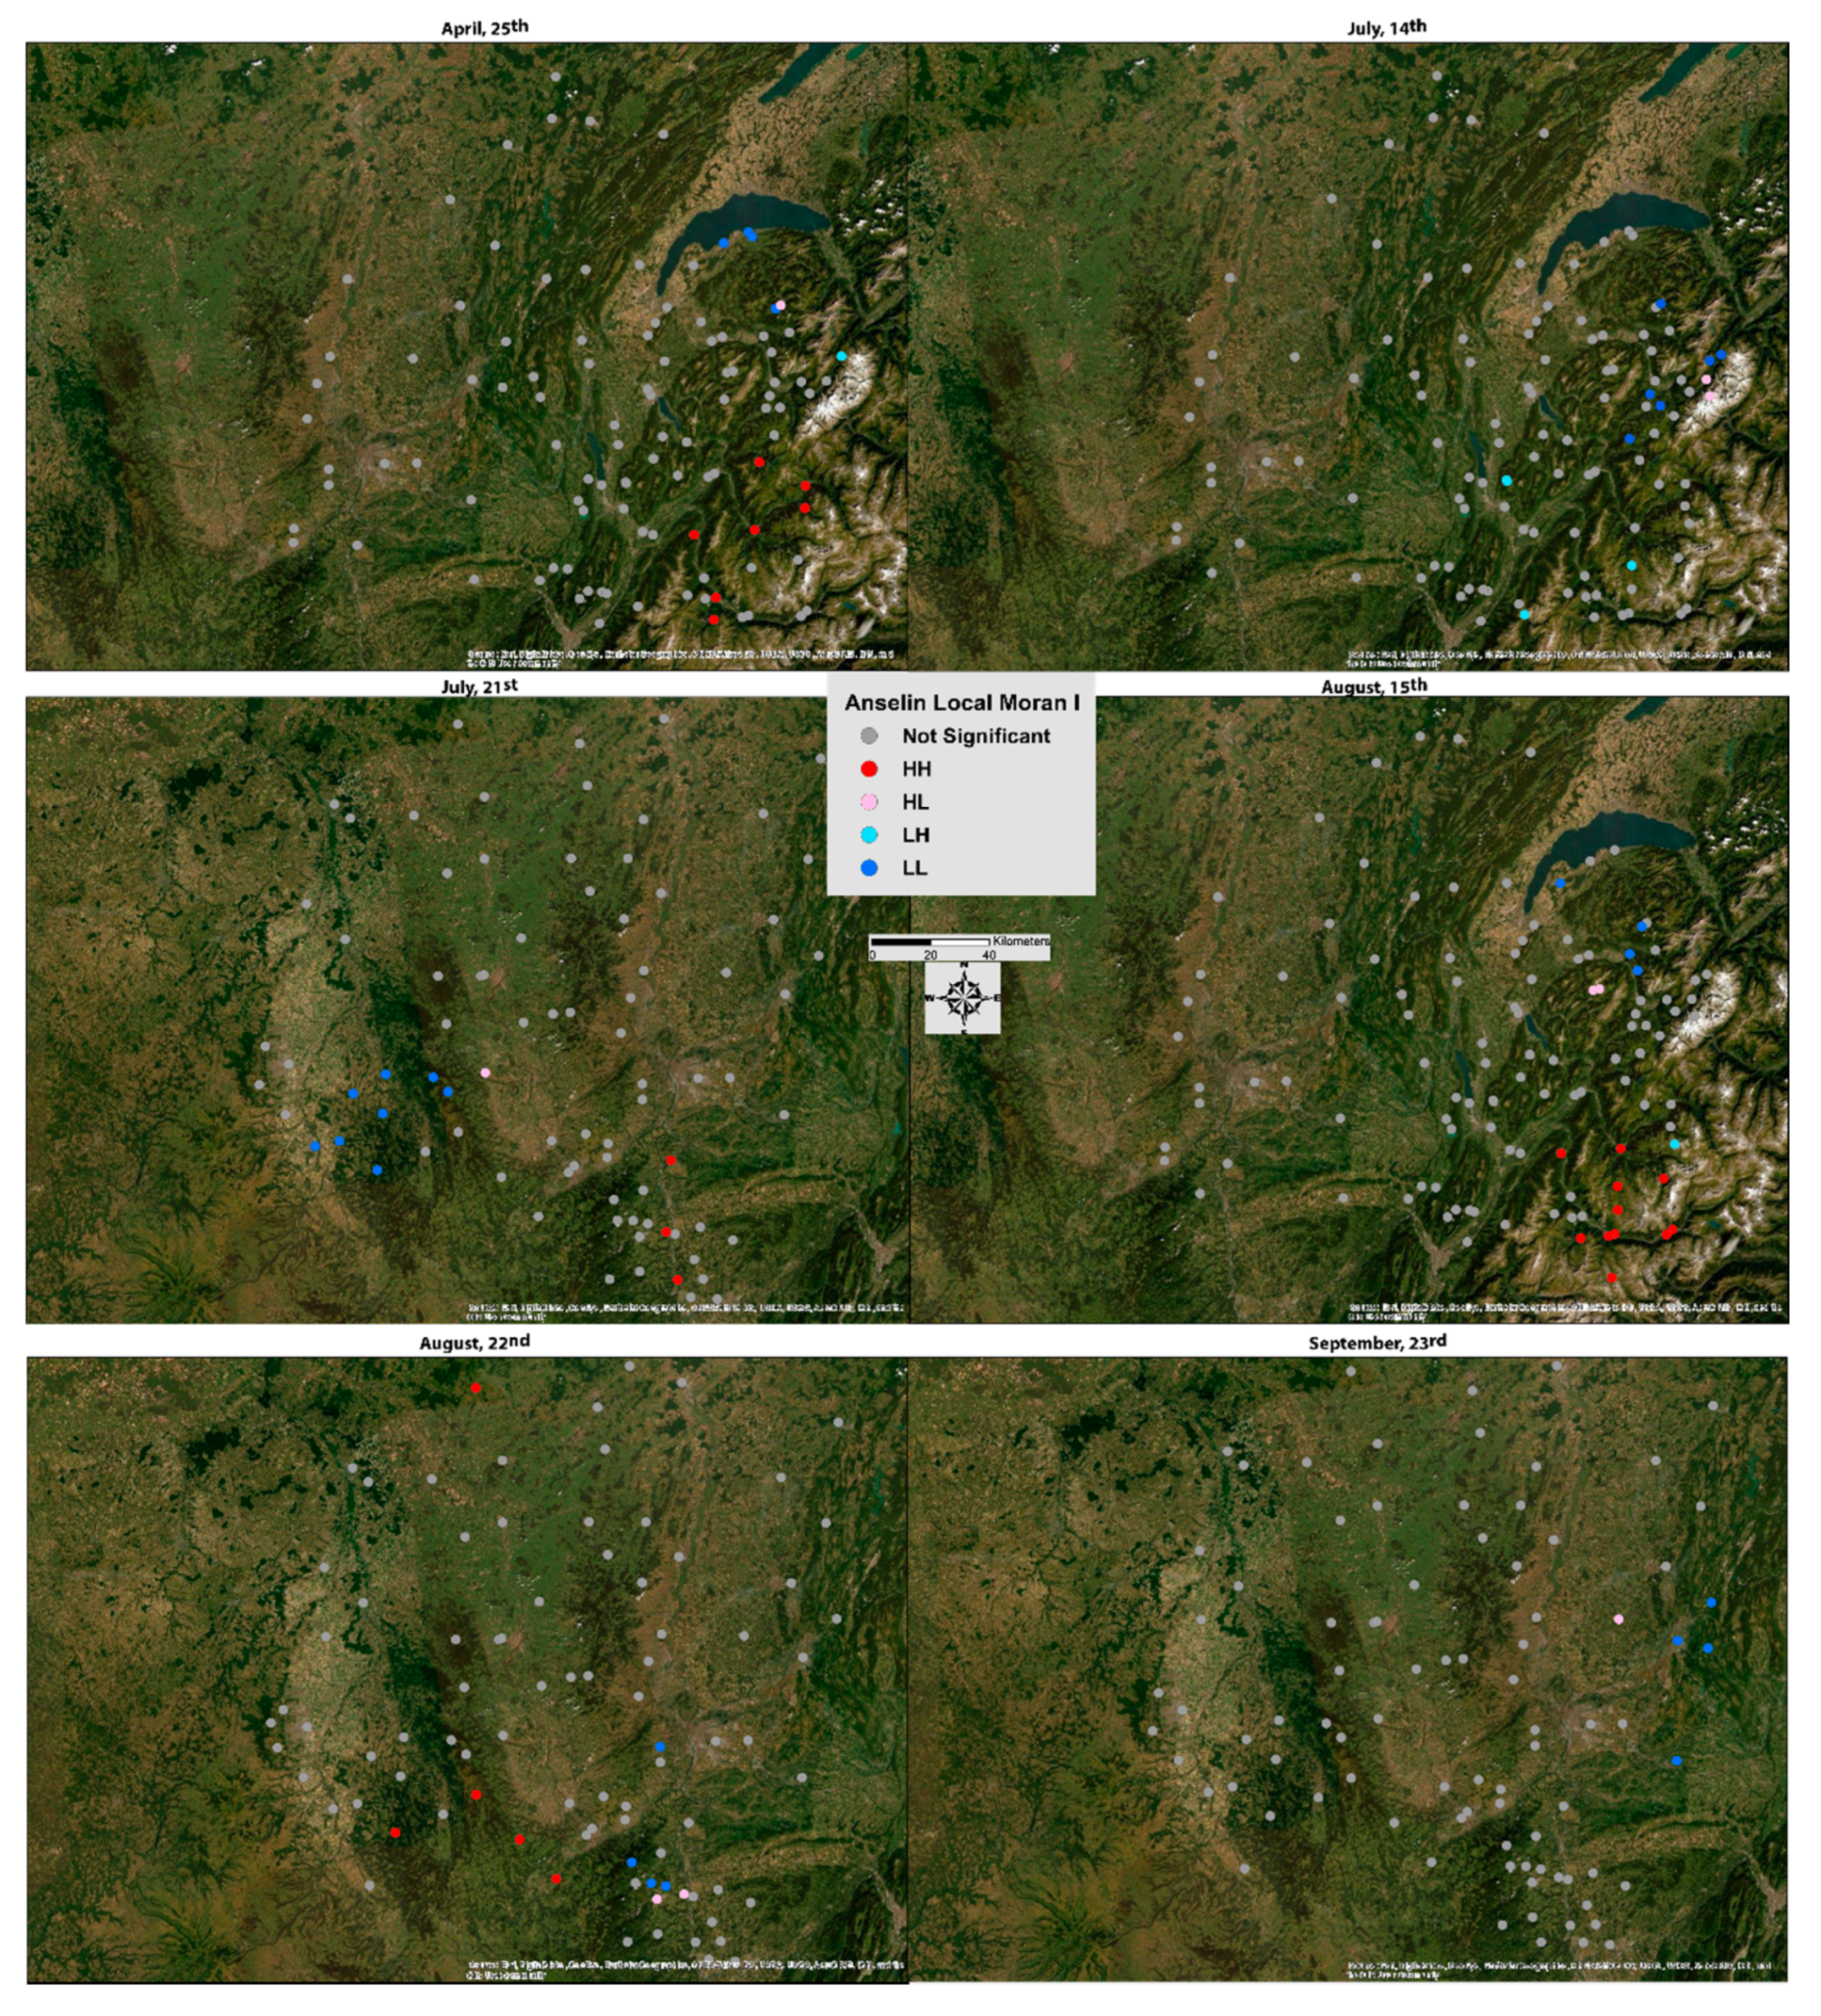
This technique makes it possible to identify spatial aggregates of features with high or low values as well as outlier spatial points. A cartographic representation showing a cluster type for each statistically significant entity is obtained. Thus, a geographic information system (GIS) allows for distinguishing between a statistically significant cluster of high values (HH), a cluster of low values (LL), an outlier in which a high value is surrounded mainly by low values (HL) and an outlier in which a low value is surrounded mainly by high values (LH).
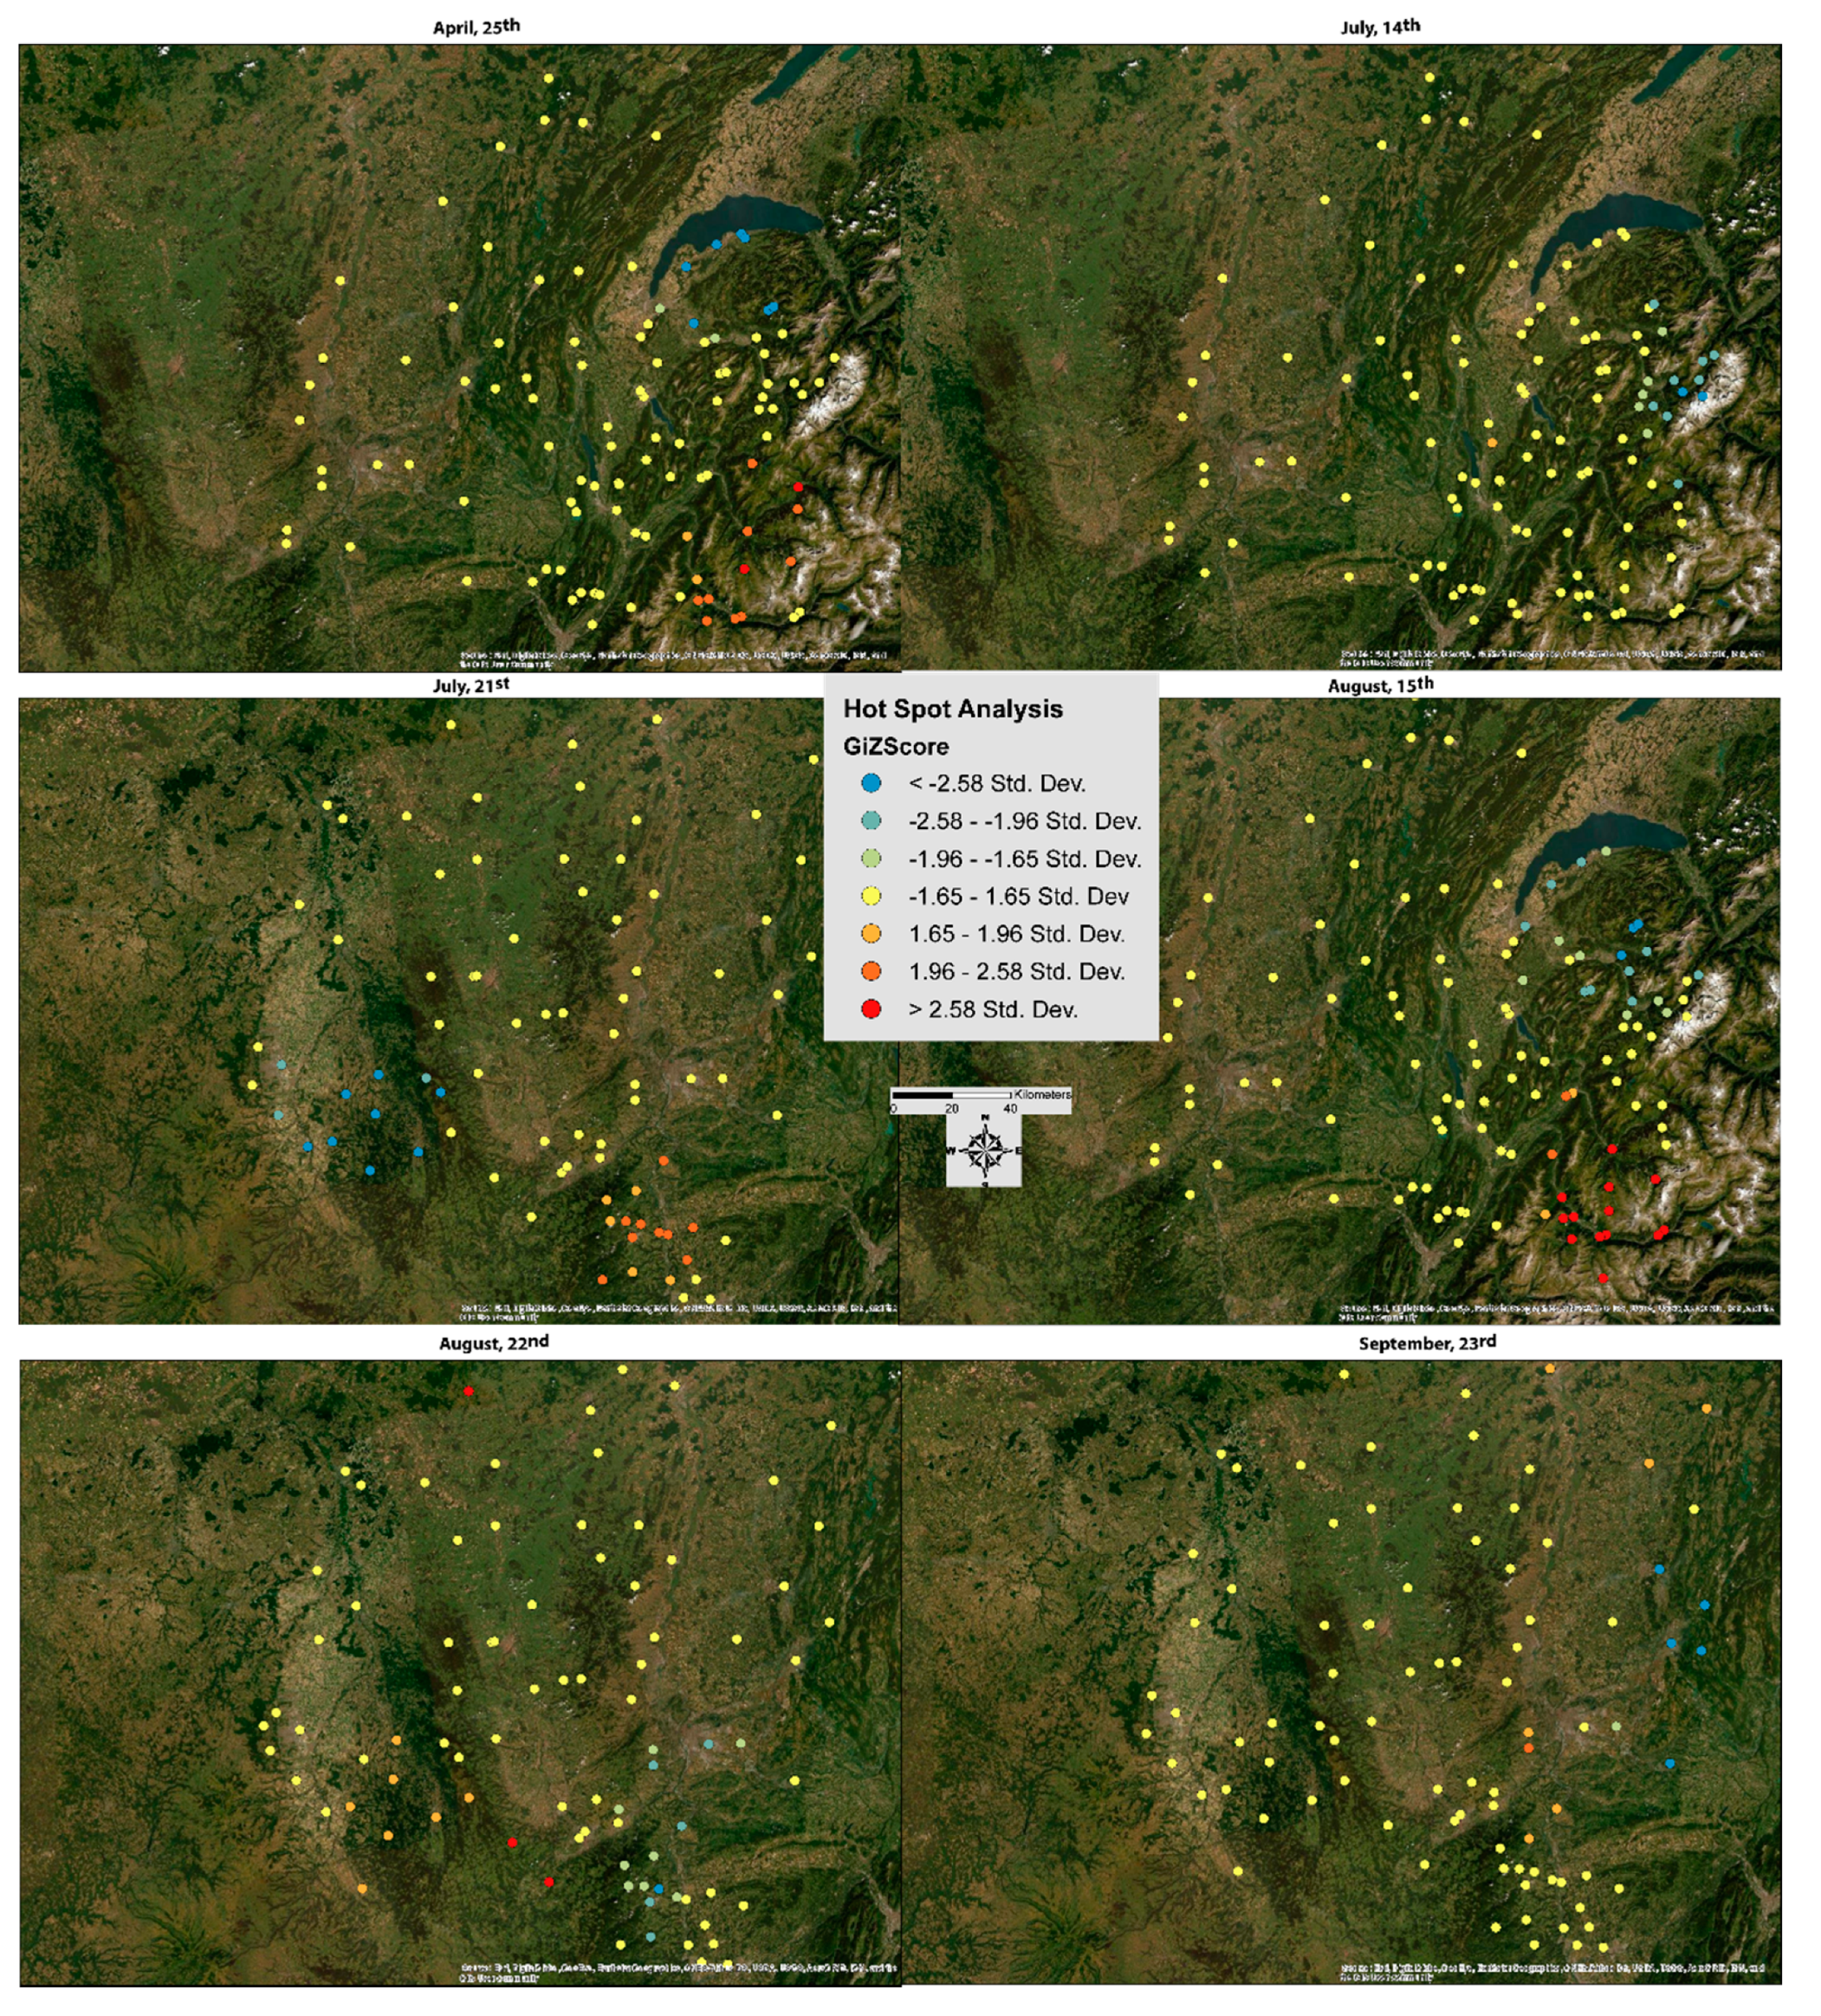
The local application of the General G statistic is the Getis Ord Gi* statistic [55]. It is used to identify statistically significant spatial clusters (p < 0.05) of high and low intensity. Thus, for positive Z scores, the higher they are, the stronger the group of high intensity values is (error overestimating air temperature). On the other hand, the lower the negative Z scores are, the higher the group of low intensity values is (error underestimating air temperature). The Getis Ord Gi* is calculated from Equation (4) below:
where xi is the value of a variable given in point i, x is the average of this attribute, Wi,j is the weight (coefficient) applied to the comparison between the two locations i and j, and n is the total number of observations. The mathematical formula for the mean is presented below (Equation (5)), as well as that of the S, present in the denominator of the Gi* formula (Equation (6)):
3. Results for the Year 2013
As indicated in Section 2.2, after performing the statistical test of the Pearson correlation matrix, for one of the pairs of correlated indicators, one of the two variables was removed. Table 4 summarizes all the variables retained after each of these two statistical tests for each study day over the entire study area. The number of variables used varies between 15 (21 July) and 19 (25 April). As a result of multiple linear regressions, the number of explanatory variables retained decreases further and varies between 6 (15 and 22 August) and 4 (14 July).
Table 4.
Variables retained (shown by the crosses) after statistical tests (Pearson test and Variance Inflation Factor (VIF)) and multiple linear regression (MLR) for each day studied.
For the whole area, the mean R2 is 0.82 when modeling air temperature. A low root mean square error (RMSE) value of 1.20 °C is associated with this high coefficient of determination. These high R2 and RMSE are also present when considering the different LULC: for example, the modeling of air temperature based on stations located in a forest or semi-natural environment has a coefficient of determination (R²) of 0.92, with an RMSE of 1.01 °C (Table 5).
Table 5.
Set of explanatory variables retained by multiple linear regressions for the year 2013.
Altitude and surface temperature variables are the most recurrent and have one of the highest coefficients for each model. Indeed, the altitude is selected five times on the six days for the whole area, the artificialized area and the agricultural area and three times for the forest and semi-natural environment. Surface temperature is selected in each case for the whole area, four times for the artificialized area, four times on the agricultural area and two times for the forest and semi-natural environment. Thus, these two variables represent the key elements for air temperature modeling.
The amount of variance explained over the entire study area is greater than 80% for the majority of study days (Table 6): for example, 0.92 for 15 August 2013 and 0.87 for 21 July 2013. However, there is an exception for 23 September 2013, when the part of the variance explained is only 66%. This may be due to the particularity of this day, which is in autumn, unlike other days in spring or summer. Indeed, this day has the lowest average temperature values and the highest humidity and cloud cover values, which can impact the quality of the modelling. On average, the determination coefficient is 0.82 with an RMSE of only 1.2 °C, which corresponds to a very good correlation between the selected predictive variables and air temperature. When only weather stations located in artificialized areas are considered, the minimum variance explained is 68% (14 July) and the maximum is 83% (21 July), with a maximum RMSE of 1.66 °C and a minimum RMSE of 0.73 °C. In the same way, for weather stations located in agricultural areas, these values of R2 minimum and maximum are 0.63 (23 September) and 0.87 (21 July) and those of the RMSE are 0.78 °C and 1.14 °C. For weather stations located in the forest and semi-natural environment, maximum determination coefficient and RMSE values of 0.99 (21 July) and 1.94 °C, respectively, and minimum values of 0.81 (23 September) and 0.06 °C can be observed.
Table 6.
Part of the variance explained in the modeling of air temperature over the entire study area and by land cover.
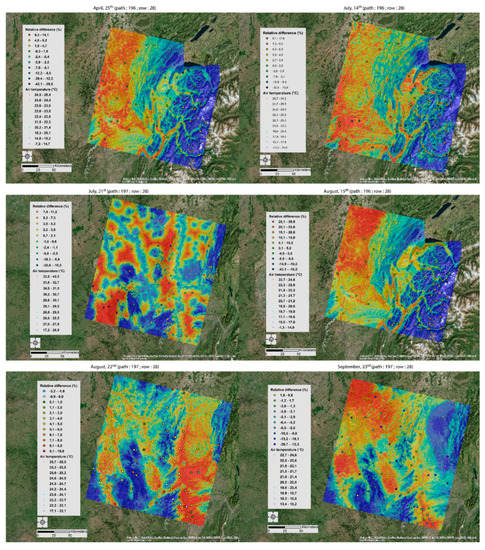
The coefficients obtained for each day and each LULC, from the multiple linear regressions, allow for modeling the air temperature at any point of the study area. For example, when focusing on the entire study area, the following equations are obtained (Equations (7)–(12)), allowing for obtaining the modelled air temperature maps (Figure 2):
Figure 2.
Estimated air temperature for all days studied with relative difference between the modelling and the in situ measurements (quantile discretization).
- for 25 April:
- for 14 July:
- for 21 July:
- for 15 August:
- for 22 August:
- for 23 September:
According to Figure 2, general trends are emerging. On the days when Landsat 8 passes over path 196 and row 28 (25 April, 14 July and 15 August), a heat corridor from northwest to southwest can be observed. This zone includes the Metropolitan Area of Lyon to the southwest where air temperatures are about 10 °C higher than the lowest temperatures located to the east in the Alps and in the centre of the Haut Jura Regional Nature Reserve.
During the days when the satellite orbits on path 196 and row 28 (21 July, 22 August and 23 September), the air temperature remains high over the Lyon Metropolis (southeast) but also around Clermont Ferrand (centre west) with a difference of +5 °C to +10 °C compared to the coldest areas, Saint Etienne and its surrounding mountains (centre south).
However, with all estimates, there is a certain percentage of error highlighted by the relative difference between the Meteo France weather stations and the air temperature model by multiple linear regression (Equation (1)). This relative difference fluctuates day by day, between an underestimation or overestimation for the same station (2.9% for the 15 August and 1.4% for the 22 August compared to the data from the Lyon Saint Exupéry’s weather station) and with more or less significant differences (1.7% for the 25 April to 19.3% for the 14 July compared to the Feclaz’s weather station located in the centre east of the study area). These estimation errors are studied in the discussion part.
4. Discussion
4.1. Characterization of Error Location and Intensity
From the coefficients of determination obtained by the multiple linear regressions for each day (Table 5), the statistical model achieves model air temperatures in a satisfactory way, more precisely with an R2 average of 0.82 for the entire study area. However, there are prediction errors that need to be quantified and located.
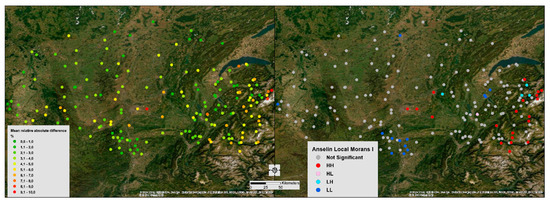
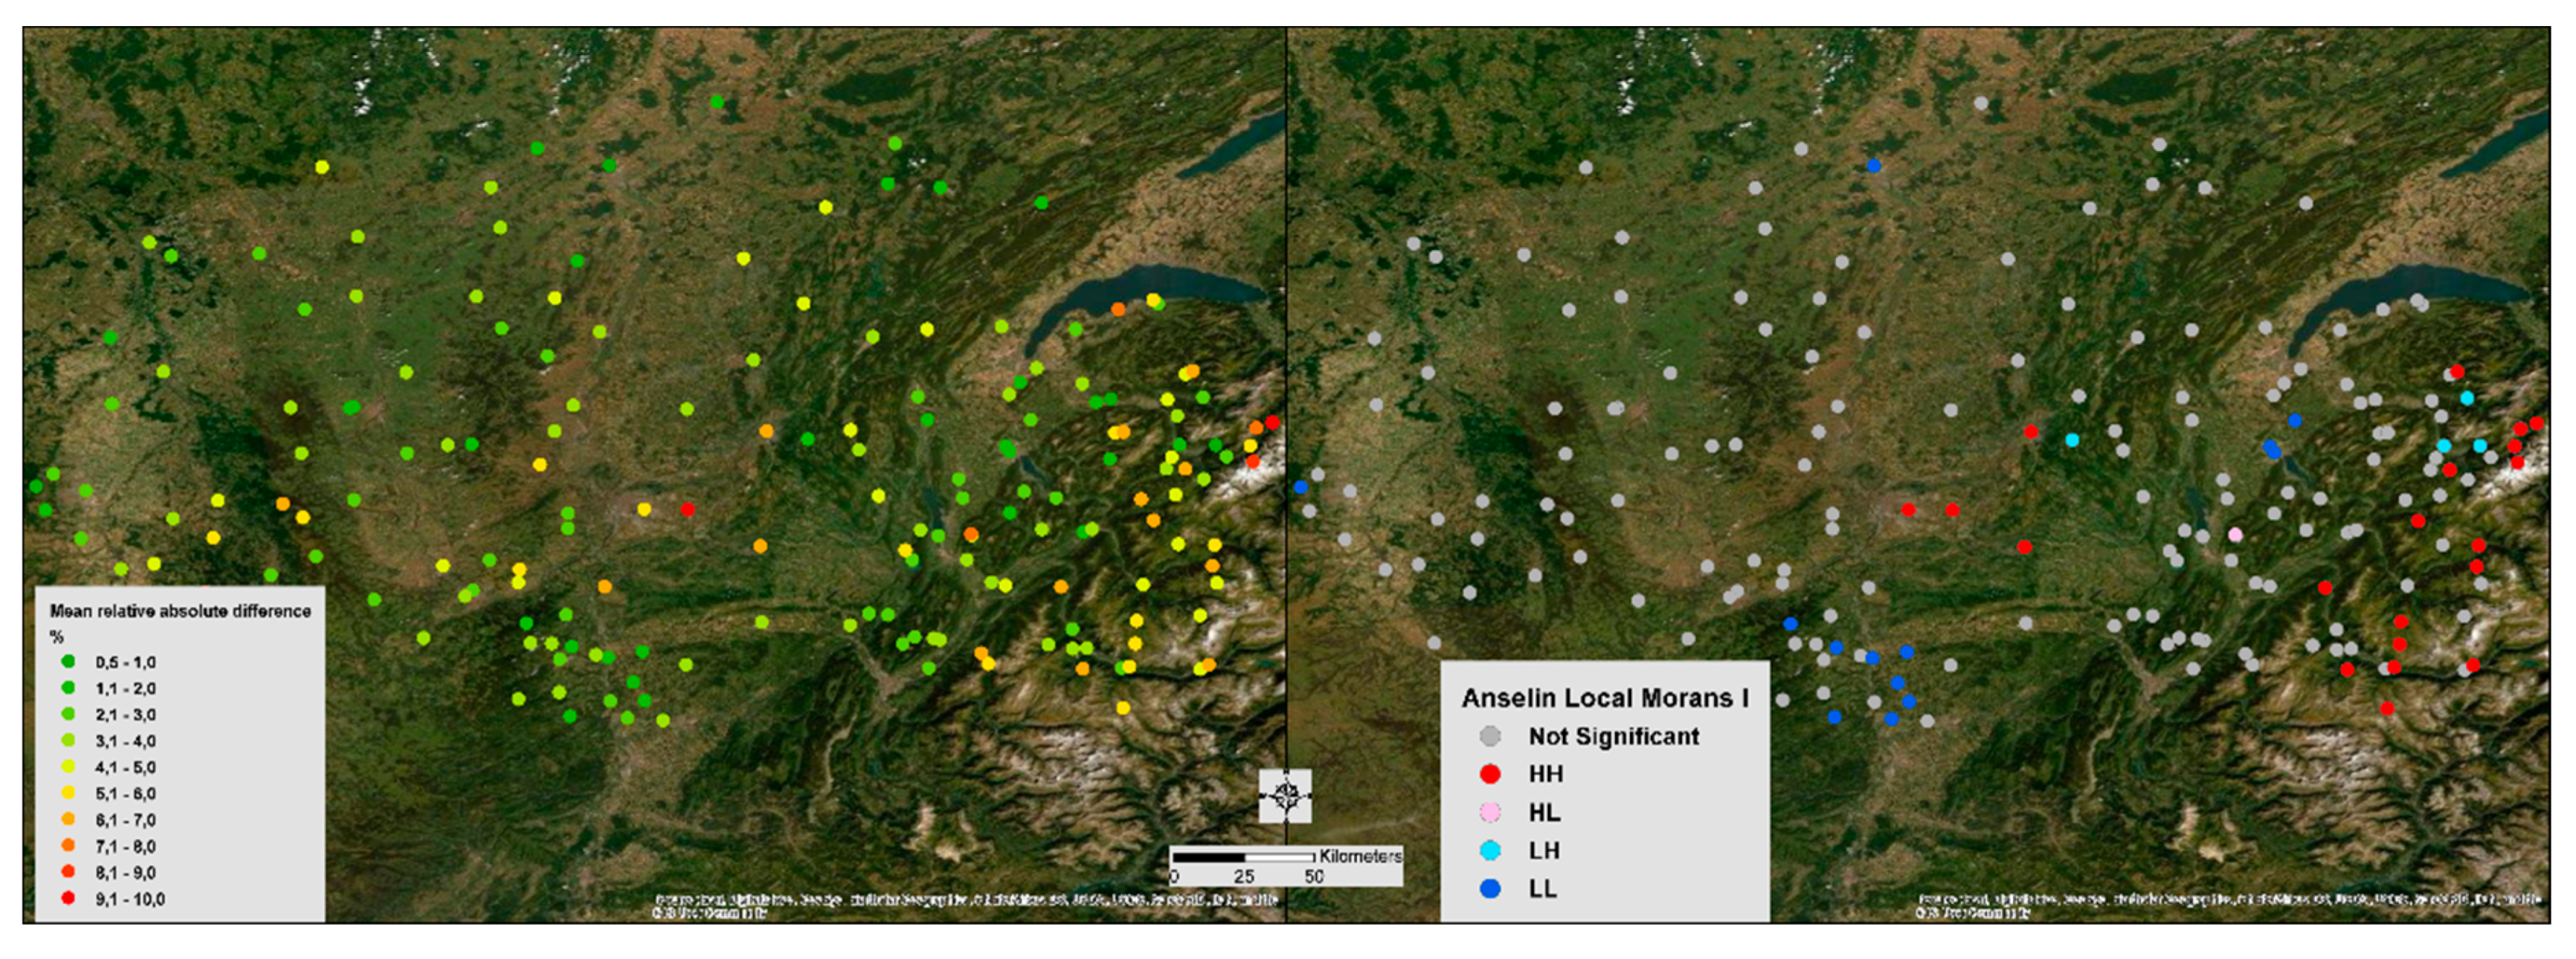
For the first time, averages of the absolute relative differences between the in situ and modelled air temperatures measurements for the six days have been located in the study area (Figure 3—left). For the second time, the spatial clustering of the statistically close relative differences values (LISA) have been identified (Figure 3—right).
Figure 3.
Averages of the absolute relative differences for the six days (left) and spatial clustering of the statistically close relative differences values (LISA—right).
Thus, a clustering of very low errors (LL) is observed in the south of the city of Lyon (south central on the map). This error fluctuates from a minimum of 1% to a maximum of 1.8% on these different measurement points. On the other hand, two zones have important errors (HH) in estimating air temperature. The first is located in the centre of the study area and concentrates in particular on the two main weather stations of Lyon (Lyon Bron and Lyon Saint Exupéry), with an average of the absolute relative differences ranging from 5.3% to 9.2%. The second area is located to the east of the study area, in the Alps, with an average of absolute relative differences ranging from 5.7% to 9.0%. These two areas with high errors in air temperature modelling have particular spatial configurations, which may explain these important differences. The first area is a dense urban space, where other prediction variables must be included, such as the sky view factor [57,58,59] or anthropogenic heat [60]. The second is a mountain area where the Alpine arc acts in response to particular climatic variations.
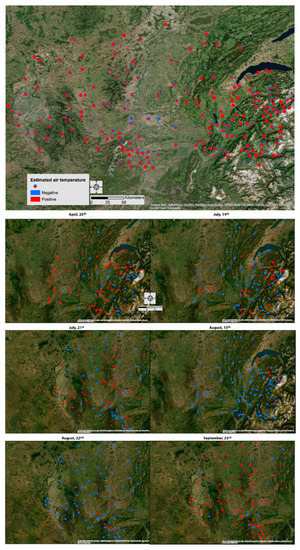
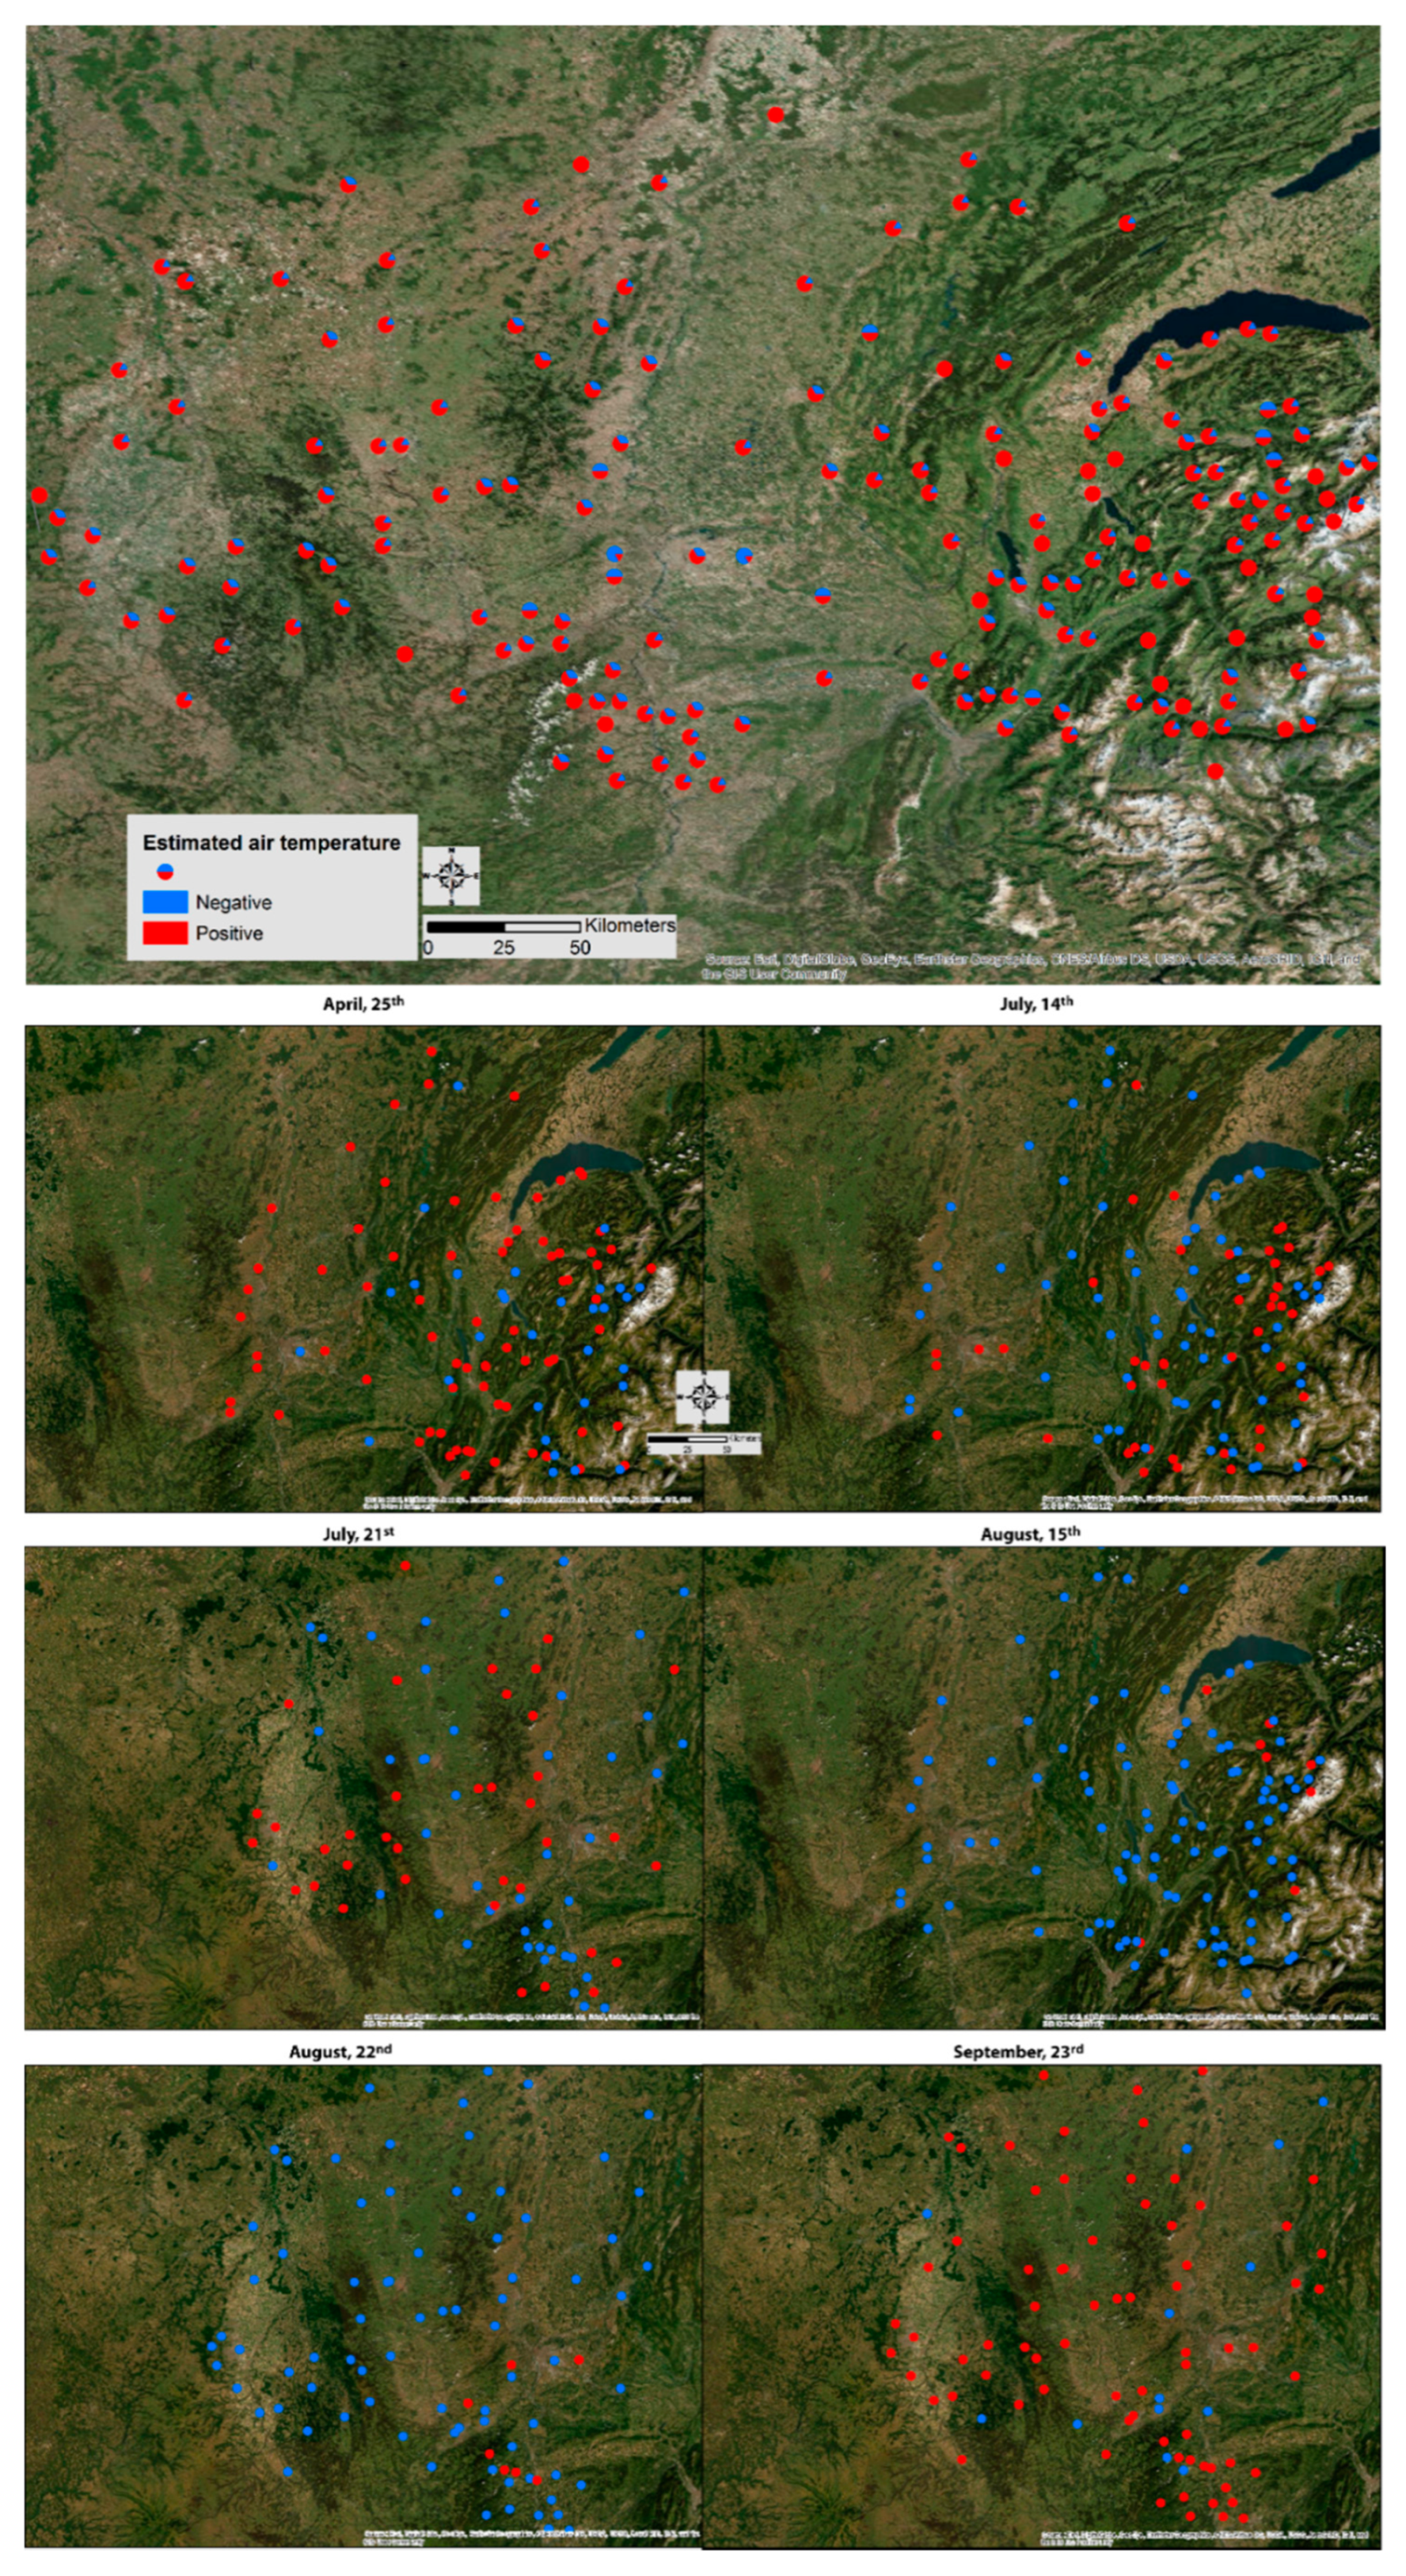
The prediction errors are located in a global way for all days (Figure 4). However, the average obtained hides the variations over each day, notably since the satellite approaches were found to underestimate measured turbulent heat fluxes and anthropogenic fluxes [61]. Moreover, temperature is one of the variables used in climate modelling. However, the latter is not a stationary phenomenon [26,52]. In this study, the prediction of air temperature gives results that are statistically very close to the air temperature measured at professional meteorological stations (R2 average of 0.82 over the entire study area). However, errors still do exist. Since these errors depend on the modelling of a non-stationary phenomenon, they also vary over time. Thus, they depend on the climate and the synoptic weather pattern of the day studied but also on previous days, also influencing variables from remote sensing such as MNDWI or NDMI. Indeed, for several days, the relative error may not be constant, being positive for one day and negative for another (Figure 5). Similarly, the magnitude of the error is not necessarily constant. Consequently, the clusters of negative or positive errors have been studied using the LISA model.
Figure 4.
Pie charts of the number of times the relative error of air temperature estimation (positive or negative) for the six days studied (top figure) and detailed day by day (bottom figures).
Figure 5.
LISA of the relative differences between in situ and modelled air temperatures for each day studied.
For the days of 25 April, 14 July and 15 August, a typical and recurrent spatial distribution of estimation errors can be observed, both in the LISA analysis (Figure 5) and in the Gi* analysis (Figure 6). Indeed, the model tends to underestimate the measurements in an area south of Lake Geneva, with LL type clusters (Figure 5) or negative z score with very low values (Figure 6). Conversely, an overestimated HH cluster is found in the Alpine massif. This overestimation cluster is also found in the Gi* results with stations with statistically significant high positive z score values.
Figure 6.
Getis Ord GI* of the relative differences between in situ and modelled air temperatures for each day studied.
In contrast to these marked configurations, the days of 21 July, 22 August and 23 September do not seem to clearly show recurrent clusters of overestimation or underestimation, either with the LISA (Figure 5) or Gi* technique (Figure 6). Indeed, there is very little clustering of statistically significant station errors. For example, only three stations form an HH cluster on 21 July and none on 23 September (Figure 5). This may be explained in particular by a different study area footprint with a less accentuated relief and less marked topoclimatic effects.
4.2. The Contribution of Remote Sensing Variables to the Quality of the Air Temperature Prediction Model
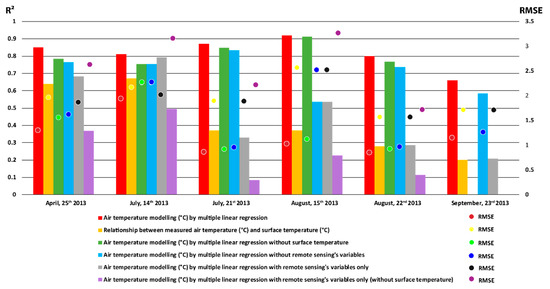
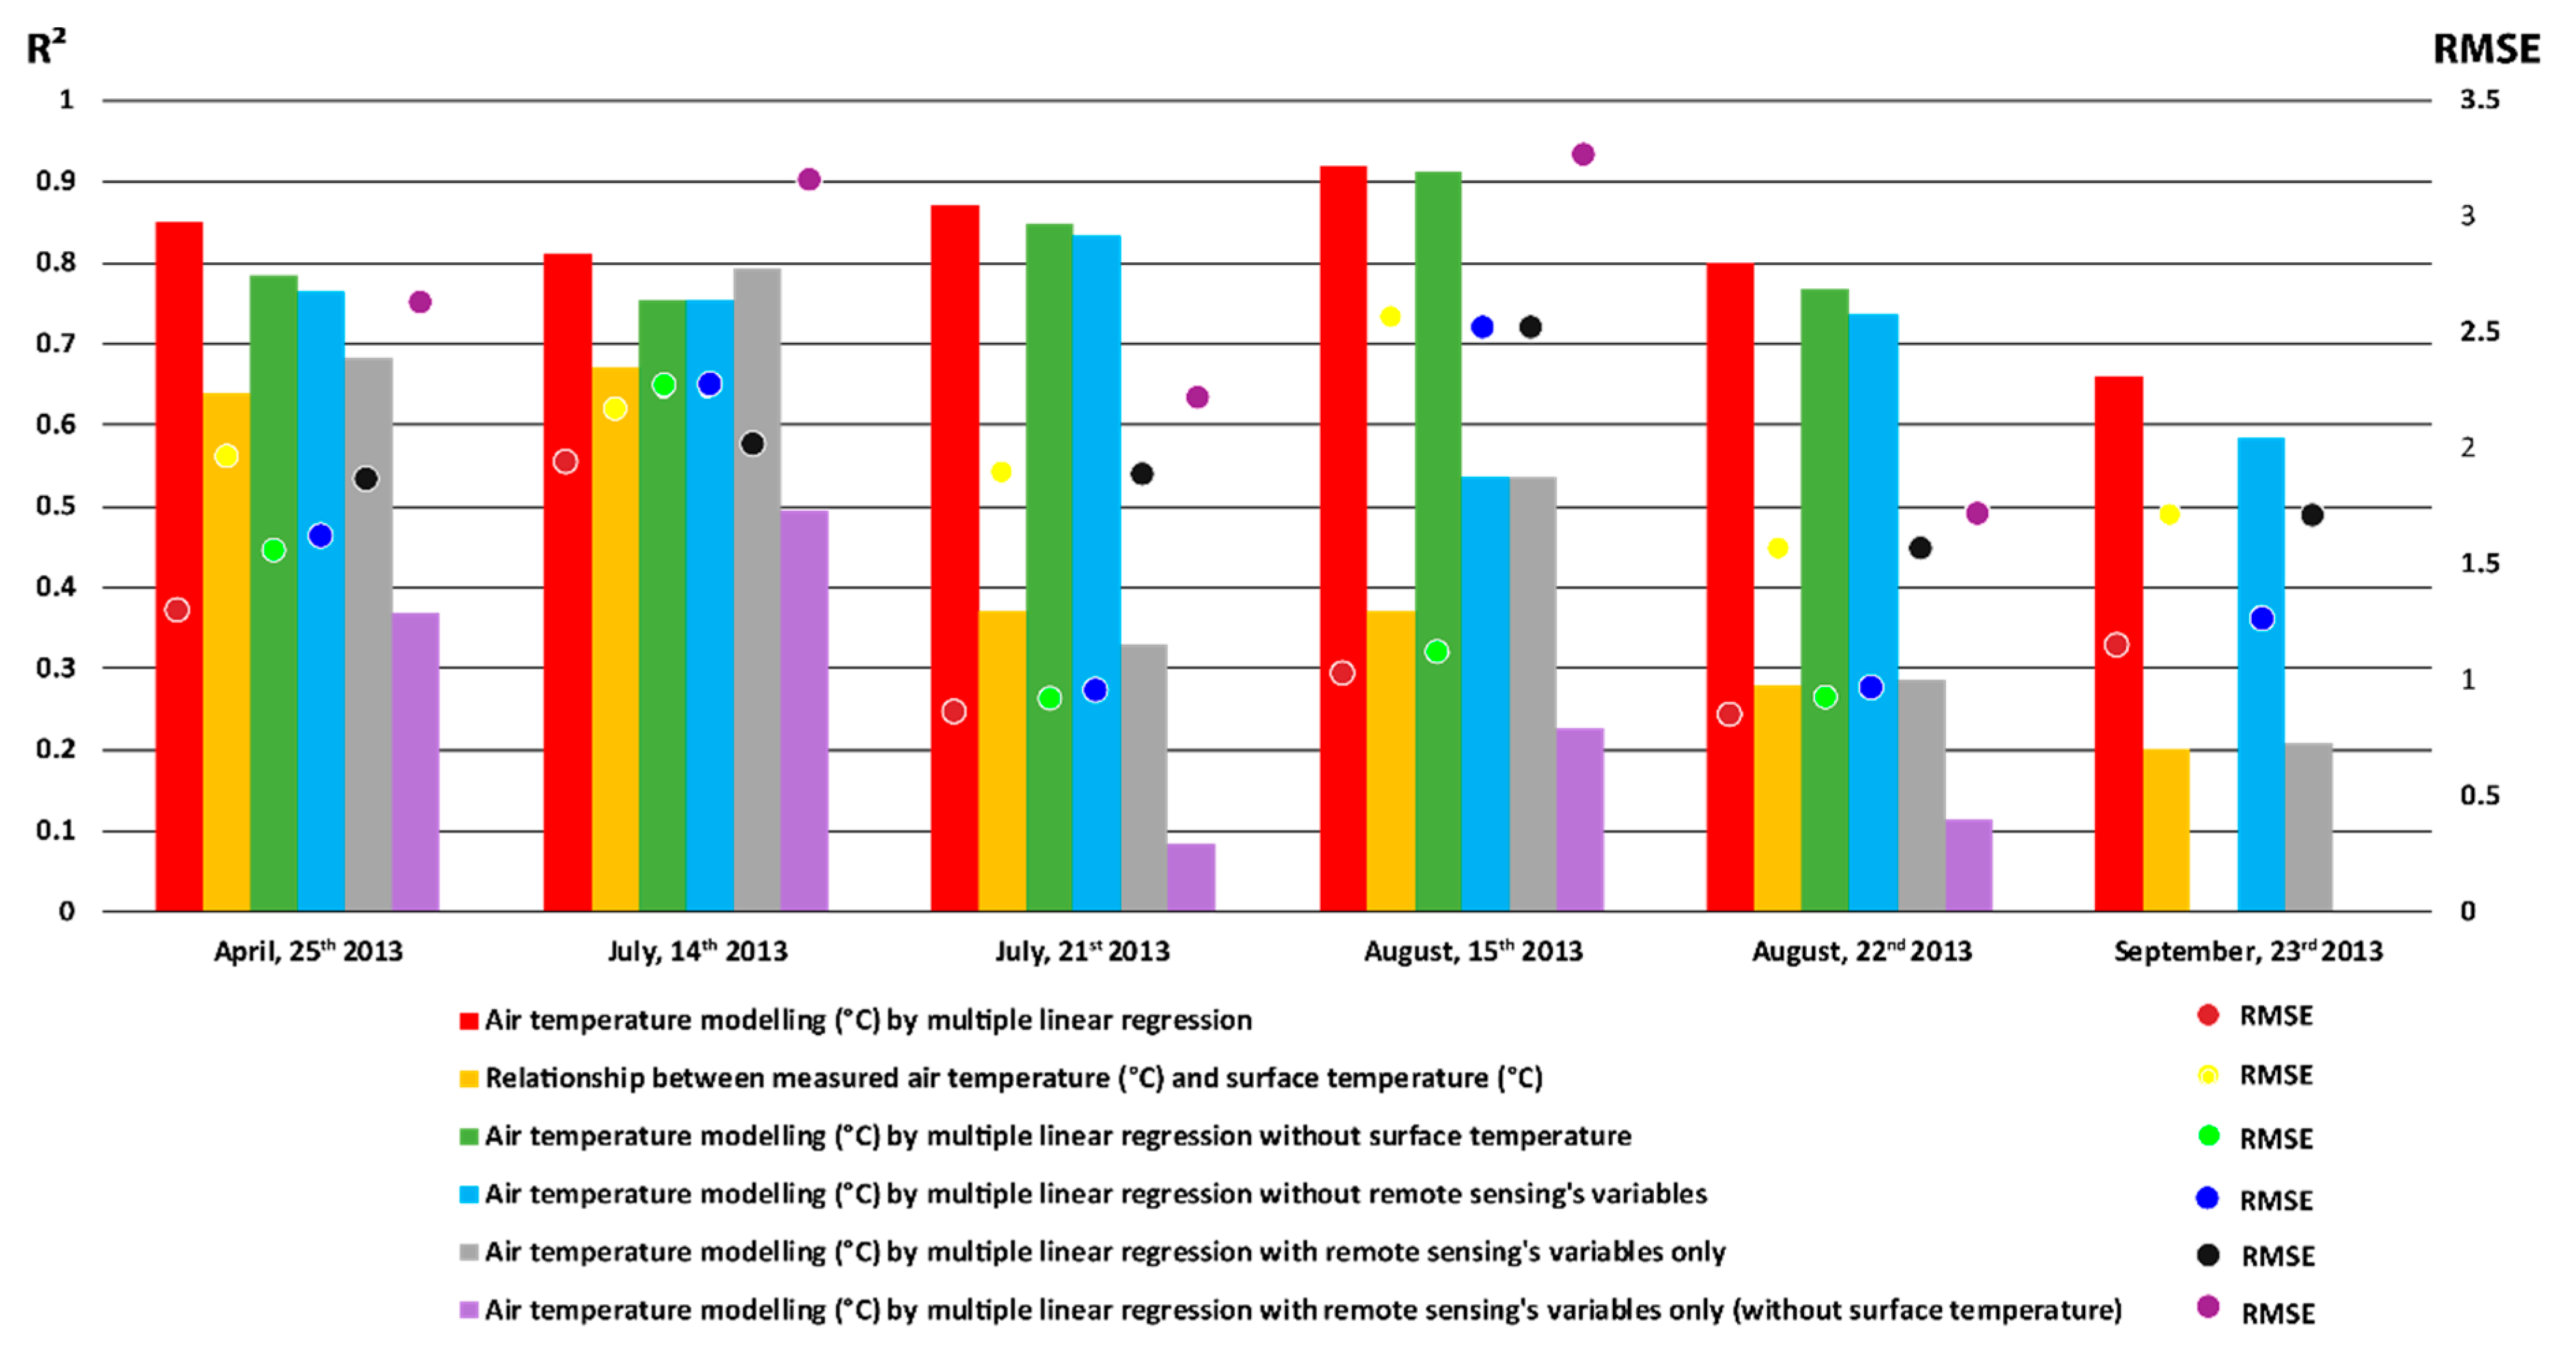
A sensitivity analysis was conducted to estimate the contribution of variables from remote sensing products (Section 2.3). As presented in the previous section, air temperature modelling with all variables gives very satisfactory results (in red in Figure 7). For example, for the day of 25 April, the determination coefficient is 0.85 and the RMSE is 1.31 °C.
Figure 7.
Results of the different modelling of air temperature over the entire study area: R2 on the left axis; Root-Mean-Square Error (RMSE) on the right axis).
When considering modelling results based only on classical air modelling variables (topography, land use, etc.), i.e., without the variables from remote sensing, it can be seen that the results are still correct (in blue in Figure 7) but lower than the previous ones. For example, for the day of 25 April, the determination coefficient is 0.76 and the RMSE is 1.62 °C.
Conversely, air temperature modelling carried out only with variables from remote sensing products (grey in Figure 7) is even less efficient. The day of 25 April 2013 has an R2 of 0.68 and an RMSE of 1.86 °C. This is not surprising because the previous results (Section 3, Table 4) indicated that the dominant variable is the elevation, both in terms of the number of times this variable has been included in the model and in terms of its normalized coefficient.
These same results indicate that the second most important variable contributing to the model is surface temperature. This is clearly shown in Figure 7 when looking at the results of modelling with all variables except surface temperature (green in Figure 7). The results of this modeling are thus positioned between those obtained with all variables and those obtained with conventional variables. Therefore, for the day of 25 April, the determination coefficient is 0.78 and the RMSE is 1.55 °C. This confirms the interest of integrating surface temperature into air temperature modelling, as previous studies have also suggested [19,20,21].
However, this relationship between air and surface temperatures is not constant and varies according to atmospheric conditions, among other things. Indeed, for the days of 25 April or 14 July 2013, the relationship between these two variables is relatively strong, with R2s of 0.64 and 0.67 respectively (in yellow in Figure 7). Conversely, this relationship may be weaker, as for the days of 22 August or 23 September 2013, with R2s of 0.28 and 0.20, respectively.
In addition, surface temperature is not the only interesting variable from remote sensing that is integrated into the modelling. When considering modelling with remotely sensed variables, with the exception of surface temperature, the results obtained are not insignificant (in purple in Figure 7). Indeed, for example, the R2 is 0.37 for the day of 25 April and 0.49 for the day of 14 July 2013. This also confirms the value of not only adding surface temperature to remote sensing products, but also other complementary variables such as spectral indices. This is one of the major contributions of this study. Indeed, the NDVI is used twice in the models for the entire study area and once in the models for artificialized areas and forest and semi-natural environment (Table 4). The EVI, MNDWI and NDBaI are also used in some models, especially with relatively high standardized coefficients (e.g., 0.30 for MNDWI for modelling in agricultural areas and 0.35 for NDBaI for forest and semi-natural environment).
4.3. Limits and Outlooks
Several limits can be considered. The first concerns the availability of the data. Indeed, the Landsat satellite passes only every 16 days over the same area which reduces the number of scenes possible. In addition, clouds have to be present. The presence of clouds would distort the modeling of the air temperature since the model integrates the surface temperature. Indeed, a cloud surface temperature is mostly negative, which is not the case of the ground under these clouds. Finally, as the last limits to this study, it can be noted that the research was carried out only on one year, 2013, with only six days available due to the dependence of valid data on the presence of clouds.
The second limit relates to the necessity to have one model equation per day due to non-stationary weather conditions [52]. These limits can be at the same time a perspective of work, while continuing the study on several years to validate the contribution of the remote sensing variables in the air temperature model.
For other perspectives, some other data satellites may be used. For example, the use of the Sentinel 2 satellite with 10 m resolution may help to increase the model by the remote sensing variables. In addition, multiple linear regressions have been used to model air temperature. However, this model does not consider the spatial variability of the data. Thus, modeling air temperature by geographically weighted regression can probe the spatial heterogeneity in data relationships [12,62].
5. Conclusions
The knowledge of air temperature distribution mechanisms is a key element in many areas, particularly in the context of urban adaptation to climate change and heat waves. In the context of this study, the modelling of air temperature by multiple linear regression gives very satisfying results for all these study days over the year 2013 (mean R2 of 0.82). The average of the absolute relative differences between the modelled air temperatures and those measured by the Météo France weather stations over all day ranges from 0.47% to 10.2%.
However, there are episodic variations in these estimates of air temperature and the associated prediction errors. This is why the use of LISA and Getis Ord GI* statistics makes it possible to quickly localise statically similar values and to be able to analyse differences and similarities on a day by day basis. Thus, there are hot spot errors in the Alps and cold spot errors close to Lake Geneva.
The contribution of remote sensing variables in the air temperature prediction model is a real added value since this integration allows us to gain in quality both an increase in the determination coefficient (a 12% benefit from the variance on average) and a decrease in the RMSE (an accuracy of more than 0.7 °C on average).
Finally, and given the current policy of streamlining the observation sites of the Météo France network, this methodology could be of some use for the weakly instrumented territories. Thus, the methods described in this study are reproducible for any area and do not require any specific resources, except the access to explanatory variables and source dataset. It can be highly useful in many fields as urban studies for heat stress planning. However, air temperature modelling will not replace direct field measurements. Thus, if cities wish to know the urban thermal gradients precisely, this necessarily requires the implementation of a dense ground measurement network.
Author Contributions
Conceptualization, L.A. and F.R.; methodology, L.A. and F.R.; validation, L.A. and F.R.; formal analysis, L.A. and F.R.; writing—original draft preparation, L.A. and F.R.; writing—review and editing, L.A. and F.R.; supervision, L.A. and F.R.; project administration, L.A. and F.R.
Funding
This research received no external funding.
Acknowledgments
The authors thank the DIRCE of Météo France for the supply of meteorological data and the USGS for the Landsat data. The authors are very grateful to the four reviewers who have greatly contributed to the improvement of this text with their relevant comments.
Conflicts of Interest
The authors declare no conflict of interest.
References
- Jouzel, J. Le Climat de la France au XXIe Siècle—Volume 4—Scénarios Régionalisés: Publishing in 2014 for Metropolitan France and Overseas Regions. 2014. Available online: http://www.ladocumentationfrancaise.fr/rapports-publics/144000543/index.shtml (accessed on 19 April 2019).
- Météo-France. Changement Climatique en Rhône-Alpes; Météo-France: Bron, France, 2011. [Google Scholar]
- ORECC. Fiche Indicateur—Climat: Changement Climatique en Auvergne Rhône-Alpes—Températures Moyennes Annuelles et Saisonnières; ORECC: Lyon, France, 2017; Available online: http://orecc.auvergnerhonealpes.fr/fileadmin/user_upload/mediatheque/orecc/Documents/Donnees_territoriales/Indicateurs/ORECC_FicheIndicateur_2017_V20170929_CumulPrecipitations.pdf (accessed on 20 September 2019).
- Keeratikasikorn, C.; Bonafoni, S. Urban Heat Island Analysis over the Land Use Zoning Plan of Bangkok by Means of Landsat 8 Imagery. Remote Sens. 2018, 10, 440. [Google Scholar] [CrossRef] [Scilit]
- Fallmann, J.; Forkel, R.; Emeis, S. Secondary effects of urban heat island mitigation measures on air quality. Atmos. Environ. 2016, 125, 199–211. [Google Scholar] [CrossRef] [Scilit]
- Benas, N.; Chrysoulakis, N.; Cartalis, C. Trends of urban surface temperature and heat island characteristics in the Mediterranean. Theor. Appl. Climatol. 2017, 130, 807–816. [Google Scholar] [CrossRef] [Scilit]
- Heino, R. Urban effect on climatic elements in Finland. Geophysica 1978, 15, 171–188. [Google Scholar]
- Giguère, M.; National Institute of Public Health of Québec, Environmental and Occupational Biological Risks Directorate. Mesures de Lutte aux Îlots de Chaleur Urbains Revue de Littérature; Environmental and Occupational Biological Risks Directorate, I National Institute of Public Health of Québec: Québec, QC, Canada, 2010. [Google Scholar]
- Wang, M.; He, G.; Zhang, Z.; Wang, G.; Zhang, Z.; Cao, X.; Wu, Z.; Liu, X. Comparison of Spatial Interpolation and Regression Analysis Models for an Estimation of Monthly near Surface Air Temperature in China. Remote Sens. 2017, 9, 1278. [Google Scholar] [CrossRef] [Scilit]
- Zhang, Z.; Du, Q. A Bayesian Kriging Regression Method to Estimate Air Temperature Using Remote Sensing Data. Remote Sens. 2019, 11, 767. [Google Scholar] [CrossRef] [Scilit]
- Chen, Y.; Quan, J.; Zhan, W.; Guo, Z. Enhanced Statistical Estimation of Air Temperature Incorporating Nighttime Light Data. Remote Sens. 2016, 8, 656. [Google Scholar] [CrossRef] [Scilit]
- Zhao, C.; Jensen, J.; Weng, Q.; Weaver, R. A Geographically Weighted Regression Analysis of the Underlying Factors Related to the Surface Urban Heat Island Phenomenon. Remote Sens. 2018, 10, 1428. [Google Scholar] [CrossRef] [Scilit]
- Wicki, A.; Parlow, E. Multiple Regression Analysis for Unmixing of Surface Temperature Data in an Urban Environment. Remote Sens. 2017, 9, 684. [Google Scholar] [CrossRef] [Scilit]
- Mira, M.; Ninyerola, M.; Batalla, M.; Pesquer, L.; Pons, X. Improving Mean Minimum and Maximum Month-to-Month Air Temperature Surfaces Using Satellite-Derived Land Surface Temperature. Remote Sens. 2017, 9, 1313. [Google Scholar] [CrossRef] [Scilit]
- Sun, Y.; Gao, C.; Li, J.; Wang, R.; Liu, J. Quantifying the Effects of Urban Form on Land Surface Temperature in Subtropical High-Density Urban Areas Using Machine Learning. Remote Sens. 2019, 11, 959. [Google Scholar] [CrossRef] [Scilit]
- The Senate. Closures of Météo-France Weather Stations and the Future of the French Public Weather Service—The Senate. Available online: https://www.senat.fr/questions/base/2011/qSEQ110317685.html (accessed on 25 April 2019).
- Barroux, R. Météo France’s Forecasts in the Budgetary Crisis. Published 15 December 2014. Available online: https://www.lemonde.fr/planete/article/2014/12/15/les-previsions-de-meteo-france-dans-la-tourmente-budgetaire_4540743_3244.html (accessed on 25 April 2019).
- Stewart, I.D. A systematic review and scientific critique of methodology in modern urban heat island literature. Int. J. Climatol. 2011, 31, 200–217. [Google Scholar] [CrossRef] [Scilit]
- Oyler, J.W.; Dobrowski, S.Z.; Holden, Z.A.; Running, S.W. Remotely Sensed Land Skin Temperature as a Spatial Predictor of Air Temperature across the Conterminous United States. J. Appl. Meteorol. Climatol. 2016, 55, 1441–1457. [Google Scholar] [CrossRef] [Scilit]
- Parmentier, B.; McGill, B.J.; Wilson, A.M.; Regetz, J.; Jetz, W.; Guralnick, R.; Tuanmu, M.-N.; Schildhauer, M. Using multi-timescale methods and satellite-derived land surface temperature for the interpolation of daily maximum air temperature in Oregon. Int. J. Climatol. 2015, 35, 3862–3878. [Google Scholar] [CrossRef] [Scilit]
- Hashimoto, H.; Wang, W.; Melton, F.S.; Moreno, A.L.; Ganguly, S.; Michaelis, A.R.; Nemani, R.R. High-resolution mapping of daily climate variables by aggregating multiple spatial data sets with the random forest algorithm over the conterminous United States. Int. J. Climatol. 2019, 39, 2964–2983. [Google Scholar] [CrossRef] [Scilit]
- Hasanlou, M.; Mostofi, N. Investigating Urban Heat Island Estimation and Relation between Various Land Cover Indices in Tehran City Using Landsat 8 Imagery. In Proceedings of the 1st International Electronic Conference on Remote Sensing, online, 22 June–5 July 2015. [Google Scholar]
- Chen, X.-L.; Zhao, H.-M.; Li, P.-X.; Yin, J. Remote sensing image-based analysis of the relationship between urban heat island and land use/cover changes. Remote Sens. Environ. 2006, 104, 133–146. [Google Scholar] [CrossRef] [Scilit]
- Jin, S.; Sader, S. Comparison of time series Tasseled Cap wetness and the normalized difference moisture index in detecting forest disturbances. Remote Sens. Environ. 2005, 94, 364–372. [Google Scholar] [CrossRef] [Scilit]
- Nguyen, K.-A.; Liou, Y.-A.; Li, M.-H.; Anh Tran, T. Zoning eco-environmental vulnerability for environmentalmanagement and protection. Ecol. Indic. 2016, 69. [Google Scholar] [CrossRef] [Scilit]
- Tsin, P.K.; Knudby, A.; Krayenhoff, E.S.; Ho, H.C.; Brauer, M.; Henderson, S.B. Microscale mobile monitoring of urban air temperature. Urban Clim. 2016, 18, 58–72. [Google Scholar] [CrossRef] [Scilit]
- Nichol, J.E.; To, P.H. Temporal characteristics of thermal satellite images for urban heat stress and heat island mapping. ISPRS J. Photogramm. Remote Sens. 2012, 74, 153–162. [Google Scholar] [CrossRef] [Scilit]
- Renard, F.; Alonso, L.; Fitts, Y.; Hadjiosif, A.; Comby, J. Evaluation of the Effect of Urban Redevelopment on Surface Urban Heat Islands. Remote Sens. 2019, 11, 299. [Google Scholar] [CrossRef] [Scilit]
- Kim, Y.-H.; Baik, J.-J. Daily maximum urban heat island intensity in large cities of Korea. Theor. Appl. Climatol. 2004, 79, 151–164. [Google Scholar] [CrossRef] [Scilit]
- Météo-France. METEO-FRANCE: Publithèque. Available online: https://publitheque.meteo.fr/okapi/accueil/okapiWebPubli/index.jsp (accessed on 19 September 2019).
- Corine Land Cover. European Environment Agency. 2012. Available online: https://www.eea.europa.eu/publications/COR0-landcover (accessed on 19 September 2019).
- Hafner, J.; Kidder, S.Q. Urban Heat Island Modeling in Conjunction with Satellite-Derived Surface/Soil Parameters. J. Appl. Meteorol. 1999, 38, 448–465. [Google Scholar] [CrossRef] [Scilit]
- Sobrino, J.; Jimenez-Munoz, J.-C.; Paolini, L. Land surface temperature retrieval from LANDSAT TM 5. Remote Sens. Environ. 2004, 90, 434–440. [Google Scholar] [CrossRef] [Scilit]
- Tran, H.; Uchihama, D.; Ochi, S.; Yasuoka, Y. Assessment with satellite data of the urban heat island effects in Asian mega cities. Int. J. Appl. Earth Obs. Geoinf. 2006, 8, 34–48. [Google Scholar] [CrossRef] [Scilit]
- Liu, L.; Zhang, Y. Urban Heat Island Analysis Using the Landsat TM Data and ASTER Data: A Case Study in Hong Kong. Remote Sens. 2011, 3, 1535–1552. [Google Scholar] [CrossRef] [Scilit]
- Shohei, K.; Takeki, I.; Hideo, T. Relationship between Terra/ASTER Land Surface Temperature and Ground-observed Air Temperature. Geogr. Rev. Jpn. Ser. B 2016, 88, 38–44. [Google Scholar] [CrossRef] [Scilit]
- Iizawa, I.; Umetani, K.; Ito, A.; Yajima, A.; Ono, K.; Amemura, N.; Onishi, M.; Sakai, S. Time evolution of an urban heat island from high-density observations in Kyoto city. Sci. Online Lett. Atmos. 2016, 12, 51–54. [Google Scholar] [CrossRef] [Scilit]
- Madelin, M.; Bigot, S.; Duché, S.; Rome, S. Intensité et délimitation de l’îlot de chaleur nocturne de surface sur l’agglomération parisienne. In Proceedings of the Colloque International de l’Association Internationale de Climatologie (AIC), Sfax, Tunisia, 3–6 July 2017. [Google Scholar]
- Roşca, C.F.; Harpa, G.V.; Croitoru, A.-E.; Herbel, I.; Imbroane, A.M.; Burada, D.C. The impact of climatic and non-climatic factors on land surface temperature in southwestern Romania. Theor. Appl. Climatol. 2017, 130, 775–790. [Google Scholar] [CrossRef] [Scilit]
- Weng, Q.; Firozjaei, M.K.; Sedighi, A.; Kiavarz, M.; Alavipanah, S.K. Statistical analysis of surface urban heat island intensity variations: A case study of Babol city, Iran. GIScience Remote Sens. 2019, 56, 576–604. [Google Scholar] [CrossRef] [Scilit]
- Weng, Q.; Quattrochi, D. Thermal remote sensing of urban areas: An introduction to the special issue. Remote Sens. Environ. 2006, 104, 119–122. [Google Scholar] [CrossRef] [Scilit]
- Alfraihat, R.; Mulugeta, G.; Gala, T.S. Ecological Evaluation of Urban Heat Island in Chicago City, USA. J. Atmos. Pollut. 2016, 4, 23–29. [Google Scholar] [CrossRef]
- Gallo, K.; Hale, R.; Tarpley, D.; Yu, Y. Evaluation of the Relationship between Air and Land Surface Temperature under Clear- and Cloudy-Sky Conditions. J. Appl. Meteorol. Climatol. 2010, 50, 767–775. [Google Scholar] [CrossRef] [Scilit]
- Taha, H. Urban climates and heat islands: Albedo, evapotranspiration, and anthropogenic heat. Energy Build. 1997, 25, 99–103. [Google Scholar] [CrossRef] [Scilit]
- Ali-Toudert, F.; Mayer, H. Effects of asymmetry, galleries, overhanging façades and vegetation on thermal comfort in urban street canyons. Sol. Energy 2007, 81, 742–754. [Google Scholar] [CrossRef] [Scilit]
- Barsi, J.A.; Lee, K.; Kvaran, G.; Markham, B.L.; Pedelty, J.A. The Spectral Response of the Landsat-8 Operational Land Imager. Remote Sens. 2014, 6, 10232–10251. [Google Scholar] [CrossRef] [Scilit]
- Shapiro, S.S.; Wilk, M.B. An analysis of variance test for normality (complete samples). Biometrika 1965, 52, 591–611. [Google Scholar] [CrossRef] [Scilit]
- OECD. Handbook on Constructing Composite Indicators: Methodology and User Guide. Available online: http://www.oecd.org/fr/els/soc/handbookonconstructingcompositeindicatorsmethodologyanduserguide.htm (accessed on 17 April 2019).
- Tibshirani, R. Regression Shrinkage and Selection via the Lasso. J. R. Stat. Soc. Ser. B Methodol. 1996, 58, 267–288. [Google Scholar] [CrossRef] [Scilit]
- Reid, S.; Tibshirani, R.; Friedman, J. A study of error variance estimation in lasso regression. Stat. Sin. 2016, 26, 35–67. [Google Scholar] [CrossRef] [Scilit]
- Voelkel, J.; Shandas, V.; Haggerty, B. Developing High-Resolution Descriptions of Urban Heat Islands: A Public Health Imperative. Prev. Chronic Dis. 2016, 13. [Google Scholar] [CrossRef] [Scilit]
- Shandas, V.; Voelkel, J.; Williams, J.; Hoffman, J. Integrating Satellite and Ground Measurements for Predicting Locations of Extreme Urban Heat. Climate 2019, 7, 5. [Google Scholar] [CrossRef] [Scilit]
- Durbin, J.; Watson, G.S. Testing for serial correlation in least squares regression. I. Biometrika 1950, 37, 409–428. [Google Scholar] [CrossRef] [Scilit] [PubMed]
- Anselin, L. Local Indicators of Spatial Association—LISA. Geogr. Anal. 1995, 27, 93–115. [Google Scholar] [CrossRef] [Scilit]
- Getis, A.; Ord, J. A Research Agenda for Geographic Information Science. In Spatial Analysis and Modeling in a GIS Environment; McMaster, R.B., Usery, E.L., Eds.; CRC Press: Boca Raton, FL, USA, 1996; p. 416. Available online: https://books.google.fr/books?hl=fr&lr=&id=k9x0B3V3op0C&oi=fnd&pg=PA157&ots=cOnYyDRjKL&sig=nW-5WZ7_04hBe-lbgv2MdwBABBM&redir_esc=y#v=onepage&q&f=false (accessed on 3 May 2019).
- Getis, A.; Ord, J.K. The Analysis of Spatial Association by Use of Distance Statistics. Geogr. Anal. 1992, 24. [Google Scholar] [CrossRef] [Scilit]
- Qaid, A.; Lamit, H.B.; Ossen, D.R.; Rasidi, M.H. Effect of the position of the visible sky in determining the sky view factor on micrometeorological and human thermal comfort conditions in urban street canyons. Theor. Appl. Climatol. 2018, 131, 1083–1100. [Google Scholar] [CrossRef] [Scilit]
- Chen, L.; Ng, E.; An, X.; Ren, C.; Lee, M.; Wang, U.; He, Z. Sky view factor analysis of street canyons and its implications for daytime intra-urban air temperature differentials in high-rise, high-density urban areas of Hong Kong: A GIS-based simulation approach. Int. J. Climatol. 2012, 32, 121–136. [Google Scholar] [CrossRef] [Scilit]
- Hodul, M.; Knudby, A.; Ho, H.C. Estimation of Continuous Urban Sky View Factor from Landsat Data Using Shadow Detection. Remote Sens. 2016, 8, 568. [Google Scholar] [CrossRef] [Scilit]
- Dong, Y.; Varquez, A.C.G.; Kanda, M. Global anthropogenic heat flux database with high spatial resolution. Atmos. Environ. 2017, 150, 276–294. [Google Scholar] [CrossRef] [Scilit]
- Chrysoulakis, N.; Grimmond, S.; Feigenwinter, C.; Lindberg, F.; Gastellu-Etchegorry, J.-P.; Marconcini, M.; Mitraka, Z.; Stagakis, S.; Crawford, B.; Olofson, F.; et al. Urban energy exchanges monitoring from space. Sci. Rep. 2018, 8, 1–8. [Google Scholar] [CrossRef] [Scilit]
- Lin, X.; Su, Y.-C.; Shang, J.; Sha, J.; Li, X.; Sun, Y.-Y.; Ji, J.; Jin, B. Geographically Weighted Regression Effects on Soil Zinc Content Hyperspectral Modeling by Applying the Fractional-Order Differential. Remote Sens. 2019, 11, 636. [Google Scholar] [CrossRef] [Scilit]

© 2019 by the authors. Licensee MDPI, Basel, Switzerland. This article is an open access article distributed under the terms and conditions of the Creative Commons Attribution (CC BY) license (http://creativecommons.org/licenses/by/4.0/).