


Abstract
Disaster risk perception in informal urban settlements remains insufficiently understood despite its importance for climate adaptation and urban resilience policies. This study evaluated disaster risk perception among residents of nine informal settlements in Greater Santo Domingo, Dominican Republic, focusing on the relationship between the subjective risk of disaster, poverty, and socio-environmental vulnerability. A mixed-methods approach was applied using the RISKPERCEP algorithm and a structured survey composed of 98 questions grouped into key perception variables. A total of 198 surveys were conducted across four municipalities, supported by expert consultation, probabilistic sample-size calculation, and statistical analyses including chi-square tests and Cramér’s V coefficients. The results revealed a generalized moderate underestimation of climate-related risks, mainly associated with limited understanding of hazards, weak institutional trust, low personal involvement, poor memory of past disasters, and reduced concern about consequences. Socioeconomic deprivation, particularly among women, retirees, and low-income groups, was strongly associated with higher perceived vulnerability. Statistical analyses demonstrated a dense and multidimensional network of interdependent social, economic, and spatial variables shaping vulnerability. The study concludes that low disaster risk perception constitutes a major barrier to climate adaptation in informal settlements and highlights the need for integrated public policies combining social protection, climate education, urban resilience, and community-based adaptation strategies. The implications of this study point to the use of a disaster risk perception inquiry method at the community level, structured around specific variables that allow the identification of underlying causes of the widespread underestimation of disaster risk. This approach enables the design of adaptive policies—both structural and non-structural—that explicitly incorporate these aspects when formulating resilience measures. Future research should aim to generalize the study to other communities across the country, preceded by addressing the limitations identified.
1. Introduction
Urbanization in Latin America and the Caribbean has been characterized by rapid demographic growth, unequal access to housing, and the expansion of informal settlements. This geographic area has been consistently marked by the expansion of informal settlements, a process driven by socioeconomic inequalities, weak land-use regulation, and limited access to formal housing. This dynamic has intensified territorial fragmentation, infrastructure deficits, and socio-environmental vulnerability across the region [1]. Comparative evidence illustrates the breadth of this phenomenon: in Lima, informal settlements challenge sustainable regeneration and monitoring through geospatial technologies [2,3]; in Chile, morphogenetic analyses reveal persistent informal growth patterns [4]; in Bogotá, predictive models highlight unplanned human settlements in peri-urban areas [5,6]; in Buenos Aires, inequalities shape interventions in informal districts [7]; in Mexico, urban expansion has been linked to climate and land-use pressures [8]; and in Medellín, studies document cascading effects of infrastructure failures in both formal and informal areas [9]. Broader regional reviews confirm that while strategies such as land regularization, participatory planning, and geospatial integration have achieved partial advances, long-term sustainability remains constrained by governance deficits and unequal access to land [10,11].
Globally, more than one billion people live in informal or precarious urban contexts, where poverty, environmental degradation, and disaster exposure converge [12]. International frameworks such as the Sendai Framework for Disaster Risk Reduction [13] and the Sustainable Development Goals [14] emphasize the urgent need to strengthen urban resilience, reduce vulnerabilities, and promote inclusive governance [15]. Yet, despite these global commitments, informal settlements continue to expand under conditions of socioeconomic marginalization, limited institutional capacity, and weak territorial planning [16,17,18,19].
Informal settlements are consistently identified in the global literature as critical hotspots of disaster risk due to the convergence of physical exposure, socioeconomic vulnerability, and limited institutional support. Recent studies show that these areas are frequently located in hazard-prone environments—such as floodplains, unstable slopes, or coastal zones—largely because of restricted access to formal land markets and planning systems. For instance, Bhanye and Li et al. [19,20] estimate that approximately one-third of slum residents in the Global South are exposed to potentially “disastrous” flooding, highlighting a structural link between informality and environmental risk. Beyond exposure, vulnerability is amplified by precarious housing conditions, infrastructure deficits, overcrowding, and limited access to water, sanitation, and emergency services, which constrain both preparedness and response capacities. Emerging research also emphasizes that these risks are dynamic and intensifying under climate change, as extreme weather events disproportionately affect populations excluded from formal urban governance and protective systems. Moreover, recent empirical work highlights how disaster risk in informal settlements is shaped by interacting socio-environmental and institutional drivers, reinforcing cycles of loss, damage, and marginalization across cities in Africa, Asia, and Latin America [19]. Overall, the evidence underscores that informality is not merely a spatial condition but a key determinant of disaster risk production, requiring integrated and inclusive risk reduction strategies that address both structural inequalities and environmental hazards [21].
In the Dominican Republic, and particularly in Santo Domingo, informal urbanization has intensified in areas characterized by irregular land tenure, precarious housing, inadequate sanitation, and scarce access to safe drinking water [22]. These communities often emerge from families’ urgent need to settle near sources of employment rather than benefiting from planned territorial development. This dynamic reproduces cycles of poverty and exclusion while simultaneously increasing exposure to hurricanes, floods, and other climate-related disasters [23]. The intersection of poverty and environmental risk creates chronic vulnerability that obstructs the transformation of these spaces into sustainable and resilient communities [24,25,26]. The Dominican Republic, as a small island developing state, is highly exposed to extreme hydrometeorological events. Since 1851, the country has been impacted by more than 70 hurricanes, 24 of which reached major hurricane status due to their destructive capacity. In total, Hispaniola has experienced at least 145 hydrometeorological events over 173 years, including 59 tropical storms, 46 hurricanes, 24 major hurricanes, and 16 tropical depressions. Of these, 77 directly affected Dominican territory, while 68 caused indirect damage, with the Caribbean Sea being the most frequent route, concentrating 106 events [27].
Among the most devastating hurricanes, we can cite San Zenón (1930, category 4 on the Saffir–Simpson scale), which destroyed much of Santo Domingo, causing over 4500 deaths; David (1979, category 5), the only one of this category to strike the country, resulting in nearly 2000 deaths and the destruction of approximately 200,000 homes; and Georges (1998, category 4), which severely affected the entire nation, with extensive damage to housing, agriculture, and electrical systems. In Greater Santo Domingo, approximately 44 hurricanes and 32 tropical storms have been recorded since 1851, leaving a legacy of human and economic losses. Recent floods in November 2022 and 2023, as well as April 2026, highlight the city’s persistent vulnerability, linked to structural deficiencies such as inadequate stormwater drainage, occupation of ravines, unplanned urban growth, and poor solid waste management [28].
A critical dimension of this challenge is the low perception of disaster risk among residents. Despite living in precarious conditions and facing high exposure, many communities underestimate the threats posed by climate change and environmental hazards. This lack of awareness and preparedness limits community participation in resilience-building initiatives and reduces the effectiveness of public policies. While previous studies have examined structural vulnerabilities in informal settlements [16,17,21,29], there is a significant gap in analyzing how subjective risk perception of disaster interacts with poverty and socio-environmental challenges to perpetuate disaster exposure [30]. Recent local studies highlight the importance of integrating community-level perceptions into disaster risk assessments, reinforcing the relevance of this research in the Dominican context [31,32,33].
On the other hand, risk studies have become a key tool for assessing sustainability, as they integrate both objective and subjective dimensions [34]. However, one of the most complex aspects is risk perception (subjective risk), which remains less developed than objective risk [35]. Objective risk relies on measurable data such as event statistics, production records, and imaging systems [36,37], often focusing on impacts. Prospective tools like risk matrices and failure mode and effect analyses have further strengthened its evaluation [38,39].
The way individuals and societies recognize, interpret, and manage potential dangers is commonly conceptualized as risk perception. Scholars have explored this construct using diverse explanatory models, among them cognitive and heuristic approaches, the psychometric paradigm, cultural interpretations of risk, social amplification mechanisms, and emotional perspectives emphasizing risk-related feelings [40,41,42]. More recently, Pirla [43] proposed a psychological model of collective risk perceptions that integrates individual probabilistic reasoning with the social transmission of information, highlighting how contextual and organizational factors shape emergent perceptions of risk.
The rationale for triangulating material living conditions, socioeconomic indicators, and subjective well-being relies on the consensus that risk perception is fundamentally shaped by structural coping capacities [44]. Material deprivation does not merely represent a lack of physical assets; it functions as a chronic stressor that severely limits a household’s capacity to anticipate, cope with, and recover from external shocks [45]. Empirical research demonstrates that individuals facing severe financial strain—such as the inability to meet unexpected expenses—exhibit significantly higher levels of risk perception, as they lack the economic safety nets required for post-disaster resilience [46]. Consequently, evaluating objective socioeconomic indices alongside subjective welfare measures allows for a comprehensive understanding of vulnerability, moving beyond traditional hazard exposure models to capture the psychological and material realities of community vulnerability [47].
The psychometric paradigm, central to this study, quantitatively identifies qualitative factors shaping perception. Beyond probability, elements such as dread, perceived control, uncertainty, and catastrophic potential strongly influence how risks are judged [48,49]. Cultural theory highlights how perceptions are shaped by values and “ways of life” (hierarchical, individualist, egalitarian, fatalist), influencing which risks are prioritized [50]. Cultural and religious diversity also affects perception, linking it to health, cognition, and experiences with extreme events [51]. While not explored in depth here, these aspects are incorporated through the psychometric approach.
According to the social amplification of risk perspective, societal mechanisms and information flows play a central role in shaping how hazards are perceived, either increasing or diminishing their perceived significance through communication and collective behavior [52]. The concept of “risk as feeling” further suggests that risk judgments are influenced not only by rational evaluation but also by emotional and intuitive responses to potential dangers [53]. This relationship is particularly relevant in sustainability contexts, where risks emerge from and affect the complex interactions among environmental, economic, and social systems [54]. Differences between expert assessments and public attitudes reveal the shortcomings of assuming that greater knowledge alone leads to public acceptance. Citizens often evaluate risks through ethical, social, and emotional lenses that extend beyond the scope of conventional technical assessments [49,52]. Unlike objective risk, risk perception reflects how people understand and react to hazards, shaping behavior. Research has increasingly focused on measuring these perceptions and behaviors [35,36,55,56,57,58]. Perceived risk profiles have proven effective, particularly variable-based approaches that integrate survey data [55,56,57].
This study seeks to address that gap by analyzing disaster risk perception in informal settlements of Santo Domingo through a case study approach. By examining the intersection of poverty, socio-environmental conditions, and community perspectives, the research identifies structural and behavioral factors that hinder transformation. The findings provide evidence to inform risk governance and urban resilience strategies, underscoring the urgent need to transform informal settlements into sustainable and resilient communities capable of confronting climate change scenarios.
The proposed study will address the following hypothesis: “The implementation and application of tools for diagnosing subjective disaster risk in human settlements will enable the development of a model for transforming informal settlements in Santo Domingo into eco-friendly and resilient communities under climate change scenarios”. As a novelty, this research shows the use of a multidimensional risk perception inquiry tool, focused on risk perception variables, with which it is possible to discover the underlying causes of the deviation from the adequate perception of disaster risk in communities and direct efforts towards the solution of these problems.
2. Materials and Methods
2.1. Perceived Risk Profile
One of the methodologies that has gained the most traction is the use of perceived risk profiles [33,58,59,60,61]. In Santo Domingo, informal settlements such as La Barquita and Domingo Savio are recurrently impacted by floods from the Ozama and Isabela rivers, hurricanes, and extreme rainfall events. Recent disasters illustrate the gravity of the problem: in November 2022, extreme rainfall of 260 mm in less than 24 h caused widespread inundation, while in November 2023, record precipitation of 431 mm led to 21 fatalities, the displacement of over 13,000 residents, and severe infrastructure damage [27] Tropical Storm Franklin in August 2023 further exacerbated vulnerabilities, damaging homes, crops, and livelihoods across multiple provinces and requiring mass evacuations coordinated by the Dominican Red Cross. These recurrent hazards highlight the chronic exposure of tens of thousands of residents in Santo Domingo’s informal settlements, underscoring the urgency of developing diagnostic tools for subjective disaster risk perception as a foundation for eco-friendly and resilient urban transformation under climate change scenarios. Although risk profiles can be represented directly from surveys [62,63], the variable-based profile approach has become increasingly popular due to its comprehensiveness. In this approach, each variable—encompassing the results of several questions—provides a clearer view of the risk perception of the studied groups, as these variables serve as tools to cluster and average opinions [61,64,65].
Given the multidimensional socioeconomic and environmental nature of this problem, the research combines quantitative and qualitative methods and designs. The summary algorithm of the method, developed for this study, includes the diagnosis of subjective criteria, recommendations of adaptation actions, and iterative evaluation after the implementation of recommendations. The algorithm is presented in Figure 1.
Figure 1.
Algorithm for diagnosis and management of subjective resilience in human settlements.
Subjective resilience is evaluated based on residents’ opinions regarding their living conditions and ability to deal with the phenomena that are precursors to disasters, collected through a disaster risk perception survey. The key aspects of the block diagram of the algorithm shown in Figure 1 are described below. The methodology of perceived risk profiling—based on variables and surveys—has been applied. This methodology is programmed in the RISKPERCEP code [65]. The RISKPERCEP program, designed by specialists from the University of Havana, is based on the use of the psychometric paradigm to measure, through variables and surveys, the perception of risk at the public level or on specialized fronts such as environmental, technological or occupational risk [33,60,63,64].
The variables used to evaluate risk perception are selected according to the research objectives and analytical framework adopted [58,59,60]. In the context of psychosocial risk studies, these factors are generally grouped into three dimensions (Table 1): characteristics of the individual, attributes inherent to the hazard, and elements associated with the way risks are managed [59,60].
Table 1.
Variables used in the study of disaster risk perception in informal human settlements facing disasters.
The relationship between these variables and perceived risk also plays an important role in their selection. Some factors contribute to higher levels of perceived risk, including catastrophic consequences, panic-inducing potential, and the rapid onset of adverse effects. Others tend to reduce perceived risk, such as familiarity with the hazard, the belief that it can be controlled, and the possibility of reversing its impacts. Risk comprehension represents a special case because its effect is characterized by a shared tendency among both specialists and the general public to underestimate its importance. To facilitate analysis and avoid the introduction of subjective biases, all variables are treated as independent and are assumed to contribute equally to the overall assessment.
The questionnaire (Table S1, Supplementary Materials) was adapted to the types of hazards and study groups in order to generate empathy, moving from the familiar to uncertainty, from the general to the particular, and from the institutional to the individual [66]. To facilitate evaluation, closed-ended questions with pre-designed responses were employed, arranged in a unidirectional increasing order with three gradations. This design ensures correlation with the associated risk perception scale, which has three levels: 1 indicates risk underestimation, 3 indicates risk overestimation, and 2 represents adequate risk estimation [61,67]. The assumption of independence is made only for the purpose of assigning equivalent weights in the algorithmic calculation of the integrated index while recognizing from the outset its latent interdependent nature in social reality.
This scale applies to questions with variables that evolve directly in relation to the associated perception. When variables evolve inversely or extremely, the computational tool performs adjustments during evaluation. A specific feature of this survey was its intentional ordering and direction toward symmetrical questions, corresponding to the area of objective indicators.
A significant aspect of this specialized survey was the inclusion of questions addressing the poverty index of the surveyed community members. This addition resulted from research informed by experiences in European community studies [68,69]. To confirm the quality of the survey, it was subjected to two validation methods: one assessing the probability of random responses and another involving expert review [70,71]. For calculating the probability of random responses, the Gaussian distribution was applied:
These terms show that the Gaussian distribution , evaluated for population with probability of success , is equivalent to the normal distribution with population mean and standard deviation . Substituting the terms and , the following expression is obtained:
Additionally, the probability of random success, considering as the number of questions that must be answered correctly for the survey to be deemed acceptable, can be calculated as
To assess this criterion, the Gaussian distribution (Equation (1)) was employed, considering the total number of questions (n = 98), the probability of success for each question (P = 0.4), the probability of failure (Q = 0.6), and the threshold score Xmeta (Equation (3)). Candidate values of Xmeta were iteratively evaluated until the probability of obtaining a passing score through random guessing was effectively zero. The analysis identified 59 correct responses as the minimum threshold. Consequently, a respondent would need to answer at least 59 questions correctly by chance to achieve an acceptable score. Given the negligible likelihood of this event, the survey instrument satisfies this adequacy criterion.
A Delphi round with experts was conducted to discuss the survey [72]. Based on their suggestions, modifications were made to construct the final version (Table S1, Supplementary Materials). The expert review consisted of meetings with specialists from various institutions, whose contributions were essential for refining the methodological framework of the study. To ensure the preparedness of the research team, evaluators were subsequently trained in the application of objective indicators. This process was supported by the availability of a multidisciplinary group of experts, including civil engineers, structural specialists, vulnerability assessors, psychologists, financial analysts, and professionals in climate change and disaster risk management, who had previously conducted evaluations comparable to those required in this study. Their collective expertise provided both methodological rigor and practical experience, strengthening the reliability and validity of the assessment process. The experts provided suggestions regarding the content of the questions and their response options. These recommendations led to amendments to the original version of the survey. Once the final list of questions was approved, it was incorporated into an intuitive, powerful, and reliable software tool designed for data collection, analysis, and management in surveys, monitoring, evaluation, and research: KoboToolbox 2.026.27c. This digital tool, which operates both online and offline, was specifically designed to facilitate survey implementation and data collection. The tool designed for the study of subjective indicators is available at https://ee-eu.kobotoolbox.org/x/fbHCndjh (accessed on 12 February 2026).
An important detail in the study of subjective risk was the calculation of a representative sample according to the resident population values in each settlement. For this purpose, Equation (4) [73], programmed within the RISKPERCEP code, was applied:
where n—sample size; p—probability of success; q—probability of failure; e—precision (maximum allowable error in the proportion); Z—probabilistic factor, defined as a function of the confidence level error; and N—initial population.
For the disaster risk perception survey, training sessions were required for its administrators. The application of the tools was facilitated by their availability in the form of online questionnaires. During implementation, databases were updated in real time and compiled in Excel tables, collecting data provided by evaluators and community members in their respective areas of participation.
An intermediate step in the risk perception study was the interpretation of responses to each question according to pre-established keys in the required format (see Supplementary Materials) for evaluation via RISKPERCEP. Since some questions deviated from the traditional format of closed, unipolar increasing responses, interpretation keys were established for questions designed differently (multi-option or priority ranking).
For evaluation with RISKPERCEP, it is essential to have files containing: (i) risk perception variables (including polytomous variables and their relationship with associated perception), (ii) surveys (closed, unipolar increasing questions related to the variables under study), and (iii) risk perception compilations (responses coded as values 1, 2, and 3, corresponding to underestimation, adequate estimation, and overestimation of risk).
With this data, the system quantifies averaged indicators at the individual, variable, and group levels, presented in analytical tables and perceived risk profiles. In addition to group indicators, dispersion studies of responses are conducted to determine the level of agreement within the group regarding the trends represented by the pre-designed survey questions. Interpretation of these results using the Pareto principle allows deduction of behavioral patterns in addressing the investigated issues.
The evaluation algorithm itself was used to re-quantify resilience capacities once the recommendations deduced through the method were implemented. The optimization or re-evaluation loop can be visualized in Figure 1 (bottom right).
2.2. Study Location
The sample size, calculated using RISKPERCEP, was determined for the four municipalities and their corresponding settlements. Common parameters applied to the expression in all cases (Equation (4)) included: probability of success (Psuccess = 0.4), probability of failure (Qfailure = 0.6), confidence level of 95%, and precision of 7%. Considering the variable population size represented in each municipality, the sample size for each case is illustrated in Table 2.
Table 2.
Population sample calculation for the studied settlements.
Considering representativeness for the studied population (according to the initial parameters) and the effort required to meet this criterion, a minimum of 191 surveys was necessary. In total, 198 surveys were successfully conducted among participants selected from community members who demonstrated leadership capacity and were permanent residents of the settlements, ensuring that the sample reflected both local authority and lived experience across each of the municipalities studied, as shown in Table 2.
The administration of surveys for this study was approved by the corresponding ethics committee, which required informed consent from all participants. The eight individuals who declined to participate in the survey were not included in the results, thereby ensuring respect for participant autonomy and the methodological integrity of the analysis.
For the selection of settlements, criteria such as climate vulnerability, poverty, and existing infrastructure in the locality were considered, among others. The studied settlements correspond to four municipalities of Santo Domingo (Figure 2), where informal communities were selected, some of them exposed to multiple hazards, which further highlights the importance of this issue. The Ministry of Economy, Planning and Development (MEPyD) evaluated 155 municipalities against threats such as precipitation, droughts, heat waves, cyclones and floods. The study identifies the National District, Santo Domingo East, Santo Domingo North and Santo Domingo West among the municipalities with the greatest vulnerability to human settlements. In addition, Santo Domingo East, Santo Domingo North, National District and Santo Domingo West occupy the first places in the global municipal climate vulnerability index [74]. The geolocation of the selected communities in each municipality is presented in Table S2 (Supplementary Materials). These nine settlements for the fieldwork were selected as they are the most representative of the four municipalities of Santo Domingo in terms of vulnerability, poverty, and exposure to potential disasters [74]. In addition, to test the versatility of the methodology, the settlements were diversified by including some with comparatively higher levels of resilience.
Figure 2.
Settlements considered in the study. (A) Dominican Republic; (B) Santo Domingo, Distrito Nacional: 1—La Yuca; 2—La 800ta; 3—Capotillo; 4—Los Mina; 5—Los Tres Brazos (Ribera del Ozama); 6—Los Coordinadores; 7—Villa Mella; 8—Pueblo Chico; 9—Juan Guzmán.
2.3. Socioeconomic Vulnerability Index
Building on the information collected in the survey regarding poverty indices and living standards [75,76,77], several indicators were introduced to enable socioeconomic vulnerability studies. These indicators were derived from questions 60 to 65 of the survey (Table S1, Supplementary Materials). To capture the multidimensional nature of social vulnerability, the analysis integrates three primary analytical dimensions derived from the community survey: material deprivation, household income streams, and subjective well-being.
- -
- Material Deprivation: This dimension evaluates structural living conditions through specific indicators of financial strain, such as the household’s inability to cope with unexpected financial expenses, arrears in utility bills, or the incapacity to afford a one-week annual holiday. These indicators serve as proxies for localized economic vulnerability and immediate resource scarcity.
- -
- Income Streams: Quantitative data on household income were gathered to assess direct financial capacity and liquidity. Income levels are analyzed relative to regional poverty thresholds to identify households facing acute economic marginalization.
- -
- Subjective Well-Being and Health: This component captures the experiential dimension of vulnerability. It incorporates self-reported health status and individuals’ perceptions of their quality of life, which act as critical mediators in how risks are perceived and managed at the household level.
To synthesize the operationalized dimensions into a standardized comparative metric, we constructed the Socioeconomic Vulnerability Index (SEVI). This composite index aggregates the objective indicators of material deprivation and income with subjective well-being metrics to provide a holistic measure of community vulnerability. The index construction follows a three-step aggregation procedure:
- -
- Normalization: To ensure comparability across disparate indicators (e.g., continuous income data versus categorical deprivation variables), all individual metrics were normalized using a min–max scaling method, bounding values strictly between 0 (lowest vulnerability) and 1 (highest vulnerability).
- -
- Weighting: Equal weights were assigned to each of the three primary dimensions (Material Deprivation, Income, and Subjective Well-Being) to avoid subjective bias and to reflect their co-equal importance in defining structural coping capacities as established in vulnerability literature.
- -
- Aggregation: The normalized indicators were mathematically aggregated to generate the final composite score for each surveyed household and municipality. The resulting index score allows for the spatial and statistical identification of highly vulnerable clusters within the studied communities.
Statistical Analysis of Socioeconomic Vulnerability
For this analysis, nine of the variables studied were taken: V1—sex, V2—municipality or district of residence, V3—type of community zone, V4—age range, V5—employment status, V6—general health condition, V7—regular participation in hobbies or meeting friends or family at least once a month for social gatherings, V8—regular participation in leisure activities such as sports, cinema, or concerts, and V9—household per capita income. All variables included in the analysis are categorical (qualitative) in nature, representing socio-demographic, economic, and living-condition dimensions. Prior to analysis, the dataset was preprocessed to ensure consistency across categories. All variables were treated as nominal and converted into string format to facilitate contingency table construction.
The existence of a statistical association between categorical variables was evaluated using Pearson’s chi-square (χ2) test of independence. For each pair of variables, a contingency table was constructed, and the χ2 statistic was computed using Equation (5).
where represents the observed frequency in cell ; represents the expected frequency under independence, and and denote the number of categories in each variable.
The null hypothesis () assumes independence between variables, while the alternative hypothesis () assumes the existence of an association. Statistical significance was assessed at the 5% level (α = 0.05) throughout the analysis. The intensity of the relationships between variable pairs was estimated using Cramér’s V coefficients calculated according to Equation (6).
where is the total sample size and and are the dimensions of the contingency table.
Cramér’s V ranges between 0 and 1, allowing standardized comparison across variable pairs regardless of table size. The following thresholds were used for interpretation:
- 0.00–0.20: very weak;
- 0.20–0.40: weak;
- 0.40–0.60: moderate;
- 0.60–0.80: strong;
- 0.80–1.00: very strong.
Two square matrices were constructed: a chi-square matrix, containing χ2 values for all pairwise combinations, and a Cramér’s V matrix, containing standardized association coefficients. Diagonal elements were set to χ2 = 0 and V = 1 to indicate self-association. All analyses were performed using Python (version 3.x) in a scientific computing environment. The following libraries were used: pandas for data preprocessing and contingency tables, scipy.stats for computation of chi-square statistics, and numpy for numerical operations and Cramér’s V calculation.
3. Results and Discussion
3.1. Study of Perceived Risk of Disasters in Informal Communities of Santo Domingo
The disaster risk perception evaluation employed an algorithm for the diagnosis and management of resilience, while also integrating subjective indicators. The evaluation of the four cases yielded the results presented in Table S3 (Supplementary Materials) and illustrated in Figure 3. For the interpretation of these results, it must be recalled that adequate disaster risk perception corresponds to value 2, while risk underestimations fall within the interval between 1 and 2, and overestimations between 2 and 3.
Figure 3.
Disaster risk perception profile across studied municipalities. The dashed line represents the average value of risk perception. The values indicated for each municipality in the legend correspond to the average value of the disaster risk perception. FAMI—familiarity with risk, COMP—understanding of risk, INVO—personal involvement, BE-C—economic–cultural well-being, CATA—catastrophic potential, HIST—past history of disasters or hazards, REVE—reversibility of consequences, PREO—concern, INST—trust in institutions, CLIM—organizational climate. The dimensionless risk perception scale (Y-axis) indicates the following: (1–1.67)—underestimation of risk; (1.68–2.23)—adequate risk estimation; and (2.24–3)—overestimation of risk.
The risk perception study was conducted at the municipal level for reasons of sample representativeness. Although the differences are slight, the greatest underestimation of risk, in order of priority (according to average values), occurs in Santo Domingo Guzmán and Santo Domingo Este, where highly vulnerable communities were identified—namely, Los Mina and Los Tres Brazos in Santo Domingo Este, and La Yuca and La 800ta in Santo Domingo Guzmán. This situation is particularly concerning, as it reflects an adaptation to degraded living conditions, which may hinder the implementation of adaptation measures. On the other hand, in settlements with relatively better resilience conditions (Pueblo Chico and Juan Guzmán), risk underestimation also persists. Correspondingly, it appears that certain improvements in living conditions tend to reduce awareness of everyday risks. The perceived risk profile for the four groups of the studied settlements is presented in Figure 3.
The general behavior of the communities tends toward a moderate underestimation of risk (between 1.5 and 1.7). Considering the small differences in disaster risk perception among municipalities, the focus is placed on the variables that generate deviations from adequate risk perception. This is largely explained by limited risk comprehension, low sense of involvement, weak perception of catastrophic potential, poor knowledge or memory of past impacts, limited concern about events and their consequences, and a perceived lack of institutional attention and associated organizational climate. The most recurrent disasters reported by respondents correspond to riverine and pluvial floods, as well as hurricanes. Landslides follow in order of frequency. Although other hazards, such as tsunamis and earthquakes, were also considered, they received very few positive responses. On the other hand, regarding anthropogenic disasters, domestic fires—primarily of electrical origin—were identified as the most prevalent.
The findings reveal a situation of apathy regarding the investigated vulnerabilities and potential actions against threats. This is nuanced by the perception of low reversibility of consequences (less reversibility–higher risk estimation), which corresponds to an overestimation for this variable. Similarly, the economic and cultural well-being variable shows overestimation (lower well-being–higher risk perception), reflecting marked inequality and a tendency toward poverty, particularly among vulnerable groups such as retirees, women, and low-income individuals or those lacking access to comfort indicators assessed by the tool [78].
Another comparable study was conducted in Honduran universities on climate change and natural disasters [64]. In that case, the variables responsible for underestimation also showed similarities in COMP and INST. Honduran faculty reported gaps in their understanding of climate change, uncertainty in scientific knowledge on certain aspects of the phenomenon, and perceived deficiencies in institutional management. Again, parallels emerge with the present study. In Honduras, faculty demonstrated low willingness to expose themselves to climate change, leading to risk overestimation for this variable. This result can be considered similar to the REVE (reversibility) variable in this study, as community members expressed apathy toward controlling consequences, effectively accepting them voluntarily.
A nationwide study conducted in the Dominican Republic in 2022 explored public knowledge and perceptions of climate change through a specialized questionnaire developed under the auspices of the United Nations [62,63]. Compared with many participating nations, the country exhibited relatively high levels of climate change literacy, especially among individuals with postsecondary education. The survey formed part of a broader international effort covering 115 countries.
Among the most relevant outcomes, 92% of respondents indicated that climate change influences their daily lives, placing the Dominican Republic among the countries reporting the highest levels of perceived impact. In addition, two-thirds of participants acknowledged effects on their income or livelihoods, and six out of ten reported having experienced water-related challenges, including scarcity and conflicts over water access. The study also found that more than one-quarter of respondents viewed climate change as the result of natural processes, such as solar variability or volcanic activity, a proportion higher than the international average.
Overall, the evidence reflects a strong perception of climate-related risk and highlights the links that citizens establish between climate change, economic well-being, and vulnerability. However, it also reveals important gaps in understanding regarding the anthropogenic drivers of climate change.
A limitation associated with climate change knowledge studies in the Dominican Republic and globally [62,63] is their implementation through independent questions, without focusing on perception variables. This disperses conclusions for policymaking. While the aforementioned surveys differ in their specific purposes, they cover issues that are closely related to those analyzed in this research. Moreover, IPCC assessments [79] underscore the central role of risk perception in the climate change context, providing additional justification for the relevance of the present study.
The IPCC [79] highlights that perceptions of climate-related risks are not uniform but depend on how individuals assess potential threats and benefits according to their personal values and aspirations, a conclusion that aligns closely with the results obtained in this study. From this perspective, adaptation strategies should be designed and implemented in a manner that reflects public values, policy objectives, and prevailing risk perceptions at different governmental scales. Moreover, acknowledging differences in interests, socioeconomic conditions, cultural contexts, and stakeholder expectations can strengthen the quality and legitimacy of decision-making outcomes. Perceptions of risk and uncertainty play a central role in shaping climate-related policy decisions within both public and private spheres. In many cases, actors rely on simplified decision strategies, such as maintaining current practices rather than adopting alternatives. Differences in risk tolerance and in the prioritization of immediate or future challenges further influence policy preferences. Accordingly, effective climate policy should extend beyond quantitative assessment methods and consider the complex interactions among natural, economic, social, and technological systems, together with the influence of stakeholder values, perceptions, decision processes, and resource constraints. Finally, the options and outcomes of adaptation measures to climate-related phenomena must reflect differences in resources and capacities, as well as the multiple processes through which stakeholders interact. Such measures involve trade-offs among prioritized values, competing objectives, and alternative development pathways that may evolve over time. Iterative approaches enable development pathways to integrate risk management, allowing policymakers to consider diverse solutions as risk and its assessment, perception, and understanding evolve [80]. As evident from the preceding discussion, many of the variables used in our study are reflected in the IPCC framework.
Dhar also investigated the underestimation of risk in his study of what he called risk tolerance, interpreting the community’s attachment to its environment, which is also a theme discovered in this study. In addition, he investigated the relationship between perception and the implementation of adaptive strategies [30]. On the other hand, Craig-Scheckman demonstrated the importance of considering the minor effects on disaster risk perception of the application of adaptation actions and the use of new technologies, which demonstrates the inadequate management of governance when implementing such actions. This aligns with the findings of this study [31,33]. It also aligns with the focus of this study by revealing multiple variables of risk perception (understanding of risk, involvement in the situation, climate, and institutional management) that present similar behaviors [33]. In addition, Craig-Scheckman et al. [81], in their study, found that issues related to past disaster experiences, specialized knowledge about disasters, availability of insurance, economic status of respondents, community cohesion, cultural contexts, and demographic characteristics are important aspects in the perception of disaster risk. Such issues are addressed, directly or indirectly, in our study and coincide with the conclusions reached by Craig-Scheckman and his team [81].
3.2. Demographic Analysis
Based on the collected information, demographic studies of disaster risk perception results were conducted for the following variables: gender, age, and educational level.
Figure 4 presents the distributions of mean values by variable for both genders, as well as the overall results by gender (Table S4).
Figure 4.
Comparative disaster risk perception profile by gender. The dashed line represents the average value of risk perception. Black points represent females, and gray points represent males. FAMI—familiarity with risk, COMP—understanding of risk, INVO—personal involvement, BE-C—economic–cultural well-being, CATA—catastrophic potential, HIST—past history of disasters or hazards, REVE—reversibility of consequences, PREO—concern, INST—trust in institutions, CLIM—organizational climate. The dimensionless risk perception scale (Y-axis) indicates the following: (1–1.67)—underestimation of risk; (1.68–2.23)—adequate risk estimation; and (2.24–3)—overestimation of risk.
As shown, there is no predominant level of disaster risk perception by gender, although numerically a slight overestimation appears in some variables for women. This aligns with the historically protective role within the household attributed to this group. Differences in disaster risk perception by gender, consistent with this study, are related to traditional gender patterns present in society [65,82]. Characteristics such as prudence and fragility, along with the consequent search for protected environments—traditionally assigned to women [65,83]—may lead to safer and less risky behaviors. Additionally, the persistence of gender-based violence, which places women in situations of uncertainty and vulnerability, fosters a more cautious and critical attitude toward their environment, resulting in higher risk estimation. These results may evolve as gender perspectives and women’s equality become more widely understood and implemented.
Figure 5 presents the distributions of mean values by variable for the age groups, as well as the overall results by age (Table S5).
Figure 5.
Comparative disaster risk perception profile by age groups. The dashed line represents the average value of risk perception. FAMI—familiarity with risk, COMP—understanding of risk, INVO—personal involvement, BE-C—economic–cultural well-being, CATA—catastrophic potential, HIST—past history of disasters or hazards, REVE—reversibility of consequences, PREO—concern, INST—trust in institutions, CLIM—organizational climate. The dimensionless risk perception scale (Y-axis) indicates the following: (1–1.67)—underestimation of risk; (1.68–2.23)—adequate risk estimation; and (2.24–3)—overestimation of risk.
As shown, there is no predominant level of disaster risk perception by age. The differences in overestimation are so slight that they are not significant. However, in the area of underestimation, middle-aged groups show a greater tendency, which is associated with the labor challenges that characterize vulnerable communities. For the 41–55 age group, underestimations are notable in comprehension, involvement, concern, and organizational climate. The first three variables are related to limited knowledge of risks associated with climate change vulnerability, while the latter reflects low confidence in institutional risk management. The 26–40 age group shows similar variables responsible for underestimation, except that involvement is replaced by a very low sense of catastrophic potential.
Previous studies on correlations between age and safety attitudes and behaviors have found that older workers in construction and gas treatment industries demonstrated more positive attitudes toward safety [65,84,85]. This argument applies to the older age group in this study, although survival conditions keep risk perception levels low. On the other hand, a reference study analyzing youth attitudes toward everyday activities with associated hazards [65,86] showed that young people tend to underestimate risks, reflected in their attitudes toward them. This is associated with physiological changes in the brain during adolescence, which give greater importance to emotions [65,87]. Within the younger respondents of this study, some are at the beginning of late adolescence, where such traits are even more pronounced, leading to risk underestimation. This explains the lower perception levels of the youngest group, although comparatively, they seem to have better perception levels than other age groups studied. This deviation is attributed to interpretation issues with some of the survey questions.
Regarding the FAMI variable, a more favorable perception was observed among younger groups than among adults. Although it is not methodologically advisable, since the variables are assumed to be independent for analytical purposes while in reality they are interconnected, it may be argued that the lower level of experience or familiarity of younger individuals with disasters generally leads to a higher perception of risk. In contrast, adults, having been exposed to a greater number of disaster events, may be more familiar with such situations and, consequently, exhibit a lower level of risk perception. This finding is closely related to the research question concerning the frequency of participation in disaster situations. However, an analysis based solely on age may contradict this interpretation, as previous studies [84] suggest that age is associated with more risk-averse behavior during adulthood and more risk-taking attitudes among younger individuals. Therefore, analyses of this nature should consider the interrelationships among variables rather than examining them in isolation. In the present study, it is also possible that the sample size contributed to the observed deviation from the expected pattern.
Figure 6 presents the distributions of mean values by variable for the educational levels studied, as well as the average by level (Table S6).
Figure 6.
Comparative disaster risk perception profile by educational levels. FAMI—familiarity with risk, COMP—understanding of risk, INVO—personal involvement, BE-C—economic–cultural well-being, CATA—catastrophic potential, HIST—past history of disasters or hazards, REVE—reversibility of consequences, PREO—concern, INST—trust in institutions, CLIM—organizational climate. The dimensionless risk perception scale (Y-axis) indicates the following: (1–1.67)—underestimation of risk; (1.68–2.23)—adequate risk estimation; and (2.24–3)—overestimation of risk.
As shown, there are no marked differences in disaster risk perception by educational level among the studied groups. However, the university level stands out with a better estimation (still within the underestimation area, below the value of 2), resulting from a greater understanding of risk and a lower sense of familiarity with risks associated with climate vulnerability. These results are supported by similar studies on climate risk perception, which indicate that higher educational levels correspond to better knowledge and estimation of risks [64].
Overall demographic behaviors by variable show a global trend consistent with expectations for contemporary society, although certain aspects highlight peculiarities of vulnerable settlement populations [66,67]. In this regard, a general underestimation of climate-related risks is evident, regardless of gender, age, or educational level. This corresponds to poverty conditions in which survival patterns prevail over comfort and the usual benefits of civilization. Specific nuances include a slightly better estimation of climate risk among women, older age groups, and higher educational levels.
3.3. Socioeconomic Vulnerability Index and Its Relationship with Disaster Risk Perception
3.3.1. Analysis of Material Deprivation
Regarding material deprivation, the data reveals a high level of economic vulnerability among the surveyed population. Specifically, 88.2% of the respondents stated an inability to cope with unexpected financial expenses, while 71.4% indicated they cannot afford to go on holiday for at least one week a year. A clear correlation emerges: lower income corresponds to higher disaster risk perception. This suggests that families in extreme poverty are fully aware of their physical vulnerability, as they live in the most hazardous areas and in weaker housing structures. Extreme poverty generates either a “normalization of risk” or cognitive adaptation [88,89,90,91] or, conversely, a sense of total lack of protection [92,93].
To systematically assess the structural economic vulnerabilities within the surveyed population, the baseline indicators of material deprivation and financial strain are compiled in Table 3.
Table 3.
Poverty profile and material deprivation in the sample.
Further analysis of vulnerability dimensions shows that disaster risk perception in these settlements is conditioned more by structural economic precariousness than by mere geographic exposure. The data are striking: 42.9% of respondents live in severe material deprivation, with critical financial fragility evidenced by 88.2% of households lacking any margin to face unexpected expenses. This “poverty trap” explains why groups in extreme poverty report significantly higher disaster risk perception (82.2%). For these families, a climate event is not only an environmental threat but also a determinant of absolute insolvency, given their inability to afford structural reinforcements or ensure safe evacuation [94,95]. When analyzing the results of the study, it can be seen that, on the one hand, extreme poverty generates a low disaster risk perception (underestimation by habituation/survival), while on the other hand, families in extreme poverty report a significantly higher perception of disaster risk (82.2%). However, it should be considered that poverty decreases the perception of prevention or proposition (people normalize danger in their daily lives) but maximizes the perception of catastrophic consequence or fear (dread risk) when asked directly due to their absolute inability to recover. These results can be cross-referenced with those on disaster risk perception, as shown in Table 4.
Table 4.
Cross-tabulation of income level vs. housing disaster risk perception.
3.3.2. Analysis of the Socioeconomic Vulnerability Index
The empirical transition from quantifying socioeconomic deprivations to understanding how these shape the cognitive construction of danger represents a core challenge in contemporary disaster risk science. The operationalization of the Socioeconomic Vulnerability Index (SEVI) allows for a quantitative assessment of the non-structural weaknesses within the surveyed settlements. Rather than viewing vulnerability as a static condition, this index synthesizes key demographic metrics, structural housing deficits, and socioeconomic pressures into a single analytical framework. By doing so, the following empirical analysis establishes a baseline to measure the uneven capacity of these communities to prepare for, withstand, and recover from severe climate-induced disasters. By analyzing this relationship, this study aims to disentangle whether extreme vulnerability induces a state of environmental normalization and fatalism or if, conversely, it fosters a state of hyper-vigilance driven by the objective recognition of having no safety nets.
This analytical focus becomes indispensable when evaluating the gap between what a community perceives as a threat and its actual capacity to execute protective behaviors. While traditional technocratic approaches often assume that risk perception is a direct byproduct of physical exposure or educational campaigns, the integration of SEVI variables reveals a much more intricate dynamic. Material deprivation, particularly the absolute inability to cope with unforeseen financial expenses, acts as an invisible threshold. Consequently, crossing the objective indicators of poverty with subjective risk scales allows us to map not just what the inhabitants fear but also the structural boundaries of their resilience [96].
Ultimately, exploring this nexus provides a foundational framework for shifts in local public policy, moving away from strictly reactive emergency management. In territories marked by deep socio-spatial segregation, the spatialization of poverty frequently forces households into the most hazardous geographical micro-environments, such as ravines and unstable slopes. Demonstrating statistically and conceptually how socioeconomic vulnerability conditions the internal metrics of risk perception serves to prove that disaster mitigation in informal urban spaces cannot be solved through engineering interventions alone but requires a systematic dismantling of the economic precarity that anchors families to danger [97]. It can also be noted that unemployment or informal work (which often coincides with poverty categories analyzed) prevents access to insurance or credit for post-disaster reconstruction.
3.3.3. Subjective Well-Being and Health
This analysis demonstrates that community members with stronger social networks (question 62: meeting with friends/family) show lower disaster risk perception or greater confidence in recovery after a disaster due to mutual support. It can also be noted that unemployment or informal work (which often coincides with poverty categories analyzed) prevents access to insurance or credit for post-disaster reconstruction [98]. The evaluation of subjective vulnerability dimensions demonstrates that perceived health quality is unevenly distributed across the studied territory, reflecting micro-regional disparities in living conditions. Empirical data extracted from the “Social Perception Survey of Risk Associated with Climate Change Effects” indicate that while the general sample exhibits a moderate baseline of subjective well-being, the localized cross-tabulations expose clear vulnerabilities. In Santo Domingo de Guzmán, health perception is markedly optimistic, with 58.54% of respondents reporting their health status as “Good”. Conversely, structural vulnerabilities become evident in Santo Domingo Norte, where only 22.22% of the population views their health as “Good” and 3.70% as “Very Good”; instead, a dense cluster of 55.56% characterizes their health as “Regular” and 18.52% explicitly report it as “Poor”. In Santo Domingo Este, a critical transition zone, the qualitative weight falls in the middle tiers, with 42.86% identifying their status as “Regular”. These geographical discrepancies suggest that subjective well-being is heavily mediated by the localized presence or absence of community infrastructure, showing that specific municipalities suffer from a compounded vulnerability where material deprivation directly overlaps with a diminished self-reported quality of life.
3.3.4. Geographic Variable
A multivariate analysis would include the correlation of perceived risk with geographic location (ravines, slopes, plains—constituting physical risk factors), combined with material deprivation and income level. Cross-referencing material deprivation with location suggests that those living on ravine margins have the highest deprivation indices, reinforcing the idea that poverty pushes people into the most hazardous terrains [16].
The spatial distribution of the surveyed households reveals that geographic location acts as a critical force multiplier for socioeconomic vulnerability. Rather than being distributed uniformly, high vulnerability scores are tightly clustered in specific physical environments, particularly within low-lying coastal zones and areas adjacent to unmanaged drainage channels (cañadas). The empirical findings demonstrate that households situated in these high-exposure sectors face a compounding effect: their structural material deprivation is exacerbated by poor public infrastructure and limited accessibility to emergency services. Consequently, the geographic variable cannot be treated as a mere spatial attribute; it represents a physical determinant that conditions both the objective capacity of a household to withstand climate hazards and their subjective, heightened state of risk perception. By synthesizing these geographic patterns with SEVI, this analysis underscores that effective risk mitigation must move beyond blanket regional policies and instead prioritize targeted, micro-localized urban interventions.
3.3.5. Statistical Analysis of the Results
Table 5 shows the integrated Pearson’s chi-square and Cramér’s V matrix. To assess the existence of statistical dependence among categorical variables, a series of Pearson’s chi-square tests of independence was conducted for all pairwise combinations. The results indicate that all variable pairs exhibit statistically significant associations (p < 0.001), leading to the systematic rejection of the null hypothesis of independence. The magnitude of the chi-square statistics is consistently high across the matrix, confirming that the observed frequency distributions differ substantially from those expected under independence. Particularly elevated chi-square values were observed in relationships such as V2–V3, V5–V7 and V7–V8, suggesting strong structural linkages between these dimensions. These findings demonstrate that the variables under analysis do not operate in isolation but instead are embedded in a highly interdependent system, where categorical outcomes co-vary systematically across the dataset.
Table 5.
Integrated Pearson’s chi-square (lower section, numbers in black, in all cases p << 0.05) and Cramér’s V (upper section, numbers in red) matrix. V1—sex, V2—municipality or district of residence, V3—type of community zone, V4—age range, V5—employment status, V6—general health condition, V7—regular participation in hobbies or meeting friends or family at least once a month for social gatherings, V8—regular participation in leisure activities such as sports, cinema, or concerts, V9—household per capita income. Color code for variable interactions by Cramer’s V: moderate (blue), strong (green) and very strong (gray).
While chi-square tests confirm the existence of dependence, Cramér’s V was used to quantify the strength and practical significance of these associations. The resulting coefficients range from 0.503 to 0.686, indicating predominantly moderate to strong relationships according to conventional thresholds. The strongest associations include:
- Municipality or district of residence (V2) vs. type of community zone (V3) (V = 0.686).
- Employment status (V5) vs. regular participation in hobbies or meeting friends or family at least once a month for social gatherings (V7) (V = 0.665).
- Regular participation in hobbies or meeting friends or family at least once a month for social gatherings (V7) vs. regular participation in leisure activities such as sports, cinema, or concerts (V8) (V = 0.644).
- Employment status (V5) vs. regular participation in leisure activities such as sports, cinema, or concerts (V8) (V = 0.635).
- Employment status (V5) vs. household per capita income (V9) (V = 0.632).
The consistency of relatively high coefficients across the matrix reinforces the interpretation of a densely interconnected system, in which multiple dimensions jointly shape the observed outcomes. Taken together, the chi-square and Cramér’s V results provide complementary insights. The chi-square analysis demonstrates that associations are statistically robust and non-random across all variable pairs; meanwhile, the Cramér’s V coefficients confirm that these associations are not only statistically significant but also substantively meaningful, with moderate-to-strong effect sizes. This dual evidence strengthens the conclusion that the dataset exhibits a coherent structural pattern of multidimensional interdependence, rather than isolated or spurious relationships. Both the magnitude of chi-square values and the distribution of Cramér’s V coefficients suggest the presence of core clusters of strongly interrelated variables. Variables V7, V8, and V9 consistently display higher association levels with multiple counterparts, indicating their potential role as structural anchors within the system. These variables are likely associated with key socioeconomic and living-condition dimensions, which are known to interact synergistically in informal settlements. The convergence of strong statistical dependence and high association strength across these variables points to the existence of reinforcing feedback mechanisms within the system.
The combined evidence from both statistical approaches reveals a dense and highly integrated network of relationships, where nearly all variables exceed moderate association thresholds. This structure implies that changes in one variable are likely to influence several others (systemic propagation effects); the system exhibits characteristics of multidimensional vulnerability, where economic, social, and spatial factors are tightly coupled, and the absence of weak or isolated associations suggests limited redundancy, with most variables contributing meaningfully to the overall structure. In summary, the combined use of chi-square tests and Cramér’s V coefficients reveals that all variables are statistically dependent, the associations are consistently moderate to strong, the system exhibits a robust, multidimensional, and interconnected structure, and certain variables act as central nodes, reinforcing the overall network of relationships. These findings highlight the need to interpret the studied phenomenon as a complex system, where multiple dimensions interact simultaneously to shape outcomes in informal settlements.
3.4. Strategic Framework for Risk Management in Informal Urban Settlements in Santo Domingo
The findings of this research provide a comprehensive framework to strengthen emergency response, climate adaptation, and social protection systems, particularly for vulnerable populations exposed to multi-hazard risks [81]. One of the key contributions of the study is its potential to enhance government capacity to support highly vulnerable households during emergencies. The existing Technical Guide for the Emergency Voucher [99]. defines allocation criteria based on: (i) level of impact (housing, livelihoods, household goods); (ii) vulnerability conditions (e.g., elderly, pregnant women, persons with disabilities); and (iii) the Quality of Life Index (ICV), as established by SIUBEN in the Dominican Republic [100]. Building on this framework, the study suggests improving predictive capacity to anticipate voucher demand, enabling proactive fund allocation rather than reactive responses. Additionally, the inclusion of multi-hazard exposure, including both natural and anthropogenic risks, would strengthen prioritization mechanisms. Understanding disaster risk perception is also critical, as underestimation of risk may reduce program enrollment and lead to funding gaps. Therefore, aligning objective vulnerability with subjective risk is essential for effective targeting.
The study highlights the importance of reinforcing local capacities through community-based training programs on climate risks and adaptation strategies. Participation in such programs can be incentivized by linking them to benefits like emergency vouchers. In parallel, accessible communication campaigns should be developed to increase awareness and improve subjective risk of disaster, particularly in communities that underestimate their vulnerability [100].
Reducing exposure to climate-related hazards requires targeted urban and environmental measures, including the development of green infrastructure (e.g., floodable parks, sustainable drainage systems, and green roofs) to mitigate floods and heat waves and the implementation of progressive housing improvement programs with resilience and safety criteria, prioritizing dwellings classified as hazardous or irreparable. These interventions contribute to both immediate risk reduction and long-term climate adaptation. The results should be integrated into national and local planning instruments, such as the National Climate Change Adaptation Plan [101]. and municipal land-use strategies. Furthermore, the creation of public–private financing mechanisms is recommended to support the transformation of informal settlements into resilient and environmentally sustainable communities, linking subsidies and vouchers to adaptation outcomes [30,31,33,81].
To improve decision-making, the study proposes developing a community monitoring system that combines objective indicators (infrastructure, services, and exposure) and subjective indicators (disaster risk perception). Additionally, applying a climate resilience index and a perceived risk profiling tool across vulnerable neighborhoods would enable the creation of a national database, supporting evidence-based policy and investment decisions. This integrated approach connects emergency response, social protection, urban planning, and community engagement, offering a scalable pathway toward more resilient and adaptive systems.
4. Limitations of the Study
The proposed methodology presents several limitations that warrant consideration. First, a previously identified challenge is its application in heterogeneous settlements, where housing conditions, infrastructure characteristics, and environmental settings with varying levels of resilience coexist. Such heterogeneity may lead to divergent assessment criteria among respondents, thereby compromising the consistency of disaster risk perception measurements. Although risk perception is inherently influenced by individual experiences and subjective interpretations, it is desirable that aggregate perceptions be derived from a population sharing relatively homogeneous exposure and contextual conditions. To address this issue, a preliminary characterization of the settlement is recommended through the analysis of high-resolution orthophotographs acquired using unmanned aerial vehicles (UAVs). This approach facilitates the identification of spatial heterogeneity and provides the research team with a comprehensive understanding of the study area before field deployment.
A second limitation concerns the availability of standardized operational guidelines for administering the field survey instrument. To mitigate potential inconsistencies in data collection, the development of a detailed technical manual is currently underway. In the interim, this limitation has been partially addressed through specialized training workshops designed for field surveyors, with the objective of ensuring consistent interpretation and application of the instrument.
An additional challenge relates to the processing and standardization of field data collected through internet-based platforms. To overcome this limitation, the development of an integrated data-management tool has been envisaged. This system will automatically transform field data into the formats required for each question type and incorporate the methodological framework for quantifying disaster risk perception. Specifically, the tool will operationalize the relationships between survey questions, associated variables, and perception metrics, enabling the calculation of perception scores at multiple analytical levels, including the individual respondent, variable-specific groups, and overall aggregate indices. Such a framework is expected to improve the efficiency, consistency, and reproducibility of data processing and analysis.
5. Conclusions
The research conducted fulfills the general objective of evaluating disaster risk perception among residents of several informal settlements in Santo Domingo, considering the vulnerability conditions in which their daily lives unfold. The study shows that there is a negligible difference in disaster risk perception between the municipalities and the vulnerable settlements studied, which leads to a focus on the behavior of the variables that cause deviations from adequate risk perception. The results allow for the identification of the main variables responsible for risk underestimation and overestimation. Underestimation is linked to limited risk comprehension, low sense of involvement, weak perception of catastrophic potential, poor knowledge or memory of past impacts, limited concern about events and their consequences, and a perceived lack of institutional attention and associated organizational climate. Overestimation of risk reflects apathy toward the investigated vulnerabilities and potential actions against threats, nuanced by the perception of low reversibility of consequences (less reversibility–higher risk estimation). The economic and cultural well-being variable also shows overestimation (lower well-being–higher risk perception), highlighting marked inequality and poverty, particularly among vulnerable groups such as retirees, women, and low-income individuals, consistent with poverty and social exclusion profiles identified in the Monitoring Global Poverty: Report of the Commission on Global Poverty [74].
Similar findings in other contexts support the validity of this study. It must be understood that, in many cases, low disaster risk perception constitutes a barrier to implementing remediation measures aimed at transforming informal settlements into eco-friendly and resilient communities. A clear lesson from this research relates to the need for training on these issues within the framework of community-level exchange mechanisms in vulnerable settlements, as well as the deployment of psychosocial methods to overcome barriers hindering adaptation measures. The findings on low disaster risk perception in informal communities suggest that adaptation policies should be accompanied by direct incentives. The emergency voucher could become a strategic tool for immediate support to highly vulnerable families, linking its delivery to training programs in risk management and community resilience. However, it is recommended that the voucher not only serve as economic relief but also be conditioned on participation in climate education workshops and neighborhood organization processes, thereby strengthening disaster risk perception and community response capacity. The integration of this academic research with public policies will allow the findings to be translated into concrete actions, reducing the exposure of informal communities to disasters and improving their resilience. The implementation of measures such as the emergency voucher, linked to education and territorial planning processes, can contribute to reducing urban inequality, strengthening institutional trust, and advancing the objectives of the PNACC, END 2030, and SDGs.
The implications of the study are centered on the use of a method of inquiry into the perception of disaster risk in communities at the level of individual variables, which allows the identification of the underlying causes of the generalized underestimation of disaster risk. This makes it possible to design policies that take these aspects into account when formulating adaptive measures, whether structural or not. Future research will lead to the generalization of the study to other communities in the country, once the identified limitations are addressed. Among the limitations are the need for prior characterization of the communities under study using orthophotos from drones, the establishment of a methodology for the analysis of the balance of weights between the dimensions of the index, when warranted, and the drafting of a detailed technical guide for the application of the investigation tools in the field.
Supplementary Materials
The following supporting information can be downloaded at https://www.mdpi.com/article/10.3390/urbansci10080438/s1, Table S1: Survey and Associated Variables; Table S2: Geolocation of the Studied Communities; Table S3: Averaged Results of Risk Perception and Dispersion Analysis of Mean Values; Table S4: Distributions of Mean Values by Variable for Both Genders; Table S5: Distributions of Mean Values by Variable for Age Groups; Table S6: Distributions of Mean Values by Variable for Educational Levels.
Author Contributions
Conceptualization, A.T.-V., A.J.-M. and U.J.J.-H.; methodology, J.C.S.-R.; Y.E.A.-R., A.T.-V., A.J.-M. and U.J.J.-H.; software, A.T.-V.; validation, J.C.S.-R.; Y.E.A.-R., A.T.-V., A.J.-M. and U.J.J.-H.; formal analysis, J.C.S.-R.; Y.E.A.-R., A.T.-V., A.J.-M. and U.J.J.-H.; investigation, J.C.S.-R.; Y.E.A.-R., A.J.-M. and A.T.-V.; resources, U.J.J.-H.; data curation, J.C.S.-R.; Y.E.A.-R., A.T.-V., A.J.-M. and U.J.J.-H.; writing—original draft preparation, J.C.S.-R.; Y.E.A.-R., A.J.-M. and A.T.-V.; writing—review and editing, U.J.J.-H.; visualization, J.C.S.-R.; Y.E.A.-R., A.J.-M. and A.T.-V.; supervision, A.T.-V., A.J.-M. and U.J.J.-H.; project administration, U.J.J.-H.; funding acquisition, U.J.J.-H. All authors have read and agreed to the published version of the manuscript.
Funding
This research was funded by Fondo Dominicano de Ciencia y Tecnología (FONDOCYT), grant number 2024-2-3D16-0839.
Institutional Review Board Statement
The study was conducted in accordance with the Declaration of Helsinki and approved by the Government Integrity and Regulatory Compliance Commission (CIGCN) of Civil Defense (protocol code DC-OA|-00-51-2025, 15 April 2025).
Informed Consent Statement
Informed consent was obtained from all subjects involved in the study.
Data Availability Statement
The data presented in this study are available on request from the corresponding author.
Acknowledgments
This work was carried out within the Doctoral Program in Environmental Sciences of the Basic and Environmental Sciences Area at the Technological Institute of Santo Domingo (INTEC). Y.E.A.-R. and J.C.S.-R. would like to thank the Ministerio de Educación Superior, Ciencia y Tecnología of the Dominican Republic (MESCYT) for the partial financial support for their Ph.D. thesis. ChatGPT-5.5 Instant was used to check and correct the English in the manuscript.
Conflicts of Interest
Yanelba Elisa Abreu-Rojas was employed by the Grupo ALFAMA, Construcción y Proyectos Sostenibles. The remaining authors declare that the research was conducted in the absence of any commercial or financial relationships that could be construed as a potential conflict of interest.
References
- Ríos Valencia, K. Expansión urbana informal y sostenibilidad en América Latina: Una revisión de literatura reciente. URBE Arquit. Ciudad. Territ. 2025, 20, 47–66. [Google Scholar] [CrossRef] [Scilit]
- Acevedo-De-los-Ríos, A.; Jones-Pérez, J.; Rondinel-Oviedo, D.R. Methodology for prioritizing sustainable urban regeneration interventions in informal settlements: Case study in Lima. Cities 2025, 157, 105550. [Google Scholar] [CrossRef] [Scilit]
- Moya, L.; García, F.; Gonzales, C.; Diaz, M.; Zavala, C.; Estrada, M.; Yamazaki, F.; Koshimura, S.; Mas, E.; Adriano, B. Radar images for monitoring informal urban settlements in vulnerable zones in Lima, Peru. Nat. Hazards Earth Syst. Sci. 2022, 22, 65–70. [Google Scholar] [CrossRef] [Scilit]
- Alegría, V.; Dovey, K. Morphogenesis of contemporary informal settlement in Chile. Urban Des. Int. 2024, 29, 171–187. [Google Scholar] [CrossRef] [Scilit]
- Hurtado-Moreno, A.P.; Martínez Natalia, M.R.; Goyes, D.F.R.; González-Maya, J.F. Mapping the marginals: Predicting unplanned human settlements in urban protected areas of Bogotá, Colombia. Urban Ecosyst. 2025, 28, 36. [Google Scholar] [CrossRef] [Scilit]
- Sierra, A.P.C.; Solano, A.S.; Lozano, D.H. Understanding urban densification in Latin American cities: Determinants of the production of built space in informal areas in Bogotá (2007–2018). Cities 2024, 148, 104839. [Google Scholar] [CrossRef] [Scilit]
- Cravino, M.C. Urban inequalities and regulations for the intervention in informal settlements in Buenos Aires (1996–2019). Rev. Direito Cid. 2022, 14, 2116–2153. [Google Scholar] [CrossRef] [Scilit]
- Ramírez Hernández, R. Urban expansion and climate in Mexican cities: An analysis of growth, land use, and urban climate. Investig. Geográficas 2024, 114, e60852. [Google Scholar] [CrossRef] [Scilit]
- Purwar, D.; Flacke, J.; Guzman, E.A.; Sliuzas, R. A qualitative analysis of cascading effects of critical infrastructure service failure post torrential floods in formal and informal settlements: The study-case of Medellin city, Colombia. Sustain. Resilient Infrastruct. 2024, 9, 496–512. [Google Scholar] [CrossRef] [Scilit]
- Fernandes, E. Regularization of Informal Settlements in Latin America. Lincoln Institute of Land Policy. 2011. Available online: https://www.lincolninst.edu/app/uploads/legacy-files/pubfiles/regularization-informal-settlements-latin-america-full_0.pdf (accessed on 4 February 2026).
- Coq-Huelva, D.; Asián-Chaves, R. Urban sprawl and sustainable urban policies: A review of the cases of Lima, Mexico City and Santiago de Chile. Sustainability 2019, 11, 5835. [Google Scholar] [CrossRef] [Scilit]
- UN-Habitat. Annual Report. 2020. Available online: https://unhabitat.org/annualreport/ (accessed on 4 February 2026).
- UNDRR. UNISDR Annual Report 2015. 2015. Available online: https://www.undrr.org/publication/unisdr-annual-report-2015 (accessed on 4 February 2026).
- United Nations. Global Sustainable Development 2015 Edition. 2015. Available online: https://desapublications.un.org/publications/global-sustainable-development-report-2015 (accessed on 4 February 2026).
- Karydi, K. From risk management to urban resilience: Urban development in the context of the twenty-first-century disaster risk reduction framework. In Smart Urban Safety and Security: Interdisciplinary Perspectives; Palgrave Macmillan: Singapore, 2024; pp. 101–122. [Google Scholar]
- Hardoy, J.E.; Mitlin, D.; Satterthwaite, D. Environmental Problems in an Urbanizing World: Finding Solutions for Cities in Africa, Asia and Latin America; Earthscan Publications: London, UK, 2001. [Google Scholar]
- Satterthwaite, D. A New Urban Agenda. 2016. Available online: https://es.scribd.com/document/797321264/satterthwaite-2016-a-new-urban-agenda (accessed on 28 January 2026).
- Atkinson, C.L. Informal settlements: A new understanding for governance and vulnerability study. Urban Sci. 2024, 8, 158. [Google Scholar] [CrossRef] [Scilit]
- Bhanye, J. A review study on community-based flood adaptation in informal settlements in the Global South. Discov. Sustain. 2025, 6, 595. [Google Scholar] [CrossRef] [Scilit]
- Li, D.; Sun, L.; Feng, K.; Zhang, N.; Yu, Y.; Zhao, D.; Zhou, Y. Disproportionate flood exposure for slum populations of the Global South. Nat. Cities 2025, 2, 626–638. [Google Scholar] [CrossRef] [Scilit]
- Kunguma, O.; Awah, L.S.; Petersen, I.; Lunga, W. Assessing disaster vulnerability in an informal settlement of Cape Town, South Africa, through the MOVE framework. Front. Built Environ. 2025, 11, 1693836. [Google Scholar] [CrossRef] [Scilit]
- Oficina Nacional de Estadística. 2021. Available online: https://www.one.gob.do/publicaciones/2021/ (accessed on 14 January 2026).
- Pelling, M.; Wisner, B. Disaster Risk Reduction: Cases from Urban Africa; Routledge: Oxfordshire, UK, 2012; Available online: https://books.google.com.do/books/about/Disaster_Risk_Reduction.html?id=zrgeBAAAQBAJ&redir_esc=y (accessed on 18 February 2026).
- Collado, J.R.N.; Potangaroa, R. (Re) constructing (re) settlement: Risk reduction and urban development negotiations in Santo Domingo, Dominican Republic. Int. Dev. Plan. Rev. 2023, 45, 203–233. [Google Scholar] [CrossRef] [Scilit]
- Sletto, B.; Luguana, A.M.L.; Rakes, K.; Stycos, M. Intersectionality, gender, and project-induced displacement in the informal city: The struggle over stormwater development in Los Platanitos, Dominican Republic. World Dev. 2022, 158, 105972. [Google Scholar] [CrossRef] [Scilit]
- Kostešić, I. Resilient Urban Communities: A Case Study of the Cvjetno Housing Estate, a Modern Period Predecessor in Urban Planning in Croatia. Urban Sci. 2024, 8, 102. [Google Scholar] [CrossRef] [Scilit]
- Bank Work. Dominican Republic: A Climate-Resilient Social Protection System. 2024. Available online: https://www.worldbank.org/en/news/feature/2024/05/28/republica-dominicana-sistema-proteccion-social-a-prueba-cambio-climatico (accessed on 23 July 2026).
- Instituto Dominicano de Meteorología (2022–2026). Boletín de Desvío de las Precipitaciones en el mes de Noviembre 2022; del mes de Noviembre 2023. del mes de abril del 2026. Available online: https://indomet.gob.do/wp-content/uploads/2026/05/Desvio-abril-2026-2.pdf (accessed on 23 May 2026).
- Massimino, F.P.; Castanho, R.A.; Gómez, I.; Rincón, V.; Velázquez, J. Assessment of the climate environmental vulnerability index for urban settlements on the mediterranean coast: A case study in Sicily. Urban Sci. 2024, 8, 130. [Google Scholar] [CrossRef] [Scilit]
- Dhar, T.; Bornstein, L.; Lizarralde, G.; Nazimuddin, S.M. Risk perception—A lens for understanding adaptive behaviour in the age of climate change? Narratives from the Global South. Int. J. Disaster Risk Reduct. 2023, 95, 103886. [Google Scholar] [CrossRef] [Scilit]
- Haque, A.; Fatema, K. Disaster risk reduction for whom? The gap between centrally planned Disaster Management Program and people’s risk perception and adaptation. Int. J. Disaster Risk Reduct. 2022, 82, 103229. [Google Scholar] [CrossRef] [Scilit]
- Maldonado-Santana, C.; Torres-Valle, A.; Franco-Billini, C.; Jauregui-Haza, U.J. Risk Perception in the Nigua River Basin: Key Determinants and Policy Implications. Water 2024, 17, 45. [Google Scholar] [CrossRef] [Scilit]
- Salas-Rosario, J.C.; Abreu-Rojas, Y.E.; Torres-Valle, A.; Jauregui-Haza, U.J. Risk Perception Among Decision-Makers in the Dominican Republic’s National System for Prevention, Mitigation, and Response to Climate Change-Related Events. Int. J. Environ. Res. Public Health 2026, 23, 565. [Google Scholar] [CrossRef] [Scilit] [PubMed]
- Wang, C.W.; Trinh, T.T.; Lo, C.J.; Jensen, O.; Ng, R.; Lee, L.; Shou, Y. How Do People Perceive Media-Reported Risks: Risk Networks and Profiles of Segments. Risk Anal. 2025, 45, 3296–3314. [Google Scholar] [CrossRef] [Scilit] [PubMed]
- Lipkus, I.M.; Samsa, G.; Rimer, B.K. General Performance on a Numeracy Scale among Highly Educated Samples. Med. Decis. Mak. 2001, 21, 37–44. [Google Scholar] [CrossRef] [Scilit] [PubMed]
- Shepperd, J.A.; Klein, W.M.; Waters, E.A.; Weinstein, N.D. Taking stock of unrealistic optimism. Perspect. Psychol. Sci. 2013, 8, 395–411. [Google Scholar] [CrossRef] [Scilit] [PubMed]
- Weinstein, N.D. Unrealistic optimism about future life events. J. Personal. Soc. Psychol. 1980, 39, 806–820. [Google Scholar] [CrossRef]
- Bartel, R. WASH-1400–The Reactor Safety Study: The Introduction of Risk Assessment to the Regulation of Nuclear Reactors (NUREG/KM-0010). U.S. Nuclear Regulatory Commission. 2016. Available online: https://www.nrc.gov/docs/ML1622/ML16225A002.pdf (accessed on 16 March 2026).
- Huq, S.; Fraass, B.A.; Dunscombe, P.B.; Gibbons, J.P.; Ibbott, G.S.; Mundt, A.J.; Mutic, S.; Palta, J.R.; Rath, F.; Thomadsen, B.R.; et al. The report of Task Group 100 of the AAPM: Application of risk analysis methods to radiation therapy quality management. Med. Phys. 2016, 43, 4209–4262. [Google Scholar] [CrossRef] [Scilit] [PubMed]
- Zhao, X.; Wang, H.; Dai, C.; Tang, J.; Deng, K.; Zhong, Z.; Kong, F.; Wang, S.; Morikawa, S. Multi-stage simulation of residents’ disaster risk perception and decision-making behavior. Systems 2025, 13, 240. [Google Scholar] [CrossRef] [Scilit]
- Sachdeva, S.; Kumar, P. Assessing the household level perception and adaptation strategies to flood risk in informal settlements of Yamuna floodplain in Delhi. Nat. Hazards 2025, 121, 11695–11729. [Google Scholar] [CrossRef] [Scilit]
- Gong, W.; Li, Z.; Tang, J. Impact of risk perception on emergency information seeking behavior: A meta-analysis. Front. Psychol. 2025, 16, 1646584. [Google Scholar] [CrossRef] [Scilit] [PubMed]
- Pirla, S. A psychological model of collective risk perceptions. Judgm. Decis. Mak. 2024, 19, e13. [Google Scholar] [CrossRef] [Scilit]
- Cutter, S.L.; Boruff, B.J.; Shirley, W.L. Social vulnerability to environmental hazards. Soc. Sci. Q. 2003, 84, 242–261. [Google Scholar] [CrossRef] [Scilit]
- Wisner, B.; Blaikie, P.; Cannon, T.; Davis, I. At Risk: Natural Hazards, People’s Vulnerability and Disasters, 2nd ed.; Routledge: Oxfordshire, UK, 2004; Available online: https://api.taylorfrancis.com/content/books/mono/download?identifierName=doi&identifierValue=10.4324/9780203714775&type=googlepdf (accessed on 20 December 2025).
- Peacock, W.G.; Morrow, B.H.; Gladwin, H. (Eds.) Hurricane Andrew: Ethnicity, Gender, and the Sociology of Disasters; Routledge: Oxfordshire, UK, 1997; Available online: https://api.taylorfrancis.com/content/books/mono/download?identifierName=doi&identifierValue=10.4324/9780203351628&type=googlepdf (accessed on 18 January 2026).
- Birkmann, J. (Ed.) Measuring Vulnerability to Natural Hazards: Towards Disaster Resilient Societies; United Nations University Press: Tokyo, Japan, 2006. [Google Scholar]
- Fischhoff, B.; Slovic, P.; Lichtenstein, S.; Read, S.; Combs, B. How Safe Is Safe Enough? A Psychometric Study of Attitudes Towards Technological Risks and Benefits. Policy Sci. 1978, 9, 127–152. Available online: http://www.jstor.org/stable/4531720 (accessed on 12 February 2026). [CrossRef] [Scilit]
- Slovic, P. Perception of risk. Science 1987, 236, 280–285. [Google Scholar] [CrossRef] [Scilit] [PubMed]
- Douglas, M.; Wildavsky, A. Risk and Culture: An Essay on the Selection of Technical and Environmental Dangers; University of California Press: Berkeley, CA, USA, 1982; Available online: https://books.google.com.mx/books?hl=es&lr=&id=rXrGbnMg63YC&oi=fnd&pg=PP8&dq=Risk+and+Culture:+An+Essay+on+the+Selection+of+Technical+and+Environmental+Dangers&ots=dY38xlnJoO&sig=-EsE7QicA-Y9i50BsknxcdMwVD4 (accessed on 6 April 2026).
- Renner, B.; Knoll, N.; Schwarzer, R. Age and body weight make a difference in optimistic health beliefs and nutrition behaviors. Int. J. Behav. Med. 2000, 7, 143–159. [Google Scholar] [CrossRef] [Scilit] [PubMed]
- Kasperson, R.E.; Renn, O.; Slovic, P.; Brown, H.S.; Emel, J.; Goble, R.; Kasperson, J.X.; Ratick, S. The social amplification of risk: A conceptual framework. Risk Anal. 1988, 8, 177–187. [Google Scholar] [CrossRef] [Scilit]
- Slovic, P.; Peters, E. Risk perception and affect. Curr. Dir. Psychol. Sci. 2006, 15, 322–325. [Google Scholar] [CrossRef] [Scilit]
- Renn, O. Risk Governance: Coping with Uncertainty in a Complex World; Earthscan: London, UK, 2008; Available online: https://api.taylorfrancis.com/content/books/mono/download?identifierName=doi&identifierValue=10.4324/9781849772440&type=googlepdf (accessed on 18 November 2025).
- Brewer, N.T.; Weinstein, N.D.; Cuite, C.L.; Herrington, J.E. Risk perceptions and their relation to risk behavior. Ann. Behav. Med. 2004, 27, 125–130. [Google Scholar] [CrossRef] [Scilit] [PubMed]
- Dryhurst, S.; Schneider, C.R.; Kerr, J.; Freeman, A.L.J.; Recchia, G.; Van der Bles, A.M.; Spiegelhalter, D.; van der Linden, S. Risk perceptions of COVID-19 around the world. J. Risk Res. 2020, 23, 994–1006. [Google Scholar] [CrossRef] [Scilit]
- Ferrer, R.A.; Klein, W.M.P. Risk perceptions and health behavior. Curr. Opin. Psychol. 2015, 5, 85–89. [Google Scholar] [CrossRef] [Scilit] [PubMed]
- Melià y Albert Sesé, J.L. La medida del clima de seguridad y salud laboral. An. Psicol. 1999, 15, 269–289. Available online: http://www.um.es/analesps/v15/v15_2pdf/13v98_12sese2.PDF (accessed on 15 April 2026).
- Camacaro, P.; Ferrigno, J. Factores de riesgo laboral psicosociales. Universidad Central de Venezuela. 2000. Available online: http://www.monografias.com/trabajos16/riesgo-psicosocial/riesgo-psicosocial.shtml (accessed on 25 January 2026).
- Benavides, F.; Gimeno, D.; Benach, J.; Martínez, J.; Jarque, S.; Berra, A.; Devesa, J. Descripción de los factores de riesgo psicosocial de cuatro empresas. Gac. Sanit. 2002, 16, 222–229. Available online: http://scielo.isciii.es/scielo.php?script=sci_arttext&pid=S0213-91112002000300005 (accessed on 1 May 2026). [CrossRef] [Scilit] [PubMed]
- Siam, A.T.C.; Valle, A.T.; Valdivie, Y.N.; Acea, Á.M.A. Análisis de percepción de riesgos laborales de tipo biológico con la utilización de un sistema informático especializado. Rev. Cuba. Farm. 2013, 47, 324–338. Available online: https://www.medigraphic.com/pdfs/revcubfar/rcf-2013/rcf133e.pdf (accessed on 1 May 2026).
- Consejo Nacional para el Cambio Climático. Informe Anual; CNCCMDL: Santo Domingo, Dominican Republic, 2022. [Google Scholar]
- United Nations Development Programme (UNDP). Informe Sobre Adaptación y Resiliencia; Programa de las Naciones Unidas para el Desarrollo: Nueva York, Estados Unidos, 2021. [Google Scholar]
- Suazo, L.E.; Torres, A. Percepciones, conocimiento y enseñanza de cambio climático y riesgo de desastres en universidades hondureñas. Form. Univ. 2021, 14, 225–236. Available online: https://scielo.conicyt.cl/pdf/formuniv/v14n1/0718-5006-formuniv-14-01-225.pdf (accessed on 16 June 2025). [CrossRef] [Scilit]
- Torres Valle, A.; Caballero Reyes, C.M.; Blanco García, Y.; Elías Hardy, L.L.; Perdomo Ojeda, M.; Garea Morea, B.; César Cárdenas, J.; Cardona, R.A.; Siam, A.T.C.; Vicente, N.T. La caracterización de las capacidades laborales y del riesgo ocupacional basada en estudios de personalidad. Rev. Cuba. Salud Trab. 2025, 25, e670. [Google Scholar]
- Portell Vidal, M. Riesgo Percibido, un Procedimiento de Evaluación. Normas de Trabajos Peligrosos, NTP 578. Universidad Autónoma de Barcelona. 2007. Available online: https://www.insst.es/documents/94886/7861730/ntp_578.pdf/545878eb-7e16-43fa-a4b6-b3dc18be7a14?version=1.1&t=1727418123992&download=true (accessed on 29 May 2026).
- Carbonell, A.T.; Torres, A. Evaluación de percepción de riesgo ocupacional. Rev. Ing. Mecánica 2010, 13, 18–25. Available online: https://www.redalyc.org/articulo.oa?id=225117651003 (accessed on 12 July 2025).
- Eurostat. Methodological Guidelines and Description of EU-SILC Target Variables; Publications Office of the European Union: Luxembourg, 2024; Available online: https://ec.europa.eu/eurostat/documents/203647/22127502/Methodological+guidelines+2024+operation_v7.pdf/27dfa88a-dd15-c3dd-98c4-0a564e0802dc?t=1756397362663 (accessed on 12 July 2025).
- Guio, A.-C.; Marlier, E.; Pomeroy, B. Towards an EU approach to measuring material deprivation using EU-SILC. Soc. Indic. Res. 2012, 109, 567–593. [Google Scholar]
- Montgomery, D.C.; Runger, G.C. Applied Statistics and Probability for Engineers; Wiley: Hoboken, NJ, USA, 2014. [Google Scholar]
- Gattrell, W.T.; Logullo, P.; van Zuuren, E.J.; Price, A.; Hughes, E.L.; Blazey, P.; Winchester, C.C.; Tovey, D.; Goldman, K.; Hungin, A.P.; et al. ACCORD (ACcurate COnsensus Reporting Document): A reporting guideline for consensus methods in biomedicine developed via a modified Delphi. PLoS Med. 2024, 21, e1004326. [Google Scholar] [CrossRef] [Scilit] [PubMed]
- Strasser, A. Delphi Method Variants In Information Systems Research: Taxonomy Development and Application. Electron. J. Bus. Res. Methods 2017, 15, 120–133. [Google Scholar] [CrossRef]
- Rendón-Macías, M.E.; Villasís-Keever, M.Á. El protocolo de investigación V: El cálculo del tamaño de muestra. Rev. Alerg. México 2017, 64, 220–227. [Google Scholar] [CrossRef] [Scilit] [PubMed]
- Alkire, S.; Foster, J. Counting and multidimensional poverty measurement. J. Public Econ. 2011, 95, 476–487. [Google Scholar] [CrossRef] [Scilit]
- Ministerio de Economía, Planificación y Desarrollo. Domingo Matías, Presenta Índice de Vulnerabilidad Climática a Escala Municipal. Gobierno de la República Dominicana. 2022. Available online: https://mepyd.gob.do/viceministro-domingo-matias-presenta-indice-de-vulnerabilidad-climatica-a-escala-municipal/ (accessed on 23 July 2026).
- Ministerio de Economía, Planificación y Desarrollo (MEPyD). Boletín de Estadísticas Oficiales de Pobreza Monetaria En La República Dominicana; MEPyD: Santo Domingo, Dominican Republic, 2024; Available online: https://mepyd.gob.do/download/4663/pobreza-monetaria-en-la-republica-dominicana/392522/pobreza-monetaria-en-la-republica-dominicana-2023.pdf (accessed on 23 July 2026).
- World Bank. Monitoring Global Poverty: Report of the Commission on Global Poverty; World Bank: Washington, DC, USA, 2017. [Google Scholar]
- Consejo Nacional de Evaluación de la Política de Desarrollo Social (CONEVAL). Metodología Para la Estimación de la Pobreza por Grupos Poblacionales a Nivel Municipal: 2010, 2015 y 2020. 2022. Available online: https://www.coneval.org.mx/Medicion/Documents/Pobreza_municipal/2020/gpos_pob/Metodologia_pobreza_grupos_municipal.pdf (accessed on 13 March 2026).
- Intergovernmental Panel on Climate Change (IPCC). Climate Change 2014: Impacts, Adaptation, and Vulnerability. WMO-UNEP. 2014. Available online: https://www.ipcc.ch/report/ar5/wg2/ (accessed on 21 November 2025).
- Xavier, M.; Camolesi, T.; Vendramini Felsberg, A.; Ramos, L.; Casagrande Rocha, F.; Monzoni Neto, M. Adaptation to climate change and integration of disaster risk management in business education: A case study in Fundação Getulio Vargas, Brazil. AD-Minister 2016, 28, 91–126. [Google Scholar] [CrossRef] [Scilit]
- Craig-Scheckman, M.; Ishiwatari, M.; Aldrich, D.P. State, market, or community? Exploring public perceptions of disaster management strategies. Nat. Hazards Res. 2025, 5, 862–874. [Google Scholar] [CrossRef] [Scilit]
- Gómez, M. Percepción de Riesgos en Cuba con Enfoque de Género. DIPECHO LAC. 2015. Available online: https://wrd.unwomen.org/explore/insights/percepcion-de-riesgos-en-cuba-con-enfoque-de-genero (accessed on 17 May 2026).
- Bosch Fiol, E.; Ferrer Pérez, V.A. Fragilidad y Debilidad Como Elementos Fundamentales del Estereotipo Tradicional Femenino; Feminismo/s; RUA Repository: Alicante, Spain, 2003; pp. 139–151. [Google Scholar] [CrossRef] [Scilit]
- Ciu, O.L.; Phillips, D.R.; Leung, T.W. Age differences in safety attitudes and safety performance in Hong Kong construction workers. J. Saf. Res. 2003, 34, 199–205. [Google Scholar] [CrossRef] [Scilit] [PubMed]
- Nouri, J.; Azadeh, A.; Fam, I.M. The evaluation of safety behaviors in a gas treatment company in Iran. J. Loss Prev. Process Ind. 2008, 21, 319–325. [Google Scholar] [CrossRef] [Scilit]
- García del Castillo, J.A. Concepto de percepción de riesgo y su repercusión en las adicciones. Salud Drog. 2012, 12, 133–151. Available online: https://www.redalyc.org/pdf/839/83924965001.pdf (accessed on 27 January 2026). [CrossRef] [Scilit]
- UNICEF. ¿Por qué los adolescentes toman riesgos? 2023. Available online: https://www.unicef.org/uruguay/por-que-los-adolescentes-toman-riesgo (accessed on 21 January 2026).
- Nsabimana, J.; Henry, S.; Ndayisenga, A.; Kubwimana, D.; Dewitte, O.; Kervyn, F.; Michellier, C. Geo-hydrological hazard impacts, vulnerability and perception in Bujumbura (Burundi): A high-resolution field-based assessment in a sprawling city. Land 2023, 12, 1876. [Google Scholar] [CrossRef] [Scilit]
- Tillermuir, H.; Carboni, L.; Hotchin, C.; Lal, H.; Morrison, R. A holistic framework to improve urban flood management in cities with informal settlements. Environ. Res. Infrastruct. Sustain. 2025, 5, 015026. [Google Scholar] [CrossRef] [Scilit]
- Sjöberg, L. Factors in Risk Perception. Risk Anal. 2000, 20, 1–12. [Google Scholar] [CrossRef] [Scilit]
- Wachinger, G.; Renn, O.; Begg, C.; Kuhlicke, C. The Risk Perception Paradox—Implications for Governance and Communication of Natural Hazards. Risk Anal. 2013, 33, 1049–1065. [Google Scholar] [CrossRef] [Scilit] [PubMed]
- Fothergill, A.; Peek, L. Poverty and disasters in the United States: A review of recent sociological findings. Nat. Hazards 2004, 32, 89–110. [Google Scholar] [CrossRef] [Scilit]
- Norris, F.H.; Friedman, M.J.; Watson, P.J.; Byrne, C.M.; Diaz, E.; Kaniasty, K. 60,000 disaster victims speak: Part I. An empirical review of the empirical literature, 1981–2001. Psychiatry. Fall 2002, 65, 207–239. [Google Scholar] [CrossRef] [Scilit] [PubMed]
- Moser, C.O. The asset vulnerability framework: Reassessing urban poverty reduction strategies. World Dev. 1998, 26, 1–19. [Google Scholar] [CrossRef] [Scilit]
- Morrow, B.H. Identifying and mapping community vulnerability. Disasters 1999, 23, 1–18. [Google Scholar] [CrossRef] [Scilit] [PubMed]
- Kenmegne, R.L.T.; Bissonnette, J.F.; Lavoie, R.; Blouin, D. When survival is organized locally: Perspectives of community resilience by collective action to flooding in three informal settlements of Douala, Cameroon. Prog. Disaster Sci. 2026, 29, 100522. [Google Scholar] [CrossRef] [Scilit]
- Muñoz-Duque, L.A.; Arroyave, O. Percepción del riesgo y apego al lugar en población expuesta a inundación: Un estudio comparativo. Pensam. Psicológico 2017, 15, 79–92. [Google Scholar] [CrossRef] [Scilit]
- Hallegatte, S.; Vogt-Schilb, A.; Bangalore, M.; Rozenberg, J. Unbreakable: Building the Resilience of the Poor in the Face of Natural Disasters; World Bank Publications: Washington, DC, USA, 2017. [Google Scholar] [CrossRef] [Scilit]
- Superate. Guía Técnica de Bono de Emergencia. 2024. Available online: https://www.superate.gob.do/wp-content/uploads/2024/02/Guia-Tecnica-Bono-de-Emergencia-6.pdf (accessed on 15 February 2026).
- Camacho, R.; Aryal, J.; Rajabifard, A. Disaster-induced disruption of policies for informal urban settlements. Cities 2024, 150, 105098. [Google Scholar] [CrossRef] [Scilit]
- Plan Nacional de Adaptación Para el Cambio Climático en la República Dominicana 2015–2030. Available online: https://adaptacion.cambioclimatico.gob.do/wp-content/uploads/2022/07/Plan-Nacional-de-Adaptacion-para-el-Cambio-Climatico-en-RD-2015-2030-PNACC.pdf (accessed on 18 February 2026).
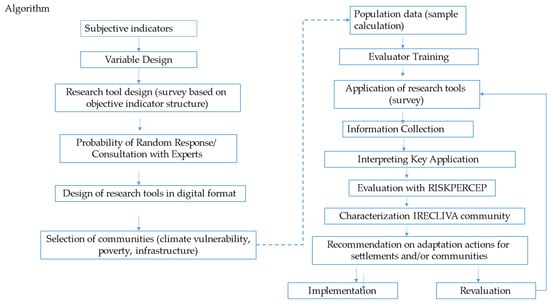
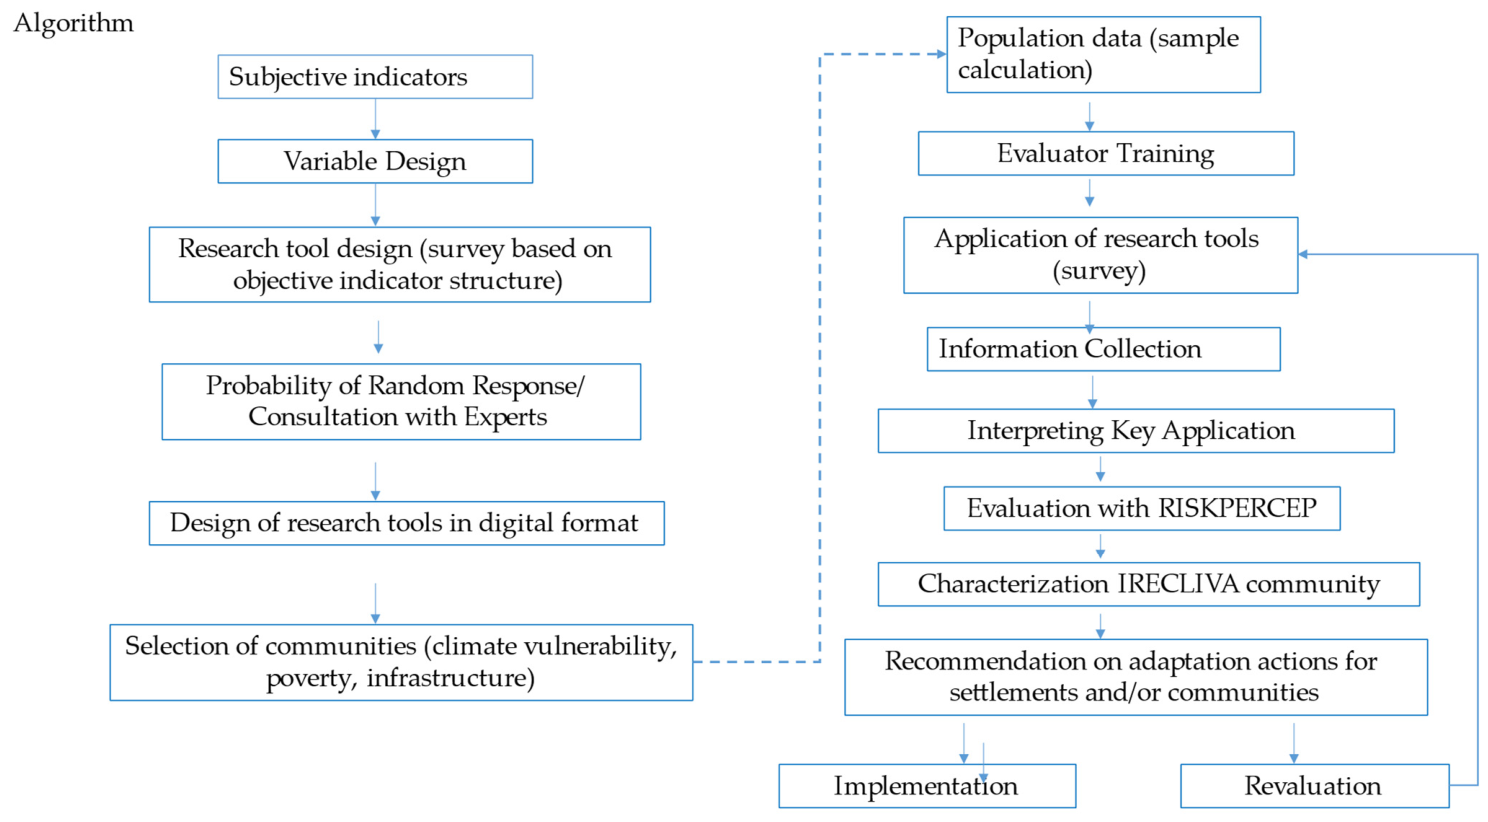
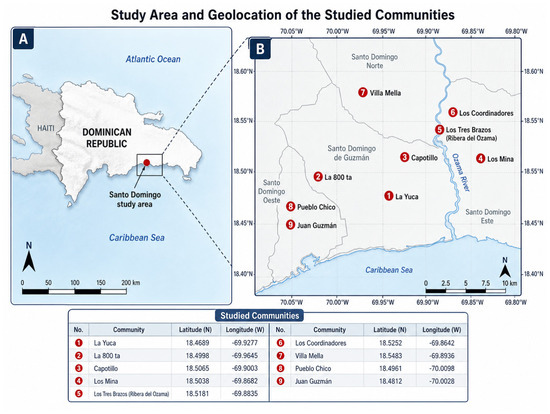
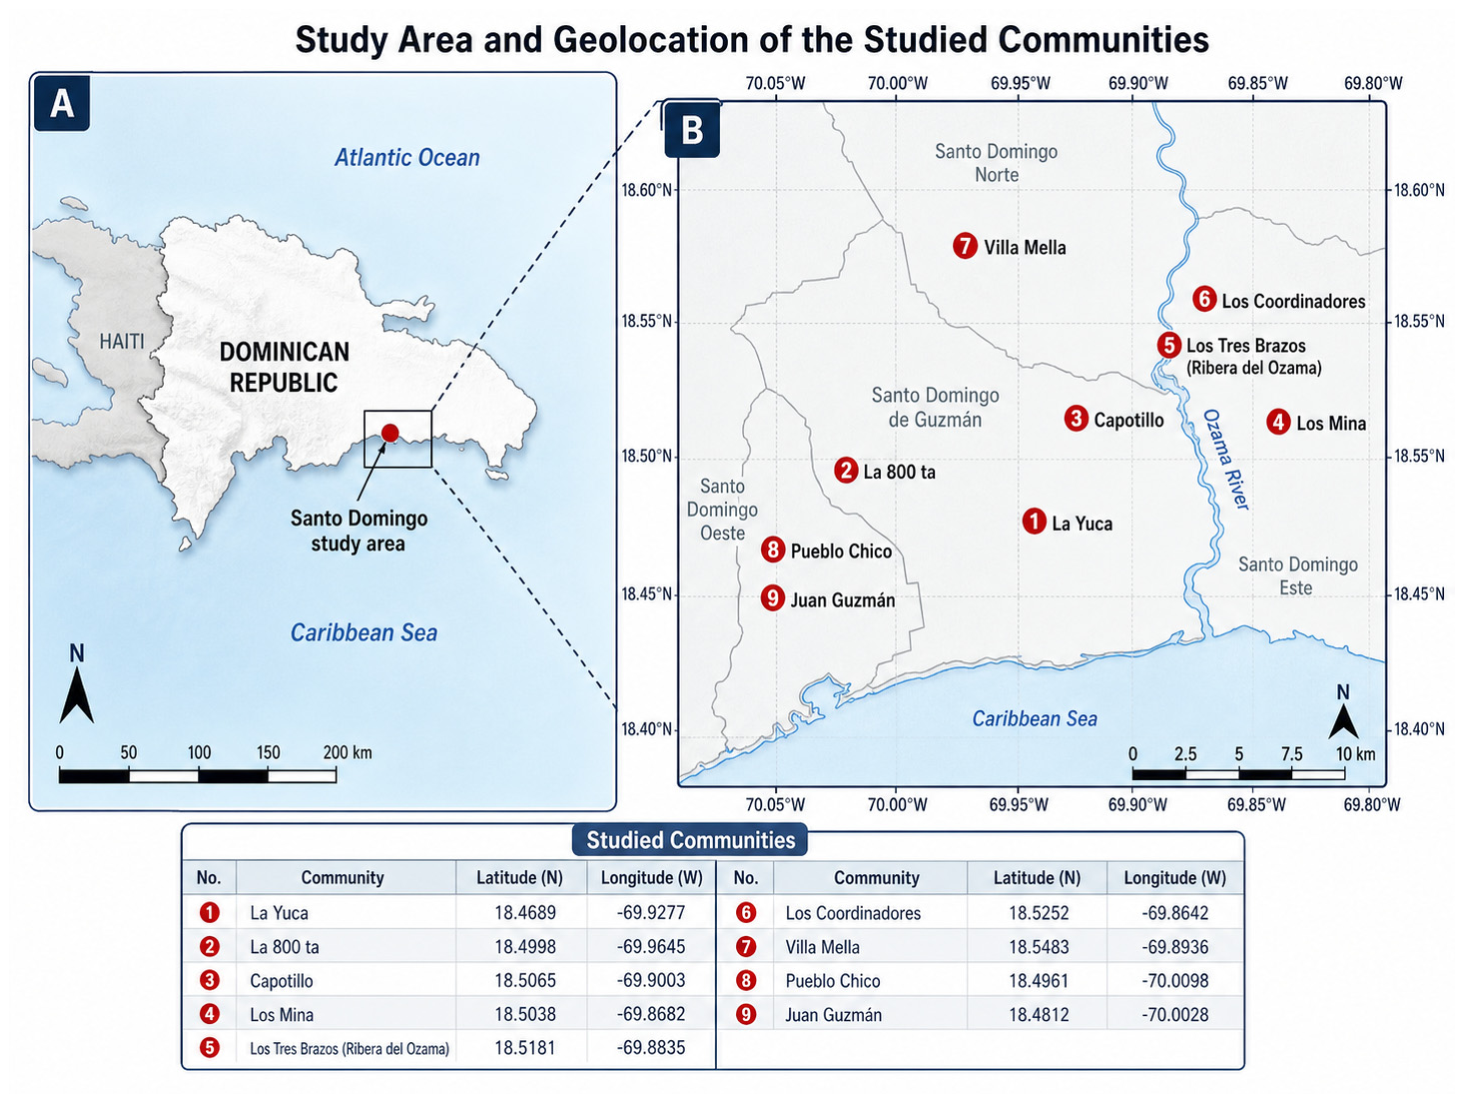
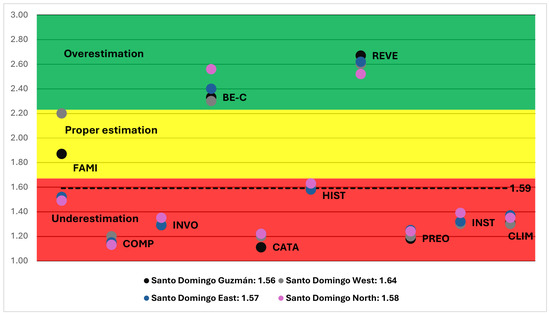
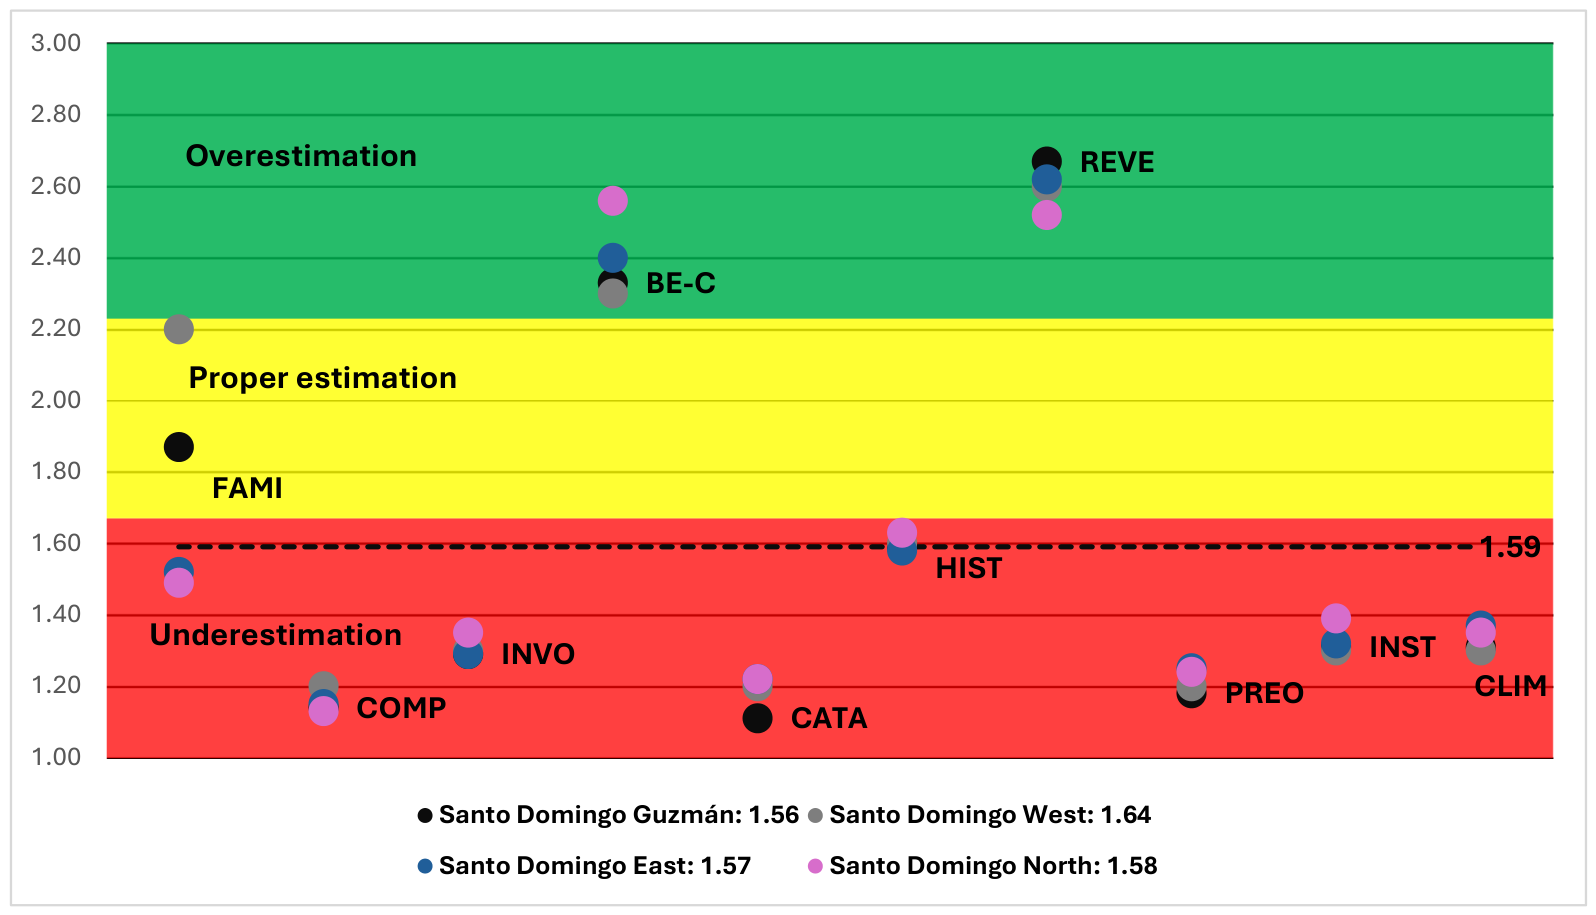
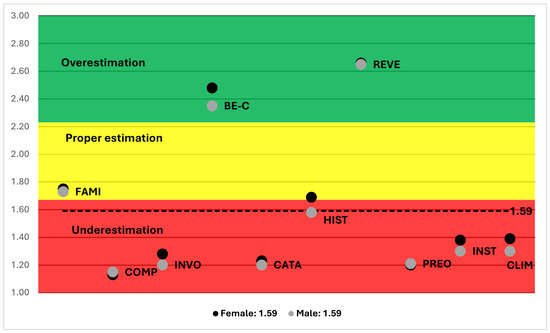
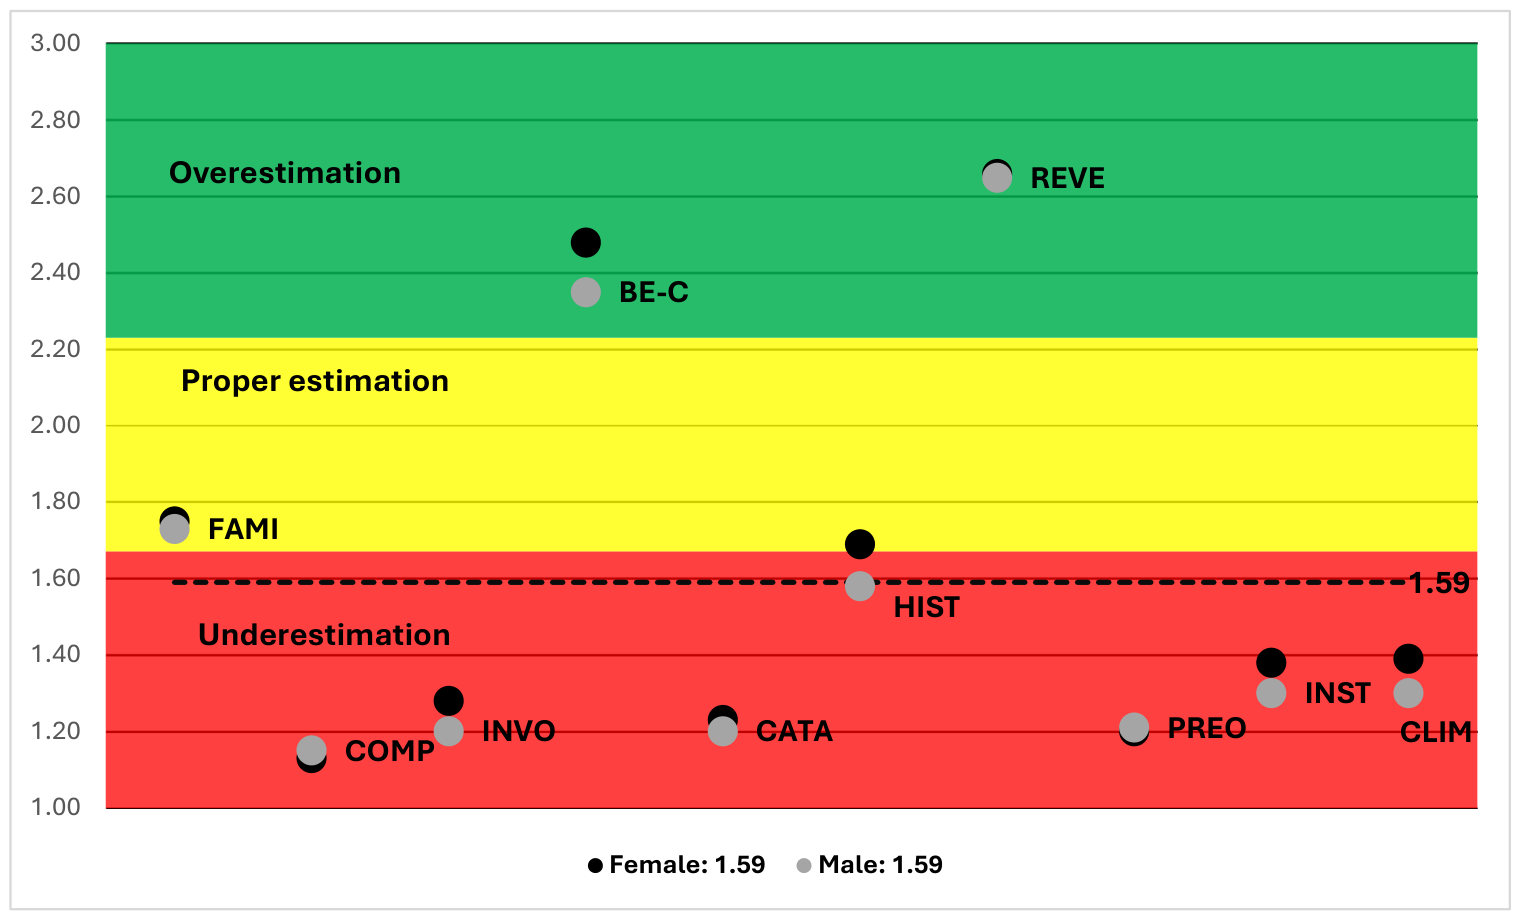
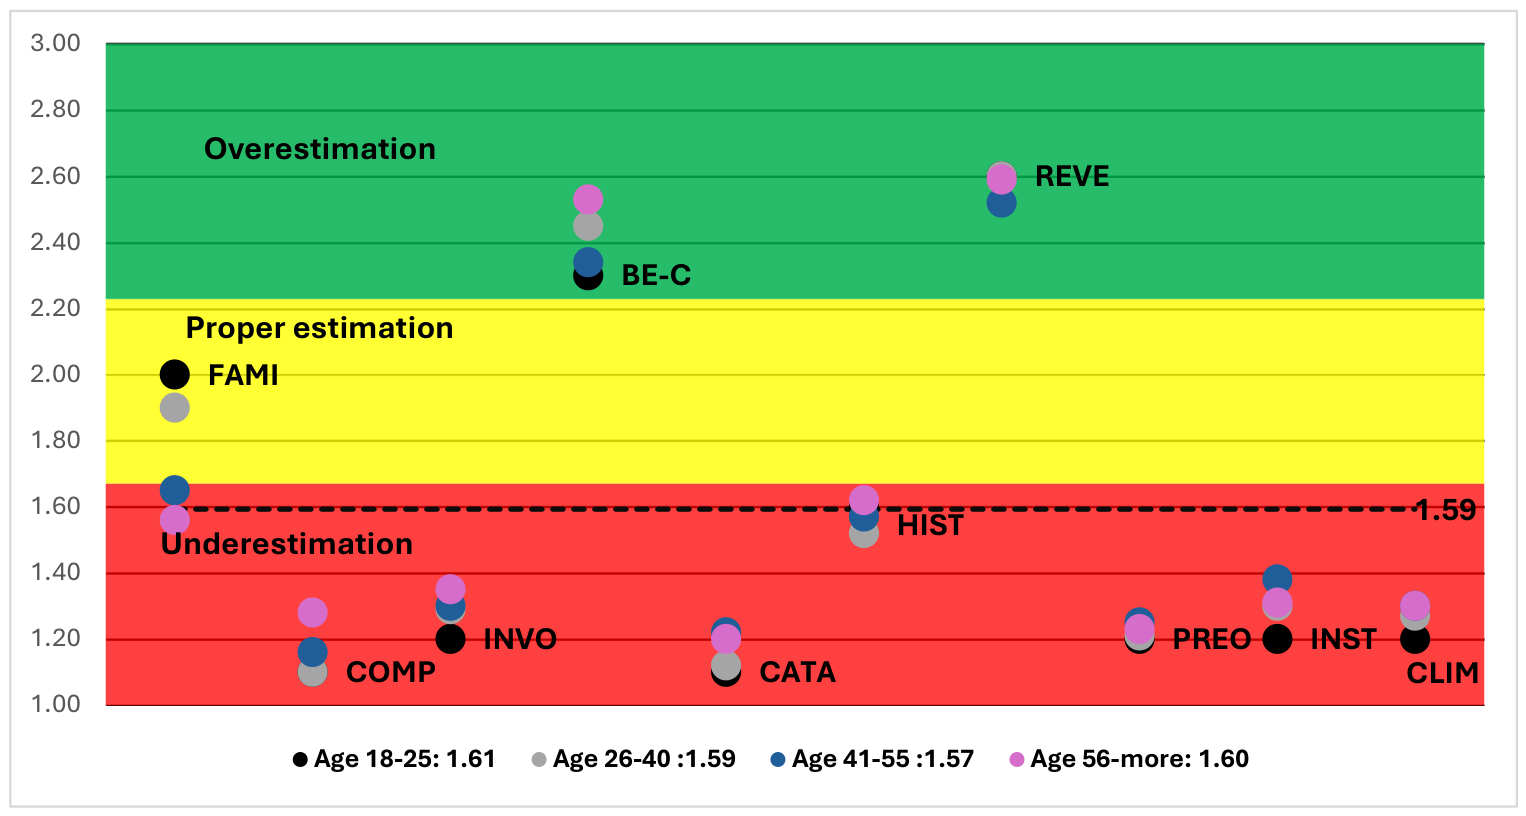
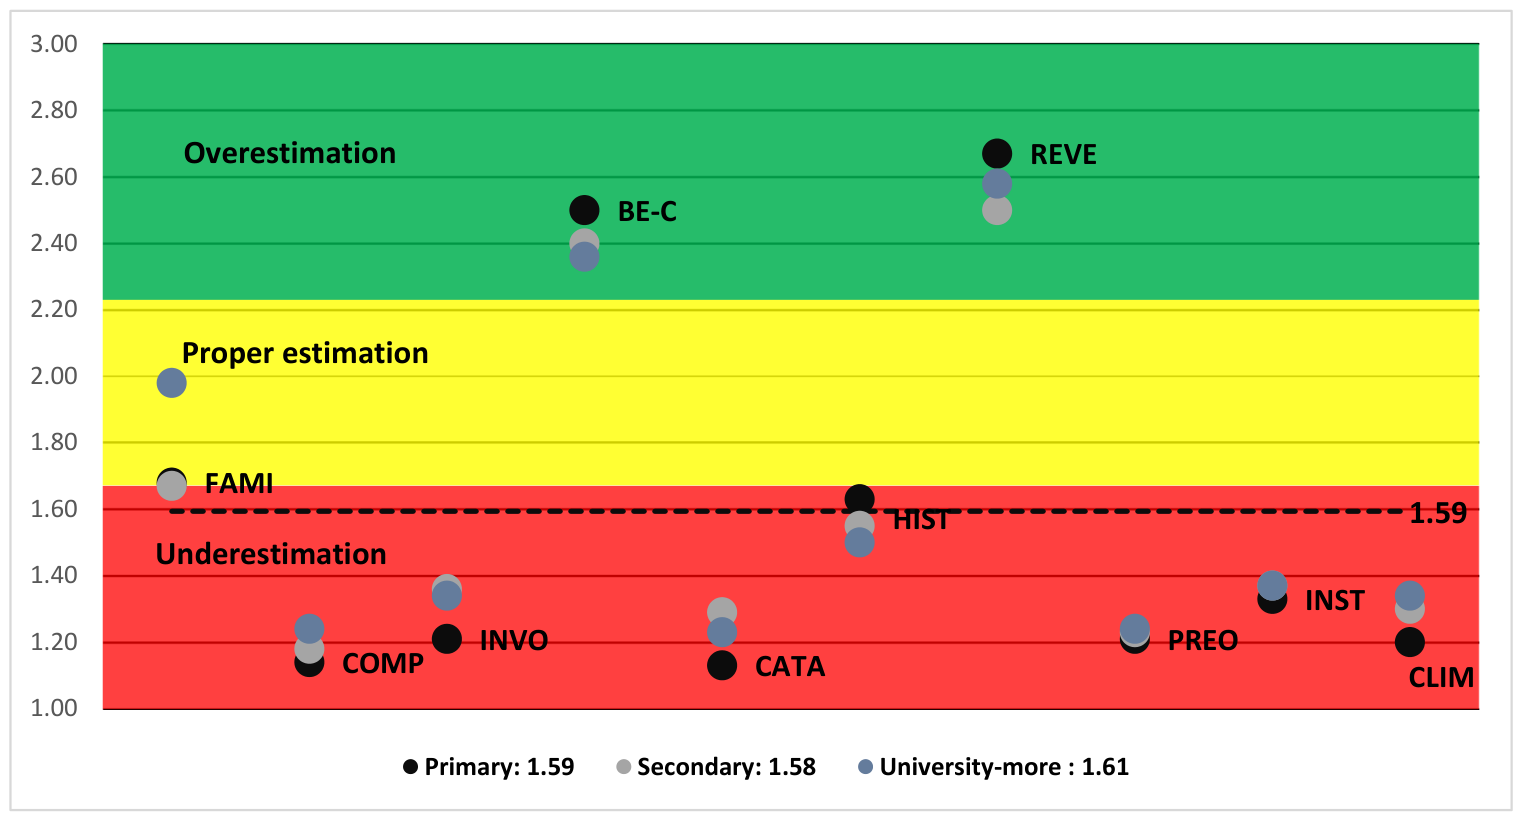

Disclaimer/Publisher’s Note: The statements, opinions and data contained in all publications are solely those of the individual author(s) and contributor(s) and not of MDPI and/or the editor(s). MDPI and/or the editor(s) disclaim responsibility for any injury to people or property resulting from any ideas, methods, instructions or products referred to in the content. |
© 2026 by the authors. Licensee MDPI, Basel, Switzerland. This article is an open access article distributed under the terms and conditions of the Creative Commons Attribution (CC BY) license.