


Abstract
To validate the validity of a driving simulation platform, this study constructs a dual dataset using field data and driving simulation experiments on an urban arterial road. Comprehensive validation is conducted from both subjective perception and objective quantification perspectives. Subjectively, questionnaires assessed simulation fidelity, driving workload, and physiological symptoms. Objectively, five core car-following indicators (speed, acceleration, relative speed, headway, and time headway) were analyzed using dynamic time warping and statistical methods. The results demonstrate that the simulated scenarios exhibit high subjective fidelity, reasonable task loads, and controllable motion sickness risks. Objectively, dynamic time warping confirms strong temporal pattern similarity, with waveform consistency proportions across core indicators ranging from 91.67% to 100.0%. Macroscopically, satisfactory relative aggregate similarity is demonstrated, with relative difference between means consistently constrained within a 20% threshold. However, strict absolute behavioral validity is unsupported due to significant statistical differences in sequence means, establishing clear boundary constraints for trend replication. It is speculated that systematic biases are primarily related to differences in risk perception within virtual environments.
1. Introduction
As the transportation system becomes increasingly complex, there is an urgent need for precise and efficient research tools in fields such as driving behavior studies, optimization of road traffic facilities, and development of intelligent transportation systems. A driving simulator, as a computer virtual simulation platform integrating vehicle dynamics and kinematics simulation models with visual scene-generation systems, can reproduce the road environment, motion feedback, and sound field effects through virtual reality technology, providing drivers with a highly realistic driving experience [1]. It boasts outstanding advantages such as no physical risks, customizable scenarios, and traceable data, and has become a core research method in related fields [2].
Compared with real vehicle tests, driving simulators have significant technical advantages [3,4]. They not only can efficiently collect multi-dimensional experimental data in real time, but can also precisely reproduce high-risk traffic conflict scenarios in a controllable environment, effectively compensating for the inherent limitations of real vehicle tests in terms of safety, repeatability, and scene controllability. Existing research has confirmed the potential application of driving simulators in various scenarios. In the study of driving behaviors, it can create extreme scenarios such as distracted driving, driving fatigue, tunnel environments, and urban roads to capture the driving behaviors of drivers, providing detailed data for analyzing the causes of traffic accidents [5,6,7]. In the assessment of road traffic safety, it can reveal the influence patterns of road alignment and traffic sign design parameters on driver behavior, providing a scientific basis for the optimization of engineering plans. In the development of intelligent transportation systems, its low cost and high repeatability has allowed it to become the core testing platform for autonomous driving systems and vehicle-road coordination technologies [8,9].
However, the scientific integrity and practical value of the simulation experiment results are highly dependent on the simulation validity of the driving simulation platform [4]. The issue with the validity of the simulator lies in the degree of correspondence (or deviation) between the driving behavior observed in the simulation environment and the actual driving behavior [10]. Only when the simulator can reliably reproduce the characteristics of real driving can its research results have value for application and promotion. From the perspective of validity, the validity of the simulator is usually divided into physical validity and behavioral validity. Physical validity refers to the degree of correspondence between the physical components of the simulator and the actual vehicle. Behavioral validity refers to the correspondence between the behaviors of the driver in the virtual and real environments [11].
The methods for verifying driving simulators typically involve direct comparison or statistical tests of the simulated driving data with the actual test data [1]. From the perspective of evaluation criteria, it is divided into absolute validity and relative validity. Absolute validity means that under the same driving task conditions, the analytical indicator values obtained in the real and simulated scenarios are equal, or there is no significant statistical difference between the evaluation indicators. Relative validity indicates that although there are significant differences in the evaluation indicator results between the simulation and the real scenarios, they exhibit similar effects or have the same change trends. In practical research, absolute validity is limited by factors such as the hardware performance of the simulator, the accuracy of scene modeling, and the differences in drivers’ risk perception, making it difficult to fully achieve. Relative validity has become the core validity goal of most driving simulation studies [12,13].
From the perspective of validity methods, the validation of driving simulators can be divided into objective validity and subjective validity [14]. Objective validity can be verified through real-world and simulation tests by collecting the motion parameters of actual vehicles and driving simulators, such as average speed, lateral position, overall driving performance, and the number of driving errors [15,16].
In addition, psychophysiological data can also serve as a validity tool. Subjective validity typically involves collecting data through questionnaires to assess the personal characteristics and subjective perceptions of drivers [17], as well as their perception of the simulator. On one hand, it assesses the drivers’ perception of the technical features of the simulator (such as visual fidelity, tactile feedback, auditory effects, and immersion), and on the other hand, it investigates the drivers’ satisfaction with the fidelity of the simulator, the comfort of the equipment, and the overall driving experience. Common scales used include the Simulator Sickness Questionnaire (SSQ) and the NASA task load index (NASA-TLX) [18,19,20]. With the development of human factors engineering and wearable device technology, perceptual and physiological data such as eye movement trajectories and electromyography (EMG) have further enriched validity dimensions, making validity assessment more comprehensive [21].
Nevertheless, despite the increasing number of studies in the field of driving simulation and the recognition of the importance of the topic of validity, the number of studies attempting to validate simulators remains limited [15]. In existing research, simulator validity is predominantly evaluated by comparing data from the same cohort of drivers operating both instrumented real-world vehicles and driving simulators. However, the utilization of naturalistic vehicle trajectory data monitored by roadside equipment for validity demonstration remains relatively limited. Furthermore, previous validation studies often assess overall driving performance without isolating specific driving scenarios, thereby overlooking the behavioral heterogeneity inherent in different dynamic contexts. To address these gaps, this study utilizes vehicle trajectory data captured by roadside radar as an authentic field dataset for comparison with driving behavior data obtained from the simulation platform. Additionally, validation specifically focuses on continuous car-following scenarios on urban arterial roads, as validating these stable microscopic driving behaviors is a crucial prerequisite for the subsequent development of reliable traffic flow models.
To address these gaps, this study proposes a comprehensive validation framework with two key innovations. The authors use large-scale naturalistic driving data from open urban arterial roads instead of small-sample closed-road tests, and focus specifically on stable urban car-following behavior rather than generalized scenario validation. This study then establishes a multi-dimensional subjective–objective evaluation system, providing support for the precise application of driving simulation technology.
It should be clarified that the unit of comparison between the field data and simulator data in this study is established at the aggregate or scenario level, rather than the individual subject level. The field data derive from naturalistic roadside observations capturing anonymous traffic flow sequences, whereas the simulator data are generated by a specific group of recruited participants. Therefore, the objective validation focuses on evaluating the overall statistical consistency and temporal trend similarity between the field-observed and simulator-generated car-following sequences under identical scenario conditions, rather than tracking subject-to-subject behavioral matching.
To establish a precise evaluation framework, the validation of the driving simulation platform is operationalized through two distinct dimensions: absolute validity and relative validity. Absolute validity denotes the exact numerical replication of real-world driving behavior, requiring no statistically significant differences in metrics (such as speed, acceleration, and headways) between simulated and field observations. Conversely, relative validity refers to the consistency in behavioral trends, ordinal rankings, or macroscopic distributions, signifying that the simulation successfully mirrors real-world traffic patterns and behavioral evolution even if systematic numerical offsets persist.
The remainder of this paper is organized as follows. Section 2 details the data preparation process, including the collection of field data and the configuration of the driving simulation experiments. Section 3 introduces the multi-dimensional subjective–objective validation methods. Section 4 presents the subjective fidelity evaluation and objective comparative results. Finally, Section 5 discusses the research findings, limitations, and concludes the paper.
2. Data Preparation
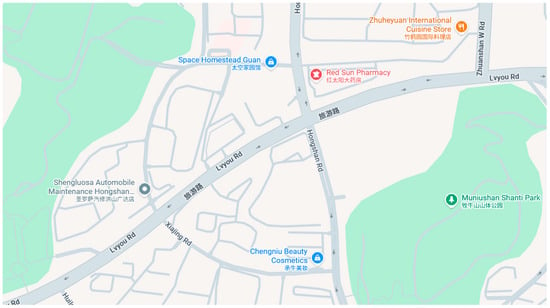
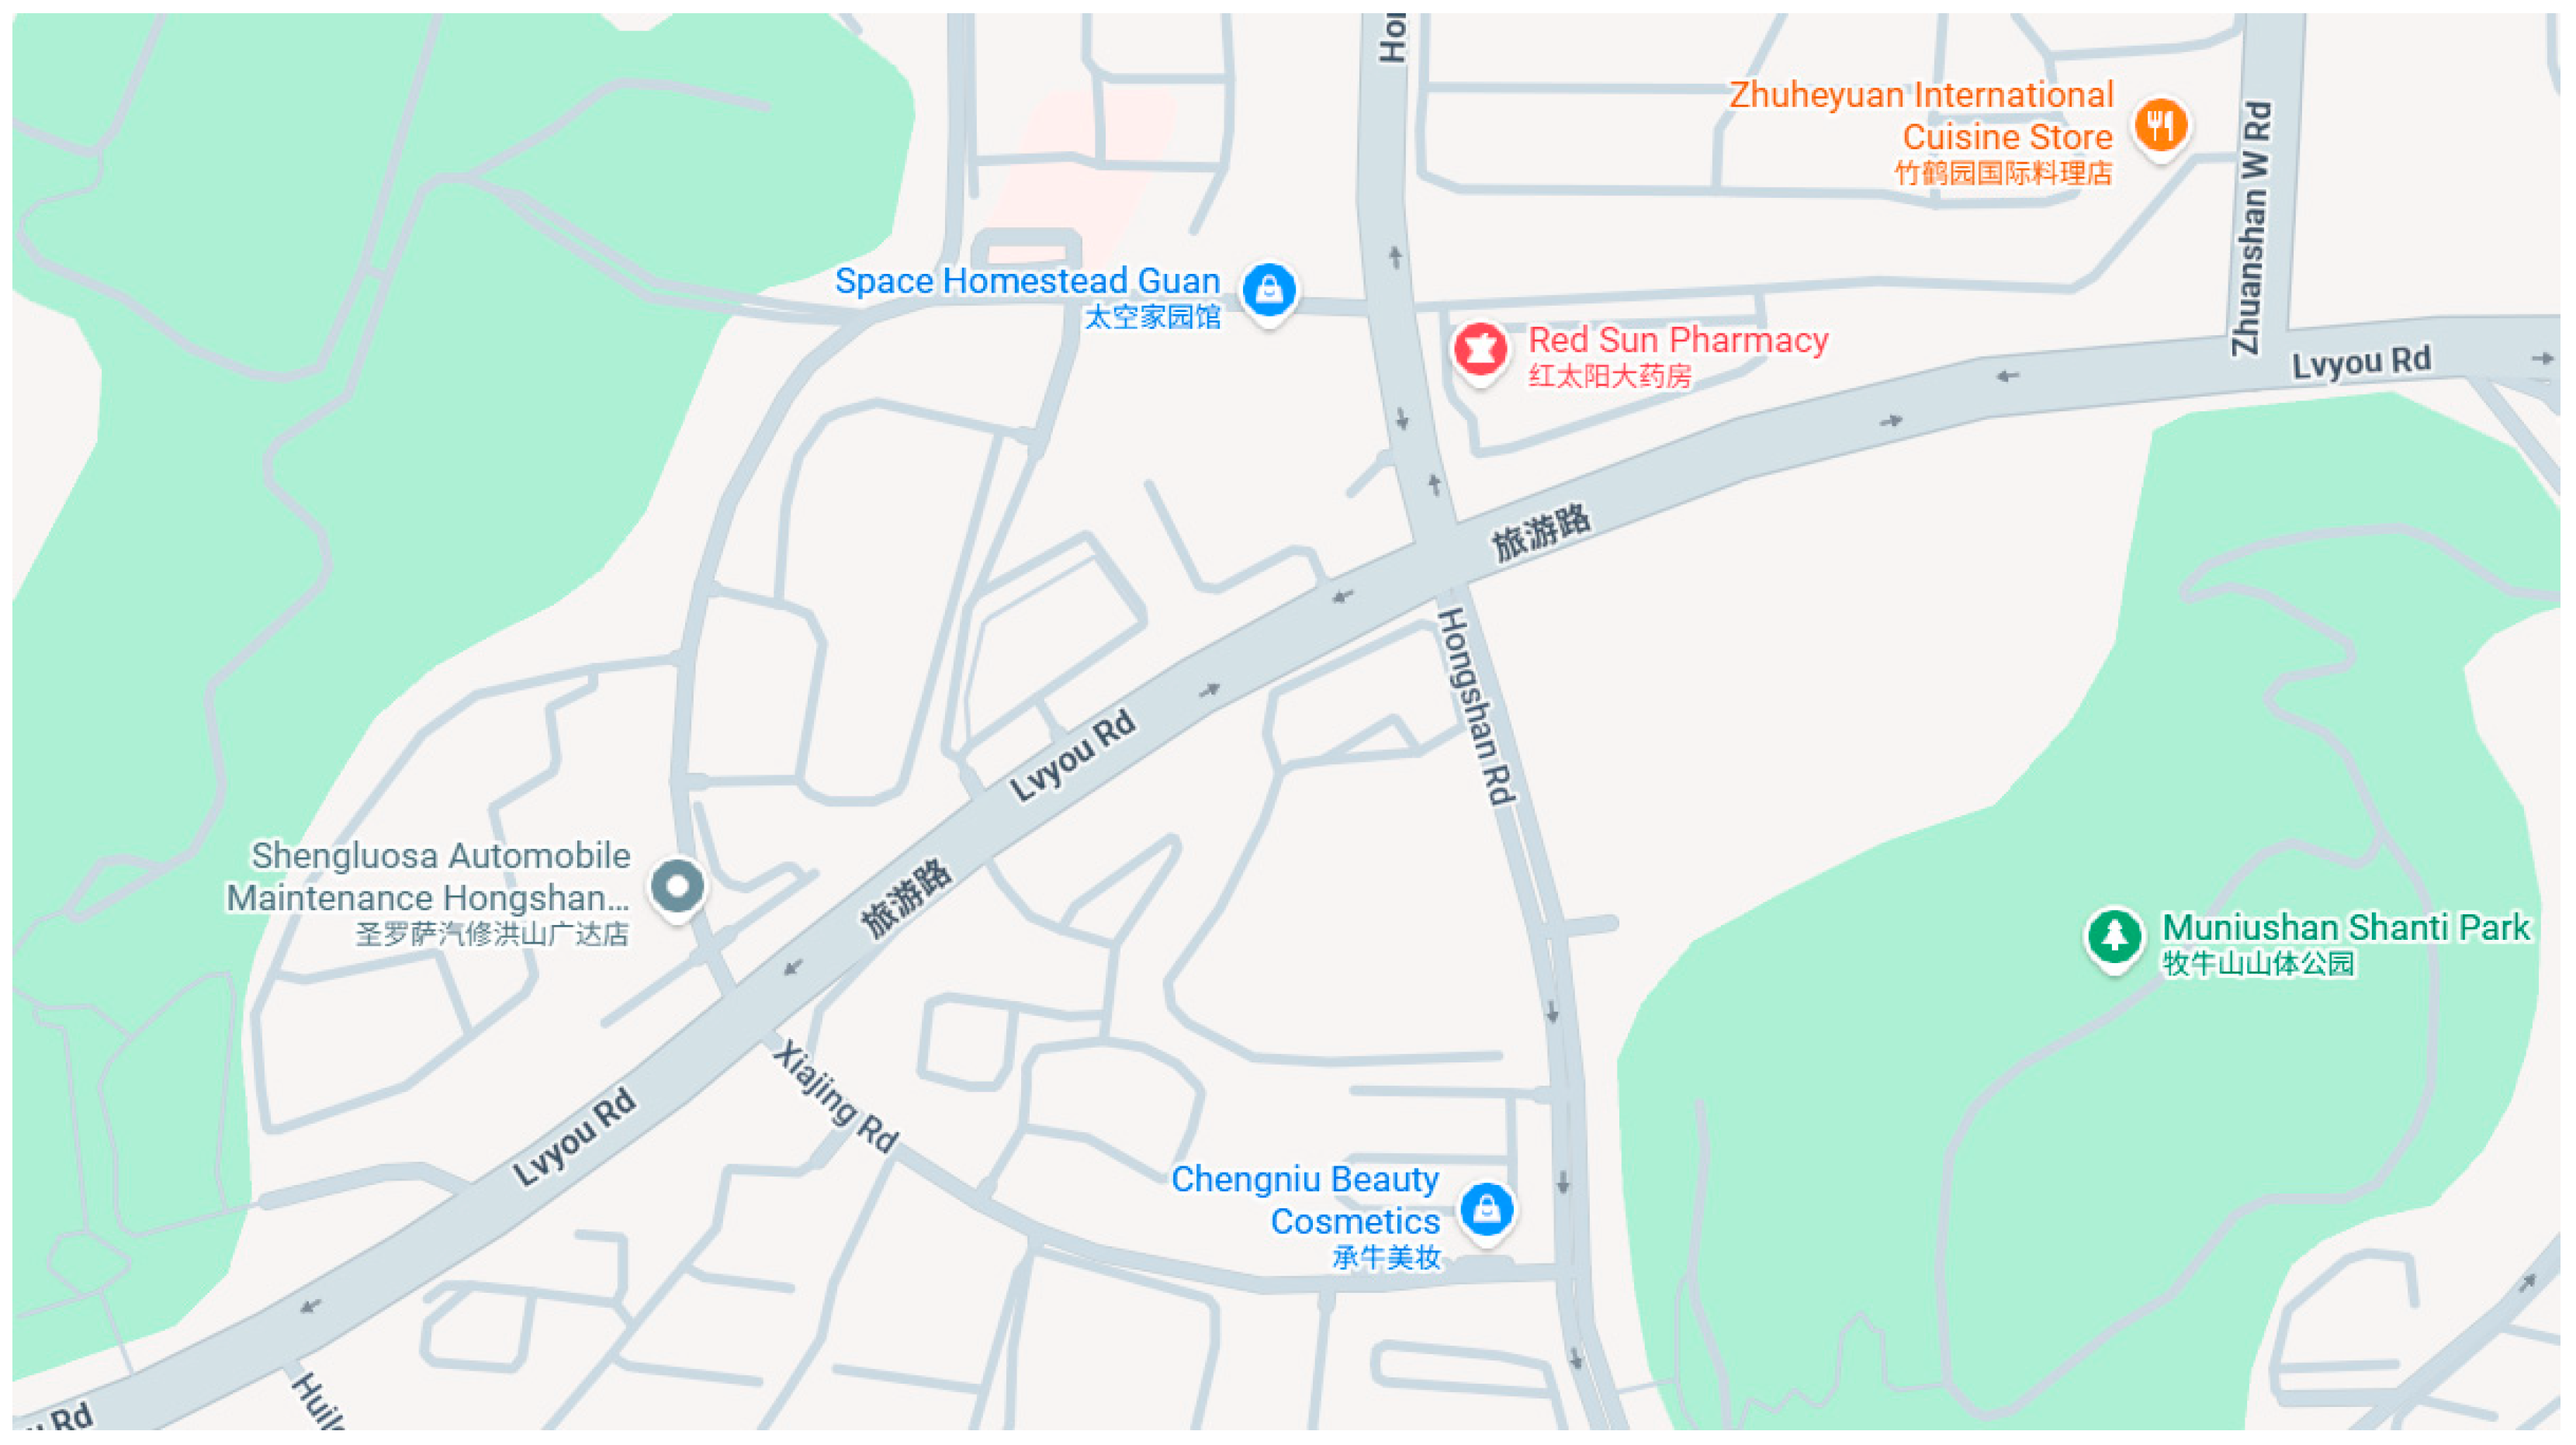
This study selected urban roads as a representative road class for the construction of evaluation scenarios. All simulated scenarios were reconstructed at a 1:1 ratio based on the alignment, gradient, roadside vegetation, and traffic signs and markings of real roads to ensure a high degree of consistency between the visual environment and the physical environment. In the urban road scenario, a section of Lvyou Road (from Zhuanshan West Road to Hongshan Road) in Jinan City was selected for the field vehicle test, as shown in Figure 1. This test section is approximately 2 km long and includes three signal-controlled intersections. The overall alignment is relatively gentle with a wide field of view, making it a typical urban arterial road environment. The design speed limit for this road is 60 km/h. Regarding the setting of the traffic flow environment, based on field survey data, the background traffic volume was set to 1200 pcu/h, of which small vehicles accounted for approximately 90%, and the measured average speed was approximately 37 km/h.
Figure 1.
Schematic diagram of Lvyou Road, Jinan (from Zhuanshan West Road to Hongshan Road).
2.1. Field Data Collection and Equipment Layout Scheme for Urban Roads
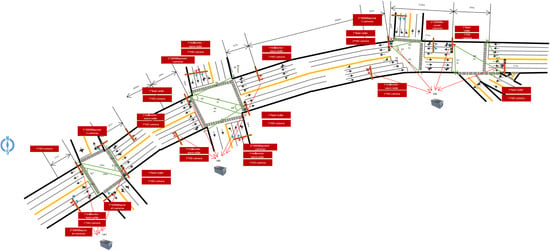
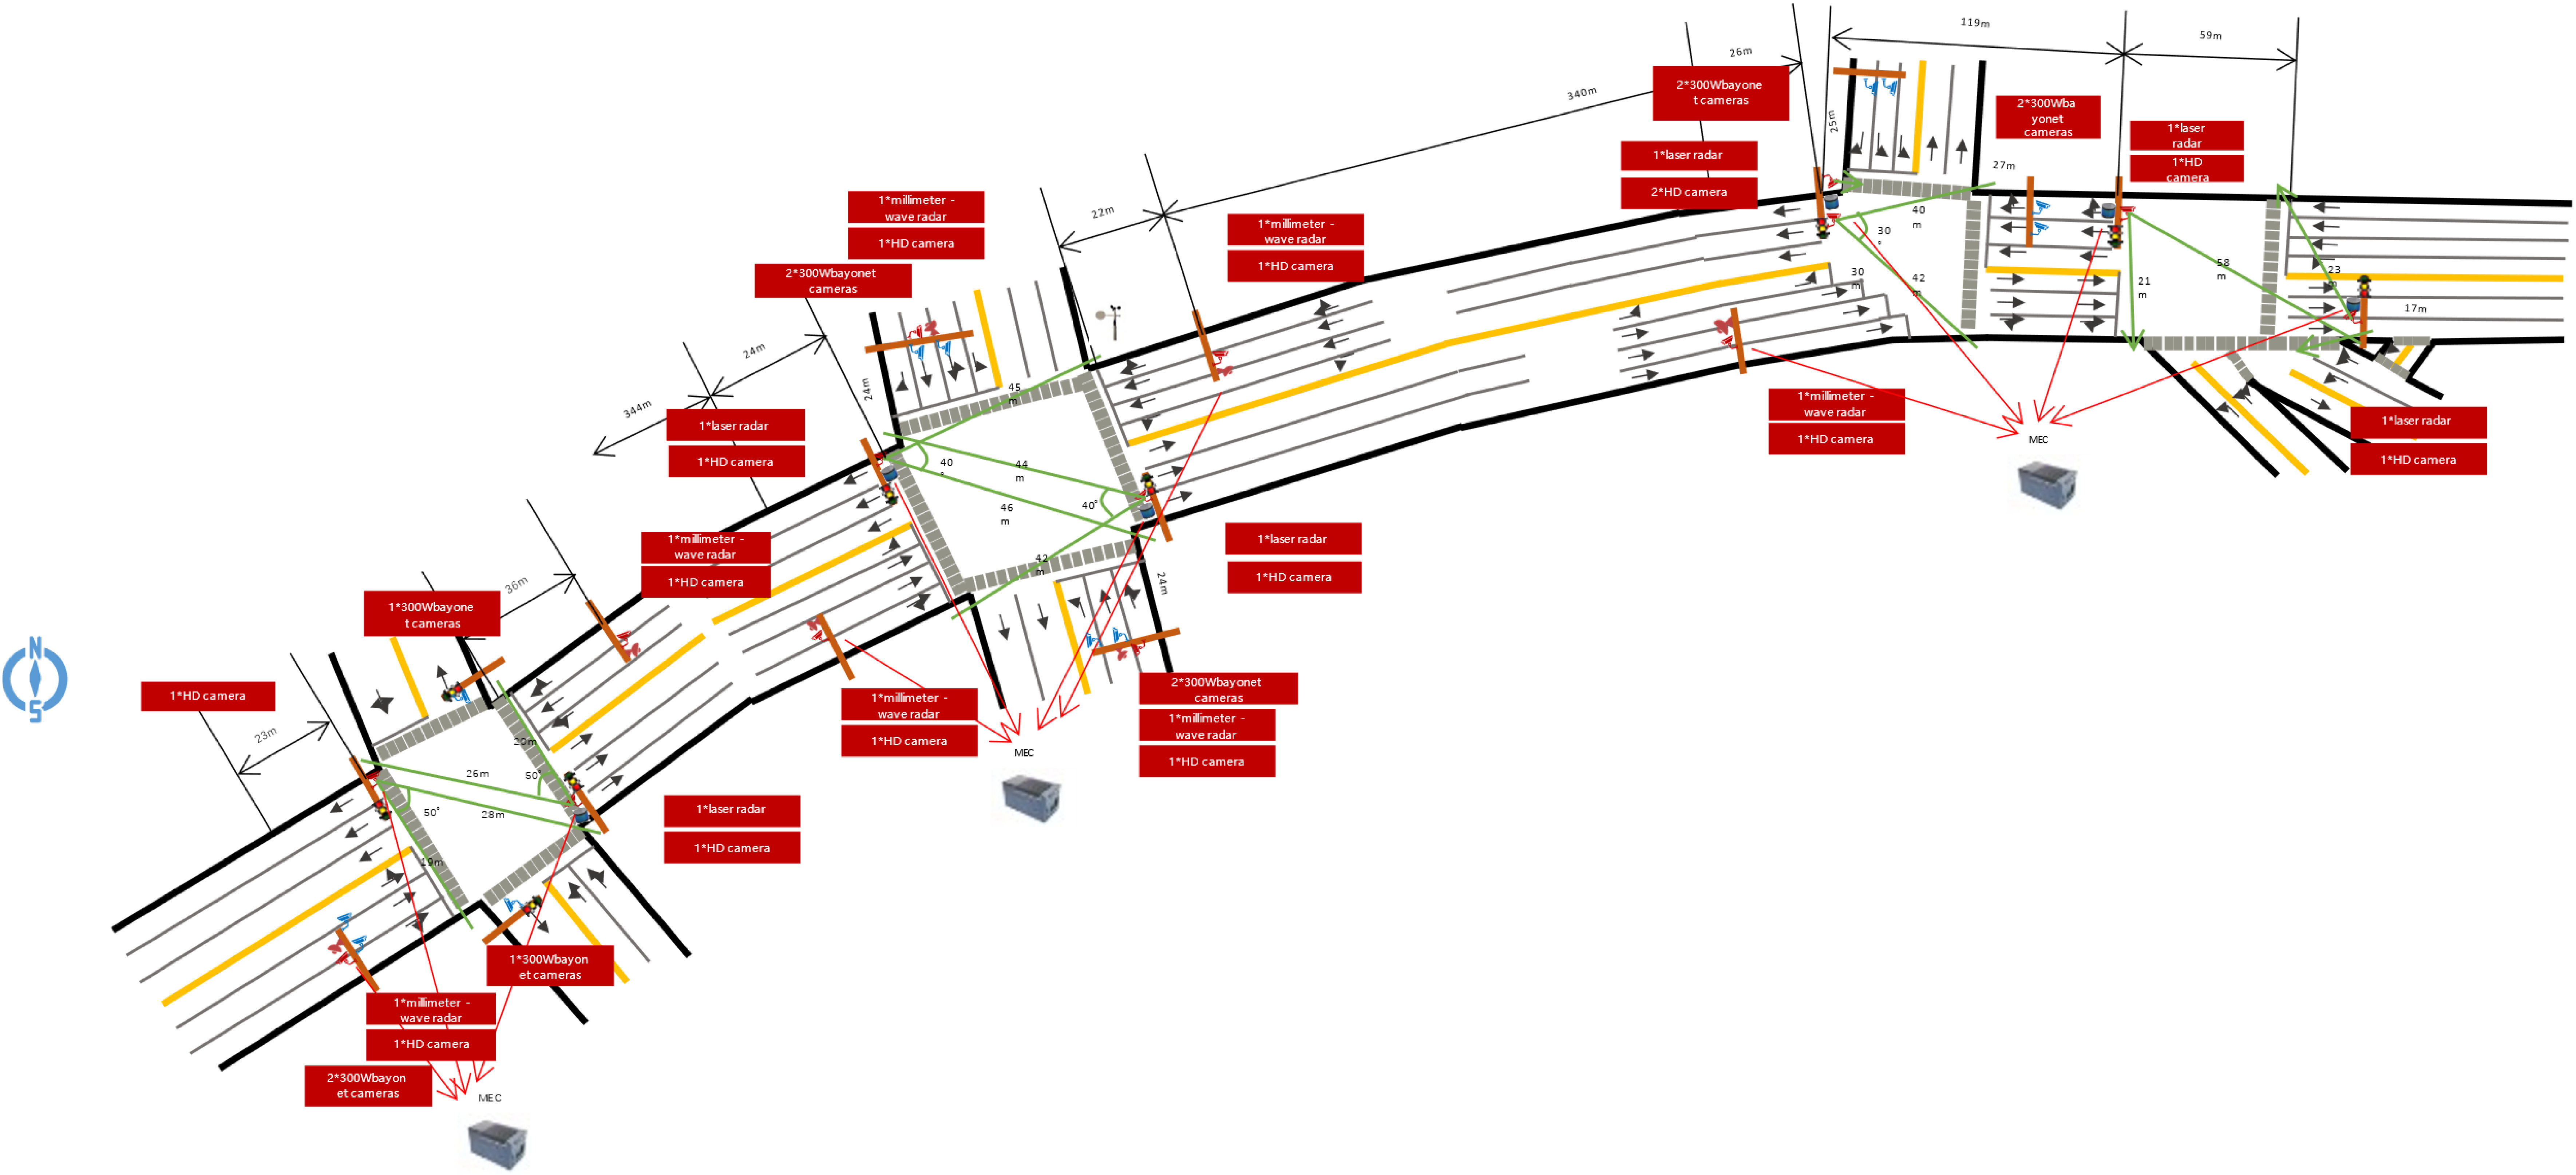
To collect continuous and stable vehicle operation data with high precision, professional data collection equipment was deployed at the three aforementioned intersections, as shown in Figure 2. All intersections adopt an independent equipment layout rather than integrated radar-vision devices. At the Xiajing Road intersection, one LiDAR (laser radar), three high-definition (HD) cameras, four 3-megapixel ANPR (Automatic Number Plate Recognition) cameras, and one millimeter-wave radar were deployed; at the Hongshan Road intersection, two LiDARs, seven HD cameras, four 3-megapixel ANPR cameras, and five millimeter-wave radars were deployed; and the Zhuanshan West Road intersection was equipped with three LiDARs, five HD cameras, four 3-megapixel ANPR cameras, and one millimeter-wave radar.
Figure 2.
Schematic diagram of data collection equipment. Black arrows indicate road segment distances, and red arrows indicate locations.
During the data collection process, a complete video clip was extracted for each traffic direction at each intersection. Meanwhile, weather condition data, road gradient data, and specific sampling dates were recorded according to the actual test conditions. Regarding data precision and quality, the sampling frequency of the field data was strictly set to 10 Hz (i.e., one sample every 0.1 s). The data completeness is excellent: the successful vehicle tracking rate in the intersection areas reached over 90%, and the successful tracking rate in the road sections also remained above 70%, providing high-quality benchmark support for subsequent research.
The field trajectory dataset is a standardized roadside perception product from Wanji Technology. This roadside perception system achieves a vehicle positioning accuracy within 0.5 m and a trajectory tracking success rate of over 70%. Raw trajectories are continuous along the entire corridor, and stable car-following segments were extracted from individual road sections due to the existence of signalized intersections.
2.2. Configuration of the Driving Simulation Platform and Subject Testing Process
2.2.1. Driving Simulation Platform
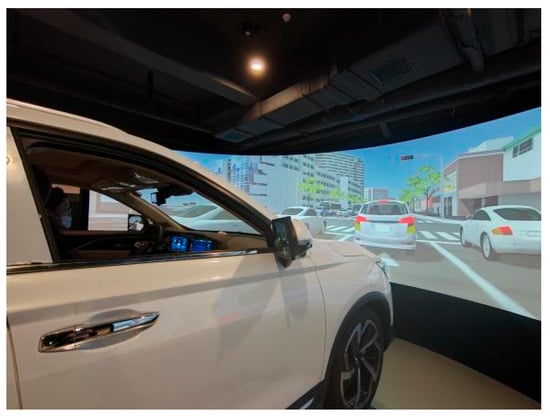
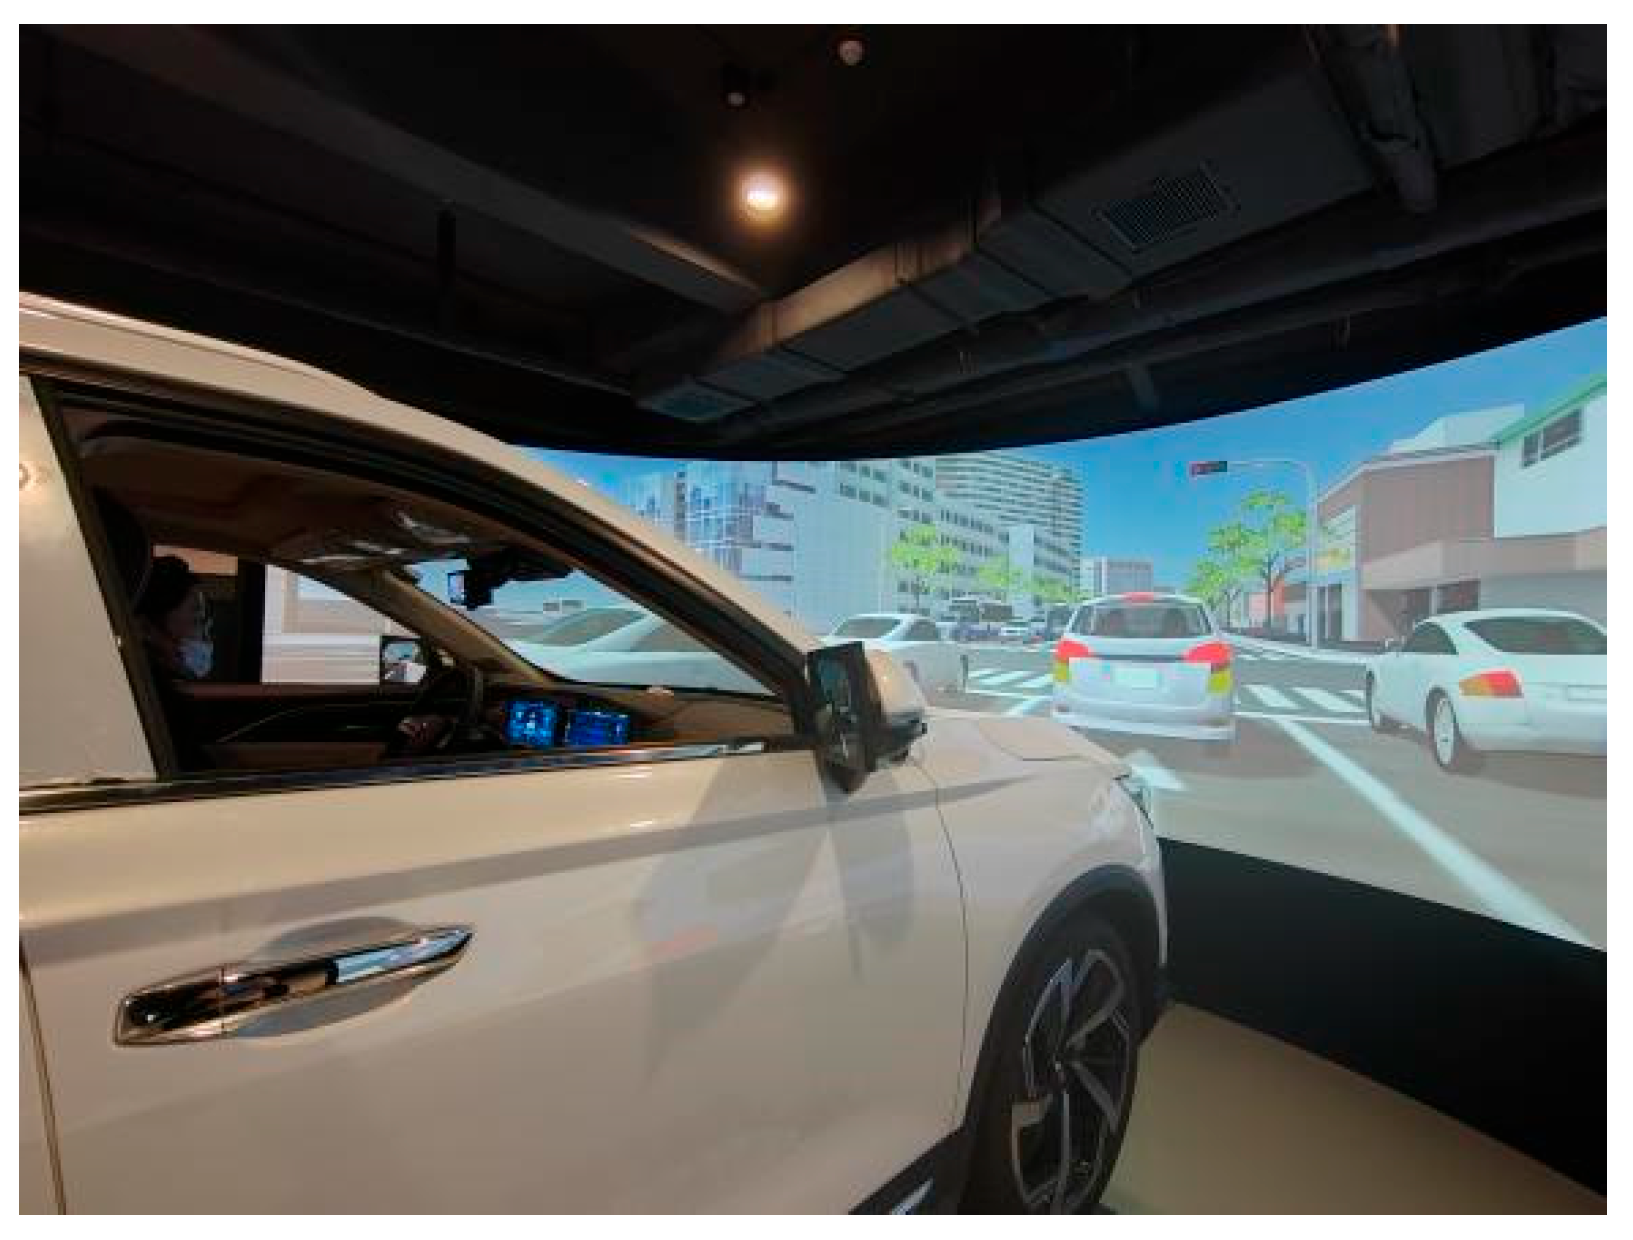
The driving simulator used in this experiment is located at the Shandong Transport Planning and Design Institute and is specifically designed for researching road safety and driving behavior, as shown in Figure 3. Constructed as a real-vehicle driving simulator, the hardware system utilizes a Bestune T77 vehicle (FAW Group, Changchun, China) mounted on a six-degree-of-freedom (6-DOF) motion platform, and is equipped with a 160° surround screen to provide an expansive field of view. The platform integrates five core systems: dynamics simulation, visual simulation, audio simulation, operation control, and data recording. For the simulation environment, the platform is powered by UC-win/Road Driving Sim (FORUM8 Co., Ltd., Tokyo, Japan), an advanced 3D simulation and visualization software. This software supports various vehicle dynamics models and accommodates 3D and OpenStreetMap (OSM) scene map formats. It uses virtual reality technology to build a virtual driving scene with multi-element dynamic interaction to ensure the realism and immersion of the simulated environment. This simulator provides drivers with 3D virtual driving scenarios including roads, signs, markings, other moving vehicles, and rich roadside facilities. To match the field benchmark data, the simulation platform synchronously outputs various simulated operation indicators at a high-frequency sampling rate of 10 Hz (i.e., every 0.1 s), including vehicle parameters such as speed, lateral displacement, throttle, brake, steering wheel angle, clutch, and vehicle coordinates, as well as the operation parameters of other surrounding vehicles.
Figure 3.
Driving simulator.
The surrounding traffic flow and the specific leader vehicles were dynamically generated by the simulation software’s internal traffic model, rather than following a fixed, pre-recorded trajectory. Although participants encountered non-identical traffic streams during their drives, the behavioral logic and kinematic distributions of the generated vehicles were tightly calibrated to conform to the empirical characteristics of the field trajectory dataset. Only the speed distribution of generated leader vehicles was calibrated against field trajectory data. In urban car-following scenarios, the speed of the leader vehicle is a core variable that dominates the follower’s driving behavior pattern and risk perception, so it is adopted as the key filtering criterion for subsequent comparative analysis. For other core car-following indicators including subject vehicle speed, headway, acceleration, relative speed, and time headway. At signalized intersections, these vehicles reacted autonomously to the synchronized traffic signal timings.
2.2.2. Subject Selection
Thirty-six subjects were recruited from universities and social groups for this experiment, comprising 75% males and 25% females. The gender distribution roughly matches the statistical characteristics of Chinese drivers (Table 1). All subjects met the criteria for driving simulator experiments. Subjects had to be at least 18 years old and hold a driver’s license. Drivers must not have vision problems (normal or corrected, self-reported) or hearing problems (self-reported), and must not suffer from simulator sickness (primarily motion sickness). Staff explained the experimental procedures and potential research risks to each subject, and subjects provided written informed consent before participating in the driving simulation.
Table 1.
Descriptive statistics of driver characteristics.
The choice of sample size is a critical element for an experiment. In previous driving simulator research, the number of subjects frequently ranges between 20 and 43. To statistically address the question of whether this number of subjects was sufficient for this study, a power analysis was conducted using Formula (1) [22,23,24]:
where is the upper ()th quantile of the standard normal distribution; is the upper th quantile of the standard normal distribution; and represents the meaningful difference. In practice, a value between 0.25 and 0.5 is usually chosen as δ if no prior knowledge exists [24]. Consistent with the statistical tests in this study, a 5% level of significance ( = 0.05, = 1.96) was chosen. To balance power and cost-effectiveness, a statistical power of 80% ( = 0.20, = 0.84) and a meaningful difference of = 0.5 were utilized. The calculation yielded a required minimum sample size of = 31.36 (rounded to 32). This implies that the actual sample size of 36 utilized in this study exceeds the statistical threshold, confirming that the experimental design provides adequate statistical power.
2.2.3. Testing Process
The experiment consists of a pre-experiment, a formal experiment, and post-experiment subjective questionnaires.
The pre-experiment was divided into a preparation phase and a driving simulator training phase. In the preparation phase, subjects signed the informed consent form and received experimental instructions. In the training phase, an informal scenario was selected to test the subjects’ adaptation to the simulator environment, carry out debugging scenarios (if applicable), and optimize the experimental process.
To adapt to the simulator’s dynamics and transition to steady driving, each subject first completed a 5 min warm-up drive on a 3 km route directly leading to the 1.3 km formal test section with three signalized intersections. Each subject performed the experiment only once. Due to the intersections and dynamic simulated traffic flow, the formal section lasted 5–10 min, with a total continuous exposure time of 10–15 min per subject.
During this process, the simulator’s built-in data logging module automatically and continuously recorded the subject vehicle’s kinematic parameters and surrounding traffic trajectories at a fixed frequency of 10 Hz. All raw multi-dimensional data were synchronously exported and stored to ensure lossless data collection for subsequent analysis. All subjects completed all experimental procedures without any adverse reactions to the simulator.
2.3. Data Preprocessing of Field Datasets and Driving Simulation Datasets
To ensure the consistency of spatiotemporal benchmarks and the reliability of distributions between the field and simulation datasets, this study constructed a standardized data preprocessing workflow. All data preprocessing procedures and subsequent statistical testing tasks were executed using the Python programming environment (Version 2023.1, Python Software Foundation, Wilmington, DE, USA), utilizing core libraries such as Pandas, NumPy, and SciPy for efficient data manipulation and analysis.
It should be noted that the raw field data were collected via radar and video capture, containing time-series records for each vehicle with explicit attribute fields including timestamp, speed, coordinates, and lane ID. The extraction of car-following trajectories was directly conducted based on the highly structured attributes of the raw datasets. Specifically, leader–follower vehicle pairs within the same lane were precisely and reliably matched utilizing the explicit “lane ID” field, which allowed core microscopic indicators (e.g., acceleration and time headway) to be calculated directly from authentic foundational data without complex sensor fusion or manual trajectory matching algorithms. The specific processing steps are as follows:
① Scenario Segmentation and Constraint Filtering: Continuous sequences are segmented according to the natural empty line identifiers in the raw data. Only stable car-following segments with at least two valid timestamps and a duration greater than 1.0 s are retained to filter out extremely short and invalid data.
② Unification of Spatial Coordinate Systems: The initial valid coordinates of the car-following scenario are extracted as the reference origin. The absolute latitude and longitude of the field data and the Cartesian coordinates of the simulation data are unified into relative planar coordinates from the origin to align the spatial benchmarks.
③ Down-sampling and Temporal Alignment: Using the lower sampling frequency between the two groups as the global benchmark, the timestamp alignment method is applied to extract the actual sampling values at the nearest timestamps for high-frequency sequences, avoiding the creation of false data via mathematical interpolation.
④ Outlier Removal and Smoothing: The Pauta criterion (3σ rule) is applied to identify outliers in the microscopic speed sequences. These points are replaced and smoothed using the arithmetic mean of adjacent valid points to eliminate sensor noise and ensure the continuity of kinematic characteristics.
⑤ Indicator Calculation and Skewness Correction: Core indicators such as relative speed, spacing, and time headway are synchronously calculated. Variance homogeneity transformations (square root or logarithmic transformations) are performed on indicators intended for t-tests to satisfy statistical testing prerequisites.
After applying the aforementioned triple-constraint filtering procedure, a total of 477 stable car-following segments were retained from the field dataset, and 264 segments were extracted from the driving simulator dataset. The durations of these retained continuous segments primarily ranged from 1.0 s to 15.0 s. On average, each participant contributed approximately 7–8 valid, stable car-following segments during their formal experimental episode.
2.4. Data Screening and Filtering Rules for Car-Following Scenarios
The car-following scenario aims to verify the degree to which the driving simulator reproduces longitudinal vehicle control characteristics. This scenario focuses on selecting specific driving data segments while excluding non-steady-state processes such as rapid approaching (collision risk) or rapid widening of gaps (exiting car-following), ensuring vehicles are in a relatively stable following state. The screening rules are based on a triple constraint of basic operation status, spatial gap, and dynamic characteristics:
① Basic Operation Status: Select only data segments where the subject vehicle speed is greater than 5 m/s (approx. 18 km/h) and traveling in the specified direction.
② Spatial Gap Rule: The spacing between the subject vehicle and the preceding vehicle must be maintained between 4 m and 80 m to ensure vehicles are within an effective urban car-following interaction range.
③ Dynamic Rule: The relative speed difference between the two vehicles is limited to the range of −2.5 m/s to 2.5 m/s.
These specific selection thresholds were established with reference to empirical criteria widely used in previous naturalistic driving studies to isolate stable car-following states [25,26,27].
Furthermore, to eliminate potential confounding factors stemming from scenario calibration and ensure a rigorous behavioral comparison, the speed distribution of the leading vehicles was analyzed. Because the extracted leader vehicle speeds in the driving simulator dataset were exclusively distributed within the 35–40 km/h range, the statistical characteristics are summarized in Table 2. Consequently, a strict filtering criterion was implemented: only car-following segments where the leader vehicle’s speed strictly falls within this 35–40 km/h range were extracted from both datasets for subsequent comparative analysis. Following this filtration, the final analysis dataset comprised 207 car-following segments from the driving simulator and 48 segments from the real vehicle.
Table 2.
Statistical characteristics of leader vehicle speeds in real vehicle and driving simulator datasets.
3. Methods
3.1. Subjective Assessment of Driving Simulation Platform
Subjective assessment was used to evaluate participants’ perceived fidelity and experimental acceptability of the driving simulation platform. The questionnaire covered three aspects: perceived simulation fidelity, subjective workload, and post-exposure discomfort symptoms. Objective car-following indicators derived from field trajectory data and simulator data were used for behavioral-level validation, while the subjective assessment provided supplementary information on participants’ perceived realism and task acceptability, as presented in Table 3.
Table 3.
Questionnaire measurement dimension classification table.
- (1)
- Driving Operation Fidelity Evaluation Scale: This scale is specifically designed to assess the perceived fidelity of driving operations during simulated driving. It adopts a 1–5-point simulation rating scale, where scores from 1 to 5 correspond to perception levels ranging from “completely fake” to “completely real”. Drivers provide subjective ratings for each dimension based on their actual driving experience.
- (2)
- The scale covers nine core dimensions, which are divided into three categories: overall evaluation, control system, and sensory and physical sensations. The control system category includes five dimensions: steering wheel operation fidelity, accelerator operation fidelity, brake operation fidelity, and instrument display fidelity. The sensory and physical sensations category includes four dimensions: speed perception fidelity, vibration feedback fidelity, driving comfort, and discomfort symptoms (e.g., dizziness and nausea). Scores of 1–2 indicate low perceived fidelity, 3 indicates a neutral rating, and 4–5 indicate high perceived fidelity.
- (3)
- Driving Scene Fidelity Evaluation Scale: This scale focuses on drivers’ perceptual assessment of the fidelity of simulated driving scenarios, adopting the same 1–5-point simulation rating standard as the Driving Operation Fidelity Evaluation Scale (1 = completely fake; 5 = completely real). Drivers rate each scenario dimension based on their subjective experience.
- (4)
- The scale covers 10 core dimensions, which are divided into three categories: overall scene, basic road elements, and environment and visual perception. The basic road elements category includes six dimensions: road condition fidelity, traffic sign fidelity, traffic marking fidelity, traffic facility fidelity, and ramp design fidelity. The environment and visual perception category includes four dimensions: traffic flow environment fidelity, surrounding road environment fidelity, scene three-dimensionality, and visual comfort. Scores of 1–2 indicate low perceived fidelity, 3 indicates a neutral rating, and 4–5 indicate high perceived fidelity.
- (5)
- NASA Task Load Index (NASA-TLX): The NASA-TLX was used to describe participants’ perceived workload during the simulated driving task. In this study, the Raw NASA-TLX method was adopted, and no 15-pair weighting procedure was conducted. The six dimensions were analyzed separately: Mental Demand (MD), Physical Demand (PD), Temporal Demand (TD), Effort (E), Performance (Per), and Frustration Level (FL). Each item was measured using a 0–10 rating scale. Performance was interpreted as a positive indicator reflecting participants’ satisfaction with the quality of task completion, whereas the other five dimensions reflected different aspects of perceived workload. To calculate the overall raw workload score, the Performance score was reverse coded before averaging to ensure a consistent workload direction across all six dimensions. For a 0–10 scale, the reverse-coded Performance score was calculated as 10 − Performance. The overall raw workload score was then calculated as the arithmetic mean of MD, PD, TD, E, FL, and the reverse-coded Performance score.
- (6)
- Simulator Sickness Questionnaire (SSQ): This questionnaire is designed to differentiate the assessment of motion sickness symptoms across various scenarios, covering three dimensions: eye discomfort, spatial disorientation, and nausea. It accurately captures differences in the manifestations of motion sickness across different physiological systems in diverse scenarios. The complete item descriptions and rating scales of all subjective questionnaires used in this study are provided in Appendix A.
3.2. Objective Evaluation of the Validity of the Driving Simulation Platform
3.2.1. Selection of Objective Evaluation Indicators for the Validity of the Driving Simulation Platform
In order to comprehensively quantify the fidelity of the driving simulation platform in the urban road car-following scenario, this study starts from the longitudinal control of vehicles and the dynamic interaction characteristics of human motion, and constructs an effective evaluation index system with multiple dimensions. This system selects key parameters such as speed, acceleration, the relative speed between the lead vehicle and the preceding vehicle, headway, and time headway. These indicators are not only used to verify the overall operation level and temporal-spatial evolution pattern in the driving task, but can also be used to help evaluate the spatial perception ability of drivers in the simulation environment, driver behavior in choosing a safety margin, and the dynamic feedback mechanism for changes in the state of the preceding vehicle. Based on the clear definition of these evaluation indicators, this study further conducts in-depth quantitative comparison of the validity between field data and simulation data from two key dimensions: the mean distribution and temporal sequence trend of the following scenario.
The speed indicators are used to verify the overall operational level and temporal-spatial evolution patterns in the driving task. Through macroscopic mean comparison and microscopic distribution testing, they assess whether the simulator provides accurate speed perception feedback and discrete characteristics of the traffic flow.
The acceleration index reflects the longitudinal dynamic response characteristics of the vehicle on a specific road section. This index mainly verifies whether the simulator can effectively reproduce acceleration and deceleration behavior patterns and the underlying dynamic distribution trends in the real environment.
The relative speed between the lead vehicle and the preceding vehicle is a key parameter that characterizes the dynamic interaction characteristics of vehicles during following. This index focuses on evaluating the driver’s perception sensitivity to changes in the speed of the preceding vehicle and the dynamic feedback mechanism of “following-adjusting”.
The headway focuses on evaluating the spatial position perception ability and safety margin selection behavior of the driver during the following process. The numerical distribution of this value directly reflects the fidelity of the visual simulation system in presenting depth information.
The time headway gap eliminates the influence of absolute speed differences and is a core indicator for measuring the safety of following and the psychological load of the driver. Verifying the consistency of this indicator aims to confirm whether the simulated environment has successfully induced the risk acceptance threshold and following urgency consistent with the real road.
3.2.2. Objective Evaluation Dimensions of the Validity of the Driving Simulation Platform
- Time-Series Trend Comparison of Car-Following Behavior Indicators
Regarding the issue of the dynamic synchronicity of traffic operation indicators between driving simulators and real vehicles over time, this study employs the Dynamic Time Warping (DTW) model for quantitative evaluation. Since drivers perform the same driving tasks (such as car-following and changing lanes) in different environments, their action durations and response timings often exhibit nonlinear time-axis deviations due to psychological load and operational habits. Traditional Euclidean distance cannot effectively handle the expansion and translation of the time dimension. However, the DTW algorithm, by constructing a nonlinear regularized path, can adaptively match two unequal-length time series, thereby accurately quantifying the degree of fit in waveform trends and fluctuation characteristics between the two.
To be methodologically precise, the unit of comparison for the DTW evaluation was the individual stable car-following segment. A random matching procedure was utilized: each simulated sequence was randomly paired with a field sequence, and the corresponding DTW distance was recorded for each simulated sequence. The reported average DTW distance represents the mean of these randomly paired distances. Prior to the DTW calculations, all sequences were Z-score-normalized to eliminate dimensional and scale differences. The a priori validity threshold for classifying a scenario as consistent was strictly set at a normalized DTW distance of less than 5 [32,33].
No additional normalization of DTW distances by sequence length or warping-path length is performed in this study. The retained stable car-following segments are concentrated in the 1–15 s duration range, with limited length variation that introduces no systematic bias to consistency judgment.
The simulator dataset was randomly subsampled to 48 scenarios to match the size of the field dataset, and one-to-one random pairing was performed with a fixed random seed. To mitigate the randomness of single pairing, the DTW calculation was repeated for five rounds of independent random matching, and the reported average DTW distance and consistency proportion were derived from the average value of five repetitions. After pairing, DTW distance was computed for each simulated-field scenario pair. Descriptive statistics including mean, standard deviation, minimum, maximum, and the proportion of pairs below the consistency threshold were summarized from all paired distances. Z-score normalization is performed independently for each sequence to eliminate dimension and absolute value differences, focusing the analysis on temporal waveform similarity. All core car-following indicators uniformly adopt a normalized DTW distance of less than 5 as the consistency threshold. This threshold refers to the general settings widely used in traffic trajectory time-series studies, and is adapted to the fluctuation characteristics of normalized driving behavior sequences [32,33].
The evaluation calculation process first standardizes and preprocesses the real vehicle test data and driving simulation experiment data, and extracts the sequences. This study adopts a lower sampling frequency as the benchmark to down sample the high-frequency data to unify the time granularity. At the same time, considering the non-one-to-one mapping relationship between the real vehicle and the simulation samples, the study adopts a random matching strategy, randomly selecting a field sample from the pool to pair with a simulation sample and calculating the corresponding DTW distance as the final difference measurement. In terms of validity determination, this study constructs a multi-dimensional evaluation system based on clearly defined DTW metrics. In this analysis, the DTW distance refers to the temporal alignment distance calculated between a specific simulated sequence and its randomly assigned field sequence. An a priori validity threshold is established as the maximum acceptable distance limit. A simulated car-following episode is classified as a consistent scenario strictly when its DTW distance falls below this validity threshold. These indicators collectively characterize the reconstruction accuracy of the dynamic process, thereby quantitatively verifying the validity of the temporal evolution of the simulation platform.
- 2.
- Scenario Mean Value Comparison of Car-Following Behavior Indicators
The overall mean comparison aims to conduct a macroscopic examination of the consistency between the simulated data and the actual vehicle data distribution. To evaluate the distributional association between the unpaired field (n = 48) and simulator (n = 207) datasets, an explicit size-matching and pairing methodology for the Pearson correlation analysis was established. A random subsampling procedure was first applied to the larger simulator dataset to extract an equal number of segments (n = 48), resolving the sample size imbalance. The sequence means of both equal-length datasets were then independently sorted in ascending order based on the speed of the leader vehicle. The correlation was subsequently computed across these ordered, matched sequences to ensure logical contextual alignment. This Pearson analysis evaluates trend consistency of ordered quantile distributions, rather than paired agreement of individual car-following episodes. Furthermore, to evaluate numerical agreement, the relative difference between group means for all indicators (including relative speed and acceleration) was calculated based on the rigorously filtered datasets, ensuring that the metrics mathematically align with the sequence means and accurately reflect the macroscopic deviation. The computational Formula (2) is:
In this study, an independent sample t-test (with a significance level of α = 0.05) is first used to infer the difference in means between the two groups of data. If p > 0.05, it indicates that there is no statistically significant difference between the two.
Based on this, the Pearson correlation coefficient and average relative error are introduced to construct a dual evaluation criterion to quantify the similarity of distribution patterns and numerical accuracy. The specific evaluation threshold is set as follows: when the correlation coefficient is greater than 0.85 and the relative error is less than 5%, it is determined as “absolute validity”; when the correlation coefficient is greater than 0.80 and the relative error is less than 20%, it is determined as “relative validity” [27,34,35].
For the indicators that revealed insufficient overall validity in the full-sample test (p < 0.05 and not meeting the aforementioned relative validity standards), this study further initiated the stratified validity test. The full sample is discretized based on the instantaneous vehicle speed, and the t-test and correlation analysis are re-performed within each independent speed interval. This is done to remove the distortion influence of local extreme conditions and scientifically define the applicable boundary of the driving simulation platform.
To overcome the limitations of standard t-tests—where a non-significant p-value fails to prove equivalence—the Two One-Sided Tests (TOST) equivalence testing framework was introduced. To ensure statistical independence, the sequence mean of each stable extracted car-following segment was defined as the true statistical unit for analysis. Based on the baseline characteristics and operational variance of the field dataset, the equivalence margin was established as ±15% of the field mean for each tracking indicator [36,37,38]. Statistical equivalence is formally concluded if the 90% confidence interval (CI) of the mean difference falls entirely within this predefined ±15% margin.
4. Results
4.1. Subjective Evaluation Results of the Fidelity of the Driving Simulation Platform
The subjective questionnaires used in this study are primarily intended to evaluate participants’ perceived fidelity of the simulated driving environment, operation fidelity, workload, and simulator discomfort reactions, thereby providing supporting evidence for the objective indicators derived from the real-vehicle trajectory data and simulated driving data.
4.1.1. Evaluation Results of Simulation Fidelity
The simulation fidelity was evaluated using the Driving Operation Fidelity Evaluation Scale and the Driving Scene Fidelity Evaluation Scale. To assess item consistency in the present sample, Cronbach’s α was calculated for the two fidelity evaluation scales. The Cronbach’s α values were 0.833 for the Driving Operation Fidelity Evaluation Scale and 0.952 for the Driving Scene Fidelity Evaluation Scale, indicating good internal consistency.
The Driving Scene Fidelity Evaluation Scale consists of 10 items and is divided into three categories: overall scene, basic road elements, and environment and visual perception. It uses a five-point scale for scoring, and the results are presented in Table 4. A total of 90.9% of the drivers gave a score of 4–5 for the overall fidelity, and only four people gave a score of 3 or below. The average scores of the five indicators in the basic road elements dimension are all above 4.4 points with small standard deviations, indicating that the simulator is good at reproducing the core elements of the road, which was strongly perceived by the drivers, providing subjective support for the fidelity of scene reproduction by the driving simulator.
Table 4.
Evaluation results of driving scene fidelity.
The Driving Operation Fidelity Evaluation Scale consists of nine items and is divided into three categories: overall evaluation, control system, and sensory and physical sensations. It uses a five-point scale for scoring, and the results are presented in Table 5. A total of 93.2% of the drivers gave high scores of 4–5 points for the overall fidelity of the driving operation, while only three drivers gave a score of 3 or below. The overall recognition rate is relatively high. The overall average score of driving operation fidelity in urban road scenarios is 4.41 points, indicating that drivers were satisfied with the overall performance of the driving simulation.
Table 5.
Evaluation results of driving operation fidelity.
In conclusion, both the fidelity of driving operations and the overall scene fidelity demonstrate high levels of performance. They can effectively ensure the core consistency between the simulated driving state and real driving, providing a solid subjective validity basis for the perceived fidelity and validity of the driving simulator.
4.1.2. Driving Workload Evaluation Results
The NASA-TLX scale is used to quantitatively evaluate the driver’s workload in the simulated driving scenario of urban roads. The results are presented in Table 6. The average performance score is the highest, indicating that drivers had high satisfaction with their own simulated driving operation performance and that the simulated driving task has strong acceptability, which indirectly supports the compatibility of the driving simulator’s operation logic with the real driving scene. The average mental demand is relatively high, which is consistent with the cognitive workload characteristics of complex traffic environments on real urban roads. The average values of physical demand, temporal demand, and effort are all stable at around 5 points, suggesting that the difficulty of the simulated driving task is moderate and did not cause excessive burden on the driver. Further, the average frustration level was below 4 points, indicating that the driver’s psychological state was generally stable throughout the simulated driving process.
Table 6.
Statistical table of each question in NASA-TLX.
The overall workload of the driving simulation tasks in urban road scenarios all exhibited the characteristics of moderate–high workloads in each objective demand dimension, high performance satisfaction levels, and low frustration levels, indicating that the workload of the driving simulation tasks is moderate, and the drivers’ emotional states were favorable and their satisfaction was high.
4.1.3. Evaluation Results of Physiological Symptoms
Based on the calculation method for the SSQ by Kennedy et al. [31], the procedure is as follows: the score of each symptom item is multiplied by the corresponding weights for O, D, and N. The weighted values are then summed separately for the O, D, and N categories to obtain the weighted subtotals . The O, D, and N scores are then calculated using the conversion Formulas (3)–(5). The total score (TS) is obtained by taking all weighted subtotals and applying the conversion Formula (6).
The descriptive statistics of the scores for simulated motion sickness symptom groups are presented in Table 7. Based on the calibration data of the simulator test by Kennedy et al. (including the percentile information of the motion sickness questionnaire with over 1100 observations) [31], a comparative analysis was conducted on the driving simulation motion sickness questionnaire data for this study.
Table 7.
Descriptive statistics table of Simulator Sickness Questionnaire.
The Simulator Sickness Questionnaire (SSQ) was used to evaluate the sickness risk and tolerability of the driving simulation experiment. The mean total SSQ score was 11.8, which was slightly higher than the reference value of 9.8. However, the distribution of symptom severity showed that simulator sickness was generally mild and controllable. Specifically, 86.1% of the responses indicated no simulator sickness symptoms, and 12.7% indicated only mild symptoms. Moderate or severe symptoms accounted for only 1.2% of the responses.
The slightly elevated total score was mainly associated with a small proportion of participants reporting mild symptoms, which increased the upper percentiles of the SSQ distribution. The reported symptoms were mainly slight headache, nausea, and disorientation-related discomfort, while no severe physical reactions were observed. Although the disorientation dimension showed relatively higher discomfort than the other dimensions, the overall symptom level remained low.
These results indicate that the driving simulation experiment had an acceptable simulator sickness risk profile. Most participants were able to complete the simulated driving task without obvious discomfort, and only a small proportion experienced mild symptoms. Therefore, the SSQ results support the tolerability and operational feasibility of the driving simulation platform used in this study, indicating that the experimental scenario was suitable for conducting the planned driving simulation experiment.
4.2. Objective Evaluation Results of the Validity of the Driving Simulation Platform
4.2.1. Mean Difference Analysis of Car-Following Scenarios
This section employs the independent sample t-test and Pearson correlation analysis to conduct a mean comparison of the five core car-following indicators under both field and simulated environments.
First, an independent sample t-test is performed on the mean values of each indicator to determine whether there is a significant systematic deviation at the macroscopic level. The independent sample t-tests were conducted based on the datasets extracted in Section 2.4 (n = 48 for field data and n = 207 for simulated data), with a consistent degree of freedom (df) of 253. The test results are presented in Table 8.
Table 8.
Differences between field and simulated environments for urban road car-following scenarios.
Building upon the difference test, the Pearson correlation coefficient and relative error are further calculated to quantify the similarity of the data distribution patterns and determine the validity level. The results are presented in Table 9.
Table 9.
Correlation results of core indicators for urban road car-following scenarios.
Overall, the simulation platform demonstrates good validity in the car-following scenario. From the difference test in Table 8, the p-values of headway and relative speed are greater than 0.05, indicating no significant difference from the field data. Conversely, speed, time headway, and acceleration exhibit significant mean deviations (p < 0.05). However, combined with the correlation test in Table 9, a more comprehensive evaluation is achieved. For speed and time headway, despite mean deviations, their correlation coefficients (r) are above 0.05 and 0.98, respectively (p = 0.0000), and their relative difference between means are strictly constrained within the 20% threshold, proving them to be relatively valid. The relative speed indicator also demonstrates high numerical similarity, with a correlation coefficient of 0.9443 and an average relative error of 18.55%, consistently falling within the relative validity standard. Furthermore, regarding the acceleration indicator, its correlation coefficient (r) reaches 0.9456 with a high statistical significance (p = 0.0000), and its average relative error is also strictly controlled within the acceptable 20% threshold, thereby rendering it relatively valid as well. To further verify the distributional consistency between field and simulated datasets, a Kolmogorov–Smirnov (K–S) test is performed on each core car-following indicator, with results presented in Table 10.
Table 10.
Kolmogorov–Smirnov test results of core car-following indicators.
All p-values are greater than the 0.05 significance level, indicating no statistically significant difference in the overall distribution of all five indicators between the two datasets.
To rigorously establish the validity of the driving simulation platform and move beyond the limitations of standard null-hypothesis significance testing, a Two One-Sided Tests (TOST) equivalence testing framework was introduced. The analysis was strictly performed using the sequence means of individual stable car-following segments to ensure the independence of observations. An equivalence margin of ±15% was defined based on the baseline characteristics of the field data.
As summarized in Table 11, the 90% confidence intervals (CIs) of the mean differences for speed, headway, and time headway fall entirely within their respective ±15% equivalence margins, formally demonstrating statistical equivalence between the driving simulator and real-vehicle environments for these metrics. Conversely, for relative speed and acceleration, the left endpoints of their 90% CIs slightly exceed the lower limits of the predefined equivalence margins, resulting in a conclusion of non-equivalence. Notably, all five core car-following indicators meet the relative validity standard defined by the dual criteria of Pearson correlation coefficient higher than 0.8 and relative difference between means within 20%. Among them, speed, headway, and time headway further pass the TOST equivalence test and achieve statistical equivalence between the simulation and field datasets. This outcome transparently delineates the behavioral boundaries and specific tracking limitations of the simulation platform under the examined conditions.
Table 11.
TOST equivalence test results (equivalence margin: ±15%).
4.2.2. Time-Series Trend Comparison of Car-Following Scenarios
This study adopts the DTW (Dynamic Time Warping) model to quantitatively compare the temporal dynamic characteristics of the core car-following indicators. The combined evaluation results are presented in Table 12.
Table 12.
Temporal dynamic characteristics of the core car-following indicators.
The time-series evolution comparison results demonstrate that the driving simulation platform is relatively valid in capturing the trend of the car-following waveforms. The average DTW distances of the five core indicators are all far below their respective preset validity thresholds, indicating that the simulated data and field data maintain a high degree of synchronization in their temporal sequence evolution. Among them, the proportion of consistent scenarios for relative speed, time headway, and acceleration all reached 100.0%, while for the speed and headway indicators, which exhibit larger fluctuations, their consistent proportions also reached as high as 93.6% and 94.9%, respectively. This indicates that under urban car-following conditions, the simulation platform can effectively capture the speed evolution patterns and dynamic feedback characteristics of “following-adjusting” consistent with the real environment.
5. Discussion and Conclusions
In this study, the validity of the driving simulation platform in urban road car-following scenarios was comprehensively verified from dual dimensions: subjective perception and objective quantification. Overall, the platform is evaluated as relatively valid in both microscopic time-series trend evolution and macroscopic numerical distribution.
Regarding microscopic time-series trend evolution, the simulation platform exhibits robust temporal pattern similarity. Dynamic Time Warping (DTW) analysis of the five core indicators confirms that the waveform trends of the simulated data are highly synchronized with the field data (with consistency proportions ranging from 93.6% to 100.0%). This excellent dynamic fitting performance is likely associated with the platform’s high-fidelity reconstruction of both the visual and physical space. The subjective questionnaire results align with this objective performance: drivers’ high ratings for overall scene fidelity and operation fidelity suggest that a high-confidence physical feedback environment may have contributed to authentic following and adjustment reactions from the drivers.
At the macroscopic numerical distribution level, the platform’s validity presents a clearly stratified two-level structure. All five core indicators conform to the relative similarity criterion based on Pearson correlation coefficient and mean relative difference, reaching the relative validity level. Among them, speed, headway, and time headway further meet the TOST equivalence requirement and reach the statistical equivalence level.
Specifically, speed, headway, and time headway achieve statistical equivalence via the TOST test, while relative speed and acceleration only meet the relative validity standard. Except for relative speed, which exhibited abnormal errors due to the mathematical sensitivity of the zero-value interval, the relative difference between means of all other indicators were strictly controlled within 20%, and their data distribution patterns were highly correlated with the field data. It is hypothesized that the systematic deviations observed in certain indicators (e.g., lower simulated speeds and smaller time headways) may be partly related to the absence of real physical collision risks in the virtual environment, leading drivers to adopt more conservative safety strategies. This phenomenon aligns closely with findings from numerous previous driving simulation validity studies regarding speed underestimation and risk perception differences. For instance, empirical research by Hussain et al. explicitly shows that due to the lack of real-world hazardous consequences, drivers’ perception and operation of speed in simulators tend to be conservative [3]. Drivers’ adaptability to the simulated traffic context acts as a key mediating variable in shaping this conservative behavior. The association between NASA-TLX mental demand and drivers’ distance/speed judgments remains speculative. While the high Mental Demand score (6.30) aligns with the pattern of conservative car-following behavior, NASA-TLX only reflects perceived workload and cannot directly demonstrate that increased cognitive load causes larger following time headways or specific car-following choices [17,39].
Additionally, while the traffic model was rigorously calibrated against field data, the inherent randomness of traffic flow generation across experimental runs may introduce minor behavioral variations. The DTW random-pairing analysis only verifies the simulator’s ability to generate dynamic sequences with micro-morphological consistency against real-world behaviors, but does not guarantee reproduction of the overall macroscopic probability distribution of car-following mechanisms. This limitation precisely underscores the necessity of our proposed dual-level validation framework, where the macroscopic statistical tests effectively compensate for the distributional blind spots of micro-morphological DTW analysis.
Furthermore, it must be explicitly acknowledged that our data filtering procedure strictly excluded non-steady-state processes such as rapid approaching, emergency braking, and gap widening. Therefore, all validity findings and conclusions herein are specifically limited to stable urban car-following episodes with leader vehicle speeds within the 35–40 km/h range, and should not be generalized to lower-speed, stop-and-go, transient, emergency braking, or broader urban car-following conditions. Finally, it should be noted that while power analysis indicates that the sample size (36 subjects) is statistically sufficient for the tested indicators, its relatively unbalanced demographic structure may limit the broader generalizability of the results. Therefore, these findings should be interpreted with caution, and future research should employ larger, more demographically balanced participant cohorts to further validate these behavioral mechanisms.
In addition, the authors acknowledge that the subjective questionnaires have certain limitations in the analysis of this study. They are primarily intended to provide supporting evidence for the objective indicators derived from the real-vehicle trajectory data and simulated driving data. In future research, we will further investigate the subjective questionnaires as a separate research topic for more detailed analysis.
In conclusion, the results demonstrate that the driving simulation platform achieves high perceived fidelity and acceptable workload. While the platform effectively captures the consistency of temporal trends, it exhibits systematic differences in absolute values compared to field data. Therefore, the platform demonstrates relative validity in macroscopic distributions, but claims of absolute validity should be approached with caution and warrant further critical boundary testing.
In conclusion, the driving simulation platform yields distinct validation outcomes across subjective and objective dimensions. Subjectively, it achieves high perceived fidelity in operations and visualization, acceptable task workload with high performance satisfaction, and a controllable risk of simulator sickness, establishing robust subjective fidelity. Objectively, dynamic time warping (DTW) confirms strong temporal pattern similarity, capturing synchronized waveform trends across all five car-following indicators (speed, relative speed, headway, time headway, and acceleration). Macroscopically, the platform exhibits satisfactory relative aggregate similarity. However, true absolute behavioral validity is unsupported; significant statistical differences in average values persist for speed, time headway, and acceleration compared to field data. Consequently, the platform is highly reliable for relative behavioral consistency and trend replication, while strict absolute validity remains unsupported and constrained within clear boundaries.
Finally, several limitations of this study should be noted. First, the findings are restricted to stable urban car-following segments with leader vehicle speeds in the 35–40 km/h range, as transient behaviors such as rapid approaching and emergency braking were excluded from the dataset. Second, while the power analysis demonstrates that the sample size of 36 subjects is statistically sufficient for the analyzed indicators, the relatively unbalanced demographic structure might limit the broader generalizability of the conclusions. Lastly, the subjective questionnaires primarily provide supporting evidence, and a more comprehensive investigation is warranted as an independent research topic in the future. Statistically, multiple segments may come from the same participant in the simulator dataset, and anonymous field data cannot exclude repeated segments from the same vehicle or leader–follower pair. No cluster-robust methods were applied to address this potential clustering, which is a statistical limitation of the current analysis. DTW results generated via random matching contain inherent random fluctuations. Furthermore, DTW only characterizes the waveform similarity of normalized time series, which can merely act as evidence of temporal pattern similarity and cannot be regarded as proof of absolute driving behavior validity.
Author Contributions
Conceptualization, C.W. and J.L.; methodology, C.W. and J.L.; formal analysis, C.L., Y.Z. and Y.B.; investigation, Z.W., W.D. and Q.F.; writing—original draft preparation, C.W., J.L. and C.L.; writing—review and editing, C.W., J.L., Y.Z. and Y.B.; visualization, Z.W., W.D. and Q.F.; supervision, J.L.; project administration, C.W. and J.L.; funding acquisition, C.W. and J.L. All authors have read and agreed to the published version of the manuscript.
Funding
This research was funded by the Key Technologies Research of Collaborative Optimization and Simulation Testing for Expressway Mixed Flow Scenarios (Shandong Provincial Transportation Science and Technology Project, No. 2025BAI21-03), the Future Expressway System Construction and Key Technologies for Simulation Testing (Shandong Hi-speed Group Science and Technology Program, No. HS2024B084), project ZR2024LZN019 supported by the Shandong Provincial Natural Science Foundation, and the State Key Lab of Intelligent Transportation Systems (for the research on Closed-Loop Intelligent Vehicle-Road Test Methods and Technology Systems Combining Virtual and Reality), and the Applied Research on Driving Simulation Technology (Science and Technology Program of Shandong Provincial Communications Planning and Design Institute Group Co., Ltd., No. KJ-2022-SJYJT-22).
Institutional Review Board Statement
Ethical review and approval were waived for this study due to the simulated driving activity involved no greater than minimal risk to participants and the data collection is non-invasive in this study.
Informed Consent Statement
Informed consent was obtained from all subjects involved in the study.
Data Availability Statement
The data that support the findings of this study are available on request from the corresponding author [J.L.] upon reasonable request.
Acknowledgments
The authors gratefully appreciate all the support received for this research.
Conflicts of Interest
Chengcheng Wang, Chenxi Li and Yufeng Bi were employed by the Shandong Hi-Speed Group, and Yunfan Zhang was employed by the Shandong Provincial Communications Planning and Design Institute Group Co., Ltd. The remaining authors declare that the research was conducted in the absence of any commercial or financial relationships that could be construed as a potential conflict of interest.
Appendix A
Table A1.
Driving Operation Fidelity Evaluation Scale. Participants rated each item according to their perceived fidelity of driving operations during the simulated driving task. Each item was scored on a 1–5 rating scale, where 1 indicates completely fake and 5 indicates completely real.
Table A2.
Driving Scene Fidelity Evaluation Scale. Participants rated each item according to their perceived fidelity of the simulated driving scenario. Each item was scored on a 1–5 rating scale, where 1 indicates completely fake and 5 indicates completely real.
Table A3.
NASA-TLX.
Table A4.
Simulator Sickness Questionnaire, SSQ. Participants reported simulator sickness symptoms after the driving simulation experiment. Each symptom was rated using four severity levels: none, slight, moderate, and severe, corresponding to scores of 0, 1, 2, and 3, respectively. The nausea, oculomotor, disorientation, and total scores were calculated following the standard SSQ scoring procedure.
References
- Zhang, S.; Zhao, C.; Zhang, Z.; Lv, Y. Driving simulator validation studies: A systematic review. Simul. Model. Pract. Theory 2025, 138, 103020. [Google Scholar] [CrossRef] [Scilit]
- Llopis-Castelló, D.; Camacho-Torregrosa, F.J.; Marín-Morales, J.; Pérez-Zuriaga, A.M.; García, A.; Dols, J.F. Validation of a Low-Cost Driving Simulator Based on Continuous Speed Profiles. Transp. Res. Rec. 2016, 2602, 104–114. [Google Scholar] [CrossRef] [Scilit]
- Hussain, Q.; Alhajyaseen, W.K.M.; Pirdavani, A.; Reinolsmann, N.; Brijs, K.; Brijs, T. Speed perception and actual speed in a driving simulator and real-world: A validation study. Transp. Res. Part F Traffic Psychol. Behav. 2019, 62, 637–650. [Google Scholar] [CrossRef] [Scilit]
- Andriola, C.; Di Rado, G.R.; Presta García, D.S.; Nodari, C.T. Classification of driving simulators validation: A case study using an immersive driving simulator. Accid. Anal. Prev. 2025, 213, 107944. [Google Scholar] [CrossRef] [Scilit] [PubMed]
- Zhao, X.; Dong, W.; Li, J.; Liu, Q.; Ju, Y. How does the mural decoration of the long tunnel sidewall affect the driver’s speed control ability? Tunn. Undergr. Space Technol. 2022, 130, 104731. [Google Scholar] [CrossRef] [Scilit]
- Orsini, F.; Baldassa, A.; Grassi, M.; Cellini, N.; Rossi, R. Music as a countermeasure to fatigue: A driving simulator study. Transp. Res. Part F Traffic Psychol. Behav. 2024, 103, 290–305. [Google Scholar] [CrossRef] [Scilit]
- Zhu, J.; Han, Y.; Li, X.; Sun, Y. Variable-frequency flashing brake lights enhance driver safety in distracted and foggy driving conditions. Int. J. Ind. Ergon. 2026, 113, 103929. [Google Scholar] [CrossRef] [Scilit]
- Ju, Y.; Chen, F.; Li, X.; Shi, H. Does visual-audio feedback impair response performance and increase workload? using detection response task and NASA-TLX to examine the effect of the HMI information on driver performance at unsignalized intersections. Accid. Anal. Prev. 2025, 214, 107972. [Google Scholar] [CrossRef] [Scilit] [PubMed]
- Wu, Y.; Yu, H.; Yan, Z.; Xu, H. Dissociating ethical dilemma preferences and actions in autonomous driving by survey and driving experiment. Transp. Res. Part A Policy Pract. 2026, 206, 104891. [Google Scholar] [CrossRef] [Scilit]
- Fisher, D.L.; Rizzo, M.; Caird, J.; Lee, J.D. Handbook of Driving Simulation for Engineering, Medicine, and Psychology, 1st ed.; CRC Press: Boca Raton, FL, USA, 2011. [Google Scholar] [CrossRef] [Scilit]
- Blaauw, G.J. Driving Experience and Task Demands in Simulator and Instrumented Car: A Validation Study. Hum. Factors J. Hum. Factors Ergon. Soc. 1982, 24, 473–486. [Google Scholar] [CrossRef] [Scilit]
- Himmels, C.; Parduzi, A.; Fischer, M.; Riener, A. Towards a Common Understanding of Driving Simulator Validity. In Proceedings of the 15th International Conference on Automotive User Interfaces and Interactive Vehicular Applications 2023, Ingolstadt, Germany, 18–22 September 2023; pp. 191–196. [Google Scholar] [CrossRef] [Scilit]
- Godley, S.T.; Triggs, T.J.; Fildes, B.N. Driving simulator validation for speed research. Accid. Anal. Prev. 2002, 34, 589–600. [Google Scholar] [CrossRef] [Scilit] [PubMed]
- Bham, G.H.; Leu, M.C.; Vallati, M.; Mathur, D.R. Driving simulator validation of driver behavior with limited safe vantage points for data collection in work zones. J. Saf. Res. 2014, 49, 53.e51-60. [Google Scholar] [CrossRef] [Scilit] [PubMed]
- Wynne, R.A.; Beanland, V.; Salmon, P.M. Systematic review of driving simulator validation studies. Saf. Sci. 2019, 117, 138–151. [Google Scholar] [CrossRef] [Scilit]
- Gupta, M.; Velaga, N.R. Validation of motorized two-wheeler virtual environment: Influence of perceived realism and simulator fidelity. Transp. Res. Part F Traffic Psychol. Behav. 2025, 109, 672–688. [Google Scholar] [CrossRef] [Scilit]
- Klüver, M.; Herrig, C.; Heinrich, C.; Schöner, H.-P.; Hecht, H. The behavioral validity of dual-task driving performance in fixed and moving base driving simulators. Transp. Res. Part F Traffic Psychol. Behav. 2016, 37, 78–96. [Google Scholar] [CrossRef] [Scilit]
- Milleville-Pennel, I.; Charron, C. Do mental workload and presence experienced when driving a real car predispose drivers to simulator sickness? An exploratory study. Accid. Anal. Prev. 2015, 74, 192. [Google Scholar] [CrossRef] [Scilit] [PubMed]
- Igoshina, E.; Russo, F.A.; Shewaga, R.; Haycock, B.; Keshavarz, B. The relationship between simulator sickness and driving performance in a high-fidelity simulator. Transp. Res. Part F Traffic Psychol. Behav. 2022, 89, 478–487. [Google Scholar] [CrossRef] [Scilit]
- Czaban, M.; Himmels, C. Investigating simulator validity by using physiological and cognitive stress indicators. Transp. Res. Part F Traffic Psychol. Behav. 2025, 114, 831–851. [Google Scholar] [CrossRef] [Scilit]
- Li, J.; Zhao, X.; Xu, S.; Ma, J.; Rong, J. The Study of Driving Simulator Validation for Physiological Signal Measures. Procedia-Soc. Behav. Sci. 2013, 96, 2572–2583. [Google Scholar] [CrossRef] [Scilit]
- Chow, S.C.; Shao, J.; Wang, H.; Lokhnygina, Y. Sample Size Calculations in Clinical Research; Chapman and Hall/CRC: Boca Raton, FL, USA, 2017. [Google Scholar] [CrossRef] [Scilit]
- Uang, S.T.; Hwang, S.L. Effects on driving behavior of congestion information and of scale of in-vehicle navigation systems. Transp. Res. Part C Emerg. Technol. 2003, 11, 423–438. [Google Scholar] [CrossRef] [Scilit]
- Yang, L.; Bian, Y.; Zhao, X.; Ma, J.; Liu, X. Experimental research on the effectiveness of navigation prompt messages based on a driving simulator: A case study. Cogn. Technol. Work 2021, 23, 439–458. [Google Scholar] [CrossRef] [Scilit]
- Wang, X.; Zhu, M. Calibrating and validating car-following models on urban expressways for chinese drivers using naturalistic driving data. China J. Highw. Transp. 2018, 31, 129–138. Available online: https://zgglxb.chd.edu.cn/EN/Y2018/V31/I9/129 (accessed on 24 March 2026).
- Liu, C.; He, Y.L.; Liu, F.H.; Chen, Y.F. Impact of trucks on traffic flow in expressway diverging areas. Digit. Transp. Saf. 2026, 5, 1–9. [Google Scholar] [CrossRef] [Scilit]
- Wang, W.; Xi, J.; Zhao, D. Learning and inferring a driver’s braking action in car-following scenarios. IEEE Trans. Veh. Technol. 2018, 67, 3887–3899. [Google Scholar] [CrossRef] [Scilit]
- Gong, M. Study on the Effectiveness of Visibility Characteristics of Driving Simulators. Ph.D. Thesis, Beijing University of Technology, Beijing, China, 2011. [Google Scholar]
- Hart, S.G.; Staveland, L.E. Development of NASA-TLX (Task Load Index): Results of Empirical and Theoretical Research. In Human Mental Workload; Hancock, P.A., Meshkati, N., Eds.; North-Holland: Amsterdam, The Netherlands, 1988; pp. 139–183. [Google Scholar] [CrossRef] [Scilit]
- Chaumillon, R.; Romeas, T.; Paillard, C.; Bernardin, D.; Giraudet, G.; Bouchard, J.-F.; Faubert, J. The Use of Transdermal Scopolamine to Solve Methodological Issues Raised by Gender Differences in Susceptibility to Simulator Sickness. Transp. Res. Part F Traffic Psychol. Behav. 2017, 47, 42–58. [Google Scholar] [CrossRef] [Scilit]
- Kennedy, R.S.; Lane, N.E.; Berbaum, K.S.; Lilienthal, M.G. Simulator Sickness Questionnaire: An Enhanced Method for Quantifying Simulator Sickness. Int. J. Aviat. Psychol. 1993, 3, 203–220. [Google Scholar] [CrossRef] [Scilit] [PubMed]
- Zhang, L.; Li, T.; Zheng, X.; Kang, W.; Fu, Y. Unsupervised Driving Behavior Primitive Inference via Hierarchical Segmentation and Context-Aware Clustering. Sensors 2026, 26, 2744. [Google Scholar] [CrossRef] [Scilit] [PubMed]
- Liu, W.; Li, H.; Zhang, H. Dangerous Driving Behavior Recognition Based on Hand Trajectory. Sustainability 2022, 14, 12355. [Google Scholar] [CrossRef] [Scilit]
- Bai, C.; Jing, J.; Liu, B.; Yao, W.; Yang, C.; Alagbé, A.J.; Jin, S. Exploring Heterogeneity in Car-Following Behaviors Based on Driver Visual Characteristics: Modeling and Calibration. J. Adv. Transp. 2023, 2023, 5583081. [Google Scholar] [CrossRef] [Scilit]
- Zhang, Y.; Zhang, Y.; Guo, Z.; Guo, Z.; Li, Z.; Li, Z. Driving Simulator Validation Study Under Car-following Condition. J. Tongji Univ. (Nat. Sci.) 2020, 48, 1765–1773. [Google Scholar] [CrossRef]
- Himmels, C.; Weigl, K.; Riener, A.; Venrooij, J. Establishing driving simulator validity: Drawbacks of null-hypothesis significance testing when compared to equivalence tests and Bayes factors. Theor. Issues Ergon. Sci. 2024, 25, 546–566. [Google Scholar]
- Lakens, D.; Scheel, A.M.; Isager, P.M. Equivalence testing for psychological research: A tutorial. Adv. Methods Pract. Psychol. Sci. 2018, 1, 259–269. [Google Scholar] [CrossRef] [Scilit]
- Schuirmann, D.J. A comparison of the two one-sided tests procedure and the power approach for assessing the equivalence of average bioavailability. J. Pharmacokinet. Biopharm. 1987, 15, 657–680. [Google Scholar] [CrossRef] [Scilit] [PubMed]
- Matute-Peaspan, J.A.; Zubizarreta-Pico, A.; Diaz-Briceno, S.E. A Vehicle Simulation Model and Automated Driving Features Validation for Low-Speed High Automation Applications. IEEE Trans. Intell. Transp. Syst. 2021, 22, 7772–7781. [Google Scholar] [CrossRef] [Scilit]

Disclaimer/Publisher’s Note: The statements, opinions and data contained in all publications are solely those of the individual author(s) and contributor(s) and not of MDPI and/or the editor(s). MDPI and/or the editor(s) disclaim responsibility for any injury to people or property resulting from any ideas, methods, instructions or products referred to in the content. |
© 2026 by the authors. Licensee MDPI, Basel, Switzerland. This article is an open access article distributed under the terms and conditions of the Creative Commons Attribution (CC BY) license.