


Abstract
This study examines the potential effect of hypothetical Urban Air Mobility (UAM) demand redistribution on congestion and signalized intersection performance in the urban environment of Topoľčany, Slovakia. Based on a calibrated microsimulation model, scenarios involving the redistribution of a portion of ground traffic demand away from the road network were analyzed at 30% and 50% during the morning peak period. The evaluation focused primarily on travel times and intersection load. The results indicate that a moderate reduction in ground traffic demand leads to a significant reduction in travel times and traffic intensity. The most substantial improvement was observed in the 30% redistribution scenario. In comparison, a further increase to 50% did not yield proportional benefits, suggesting a nonlinear threshold effect in the transport system’s performance. It should be emphasized that the UAM scenarios in this study do not represent a full operational simulation of Urban Air Mobility, including aerial corridors, vertiports, waiting times, intermodal transfers, or airspace capacity. Instead, they represent demand redistribution scenarios used to evaluate the response of the existing signalized road network to reduced ground traffic demand. The study identifies limitations arising from simplified model assumptions and the absence of broader environmental, operational, and social considerations. Nevertheless, the findings show that even a moderate reduction in road traffic demand, potentially associated with future multimodal mobility concepts, can contribute to improved traffic efficiency in congested urban networks.
1. Introduction
Urban mobility in contemporary cities is facing increasing challenges, including rising traffic volumes, intersection congestion, and the ongoing need to implement more efficient and sustainable solutions in transport infrastructure and traffic management systems [1,2]. These factors, combined with rapid urbanization and increasing urban density, lead to longer travel times, growing traffic congestion, and an overall decline in quality of life in cities [3,4]. In this context, the Smart Cities concept is gaining increasing importance as a comprehensive framework that leverages digital technologies, data-driven planning, and innovative mobility solutions to enhance the efficiency and sustainability of urban systems [5,6].
One of the key pillars of the Smart Cities concept is the integration of intelligent mobility solutions that can respond to dynamically changing traffic demand while minimizing the negative impacts of conventional ground transportation [7]. In this context, Urban Air Mobility (UAM) represents a promising new layer of mobility that enables bypassing congested road infrastructure by using airspace. Its implementation requires advanced transport and information systems to ensure route planning, movement coordination, and integration with other modes of transport [8]. By redirecting a portion of traffic demand into the airspace, UAM can contribute to reduced travel times, lower traffic load, and improved quality of life in urban areas. Previous research has focused on the technical, operational, and regulatory aspects of UAM, as well as its synergy with Smart City strategies, particularly in terms of reducing congestion and emissions and supporting multimodal integration [9,10,11].
Despite these findings, there remains a need for a quantitative evaluation of UAM’s impact in specific urban conditions, particularly in areas with persistently high traffic loads. This paper builds on previous research focused on optimizing transport infrastructure and signal control plans at five key intersections in the city of Topoľčany [12]. The aforementioned research employed a calibrated microsimulation model developed in Aimsun 8, based on data collected via video detection and automated traffic counting. Despite the implemented optimization measures, traffic congestion during the morning peak period remained a significant issue.
Although existing studies provide important knowledge on UAM technologies, airspace organization, passenger acceptance, environmental impacts, and multimodal integration, fewer studies directly quantify how a hypothetical shift in part of urban travel demand away from the road network affects conventional road traffic parameters at the intersection level. In particular, the relationship between different levels of demand redistribution and nonlinear changes in travel time at signalized intersections remains insufficiently explored. This creates a research gap between broad conceptual UAM studies and detailed traffic-engineering analyses of urban road network performance. The present study addresses this gap by using a calibrated microsimulation model to evaluate how selected levels of hypothetical UAM-related demand redistribution influence travel times and traffic load at signalized intersections.
The present study therefore extends the previously published assessment of the same urban road network by examining how the analyzed signalized intersections respond to hypothetical reductions in ground traffic demand. While the previous study focused on the evaluation of existing traffic conditions and the optimization of signal control, the present paper investigates whether a nonlinear threshold effect can be observed when part of the traffic demand is redistributed away from the road network [12].
In this study, Urban Air Mobility (UAM) is not modeled as a complete operational aerial transport system. The analysis does not include aerial corridors, vertiport locations, airspace capacity, passenger access and egress, waiting times, or intermodal transfer processes. Instead, UAM is used as a conceptual demand redistribution mechanism. Two hypothetical scenarios were created in which 30% and 50% of ground traffic demand were removed from the analyzed road network. This approach makes it possible to evaluate the sensitivity of the existing signalized road network to different levels of reduced traffic demand and to identify whether further reductions continue to generate proportional improvements in traffic performance [13].
The simulation results demonstrated that partial implementation of UAM leads to a significant reduction in travel times and intersection load. The most pronounced improvement was observed at a 30% UAM share, whereas increasing to 50% did not yield proportional benefits, suggesting a threshold effect in intersection performance. At the same time, the reduction in ground traffic intensity leads to lower exposure to traffic interactions, suggesting potential indirect safety benefits, such as reduced conflict situations.
The aim of this study is to evaluate the response of the analyzed signalized road network to hypothetical traffic demand redistribution associated with the potential future role of UAM within a Smart City transport system. The specific objectives are:
- to analyze the acquisition, processing, and utilization of traffic data within modern information systems in the transport planning process,
- to quantify the reduction in travel time resulting from the partial implementation of UAM,
- to identify the level of traffic load at which UAM achieves the highest efficiency,
- to visualize traffic impacts through simulation outputs,
- to support data-driven decision-making within Smart City initiatives.
To verify these objectives, the following hypotheses were formulated:
- Hypothesis 1: A hypothetical redistribution of part of the ground traffic demand to an alternative UAM layer leads to a measurable reduction in travel time at signalized intersections during peak traffic periods.
- Hypothesis 2: Increasing the hypothetical redistribution of ground traffic demand from 30% to 50% leads to further proportional improvement in intersection performance.
2. Materials and Methods
This chapter describes the process of traffic data collection, the development and calibration of the microsimulation model, and the methodology for scenario creation, through which Urban Air Mobility (UAM) was integrated into the study’s analytical framework. It also addresses the approach to estimating travel times. It justifies the analysis’s focus on peak traffic periods, which represent the most critical conditions for transport system performance.
2.1. Study Area and Traffic Survey
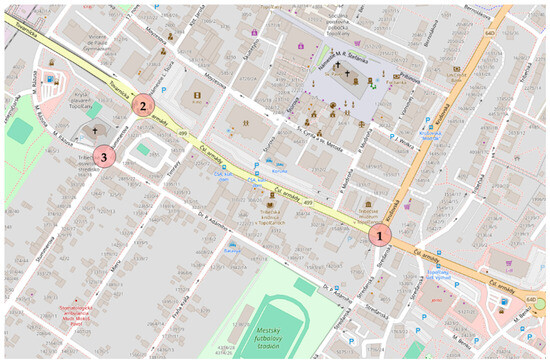
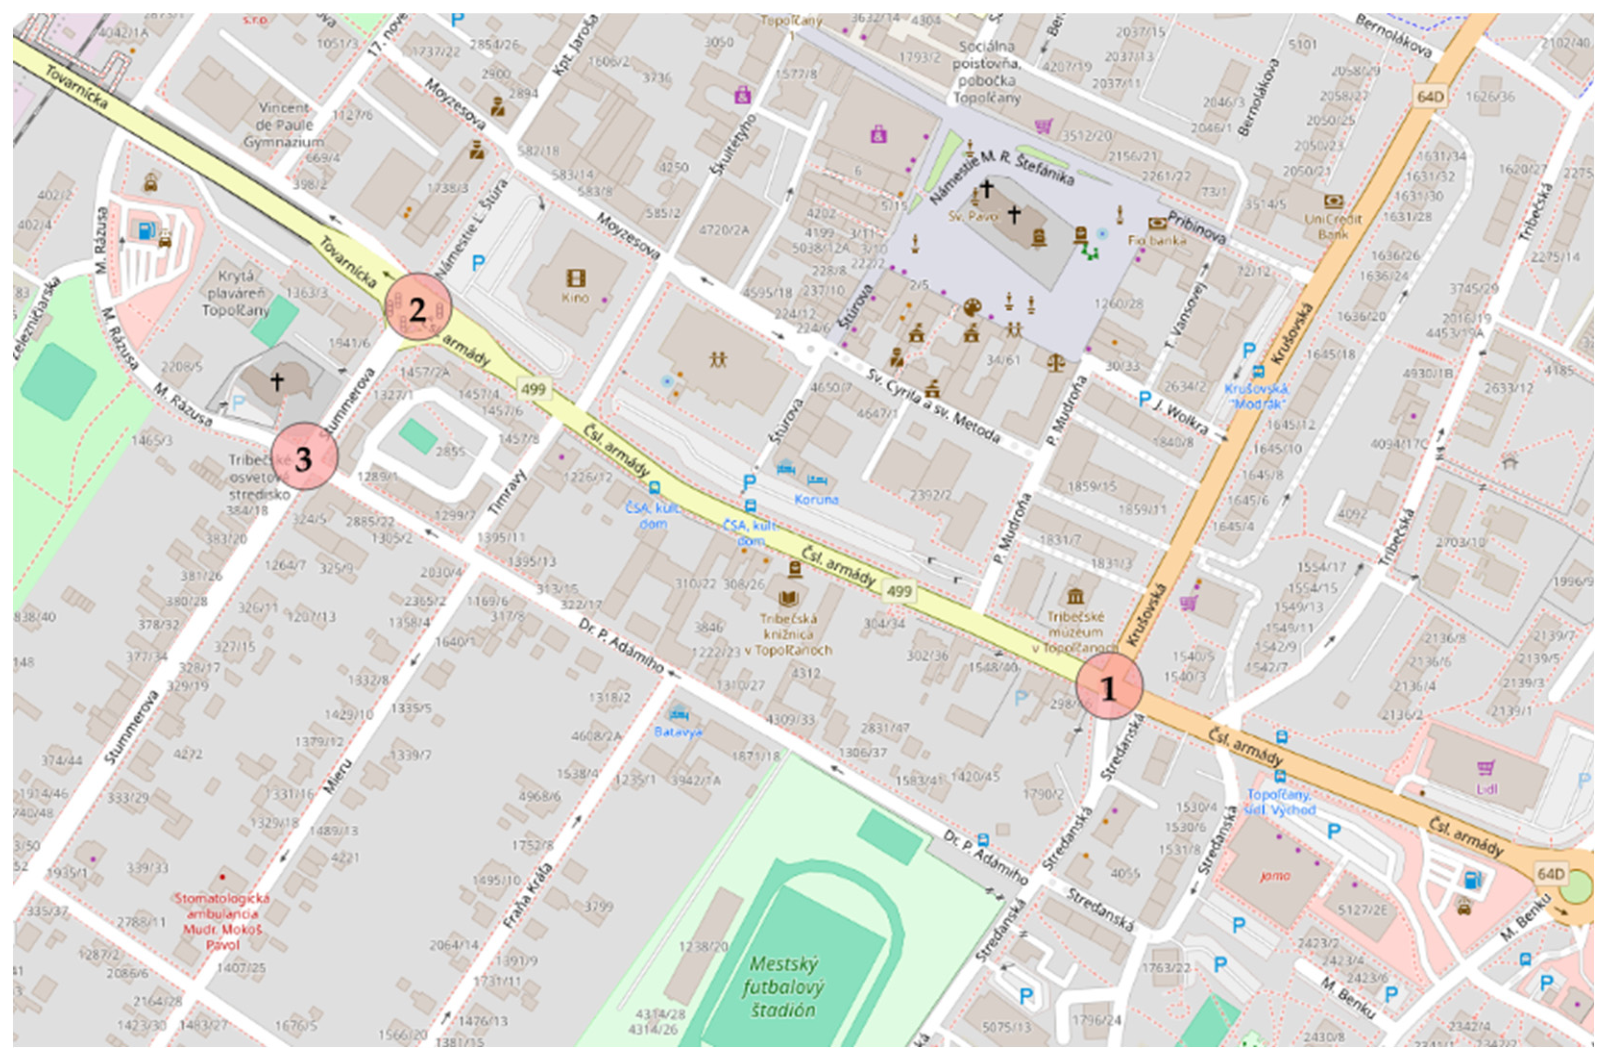
The study focuses on three selected signalized intersections in the city of Topoľčany (Slovakia), which were identified as key nodes of the urban transport network due to their traffic importance and impact on traffic flow. These intersections were selected from an original set of five analyzed locations. One of the excluded intersections serves exclusively pedestrian traffic and was therefore not included in the analysis of traffic flow redistribution.
The selected intersections are located on major transport corridors and play a significant role in urban mobility. Intersection No. 1 is dynamically controlled, with signal phase lengths adaptively adjusted based on data from a vehicle detection system. In contrast, intersections No. 2 and No. 3 operate using fixed-time signal control plans [14].
A specific feature of intersection No. 3 is the closure of one incoming approach due to a one-way street, which affects the distribution of traffic flows and the potential for redistribution. This configuration provides suitable conditions for comparing intersection performance under different UAM implementation scenarios. The spatial arrangement of the analyzed intersections and their interconnection within the transport network is illustrated in Figure 1.
Figure 1.
Surveyed area, based on OpenStreetMap.
The survey covered both the morning and afternoon peak periods and off-peak hours, with measurements conducted under favorable weather conditions. Data collection was performed using camera-based video detection systems installed at each analyzed intersection. This approach enabled recording traffic intensity, vehicle categories, and movement directions. Video detection is currently a standardized, widely used method for traffic data collection, serving as a basis for evaluating the performance of transport infrastructure and as an input component of transport information systems [15,16].
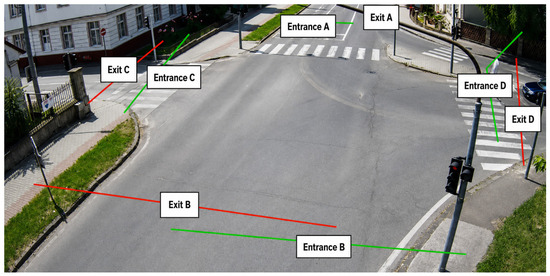
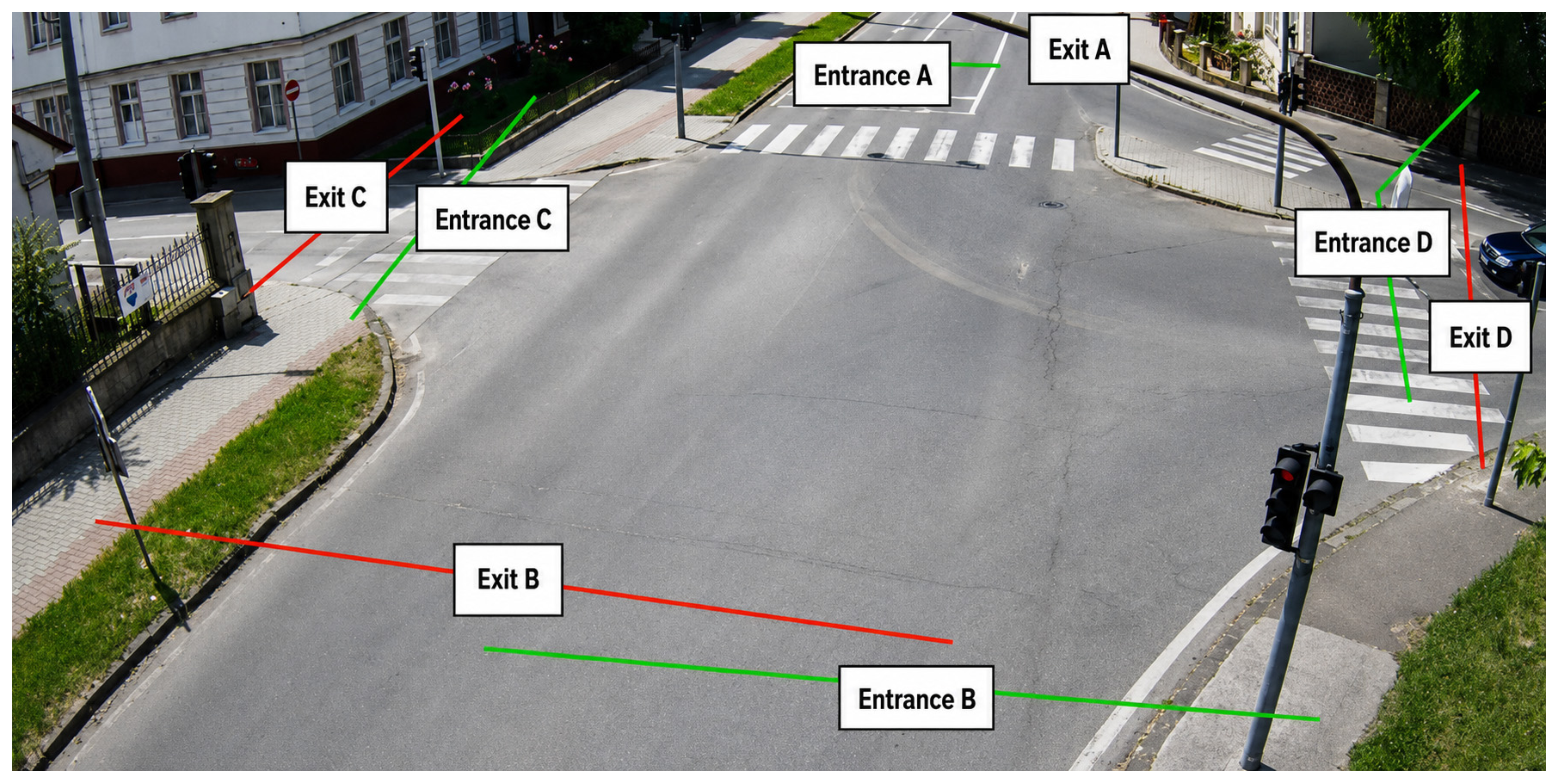
To ensure accurate and comprehensive data collection, each intersection was equipped with dedicated entry and exit gates for individual traffic lanes (Figure 2). This setup enabled precise measurement of traffic flow intensity and classification of vehicles into passenger cars, heavy vehicles, and public transport vehicles. The resulting dataset served as a key input for the development and calibration of the microsimulation model. It formed an integral component of the transport information system used in the analysis.
Figure 2.
Entry and exit points.
2.2. Simulation Model Development
The simulation model was developed using the microsimulation software Aimsun 8, which is among the leading tools used for planning and modeling urban transport systems [17,18,19]. Input data included traffic volumes, vehicle classification by type, turning movements, and signal control plans for each analyzed intersection. These data were obtained from a detailed 13-h traffic survey.
Model calibration was carried out based on measured travel times along predefined sections between individual intersections [20,21]. In the simulation environment, reference sections corresponding to real distances within the analyzed area were created. Subsequently, observed travel times were compared with simulated values, and model parameters, particularly vehicle speeds, were iteratively adjusted to minimize differences between the simulation and real-world conditions. This procedure ensured sufficient model accuracy in reproducing the current traffic situation.
The calibration process also accounted for delays at intersections and interactions between vehicles, especially when vehicles stop at traffic signals. Although the microsimulation approach cannot fully capture the complexity of driver behavior, it provides a sufficiently reliable estimate of travel times suitable for evaluating traffic scenarios.
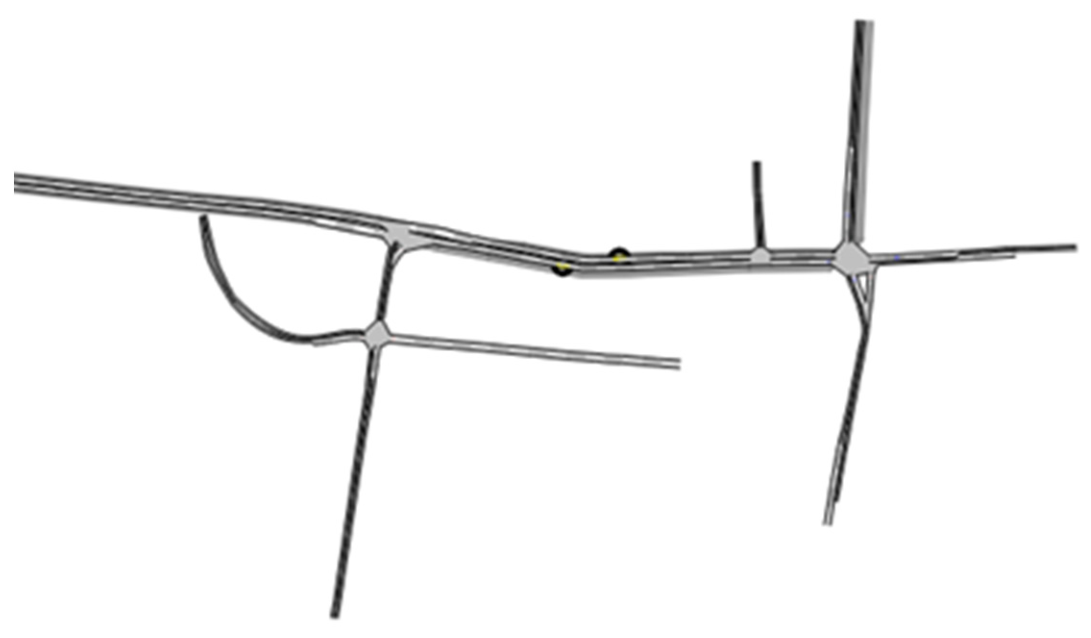
A graphical representation of the modeled road network in the Aimsun environment is shown in Figure 3. The visualization highlights key segments, signalized intersections, and the overall structure of the transport system used in the analysis.
Figure 3.
Road infrastructure created in Aimsun 8.
The final calibrated model achieved a satisfactory level of agreement with the measured travel times, ensuring the reliability of subsequent analyses of the individual simulation scenarios.
2.3. Scenario Development
To evaluate the traffic-engineering effect of a hypothetical Urban Air Mobility (UAM)-related demand redistribution, two demand reduction scenarios were developed in addition to the baseline simulation. The baseline scenario represents the existing traffic conditions without any redistribution of ground traffic demand. The two additional scenarios represent hypothetical situations in which a selected share of trips is no longer performed by ground vehicles within the analyzed road network.
- Scenario 1: A 30% reduction in ground traffic demand within the analyzed road network.
- Scenario 2: A 50% reduction in ground traffic demand within the analyzed road network.
The selected 30% and 50% levels do not represent a forecast of actual UAM adoption. Instead, they were defined as hypothetical sensitivity levels representing moderate and high reductions in ground traffic demand. The 30% scenario was used to evaluate whether a partial reduction in road traffic demand is sufficient to produce a measurable improvement in intersection performance, while the 50% scenario was used to test whether a substantially higher reduction produces proportional additional benefits. This design supports the identification of a possible nonlinear threshold effect in the analyzed road network.
In both scenarios, the existing ground traffic volumes were proportionally reduced in the microsimulation model. This reduction was used to represent the assumed effect of a partial modal shift to an alternative aerial mobility layer. However, it should be emphasized that this approach does not represent a complete operational simulation of an Urban Air Mobility system. The model does not include aerial corridors, vertiport locations, vertiport capacity, airspace capacity, passenger access and egress times, waiting times, intermodal transfer processes, operating costs, or different propulsion and fuel systems.
Therefore, the scenarios should be interpreted as hypothetical demand redistribution scenarios rather than as a full multimodal UAM simulation. The purpose of this approach is to evaluate how the existing signalized road network responds to selected levels of reduced ground traffic demand and to identify whether the relationship between traffic demand reduction and travel-time improvement is proportional or nonlinear.
This methodological simplification was selected because the primary objective of the study is not to design or optimize a complete UAM transport system, but to assess the response of the road network under different demand reduction levels. In this context, UAM is used as a conceptual demand redistribution mechanism, while the main traffic-engineering focus is the identification of a possible congestion threshold effect in the analyzed signalized intersections.
2.4. Determination of Travel Times
For each scenario, the average travel times across the selected intersections were determined from the microsimulation model outputs in the Aimsun environment. Travel time included both actual driving time and delays occurring at signalized intersections, thereby reflecting the combined influence of traffic flow conditions, traffic demand levels, and signal control strategies.
The average travel time was calculated as the arithmetic mean of travel times recorded for individual vehicles passing through the analyzed section, ensuring a representative evaluation of overall traffic performance. This calculation approach allows for consistent comparison between different simulation scenarios and serves as a fundamental indicator of transport system efficiency (see Equation (1)):
where
- represents the average travel time;
- is the travel time of the i-th vehicle;
- n is the total number of vehicles included in the analysis.
For comparison purposes, the reference travel time for Urban Air Mobility (UAM) was estimated based on the direct distance between the analyzed points and the assumed operational speed of UAM, according to Equation (2):
where
- d represents the distance of the transport corridor;
- v is the assumed operational speed of UAM.
This travel time was assumed constant across all scenarios, thereby providing a reference framework for comparing UAM performance with ground transportation under different traffic loads.
Such a defined methodological approach enables quantitative comparison of individual scenarios while also supporting the use of simulation and transport information systems in evaluating the efficiency of urban transport operations.
2.5. Selection of Peak Hour Periods
Although the traffic survey covered a 13-h period, this study focuses on the morning peak interval, which represents the most critical conditions for transport system performance. This period was selected based on observed traffic conditions, as it exhibited the highest levels of congestion, queue formation, and delay. At the same time, the morning peak reflects a stable, recurring demand pattern, making it suitable for consistent comparison across different simulation scenarios.
Focusing on peak conditions allows the transport system to be evaluated under maximum load, where vehicle interactions, queue spillbacks, and signal-related delays are most pronounced. Under such circumstances, even small changes in traffic demand can lead to significant variations in system performance. Therefore, the redistribution of a portion of traffic demand to Urban Air Mobility (UAM) has the greatest potential to produce measurable improvements in traffic flow and reductions in travel time.
This approach differs from previous studies of the analyzed area, which used aggregated daily data to evaluate traffic conditions. While daily averages provide a general overview of traffic performance, they tend to smooth out short-term fluctuations and may underestimate the severity of congestion during peak periods. In contrast, an analysis based on time-specific intervals enables a more detailed examination of system behavior under critical conditions. It allows for a more accurate assessment of the effectiveness of the proposed measures.
From the perspective of transport information systems, this approach supports the use of time-dependent data. It facilitates the design of adaptive traffic management strategies to optimize system performance during periods of high demand. Such strategies are essential for improving the efficiency and reliability of urban transport systems, particularly in Smart City applications, where real-time data and dynamic control are key to decision-making.
The measured corridor distances between the analyzed intersections and their selected entrance points, which were used for the calculation of reference UAM travel times, are summarized in Table 1.
Table 1.
Measured distances.
To ensure comparability, the travel time for Urban Air Mobility (UAM) was calculated using a constant speed along the defined routes. In contrast, travel times for ground transportation were obtained directly from the simulation outputs. The subsequent analysis compares the baseline condition with scenarios with 30% and 50% UAM shares during the morning peak period.
Although the original 13-h traffic survey also covered off-peak periods, the hypothetical demand redistribution scenarios in the present study were evaluated only for the morning peak period. This choice was made because the morning peak represents the most critical operating condition of the analyzed network, when traffic demand is closest to the capacity of the signalized intersections and nonlinear congestion effects are most likely to occur. Off-peak periods generally operate under lower traffic demand and are less likely to produce comparable threshold behavior. Nevertheless, a systematic comparison between peak and off-peak regimes was not included in the present study and is recognized as a limitation. Future research should extend the analysis to multiple daily periods in order to determine whether the observed threshold effect also occurs under lower traffic demand conditions [12].
3. Results
This section presents the results of the microsimulation analysis for the baseline scenario and for two hypothetical demand redistribution scenarios. The evaluation focuses on changes in vehicle counts and average travel times during the morning peak period. The baseline scenario represents the existing traffic conditions without redistribution of ground traffic demand, while the 30% and 50% scenarios show how the analyzed signalized road network responds to selected levels of reduced ground traffic demand. The results are presented separately for each scenario and subsequently interpreted in relation to the observed nonlinear threshold effect.
3.1. Baseline Scenario (0% UAM)
The baseline scenario, which relied exclusively on ground transportation, exhibited significant delays and long travel times. These conditions reflect a heavily loaded transport system, where increasing traffic demand leads to congestion formation, reduced traffic flow efficiency, and prolonged delays at signalized intersections. The accumulation of vehicles in the network further intensifies these effects, particularly during peak periods when demand exceeds the infrastructure’s operational capacity.
In addition to extended travel times, the baseline scenario also revealed considerable variability in traffic conditions across different time intervals. Signal control strategies, uneven traffic distribution, and interactions between vehicle streams at intersections primarily influence this fluctuation. Such variability indicates an unstable traffic environment, where minor disturbances can lead to disproportionate increases in delay and queue formation.
Table 2 summarizes the development of travel times and traffic intensity during the morning peak period.
Table 2.
Baseline condition.
Vehicle count is the average number of vehicles per interval across multiple simulation replications.
The results indicate a high level of traffic congestion, with travel times in the direction from intersection 1 to intersection 3 exceeding 170 s in many intervals and reaching peaks above 220 s. At the same time, high traffic intensities were recorded, in some cases exceeding 20 vehicles per 5 min, indicating congestion. The summary values are presented in Table 3.
Table 3.
Summary of the baseline condition.
The average travel time reached 178.41 s in the 1 → 3 direction and 131.86 s in the opposite direction, with these differences indicating asymmetry in traffic load and signal control conditions.
3.2. Scenario with 30% Demand Redistribution
The scenario involving a 30% redistribution of traffic demand to Urban Air Mobility (UAM) demonstrated a substantial improvement in operational performance (Table 4). Compared to the baseline condition, a noticeable reduction in both travel times and traffic intensity was observed, indicating a significant alleviation of congestion effects within the network.
Table 4.
Scenario after 30% Demand Redistribution.
This improvement can be attributed to the decreased number of vehicles circulating within the system, which led to smoother traffic flow, reduced queue formation, and fewer delays at signalized intersections. As a result, the transport system operated under more stable and efficient conditions during the analyzed peak period.
The average travel time decreased to approximately 130–140 s, accompanied by a significant reduction in the number of vehicles within the system. The summary results are presented in Table 5.
Table 5.
Summary of the scenario after 30% Demand Redistribution.
The average travel time decreased to 137.30 s (1 → 3) and 99.57 s (3 → 1), representing a significant improvement compared to the baseline scenario.
An interesting finding is that the reduction in the number of vehicles was more pronounced than the 30% decrease in demand itself. This effect was caused by the elimination of congestion and the dissipation of vehicle queues, which in the baseline scenario artificially increased the number of vehicles within the system. This represents a nonlinear effect typical of congested transport systems.
3.3. Scenario with 50% Demand Redistribution
The simulation of the 50% Urban Air Mobility (UAM) scenario resulted in a further reduction in traffic load, but without a proportional improvement in operational performance compared to the 30% scenario (Table 6).
Table 6.
Scenario after 50% Demand Redistribution.
Although the number of vehicles in both directions decreased slightly, the differences compared to the 30% UAM share scenario were not substantial. This result suggests that the transport system reached a state in which traffic congestion is no longer the dominant limiting factor of performance. In other words, further reductions in traffic demand do not lead to proportional improvements in travel times, suggesting a threshold effect.
The average travel times remained similar to those in the 30% scenario, with a slight increase observed in some time intervals. However, this phenomenon is not related to re-emerging congestion but rather reflects that, at lower traffic intensities, travel times are primarily determined by the geometric and control characteristics of the infrastructure, such as signal cycle lengths, lane configurations, and traffic flow organization. The summary results are presented in Table 7.
Table 7.
Summary of the scenario after 50% Demand Redistribution.
The average travel time reached 138.95 s in the direction 1 → 3 and 101.24 s in the direction 3 → 1, while the number of vehicles decreased to 44.44 and 33.64, respectively. Compared to the baseline scenario, this represents a significant improvement; however, compared to the 30% UAM scenario, the benefits are only marginal.
These results confirm that the most substantial improvements in transport system performance are achieved in the early stages of UAM implementation. At higher levels of adoption, the effect gradually saturates, and system performance is increasingly limited by infrastructure and control parameters rather than by traffic intensity itself. From the perspective of transport information systems, this is a key finding, highlighting the need to combine demand-reduction measures with the optimization of traffic management strategies.
3.4. Theoretical Interpretation of the Threshold Effect
The threshold effect observed in this study can be interpreted using classical traffic flow theory and the relationship between traffic demand and infrastructure capacity. In traffic engineering, this relationship is commonly expressed by the saturation ratio:
When saturation ratio is greater than 1, traffic demand exceeds the available capacity. Under such conditions, queues grow, traffic flow becomes unstable, and delays increase disproportionately. In contrast, when Saturation ratio is lower than 1, the system operates in a more stable traffic regime, and additional reductions in traffic demand may produce only limited further improvements in travel time. From this perspective, the substantial improvement observed between the baseline scenario and the 30% demand redistribution scenario suggests that the analyzed road network shifted from an oversaturated or near-saturated regime to a more stable operating regime.
The limited additional improvement observed in the 50% scenario can therefore be interpreted as a saturation of benefits after the critical congestion threshold has already been passed. Once the system is no longer primarily limited by excessive traffic demand, travel times are increasingly influenced by fixed infrastructure and control characteristics, such as signal cycle lengths, lane configuration, intersection geometry, and traffic flow organization.
It should be noted that the present study does not determine the exact critical density, the complete fundamental traffic flow diagram, or the precise transition point between congested and uncongested traffic conditions. The interpretation of the threshold effect is based on the observed changes in travel times and traffic load in the microsimulation outputs. A detailed capacity-based analysis using saturation ratios, density-related indicators, queue lengths, and delay values for each intersection approach should therefore be addressed in future research.
4. Discussion
To ensure a relevant comparison between microsimulation results and the Urban Air Mobility (UAM) alternative, reference travel times were calculated for two operational speeds: 50 km/h (13.89 m/s) and 30 km/h (8.33 m/s). These values were selected to represent different urban traffic conditions. A speed of 50 km/h corresponds to the typical maximum speed limit in urban areas. In comparison, 30 km/h represents conditions in traffic-calmed zones, residential streets, school areas, or locations with increased pedestrian activity.
The analysis assumed a simplified condition of equal route length for both UAM and ground transportation. Although UAM is not constrained by road geometry, intersections, or signal control in real-world conditions, this assumption allowed for a methodologically consistent comparison of travel times under identical spatial conditions. The reference travel time for UAM was calculated according to Equation (4):
The calculated travel times are presented in the following Table 8.
Table 8.
Travel time.
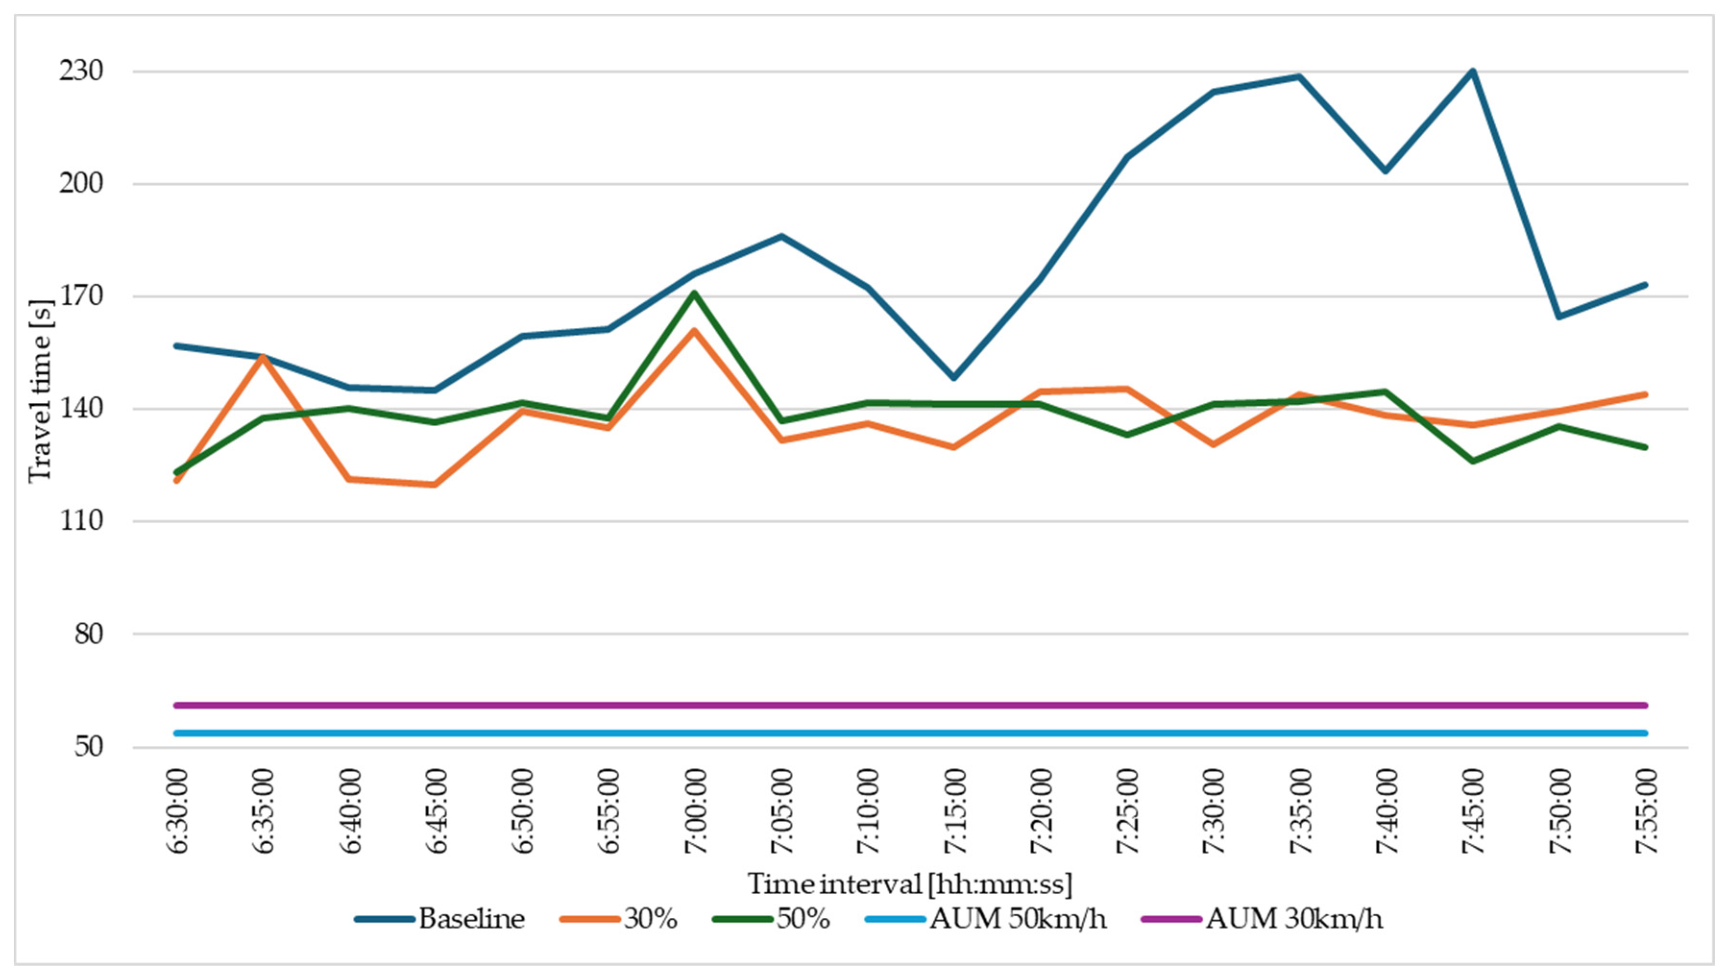
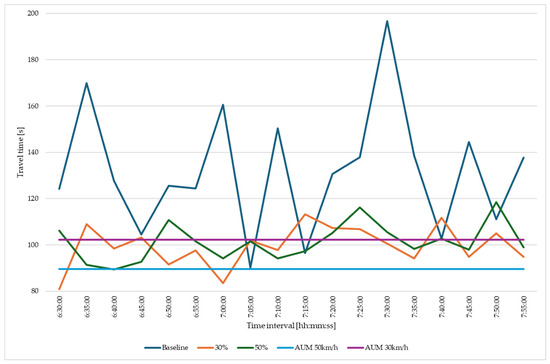
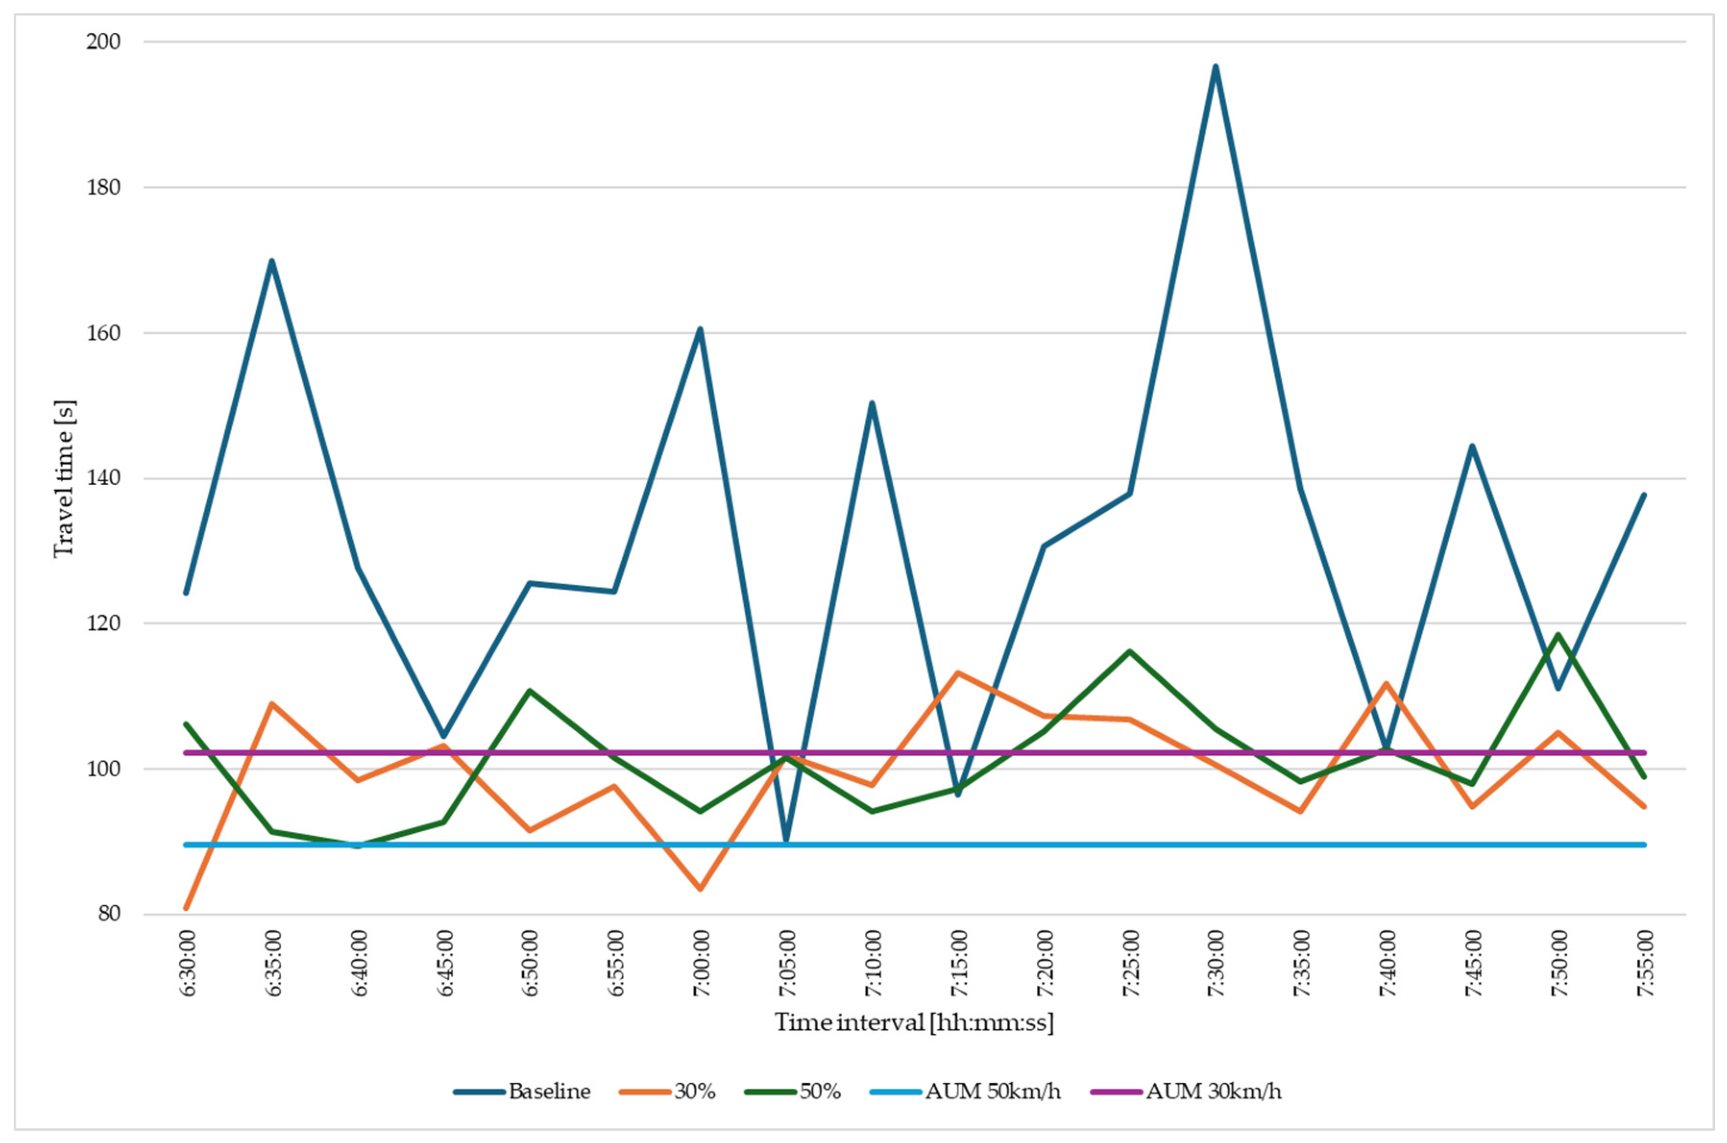
The comparison of results shows that UAM achieves significantly lower and more stable travel times than ground transportation, particularly in the direction from intersection 1 to intersection 3 (see Figure 4, Comparison of travel time in direction 1–3). In the baseline scenario, ground transportation travel times were considerably higher and varied with congestion levels. After redistributing 30% of traffic demand to UAM, substantial reductions in travel times and stabilization of traffic flow were observed. The scenario with a 50% UAM share resulted in a further decrease in traffic load, but without proportional improvement in travel times. This outcome indicates a threshold effect, in which further reductions in ground traffic intensity do not yield proportional improvements in intersection performance.
Figure 4.
Comparison of travel time in direction 1–3.
The graph illustrates the average travel time [s] for individual simulation scenarios and two reference speeds of Urban Air Mobility (UAM) in the direction from intersection 1 to intersection 3 during the morning peak period (from 6:30 to 7:55). The x-axis represents time intervals in five-minute steps, while the y-axis shows the average travel time in seconds.
- Blue curve (baseline): This curve represents the current state of ground transportation without the implementation of Urban Air Mobility. The initial travel times are the highest and exhibit significant variability, indicating congestion and delays.
- Orange curve: This scenario represents a 30% reduction in ground vehicles due to the introduction of Urban Air Mobility. Travel times decrease significantly and show greater stability compared to the baseline, indicating improved traffic flow and reduced delays.
- Green curve: In this case, traffic volume is reduced by 50% as a result of implementing Urban Air Mobility. Travel times are further reduced and remain highly stable, confirming the positive impact of reduced vehicle numbers on intersection performance.
- Purple (UAM 30 km/h) and light blue (UAM 50 km/h) curves: These horizontal curves represent travel times for Urban Air Mobility at speeds of 30 km/h and 50 km/h, respectively.
Travel times achieved through Urban Air Mobility (UAM) are significantly lower and remain stable, as UAM is expected to bypass delays at signalized intersections. The graph demonstrates that even with a substantial reduction in traffic intensity (by 50%), ground transportation does not reach travel times comparable to those of UAM. The largest difference between ground transportation and UAM travel times occurs during peak traffic periods, roughly between 7:20 and 7:40. These findings highlight UAM’s potential to reduce travel times and mitigate congestion in urban environments, offering consistently faster, more predictable travel compared to conventional ground transportation.
The following figure illustrates the average travel time for different traffic scenarios and reference speeds of Urban Air Mobility in the direction from intersection 3 to intersection 1. This comparison aims to demonstrate how different levels of UAM implementation (30% and 50% reductions in ground traffic) affect travel times while also emphasizing the high efficiency of UAM, which remains consistently lower than that of conventional ground transportation.
The graph in Figure 5 shows the average travel time in seconds for different simulation scenarios and two reference speeds of Urban Air Mobility (UAM) in the direction from intersection 3 to intersection 1 during the morning peak period (from 6:30 to 7:55). The x-axis represents time intervals in five-minute steps, while the y-axis indicates the average travel time in seconds.
Figure 5.
Comparison of travel time in direction 3–1.
- Blue curve (baseline): This curve represents the baseline scenario of ground transportation without the involvement of Urban Air Mobility. Travel times are highly variable and, at certain points (for example, around 7:25–7:35), reach significant peaks, reflecting severe congestion and the random formation of traffic queues.
- Orange curve: This scenario represents a 30% reduction in ground traffic volumes due to the introduction of Urban Air Mobility. Travel times are consistently lower and much less variable compared to the baseline, indicating smoother traffic flow.
- Green curve: This curve shows a further reduction in traffic load as a result of Urban Air Mobility implementation. Travel times are even more stable and lower than in the 30% scenario, suggesting near-optimal traffic conditions within the given context.
- Purple curve (UAM 30 km/h) and light blue curve (UAM 50 km/h): These constant curves represent travel times for Urban Air Mobility at speeds of 30 km/h and 50 km/h, respectively.
In this case, after UAM-related demand redistribution, travel times approached the UAM reference values, and in two intervals, ground transportation even achieved better results than UAM. This phenomenon is primarily due to the signal control plans at intersections 2 and 3 being static rather than dynamic, optimized for higher traffic volumes. As a result, during periods of reduced traffic, vehicles at these intersections experience minimal delays, resulting in a significant reduction in travel times.
Moreover, when drivers encounter minimal delays, they are more likely to exceed the maximum permitted speeds, as confirmed by calibration data from the baseline model.
The findings of this study confirm the potential of Urban Air Mobility (UAM) as a complementary element of a multimodal transport system within the Smart City concept. The redistribution of a portion of traffic demand from ground transportation to the airspace can help reduce congestion, shorten travel times, and increase mobility predictability. From the perspective of transport information systems, UAM is a tool that can be integrated into broader decision-making and control platforms to optimize traffic flows.
However, it is important to emphasize that the practical implementation of UAM requires addressing several open challenges, particularly in infrastructure, safety, regulation, energy demand, and public acceptance [22,23,24,25]. Despite favorable travel-time results, Urban Air Mobility (UAM) cannot be considered a complete replacement for ground transportation. Ground transport systems benefit from established infrastructure, an existing regulatory framework, and a high level of spatial accessibility [26,27,28]. At the same time, they provide flexibility for a wide range of users, destinations, and transport modes, including public transport, private transport, cycling, logistics, and the mobility of people with specific needs [29,30,31].
Another important aspect is the operational cost and energy demand of UAM. In particular, systems based on vertical take-off and landing can be technologically complex and energy-intensive, which may limit their use compared to modern low-emission or zero-emission ground transport modes [32,33]. For this reason, UAM should be regarded primarily as a selective complement to the existing transport system, particularly suitable for specific routes, congested corridors, or time-sensitive trips.
Overall, the results indicate that the greatest impact of UAM already occurs at the stage of its partial implementation. The scenario with a 30% redistribution of traffic demand resulted in a significant improvement in travel times, whereas increasing the share to 50% did not produce proportional benefits. This threshold effect is important for future planning, as it highlights the need to integrate UAM with signal control optimization, demand management, and the development of multimodal transport approaches.
Thus, UAM can contribute to a more efficient, resilient, and sustainable urban mobility system, but only as part of an integrated transport ecosystem rather than as a standalone solution.
These findings highlight the importance of data-driven approaches in urban mobility planning, where simulation-based analyses can support more informed decisions on integrating emerging transport concepts, such as Urban Air Mobility.
The results should therefore be interpreted primarily as a traffic demand sensitivity analysis rather than as a complete multimodal UAM simulation. The main finding is not the operational performance of UAM itself, but the nonlinear response of the existing signalized road network to reduced ground traffic demand. The comparison between the baseline, 30%, and 50% scenarios indicates that the largest improvement occurs when the traffic system moves away from oversaturated or near-saturated conditions. Once this transition has occurred, further reductions in demand bring only marginal additional benefits, because travel times are increasingly determined by signal control parameters, road geometry, and fixed infrastructure characteristics rather than by congestion alone.
The obtained results are consistent with previous traffic-engineering and microsimulation studies showing that reductions in traffic demand do not always lead to proportional improvements in network performance. In congested or near-saturated conditions, even a moderate decrease in demand may lead to a substantial reduction in travel time and queue formation, while further demand reductions may produce only marginal additional benefits once the system has moved into a more stable operating regime. Compared with broader UAM studies, which usually focus on airspace organization, vertiport planning, passenger acceptance, or system-level integration, the present study contributes by examining the road-network response at the level of signalized intersections. In this respect, the results complement the previously published assessment of the same Topoľčany road network by extending the analysis from traffic management optimization to hypothetical UAM-related demand redistribution scenarios.
5. Conclusions
This study aimed to assess the potential of Urban Air Mobility (UAM) to reduce travel times and improve overall signalized intersection performance in the urban environment of Topoľčany, Slovakia. Specifically, the impact of redistributing 30% and 50% of ground traffic into the airspace was analyzed, with a focus on key intersections during the morning peak period.
The results of the microsimulation-based analysis clearly support Hypothesis 1. The implementation of UAM-related demand redistribution led to a measurable reduction in travel times at signalized intersections. Even in the baseline scenario, the average travel times of ground vehicles remained significantly higher compared to the reference UAM travel times. In scenarios with partial UAM implementation, this difference persisted, confirming the significant time-saving potential of this form of mobility regardless of the specific level of its adoption.
An exception was observed along the route from intersection 3 to intersection 1, where longer travel times were likely due to the use of a fixed signal control plan. For more accurate comparisons, it would be beneficial to optimize signal control plans or implement adaptive traffic management that reflects current traffic conditions. This aspect represents an opportunity for further research.
Regarding Hypothesis 2, the results do not fully support the expected relationship. Although the reduction in traffic load led to a noticeable decrease in travel times, increasing the UAM share from 30% to 50% did not result in a substantial additional improvement. This finding indicates a threshold effect, in which further reductions in traffic demand no longer translate into significant gains in transport system performance.
From a broader perspective, these findings may support the Smart City concept by showing how simulation-based analyses can be used to evaluate the operational effects of hypothetical demand redistribution scenarios. Urban Air Mobility (UAM) may represent a complementary mobility concept for selected congested corridors or time-sensitive trips. However, in the present study, its effects were evaluated only through travel times and traffic load at signalized intersections. Therefore, broader implications related to sustainable mobility, system resilience, and quality of life should be interpreted only as potential indirect effects that require further investigation.
However, it is also important to emphasize the limitations of this study. The simulation was conducted for a specific urban environment and based on simplified assumptions, including equal route lengths for both UAM and ground transportation. Although this approach enabled direct comparison, it does not account for UAM’s routing flexibility or for specific operational constraints in real-world conditions.
A key limitation of this study is that Urban Air Mobility was represented through hypothetical demand redistribution scenarios and not through a complete operational UAM model. The analysis did not include aerial corridors, vertiport capacity, waiting times, passenger access and egress, intermodal transfers, airspace constraints, or operating costs. Therefore, the results should not be interpreted as a full evaluation of UAM implementation, but as an assessment of how a signalized urban road network may respond if part of the ground traffic demand is removed from the road system. Future research should extend this approach by integrating detailed UAM supply-side parameters, dynamic adoption models, and capacity-based indicators such as saturation ratios, density, and the identification of the exact transition point between congested and uncongested regimes.
In addition, the model did not account for weather conditions, airspace regulations, or the practical challenges of implementing UAM infrastructure and services. From the perspective of transport information systems, these limitations highlight the need to extend analytical tools and models to better reflect the complexity of real transport environments [34,35,36].
Another limitation is the study’s focus exclusively on travel times and intersection performance. Although these are key indicators of operational efficiency, they do not capture other important aspects such as environmental impacts, energy consumption, noise, or the societal acceptance of aerial mobility. Future research should integrate these dimensions into the analysis to achieve a more comprehensive evaluation of the benefits and risks of UAM. Such an extension would make it possible to evaluate the broader environmental and social implications of UAM-related demand redistribution more comprehensively within the Smart City concept.
In addition, it should be noted that this study considered static UAM shares (30% and 50%). In contrast, in real-world conditions, the adoption of this technology will be dynamic and influenced by factors such as economic accessibility, technological progress, user preferences, and regulatory policies. Future research should therefore focus on dynamic modeling of UAM adoption, multimodal interactions, and adaptive control strategies within the Smart City environment. From the perspective of transport information systems, such an approach is essential for accurate modeling and efficient management of complex transport processes.
The integration of Urban Air Mobility into urban transport systems would require addressing challenges that extend beyond operational efficiency. These include safety, airspace regulation, technological reliability, operating costs, infrastructure requirements, and public acceptance. Since these aspects were not directly evaluated in the present model, the results should be interpreted as an operational traffic assessment rather than as a complete evaluation of UAM implementation. In future studies, transport information systems could play an important role in supporting real-time coordination, monitoring, and mobility management in a more comprehensive multimodal framework.
In conclusion, this study provides a quantitative basis for understanding how hypothetical UAM-related demand redistribution may influence travel times and traffic load at signalized intersections. The results show that a 30% reduction in ground traffic demand produces a substantial improvement in traffic flow, while a further increase to 50% does not generate proportional additional benefits. However, these findings should not be interpreted as a complete assessment of UAM implementation. Further research is required to include operational UAM parameters, infrastructure requirements, user behavior, travel costs, environmental impacts, and regulatory constraints before broader conclusions about UAM integration into Smart City transport strategies can be drawn.
The results should be interpreted primarily in relation to operational traffic performance, especially travel times and traffic load at signalized intersections. Although improved traffic flow may indirectly support broader Smart City objectives, such as more efficient mobility planning and reduced pressure on road infrastructure, this study did not directly evaluate environmental impacts, system resilience, social acceptance, or residents’ quality of life. Therefore, conclusions related to sustainability and quality-of-life benefits should be understood as potential implications rather than directly measured outcomes. Future research should include environmental indicators, energy consumption, noise, accessibility, user behavior, and social acceptance in order to evaluate these broader impacts more comprehensively.
These findings have not only theoretical significance but also practical implications for urban planning and traffic management. Based on the obtained results, the following policy implications can be formulated:
Policy Implications
The results of this study have significant implications for urban planning and transport policy within the Smart City context. First, the results indicate that even a hypothetical partial reduction in ground traffic demand may lead to measurable improvements in travel times and intersection performance in the analyzed road network. This suggests that UAM implementation can be carried out gradually and strategically, focusing on critical transport corridors and peak traffic periods.
Second, the identified threshold effect highlights the importance of evaluating demand redistribution levels before drawing conclusions about the expected benefits of new mobility concepts. The results suggest that higher levels of demand reduction do not necessarily produce proportional improvements in road network performance.
Third, the results emphasize the importance of transport information systems for evaluating and managing complex mobility scenarios. Advanced tools for data collection, traffic demand prediction, simulation, and adaptive traffic control are necessary to assess how changes in travel demand may influence road network performance.
Finally, future scenario analyses should be combined with signal control optimization, traffic demand management, and broader multimodal planning. Such an integrated approach would allow researchers and decision-makers to evaluate operational, environmental, economic, and social impacts in a more balanced way.
Author Contributions
Conceptualization, M.P. and P.F.; methodology, A.K.; software, K.Č.; validation, A.K. and K.Č.; formal analysis, M.P.; investigation, P.F.; resources, P.F.; data curation, A.K.; writing—original draft preparation, P.F.; writing—review and editing, P.F., A.K. and M.P.; visualization, M.P.; supervision, M.P.; project administration, K.Č.; funding acquisition, A.K. All authors have read and agreed to the published version of the manuscript.
Funding
Project: 1/0411/25 Shared mobility in Slovakia and its economic impacts on enhancing the competitiveness of public transportation in urban environments.
Institutional Review Board Statement
Not applicable.
Informed Consent Statement
Not applicable.
Data Availability Statement
The data supporting the findings of this study are available within the article and in the related previous study published at DOI: 10.3390/vehicles6040095. Additional data may be provided by the authors upon reasonable request.
Acknowledgments
During the preparation of this manuscript, the authors used AI software such as Grammarly PRO (version 1.165.1.0) for the purposes of grammar and spelling correction. The authors have reviewed and edited the output and take full responsibility for the content of this publication.
Conflicts of Interest
The authors declare no conflicts of interest.
References
- Lejda, K.; Mądziel, M.; Daszykowska, S.; Zielińska, E. The Future of Public Transport in Light of Solutions for Sustainable Transport Development. Sci. J. Silesian Univ. Technol. Ser. Transp. 2017, 95, 97–108. [Google Scholar] [CrossRef] [Scilit]
- Gulc, A.; Budna, K. Classification of Smart and Sustainable Urban Mobility. Energies 2024, 17, 2148. [Google Scholar] [CrossRef] [Scilit]
- Li, S.; Shao, Y.; Hong, M.; Zhu, C.; Dong, B.; Li, Y.; Lin, Y.; Wang, K.; Gan, M.; Zhu, J.; et al. Impact Mechanisms of Urbanization Processes on Supply-Demand Matches of Cultivated Land Multifunction in Rapid Urbanization Areas. Habitat Int. 2023, 131, 102726. [Google Scholar] [CrossRef] [Scilit]
- Sodri, A.; Garniwa, I. The Effect of Urbanization on Road Energy Consumption and CO2 Emissions in Emerging Megacity of Jakarta, Indonesia. Procedia-Soc. Behav. Sci. 2016, 227, 728–737. [Google Scholar] [CrossRef] [Scilit]
- Carnis, L. Smart Cities and Transport Infrastructures Topical Collection. Eur. Transp. Res. Rev. 2018, 10, 29. [Google Scholar] [CrossRef] [Scilit]
- Koman, G.; Toman, D.; Jankal, R.; Krúpová, S. Public Transport Infrastructure with Electromobility Elements at the Smart City Level to Support Sustainability. Sustainability 2024, 16, 1091. [Google Scholar] [CrossRef] [Scilit]
- Pribyl, O.; Svitek, M.; Rothkrantz, L. Intelligent Mobility in Smart Cities. Appl. Sci. 2022, 12, 3440. [Google Scholar] [CrossRef] [Scilit]
- Wild, G. Urban Aviation: The Future Aerospace Transportation System for Intercity and Intracity Mobility. Urban Sci. 2024, 8, 218. [Google Scholar] [CrossRef] [Scilit]
- Shi, Y. Pilots in the Evolving Urban Air Mobility: From Manned to Unmanned Aviation. In Proceedings of the 2023 International Conference on Unmanned Aircraft Systems (ICUAS), Warsaw, Poland, 6–9 June 2023; pp. 63–70. [Google Scholar]
- Cho, S.-H.; Kim, M. Assessment of the Environmental Impact and Policy Responses for Urban Air Mobility: A Case Study of Seoul Metropolitan Area. J. Clean. Prod. 2022, 360, 132139. [Google Scholar] [CrossRef] [Scilit]
- Li, J.; Shen, D.; Yu, F.; Qi, D. A Method for Air Route Network Planning of Urban Air Mobility. Aerospace 2024, 11, 584. [Google Scholar] [CrossRef] [Scilit]
- Fabian, P.; Čulík, K.; Kalašová, A.; Černický, Ľ. The Impact of Road Realignment on the Traffic Load in the Surrounding Area. Vehicles 2024, 6, 1942–1962. [Google Scholar] [CrossRef] [Scilit]
- McKercher, R.G.; Khouli, F.; Wall, A.S.; Larose, G.L. Modelling and Control of an Urban Air Mobility Vehicle Subject to Empirically-Developed Urban Airflow Disturbances. Aerospace 2024, 11, 220. [Google Scholar] [CrossRef] [Scilit]
- Genser, A.; Makridis, M.A.; Yang, K.; Ambühl, L.; Menendez, M.; Kouvelas, A. Time-to-Green Predictions for Fully-Actuated Signal Control Systems With Supervised Learning. IEEE Trans. Intell. Transp. Syst. 2024, 25, 7417–7430. [Google Scholar] [CrossRef] [Scilit]
- Wang, X. Vehicle Image Detection Method Using Deep Learning in UAV Video. Comput. Intell. Neurosci. 2022, 2022, 8202535. [Google Scholar] [CrossRef] [Scilit] [PubMed]
- Fernández-Rodríguez, J.D.; García-González, J.; Benítez-Rochel, R.; Molina-Cabello, M.A.; Ramos-Jiménez, G.; López-Rubio, E. Automated Detection of Vehicles with Anomalous Trajectories in Traffic Surveillance Videos. Integr. Comput.-Aided Eng. 2023, 30, 293–309. [Google Scholar] [CrossRef] [Scilit]
- Gao, L.; Bai, W.; Leary, R.; Varadarajan, K.; Brennan, S. ROS Integration of External Vehicle Motion Simulations with an AIMSUN Traffic Simulator as a Tool to Assess CAV Impacts on Traffic. IFAC-PapersOnLine 2021, 54, 870–875. [Google Scholar] [CrossRef] [Scilit]
- Vatchova, B.; Boneva, Y.; Gegov, A. Modelling and Simulation of Traffic Light Control. Cybern. Inf. Technol. 2023, 23, 179–191. [Google Scholar] [CrossRef] [Scilit]
- Okebe, M.W.; Abuodha, S.O.; Ochieng, M.O.A. Evaluating Emission Reduction Policies along an Urban Arterial Highway Using the AIMSUN Model. J. Adv. Transp. 2024, 2024, 6309854. [Google Scholar] [CrossRef] [Scilit]
- Macioszek, E.; Tumminello, M. Simulating vehicle-to-vehicle communication at roundabouts. Transp. Probl. 2024, 19, 45–57. [Google Scholar] [CrossRef] [Scilit]
- Nahmias-Biran, B.-H.; Dadashev, G.; Levi, Y. Demand Exploration of Automated Mobility On-Demand Services Using an Innovative Simulation Tool. IEEE Open J. Intell. Transp. Syst. 2022, 3, 580–591. [Google Scholar] [CrossRef] [Scilit]
- Cohen, A.; Shaheen, S.; Farrar, E. Urban Air Mobility: History, Ecosystem, Market Potential, and Challenges. IEEE Trans. Intell. Transp. Syst. 2021, 22, 6074–6087. [Google Scholar] [CrossRef] [Scilit]
- Arafat, M.Y.; Pan, S. Urban Air Mobility Communications and Networking: Recent Advances, Techniques, and Challenges. Drones 2024, 8, 702. [Google Scholar] [CrossRef] [Scilit]
- Marzouk, O.A. Urban Air Mobility and Flying Cars: Overview, Examples, Prospects, Drawbacks, and Solutions. Open Eng. 2022, 12, 662–679. [Google Scholar] [CrossRef] [Scilit]
- Adelstein, B.D.; Toscano, W.B.; Espinosa, F.A.; Cowings, P.S. Passenger Experience of Simulated Urban Air Mobility Ride Quality: Responses to Large-Scale Motion. IFAC-PapersOnLine 2022, 55, 138–143. [Google Scholar] [CrossRef] [Scilit]
- Zhang, J.; Liu, K.; Zhang, Y. Sustainable Development of China’s Road Transportation Infrastructure: Situation and Prospect. In Proceedings of the LTLGB 2012; Chen, F., Liu, Y., Hua, G., Eds.; Springer: Berlin/Heidelberg, Germany, 2013; pp. 31–38. [Google Scholar]
- Santos, E.A.N.e.; Dutra, C.T.d.S.; Chinelli, C.K.; Hammad, A.W.A.; Haddad, A.N.; Soares, C.A.P. The Main Impacts of Infrastructure Works on Public Roads. Infrastructures 2021, 6, 118. [Google Scholar] [CrossRef] [Scilit]
- Kussl, S.; Wald, A. Smart Mobility and Its Implications for Road Infrastructure Provision: A Systematic Literature Review. Sustainability 2023, 15, 210. [Google Scholar] [CrossRef] [Scilit]
- Babić, D.; Kalić, M.; Janić, M.; Dožić, S.; Kukić, K. Integrated Door-to-Door Transport Services for Air Passengers: From Intermodality to Multimodality. Sustainability 2022, 14, 6503. [Google Scholar] [CrossRef] [Scilit]
- Konečný, V.; Gnap, J.; Settey, T.; Petro, F.; Skrúcaný, T.; Figlus, T. Environmental Sustainability of the Vehicle Fleet Change in Public City Transport of Selected City in Central Europe. Energies 2020, 13, 3869. [Google Scholar] [CrossRef] [Scilit]
- Gnap, J.; Poliak, M.; Semanova, S. The Issue of a Transport Mode Choice from the Perspective of Enterprise Logistics. Open Eng. 2019, 9, 374–383. [Google Scholar] [CrossRef] [Scilit]
- Brynolf, S.; Hansson, J.; Anderson, J.E.; Skov, I.R.; Wallington, T.J.; Grahn, M.; Korberg, A.D.; Malmgren, E.; Taljegård, M. Review of Electrofuel Feasibility—Prospects for Road, Ocean, and Air Transport. Prog. Energy 2022, 4, 042007. [Google Scholar] [CrossRef] [Scilit]
- Breuer, J.L.; Scholten, J.; Koj, J.C.; Schorn, F.; Fiebrandt, M.; Samsun, R.C.; Albus, R.; Görner, K.; Stolten, D.; Peters, R. An Overview of Promising Alternative Fuels for Road, Rail, Air, and Inland Waterway Transport in Germany. Energies 2022, 15, 1443. [Google Scholar] [CrossRef] [Scilit]
- Wei, Q.; Nilsson, G.; Coogan, S. Safety Verification for Urban Air Mobility Scheduling. IFAC-PapersOnLine 2022, 55, 306–311. [Google Scholar] [CrossRef] [Scilit]
- Reiche, C.; Cohen, A.; Fernando, C. An Initial Assessment of the Potential Weather Barriers of Urban Air Mobility. IEEE Trans. Intell. Transp. Syst. 2021, 22, 6018–6027. [Google Scholar] [CrossRef] [Scilit]
- Rajendran, S.; Srinivas, S.; Grimshaw, T. Predicting Demand for Air Taxi Urban Aviation Services Using Machine Learning Algorithms. J. Air Transp. Manag. 2021, 92, 102043. [Google Scholar] [CrossRef] [Scilit]

Disclaimer/Publisher’s Note: The statements, opinions and data contained in all publications are solely those of the individual author(s) and contributor(s) and not of MDPI and/or the editor(s). MDPI and/or the editor(s) disclaim responsibility for any injury to people or property resulting from any ideas, methods, instructions or products referred to in the content. |
© 2026 by the authors. Licensee MDPI, Basel, Switzerland. This article is an open access article distributed under the terms and conditions of the Creative Commons Attribution (CC BY) license.