


Abstract
Automatic license plate reader (ALPR) cameras and gunshot detection system (GDS) technology represent rapidly expanding forms of surveillance. Despite their prevalence, empirical literature regarding these tools remains limited, particularly concerning their geographic distribution across the United States. This study addresses this gap by conducting a geospatial analysis of crowdsourced ALPR and GDS locations throughout Virginia. Utilizing Geographic Information Systems (GIS), we mapped the concentrations of this technology and analyzed the racial demographic profiles of the most heavily surveilled communities. Our results identify distinct clusters of surveillance technology hubs across Virginia. In these high-intensity areas, surveillance technology is frequently concentrated in and around communities of color. These findings carry an array of implications, including the risk that over-surveilled neighborhoods may disproportionately suffer from the abuse or misuse of these tools. Furthermore, this distribution reflects a historical legacy within the criminal justice system of disproportionately monitoring marginalized populations. The limitations of this analysis are equally revealing: the reliance on crowdsourced data due to a lack of verifiable, publicly accessible coordinates underscores an ongoing lack of transparency.
1. Introduction
Surveillance has become a staple of modern society and is now integrated into every facet of the criminal justice system, ranging from policing and incarceration to community corrections, probation, and parole [1,2,3]. Throughout the “war on drugs” and “tough on crime” eras in the United States—stretching from the 1970s into the 1990s—the federal government provided substantial funding to local and state law enforcement, a significant portion of which was allocated to expanding surveillance technology [4]. This expansion continued into the 2000s, as the response to the 11 September 2001 terrorist attacks intensified surveillance efforts and bolstered information sharing between local, state, and federal law enforcement [5,6,7]. There has also been growing integration of various disparate surveillance tools [8]. Consequently, the expansion of modern surveillance technology allows vast numbers of people to be surveilled and included in police datasets without ever having had direct contact with law enforcement [9].
Automated License Plate Reader (ALPR) cameras and Gunshot Detection Systems (GDS) are two surveillance tools increasingly utilized by law enforcement that have proliferated in recent years. ALPR cameras capture a “vehicle fingerprint” of every passing car; they are capable of recording a vehicle’s make, model, and color, as well as license plates, decals, and bumper stickers. This data is immediately transmitted to local police departments and is stored in centralized databases searchable by law enforcement, often without the requirement of a warrant or court order [10]. Over 6000 localities in the United States utilize ALPR cameras. The majority of which are provided by the private company Flock Safety and are leased to law enforcement agencies, private corporations, and homeowner associations (HOAs) [10,11,12]. This database is sufficiently expansive to allow law enforcement to reconstruct an individual’s historical patterns and daily activities. Consequently, privacy advocates express concern that this unprecedented, centralized movement database is uniquely vulnerable to data breaches, systemic misuse, and technical malfunctions [13,14,15,16,17,18,19]. Police argue the data collected from ALPRs can help them locate persons of interest, as well as locating missing individuals, while improving efficiency and gathering evidence for investigations [20]. Localities such as Staunton and Charlottesville, Virginia, have decided to cancel or decline contracts with ALPR providers [21]. These decisions were often driven by concerted efforts from local citizens to educate officials on the risks. These concerns were recently heightened by a Virginia Crime Commission [22] report, which detailed that law enforcement agencies admitted to violating state guidelines regarding data retention and unauthorized data sharing.
GDS technology, the most common version being ShotSpotter, is used by law enforcement to detect the sound of gunfire and alert police to its location [23]. The technology relies on a network of sensors, typically mounted on light posts or buildings, that analyze acoustic patterns to determine if a sound aligns with a gunshot [24]. However, this emergent form of surveillance has raised a number of significant concerns. Cities such as Chicago, Atlanta, and Portland have opted to discontinue their systems. Critics argue the technology is costly and often ineffective; for instance, in Houston, only 5% of thousands of alerts resulted in an arrest over a two-year span. Furthermore, there are concerns that GDS is disproportionately deployed in communities of color, leading to unnecessary and potentially volatile police-civilian interactions [25,26]. Similar to ALPR cameras, GDS technology was adapted from military use to allow law enforcement to detect gunshots over many square miles with accuracy within a few feet. Law enforcement agencies and the Department of Homeland Security [27] argue that these detections can also be used in legal cases, expanding their utility beyond immediate detection and resource deployment.
There remains a significant gap in empirical research regarding ALPR cameras and GDS technology. Specifically, little is known about how these tools are geographically deployed within municipalities or the implications of such disparate deployment. While law enforcement agencies make intentional decisions regarding where to locate these tools, they rarely provide transparency regarding those selections. To date, only one documented geospatial analysis has examined ALPR deployment. That study focused on the Hampton Roads region of Virginia after a federal judge ordered the release of all ALPR locations in November 2025 as part of a Fourth Amendment challenge [28]. While this study provided an initial glimpse into camera deployment, it covered only one metropolitan region; therefore, it remains unknown if the patterns found in Hampton Roads exist elsewhere. Consequently, local debates regarding whether to enter into, extend, or cancel contracts with ALPR vendors are limited by the uncertainty of whether to generalize the Hampton Roads findings or treat them as isolated results. In the present analysis, we are the first researchers to test whether the patterns found in Hampton Roads are consistent statewide or if regional variance suggests more localized decision-making. This study also advances the work of Keener, Finn, and Baird [28] by incorporating GDS technology into the analysis, whereas their work focused solely on ALPR cameras. Specifically, we conducted a geospatial analysis of civilian-reported ALPR locations and GDS technology across Virginia. The following sections detail the existing literature on the deployment and impact of surveillance technology, describe the materials and methods used in this geospatial analysis, and provide a series of maps and narratives detailing the results. We conclude with a discussion of the implications of our findings, particularly as policy debates surrounding ALPR cameras continue to evolve.
1.1. History of Surveillance Deployment
While surveillance has increased across the board in the modern era, certain groups have disproportionately borne the brunt of this growth. People of color have historically been over-surveilled in the United States [29,30]. Following the attacks of 11 September 2001, Muslim communities were extensively tracked and surveilled by law enforcement [31]. Furthermore, individuals under the supervision of the criminal justice system—such as those on probation or parole—are subject to a wide array of surveillance mechanisms [32,33]. This reinforces a cycle of over-surveillance in marginalized communities, particularly since the justice system disproportionately arrests and charges people of color and those in low-income brackets [34,35]. This disparate impact extends across the entire carceral spectrum, from incarceration to reentry.
The nature of surveillance has also undergone a fundamental shift. A primary change is the emergence of technology that collects data on individuals regardless of whether probable cause or reasonable suspicion exists to search them [36]. In fact, surveillance capabilities have expanded to the point where avoidance is nearly impossible [37]. It has become increasingly difficult to opt out of various forms of data tracking while engaging in essential everyday tasks, such as searching the internet, communicating electronically, or making phone calls [8,38].
The geographic deployment of surveillance tools must be analyzed through the lens of the changing nature of American policing. A major tenet of modern policing is the utilization of proactive strategies that attempt to identify and monitor individuals or groups deemed a threat before an offense occurs [39,40]. Predictive policing models typically employ a data-driven approach to identify potential hot spots of crime, targeting resources and monitoring accordingly [41,42]. This approach gained national prominence when New York City implemented CompStat in the 1990s, adopting a broken windows philosophy that led to controversial tactics such as stop and frisk [43]. These tactics drove a 50% increase in misdemeanor arrests in New York City in the years following their implementation [40]. Other cities adopted similar strategies, concentrating police efforts on specific areas deemed high-risk [43].
Surveillance technology is a critical component in the operation of predictive policing. These systems collect data on individuals daily, irrespective of probable cause [36,44]. The vast majority of data collected by technologies like ALPR cameras comes from individuals performing law-abiding tasks [8,37,38]. This information, aggregated with other police and crime data, is used to predict where future crimes may occur [45]. Consequently, if surveillance tools are disproportionately placed in communities of color, those neighborhoods are more likely to be targeted by the outputs of predictive policing models. Given that the U.S. carceral system has historically arrested and incarcerated people of color at higher rates [46,47], these historical biases are likely to be encoded into and perpetuated by modern predictive models. Furthermore, research indicates that these programs often produce more false positives for non-white individuals, with the highest error rates frequently occurring for Black females [48,49].
1.2. Impacts of Surveillance Deployment
The disproportionate deployment of surveillance tools has profound implications. First, it can perpetuate the ongoing criminalization and over-policing of communities historically subjected to such scrutiny. These impacts range from invasive tactics, such as stop and frisk, to the continuous tracking of individuals in databases that label them as high-risk [29,30,50,51]. These neighborhoods often possess the lowest levels of trust in law enforcement [52]. In these over-policed areas, interactions with the police are frequent, a reality that particularly affects young Black men [53].
Experiences with pervasive surveillance drives individual-level responses. For instance, many people adopt surveillance avoidance strategies to minimize their digital and physical footprint [9,54]. It is common for individuals to feel a sense of unease when confronted with surveillance cameras, even when they are engaged in law-abiding behavior [55]. Furthermore, a growing body of research identifies significant mental and physical health challenges linked to the stress of over-surveillance and subsequent over-policing [56].
Beyond personal implications, the deployment of surveillance tools carries broader societal risks. There is a danger of tech-washing, a process in which data-driven systems are erroneously assumed to be objective or racially neutral [57]. However, when these tools are disproportionately deployed in communities of color and low-income neighborhoods, they inevitably produce racially and class-disparate outcomes [57]. This creates a self-fulfilling prophecy: historically over-policed communities are subjected to intensified surveillance, which generates data used to justify further targeting of those same communities [50]. Consequently, the daily movements of residents become hyper-trackable, often without their consent or input, effectively turning their neighborhoods into permanent parts of the surveillance apparatus [38,50,52]. On one hand, digital redlining occurs when historically marginalized communities receive insufficient investment in broadband, leaving them behind the curve on critical modern infrastructure [58]. Simultaneously, the specific technologies being implemented in these communities are surveillance tools that can further criminalize their residents.
1.3. Potential Benefits of Surveillance Technology
The use of surveillance technology in policing continues to expand. Law enforcement, system actors, and policymakers often view these technologies as crime prevention tools that improve investigations, arrests, and prosecutions [59]. For example, law enforcement leaders argue that ALPR cameras help capture a larger volume of license plates, solve crimes, and address staffing shortages [60]. As surveillance technology becomes more affordable, its use may be better equalized between the police and the public [61]. Furthermore, “big data” in policing provides ample opportunities to evaluate police practices, provided the data is shared with researchers external to law enforcement [62].
There is various empirical research supporting the use of surveillance technology in law enforcement. A meta-analysis of CCTV found crime reductions in areas with cameras, with the most significant impact on property crimes and little to no effect on violent crime [63]. Targeting crime “hot spots” can lead to an initial reduction in certain crimes in the specific area targeted [64]. Similarly, ALPR cameras have a modest positive impact on clearing motor vehicle theft and robbery cases, but primarily when a large number of cameras are present [65].
Important factors to consider when implementing surveillance cameras include balancing utility with privacy, prioritizing training, and involving community stakeholders to improve buy-in [59]. Public perceptions of police surveillance tend to be more positive when the public views the police as legitimate [66]. For example, facial recognition technology research has largely focused on public attitudes, finding that perceptions are shaped by legitimacy, trust, and how privacy is managed. Research to date suggests that, when used in targeted ways, surveillance can improve the efficiency of investigations [67]. While there is empirical research to support the use of surveillance, this body of work remains in its nascent stages.
1.4. Empirical Research on ALPR Cameras and GDS Technology
A significant gap exists in empirical research regarding ALPR cameras. An unpublished white paper co-authored by Flock Safety employees argued that these cameras can improve crime clearance rates. However, the study faced several limitations and could not claim that the offenses would have remained unsolved without ALPR technology [68]. Conversely, peer-reviewed studies have found little to no deterrent effect attributable to ALPR cameras, nor any significant impact on traffic safety [17,69]. Public perception research indicates that the general population remains largely uninformed about ALPR cameras. Survey respondents were less likely to support the technology when it was used for purposes other than vehicle-related enforcement, when data was stored for extended periods, or when the technology impacted everyday community members [70]. A survey of residents in Fairfax County, Virginia, found that while 62.8% of respondents had heard of ALPRs, approximately 90% were unsure if their local police department utilized them. Furthermore, 53.4% of respondents believed that ALPR-collected data constituted private information [18]. Respondents expressed more negative feelings toward police when informed that ALPR data might be stored for six months rather than being purged immediately [20].
Empirical studies on GDS technology have yielded mixed results. Milburn and Syed [71] noted that inconsistent evidence regarding ShotSpotter’s, a popular GDS technology, ability to reduce violence suggests that the potential harms of the technology may outweigh its benefits. While some studies in Camden, New Jersey, found that ShotSpotter improved response and transport times for victims, potentially saving lives [72,73], others highlighted significant operational trade-offs. Research in Kansas City suggested that GDS can provide more spatially accurate data and reduce police response times [74], and other studies have noted that GDS helps officers detect gunfire that would otherwise go unreported [75,76].
These benefits are often offset by a high rate of false positives and police responses to random, non-criminal acoustic events [77]. False positives are incidents where the system misidentifies non-ballistic sounds (such as fireworks, backfiring cars, or construction) as gunfire. For example, a major audit by the Chicago Office of Inspector General [78] found that roughly 89% of ShotSpotter alerts turned up no evidence of a gun-related crime, leading to thousands of dead-end deployments that strained police resources. The surge in responses to incidents where no gunfire is detected can strain departmental resources [77,79]. For example, a study in Massachusetts found positive outcomes for dispatch efficiency but no improvement in case resolutions [80]. Similarly, research in Denver, Milwaukee, and Richmond, California, observed a two-to-threefold increase in officer time spent responding to alerts, which increased overall workloads despite reducing notification times [81].
Several studies have documented significant drawbacks and operational issues related to GDS. Doucette et al. [82] analyzed ShotSpotter’s impact across 68 metropolitan U.S. counties over nearly two decades and found no significant effect on firearm-related homicides or arrests. In Chicago, research indicated that ShotSpotter reallocated officer time away from other duties, yet officers were often dispatched more slowly and arrived later to scenes, resulting in a decreased probability of arrest [83]. Another Chicago-based study found that while GDS deployment coincided with a decline in citizen stops, it also led to an increase in complaints against officers [84]. In Philadelphia, the system notably increased the workload for officers responding to unfounded incidents where no evidence of a shooting existed [77]. Findings in St. Louis mirrored this, showing that GDS did not significantly reduce violent crime but did increase the demand for police resources, offering little benefit to agencies already facing high call volumes [79]. Finally, a Kansas City study concluded that GDS did not significantly improve the likelihood of evidence collection or the clearing of shooting cases, often leading to unfounded investigations that increased patrol officer workloads without adding investigative value [85].
2. Materials and Methods
In this analysis, we employed Geographic Information Systems (GIS) to analyze the deployment of ALPR cameras and GDS technology across Virginia. We first examined how these surveillance tools are deployed and clustered across the state. Then we focused on areas in which the tools were clustered, while intentionally examining each major reason of the state, and analyzed the surveillance deployment across community racial demographics to identify variations in surveillance impact across different communities.
Neighborhood demographic data was retrieved from the National Historical Geographic Information System (NHGIS), utilizing the 2019–2023 American Community Survey (ACS) five-year estimates at the census tract level. We also integrated demographic attributes from the 2020 United States Census via ESRI. Racial demographics variables were selected based on existing literature regarding the disproportionate impact of surveillance on communities of color.
Because law enforcement agencies and private vendors like Flock Safety and ShotSpotter often lack transparency regarding camera placement, location data for ALPRs was obtained via DeFlock (deflock.me). DeFlock is an open-source, crowdsourced mapping initiative that utilizes OpenStreetMap (OSM)—a free, non-profit mapping platform—to identify and categorize surveillance devices.
While we recognize that crowdsourced data carries a margin of error (e.g., misidentifying a speed camera as an ALPR), it currently serves as the most comprehensive source for statewide deployment data. To date, the only official widespread release of ALPR locations followed a November 2025 federal court order in Virginia, which mandated the disclosure of camera locations in the Hampton Roads region during a Fourth Amendment challenge regarding unreasonable search and seizure.
Surveillance data was extracted from OSM in November 2025 using the Overpass Turbo web platform. The resulting datasets were imported into ArcGIS Pro version 3.6.2 for geospatial processing. The specific code utilized for data extraction is provided in Appendix A. To analyze the relationship between surveillance tools and neighborhood characteristics, we performed a two-directional spatial join in ArcGIS Pro: (1) Point-to-Tract Join: We joined ACS data to each ALPR/GDS location point, assigning the attributes of the surrounding census tract (e.g., percent Black) to each individual device. (2) Tract-to-Point Join: We joined device locations to a census tract shapefile to calculate the total number of cameras within each tract.
This dual-directional approach allowed us to explore bivariate relationships between camera density and racially demographic makeup. Finally, the processed data was exported to SPSS version 29.0.1.0 for statistical analysis, enabling the generation of descriptive statistics to evaluate the geographic and racial demographic disproportionality of surveillance deployment.
3. Results
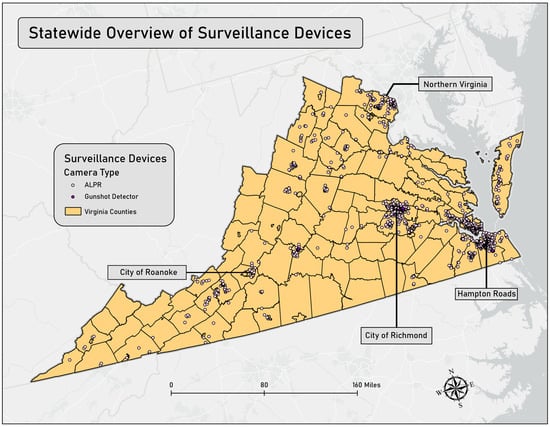
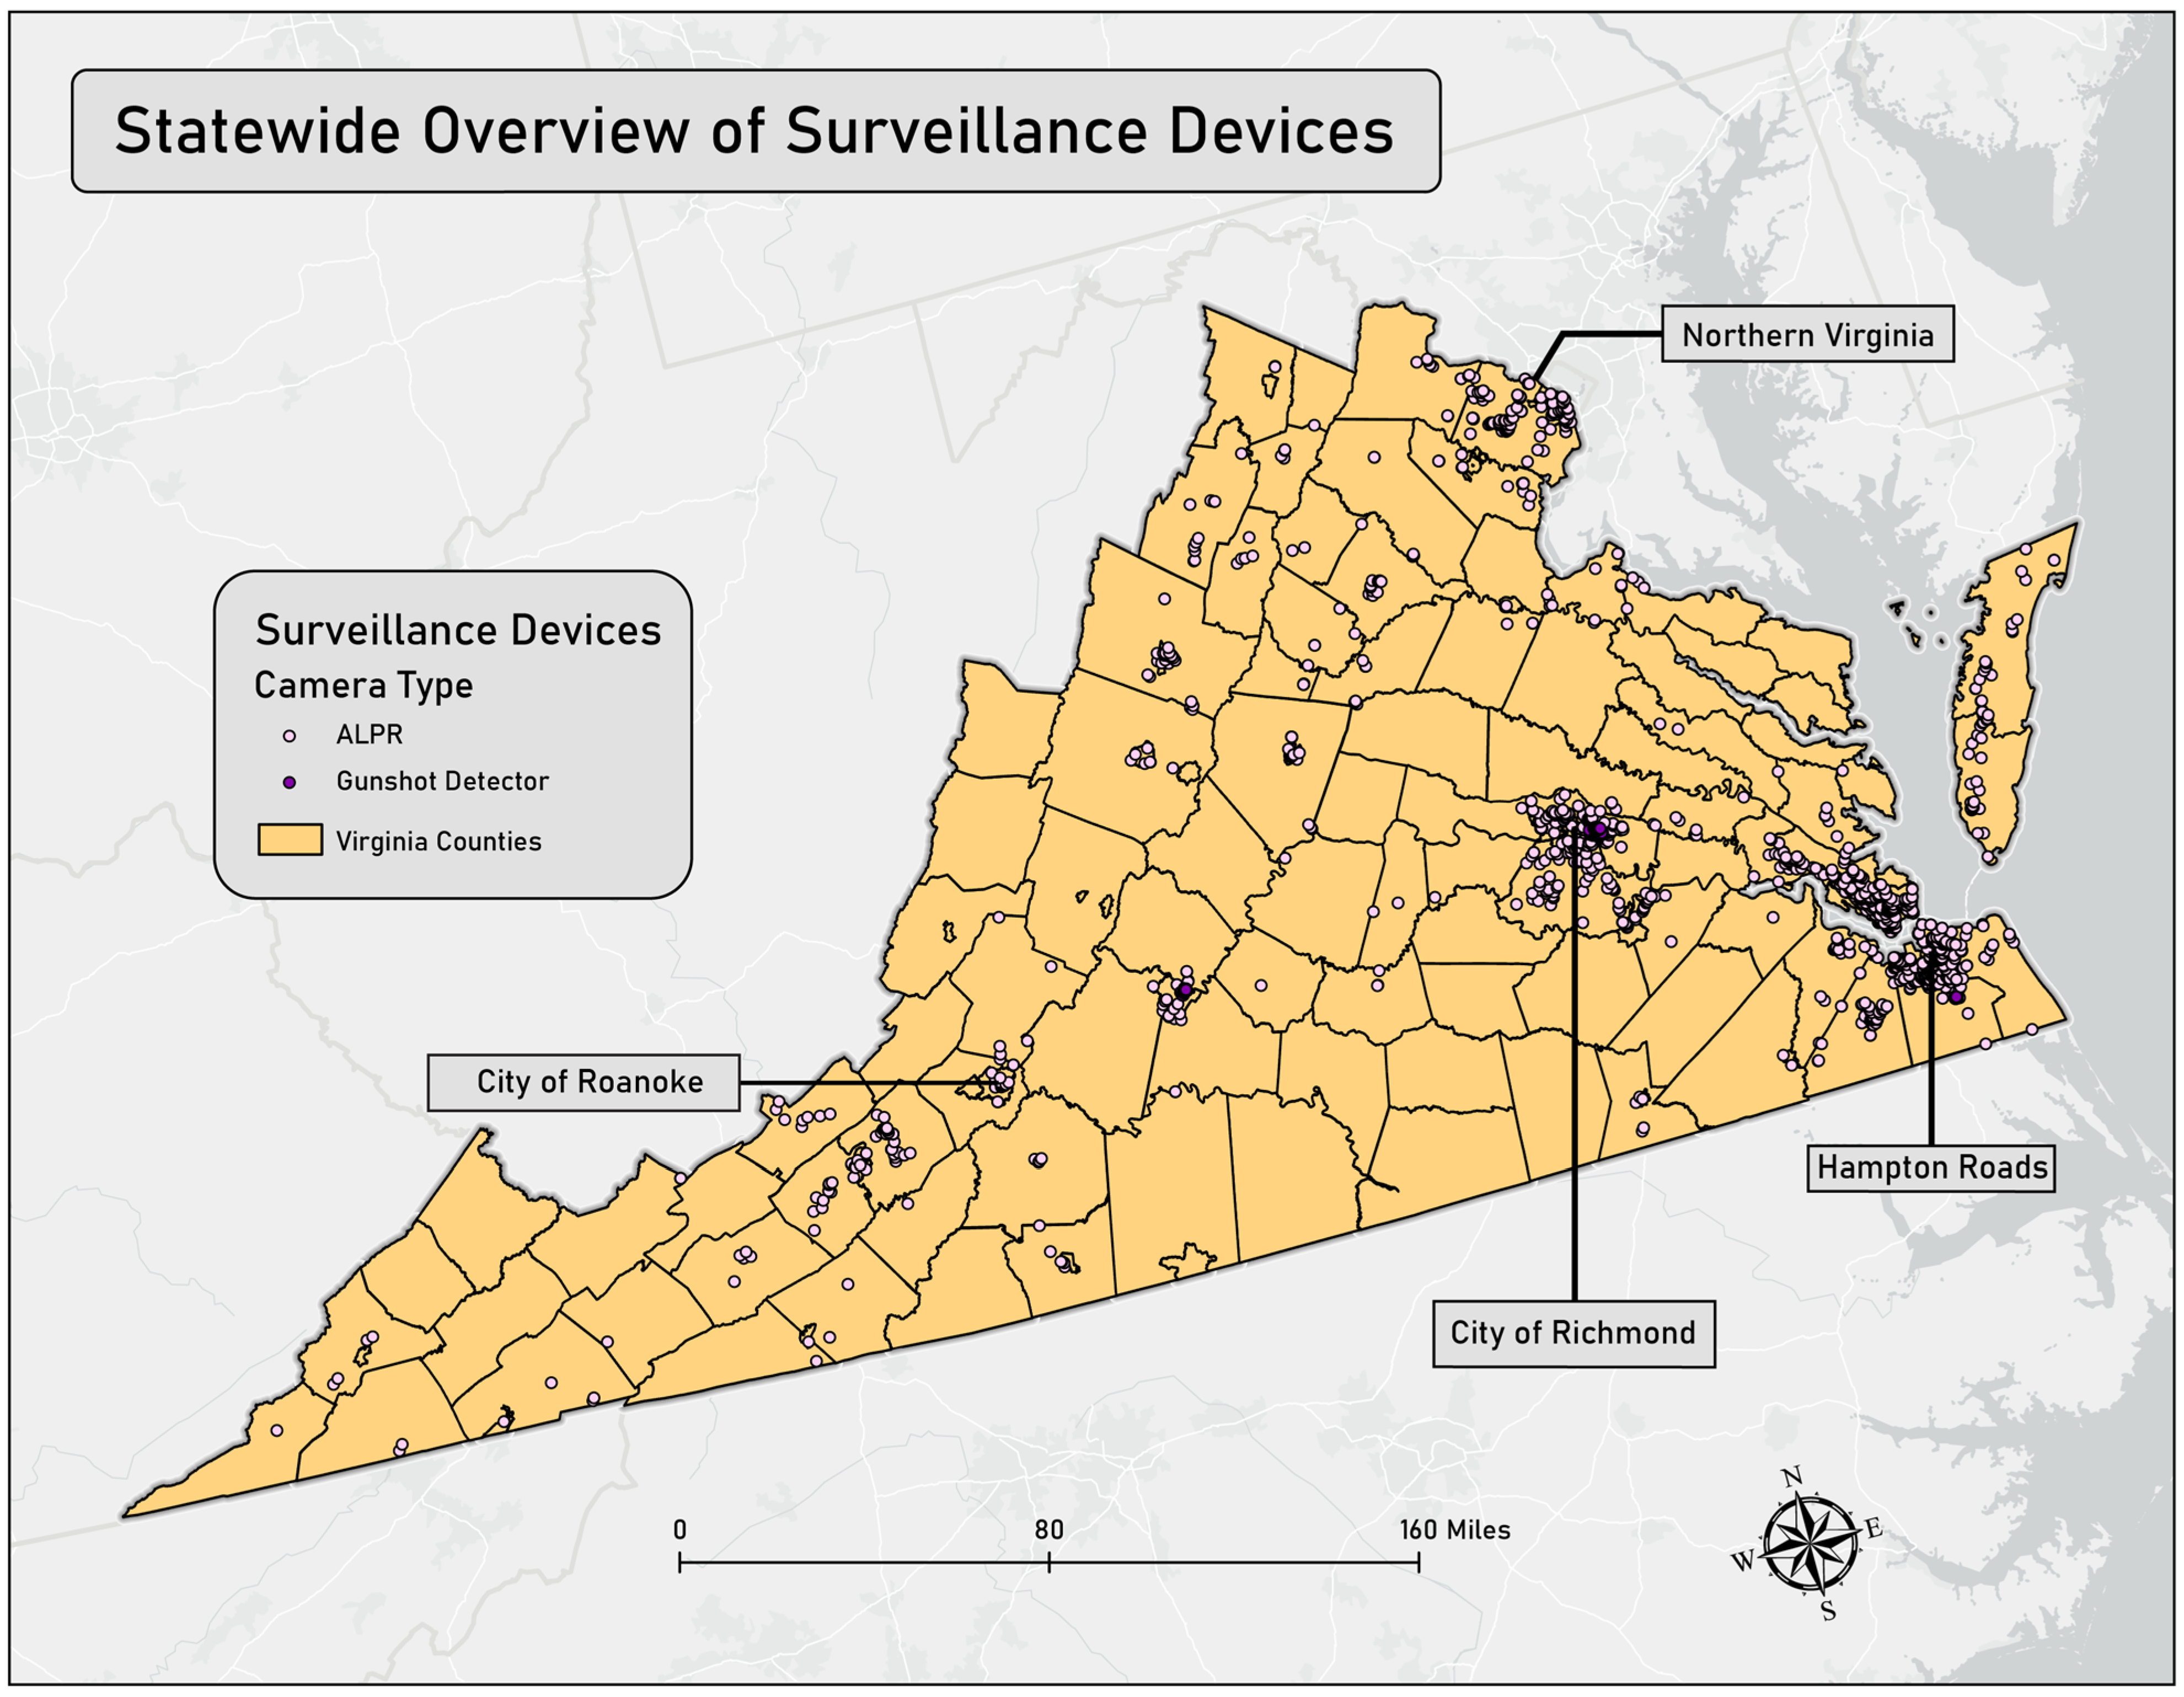
Data acquired from OpenStreetMap identified a total of 1636 surveillance devices throughout the Commonwealth of Virginia. Figure 1 provides a statewide overview of these devices and their specific coordinates.
Figure 1.
Statewide Overview of Surveillance Devices across the Commonwealth of Virginia.
A significant concentration of these devices is located within Virginia’s major metropolitan areas in the Northern Virginia, Richmond metropolitan, and Hampton Roads regions of the state. In the following maps, you will see the Hampton Roads region represented by the city of Norfolk and the surrounding area, which includes Newport News, Hampton, Suffolk, Portsmouth, Chesapeake, and Virginia Beach in addition to Norfolk. While ALPRs constitute the vast majority of surveillance devices statewide, GDS are notably prevalent in the cities of Richmond, Lynchburg, and Chesapeake. The city of Richmond had the most reported ALPR cameras and GDS technology (n = 144), followed by Norfolk (n = 142), Hampton (n = 128), Newport News (n = 104), Henrico County (n = 100), and Fairfax County (n = 91). These areas are within the Northern Virginia, Richmond metropolitan, and Hampton Roads regions of the state. When considering population, Hampton (93.03 per 100,000), Richmond (63.55 per 100,000), Norfolk (59.66 per 100,000) and Newport News (56.81 per 100,000) had particularly high rates of surveillance technology. Figure 1 displays the crowdsourced locations of ALPR cameras and GDS technology across Virginia.
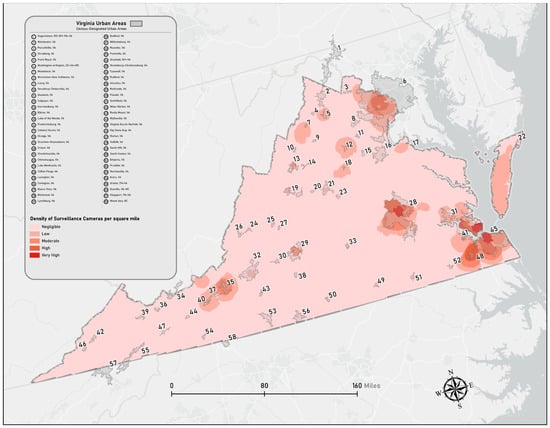
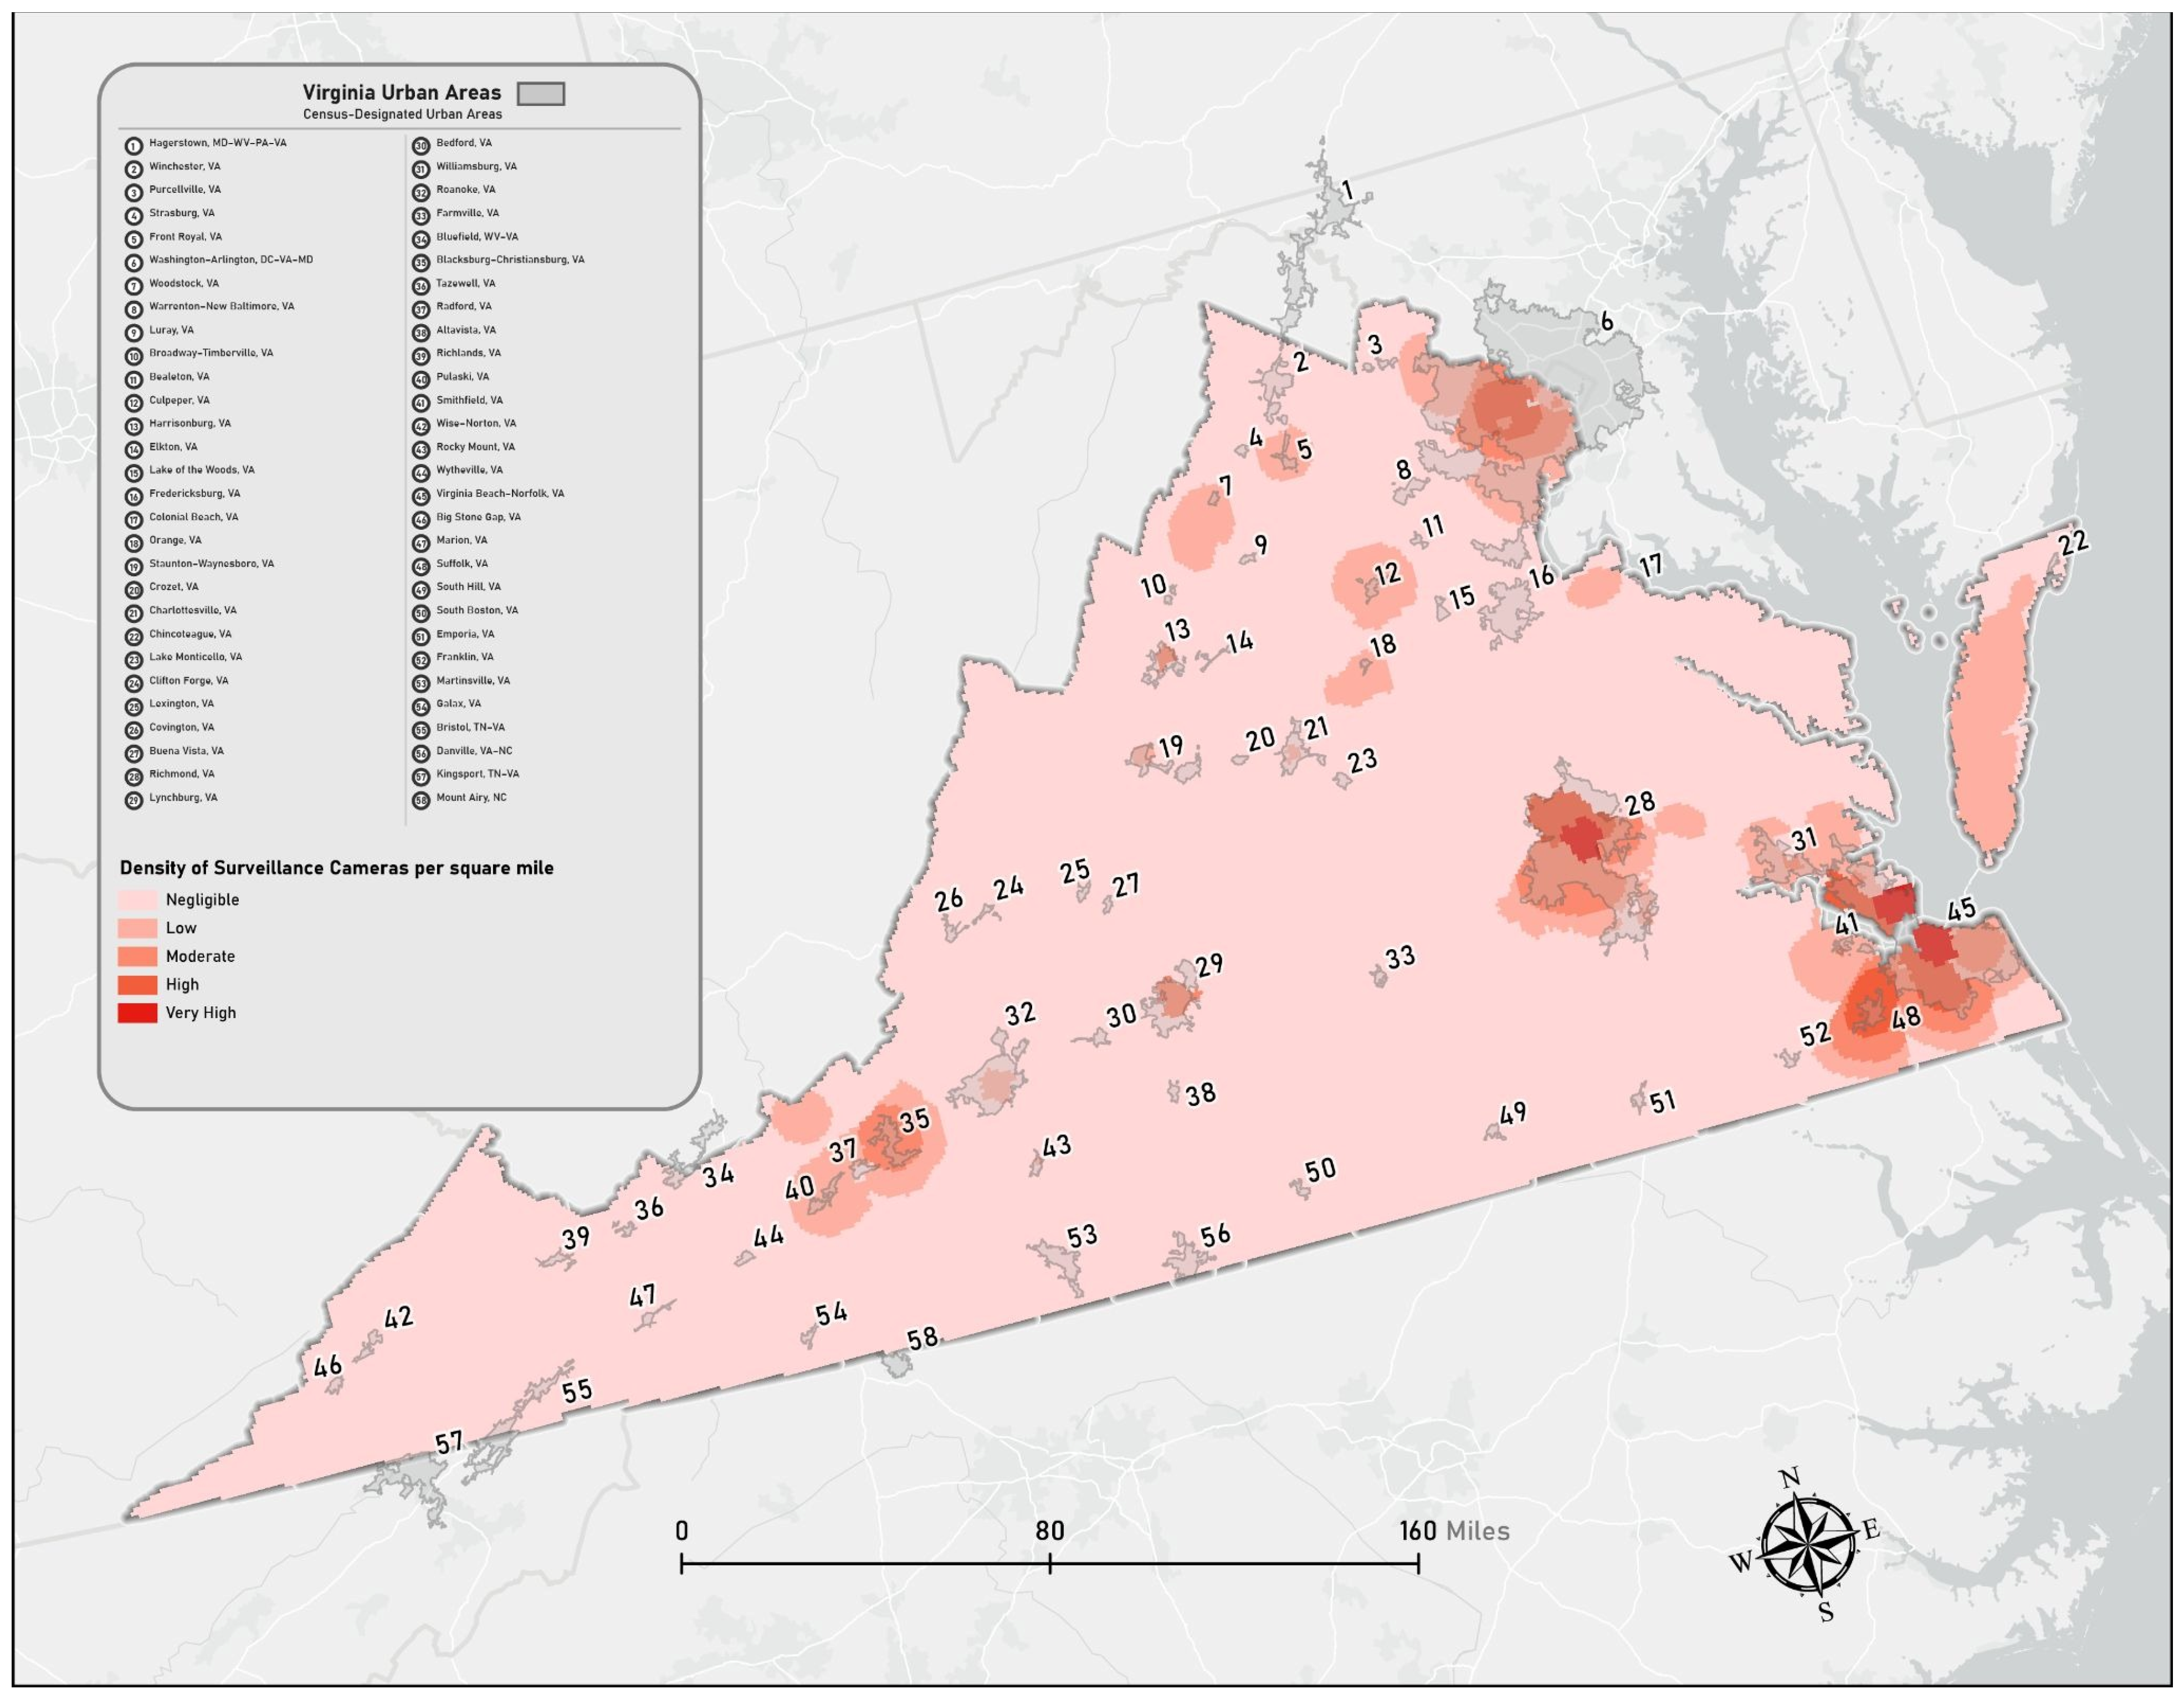
To measure the intensity of surveillance, we utilized a kernel density geoprocessing tool to determine the concentration of cameras per square mile. This tool calculates a magnitude-per-unit area from point or polyline features to fit a smoothly tapered surface to each feature. The default search radius is computed specifically for the input dataset using a spatial variant of Silverman’s Rule of Thumb, which is sufficiently robust to account for spatial outliers.
The map below displays the output of the kernel density analysis for Virginia, overlaid with Census Designated Urban Areas. Lighter red shading indicates a lower density of surveillance cameras, while darker red signifies a higher concentration per square mile. The layer is categorized into five classes: Negligible, Low, Moderate, High, and Very High. High camera densities are prominent within several urban areas, specifically Virginia Beach-Norfolk, Suffolk, Richmond, Washington-Arlington, Lynchburg, Blacksburg-Christiansburg, and Roanoke. The highest density levels are concentrated in Richmond and the Hampton Roads region—the latter of which includes Norfolk, Newport News, Hampton, Suffolk, Portsmouth, Chesapeake, and Virginia Beach.
An analysis of the state’s highest mean kernel densities reveals that the top 14 census tracts are located within the City of Richmond (ranging from 0.52–0.55). Furthermore, of the top 68 census tracts with the highest mean densities, all are located in Richmond and Norfolk. Both cities share a peak mean kernel density of 0.49 across these tracts. Following Richmond and Norfolk, the localities with the next highest mean kernel densities are Hampton (0.47), Newport News (0.33), Henrico County (0.27), Portsmouth (0.27), and Fairfax County (0.23). Figure 2 illustrates the results of this kernel density analysis.
Figure 2.
Kernel Density Analysis of Surveillance Cameras Per Square Mile in the Commonwealth of Virginia.
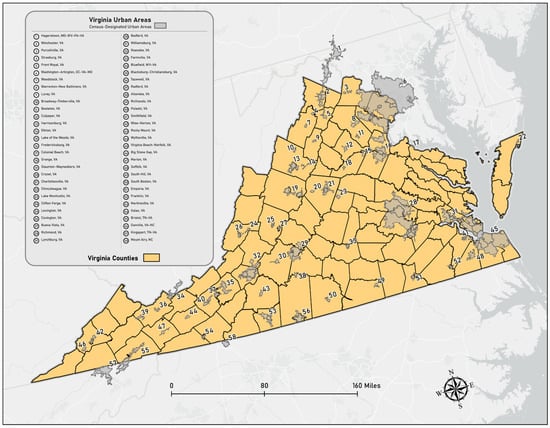
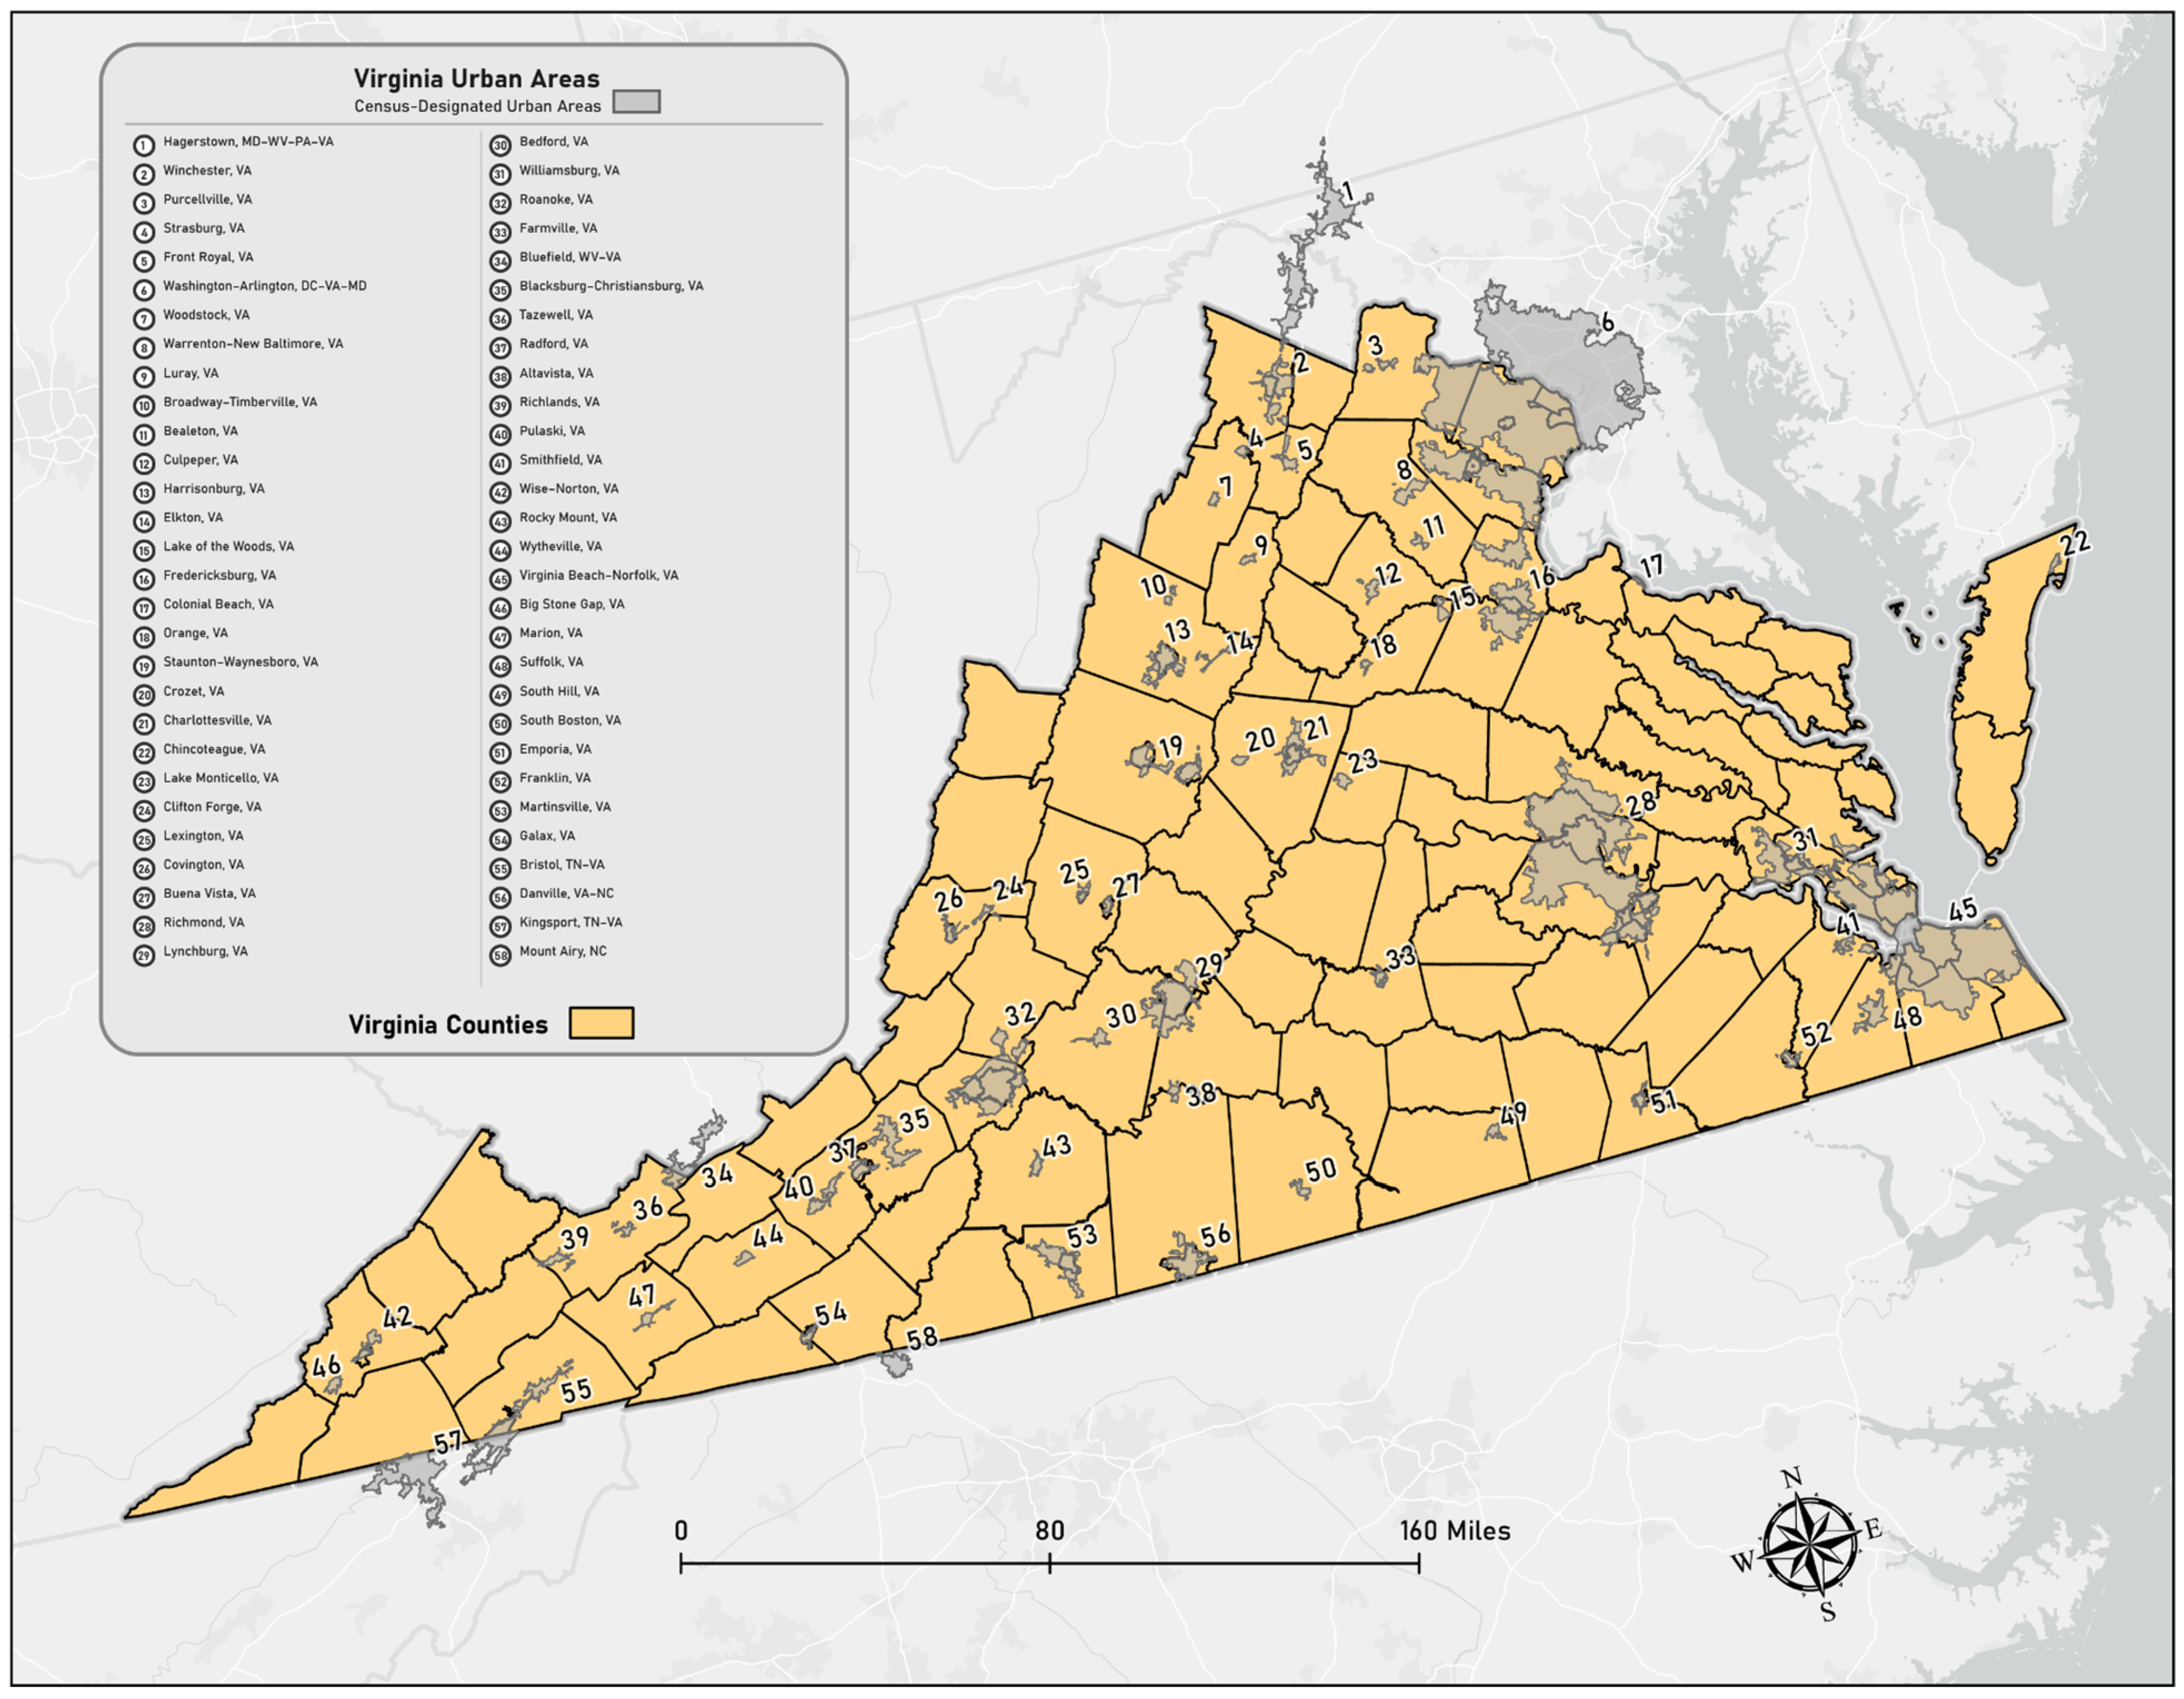
The map below illustrates the Census Designated Urban Areas for Virginia. To qualify as a Census Designated Urban Area, a region must encompass at least 2000 housing units or maintain a population of at least 5000 individuals. When comparing camera distribution, approximately 1421 cameras (87%) were located in urban areas, while only 218 (13%) were situated in non-urban areas. Given this concentration within urban centers, we performed zonal statistics for census tracts intersecting these areas. The zonal statistics process overlays the kernel density results onto selected polygons (urban census tracts) and calculates the average of the underlying raster cells to produce mean density values. This provides a more granular understanding of which specific census tracts possess the highest camera densities. Figure 3 displays the urban areas of Virginia.
Figure 3.
Census Designated Urban Areas for the Commonwealth of Virginia.
After creating these statewide maps, we focused our analysis on Norfolk and Richmond given their high rate of surveillance tools, as well as the Northern Virginia region given their high total in surveillance tools and population. We also analyzed Roanoke since they are a major area located in the western part of the state and would assure each major geographic region of Virginia was represented.
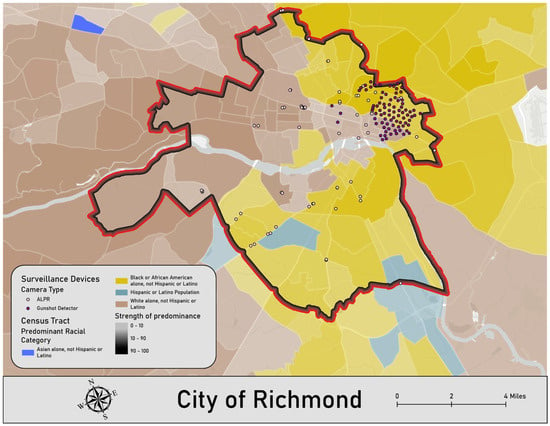
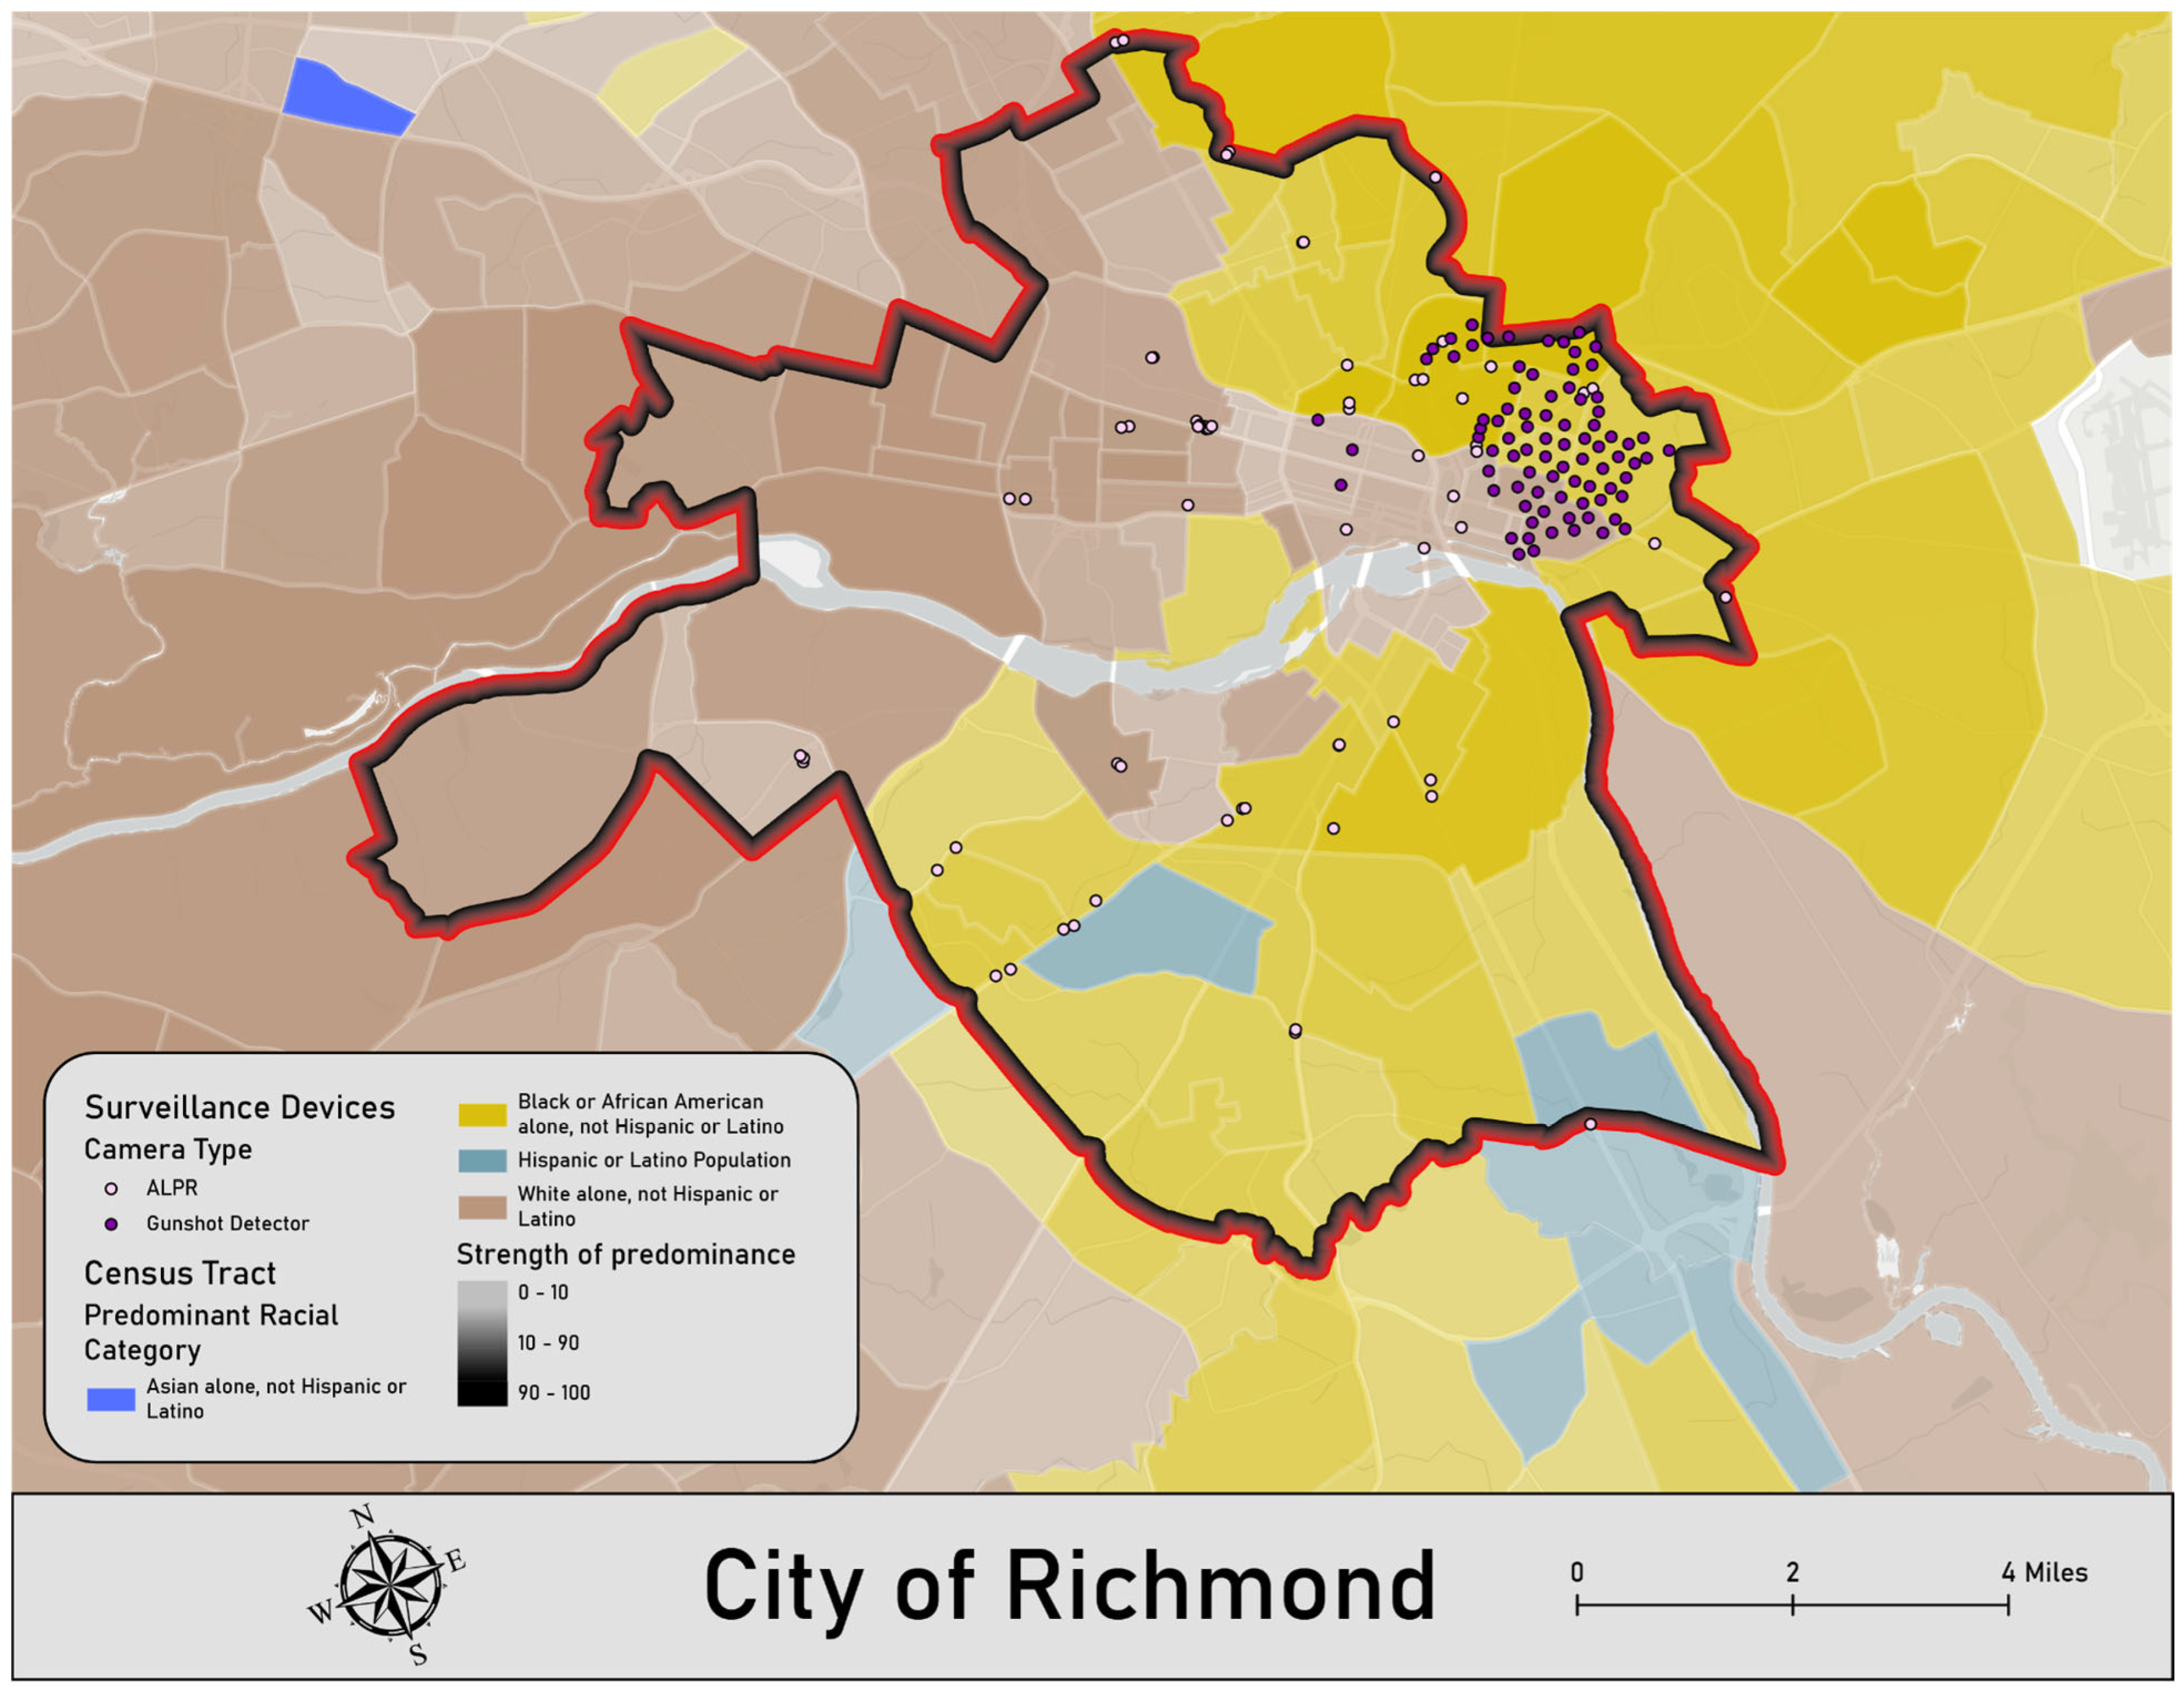
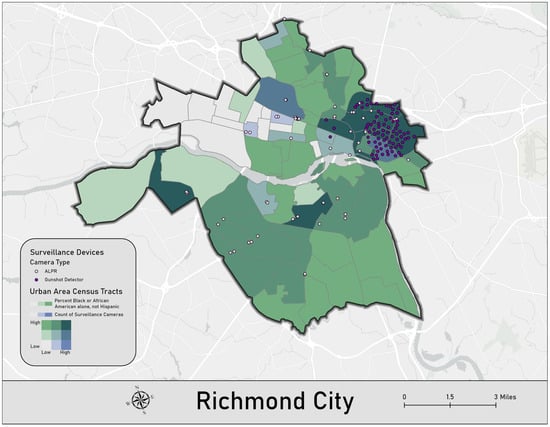
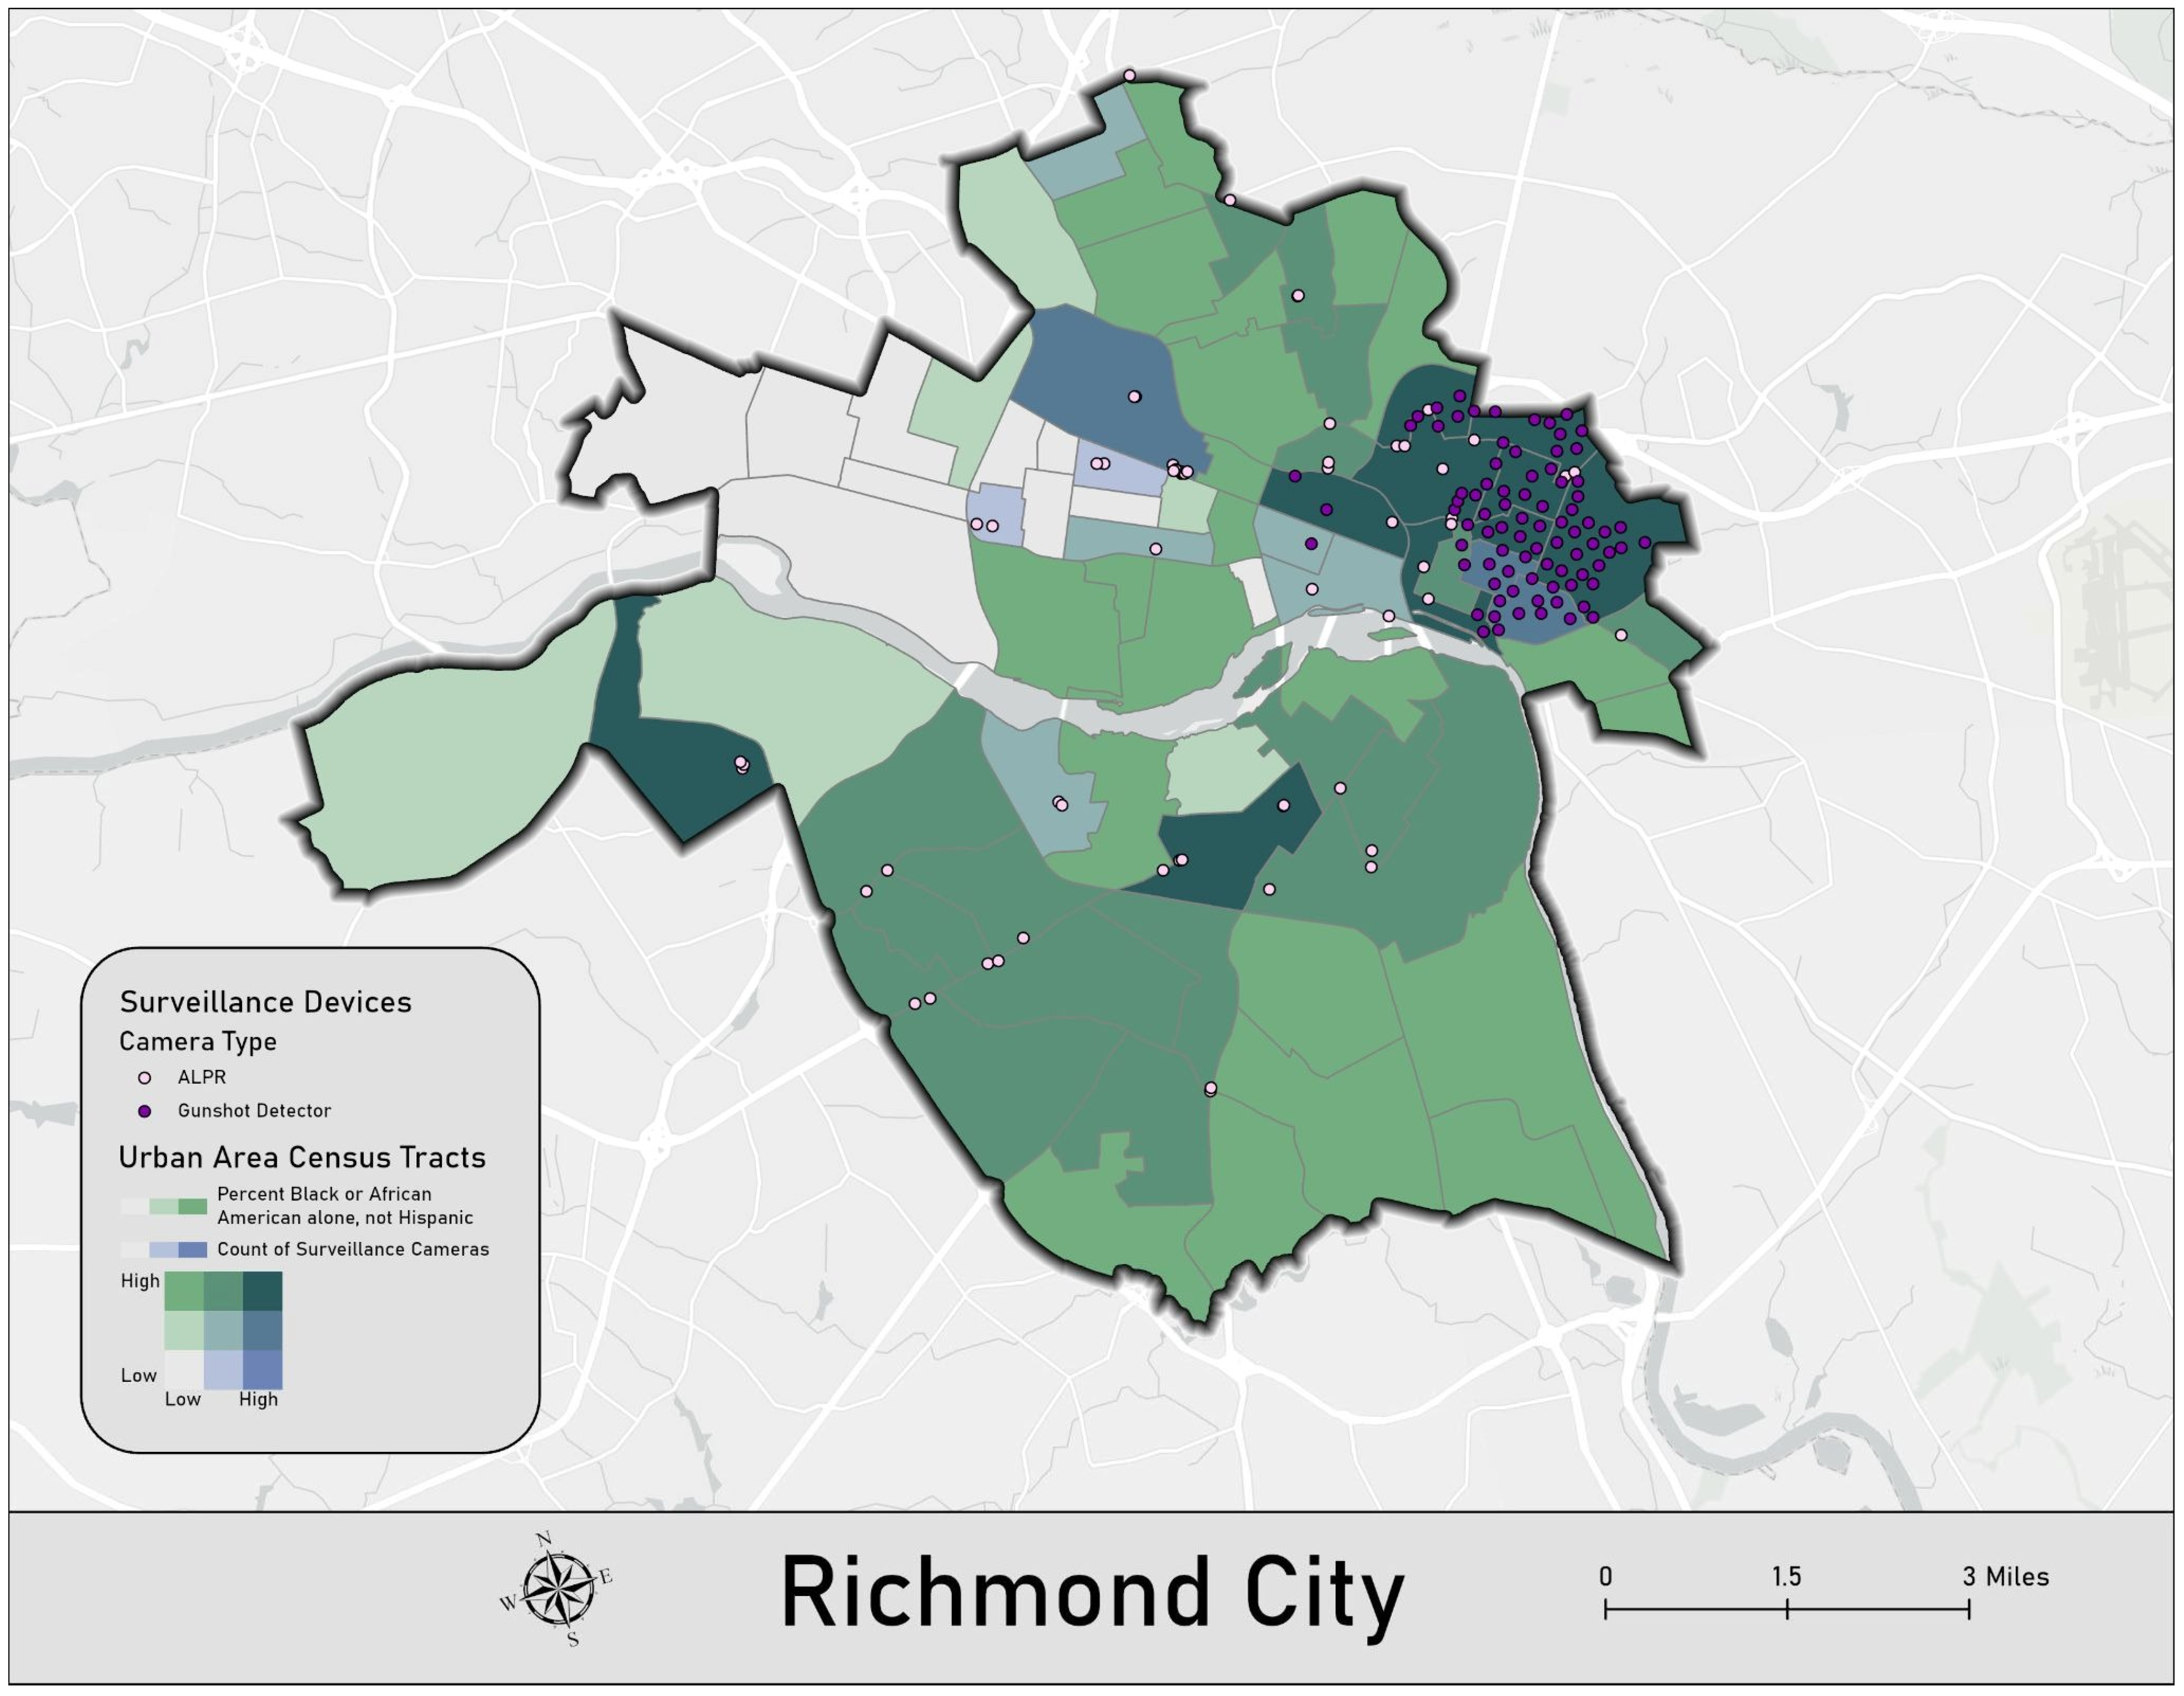
The City of Richmond contains a total of 144 surveillance devices within its boundaries. The distribution of these devices is heavily concentrated within predominantly African American census tracts. This demographic disparity is particularly acute regarding gunshot detectors, which are situated almost exclusively in African American census tracts. While ALPR cameras are also frequently located in these areas, some are deployed in predominantly White census tracts; however, it is important to note that the demographic margin in these White tracts is relatively low, often representing a more racially mixed sociodemographic profile compared to the heavily concentrated GDS zones. Specifically, the census tract with the most ALPR cameras and GDS technology (n = 23) is approximately 62.4% African American. The second and third most concentrated census tract had 13 and 12 surveillance tools respectively, with their populations being 88.6% and 92.9% African American respectively. Figure 4 displays the ALPR cameras and GDS technology locations reported in Richmond.
Figure 4.
Overview of Surveillance Devices in the City of Richmond, Virginia.
The kernel density analysis revealed further patterns of surveillance within the City of Richmond. Among the 10 census tracts with the highest mean kernel densities (ranging from 0.53–0.55), seven are majority Black (ranging from 61–92%), two are majority White (52% and 70%), and the final tract has a White plurality (49% White) followed by Black residents (31%). When expanding the analysis to the top 15 census tracts (ranging from 0.52–0.55), 11 are majority Black (ranging from 52–92%). To further contextualize how camera distribution varies across racial demographics in Richmond, Figure 5 displays a bivariate analysis of the relationship between surveillance tool distribution and race. Specifically, the blue color bar represents surveillance technology counts, while the green color bar represents the percentage of the Black or African American population. Darker teal shades (the mixture of green and blue) represent tracts with both higher surveillance technology counts and higher percentages of Black residents.
Figure 5.
Bivariate Analysis of Surveillance Technology and Race in the City of Richmond, Virginia.
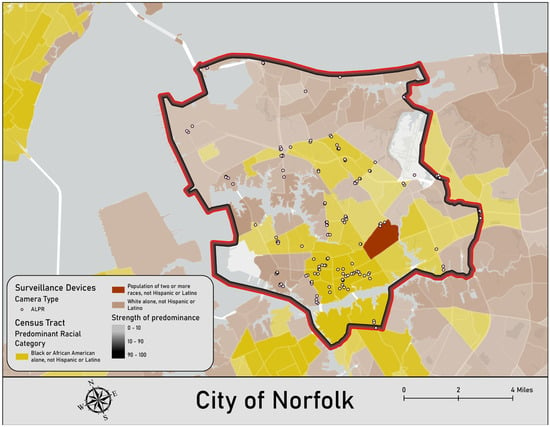
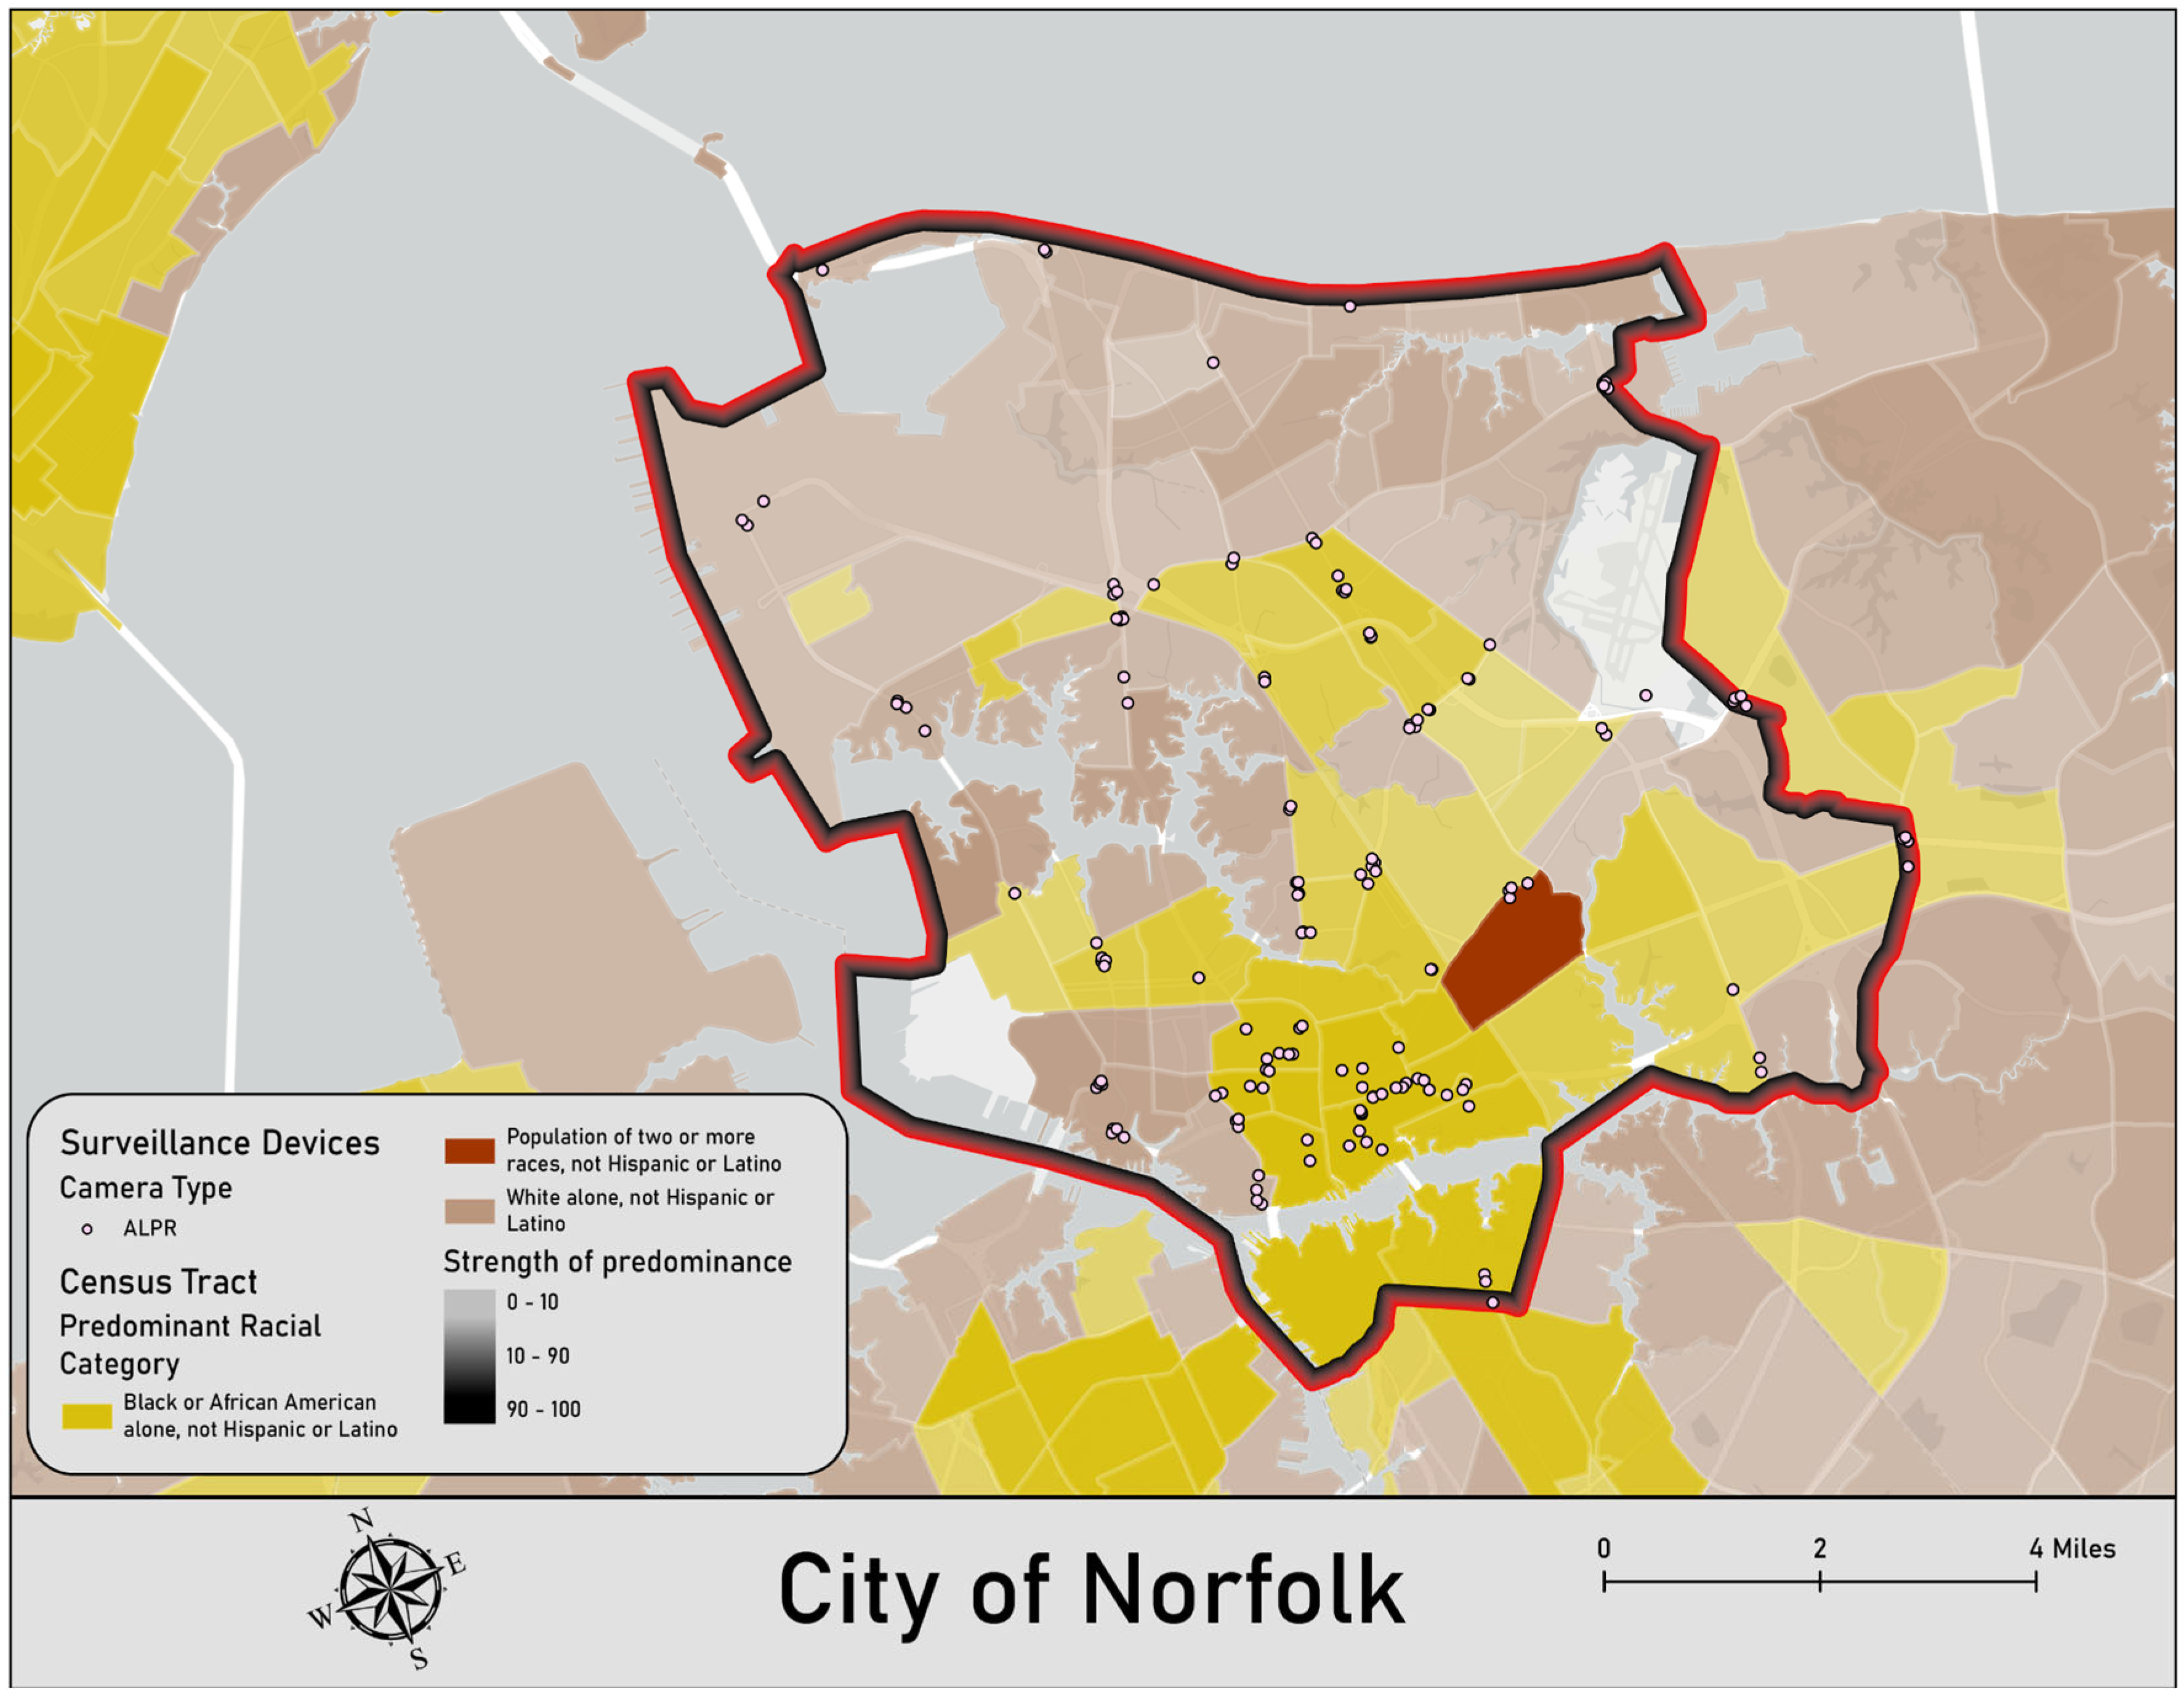
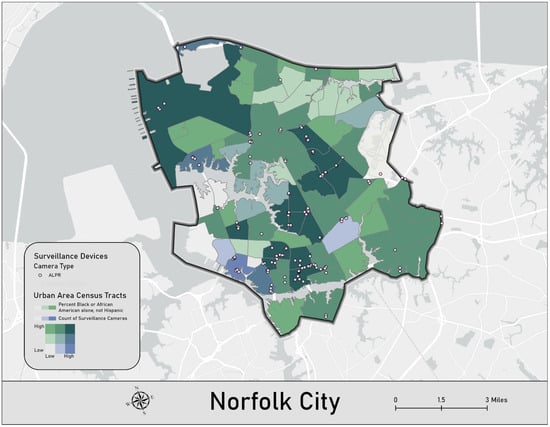
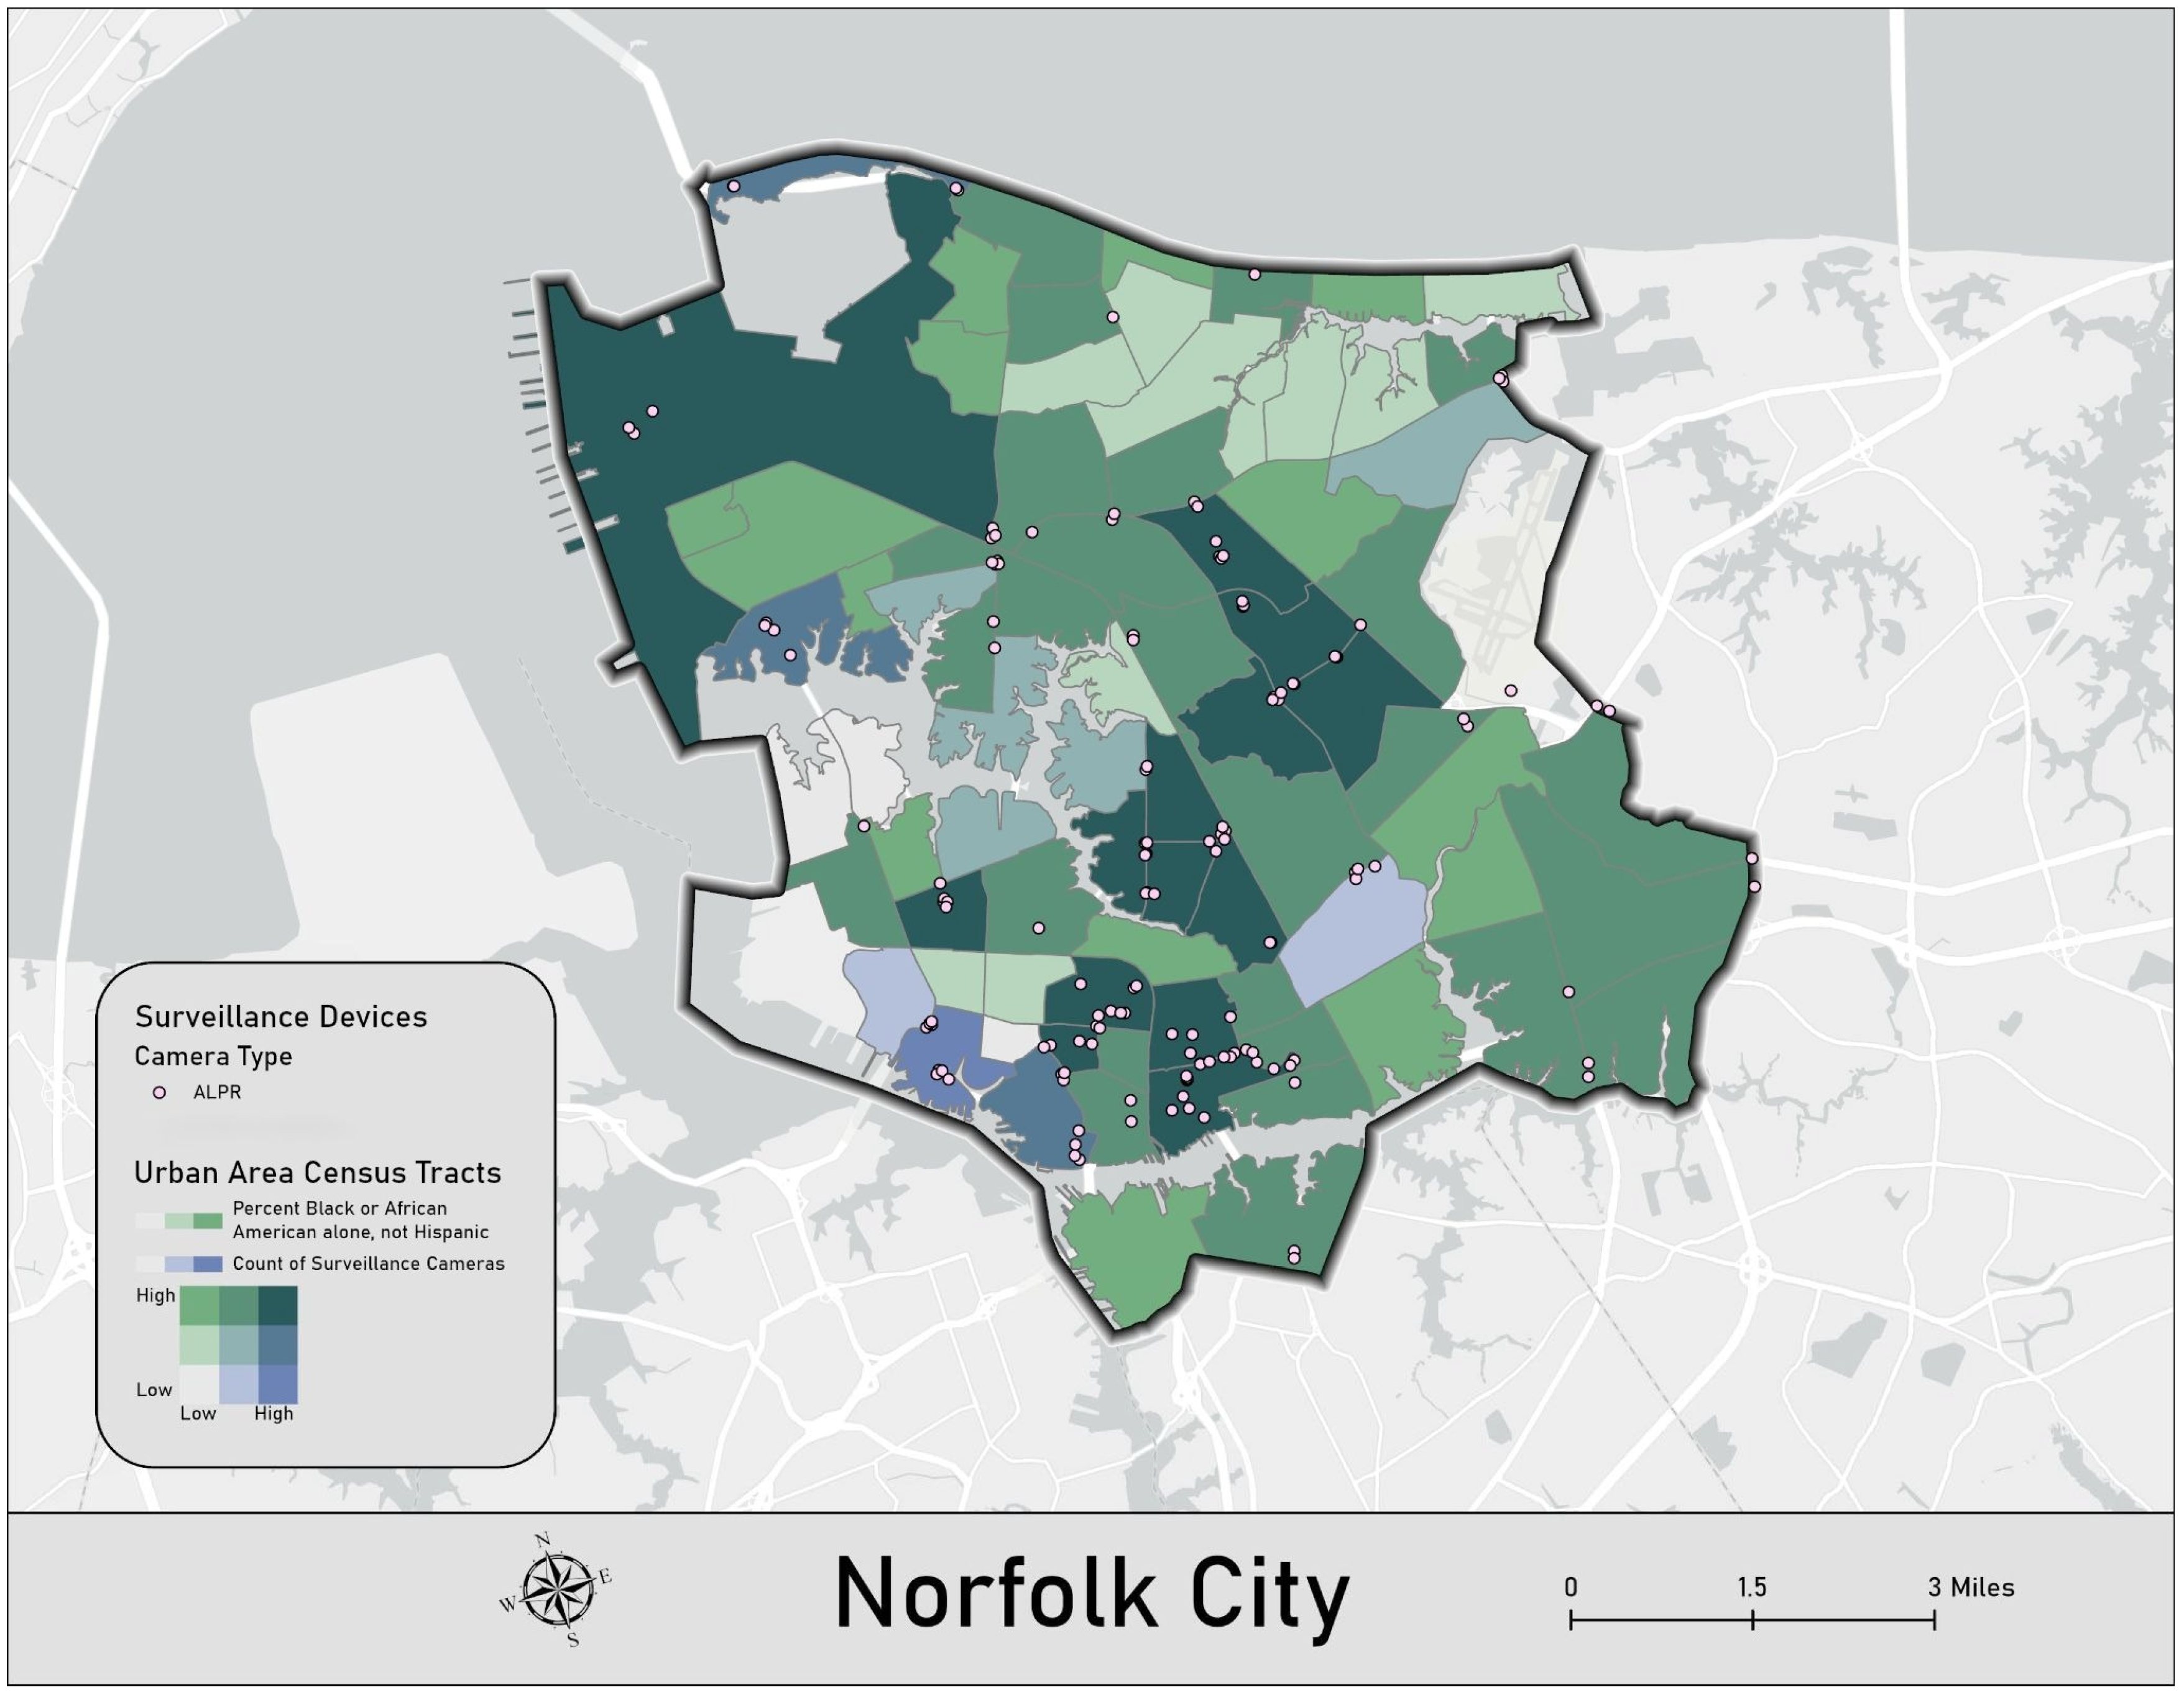
In the city of Norfolk, we identified a total of 142 reported surveillance devices located within the municipal boundaries. These devices consist exclusively of ALPR cameras. Geospatial analysis indicates that these units are primarily situated within predominantly African American census tracts. In fact, the census tract with the most cameras (n = 18) in Norfolk is approximately 92.8% African American. Figure 6 displays the surveillance tool locations reported in Norfolk.
Figure 6.
Overview of Surveillance Devices in the City of Norfolk, Virginia.
The kernel density analysis further contextualizes the concentration of surveillance technology as it relates to community demographics. In Norfolk, of the 10 census tracts with the highest mean kernel densities (ranging from 0.51–0.52), six have a majority Black population (ranging from 65–80%). Of the remaining four census tracts, two have a majority White population (57% and 77%, respectively), one has a Black plurality (49%), and one has a White plurality (49%). Thus, within these 10 tracts, Black residents constitute the most common demographic in seven tracts, while White residents are the most common in three. To further illustrate how camera distribution varies across racial demographics in Norfolk, Figure 7 displays a bivariate analysis of the relationship between surveillance tool distribution and race. Specifically, the blue color bar represents surveillance technology counts, while the green color bar represents the percentage of the Black or African American population. Darker teal shades (the mixture of green and blue) represent tracts with both higher surveillance technology counts and higher percentages of Black or African American residents.
Figure 7.
Bivariate Analysis of Surveillance Technology and Race in the City of Norfolk, Virginia.
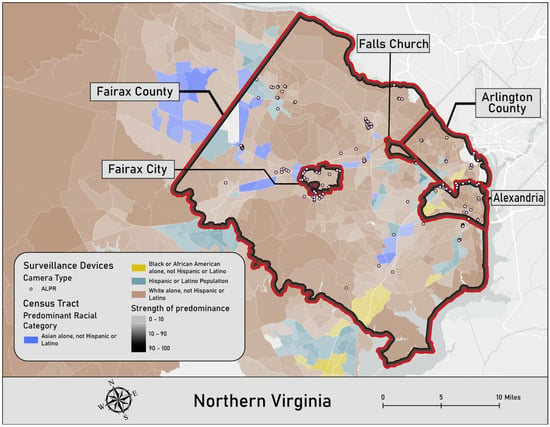
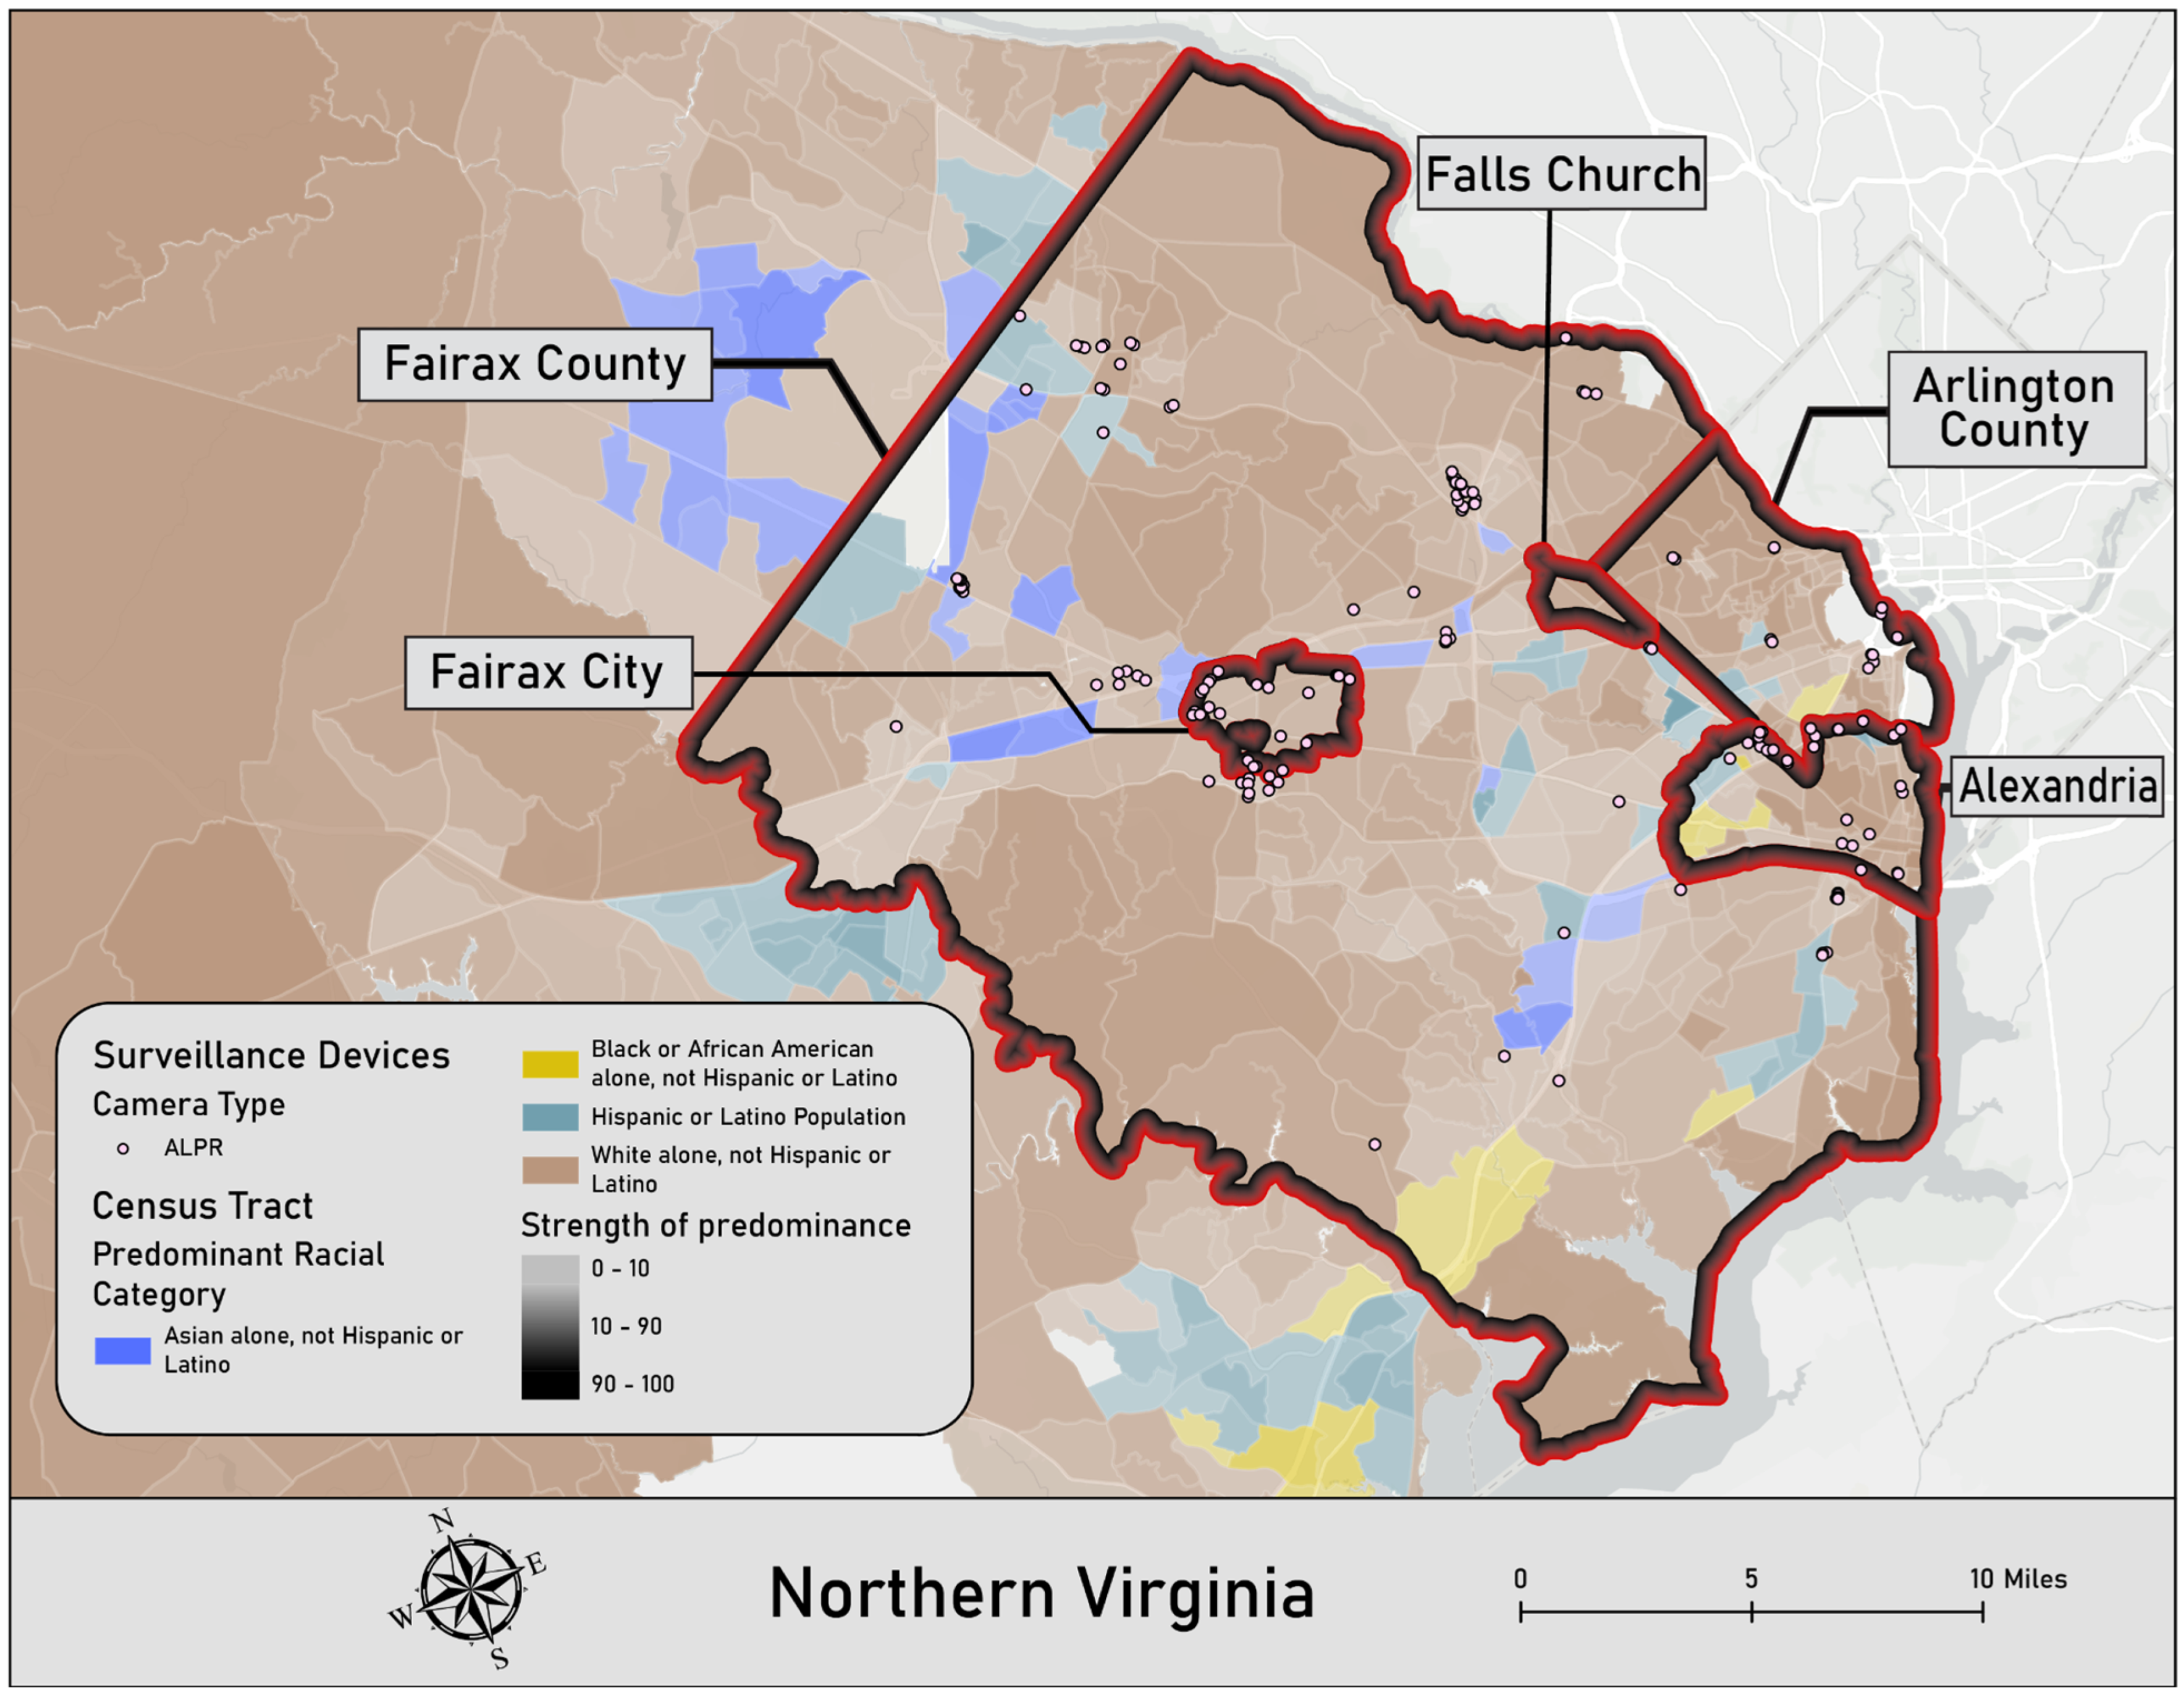
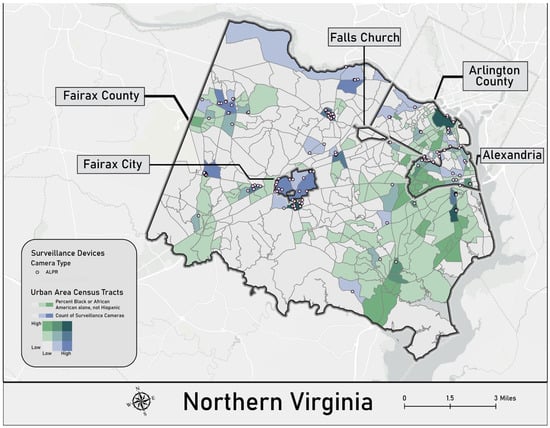
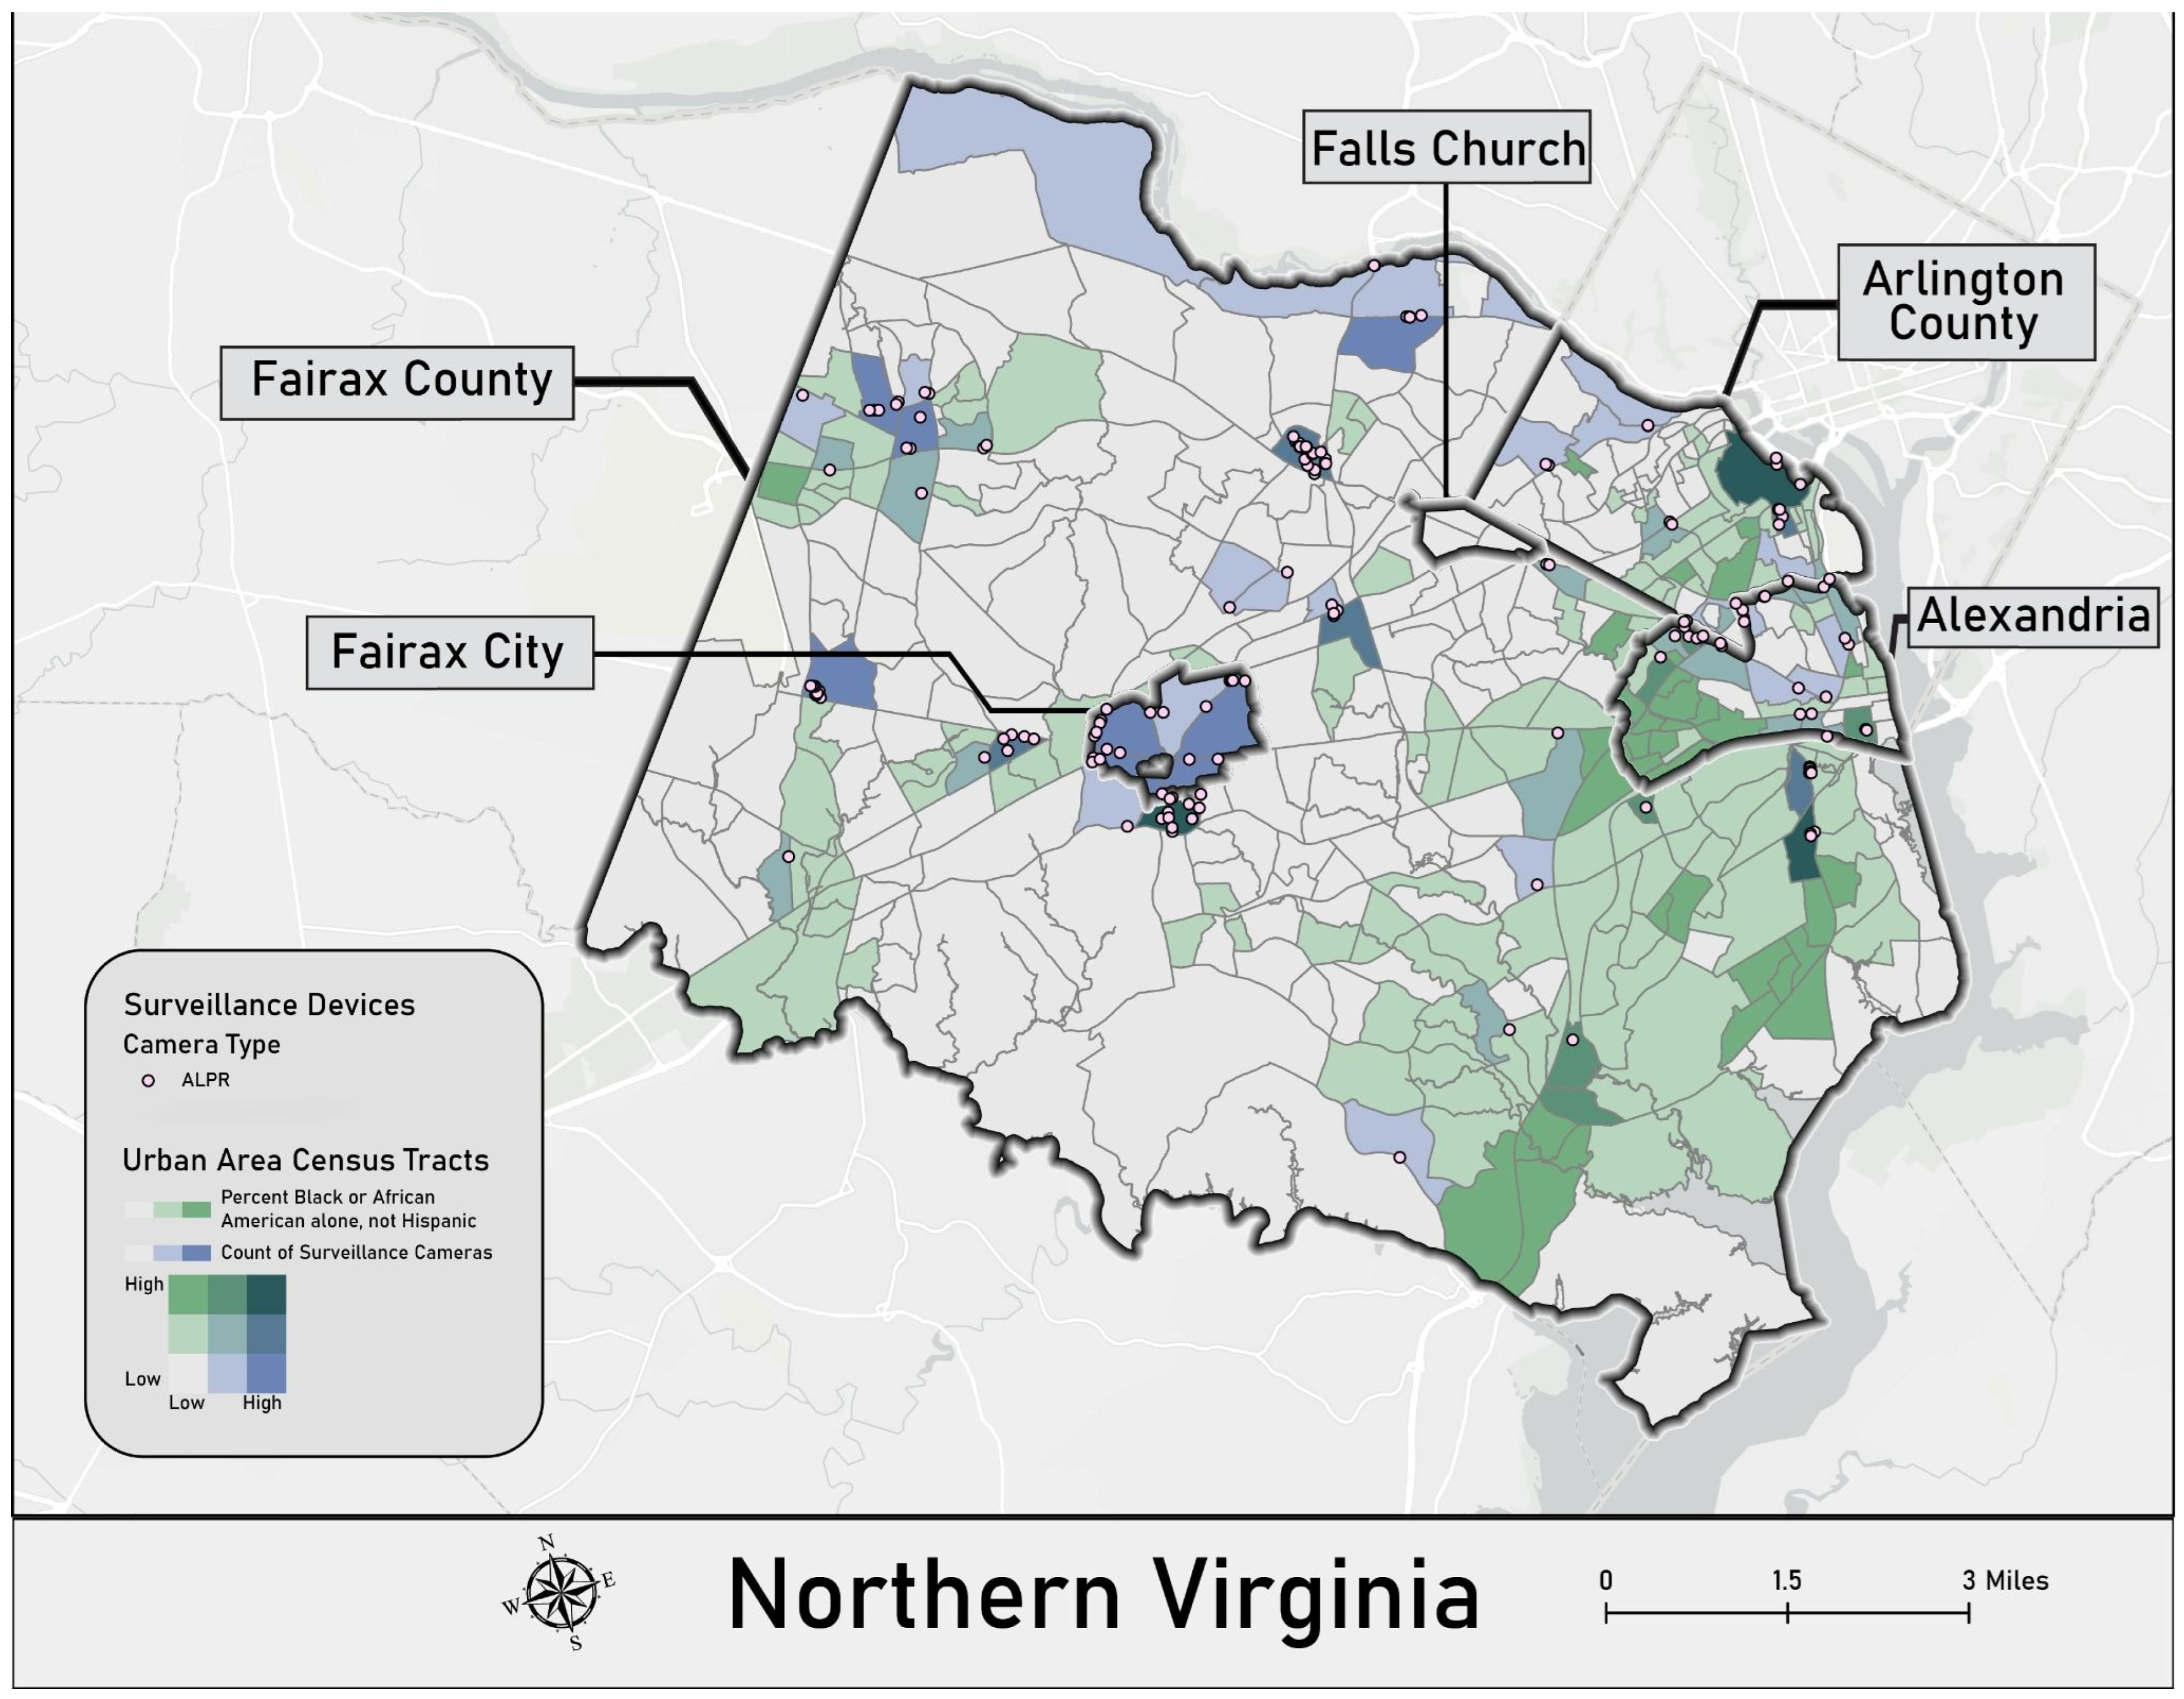
Surveillance devices across the Northern Virginia region were mapped to determine their distribution across census tracts. The Northern Virginia analysis focused upon Fairfax County with Alexandria, Arlington County, Fairfax City, and Falls Church contained within the county’s geographic borders. Across this region, there are 152 reported surveillance devices, with 91 in Fairfax County, 22 in the city of Alexandria, 21 in Fairfax City, 18 in Arlington County, and none in Falls Church. Unlike the patterns observed in Norfolk and Richmond, these devices are more likely to be located in census tracts with predominantly two or more races and predominantly White census tracts. The geospatial mapping also reveals a number of surveillance technology positioned near and/or in census tracts that are predominantly Asian and Hispanic or Latino. Figure 8 displays the ALPR cameras and GDS technology locations reported in the Northern Virginia region.
Figure 8.
Overview of Surveillance Devices in the Counties of Fairfax and Arlington.
The kernel density analysis revealed further patterns of surveillance in the Northern Virginia region. Across this area, the highest mean kernel densities are concentrated within Fairfax County census tracts. Of the 10 census tracts with the highest mean kernel densities (ranging from 0.22–0.23), eight are majority White (ranging from 61–78%). In the remaining two census tracts, a plurality of the population is White (41% and 42%, respectively), followed by Asian residents (33% and 35%) and Hispanic residents (17% in both tracts). To further contextualize how the distribution of cameras varies across racial demographics in Northern Virginia, Figure 9 displays a bivariate analysis of the relationship between surveillance tool distribution and race. Specifically, the blue color bar represents surveillance technology counts, and the green color bar represents the percentage of the Black or African American population. Darker teal shades (the mixture of green and blue) represent tracts with both higher surveillance technology counts and higher percentages of Black or African American residents.
Figure 9.
Bivariate Analysis of Surveillance Technology and Race in Northern Virginia.
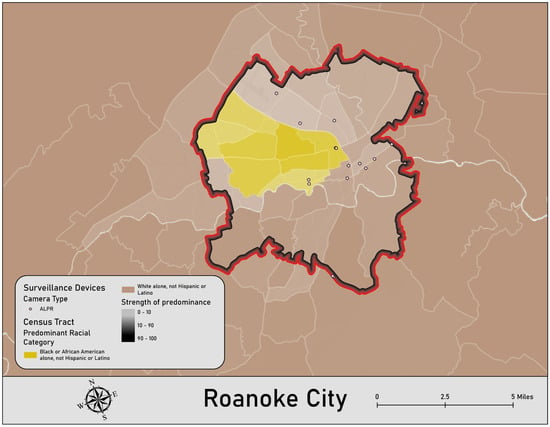
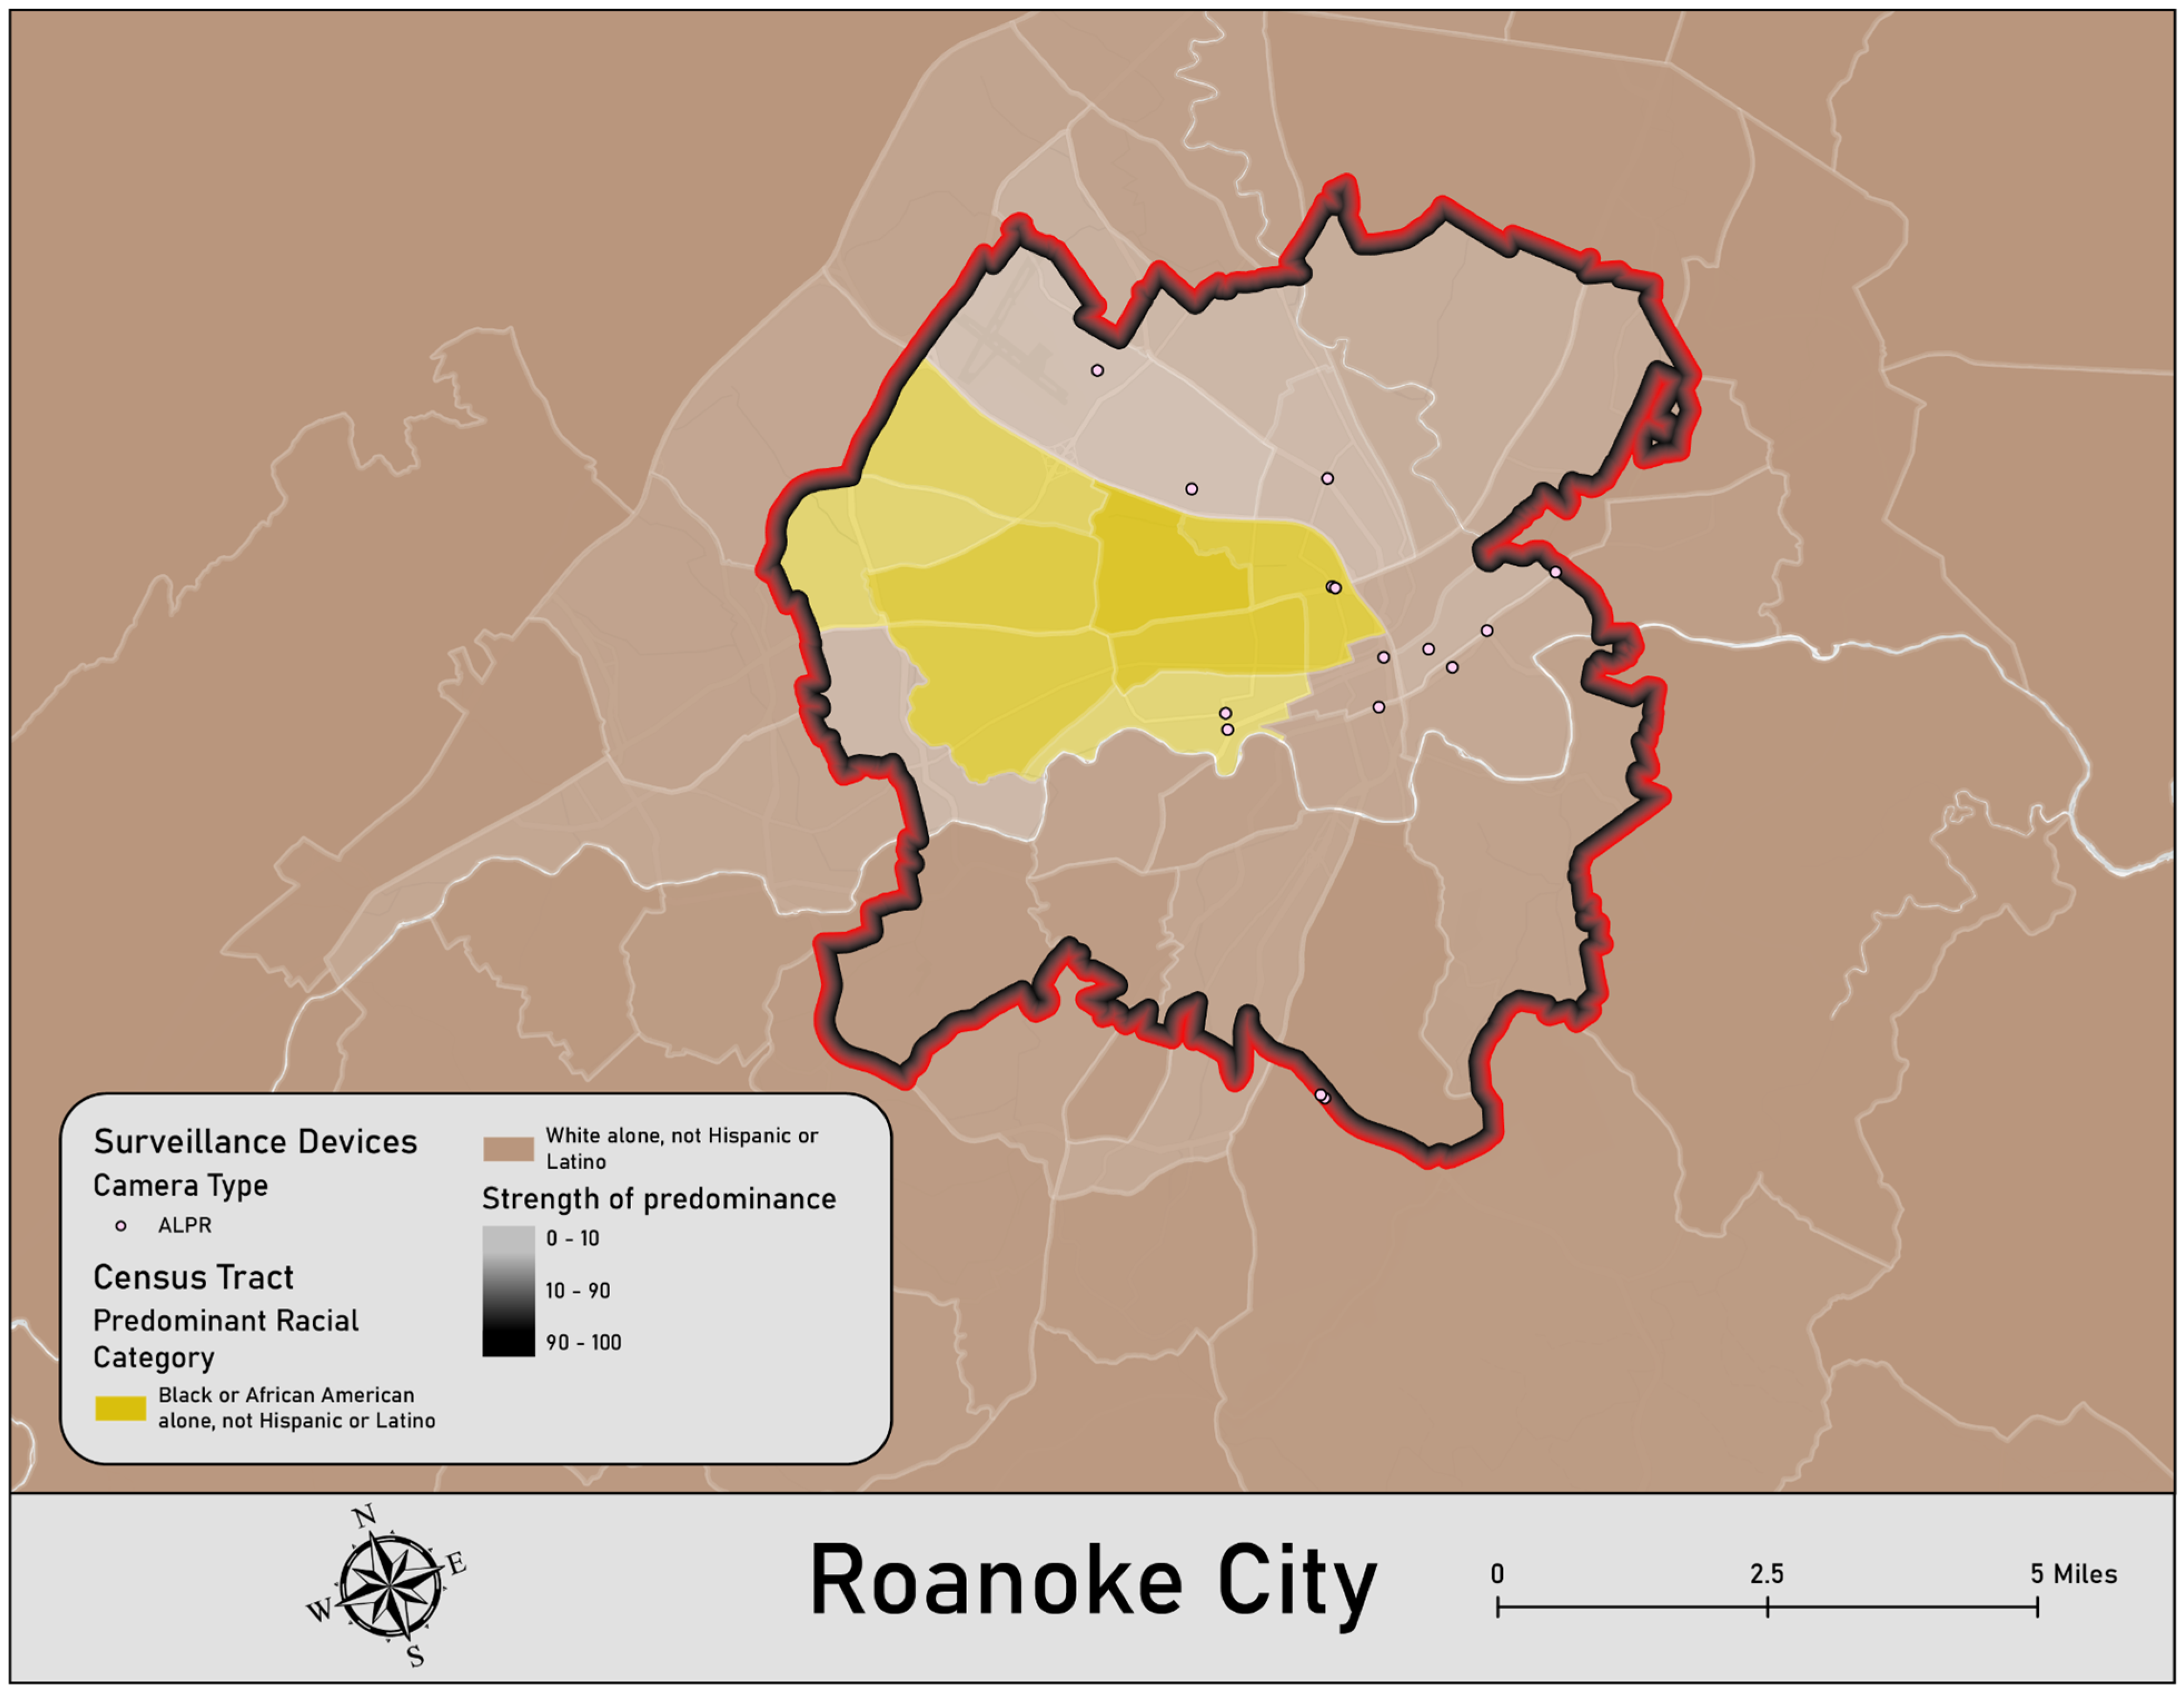
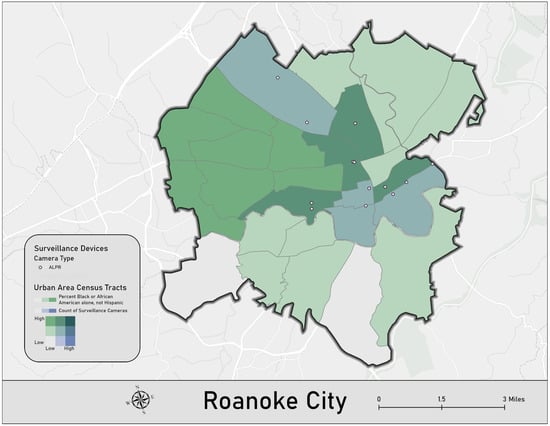
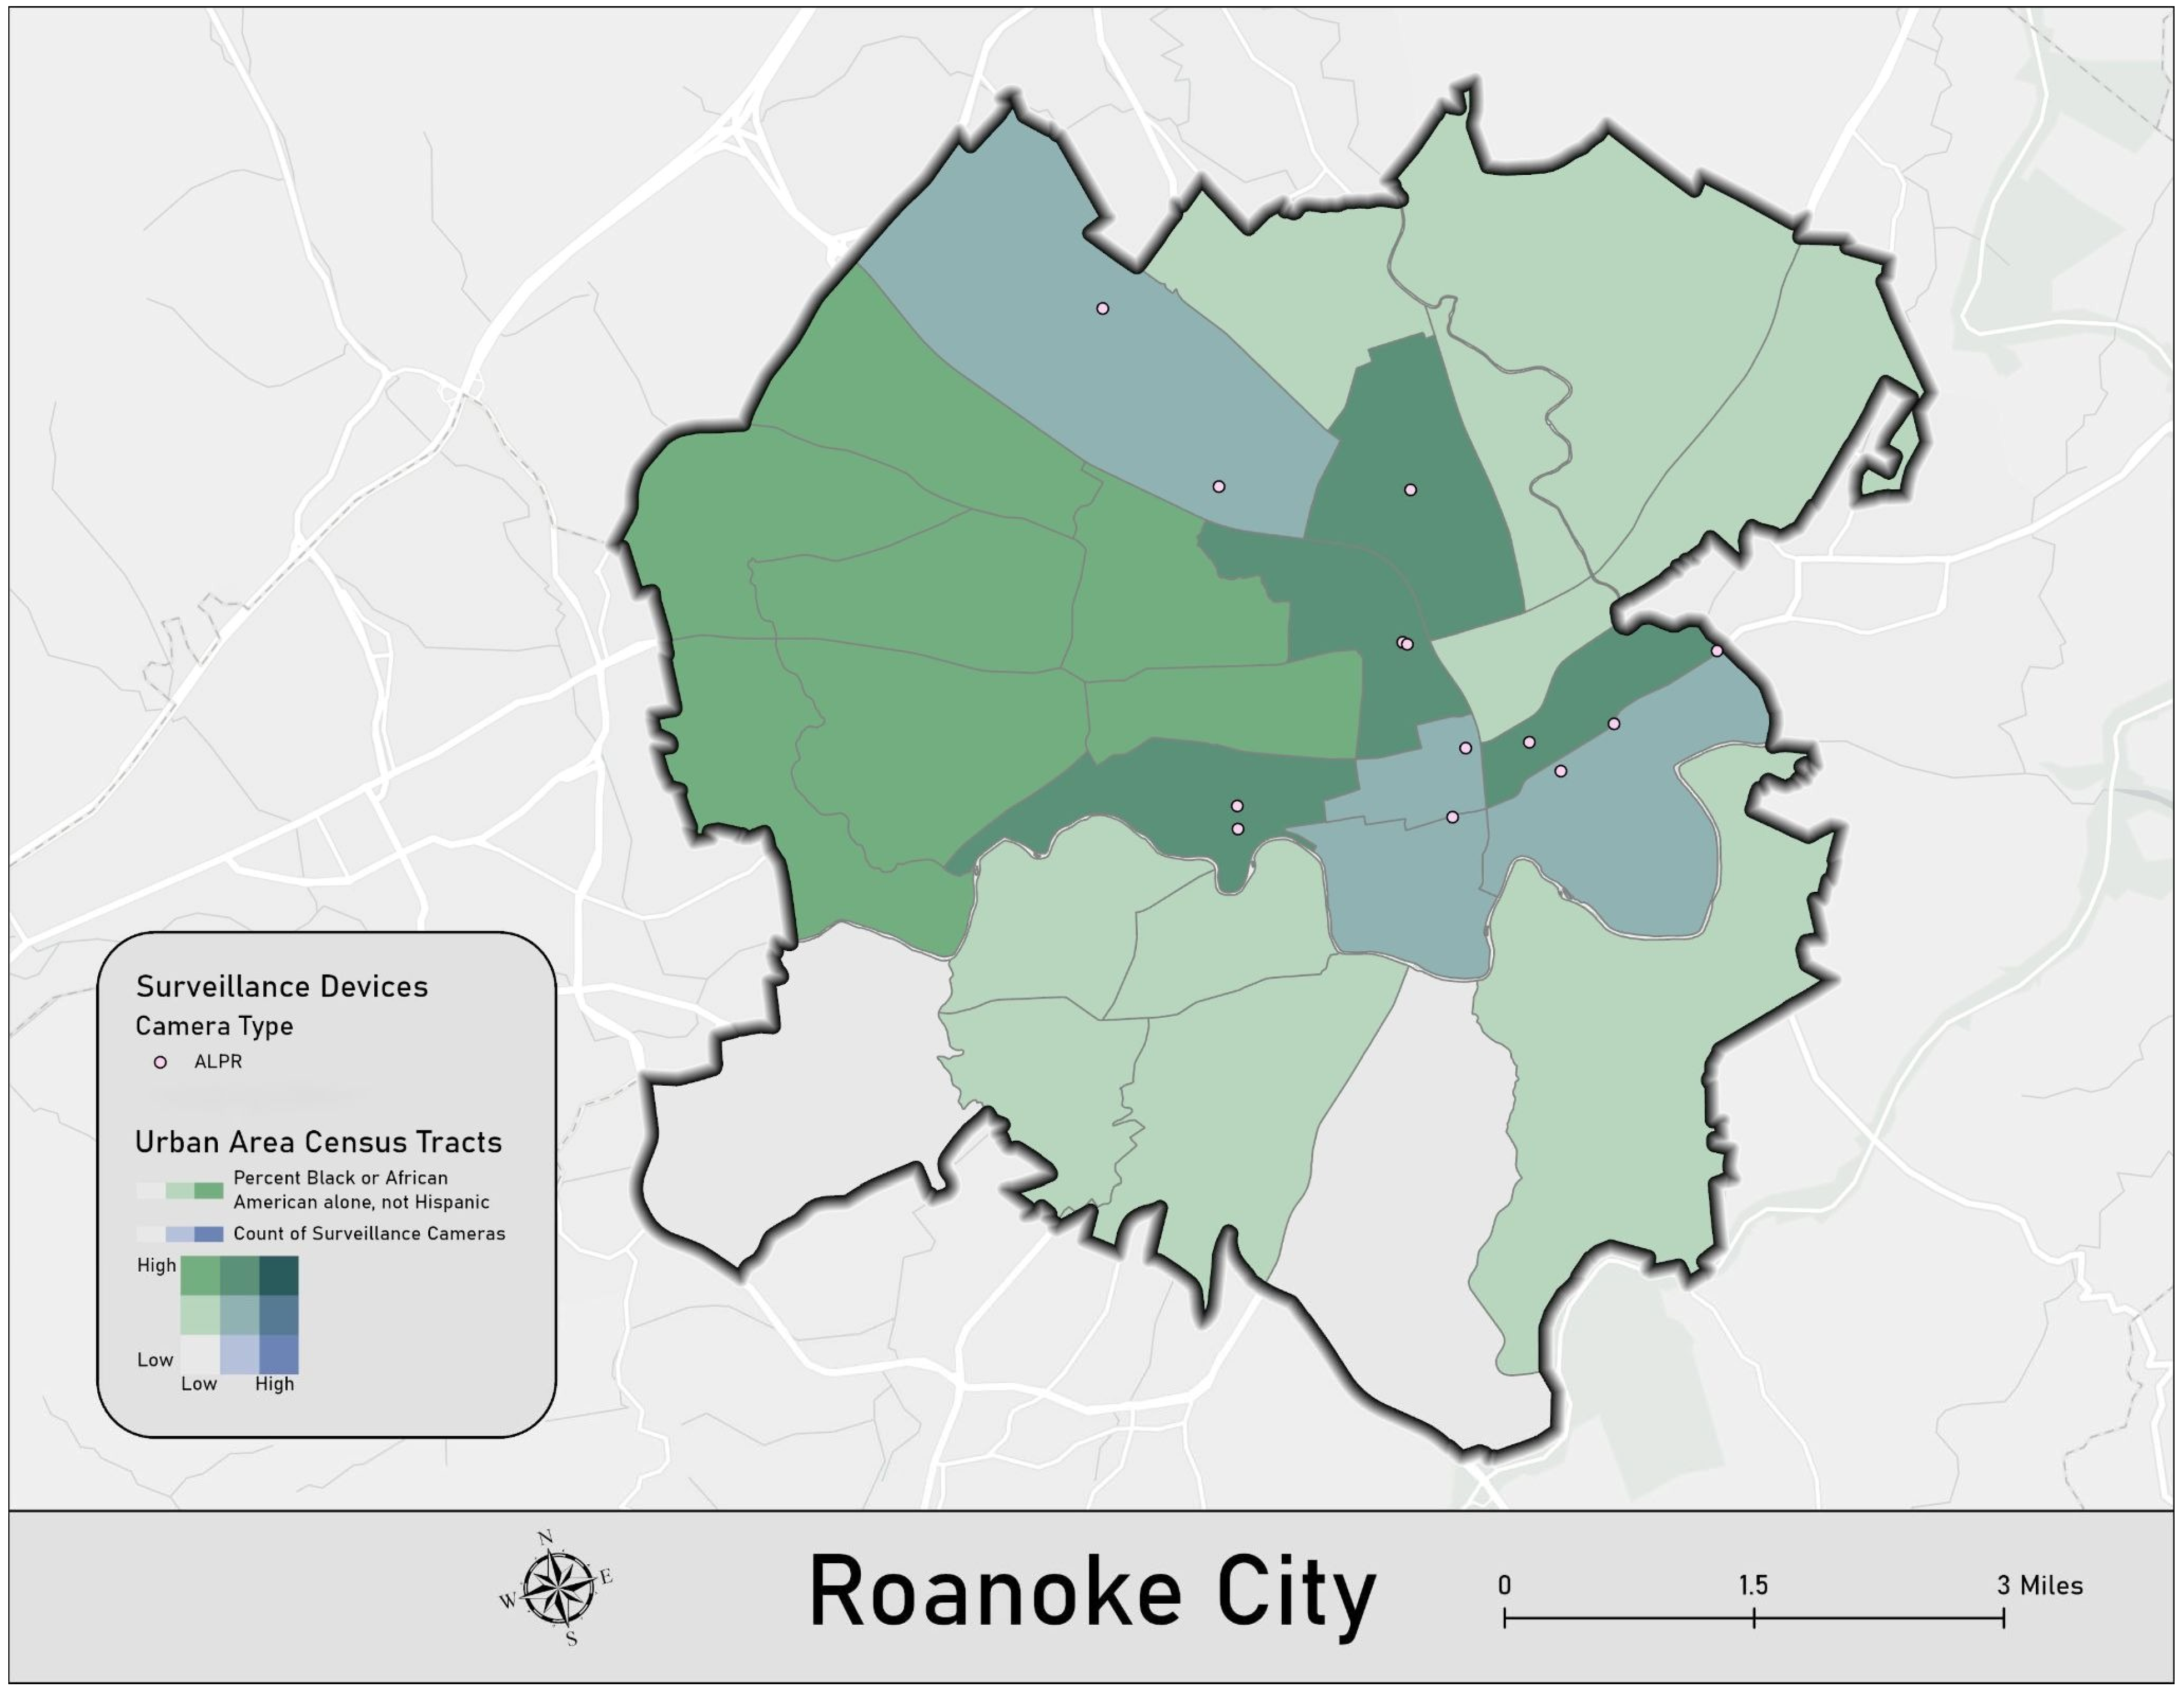
Within the City of Roanoke, there are a total of 13 surveillance devices, all of which are ALPR cameras. The placement of these devices is primarily concentrated within predominantly White census tracts. However, geospatial analysis reveals that many of these cameras are positioned directly on the borders of predominantly African American census tracts. In fact, five census tracts had multiple surveillance devices, with three of those census tracts being predominantly non-white. Figure 10 displays the ALPR camera locations reported in Roanoke.
Figure 10.
Overview of Surveillance Devices in the City of Roanoke, Virginia.
The kernel density analysis revealed further patterns of surveillance in the City of Roanoke. Eight census tracts in Roanoke yielded a mean kernel density of 0.049 or higher. Of these eight tracts, three have a White population of 70% or above, with a corresponding Black or African American population of 13–15%. Two of the eight tracts are majority Black (66% and 71%, respectively). Among the remaining three tracts, one has a population that is 59% White, 22% Black, and 10% Hispanic; another is 52% White, 22% Black, and 17% Hispanic; and the final tract is 45% Black, 36% White, and 6% Hispanic. To further contextualize how the distribution of cameras varies across racial demographics in Roanoke, Figure 11 displays a bivariate analysis of the relationship between surveillance tool distribution and race. Specifically, the blue color bar represents surveillance technology counts, and the green color bar represents the percentage of the Black or African American population. Darker teal shades (the mixture of green and blue) represent tracts with both higher surveillance technology counts and higher percentages of Black or African American residents.
Figure 11.
Bivariate Analysis of Surveillance Technology and Race in the City of Roanoke, Virginia.
4. Discussion
Our analysis reveals a growing surveillance network in Virginia characterized by a stark lack of transparency. The geospatial data identifies high-concentration hubs in the Hampton Roads region, the Richmond metropolitan area, and northern Virginia region. The demographic associations within these hubs are significant. In Norfolk and Richmond, ALPR and GDS technologies are predominantly concentrated in census tracts where African Americans are the majority. Conversely, in the Northern Virginia region and Roanoke, surveillance technology is more prevalent in predominantly White census tracts, though these locations frequently border and/or are in areas with high Asian and Hispanic/Latino populations.
The implications of this expanding network are important, as any abuse of these tools will disproportionately impact the most heavily surveilled neighborhoods. Documented misuses—including stalking by law enforcement officials, database breaches, and attempts to track interstate travel for reproductive healthcare—underscore the risks [15,86].
While proponents argue that policy guardrails mitigate these dangers, a recent Virginia Crime Commission [22] report found that departments frequently disregarded legislative restrictions. Specifically, agencies were found to be storing data beyond legal limits, sharing information with out-of-state and federal entities, and failing to hold required public information sessions. These systemic failures call into question the efficacy of legal oversight in protecting surveilled communities.
The privatization of this infrastructure presents additional concerns. For example, the bulk of Virginia’s ALPR cameras are Flock Safety cameras [87]. These systems are leased, not owned, by the public. This arrangement allows a private, profit-driven corporation to own the data regarding the everyday movements of citizens. Furthermore, the proliferation of ALPR cameras effectively privatizes public space. These cameras track individuals’ daily movements and populate databases owned by private corporations. As the density of ALPR networks and the intensity of subsequent surveillance increase, it becomes difficult to travel by vehicle without a private entity tracking one’s movements. These companies can then map behavioral patterns and build profiles, rendering an individual’s presence in previously public spaces effectively under private control.
The fact that the public must rely on crowdsourced platforms like DeFlock to estimate the coordinates of publicly funded surveillance speaks to a critical transparency gap. While some localities, such as Staunton and Charlottesville, have canceled contracts due to concerns [21], the majority of the network remains obscured. The only verified release of coordinates occurred in November 2025 following a federal court order in the Hampton Roads region—a case that remains central to the debate over Fourth Amendment protections against unreasonable search and seizure.
As it relates to the relationship between these surveillance tools and crime reduction, these tools are inherently reactive rather than preventative. Criminological literature suggests that violence is best prevented through intervention programs, inequality reduction, and cycle-interruption strategies, rather than expanded tracking [88,89,90]. GDS technology, in particular, can be counterproductive, frequently dispatching officers to scenes where no evidence of a crime exists. Given that a high percentage of searches in the Flock database do not result in successful outcomes, the current system represents an expensive venture that compromises privacy with questionable investigative success.
While there are clear concerns regarding these surveillance tools and their deployment, alternative perspectives are essential to consider. For instance, law enforcement agencies argue that such technology enables a more effective response to criminal behavior and improves investigative efficiency, particularly when navigating staffing shortages [59,60]. Furthermore, if extensive data regarding the use of these tools were shared with the academic community, the technology could be evaluated more rigorously [62]. Given that prior attempts to address hot spots have yielded promising early results [64], it stands to reason that a similar pattern might emerge here. However, additional research remains necessary to determine whether these benefits truly outweigh the aforementioned concerns and documented misuses as supported by empirical evidence.
The lack of transparency remains the primary obstacle to a full understanding of this technology. Our analysis is limited by its reliance on crowdsourced data; many cameras, particularly GDS sensors which are difficult to identify, likely go unreported. If law enforcement agencies and vendors like Flock Safety are confident in the efficacy and equitable deployment of these tools, they should provide the public and researchers with accessible, verified data. Until such transparency is mandated, the full impact of Virginia’s surveillance state remains partially hidden.
5. Conclusions
ALPR cameras and GDS technology represent a burgeoning suite of surveillance tools utilized by law enforcement, yet they are largely owned and operated by private corporations. A pervasive lack of transparency surrounds these technologies, particularly regarding their geographic deployment. This analysis seeks to address this by examining crowdsourced locations of ALPR cameras and GDS technology across Virginia. While we acknowledge a margin of error inherent in crowdsourced data—such as the potential for misidentifying hardware types or failing to capture the most recent installations—this approach provides a critical initial look at statewide implementation. Our results reveal significant clusters of high surveillance prevalence across Virginia. Within these hotspots, communities of color often experience high rates of monitoring. These findings carry an array of implications, specifically the risk that over-surveilled areas may be systematically harmed by the technology. Such deployment patterns threaten to foster a cycle of over-policing and over-criminalization in these specific communities. Further research is essential to establish true transparency and to evaluate how this surveillance apparatus impacts individuals, with a specific focus on its disparate effects on marginalized populations.
Author Contributions
Conceptualization, S.K., T.K. and B.T.; Methodology, S.K. and T.K.; Software, T.K.; Validation, S.K. and T.K.; Formal analysis, S.K. and T.K.; Investigation, S.K. and T.K.; Resources, S.K. and B.T.; Data curation, T.K.; Writing—original draft preparation, S.K., T.K. and B.T.; Writing—review and editing, S.K.; Visualization, T.K.; Supervision, S.K.; Project administration, S.K. All authors have read and agreed to the published version of the manuscript.
Funding
This research received no external funding.
Data Availability Statement
The data presented in this study are available on request to the corresponding author.
Conflicts of Interest
The authors declare no conflicts of interest.
Appendix A
[out:json][timeout:90];
area[admin_level=4][“name”=“Virginia”]->.virginia;
(
node[“man_made”=“surveillance”][“surveillance:type”=“ALPR”](area.virginia);
node[“man_made”=“surveillance”][“surveillance:type”=“gunshot_detector”](area.virginia);
way[“man_made”=“surveillance”][“surveillance:type”=“ALPR”](area.virginia);
way[“man_made”=“surveillance”][“surveillance:type”=“gunshot_detector”](area.virginia);
relation[“man_made”=“surveillance”][“surveillance:type”=“ALPR”](area.virginia);
relation[“man_made”=“surveillance”][“surveillance:type”=“gunshot_detector”](area.virginia);
);
out body qt meta;
{{style:
node[surveillance:type=gunshot_detector],
way[surveillance:type=gunshot_detector],
relation[surveillance:type=gunshot_detector] { fill-color: blue; color: blue; fill-opacity: 1; }
node[surveillance:type=ALPR],
way[surveillance:type=ALPR],
relation[surveillance:type=ALPR] { fill-color: red; color: red; fill-opacity: 1; }
}}
References
- Carson, E.A. Prisoners in 2014; Bureau of Justice Statistics: Washington, DC, USA, 2015. Available online: https://bjs.ojp.gov/content/pub/pdf/p14.pdf (accessed on 1 February 2026).
- Herberman, E.J.; Bonczar, T.P. Probation and Parole in the United States, 2013; Bureau of Justice Statistics: Washington, DC, USA, 2014.
- Travis, J.; Western, B.; Redburn, S. The Growth of Incarceration in the United States: Exploring Causes and Consequences; National Academies Press: Washington, DC, USA, 2014. [Google Scholar] [CrossRef] [Scilit]
- Roush, C.R. Quis custodiet ipsos custodes? Limits on widespread surveillance and intelligence gathering by local law enforcement after 9/11. Marquette Law Rev. 2012, 96, 315–376. [Google Scholar]
- Cordner, G.; Scarborough, K. Information sharing: Exploring the intersection of policing with national and military intelligence. Homel. Secur. Aff. 2010, 6. Available online: https://www.hsaj.org/articles/114 (accessed on 15 January 2026).
- Danna, A.; Gandy, O.H. All that glitters is not gold: Digging beneath the surface of data mining. J. Bus. Ethics 2002, 40, 373–386. [Google Scholar] [CrossRef] [Scilit]
- Waxman, M.C. Police and national security: American local law enforcement and counter-terrorism after 9/11. J. Natl. Secur. Law Policy 2009, 3, 377–407. [Google Scholar]
- Haggerty, K.D.; Ericson, R.V. The surveillant assemblage. Br. J. Sociol. 2000, 51, 605–622. [Google Scholar] [CrossRef] [Scilit] [PubMed]
- Brayne, S. Big data surveillance: The case of policing. Am. Sociol. Rev. 2017, 82, 977–1008. [Google Scholar] [CrossRef] [Scilit] [PubMed]
- Falayi, K. Who Combed Virginia’s Flock Surveillance Data for Immigration Enforcement? Search Here. Virginia Center for Investigative Journalism at WHRO. 24 September 2025. Available online: https://www.whro.org/virginia-center-for-investigative-journalism/2025-09-24/flock-surveillance-camera-search-database (accessed on 16 January 2026).
- Flock Safety. How Many Crimes Do Automated License Plate Readers (ALPRs) Solve, Anyway? 2026. Available online: https://www.flocksafety.com/customers/how-many-crimes-do-automated-license-plate-readers-alprs-solve-anyway (accessed on 15 February 2026).
- Wardwell, F. Liberal Towns Backtrack on License Plate Trackers Amid Concerns About Privacy—And Trump; Politico: Arlington, VA, USA, 2025. [Google Scholar]
- ACLU. In VT, ALPRs Are Regulated. American Civil Liberties Union. 2013. Available online: https://www.acluvt.org/news/vt-alprs-are-regulated/ (accessed on 1 February 2026).
- Derby, P. Policing in the age of information: Automatic number plate recognition. In Eyes Everywhere: The Global Growth of Camera Surveillance; Doyle, A., Lippert, R., Lyon, D., Eds.; Routledge: London, UK, 2012. [Google Scholar] [CrossRef] [Scilit]
- Doudna, M. Braselton Police Chief Accused of Misusing Police Cameras to Stalk People. WSB-TV2 Atlanta. 2025. Available online: https://www.yahoo.com/news/articles/braselton-police-chief-resigns-announces-083652183.html (accessed on 15 January 2026).
- Guariglia, M.; Kelley, J. New ALPR Vulnerabilities Prove Mass Surveillance Is a Public Safety Threat; Electronic Frontier Foundation: San Francisco, CA, USA, 2024; Available online: https://www.eff.org/deeplinks/2024/06/new-alpr-vulnerabilities-prove-mass-surveillance-public-safety-threat (accessed on 1 February 2026).
- Lum, C.; Merola, L.; Willis, J.; Cave, B. License Plate Recognition Technology (LPR): Impact Evaluation and Community Assessment. George Mason University Center for Evidence-Based Crime Policy. 2010. Available online: https://cebcp.org/wp-content/evidence-based-policing/LPR_FINAL.pdf (accessed on 15 February 2026).
- Merola, L.; Lum, C. Privacy and the impact of emerging surveillance technologies: The case of license plate recognition technology. Judicature 2012, 96, 119–126. [Google Scholar]
- Rushin, S. The judicial response to mass police surveillance. J. Law Technol. Policy 2011, 2011, 281–329. [Google Scholar]
- Merola, L.; Lum, C.; Murphy, R. The impact of license plate recognition technology (LPR) on trust in law enforcement: A survey-experiment. J. Exp. Criminol. 2018, 15, 55–66. [Google Scholar] [CrossRef] [Scilit]
- Kutner, B. Virginia Legislators Ding Local Law Enforcement over Surveillance Abuses. Radio IQ/WVTF. 12 March 2026. Available online: https://www.wvtf.org/news/2026-03-12/virginia-legislators-ding-local-law-enforcement-over-surveillance-abuses (accessed on 13 March 2026).
- Virginia State Crime Commission. Law Enforcement Use of Automatic License Plate Recognition (ALPR) Update. 2026. Available online: https://vscc.virginia.gov/2026/VSCC%20ALPR%20Report%20January%202026%20FINAL%20REVISED%20Jan%2021%202026.pdf (accessed on 1 March 2026).
- Mammino, J. Acoustic Gunshot Detection Systems: Community and Policy Considerations (Technology Assessment 22-1). Gerald R. Ford School of Public Policy, University of Michigan. 2022. Available online: https://stpp.fordschool.umich.edu/research/policy-brief/acoustic-gunshot-detection-systems-community-policy-considerations (accessed on 15 February 2026).
- Electronic Frontier Foundation. Gunshot Detection. 1 August 2023. Available online: https://sls.eff.org/technologies/gunshot-detection (accessed on 5 February 2026).
- Brooklyn Defender Services. Confirmed: ShotSpotter Technology Increases Surveillance and Policing of Black and Latine New Yorkers. 2024. Available online: https://bds.org/latest/report-shotspotter-technology-increases-surveillance-and-policing-of-black-and-latine-new-yorkers-while-failing-to-reduce-gun-violence-analysis-of-nine-years-of-previously-undisclosed-police-data-reveals (accessed on 1 February 2026).
- Ebrahimji, A. Why Some Cities Are Choosing to Stop Using ShotSpotter. CNN. 24 February 2024. Available online: https://www.cnn.com/2024/02/24/us/shotspotter-cities-choose-not-to-use (accessed on 1 February 2026).
- Department of Homeland Security. Highlight: Gunshot Detection Systems. 2012. Available online: https://www.dhs.gov/sites/default/files/publications/GunshotDetect-HLT_0512-508.pdf (accessed on 18 January 2026).
- Keener, S.; Finn, J.; Baird, A. Surveillance inequality: Race, poverty, and the geography of automated license plate reader deployment. SocArXiv 2026. [Google Scholar] [CrossRef] [Scilit]
- Gustafson, K.S. Cheating Welfare: Public Assistance and the Criminalization of Poverty; New York University Press: New York, NY, USA, 2011. [Google Scholar]
- Soss, J.; Fording, R.C.; Schram, S.F. Disciplining the Poor: Neoliberal Paternalism and the Persistent Power of Race; University of Chicago Press: Chicago, IL, USA, 2011. [Google Scholar] [CrossRef] [Scilit]
- Kundnani, A. The Muslims Are Coming!: Islamophobia, Extremism, and the Domestic War on Terror; Verso Books: London, UK, 2014. [Google Scholar]
- Kilgore, J. Understanding e-Carceration: Electronic Monitoring, the Surveillance State, and the Future of Mass Incarceration; The New Press: New York, NY, USA, 2022. [Google Scholar]
- Phelps, M.S. Ending mass probation: Sentencing, supervision, and revocation. Future Child. 2018, 28, 128–146. [Google Scholar] [CrossRef] [Scilit]
- Clear, T.R. Imprisoning Communities: How Mass Incarceration Makes Disadvantaged Neighborhoods Worse; Oxford University Press: Oxford, UK, 2007. [Google Scholar]
- Eubanks, V. Automating Inequality: How High-Tech Tools Profile, Police, and Punish the Poor; St. Martin’s Press: New York, NY, USA, 2018. [Google Scholar]
- Angwin, J. Dragnet Nation: A Quest for Privacy, Security, and Freedom in a World of Relentless Surveillance; Times Books: Manhattan, NY, USA, 2014. [Google Scholar]
- Marx, G.T. Windows into the Soul: Surveillance and Society in an Age of High Technology; University of Chicago Press: Chicago, IL, USA, 2016. [Google Scholar]
- Lyon, D. Surveillance after September 11; Polity: Cambridge, UK, 2003. [Google Scholar]
- Ferguson, A.G. The Rise of Big Data Policing: Surveillance, Race, and the Future of Law Enforcement; NYU Press: New York, NY, USA, 2017. [Google Scholar]
- Harcourt, B.E. Against Prediction: Profiling, Policing, and Punishing in an Actuarial Age; University of Chicago Press: Chicago, IL, USA, 2007. [Google Scholar]
- Braga, A.A.; Turchan, B.S.; Papachristos, A.V.; Hureau, D.M. Hot spots policing and crime reduction: An updated systematic review and meta-analysis. J. Exp. Criminol. 2019, 15, 289–311. [Google Scholar] [CrossRef] [Scilit]
- Mohler, G.O.; Short, M.B.; Brantingham, P.J.; Schoenberg, F.P.; Tita, G.E. Randomized controlled field trials of predictive policing. J. Am. Stat. Assoc. 2015, 110, 1399–1411. [Google Scholar] [CrossRef] [Scilit]
- Joh, E.E. Policing by numbers: Big data and the Fourth Amendment. Wash. Law Rev. 2014, 89, 35–68. [Google Scholar]
- Deller, R.A. Why get a warrant when you can fly over the wall? The constitutionality of aerial surveillance without a warrant. New Mex. Law Rev. 2021, 51, 234–254. [Google Scholar]
- Herbert, S.; Beckett, K.; Stuart, F. Policing social marginality: Contrasting approaches. Law Soc. Inq. 2017, 43, 1491–1513. [Google Scholar] [CrossRef] [Scilit]
- Alexander, M. The New Jim Crow: Mass Incarceration in the Age of Colorblindness; The New Press: New York, NY, USA, 2010. [Google Scholar]
- Western, B. Punishment and Inequality in America; Russell Sage Foundation: New York, NY, USA, 2006. [Google Scholar]
- Buolamwini, J.; Gebru, T. Gender shades: Intersectional accuracy disparities in commercial gender classification. Proc. Mach. Learn. Res. 2018, 81, 77–91. Available online: https://proceedings.mlr.press/v81/buolamwini18a.html (accessed on 15 February 2026).
- Grother, P.; Ngan, M.; Hanaoka, K. Face Recognition Vendor Test (FRVT) Part 3: Demographic Effects (NIST Interagency Report 8280); National Institute of Standards and Technology: Gaithersburg, MD, USA, 2019. [CrossRef] [Scilit]
- Chu, S.P.; Pezzella, F.S.; Evans, J.D. Surveillance load: A burden of search borne by Black and Brown bodies. Crit. Criminol. 2023, 31, 451–466. [Google Scholar] [CrossRef] [Scilit]
- Kamalu, N.C.; Onyeozili, E.C. A critical analysis of the ‘broken windows’ policing in New York City and its impact: Implications for the criminal justice system and the African American community. Afr. J. Criminol. Crim. Justice Stud. 2018, 11, 71–94. [Google Scholar]
- Chavis, K. Transformative policing technology: Balancing public safety, privacy, and community consent in vulnerable communities in the United States. Polic. A J. Policy Pract. 2021, 15, 425–439. [Google Scholar] [CrossRef] [Scilit]
- Jones, N. “The regular routine”: Proactive policing and adolescent development among young, poor Black men. New Dir. Child Adolesc. Dev. 2014, 2014, 33–54. [Google Scholar] [CrossRef] [Scilit]
- Leverso, J.; Lee, S. The status of the surveilled: Hyper surveillance and status attainment among gangs. Soc. Probl. 2025, 73, 512–527. [Google Scholar] [CrossRef] [Scilit]
- Goold, B.; Loader, I.; Thumala, A. The banality of security: The curious case of surveillance cameras. Br. J. Criminol. 2013, 53, 977–996. [Google Scholar] [CrossRef] [Scilit]
- Sewell, A.A.; Jefferson, K.A.; Lee, H. Living under surveillance: Gender, psychological distress, and stop-question-and-frisk policing in New York City. Soc. Sci. Med. 2016, 159, 1–13. [Google Scholar] [CrossRef] [Scilit] [PubMed]
- Benjamin, R. Introduction: Discriminatory design, liberating imagination. In Captivating Technology: Race, Carceral Technoscience, and Liberatory Imagination in Everyday Life; Benjamin, R., Ed.; Duke University Press: Durham, NC, USA, 2019; pp. 1–22. [Google Scholar] [CrossRef] [Scilit]
- McKoy, J. Combatting Digital Redlining Is ‘Imperative for Advancing Health Equity’; Boston University School of Public Health: Boston, MA, USA, 2024. Available online: https://www.bu.edu/sph/news/articles/2024/combating-digital-redlining-is-imperative-for-advancing-health-equity/ (accessed on 1 February 2026).
- La Vigne, N.G.; Lowry, S.S.; Markman, J.A.; Dwyer, A.M. Evaluating the Use of Public Surveillance Cameras for Crime Control and Prevention—A Summary; Urban Institute: Washington, DC, USA, 2011; Available online: https://www.urban.org/sites/default/files/publication/27546/412401-Evaluating-the-Use-of-Public-Surveillance-Cameras-for-Crime-Control-and-Prevention-A-Summary.PDF (accessed on 1 February 2026).
- Grogan, B. From Patrol Cares to Poles: How Automated License Plate Readers Became a Crime-Fighting Star. Police Chief Magazine. 15 October 2025. Available online: https://www.policechiefmagazine.org/patrol-cars-poles-alpr/ (accessed on 15 February 2026).
- Schuck, A.M. Prevalence and predictors of surveillance cameras in law enforcement: The importance of stakeholders and community factors. Crim. Justice Policy Rev. 2013, 28, 41–60. [Google Scholar] [CrossRef] [Scilit]
- Brayne, S. The criminal law and law enforcement implications of big data. Annu. Rev. Law Soc. Sci. 2018, 14, 293–308. [Google Scholar] [CrossRef] [Scilit]
- Piza, E.L.; Welsh, B.C.; Farrington, D.P.; Thomas, A.L. CCTV surveillance for crime prevention: A 40-year systematic review with meta-analysis. Criminol. Public Policy 2019, 18, 135–159. [Google Scholar] [CrossRef] [Scilit]
- Friend, Z. Predictive Policing: Using Technology to Recue Crime. LEB. 2013. Available online: https://leb.fbi.gov/articles/featured-articles/predictive-policing-using-technology-to-reduce-crime (accessed on 1 February 2026).
- Prince, H.; Lum, C.; Koper, C.S. Effective police investigative practices: An evidence-based assessment of the research. Polic. Int. J. 2021, 44, 683–707. [Google Scholar] [CrossRef] [Scilit]
- Nader, E.; Wasileski, G.; Poteyeva, M. Community perceptions, concerns for privacy, and support for law enforcement use of aerial surveillance in Baltimore. Crime Delinq. 2023, 71, 2198–2227. [Google Scholar] [CrossRef] [Scilit]
- Stiernstrom, E. Facial recognition technology in law enforcement-a scoping review of existing empirical studies. Police Pract. Res. 2026, 1–25. [Google Scholar] [CrossRef] [Scilit]
- Snow, A.; Charpentier, C. Technologies in Law Enforcement: An Initial Evaluation of Effectiveness in Aiding Police in Real-World Crime Clearance [White Paper]. ResearchGate. 2024. Available online: https://www.researchgate.net/publication/377845222 (accessed on 1 February 2026).
- Zmud, J.; Walden, T.; Ettelman, B.; Higgins, L.; Graber, J.; Gilbert, R.; Hodges, D. State of Knowledge and Practice for Using Automated License Plate Readers for Traffic Safety Purposes (Report No. DOT HS 813 051). National Highway Traffic Safety Administration: Washington, DC, USA, 2021. Available online: https://rosap.ntl.bts.gov/view/dot/55586 (accessed on 15 February 2026).
- Merola, L.; Lum, C.; Willis, J.; Cave, B. Community support for license plate recognition. Polic. Int. J. Police Strateg. Manag. 2014, 37, 30–51. [Google Scholar] [CrossRef] [Scilit]
- Milburn, T.; Syed, I.U. An interdisciplinary examination of a gunshot detection system: The public health context of a policing technology. Crit. Soc. Policy 2025, 45, 148–164. [Google Scholar] [CrossRef] [Scilit]
- Goldenberg, A.; Rattigan, D.; Dalton, M.; Gaughan, J.P.; Thomson, J.S.; Remick, K.; Butts, C.; Hazelton, J.P. Use of ShotSpotter detection technology decreases prehospital time for patients sustaining gunshot wounds. J. Trauma Acute Care Surg. 2019, 87, 1253–1259. [Google Scholar] [CrossRef] [Scilit]
- Sandau, A.G.; Field, R.; Hunter, K. Detect, dispatch, drive: A study of ShotSpotter acoustic technology and transport of gunshot victims. J. Surg. Res. 2024, 300, 550–558. [Google Scholar] [CrossRef] [Scilit] [PubMed]
- Piza, E.L.; Hatten, D.N.; Carter, J.G.; Baughman, J.H.; Mohler, G.O. Gunshot detection technology time savings and spatial precision: An exploratory analysis in Kansas City. Polic. A J. Policy Pract. 2023, 17, paac097. [Google Scholar] [CrossRef] [Scilit]
- Huebner, B.M.; Lentz, T.S.; Schafer, J.A. Heard shots–call the police? An examination of citizen responses to gunfire. Justice Q. 2022, 39, 673–696. [Google Scholar] [CrossRef] [Scilit]
- Mares, D. Gunshot Detection: Reducing Gunfire Through Acoustic Technology (Response Guide Series No. 14). Bureau of Justice Assistance. 2022. Available online: https://bja.ojp.gov/library/publications/gunshot-detection-reducing-gunfire-through-acoustic-technology (accessed on 1 February 2026).
- Ratcliffe, J.H.; Lattanzio, M.; Kikuchi, G.; Thomas, K. A partially randomized field experiment on the effect of an acoustic gunshot detection system on police incident reports. J. Exp. Criminol. 2019, 15, 67–76. [Google Scholar] [CrossRef] [Scilit]
- Chicago Office of Inspector General. The City of Chicago’s Use of ShotSpotter Technology. 2021. Available online: https://igchicago.org/wp-content/uploads/2023/08/Chicago-Police-Departments-Use-of-ShotSpotter-Technology.pdf (accessed on 10 February 2026).
- Mares, D.; Blackburn, E. Acoustic gunshot detection systems: A quasi-experimental evaluation in St. Louis, MO. J. Exp. Criminol. 2021, 17, 193–215. [Google Scholar] [CrossRef] [Scilit]
- Choi, K.S.; Librett, M.; Collins, T.J. An empirical evaluation: Gunshot detection system and its effectiveness on police practices. Police Pract. Res. 2014, 15, 48–61. [Google Scholar] [CrossRef] [Scilit]
- Lawrence, D.S.; Novak, K.J. Firearm shootings and the police response: Examining the impact of gunshot detection technology. Police Pract. Res. 2025, 26, 726–745. [Google Scholar] [CrossRef] [Scilit]
- Doucette, M.L.; Green, C.; Necci Dineen, J.; Anderson, D.; Sato, K.; McCourt, A.; Crifasi, C.K.; Webster, D.W. Impact of ShotSpotter technology on firearm homicides and arrests among large metropolitan counties: A longitudinal analysis, 1999–2016. J. Urban Health 2021, 98, 609–621. [Google Scholar] [CrossRef] [Scilit]
- Topper, M.; Ferrazares, T. The unintended consequences of policing technology: Evidence from ShotSpotter. SSRN 2024. [Google Scholar] [CrossRef] [Scilit]
- Burtch, G.; Greenwood, B.; Watson, J. The effect of gunshot detection technologies on policing practices: An empirical examination of the Chicago Police Department (Research Paper No. 5223847). SSRN 2025. [Google Scholar] [CrossRef] [Scilit]
- Piza, E.L.; Arietti, R.A.; Carter, J.G.; Hatten, D.N. The effect of gunshot detection technology on evidence collection and case clearance in Kansas City, Missouri. J. Exp. Criminol. 2025, 21, 127–152. [Google Scholar] [CrossRef] [Scilit]
- Cox, J.; Koebler, J. A Texas Cop Searched License Plate Cameras Nationwide for a Woman Who Got an Abortion. 404 Media. 22 May 2024. Available online: https://www.404media.co/a-texas-cop-searched-license-plate-cameras-nationwide-for-a-woman-who-got-an-abortion/ (accessed on 1 February 2026).
- Infante, D. RPD Has Spent $1 Million on Flock License-Plate Readers. The Richmonder. 12 March 2026. Available online: https://www.richmonder.org/rpd-has-spent-1-million-on-flock-license-plate-readers-with-those-contracts-up-for-renewal-anti-surveillance-activists-call-for-cancellation-while-mayor-council-demur/.
- Braga, A.A.; Kennedy, D.M. A Framework for Addressing Violence and the Cycle of Retaliation; Oxford University Press: Oxford, UK, 2021. [Google Scholar]
- Sampson, R.J. Great American City: Chicago and the Enduring Neighborhood Effect; University of Chicago Press: Chicago, IL, USA, 2012. [Google Scholar]
- Sharkey, P.; Tirado-Strayer, N.; Papachristos, A.V.; Raver, C.C. Community and the crime decline: The causal effect of local nonprofits on violent crime. Am. Sociol. Rev. 2017, 82, 1214–1240. [Google Scholar] [CrossRef] [Scilit]
Disclaimer/Publisher’s Note: The statements, opinions and data contained in all publications are solely those of the individual author(s) and contributor(s) and not of MDPI and/or the editor(s). MDPI and/or the editor(s) disclaim responsibility for any injury to people or property resulting from any ideas, methods, instructions or products referred to in the content. |
© 2026 by the authors. Licensee MDPI, Basel, Switzerland. This article is an open access article distributed under the terms and conditions of the Creative Commons Attribution (CC BY) license.