


Abstract
Urban work-zone safety monitoring requires integrating operational records with road-incident information collected through different reporting systems. This study examines sign loss, data-source compatibility, and monthly associations between operational indicators and corridor-level incidents along Carrera 62 in Medellín, Colombia. A retrospective longitudinal observational design was applied to records covering November 2023–February 2025. The analysis included 288 supervision entries recorded on 278 dates, 96 sign-loss records representing 137 recorded stolen units, and incident summaries available for 13 of the 16 study months. The available monthly summaries contained 371 incidents, while three months with unavailable information were retained as missing rather than treated as zero. Recorded sign loss showed a positive monthly association with corridor incidents (Spearman ; unadjusted ), although the association weakened after Holm adjustment (). Supervision-entry count was negatively associated with incident counts (), whereas the nighttime share of supervision entries showed a positive association (). A paired-month bootstrap for the sign-loss association yielded a 95% percentile interval from to , and adjacent-month changes did not reproduce the positive relationship observed in the level-based comparison. Because traffic and pedestrian exposure, date-specific work-front records, and the event-level incident extract were unavailable, the analysis focuses on what the archived records can support for safety monitoring rather than on estimating exposure-adjusted risk or causal effects of roadworks or temporary traffic management. The findings highlight the importance of traceable data sources, dated work-front locations, explicit data-availability coding, exposure measures, and sign-restoration times for strengthening safety monitoring in urban work zones.
1. Introduction
Road construction creates a difficult interval in the life of an urban street. The infrastructure being improved must often continue to carry vehicles and accommodate walking, deliveries, and access to nearby properties. During that interval, permanent street features and temporary traffic arrangements coexist. A road traffic incident count describes one consequence of this setting, but it does not identify the condition of a warning sign, the duration of a closure, or the position of a work front when an event occurred. Road safety monitoring therefore requires both outcome information and a defensible account of the conditions under which travel takes place. This distinction is consistent with the broader separation of final outcomes, intermediate indicators, and exposure in road safety data systems [1,2].
Work-zone research provides a substantial basis for examining these conditions. Rathnasiri et al. [3] review the range of safety problems and assessment approaches associated with road works, while research on smart work zones considers how sensing and communication can improve the information available to travelers and operators [4]. Yet a retrospective urban study may depend on less elaborate resources: an operational spreadsheet, a municipal incident summary, and a set of location labels. Their analytical usefulness depends less on file size than on whether their units, dates, and definitions can be reconciled. An apparently simple comparison between monthly sign losses and monthly incidents can conceal substantial differences in what each source actually observes.
Imprialou and Quddus [5] identify data quality as a central issue in crash research. More recent work on linking crash and hospital datasets, and on the organization of regional traffic data systems, reinforces the need to examine how records are assembled before interpreting their combined results [6,7]. The relevance to construction monitoring is methodological rather than a claim that hospital and operational records serve the same purpose. Sources collected for different institutional tasks can describe different portions of the same setting. Their agreement is informative only after the meaning of an observation, the period covered, and the rules for inclusion have been established.
Blackman et al. [8] demonstrate the value of workplace health and safety records as an alternative source for studying work-zone crashes. Such records do not automatically replace police or municipal data. Research comparing police reports and insurance claims illustrates how source selection can affect the incidents represented, while reviews of road accident data collection show the variety of institutional arrangements through which those records are produced [9,10]. In a construction archive, a missing device may be recorded because it needs replacement; in a traffic database, an event may be recorded because it meets an administrative incident definition. Neither purpose guarantees that the two observations can be linked to one another.
This issue is relevant to urban infrastructure research in Latin America, where road safety assessment must account for the diversity of transport environments and available administrative information. Regional analysis has described both the challenges and opportunities for improving road safety, and Medellín has provided settings for studies using open incident data and examining transport-related urban change [11,12,13]. A recently published georeferenced dataset further documents the availability of incident and fatality information for the city [14]. Citywide data availability, however, does not establish the provenance or completeness of every corridor summary subsequently derived from those data. That distinction matters when a project archive retains the summary but not the underlying extract.
Sánchez Corredor et al. [15] examined risk-based supervision, compliance, and safety management using the operational archive analyzed here, and the associated dataset and code are available in Mendeley Data [16]. The seven incidents reported in that study corresponded to seven supervision entries in which the operational form’s incident field was marked “Yes.” In contrast, the 371 incidents examined here come from a separate monthly corridor summary attributed to SIAT. These quantities differ in source, spatial coverage, and unit of observation and should not be interpreted as alternative estimates of the same total. The present study addresses a different analytical question by examining the temporal and functional patterns of sign loss, the compatibility of operational records with corridor incident summaries, and the stability of their monthly associations. Its contribution lies in establishing which findings can be reproduced from the retained records, which depend on unresolved source provenance, and which additional measurements would be required for stronger work-zone safety evaluation.
An urban perspective also requires attention to pedestrians. Evidence on vulnerable road users connects safety to the built environment, while intervention reviews examine measures intended to reduce pedestrian injuries [17,18,19]. Construction monitoring can contribute to this discussion by identifying whether the information needed to examine temporary walking conditions is retained. It cannot substitute a count of pedestrian-involved incidents for an assessment of pedestrian exposure, route accessibility, or conflict mechanisms. The distinction is especially important when intersection-level information is available only as an aggregate table rather than as event records with verified coordinates.
Reviews of road accident research describe an expanding range of data sources and analytical techniques [20]. The present study addresses a prior question of data usability rather than proposing a more complex prediction model: What can a source-audited analysis of operational records and supplied incident summaries establish about sign loss and road safety monitoring in an urban construction corridor? The objective is to reconcile the available record streams, describe their temporal and spatial coverage, and test the stability of exploratory monthly associations without treating them as causal effects. The contribution is a reproducible distinction between findings supported by record-level evidence, patterns available only from aggregate summaries, and relationships that cannot be established without event-level linkage and exposure information.
The study is organized around three levels of evidence. At the first level, a quantity can be traced to a dated operational row and recomputed under an explicit inclusion rule. At the second, a quantity can be reproduced from a supplied aggregate table but its underlying event selection remains unverifiable. At the third, an analytical association or a proposed monitoring improvement depends on interpretation beyond the source count itself. Distinguishing these levels is useful because the same numerical precision can otherwise conceal very different evidential support. A total reconstructed from line items and a total transcribed from a summary may both be integers, yet only the former can be examined at the retained record level. This distinction follows the emphasis on transparent reporting rather than numerical precision alone in observational research [21].
2. Materials and Methods
The study combined record reconciliation, descriptive analysis, and exploratory comparisons of monthly indicators. Operational entries and aggregate incident summaries were examined separately before constructing the monthly analytical series. The following subsections describe the study setting, data sources, inclusion rules, variable definitions, and statistical procedures. General reporting principles for observational research informed the documentation of these procedures and their limitations [21].
2.1. Study Setting and Design
This retrospective longitudinal observational study examined a construction corridor along Carrera 62 in Medellín, Colombia. The available archive covers 16 calendar months, from November 2023 through February 2025, with dated supervision entries extending from 3 November 2023, to 21 February 2025. Calendar month was the unit of the exploratory association analysis, whereas individual supervision entries and sign-loss line items were used to reconstruct the operational series.
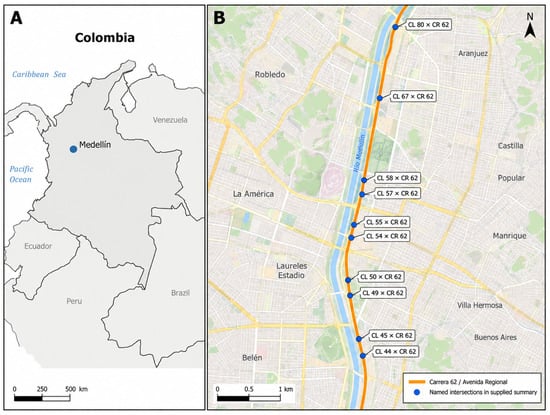
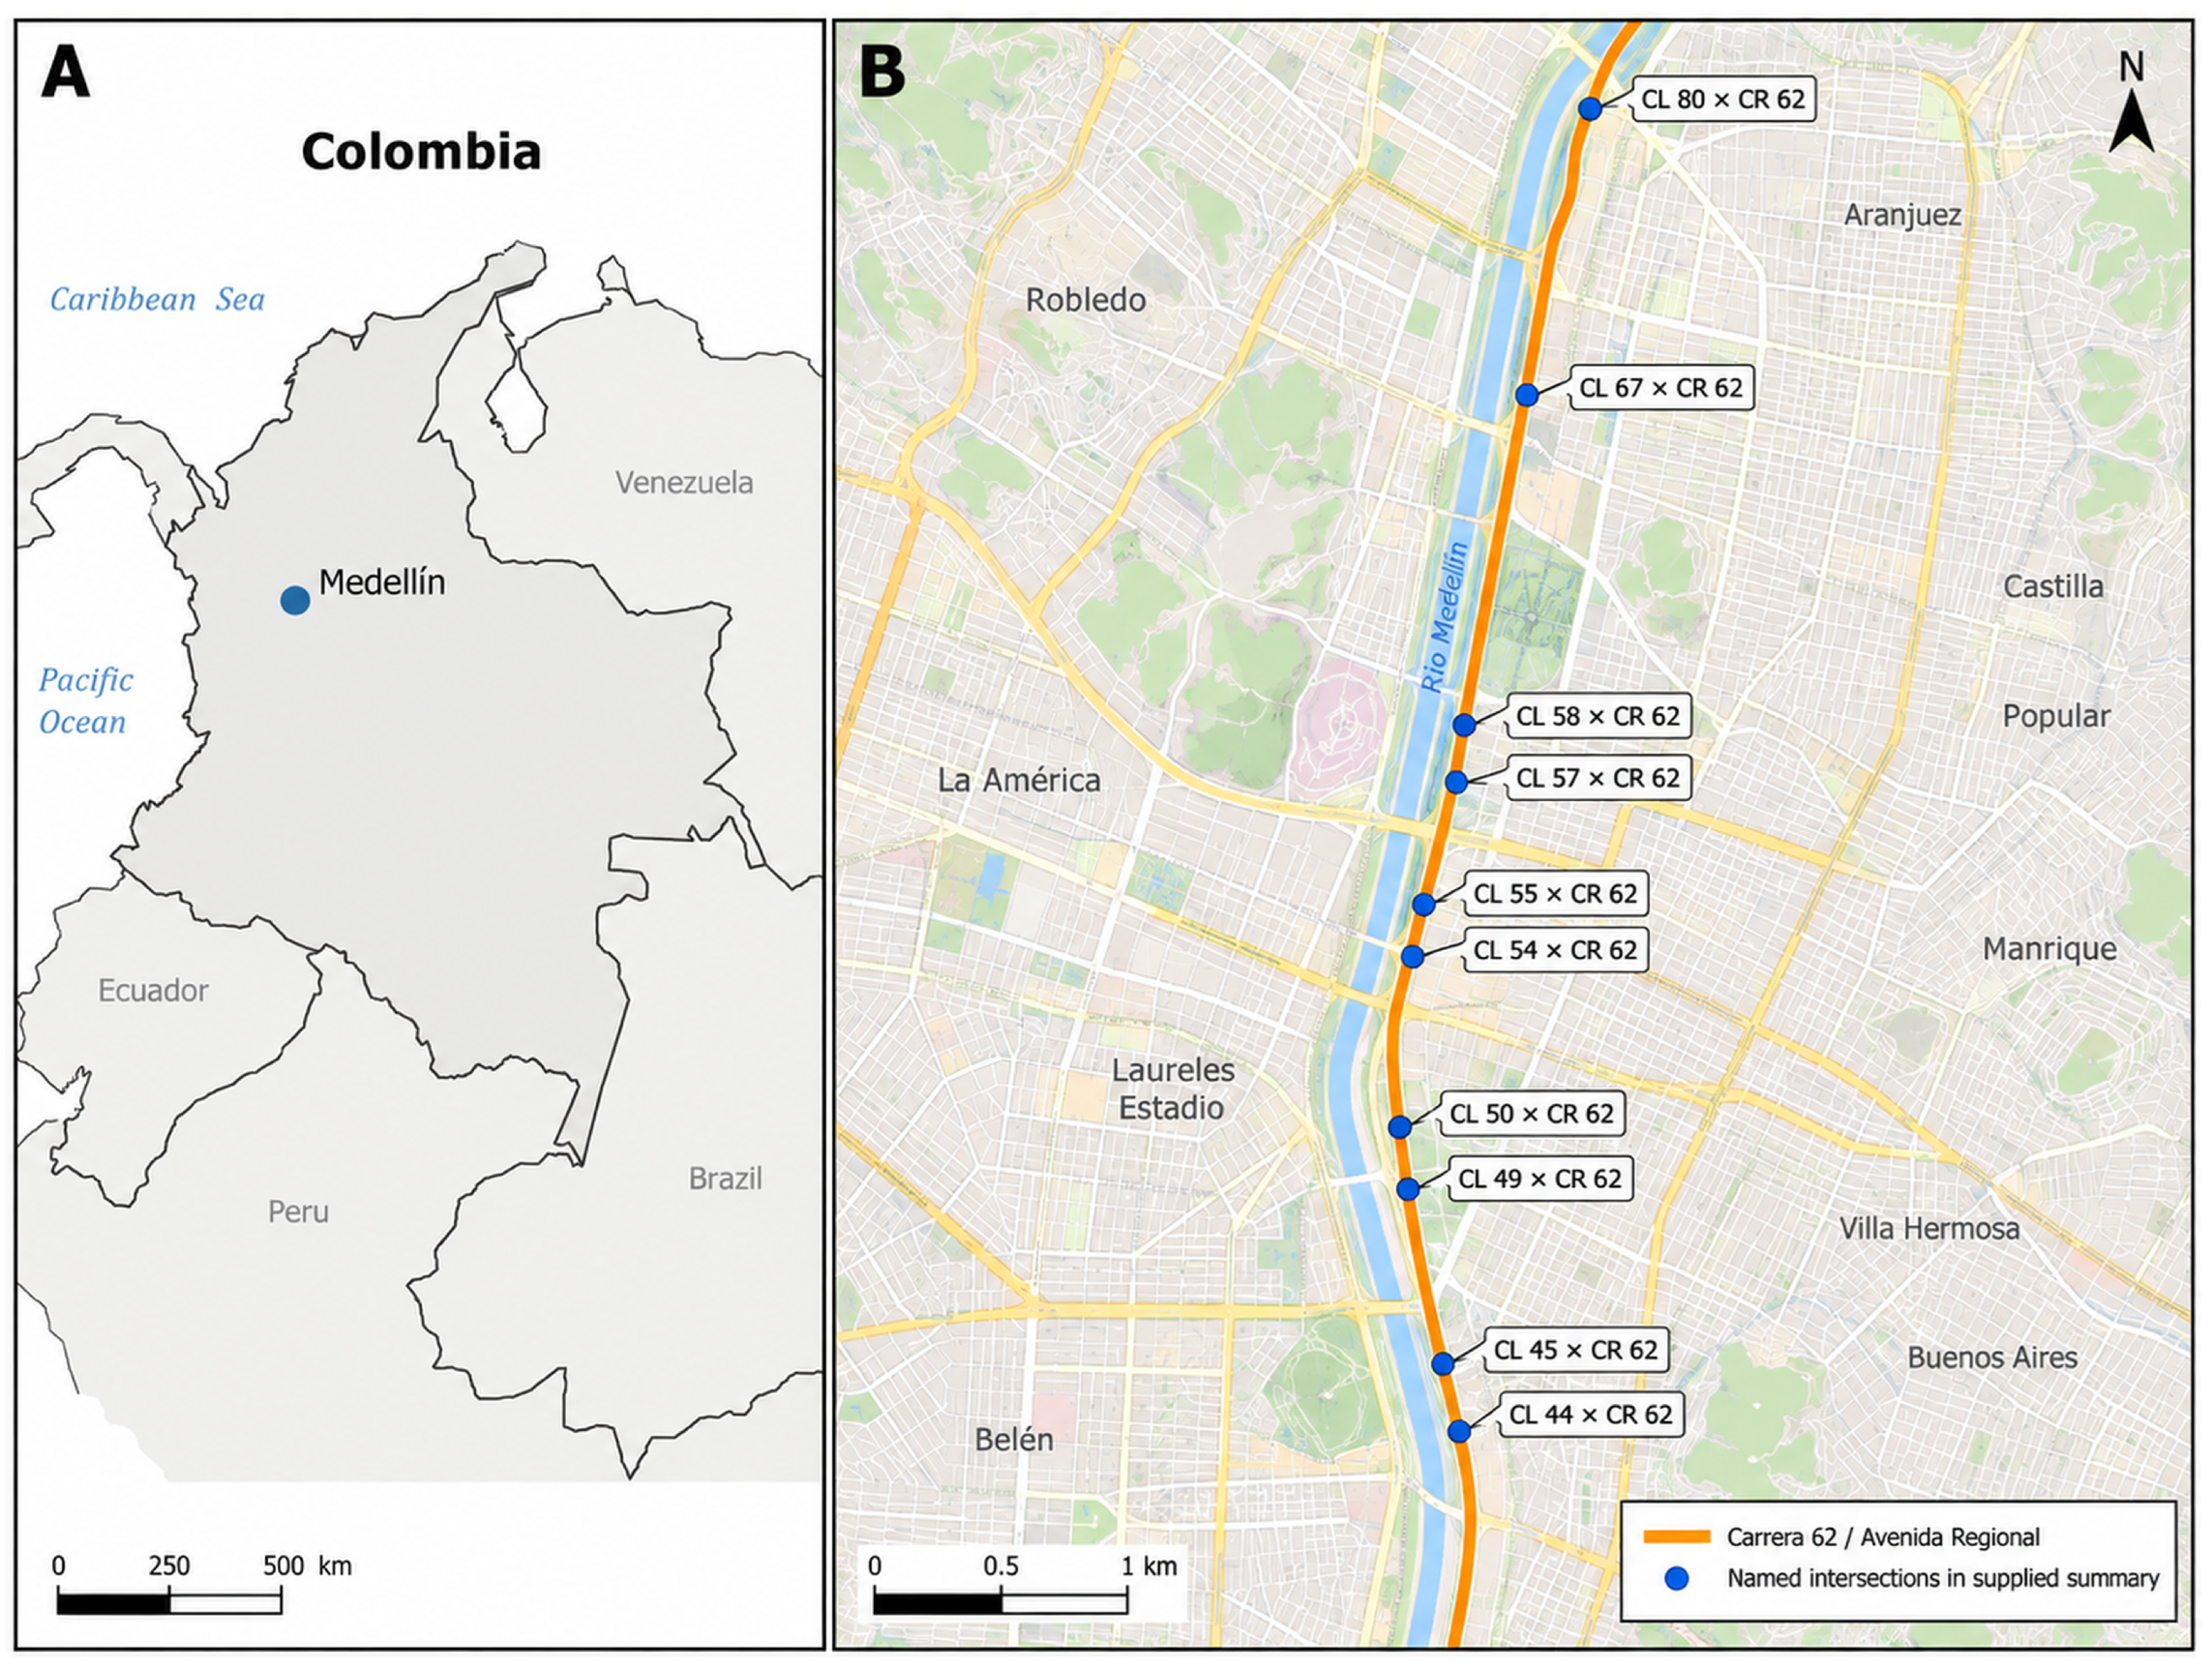
Project documentation describes the nominal supervised segment as approximately 5 km of Carrera 62 (Avenida Regional), between Calle 44 and Calle 92. Activities involved inspection, rehabilitation, and maintenance of trunk water and sewer assets while the urban corridor remained in operation. Work fronts moved within the segment over time. The retained analytical archive does not provide a verified lane count, cross-sectional inventory, traffic-volume series, posted-speed history, or complete dated footprints of the active work fronts; those technical attributes were therefore not inferred. Supervision entries were entirely nocturnal from November 2023 through March 2024, mixed in April 2024, and predominantly diurnal thereafter. Figure 1 provides spatial context for the documented corridor and the named intersections represented in the supplied summary.
Figure 1.
Spatial context of the study corridor in Medellín, Colombia. Panel (A) locates Medellín within Colombia, and Panel (B) shows Carrera 62/Avenida Regional and the named intersections in the supplied incident summary. The marked intersections provide geographic context and do not represent event-level incident or work-front locations.
The project files do not retain the date-specific locations, operating schedules, or durations of individual work fronts; consequently, the map and analysis cannot assign corridor incidents to particular work zones or construction phases.
The analysis used an operational monitoring workbook, monthly corridor incident summaries, and an intersection-level incident summary. The operational records also supported an earlier investigation of risk-based supervision and compliance [15]. The present analysis focuses on sign-loss patterns, source compatibility, record coverage, and the stability of monthly relationships with corridor incident counts.
2.2. Source Architecture and Provenance
The workbook contains two supervision-related worksheets, Data and Consolidado, along with a sign-theft worksheet and an inventory worksheet. The primary supervision series was reconstructed from Data. The theft series was reconstructed from dated rows in the sign-theft worksheet. Personal names and free-text supervision notes were not included in the distributed analytical records. Source worksheet names and original row numbers were retained to make the transformation auditable. These row references describe provenance; they do not establish that each retained entry is an independent event.
The corridor outcome series and intersection table were available only as supplied summaries attributed in the source materials to Medellín’s traffic incident information system, SIAT. A search of the supplied archive did not recover the event-level extract, extraction date, exact query, verified corridor boundary, location-assignment procedure, or operational definition of an included incident. Consequently, the analysis is limited to patterns that can be reproduced from the supplied summaries and does not present them as a validated extract of all eligible corridor events. The arithmetic consistency of each summary was assessed, but arithmetic agreement was not treated as evidence of complete ascertainment. For this reason, the supplied incident counts are interpreted as aggregate corridor-level totals for the available months; they do not permit independent verification of dataset completeness, case-selection criteria, or attribution of individual incidents to roadworks or temporary traffic management.
The available files also did not establish that the monthly summary and the intersection summary cover identical dates, spatial boundaries, or incident-category definitions. They were therefore analyzed as separate aggregate sources. In particular, the monthly subtotal of 371 incidents was not used as the denominator for percentages calculated from the 10-intersection table. Table 1 summarizes the analytical units and verification boundaries.
Table 1.
Available sources, analytical units, and limits of verification.
October, November, and December 2024 have no incident values in the supplied monthly summary. These cells were preserved as unavailable values. The absence could reflect extraction, transfer, archiving, or other processes that cannot be distinguished with the retained material. It was not coded as zero and was not attributed to a municipal reporting failure. The three-month gap reduces temporal completeness and is treated as a limitation of the supplied summary rather than evidence that no incidents occurred.
The monthly categories were retained under their supplied labels: collisions, pedestrian-involved incidents, and other incidents. A separate reported-fatality field was preserved without inferring whether it represents persons or fatal events or whether it follows a particular post-incident follow-up period. No injury-severity recoding was attempted. A positive count establishes that some events are represented, but not that all events meeting an intended definition are present. The analysis therefore uses an availability flag alongside the count, consistent with the distinction between observed outcomes and the systems that record them [2].
2.3. Record Reconciliation and Variable Construction
The supervision worksheets were first compared without assuming that corresponding row positions identified the same underlying record. Dates disagreed at 281 of 288 compared positions, and shift labels disagreed at 13 positions. These discrepancies indicate that positional joining is unsafe; they do not prove that 281 dates in one worksheet are erroneous. The Data worksheet was retained as the time-series source because its dated entries could be reconstructed directly. Variables from Consolidado were not imported into that series by row order.
The dated theft rows occupy rows 2–97 in the source worksheet. Row 99 contains a subtotal of 137 units and was excluded from the record count and quantity sum. A pasted summary area was also excluded. Including the subtotal as another observation would double the total to 274 without adding information. Identical-looking dated line items were retained in the primary series because no episode identifier was available to determine whether they represented repeated documentation or separate losses.
Duplication risk was quantified with two sensitivity rules. The strict rule removed rows that were identical in date, raw sign code, normalized message, assigned function, and unit count. The conservative rule collapsed all rows sharing a date, sign code, and assigned function, retaining only the maximum unit count for each group. The second rule provides a lower-bound scenario but may merge legitimately distinct losses recorded on the same date.
Sign functions were assigned from the original message field, with the raw code retained. The categories distinguish flagger warnings, speed-limit signs, machinery warnings, worker warnings, road-narrowing warnings, end-of-roadwork signs, and unspecified entries. Based on the recorded messages, SPO-02 denotes machinery-warning signs and SPO-05 denotes right-side narrowing warnings. The category mapping is a transcription of the archive, not a retrospective compliance assessment against a later standard [22,23].
For each calendar month, supervision volume was defined as the number of retained Data entries, and night share as the number labeled night divided by the total number of entries. Distinct supervision dates were calculated separately. Monthly sign loss was the sum of recorded units, with zero assigned when the retained theft log had no dated line item in that month. This zero denotes no recorded loss in the available log; it does not guarantee that no theft occurred. Monthly coverage was reported through supervision-entry count, distinct supervision dates, theft-line-item count, and distinct theft dates. January 2024 was the only populated incident month with fewer than 10 supervision entries, so a sensitivity analysis repeated the sign-loss comparison after excluding that month.
2.4. Descriptive and Exploratory Statistical Analysis
Descriptive results include source counts, calendar availability, monthly coverage, sign-function totals, and the distribution of the supplied incidents across named intersections. Percentages use denominators internal to the source from which the numerator was obtained. The intersection table is used for descriptive ranking only; formal spatial clustering and exposure-adjusted hotspot analysis were not attempted because event-level coordinates, network exposure, and the source-selection boundary could not be verified. Because no traffic-volume or pedestrian-flow series was retained, the study reports incident counts and rank associations rather than exposure-adjusted rates or risk estimates.
Monthly associations were evaluated using Spearman rank correlation, calculated as the Pearson correlation of average ranks so that tied values were handled explicitly [24]. For indicator X and supplied incident count Y, the statistic was
where contains the 13 months with populated incident summaries; m indexes the months in ; and denote the average ranks of X and Y in month m, respectively; and and denote their mean ranks across the observed months. The three indicators evaluated as X were recorded stolen units, night share, and supervision-entry count, whereas Y was the supplied monthly incident count. The comparison family was exploratory, was not preregistered, and was not treated as a confirmatory test set.
Two-sided asymptotic p values were calculated using with degrees of freedom. Because there are only 13 monthly observations and several ties, these values are approximate. Holm [25] provides the sequential procedure used to adjust the three exploratory p values as one family. A paired-month bootstrap generated 20,000 samples of size 13 with replacement, and a leave-one-month-out analysis recalculated the sign-loss coefficient after omitting each populated month [26]. The bootstrap percentile interval is reported as a descriptive stability summary because ordinary paired resampling does not preserve temporal dependence.
The partial rank sensitivity used the original calendar positions 1–16 as the time variable. Thus, the unavailable October–December 2024 interval remained a three-month gap rather than being compressed by ranking only the 13 observed months. Additional sensitivities compared adjacent-month first differences and the two duplicate-record rules. The sparse-coverage sensitivity excluded January 2024, and an unsupported zero-fill scenario was retained only to demonstrate the numerical consequence of replacing unavailable incident values with zero. These analyses answer different descriptive questions and are not alternative estimators of a common causal effect.
3. Results
The results are presented in the order needed to interpret the combined archive: source reconciliation and coverage, recorded sign loss, the two supplied incident summaries, and exploratory monthly associations. Counts reconstructed from operational rows are distinguished from counts carried forward from aggregate summaries.
3.1. Reconciled Records and Temporal Coverage
The retained supervision worksheet contains 288 entries on 278 distinct dates. Of these entries, 211 are labeled day and 77 night, corresponding to 73.3% and 26.7%, respectively. More than one entry can occur on the same date, so the 288 records should not be described as 288 independent days. Monthly supervision counts range from two in January 2024 to 25 in October 2024. The theft worksheet contains 96 dated line items on 43 distinct dates, representing 137 recorded units. Exclusion of the subtotal row removes an arithmetic duplication, not an observed theft.
Table 2 reports monthly record coverage directly. January 2024 contains two supervision entries on two dates and no theft line item; every other month with an available incident summary contains 15–23 supervision entries. During October–December 2024, when incident values are unavailable, the operational archive contains 63 supervision entries and five recorded stolen units. This difference in source coverage does not identify why the incident summary is incomplete.
Table 2.
Monthly analytical series and record coverage.
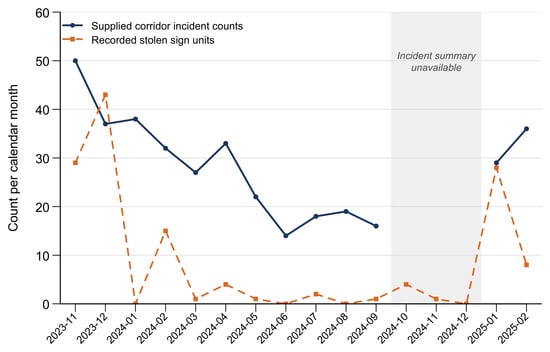
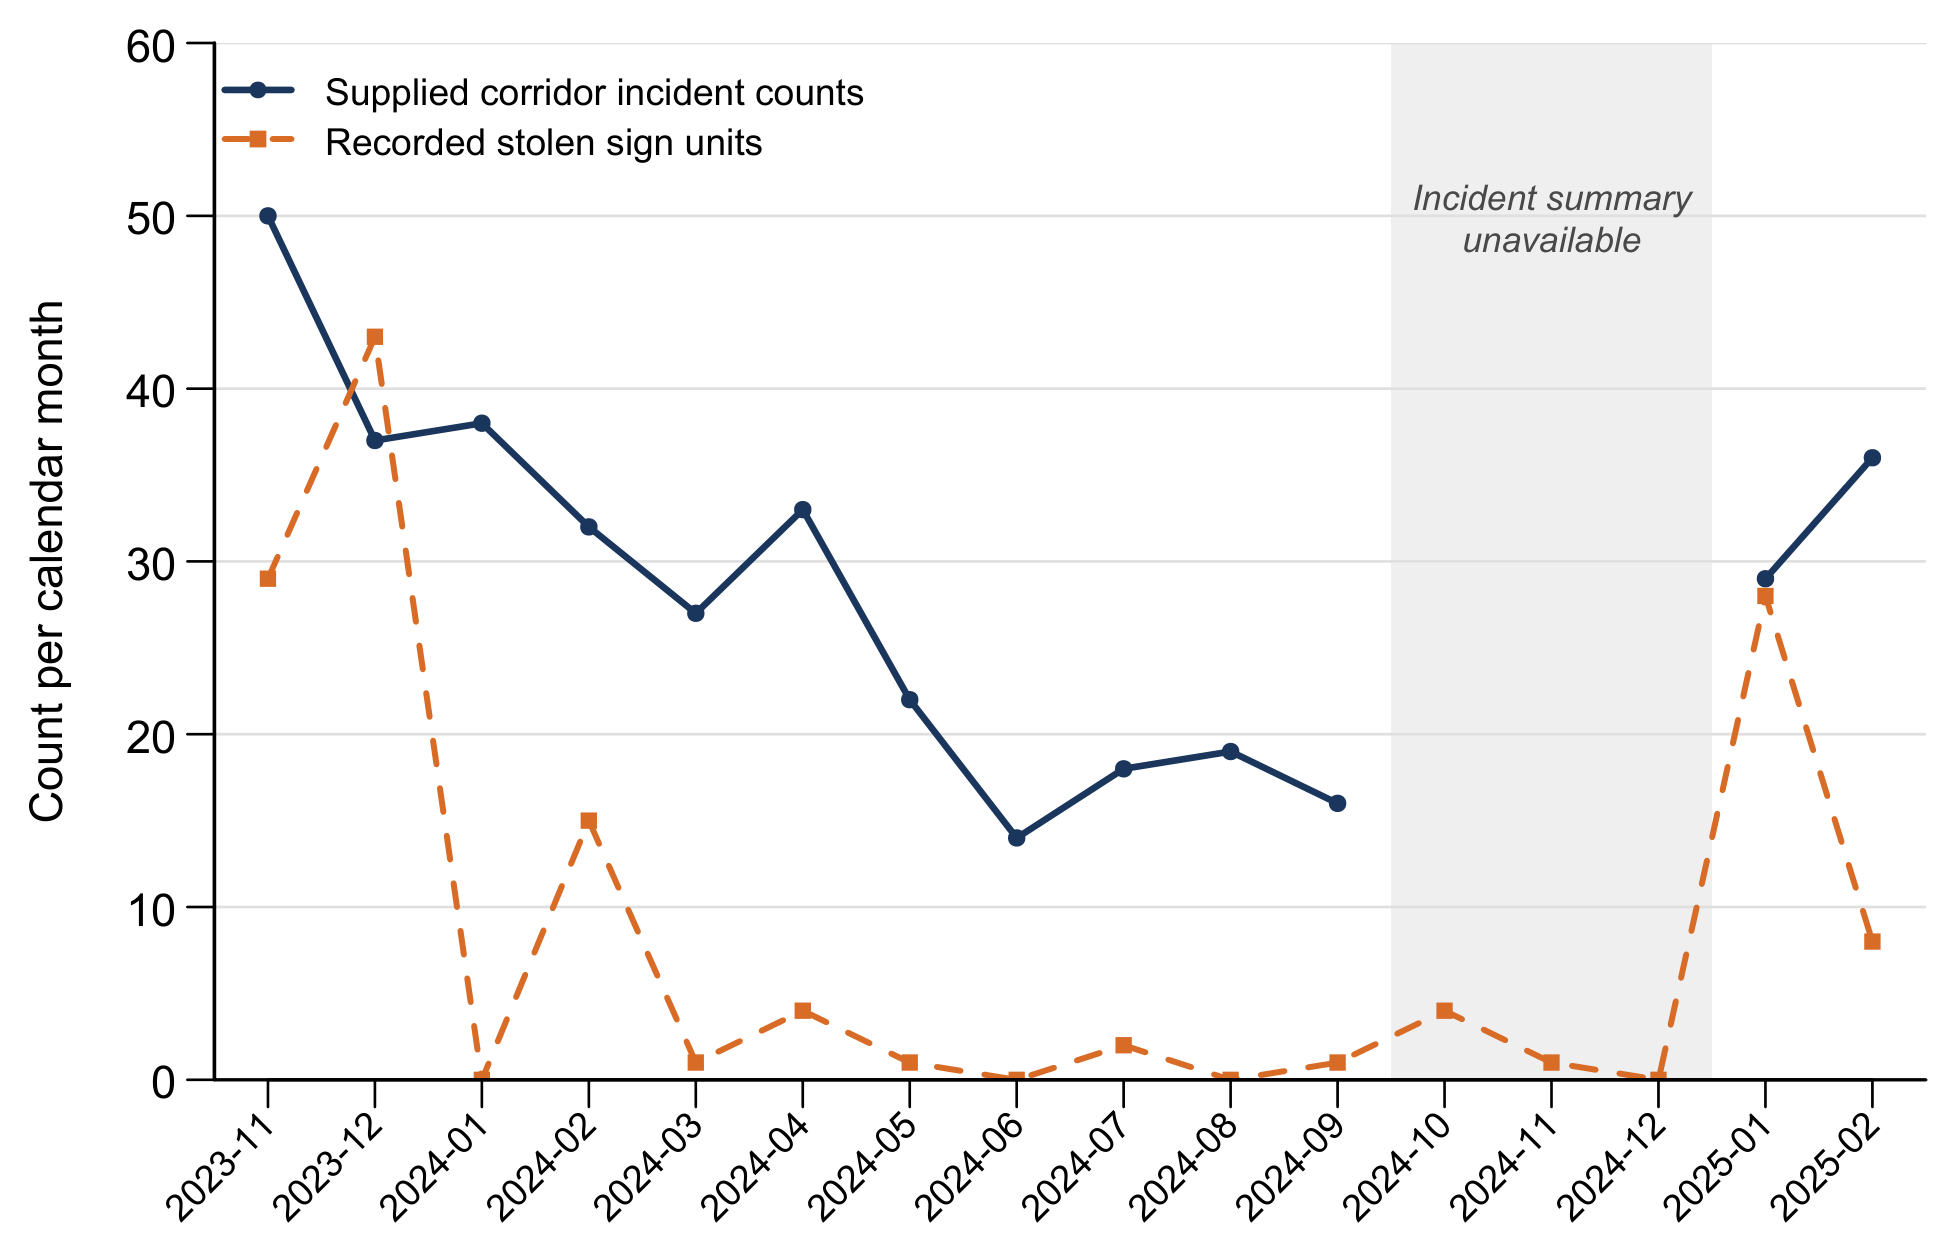
Across populated months, supplied incident counts range from 14 in June 2024 to 50 in November 2023. Sign losses are concentrated in December 2023, November 2023, and January 2025. Figure 2 displays both series on the original calendar and leaves the unavailable quarter visibly interrupted.
Figure 2.
Recorded stolen sign units and supplied corridor incident counts by calendar month. Note: The shaded interval marks unavailable incident summaries for October–December 2024. The continuous theft record does not resolve the cause of this absence.
3.2. Sign Functions and the Supplied Incident Distribution
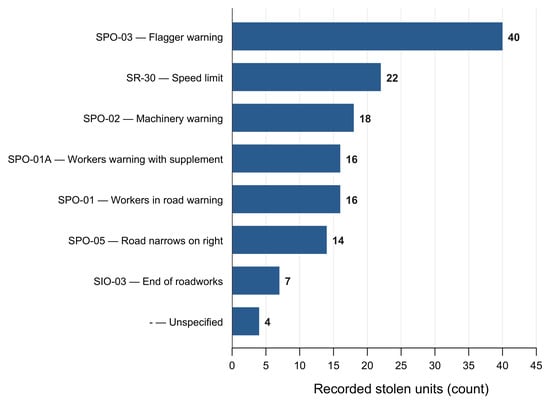
Flagger-warning signs account for 40 of the 137 recorded stolen units (29.2%), followed by speed-limit signs with 22 units (16.1%) and machinery-warning signs with 18 units (13.1%). The two worker-warning categories contain 16 units each, right-side narrowing warnings contain 14, and end-of-roadwork signs contain seven. Four units have an unspecified code. These percentages are shares of recorded sign loss, not estimates of theft risk, because the number and duration of deployed signs by function are unknown. Figure 3 retains the code–function relationship instead of grouping unlike devices under an assumed generic category.
Figure 3.
Recorded stolen units by source sign code and function, based on 96 dated line items and 137 units.
The 13 populated monthly summaries contain 371 incidents: 160 collisions (43.1%), 82 pedestrian-involved incidents (22.1%), and 129 other incidents (34.8%). The separate reported-fatality field sums to four, but its case definition cannot be verified. These values are not interpreted as complete counts for the entire 16-month period.
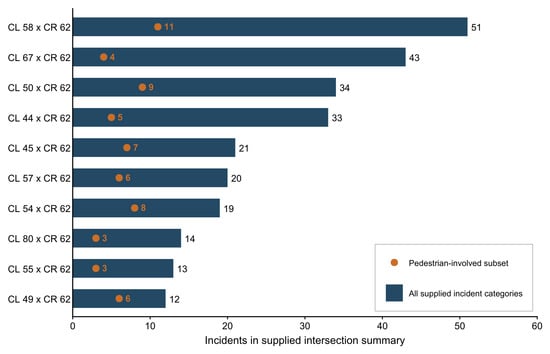
The separate 10-intersection summary contains 260 incidents, including 62 pedestrian-involved incidents and two reported fatalities. Because equivalence to the monthly summary could not be confirmed, these counts were not divided by 371, 82, or four. Within the intersection table, the four largest totals—Calle 58 with Carrera 62 (51), Calle 67 (43), Calle 50 (34), and Calle 44 (33)—sum to 161 incidents (61.9% of 260). Calle 58, Calle 50, and Calle 54 contain 28 of the 62 pedestrian-involved incidents in that table (45.2%). Figure 4 displays both total and pedestrian-involved counts without implying validated coordinates or exposure-adjusted risk.
Figure 4.
Supplied incident counts at 10 named intersections. Note: Pedestrian-involved counts are labeled beside the orange markers and are subsets of each total, not additional events. CL denotes Calle and CR denotes Carrera. The figure uses the intersection summary’s own denominator and does not constitute a spatial hotspot or risk analysis.
3.3. Exploratory Monthly Associations
For the 13 populated months, recorded stolen units and supplied incidents have a positive rank association (; unadjusted ). The night-share association is also positive (; unadjusted ), whereas supervision-entry count is negatively associated with incidents (; unadjusted ). After Holm adjustment, the sign-loss and night-share comparisons both have , while the supervision-entry comparison has . Thus, only the supervision-entry association remains below the 0.05 threshold within the defined three-comparison family. Table 3 reports these archival covariation indicators without converting them into effects of theft, night work, or supervision.
Table 3.
Exploratory associations with supplied corridor incident counts in the 13 populated months. The three tests form one Holm-adjusted family.
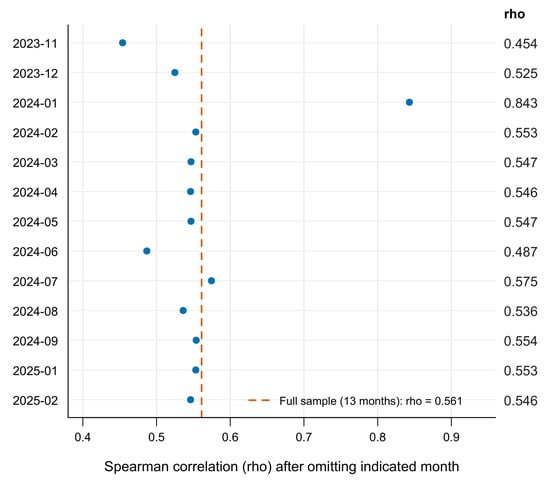
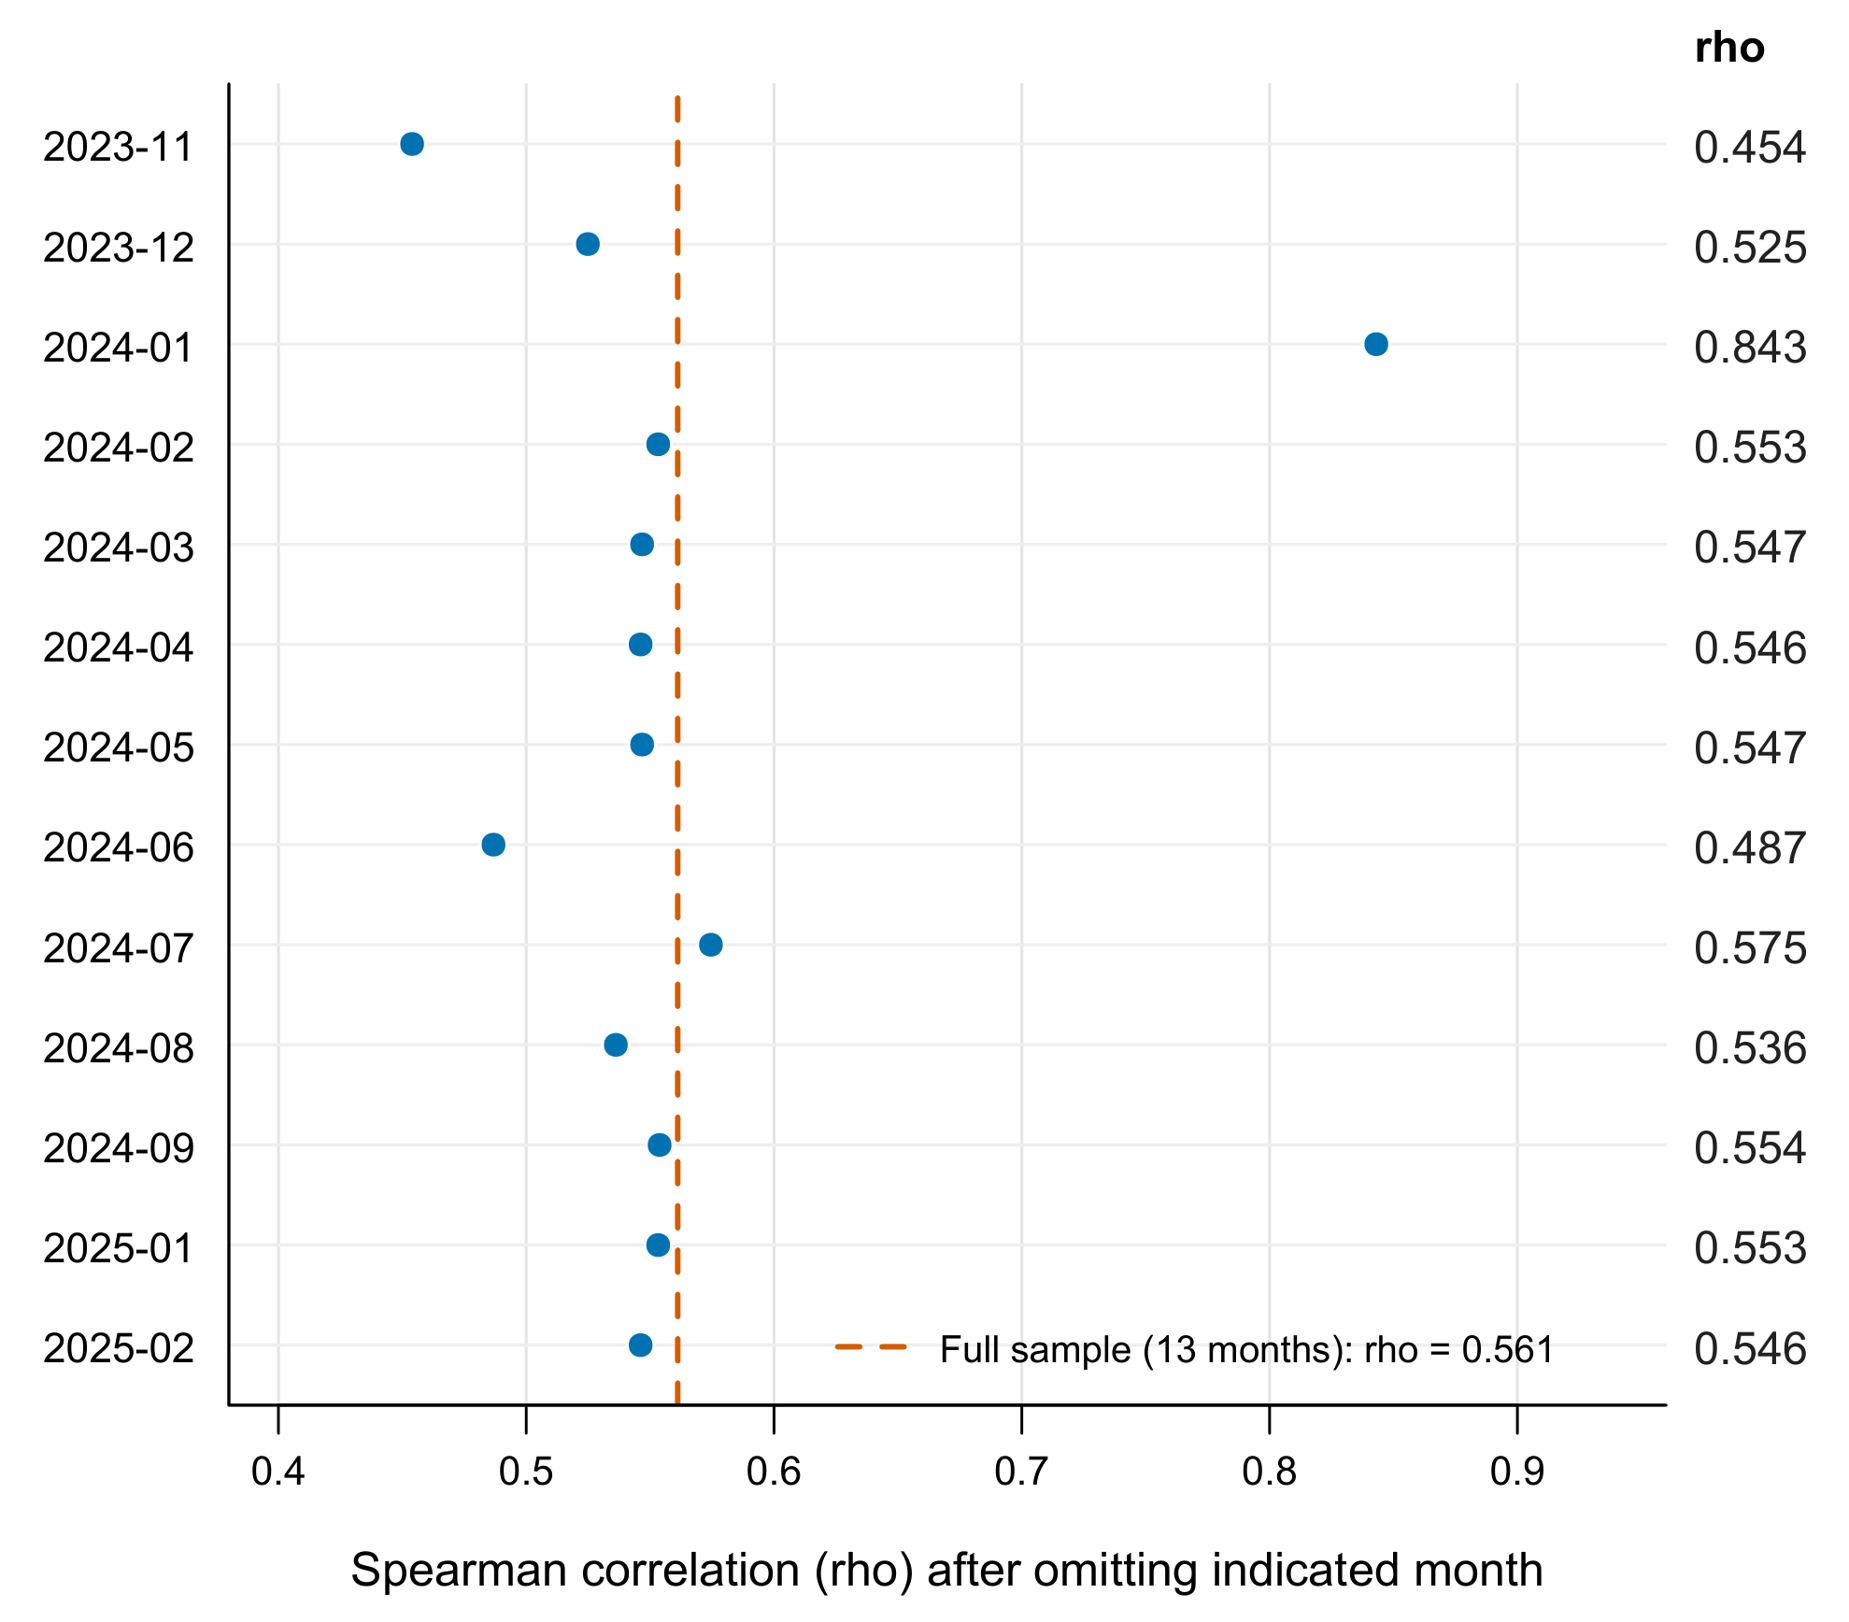
The paired-month bootstrap gives a 95% percentile interval of to for the sign-loss coefficient. Its breadth indicates substantial uncertainty under this resampling scheme. Leave-one-month-out coefficients remain positive but range from 0.454 to 0.843 (Figure 5). Omitting January 2024 yields the largest coefficient; that month contains only two supervision entries, no recorded stolen units, and 38 supplied incidents. These results identify influential calendar observations rather than grounds for deleting them.
Figure 5.
Leave-one-month-out Spearman correlations between recorded stolen sign units and supplied incident counts. Note: Each point uses 12 months. The vertical reference line is the full 13-month estimate (); the omitted month is identified on the vertical axis.
3.4. Sensitivity to Time Ordering, Record Coverage, and Duplicate Entries
The correlation between adjacent-month changes is negative and imprecise (; ; 11 pairs). The level-based coefficient compares the rank ordering of months across the observed period, whereas the first-difference coefficient asks whether increases or decreases from one observed month to the next occur together. The opposite, nonsignificant first-difference result therefore shows that the positive level association is not reproduced as a short-run month-to-month relationship.
Using actual calendar position rather than the compressed order of the 13 available months gives a partial rank association of (). Excluding January 2024, the only populated month with fewer than 10 supervision entries, increases the sign-loss coefficient to (). This increase demonstrates the influence of the sparsely documented month; it does not establish that the month is erroneous or that exclusion is preferable.
The strict duplicate audit identified one exact pair of one-unit SPO-02 entries on 17 January 2025. Removing one row reduced the recorded total from 137 to 136 units but left the monthly rank coefficient unchanged (; ). The conservative collapse reduced the total to 131 units and the coefficient to (). Because that rule may combine legitimate same-day losses, it is interpreted as a lower-bound sensitivity rather than a corrected total. Table 4 summarizes the sensitivity analyses, including the time-ordering, sparse-coverage, duplicate-record, and hypothetical zero-fill checks.
Table 4.
Sensitivity analyses for recorded sign loss and supplied monthly incident counts.
Hypothetically assigning zero incidents to October–December 2024 produces with an unadjusted . This scenario is not evidence that zero is an appropriate replacement; it shows that an unsupported missing-data assumption can alter the estimate and its approximate p value. Taken together, the sensitivity analyses show that the level association depends on temporal representation, record coverage, and duplicate-handling assumptions.
4. Discussion
The combined records reveal a consistent methodological pattern: operational sign-loss and supervision data can be summarized reproducibly, but their relationship with municipal incident counts remains aggregate and incomplete. Recorded sign loss, supervision volume, and the day/night composition of supervision each showed monthly covariation with corridor incident counts, yet these patterns do not constitute evidence of causal effects. The incomplete incident calendar, absence of exposure denominators, and lack of event-level linkage constrain the interpretation of these associations.
4.1. What the Combined Records Can Establish
The corrected sign-loss count is an operational finding, but it is not an estimate of safety impact. A missing flagger-warning or speed-limit sign changes what the archive reports about temporary traffic control. The consequences would depend on whether the sign was required at that location, whether another device provided the same information, how long the sign remained absent, and which road users encountered the affected approach. The source contains quantities lost but not those intermediate conditions. General work-zone reviews and studies incorporating infrastructure and environmental characteristics show why the condition of a traffic-control system cannot be reduced to the number of devices listed in a loss log [3,27].
Islam [28] examines geometric and non-geometric factors in work-zone crashes. Research on temporal instability and worker-involved crash severity also cautions against treating a coefficient estimated in one period as an invariant relationship [29,30]. The present comparison is considerably more limited than those event-level modeling settings. It uses only 13 months, lacks a traffic denominator, and cannot connect an incident to a particular missing sign. Its positive level-based coefficient is compatible with several explanations, including common calendar patterns, changes in construction activity, differences in observation intensity, and other unmeasured corridor conditions. The retained data do not distinguish among them. Moreover, the sign-loss association weakened after adjustment for multiple testing, had a wide paired-month bootstrap interval, and was not reproduced in the first-difference analysis. These results reinforce that the observed monthly relationship should not be interpreted as evidence that sign loss caused corridor incidents.
Absolute incident counts describe recorded burden rather than exposure-adjusted risk. Without vehicle volumes, pedestrian flows, vehicle-kilometers traveled, or comparable time-at-risk measures, a month with more recorded incidents cannot be interpreted as having a higher underlying safety risk. The same limitation applies to comparisons among intersections.
The negative association between supervision volume and incidents requires the same restraint. A month with more entries is not necessarily a month with more effective supervision, more inspection hours, or more complete observation of hazards. January 2024 illustrates the problem: two entries coexist with a relatively high supplied incident count, but the archive does not establish whether supervision activity was sparse, recording was incomplete, or the work program differed. The positive association between the nighttime share of supervision entries and incident counts is similarly descriptive. Night share is closely tied to calendar period, and day and night entries do not provide denominators for traffic exposure during those shifts. Interpreting either coefficient as a management or safety effect would assign meaning to the record counts that the source does not support.
The difference between the level-based and first-difference results provides an additional reason for caution. The level-based coefficient describes how monthly values vary across the study period, whereas the first-difference analysis evaluates whether month-to-month changes move in the same direction. The latter did not reproduce the positive relationship observed in the levels. This divergence may reflect slowly varying calendar or construction-phase conditions, but the monthly data cannot identify those conditions or establish an appropriate lag between a recorded sign loss and a subsequent incident.
Karimi et al. [6] show why linkage between datasets is itself a substantive methodological task. In this case, aggregation to month makes two tables numerically comparable without making their records linkable. The operator’s unit is a supervision entry or loss line item; the supplied municipal unit is an incident count. Differences in source capture, such as those examined in police and insurance comparisons, cannot be solved by aligning column headings [8,9]. The practical contribution is therefore not a claim that the sources have been integrated at event level. It is a documented boundary between the monthly comparison that can be reproduced and the event-level attribution that cannot.
The unavailable quarter further limits the completeness of the retained incident series and cannot be attributed to a discontinuity in municipal reporting [7].
4.2. Implications for Urban Monitoring and Pedestrian Protection
The intersection counts can guide an initial review of where the supplied burden is concentrated, but not determine which locations are intrinsically most dangerous. A busy intersection can have a high count because many travelers pass through it, because its layout generates conflicts, or because reporting is more complete there. Espinoza-Mina and Colina-Vargas [31] illustrate the descriptive value of characterizing urban traffic incidents, while work on urban features and vulnerable road users motivates closer examination of the surrounding environment [17]. In the present corridor, the combination of total and pedestrian-involved counts provides a starting point for field assessment. It does not establish a spatial risk gradient or show that construction created the observed concentration.
Pedestrian protection should not be inferred from whether a supervision log contains a generic compliance entry. A temporary walking route may remain open while becoming indirect, difficult to detect, or disconnected from a safe crossing. These are candidate conditions for prospective observation, not conditions measured in the present archive. Sharma and Dehalwar [19] review pedestrian safety in urban transport systems, and the intervention literature provides a basis for considering changes to the travel environment rather than relying only on traveler behavior [18]. For a future construction-monitoring protocol, route continuity, crossing availability, accessibility, and the duration of obstructions would need explicit fields with defined observation times.
International guidance emphasizes monitoring progress in urban road safety [32], while comparative urban practice highlights the relevance of coordinated local action [33]. The case suggests a modest operational requirement for such coordination: preserve the identifiers that allow an incident record and a work-front condition to be evaluated on a common spatial and temporal basis. At minimum, a prospective record would need a stable work-front identifier, a dated location or footprint, start and end times, and the condition of critical traffic-control elements. A loss entry should distinguish detection time from estimated occurrence time and record when the missing function was restored. These fields would support later analysis without assuming that detection and exposure begin simultaneously.
The proposed record structure is a design implication, not an intervention tested by this study. It should be introduced with clear definitions and an audit process rather than as a large checklist whose completeness cannot be maintained. For example, an explicit “not observed” code is preferable to an empty cell when a required condition was not assessed. A separate “not applicable” code avoids treating a device that was not required as a missing device. Retaining the difference between planned deployment, observed presence, reported loss, and restoration would also prevent inventory totals from being confused with incident totals. These distinctions follow directly from the ambiguities encountered in the supplied workbook.
The interpretation of a loss quantity also depends on its time basis. Consider two hypothetical records with the same number of missing signs: one is followed by immediate replacement, whereas the other remains unresolved over several observation periods. Their recorded loss counts would be equal, but the duration of the missing traffic-control function would differ. Neither situation is asserted to have occurred in this corridor. The example clarifies why replacing the absent duration variable with the number of lost units would change the meaning of an exposure measure. A prospective system should consequently record both a loss episode and its resolution, while retaining the sign’s function and the relevant work-front identifier. Without those links, the loss log remains useful for operational accounting but incomplete for evaluating exposure to an altered traffic-control arrangement.
Standardization would also improve the connection between technical requirements and analytical variables. Temporary traffic-control manuals identify device functions, but a research database needs to preserve which function was relevant to the actual work configuration [22,23]. The present sign categories cannot establish whether the deployed arrangement met an applicable plan. A prospective archive should therefore retain the traffic-management-plan version and the observation’s relationship to that version. Historical analyses should use the standard and plan in force for the observation period rather than assume that a later manual describes earlier obligations. This would make compliance an interpretable variable instead of a label detached from its reference conditions.
4.3. Limitations and Priorities for Further Research
The most consequential limitation is the absence of the event-level incident extract. It prevents independent checking of the corridor definition, location assignment, duplicated events, category coding, and temporal completeness. The original query boundaries, event inclusion rules, extraction date, and relationship between the monthly and intersection-level summaries also cannot be independently verified. In particular, the two summaries cannot be confirmed as equivalent in period, geographic coverage, or incident categories. The supplied totals can be reproduced from the retained tables, but the underlying incidents cannot be independently reconstructed from the present package. Research using citywide open datasets illustrates what can become possible when spatial and temporal records are retained with sufficient detail [12,14]. Recovering the original extract is therefore more important for strengthening this study than fitting a more elaborate model to the same 13 monthly observations.
Incident summaries were unavailable for October–December 2024. These months were retained as missing rather than treated as zero, and their absence should not be interpreted as evidence that no incidents occurred or that the municipal system stopped recording events during that period.
The operational records also have limits. Their worksheet inconsistencies preclude an unqualified positional join, identical-looking theft line items cannot be resolved without episode identifiers, and the observed dates do not establish continuous supervision coverage. The strict and conservative duplicate-sensitivity analyses indicate that the main monthly association is not driven by the single exact duplicate pair, although these analyses cannot determine whether visually similar records represent duplicate or separate loss episodes. No inventory-at-risk denominator is available for estimating a sign-theft rate. No replacement times are available for estimating how long a required function was absent. Thus, a count of 137 units can be reproduced, but the cumulative duration or spatial distribution of missing-sign exposure cannot. These omissions cannot be repaired by assigning assumed values from general engineering practice.
The statistical analysis is exploratory and ecological. Monthly aggregation obscures the order of sign loss and incidents within a month, and unmeasured traffic demand, construction intensity, weather, and route changes may affect both series. The small number of months limits the usefulness of multivariable adjustment, and ordinary asymptotic tests and paired bootstrap resampling do not resolve serial dependence. The leave-one-month-out analysis also shows that the level-based association is sensitive to individual months, particularly January 2024, which had only two retained supervision entries. The contrasting first-difference result further indicates that the observed relationship depends on how temporal variation is represented. Broader reviews of data collection and analysis support treating data architecture and measurement as prerequisites for stronger modeling [10,20].
Attribution of corridor incidents to active construction also remains constrained by the available spatial and temporal information. The occurrence of an incident within the study corridor does not necessarily indicate that it was directly associated with construction activity, because the location and operating period of individual work fronts cannot be matched reliably to each incident. A fixed corridor boundary may include intersections and approaches that were not under temporary traffic control at the time of an event, whereas a time-varying work-front boundary would change which locations were exposed to construction-related conditions on each date. Establishing a direct relationship would therefore require sufficiently precise incident locations together with dated work-front footprints and operating periods. Accordingly, the present analysis treats the observations as corridor-level incident counts during the study period rather than as incidents attributable to construction activity or sign loss.
The single-corridor setting and aggregate monthly design limit the transferability of the observed associations. Findings concerning source compatibility, availability coding, and analytical sensitivity may inform monitoring procedures in other urban construction settings, but the estimated correlations should not be assumed to apply beyond the corridor examined here. The absence of a comparison corridor or a clearly defined before–after comparison also prevents the present analysis from estimating an intervention effect. Future studies should integrate event-level incident records with time-varying work-front conditions, traffic and pedestrian exposure measures, and either multiple corridors or a clearly defined comparison period. Such designs would provide a stronger basis for evaluating temporal relationships and potential safety effects than is possible with the present monthly aggregate records.
5. Conclusions
This source-audited analysis evaluates the monitoring value and limitations of archived work-zone records; it does not test whether roadworks or temporary traffic management caused the recorded corridor incidents. The audited workbook contains 288 supervision entries and 96 dated sign-loss line items representing 137 recorded units. The corridor summaries contain 371 incidents across 13 populated months, not a complete total for the 16-month construction calendar. The intersection-level summary represents a separate aggregate source and should not be assumed to constitute a verified subset of the monthly total. Keeping these quantities and observation units separate prevents unavailable values and unverified source relationships from being converted into unsupported safety findings.
Recorded sign loss and corridor incident counts showed a positive association at the monthly level; however, the association did not remain below 0.05 after Holm adjustment and was not reproduced by the first-difference analysis. The wide bootstrap interval further indicates substantial uncertainty in the estimated relationship. Accordingly, the observed patterns should be interpreted as temporal covariation among archived aggregate measures rather than as evidence that sign loss causes corridor incidents or that greater supervision reduces them. The concentration of pedestrian-involved incidents at specific locations further highlights the value of more detailed spatial, temporal, and exposure information for future work-zone safety assessments.
For future urban projects, the priority is a traceable connection between incident outcomes and the changing condition of the active work zone. Stable record identifiers, dated work-front locations or footprints, traffic and pedestrian exposure measures, explicit availability codes, and sign-function and restoration records would address the principal ambiguities identified here. Linked to an appropriately documented event-level incident extract, these measurements would make later safety evaluation more credible. The present analysis therefore shows how archived operational and incident records can contribute to work-zone safety monitoring, while also making clear that stronger exposure and event-linkage data are needed to estimate risk or assess causal relationships.
Author Contributions
Conceptualization, J.S.C., O.E.B.-C. and C.D.C.-Á.; methodology, J.S.C. and O.E.B.-C.; validation, O.E.B.-C.; formal analysis, C.D.C.-Á.; investigation, J.S.C.; data curation, O.E.B.-C.; writing—original draft preparation, J.S.C. and O.E.B.-C.; writing—review and editing, C.D.C.-Á.; visualization, C.D.C.-Á.; supervision, J.S.C. All authors have read and agreed to the published version of the manuscript.
Funding
This research received no external funding.
Institutional Review Board Statement
This analysis involved no participant recruitment or intervention. It used operational records with direct personal fields removed and aggregate incident summaries, without access to individual clinical records.
Informed Consent Statement
No individuals were recruited or contacted for this analysis.
Data Availability Statement
The related operational dataset is available in Mendeley Data, version 1, at https://doi.org/10.17632/tb2mhjssjj.1.
Acknowledgments
During the preparation of this manuscript, the authors used ChatGPT (version 5.6, OpenAI) for limited language editing and stylistic refinement. No generative AI tools were used for study design, data collection, data analysis, or interpretation of results. The authors reviewed and edited all AI-assisted outputs and take full responsibility for the content of this publication.
Conflicts of Interest
The authors declare no conflicts of interest.
References
- World Health Organization. Global Status Report on Road Safety 2023; World Health Organization: Geneva, Switzerland, 2023; Available online: https://www.who.int/publications/i/item/9789240086517 (accessed on 5 September 2026).
- World Health Organization; FIA Foundation; Global Road Safety Partnership; World Bank. Data Systems: A Road Safety Manual for Decision-Makers and Practitioners; World Health Organization: Geneva, Switzerland, 2010; Available online: https://www.who.int/publications/i/item/9789241598965 (accessed on 5 September 2026).
- Rathnasiri, N.; De Silva, N.; Wijesundara, J. State of the art in work zone safety: A systematic review. Int. J. Transp. Sci. Technol. 2024, 13, 14–28. [Google Scholar] [CrossRef] [Scilit]
- Venthuruthiyil, S.P.; Thapa, D.; Mishra, S. Towards smart work zones: Creating safe and efficient work zones in the technology era. J. Saf. Res. 2023, 87, 345–366. [Google Scholar] [CrossRef] [Scilit]
- Imprialou, M.; Quddus, M. Crash data quality for road safety research: Current state and future directions. Accid. Anal. Prev. 2019, 130, 84–90. [Google Scholar] [CrossRef] [Scilit]
- Karimi, S.; Hosseinzadeh, A.; Kluger, R.; Wang, T.; Souleyrette, R.; Harding, E. A systematic review and meta-analysis of data linkage between motor vehicle crash and hospital-based datasets. Accid. Anal. Prev. 2024, 197, 107461. [Google Scholar] [CrossRef] [Scilit]
- Puvanachandra, P.; Laverty, A.; Ghaly, M.; Sakr, H.; Abdelhamid, R.; Iaych, K.; Peden, M. A scoping review of road traffic data systems in the Eastern Mediterranean Region. East. Mediterr. Health J. 2024, 30, 238–247. [Google Scholar] [CrossRef] [Scilit]
- Blackman, R.; Debnath, A.K.; Haworth, N. Understanding vehicle crashes in work zones: Analysis of workplace health and safety data as an alternative to police-reported crash data in Queensland, Australia. Traffic Inj. Prev. 2020, 21, 222–227. [Google Scholar] [CrossRef] [Scilit]
- Branion-Calles, M.; Godfreyson, A.; Berniaz, K.; Arason, N.; Chan, H.; Erdelyi, S.; Winters, M.; Sengupta, J.; Essa, M.; Rajabali, F.; et al. Underreporting and selection bias of serious road traffic injuries in auto insurance claims and police reports in British Columbia, Canada. Transp. Res. Interdiscip. Perspect. 2025, 30, 101375. [Google Scholar] [CrossRef] [Scilit]
- Rabbani, M.B.A.; Musarat, M.A.; Alaloul, W.S.; Ayub, S.; Bukhari, H.; Altaf, M. Road Accident Data Collection Systems in Developing and Developed Countries: A Review. Int. J. Integr. Eng. 2022, 14, 336–352. [Google Scholar] [CrossRef] [Scilit]
- Martinez, S.; Sanchez, R.; Yañez-Pagans, P. Road safety: Challenges and opportunities in Latin America and the Caribbean. Lat. Am. Econ. Rev. 2019, 28, 17. [Google Scholar] [CrossRef] [Scilit]
- Pérez-Rave, J.; Correa Morales, J.C.; González Echavarría, F. Metodología para explorar datos abiertos de accidentalidad vial usando Ciencia de Datos: Caso Medellín. Ingeniare Rev. Chil. Ing. 2019, 27, 495–509. [Google Scholar] [CrossRef] [Scilit]
- Arango Uribe, M.L.; Sánchez Corredor, J.; Correa Álvarez, C.D. Social impacts and road safety in intermodality: Case study of the Ayacucho Tram in Medellín-Colombia. J. Urban Mobil. 2025, 8, 100154. [Google Scholar] [CrossRef] [Scilit]
- Arango Uribe, M.L.; Rúa, E.Q.; Correa Álvarez, C.D. Georeferenced Dataset on Road Traffic Incidents and Fatalities in Medellín, Colombia (2008–2025). Data 2026, 11, 67. [Google Scholar] [CrossRef] [Scilit]
- Sánchez Corredor, J.; Arango Uribe, M.L.; Correa Álvarez, C.D. Risk-Based Supervision of Work Zone Traffic Management: Longitudinal Evidence on Compliance and Safety in Urban Infrastructure Projects. Future Transp. 2026, 6, 90. [Google Scholar] [CrossRef] [Scilit]
- Correa, C. Dataset and Code for Risk-Based Supervision of Work Zone Traffic Management in Medellín, Colombia. Mendeley Data 2026. [Google Scholar] [CrossRef]
- Klanjčić, M.; Gauvin, L.; Tizzoni, M.; Szell, M. Identifying urban features for vulnerable road user safety in Europe. EPJ Data Sci. 2022, 11, 27. [Google Scholar] [CrossRef] [Scilit]
- Rezapur-Shahkolai, F.; Afshari, M.; Doosti-Irani, A.; Bashirian, S.; Maleki, S. Interventions to prevent road traffic injuries among pedestrians: A systematic review. Int. J. Inj. Control Saf. Promot. 2022, 29, 533–549. [Google Scholar] [CrossRef] [Scilit]
- Sharma, S.N.; Dehalwar, K. A Systematic Literature Review of Pedestrian Safety in Urban Transport Systems. J. Road Saf. 2025, 36, 55–78. [Google Scholar] [CrossRef] [Scilit]
- Gutierrez-Osorio, C.; Pedraza, C. Modern data sources and techniques for analysis and forecast of road accidents: A review. J. Traffic Transp. Eng. (Engl. Ed.) 2020, 7, 432–446. [Google Scholar] [CrossRef] [Scilit]
- von Elm, E.; Altman, D.G.; Egger, M.; Pocock, S.J.; Gøtzsche, P.C.; Vandenbroucke, J.P. The Strengthening the Reporting of Observational Studies in Epidemiology (STROBE) Statement: Guidelines for Reporting Observational Studies. PLoS Med. 2007, 4, e296. [Google Scholar] [CrossRef] [Scilit] [PubMed]
- Ministerio de Transporte de Colombia; Agencia Nacional de Seguridad Vial. Manual de Señalización Vial de Colombia: Dispositivos Uniformes en la Infraestructura Vial para la Regulación del Tránsito y la Seguridad Vial; Ministerio de Transporte de Colombia: Bogotá, Colombia, 2024. Available online: https://ansv.gov.co/es/publicaciones/manual-de-senalizacion-vial (accessed on 15 September 2026).
- Federal Highway Administration. Manual on Uniform Traffic Control Devices for Streets and Highways, 11th ed.; with Revision 1; U.S. Department of Transportation: Washington, DC, USA, 2025. Available online: https://mutcd.fhwa.dot.gov/kno_11th_Edition.htm (accessed on 15 September 2026).
- Spearman, C. The proof and measurement of association between two things. Int. J. Epidemiol. 2010, 39, 1137–1150. [Google Scholar] [CrossRef] [Scilit] [PubMed]
- Holm, S. A simple sequentially rejective multiple test procedure. Scand. J. Stat. 1979, 6, 65–70. [Google Scholar]
- Efron, B.; Tibshirani, R.J. An Introduction to the Bootstrap; Chapman & Hall: New York, NY, USA, 1993; Available online: https://www.taylorfrancis.com/books/mono/10.1201/9780429246593/introduction-bootstrap-bradley-efron-tibshirani (accessed on 15 September 2026).
- Palese, S.; Pazzini, M.; Chiola, D.; Lantieri, C.; Simone, A.; Vignali, V. Crash Risk Analysis in Highway Work Zones: A Predictive Model Based on Technical, Infrastructural, and Environmental Factors. Sustainability 2025, 17, 6112. [Google Scholar] [CrossRef] [Scilit]
- Islam, M. Assessing the effects of geometry and non-geometry related factors in work-zone crashes. Traffic Inj. Prev. 2024, 25, 492–498. [Google Scholar] [CrossRef] [Scilit]
- Islam, M.; Alnawmasi, N.; Mannering, F. Unobserved heterogeneity and temporal instability in the analysis of work-zone crash-injury severities. Anal. Methods Accid. Res. 2020, 28, 100130. [Google Scholar] [CrossRef] [Scilit]
- Mokhtarimousavi, S.; Anderson, J.C.; Hadi, M.; Azizinamini, A. A temporal investigation of crash severity factors in worker-involved work zone crashes: Random parameters and machine learning approaches. Transp. Res. Interdiscip. Perspect. 2021, 10, 100378. [Google Scholar] [CrossRef] [Scilit]
- Espinoza-Mina, M.A.; Colina-Vargas, A.M. Characterization of traffic accidents for urban road safety. Rev. Fac. Ing. Univ. Antioq. 2024, 112, 60–77. [Google Scholar] [CrossRef] [Scilit]
- International Transport Forum. Monitoring Progress in Urban Road Safety: 2022 Update; International Transport Forum Policy Papers, No. 108; OECD Publishing: Paris, France, 2022. [Google Scholar] [CrossRef] [Scilit]
- International Transport Forum. Best Practice for Urban Road Safety: Case Studies; International Transport Forum Policy Papers, No. 76; OECD Publishing: Paris, France, 2020. [Google Scholar] [CrossRef]

Disclaimer/Publisher’s Note: The statements, opinions and data contained in all publications are solely those of the individual author(s) and contributor(s) and not of MDPI and/or the editor(s). MDPI and/or the editor(s) disclaim responsibility for any injury to people or property resulting from any ideas, methods, instructions or products referred to in the content. |
© 2026 by the authors. Licensee MDPI, Basel, Switzerland. This article is an open access article distributed under the terms and conditions of the Creative Commons Attribution (CC BY) license.