


Abstract
Lithological, metasomatic, and structural heterogeneity in ore-hosting rocks limits the reliability of applying a single set of mechanical parameters without domain subdivision. This study evaluates intact rock properties, shear resistance along natural discontinuities, and conditional upscaling to the rock mass scale. The database comprised 232 laboratory records from 36 geotechnical borehole identifiers: 73 Brazilian tensile tests, 68 uniaxial compression tests, 49 triaxial compression tests, and 42 direct shear tests. Four domains were defined: D1, beresite-altered granodiorites; D2, diorites; D3, granodiorites; and D4, lamprophyre dikes. The lowest mean uniaxial compressive strength occurred in D1 (91.75 ± 40.65 MPa), whereas D2 showed the highest mean value, although its small sample size precludes confirmation as a domain characteristic. D3 provided the most representative dataset and exhibited intra-domain variability, while D4 showed the greatest variability in Young’s modulus (CV = 82.21%). Mean apparent cohesion along natural discontinuities was 0.125 ± 0.039 MPa for D1 and 0.140 ± 0.083 MPa for D3; D2 and D4 remain preliminary. GSI values of 48–58 were used only in scenario-based Hoek–Brown calculations. A ±5-point change in GSI altered equivalent rock mass strength by approximately −25% to −26% and +33% to +34%. The results support domain-based parameterization but require in situ verification.
1. Introduction
The physical and mechanical properties of intact rock provide the fundamental input for the geomechanical characterization of mineral deposits. In ore deposits affected by lithological, metasomatic, and structural heterogeneity, however, a single mean value of strength or deformability may obscure mechanically contrasting intervals and lead to oversimplified parameter selection. Domain-based grouping offers a practical means of preserving geologically controlled contrasts while treating each domain as a distinct, although internally heterogeneous, statistical population [1,2,3]. This approach is particularly important where alteration zones, intrusive contacts, and dike bodies produce sharp local changes in rock behavior.
A clear distinction must be maintained between intact rock and the rock mass. Intact rock refers to the material represented by a laboratory specimen without visible macroscopic discontinuities, whereas a rock mass contains joint sets, lithological contacts, alteration zones, and block structures. Consequently, laboratory-derived values of uniaxial compressive strength (UCS), Brazilian tensile strength (BTS), and Young’s modulus are not direct rock mass parameters. Their engineering interpretation may involve empirical formulations, including the generalized Hoek–Brown failure criterion [4,5,6,7]. Nevertheless, the extent to which laboratory properties can be scaled to the rock mass level remains model-dependent and is strongly influenced by the quality of the structural and classification data used as input.
The Geological Strength Index (GSI) is a semi-quantitative descriptor of rock mass blockiness and discontinuity surface conditions rather than a directly measured strength parameter. Reproducible GSI assignment requires documented field observations, scaled photographs of core or rock exposures, and systematic evaluation of discontinuity conditions [4,5]. However, published applications differ in the degree to which GSI is treated either as a reproducible classification parameter or as an expert estimate. This distinction is important because uncertainty in GSI may substantially affect the calculated Hoek–Brown parameters. In the present study, GSI was not independently reassessed. The values were adopted from a technical report, whereas the primary classification sheets and the complete structural dataset were unavailable in the accessible archive. The resulting Hoek–Brown parameters are therefore interpreted strictly as scenario-based estimates rather than independently verified in situ properties.
The response of an underground excavation is governed not only by rock material properties but also by the in situ stress state, mining depth, excavation geometry and orientation, and the spatial arrangement of discontinuities [7,8,9]. Laboratory characterization is therefore essential for geomechanical parameterization, but it cannot independently demonstrate the stability of a particular excavation in the absence of site-specific stress data, structural mapping, support information, and monitoring. This distinction is especially important in heterogeneous hard-rock deposits, where structurally controlled weakening may dominate over the strength of intact specimens.
Traceability between a tested specimen and its geological context is established through geotechnical drilling and systematic core logging. Domain-based interpretation requires preservation of the core sequence, reliable depth control, differentiation between natural and drilling-induced fractures, documentation of lithological contacts, and transparent allocation of specimens among boreholes and test types [10,11,12]. Such traceability is necessary to determine whether the observed variability reflects domain-scale behavior or specimen-specific characteristics. Without this linkage, laboratory variability may be incorrectly attributed to lithology alone.
Natural discontinuities constitute a separate object of mechanical investigation. Their shear resistance depends on normal stress, roughness, infill, wall condition, weathering or alteration, and displacement history; direct shear parameters must therefore not be conflated with failure parameters derived for intact rock [13,14]. A continuing methodological issue concerns whether a small number of tested surfaces can adequately represent an entire structural domain. Because each discontinuity surface may exhibit a unique morphology and condition, results based on limited numbers of independent specimens should be treated as preliminary rather than as validated domain parameters.
Methodological comparability can be improved through standardized core preparation and testing under uniaxial compression, indirect tension, triaxial compression, and direct shear [15,16,17,18]. Standardized procedures, however, do not eliminate natural heterogeneity. Accordingly, results should be reported together with sample size, individual observations, mean values, standard deviations, coefficients of variation, and ranges. Potentially extreme observations should not be excluded solely because they differ from the main population; exclusion is justified only where a documented preparation, geometry, or testing error is identified.
Computed tomography studies of granite have shown that microcrack development and changes in internal texture can substantially influence the macroscopic strength of externally similar specimens [19,20,21]. Although the thermal damage mechanisms investigated in those studies differ from the natural metasomatic alteration at Deposit X, they demonstrate that internal rock condition may exert a strong control on measured mechanical behavior. This supports the need to interpret laboratory results jointly with lithological, textural, and alteration-related information rather than on the basis of bulk lithology alone.
The present study addresses three working hypotheses. First, subdivision into lithological–metasomatic domains is expected to reveal mechanically meaningful differences that would be obscured by a single pooled dataset. Second, intact rock properties and the shear resistance of natural discontinuities are expected to represent distinct mechanical levels and therefore require separate interpretation. Third, conditional upscaling using the Hoek–Brown criterion is expected to be highly sensitive to the adopted GSI values and should therefore be presented as a scenario-based rather than deterministic assessment.
The contribution of this study lies not in introducing a new testing method, but in organizing a unified experimental database by geomechanical domain and consistently distinguishing three levels of interpretation: intact rock properties, shear resistance along natural discontinuities, and conditionally calculated rock mass parameters. Four domains were considered: D1, beresite-altered granodiorites; D2, diorites; D3, granodiorites; and D4, lamprophyre dikes. The objective was to provide a domain-based laboratory characterization of the physical, strength, and deformation properties of intact rocks and the shear-resistance parameters of natural discontinuities at Deposit X, and to present a transparent scenario-based interpretation of rock mass parameters. The results show substantial intra-domain variability, limited statistical reliability for some poorly represented domains, and pronounced sensitivity of equivalent rock mass strength to GSI, thereby supporting domain-based parameterization while demonstrating the need for subsequent structural and in situ verification.
2. Materials and Methods
2.1. Overall Study Framework
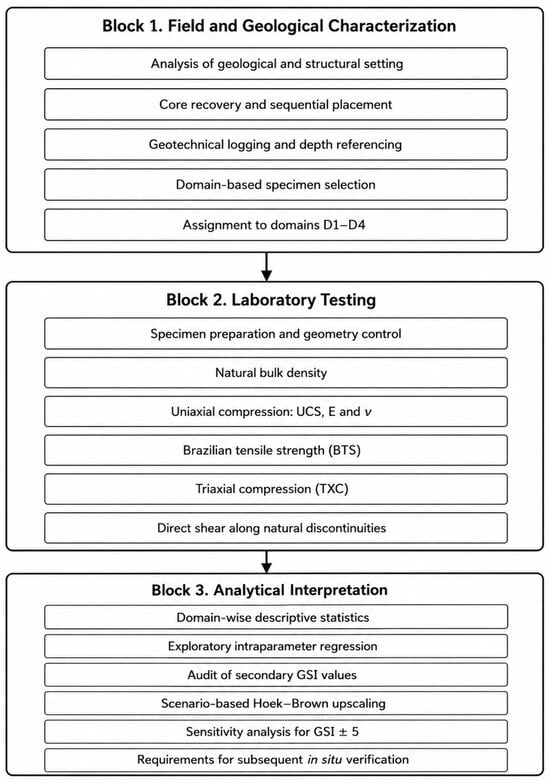
The methodology was organized into three interrelated blocks. Block 1 comprised analysis of the geological setting, core recovery and sequential placement, geotechnical logging, and domain-based selection of representative specimens. Block 2 included standardized laboratory procedures: preparation of specimens with regular geometry, determination of natural bulk density, uniaxial compression with measurement of E and ν, Brazilian tensile testing, triaxial compression, and direct shear along natural discontinuities. Block 3 comprised statistical processing, audit of the adopted GSI values, scenario-based upscaling using the Hoek–Brown criterion, and definition of requirements for subsequent in situ verification.
In this study, the term “intact rock” is used exclusively for laboratory specimens without visible macroscopic discontinuities, whereas “rock mass” refers to the in situ geological medium. This distinction enables separate interpretation of directly measured specimen properties, the resistance of natural discontinuities, and model-dependent rock mass parameters.
The sequence of the study stages is shown in Figure 1. Direct laboratory measurements are separated from conditional calculation stages. The GSI audit and upscaling to rock mass parameters are indicated by a dashed boundary because their reliability depends on the completeness of structural characterization and is not equivalent to experimental determination of specimen properties.
Figure 1.
Three-block workflow for the field, laboratory, and analytical stages of domain-based geomechanical characterization.
The workflow provides traceability from the depth interval and lithological domain to the specific test method. Separation of the stages prevents conflation of intact rock properties, natural discontinuity resistance, and calculated rock mass characteristics: geological identification precedes laboratory testing, and conditional upscaling is undertaken only after auditing the experimental database.
2.2. Geological and Structural Setting of the Study Area
For confidentiality, the study site is designated Deposit X. The geological description was compiled from archived documentation, core-logging records, and a technical report on physical and mechanical testing [22]. The ore field is hosted by an elongated intrusive block approximately 3.6 km long and 1.0 km wide and is affected by deep-seated faults, dike bodies, and hydrothermal–metasomatic alteration zones.
The host rocks consist predominantly of diorites and granodiorites. Part of the granodiorite sequence is beresite-altered, with associated modification of mineral composition and textural–structural attributes. Lamprophyre dikes cross-cut the diorite–granodiorite host and create pronounced lithological and mechanical contrasts.
The dominant structural features strike east–west to west–northwest. Moderately inclined structures generally dip at 40–50°, whereas steeply dipping discontinuities dip at 60–80°. Natural joints, dike contacts, and boundaries of metasomatically altered rocks were treated as potential planes of weakness.
Geomechanical domains were defined using lithology, degree of hydrothermal–metasomatic alteration, structural setting, and visually documented fracture characteristics. Four domains were identified: D1, beresite-altered granodiorites; D2, diorites; D3, granodiorites; and D4, lamprophyre dikes.
Mining depth, excavation geometry, the in situ stress field, and support parameters were not available at a level sufficient for a verified stability assessment. These variables were therefore not incorporated into the calculations and are explicitly recognized as study limitations.
2.3. Domain-Based Specimen Selection
On the basis of geotechnical logging, specimens were selected separately for D1–D4 and linked to the borehole identifier, depth interval, and lithology. Intact rock tests used preserved intervals without visible natural discontinuities, pronounced drilling damage, or ambiguous contacts. In contrast, direct shear specimens contained an identifiable natural discontinuity.
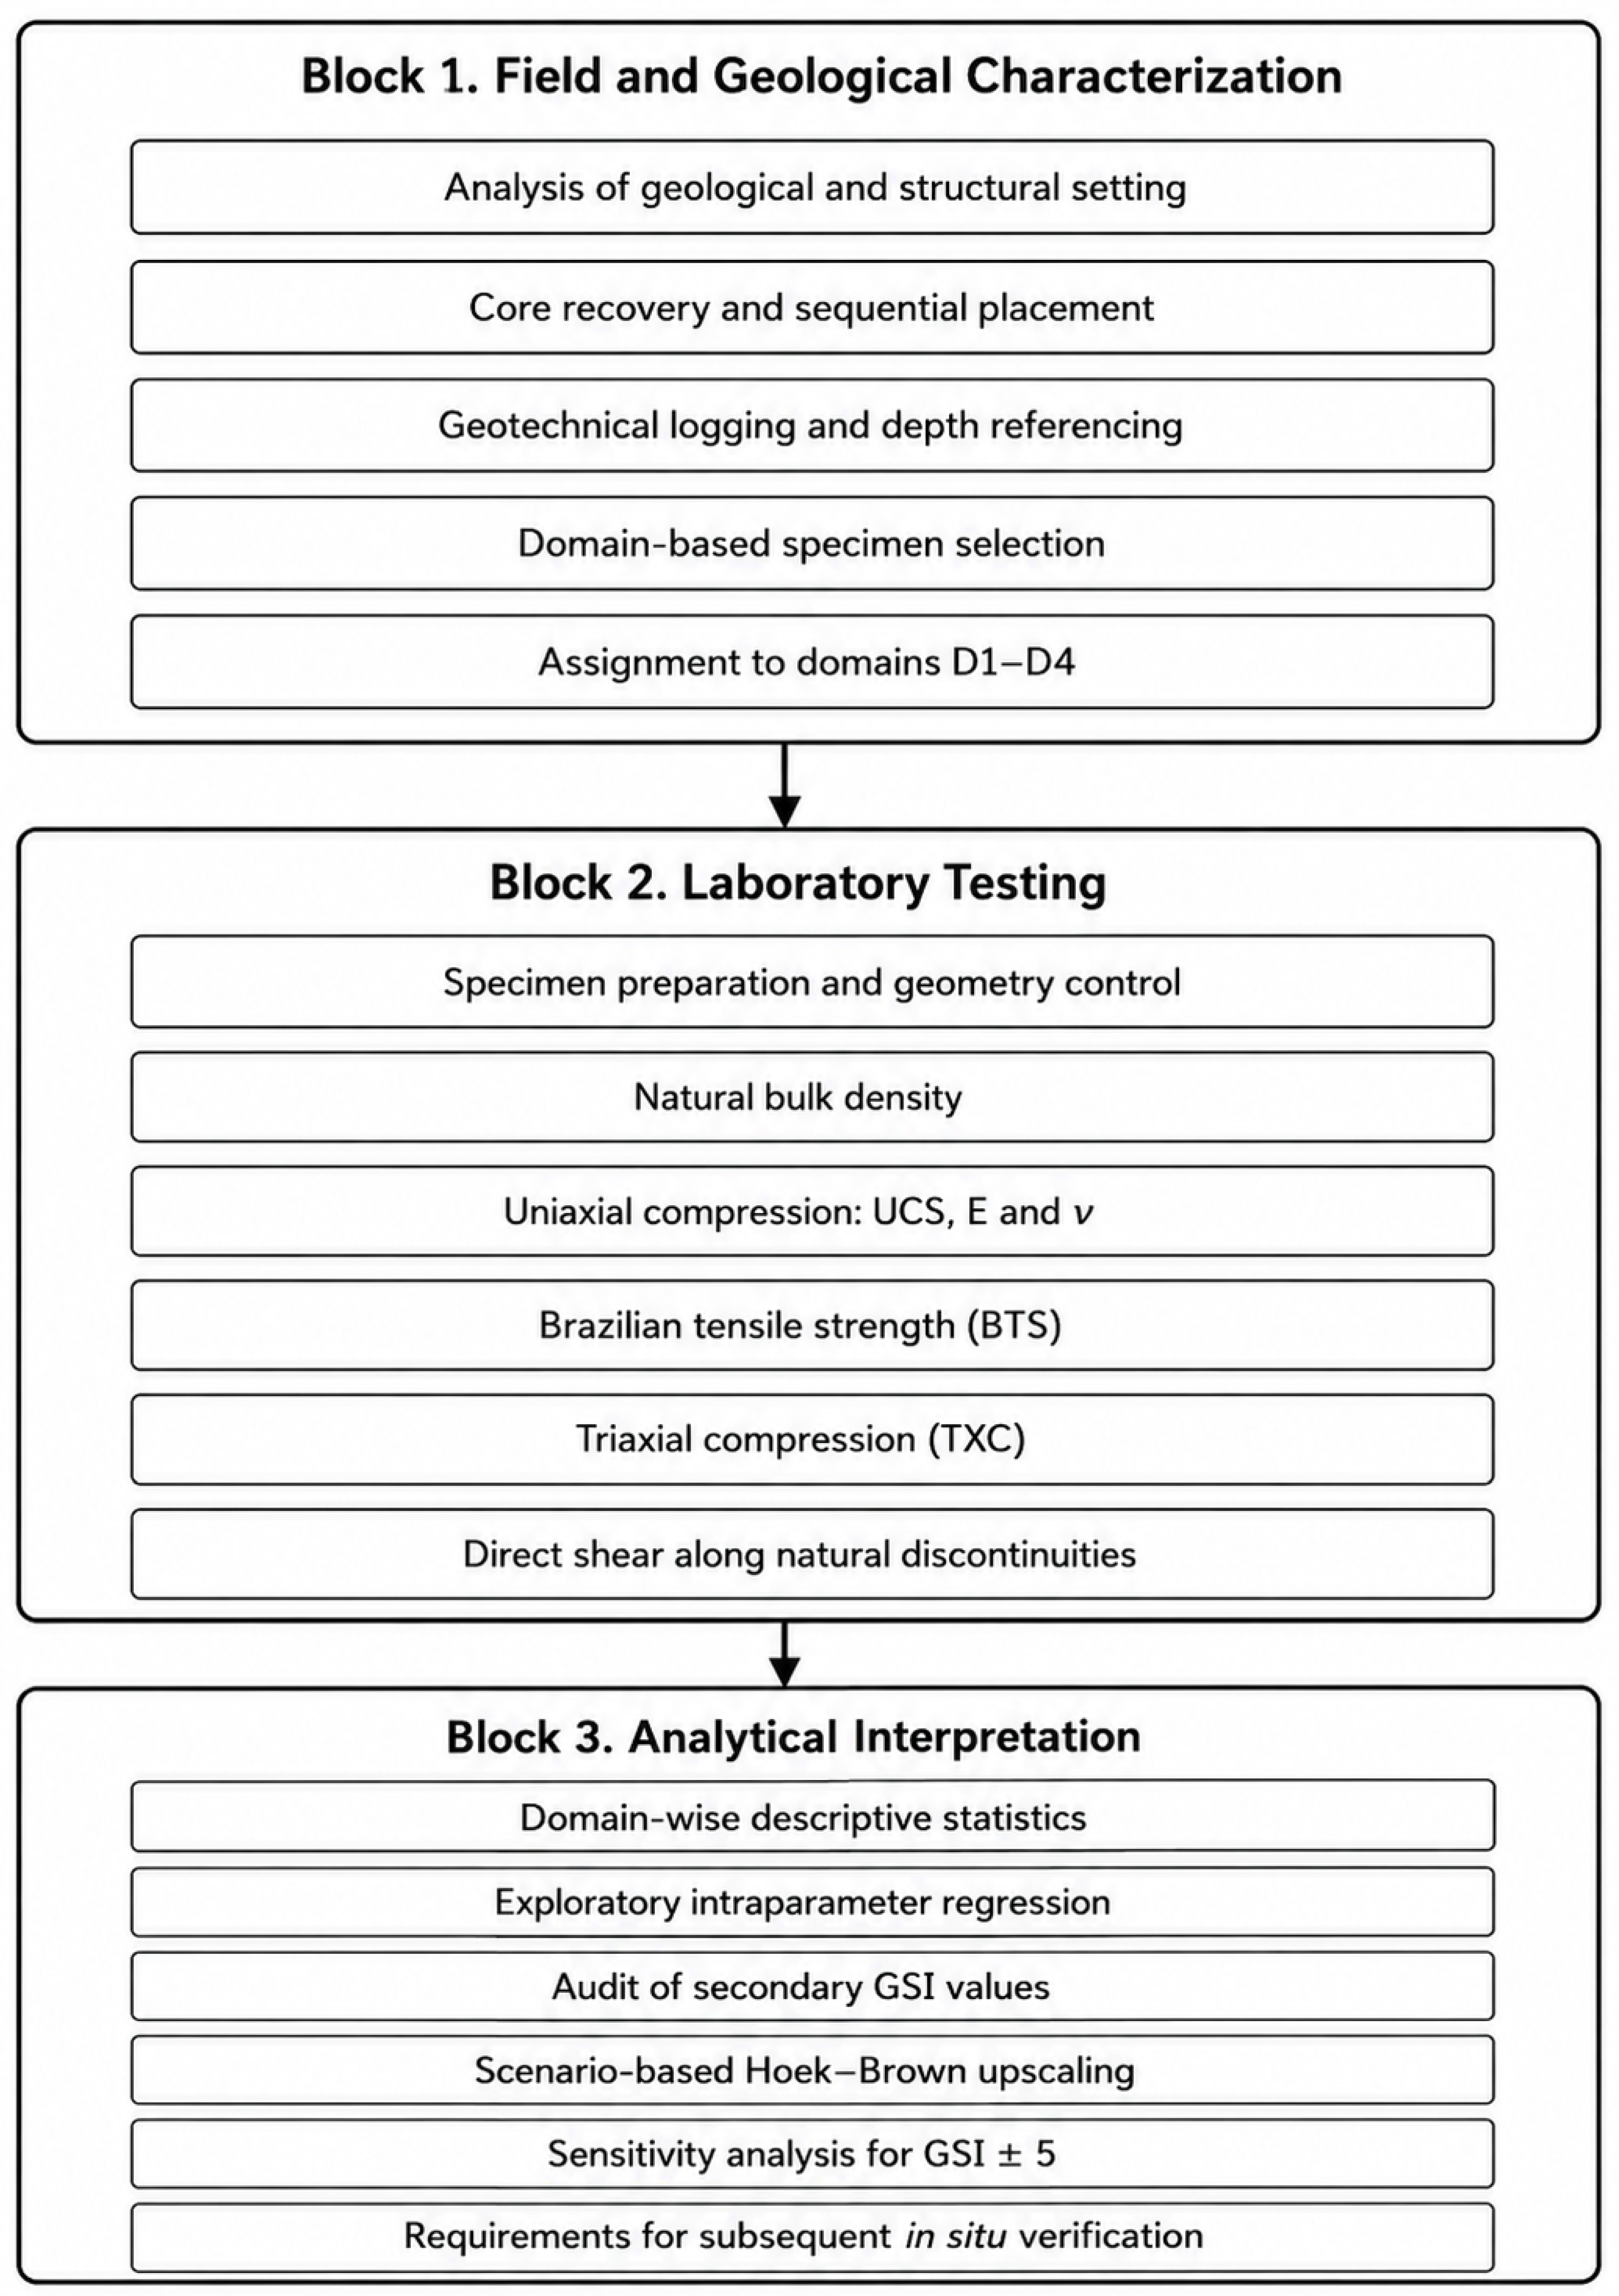
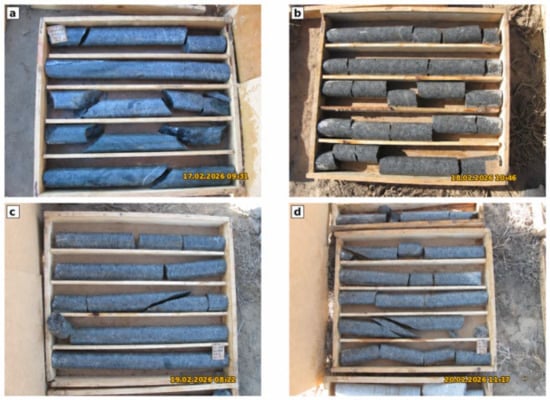
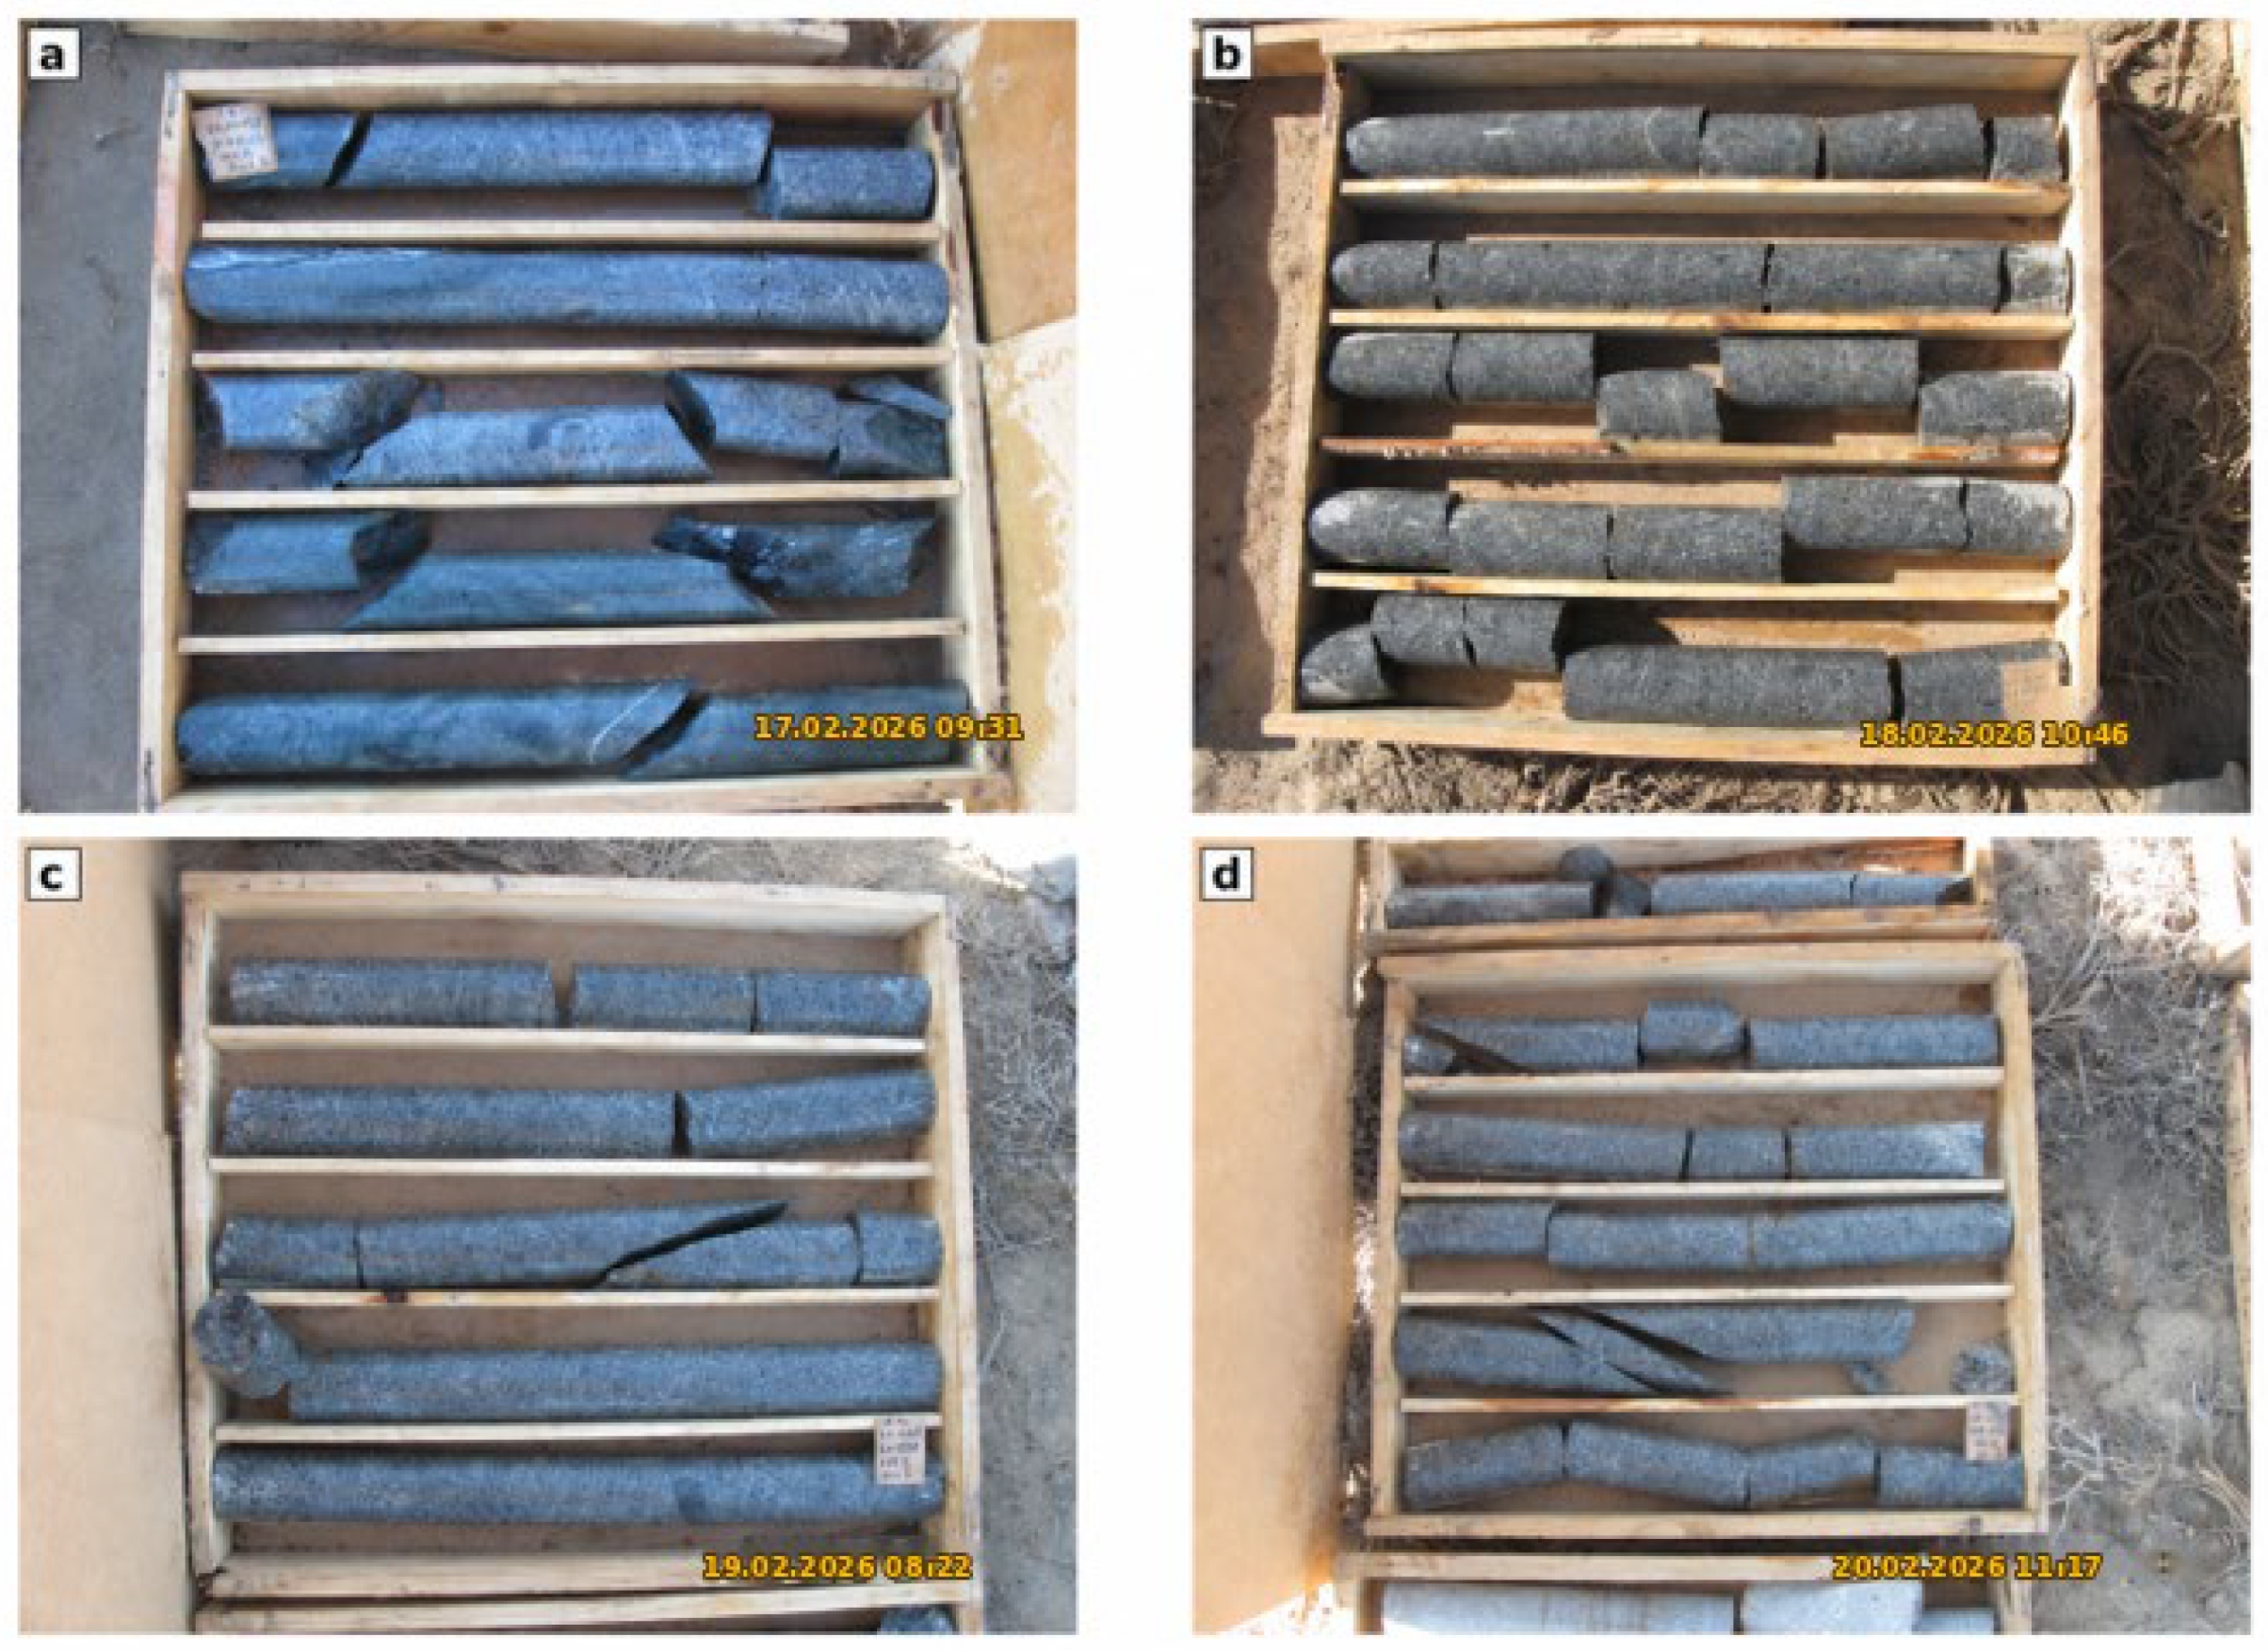
Core photographs were used to verify core sequence and identify sampling intervals. Representative core conditions are shown in Figure 2. Domain assignment was based on the geological logs and depth reference rather than on photographic appearance alone.
Figure 2.
Representative geotechnical core conditions: (a) relatively intact core with isolated breaks; (b) moderately fragmented core; (c,d) core containing inclined natural discontinuities.
The photographs illustrate differences in preserved fragment length and discontinuity geometry. Because visually similar intervals may exhibit different mechanical behavior, final specimen selection was based on the combined consideration of lithological description, depth position, and specimen condition.
The laboratory program is summarized in Table 1. During data auditing, four rows corresponding to mean UCS values at σ3 = 0 were identified as calculated values rather than independent triaxial tests. After their removal, the actual number of triaxial specimens was 49.
Table 1.
Laboratory testing program.
The distribution of specimens among domains was unbalanced: D3 was substantially better represented than D2 and D4. This imbalance was considered when selecting statistical descriptors and formulating the conclusions.
2.4. Laboratory Testing Program and Data Interpretation
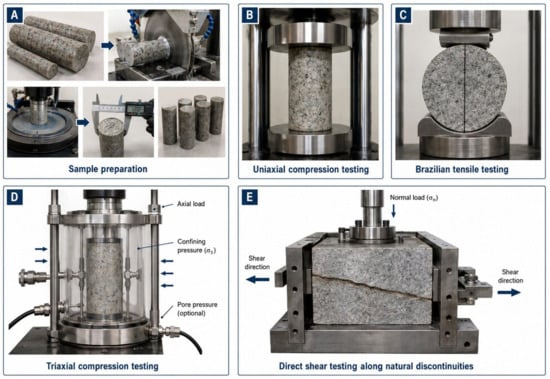
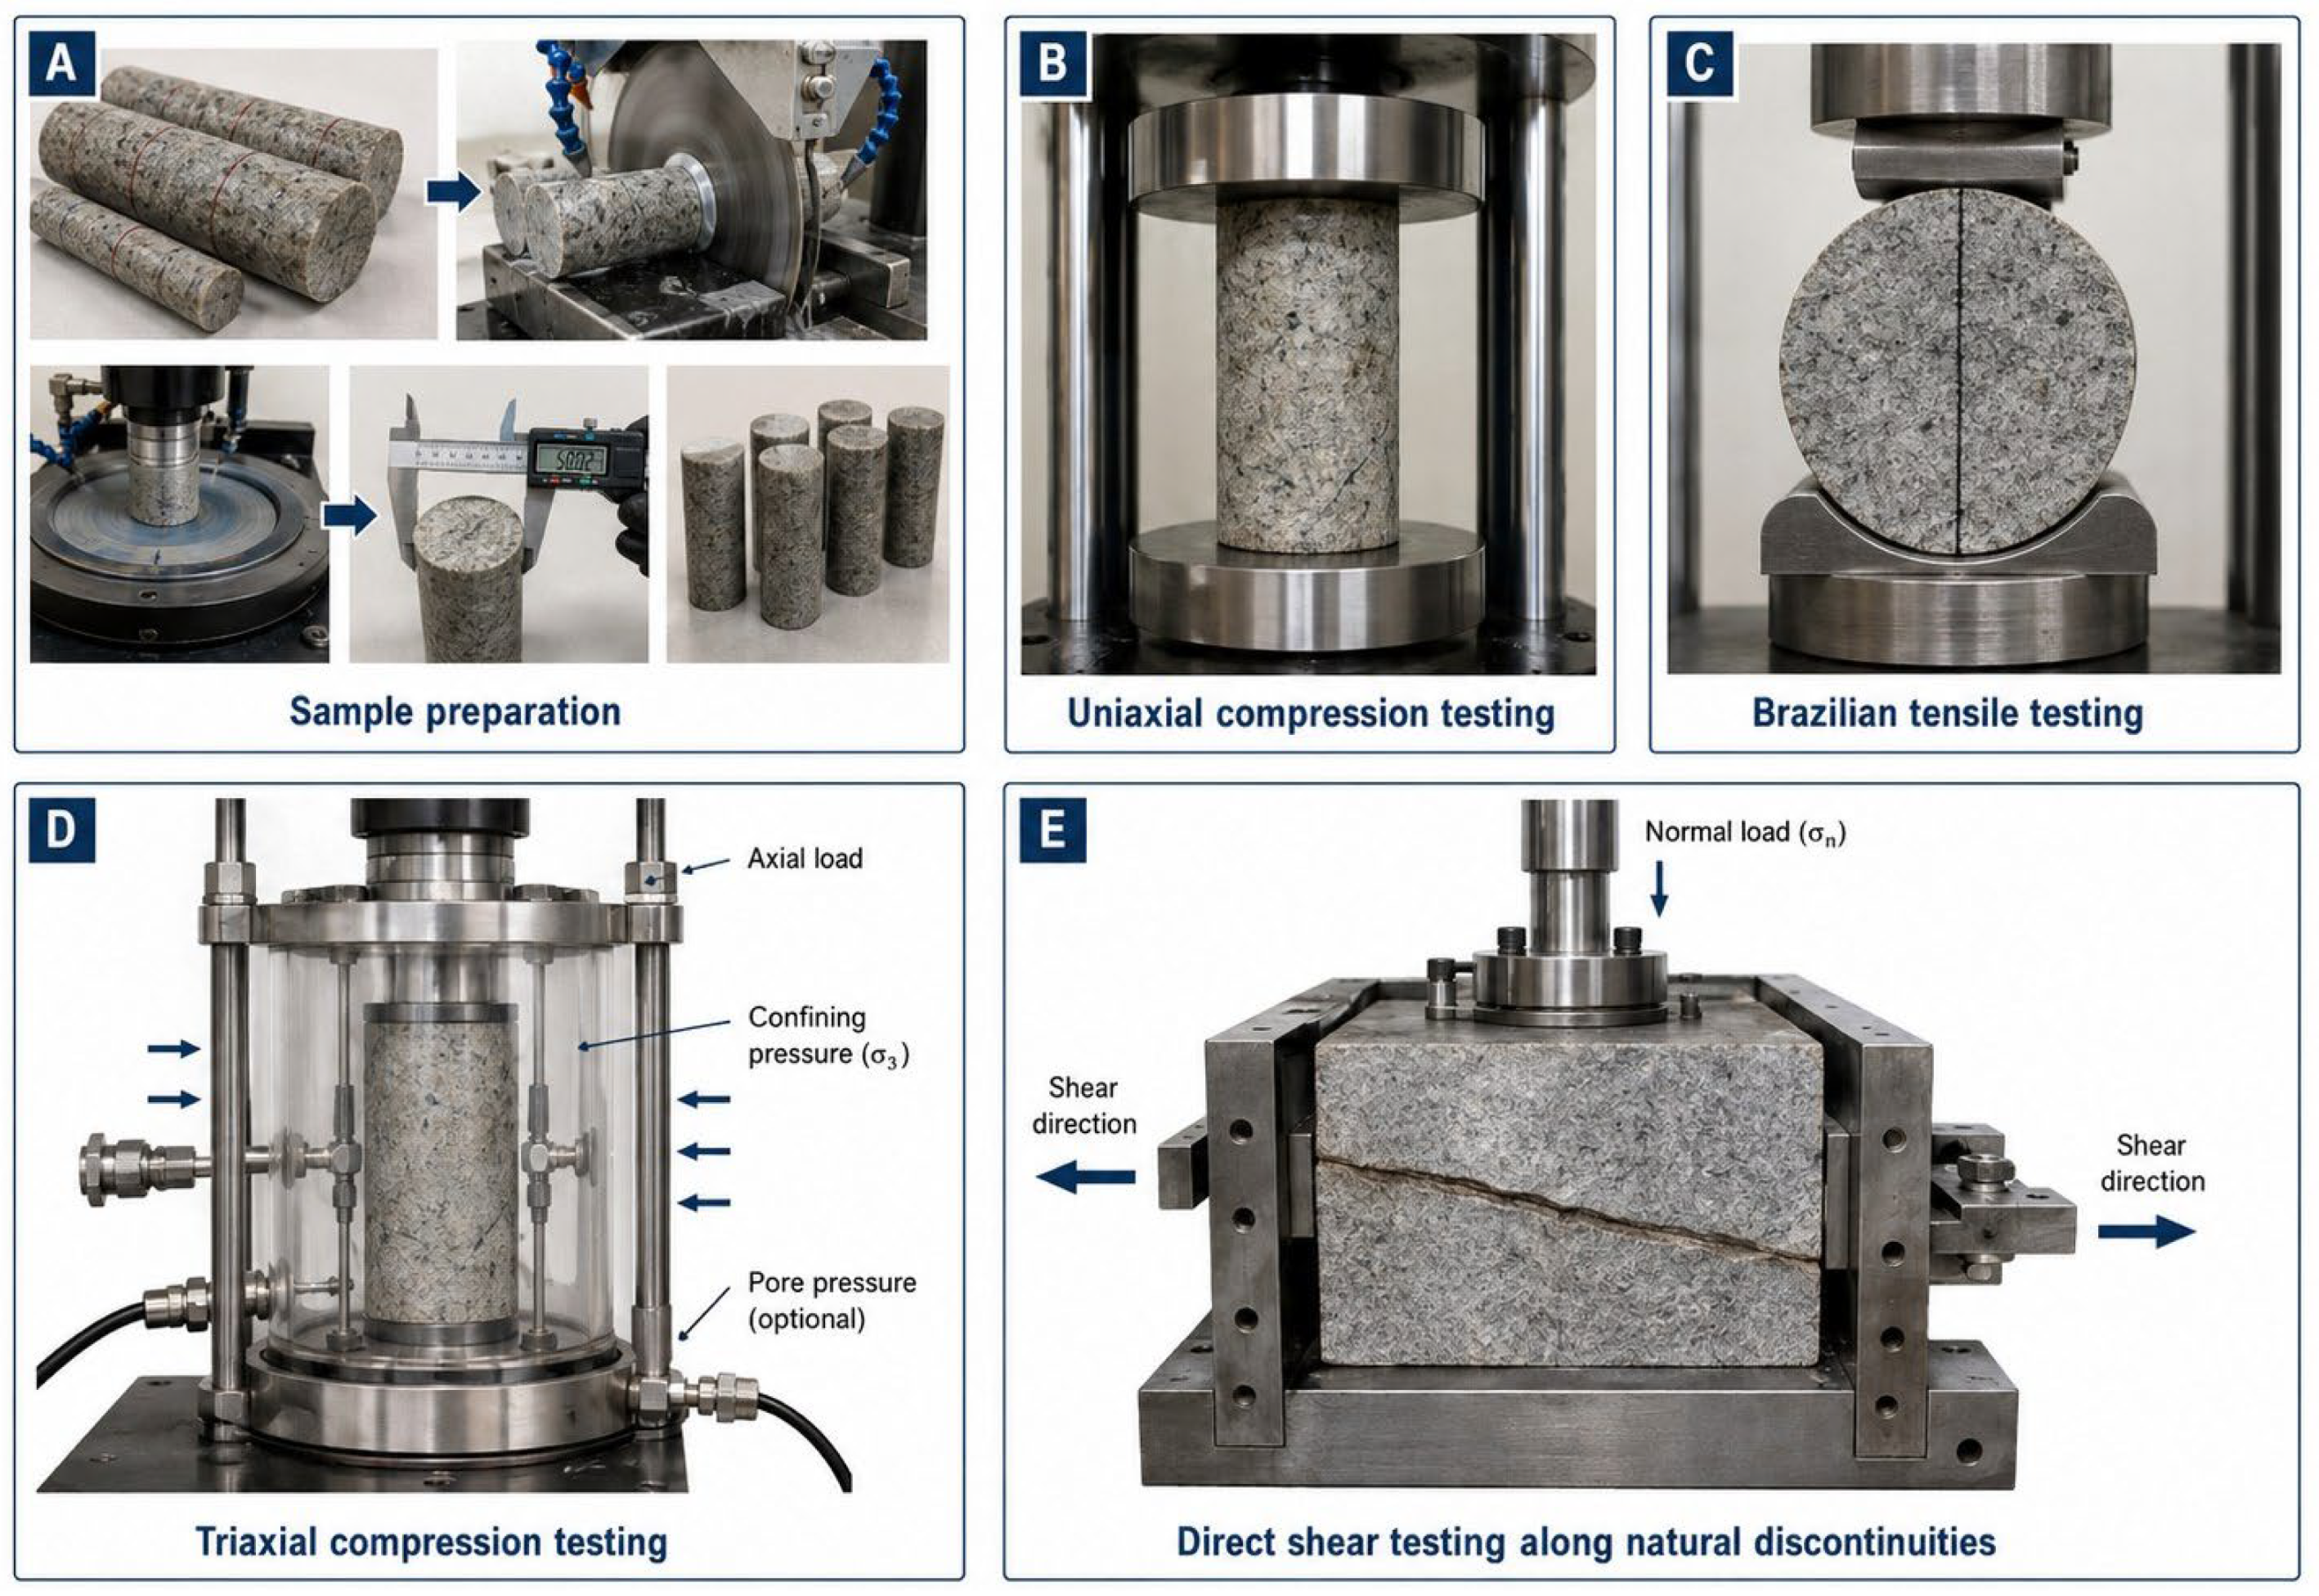
The laboratory program comprised specimen preparation, determination of natural bulk density, uniaxial compression, Brazilian tensile testing, triaxial compression, and direct shear. The methodological distinction among these test types is illustrated schematically in Figure 3.
Figure 3.
Schematic representation of the laboratory tests: (A) specimen preparation; (B) uniaxial compression; (C) Brazilian tensile test; (D) triaxial compression; (E) direct shear along a natural discontinuity.
The tests shown in Figure 3B–D characterize intact rock material, whereas the test in Figure 3E concerns a natural discontinuity. The corresponding parameter groups were analyzed separately and were not combined into a single experimental strength measure.
Cylindrical core specimens were prepared in accordance with ASTM D4543 [15]. The core was cut using a diamond saw, and the end surfaces were ground to satisfy requirements for flatness, parallelism, and perpendicularity to the longitudinal axis. Diameter was measured in three sections along two mutually perpendicular directions to an accuracy of 0.1 mm, and height was measured along several generators. Each specimen identifier retained its link to the borehole, depth interval, and domain.
The natural bulk density of regular cylindrical specimens was determined from mass and mean geometric dimensions following the technical report procedure [27]:
where ρ is natural bulk density (g/cm3), m is specimen mass (g), d is mean diameter (cm), and h is mean height (cm). All calculations were performed using consistent units.
Uniaxial compression tests were conducted on an MTS 816 servo-hydraulic system at natural moisture content in accordance with ISRM [24] recommendations and ASTM D7012 [16] and GOST 28985-91 [25]. Axial load and longitudinal and transverse strains were recorded to failure. Uniaxial compressive strength was calculated as:
where σc is uniaxial compressive strength (MPa), Pmax is the maximum axial load (N), and A0 is the initial cross-sectional area (mm2). Young’s modulus E and Poisson’s ratio ν were determined over a consistent linear portion of the stress–strain curve, generally up to 50% of peak strength. Longitudinal and transverse strain curves were inspected to verify linearity and identify possible opening of concealed defects.
For the Brazilian test, disk-shaped specimens were loaded diametrically between flat steel platens in accordance with ISRM recommendations [23] and ASTM D3967 [17]. Indirect tensile strength was calculated as:
where σt is indirect tensile strength (MPa), Pmax is the failure load (N), D is disk diameter (mm), and L is specimen thickness (mm). Only tests exhibiting a failure mode consistent with diametral splitting were included in the analysis.
Strength under confinement was determined at natural moisture content using the revised ISRM method for triaxial compression [18]. Tests were performed on an MTS 815 servo-hydraulic system. Each specimen was enclosed in a flexible jacket to prevent penetration of the confining fluid, and steel end platens were used to isolate the specimen ends.
Triaxial tests were conducted at confining pressures σ3 of 5, 10, and 20 MPa. At each level, the maximum principal stress σ1 at failure was recorded. Parameters of a linear Mohr–Coulomb envelope were obtained by least-squares fitting of σ1 = Aσ3 + B and transformed as follows:
The parameters ci and φi describe intact rock material over the investigated confinement range and are not equivalent to the parameters of natural discontinuities or the rock mass.
Direct shear tests were conducted on a GCTS RDS-200 servo-hydraulic system in accordance with the revised ISRM suggested method for laboratory determination of rock joint shear strength [13]. Composite specimens containing a natural discontinuity were embedded in steel holders using a cementitious material and mounted in the shear boxes.
Each surface was tested at normal stresses of 1, 3, and 5 MPa. Shear displacement was imposed at approximately 0.5 mm/min until shear resistance stabilized at each loading stage. Normal and shear loads and shear displacement were recorded continuously. Stresses and the parameters of the linear Mohr–Coulomb relationship were calculated as:
where and are the normal and shear forces, respectively; A is the current overlap area of the mating surfaces; is apparent cohesion; and is the friction angle of the natural discontinuity. Parameters were derived from stabilized shear-resistance values at each stage. They therefore represent the multistage response of a particular surface rather than independent specimens tested at each level.
Following interpretation of the laboratory data, a conditional scheme for upscaling specimen properties to rock mass parameters was examined using inputs adopted from the technical report [27]. The report assigned GSI values of 58, 55, 56, and 48 to D1–D4, respectively, stating that they were derived from borehole data. However, the accessible archive did not contain the original classification sheets, structural measurement map, discontinuity orientations, interval-specific RQD values, or separate assessments of discontinuity surface conditions. The GSI source was therefore classified as expert–empirical rather than as an independently reproducible field determination.
The generalized Hoek–Brown failure criterion is expressed as:
where σ1 is the major principal stress at failure, σ3 is the confining pressure, σci is the uniaxial compressive strength of the intact rock, and mb, s, and a are the Hoek–Brown rock mass constants derived from the intact rock constant mi, the Geological Strength Index (GSI), and the disturbance factor D.
To express structural weakening consistently, two complementary indices were used:
where is the retained fraction of equivalent rock mass strength, is the calculated reduction, and σ_cm is the equivalent rock mass UCS. For each domain, + = 100%. A sensitivity analysis was also performed by varying GSI by ±5 points, treated as a scenario range of expert uncertainty in the absence of primary classification sheets. Barton–Bandis parameters for the fractured rock mass [14] were likewise interpreted as secondary equivalent values.
Statistical processing was performed separately for each domain and test type. For samples with n ≥ 2, the mean, standard deviation, median, range, and coefficient of variation (CV = SD/mean × 100%) were calculated. Individual observations were retained unless the test records documented a valid exclusion criterion related to specimen preparation, geometric nonconformity, or equipment malfunction. Interparameter relationships were explored using linear regression and reported using R2. Because the domain samples were unbalanced, these relationships were interpreted as exploratory rather than predictive models.
3. Results
The results are based on laboratory tests of geotechnical core from Deposit X; data from other sites were not incorporated into the principal dataset. Audit of the source database showed that four rows in the triaxial test table represented mean UCS values at σ3 = 0 rather than independent specimens. After exclusion of these calculated rows, the database comprised 232 laboratory records, including 49 actual triaxial tests.
3.1. Geomechanical Domains and Experimental Dataset Structure
Laboratory results were grouped into four geomechanical domains, D1–D4. The database was linked to 36 unique geotechnical borehole identifiers. Because a single identifier could include more than one lithological domain, the numbers of boreholes assigned to individual domains are not additive (Table 2).
Table 2.
Distribution of laboratory tests among geomechanical domains.
D3 provided the most representative dataset, with 181 tests, or approximately 78% of all records. Descriptive statistics for the granodiorites, therefore, have the strongest experimental support. D1 was represented by 25 tests, D4 by 16, and D2 by 10. This imbalance—particularly the small numbers of UCS, TXC, and direct shear tests for D2 and D4—was explicitly considered when interpreting mean values and intra-domain variability.
3.2. Variability of Intact-Rock Properties and Interparameter Relationships
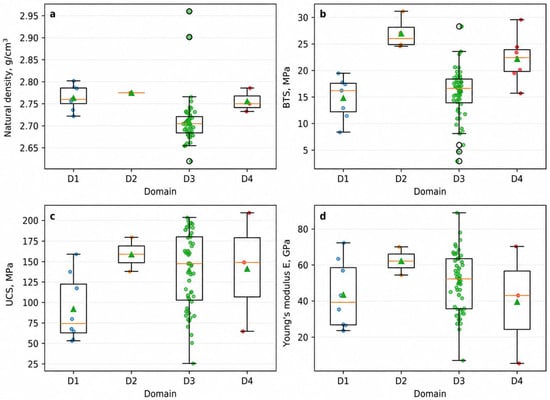
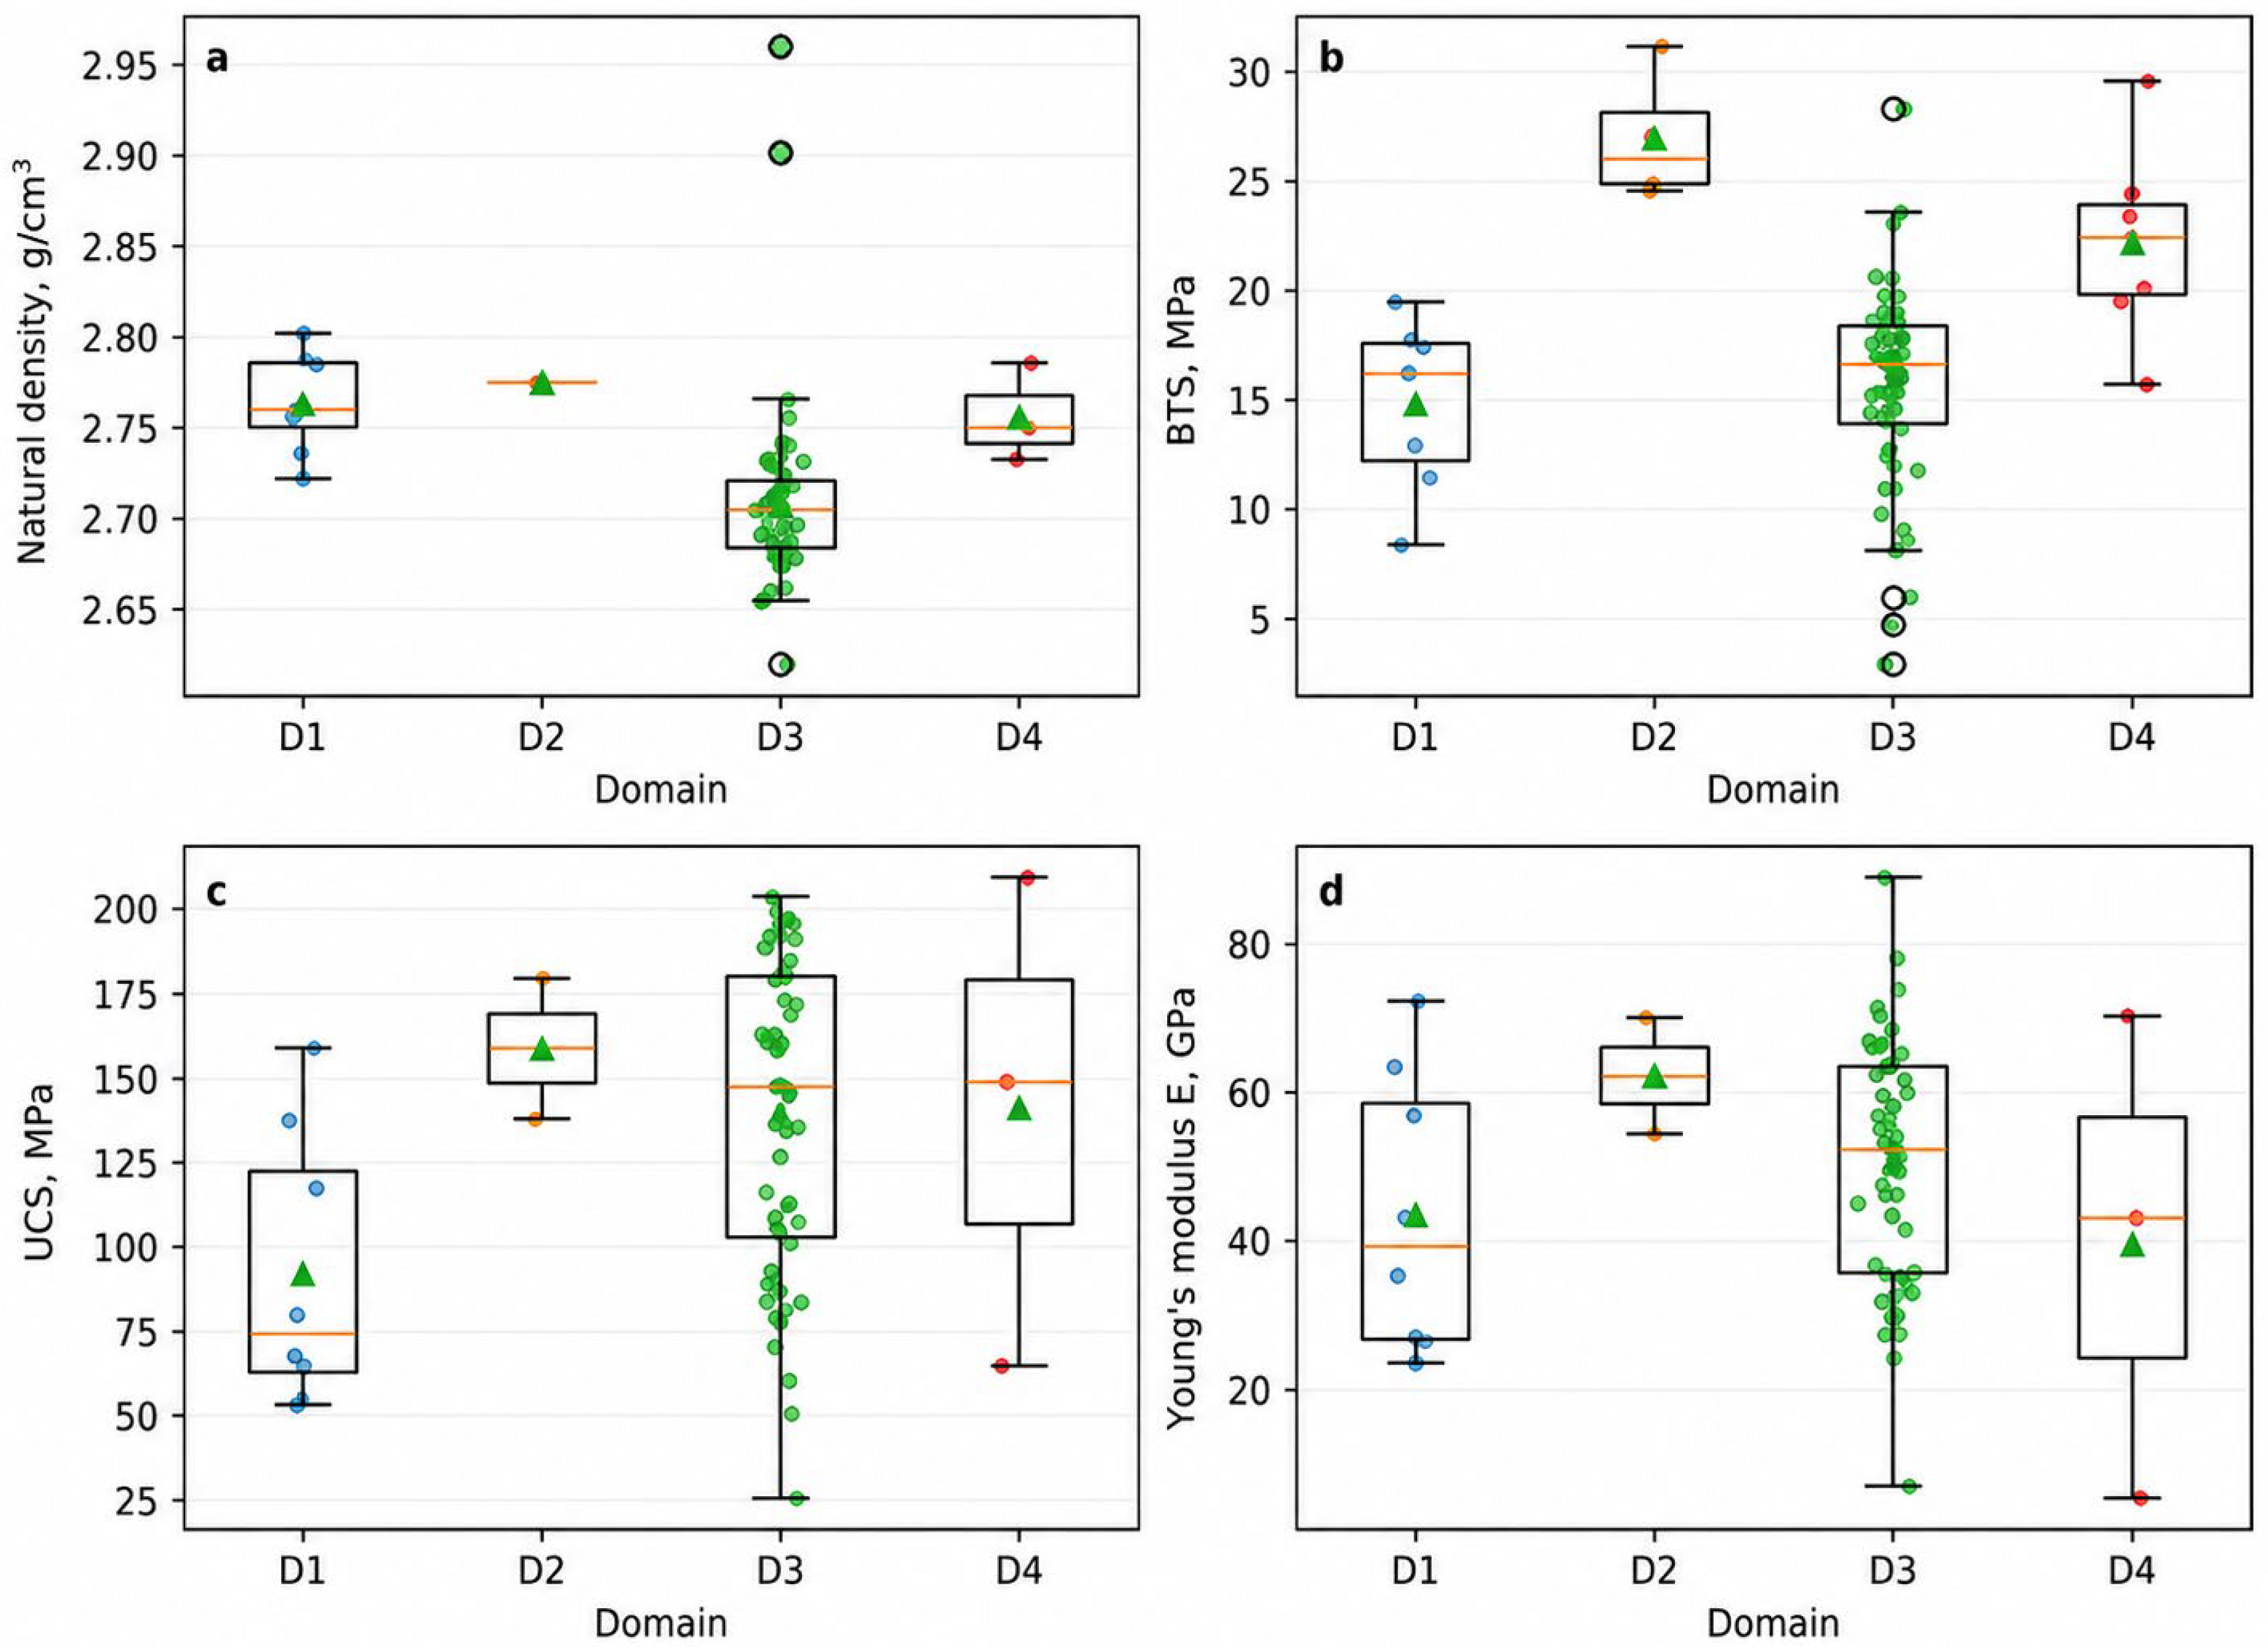
Distributions of natural bulk density, indirect tensile strength, uniaxial compressive strength, and Young’s modulus across the geomechanical domains are presented in Figure 4. The box plots reveal pronounced intra-domain variability and partial overlap among domains. Lithology alone, therefore, does not provide an unambiguous prediction of the mechanical properties of an individual specimen and must be considered together with structural, textural, and mineralogical–petrographic characteristics.
Figure 4.
Distribution of intact rock properties by geomechanical domain: (a) natural bulk density; (b) BTS; (c) UCS; (d) Young’s modulus. Green circles indicate individual test results, orange triangles indicate mean values, boxes represent interquartile ranges, central horizontal lines indicate medians, and whiskers show the data range.
Figure 4 presents individual test results, medians, interquartile ranges, and overall ranges for the physical, strength, and deformation properties of D1–D4. This format enables simultaneous assessment of both inter-domain contrasts and variability within each domain.
The lowest natural bulk density values occurred in D3 granodiorites. D1, D2, and D4 had similar mean densities, predominantly within 2.75–2.78 g/cm3. Inter-domain differences in density were substantially less pronounced than those in strength and deformation properties, indicating that density alone has limited value as a predictor of mechanical response.
The Brazilian tests yielded the highest BTS values for D2, whereas D1 and D3 displayed lower mean values. D3 also exhibited the broadest range, reflecting marked heterogeneity in the tensile resistance of the granodiorites. The elevated D2 values must be interpreted cautiously because of the limited sample size.
UCS distributions likewise showed substantial variability. The lowest mean UCS occurred in D1 beresite-altered granodiorites, whereas higher values were obtained for D2, D3, and D4. The broadest spreads occurred in D3 and D4, demonstrating pronounced intra-domain strength heterogeneity and limiting the representativeness of a single mean value.
Young’s modulus distributions are shown in Figure 4d. D2 had the highest mean stiffness, whereas D1, D3, and D4 exhibited broad ranges. Variability was particularly high in D4, where the difference between minimum and maximum E values was greatest, potentially reflecting heterogeneity in the composition and internal condition of the tested lamprophyre specimens.
Overall, the box plots show substantial overlap in UCS and Young’s modulus among domains. Lithology is therefore an important but not exclusive control on rock material behavior. Hydrothermal–metasomatic alteration, mineral composition, microcracking, textural–structural characteristics, and local specimen defects may also contribute. Subsequent engineering parameterization should thus consider medians, ranges, and intra-domain distributions in addition to mean values.
D2 had the highest mean UCS, and D1 the lowest. Nevertheless, the D2 result remains uncertain because of the small sample size. D3 combined the broadest strength and deformation ranges with the greatest statistical representation, while D4 displayed particularly high variability in Young’s modulus.
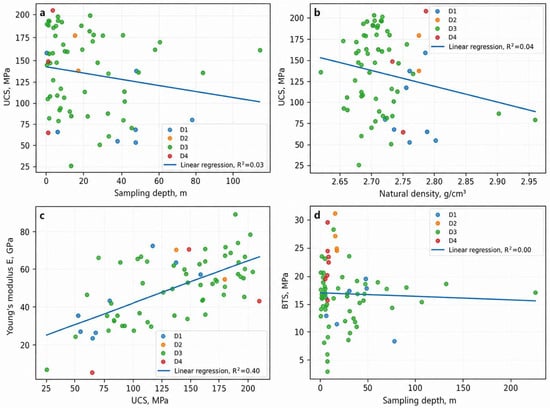
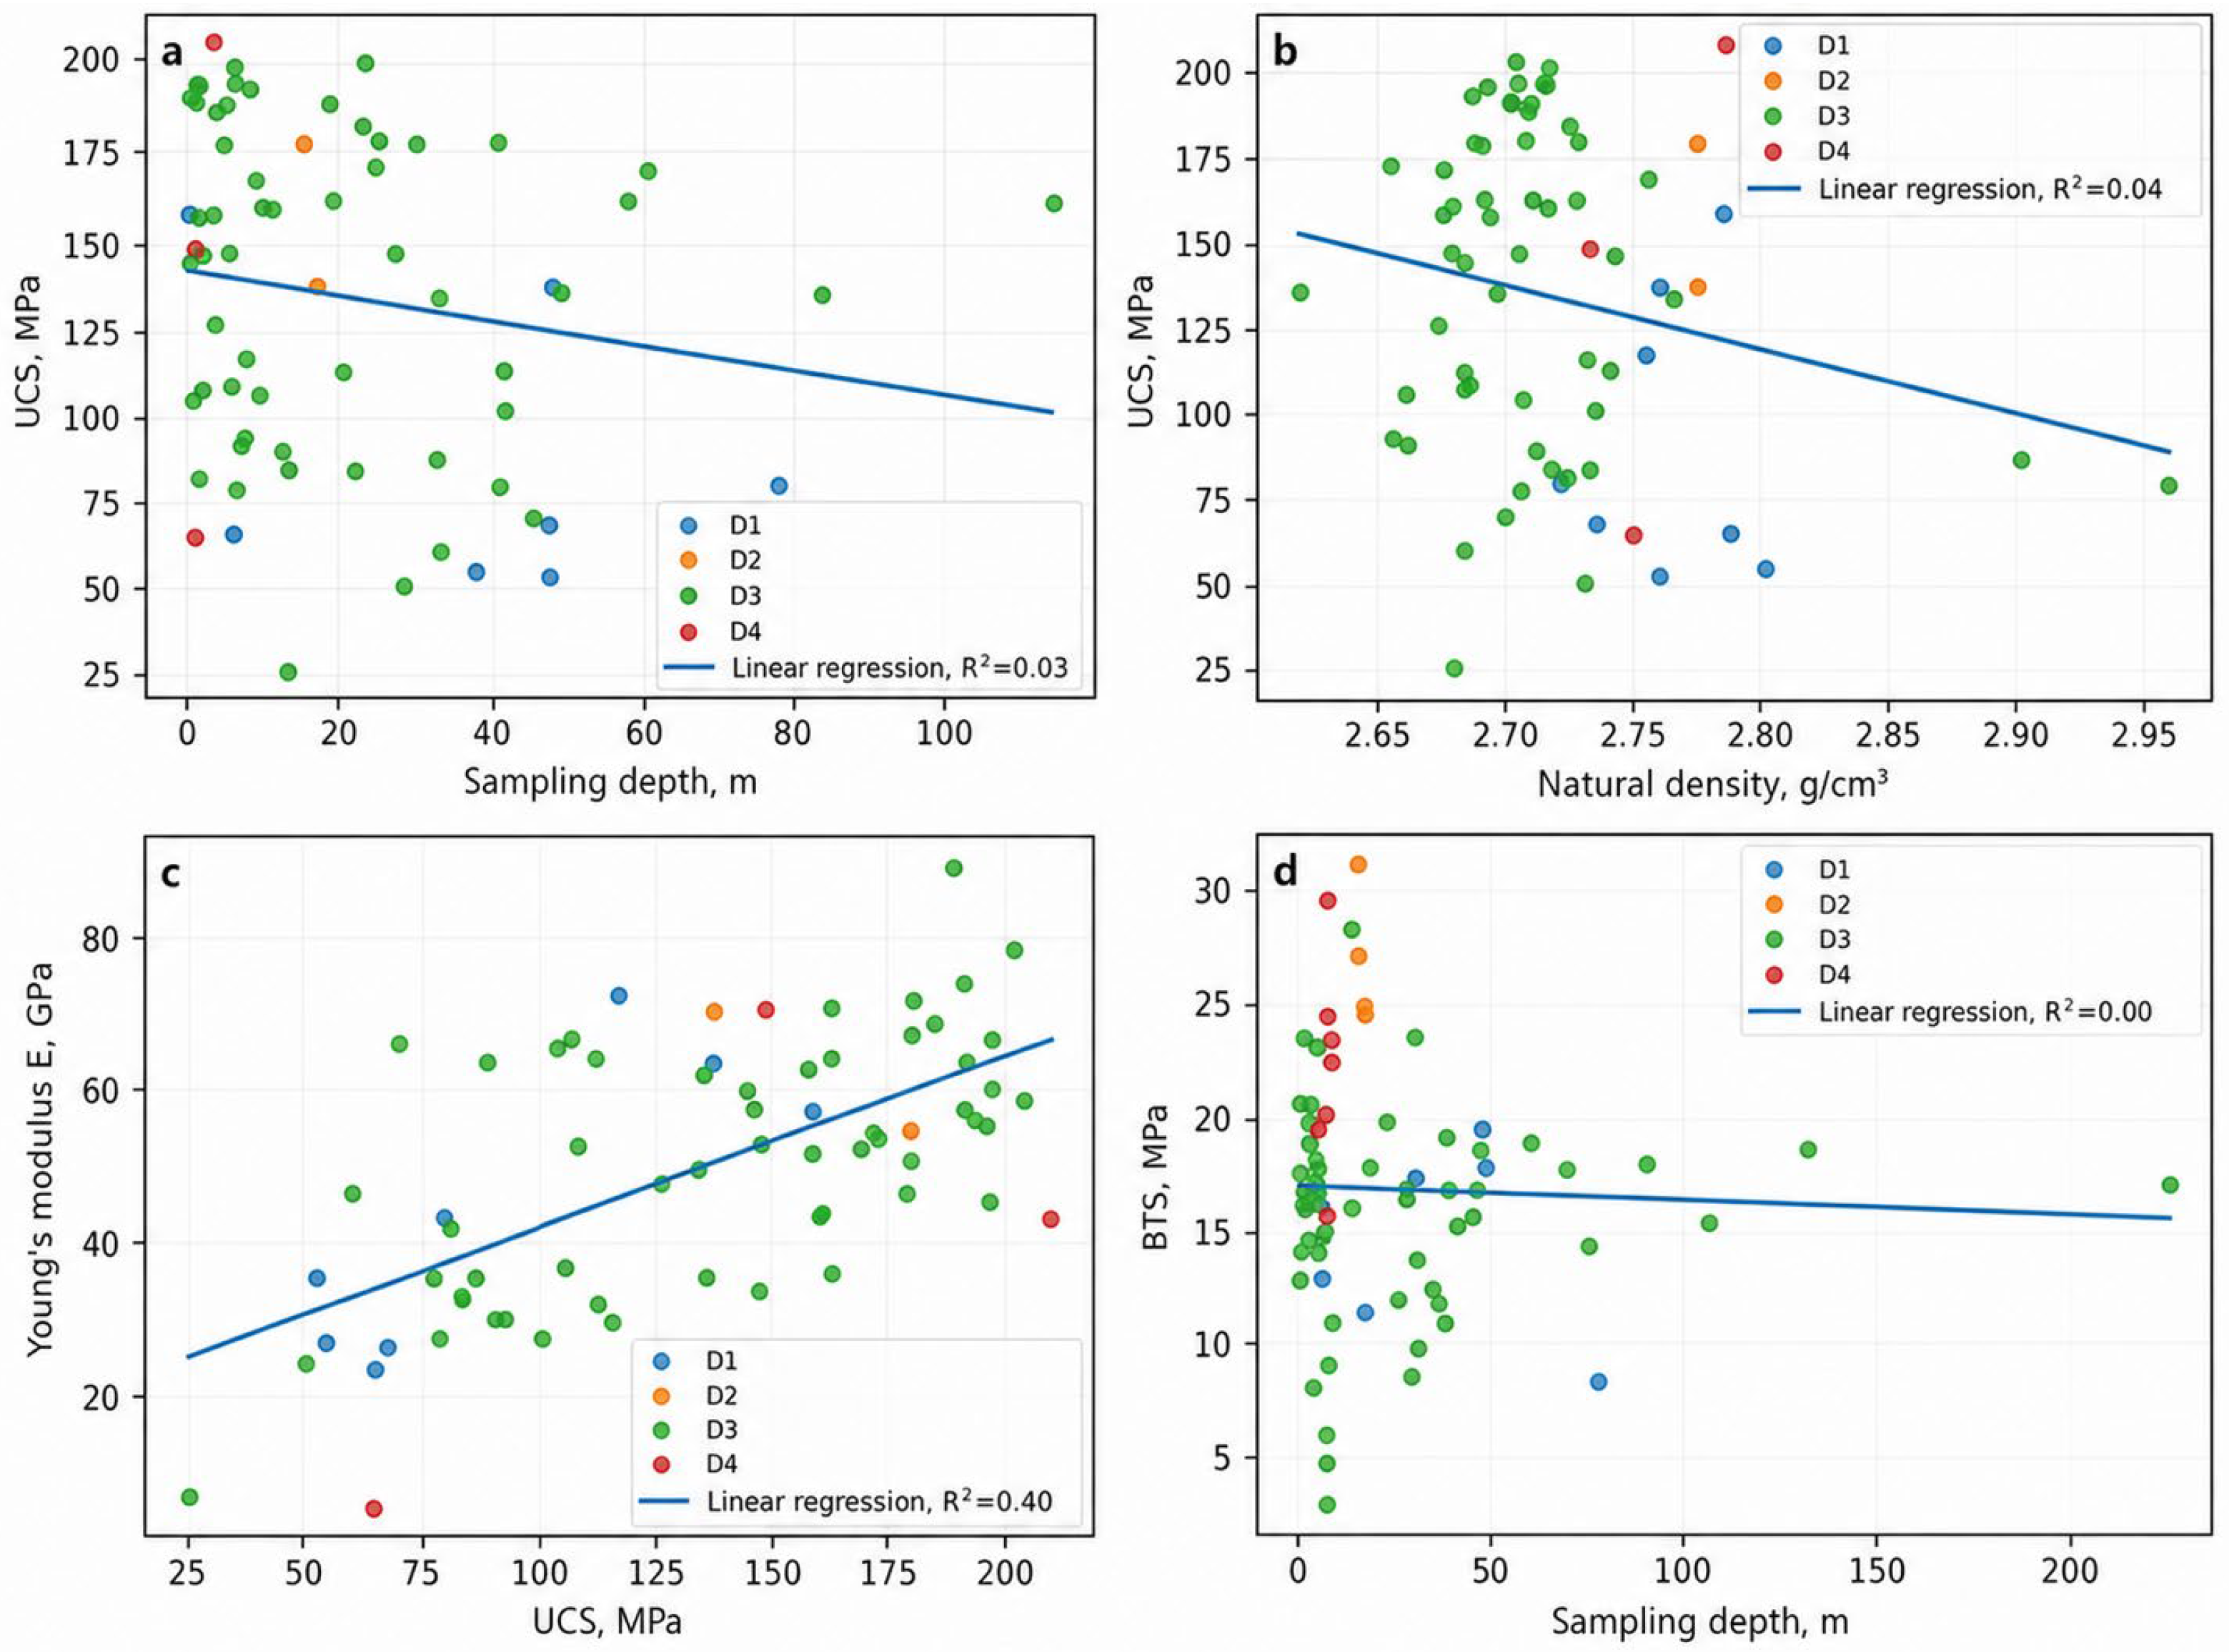
Exploratory correlation analysis was used to examine potential relationships among the measured properties (Figure 5). The analyzed relationships were UCS versus sampling depth, UCS versus natural bulk density, Young’s modulus versus UCS, and BTS versus sampling depth. The low coefficients of determination indicate that depth and density explain little of the observed strength variability within the available dataset.
Figure 5.
Exploratory relationships among intact rock properties: (a) UCS versus sampling depth; (b) UCS versus natural bulk density; (c) E versus UCS; (d) BTS versus sampling depth.
Figure 5 shows the exploratory relationships among the principal intact rock properties. Colors denote domain membership, and solid lines represent linear regressions fitted to the complete dataset. The plots indicate overall trends but do not remove the influence of the strongly unbalanced domain sample sizes.
UCS exhibits only a weak negative trend with sampling depth (Figure 5a), with substantial scatter throughout the investigated depth range. The low coefficient of determination (R2 = 0.03) indicates no meaningful linear relationship between depth and UCS in the available dataset.
The relationship between UCS and natural bulk density is also weakly negative (Figure 5b), and R2 = 0.04 indicates negligible explanatory capacity. Strength differences therefore cannot be reliably attributed to density alone and are more plausibly governed by the combined effects of mineral composition, hydrothermal–metasomatic alteration, texture, and microcracking.
The clearest relationship was obtained between Young’s modulus and UCS (Figure 5c). E increased with UCS, and R2 reached 0.40, indicating a moderate positive association between intact rock stiffness and strength. The dispersion around the regression line nevertheless shows that UCS explains only part of the variability in E.
The BTS–depth relationship is essentially horizontal (Figure 5d), with R2 = 0.00. No discernible linear relationship between sampling depth and indirect tensile strength was identified over the investigated depth interval.
Taken together, the exploratory regressions show that sampling depth and natural bulk density are weak predictors of strength, whereas the UCS–E relationship is comparatively more persistent. These relationships should be used primarily for qualitative interpretation because much of the variability arises from lithological heterogeneity, metasomatic alteration, and internal rock material defects.
A weak linear relationship does not imply the absence of geological control. Mechanical response is governed jointly by lithology, mineral composition, hydrothermal–metasomatic alteration, microcracking, and textural–structural features. Sampling depth and density should therefore be treated only as supplementary indicators and cannot replace direct laboratory testing.
The observed intra-domain variability and overlap among domains demonstrate that engineering parameterization should incorporate distribution shape, median, range, and coefficient of variation rather than relying on a single deterministic mean.
Deformation parameters were derived from axial and lateral strain curves recorded during uniaxial compression. Domain-level Young’s modulus and Poisson’s ratio statistics are summarized in Table 3.
Table 3.
Young’s modulus and Poisson’s ratio of intact rock by geomechanical domain.
The highest mean Young’s modulus was obtained for D2 (62.25 GPa), whereas the lowest was obtained for D4 (39.60 GPa). Direct comparison is limited, however, because only two D2 and three D4 specimens were tested.
The coefficient of variation of E in D4 reached 82.21%, driven by individual values of 5.44, 43.10, and 70.27 GPa. This extreme dispersion indicates substantial heterogeneity in deformation behavior and precludes treating the mean as fully representative of the entire domain.
Because the test records contained no documented evidence of methodological error, specimen geometry nonconformity, or equipment malfunction, the 5.44 GPa observation was retained. It may represent genuine heterogeneity within the lamprophyre dikes; nevertheless, its use in engineering parameterization requires caution and verification using a larger sample.
3.3. Strength Under Triaxial Compression
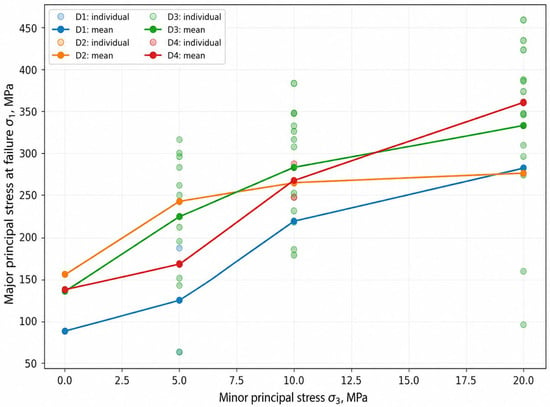
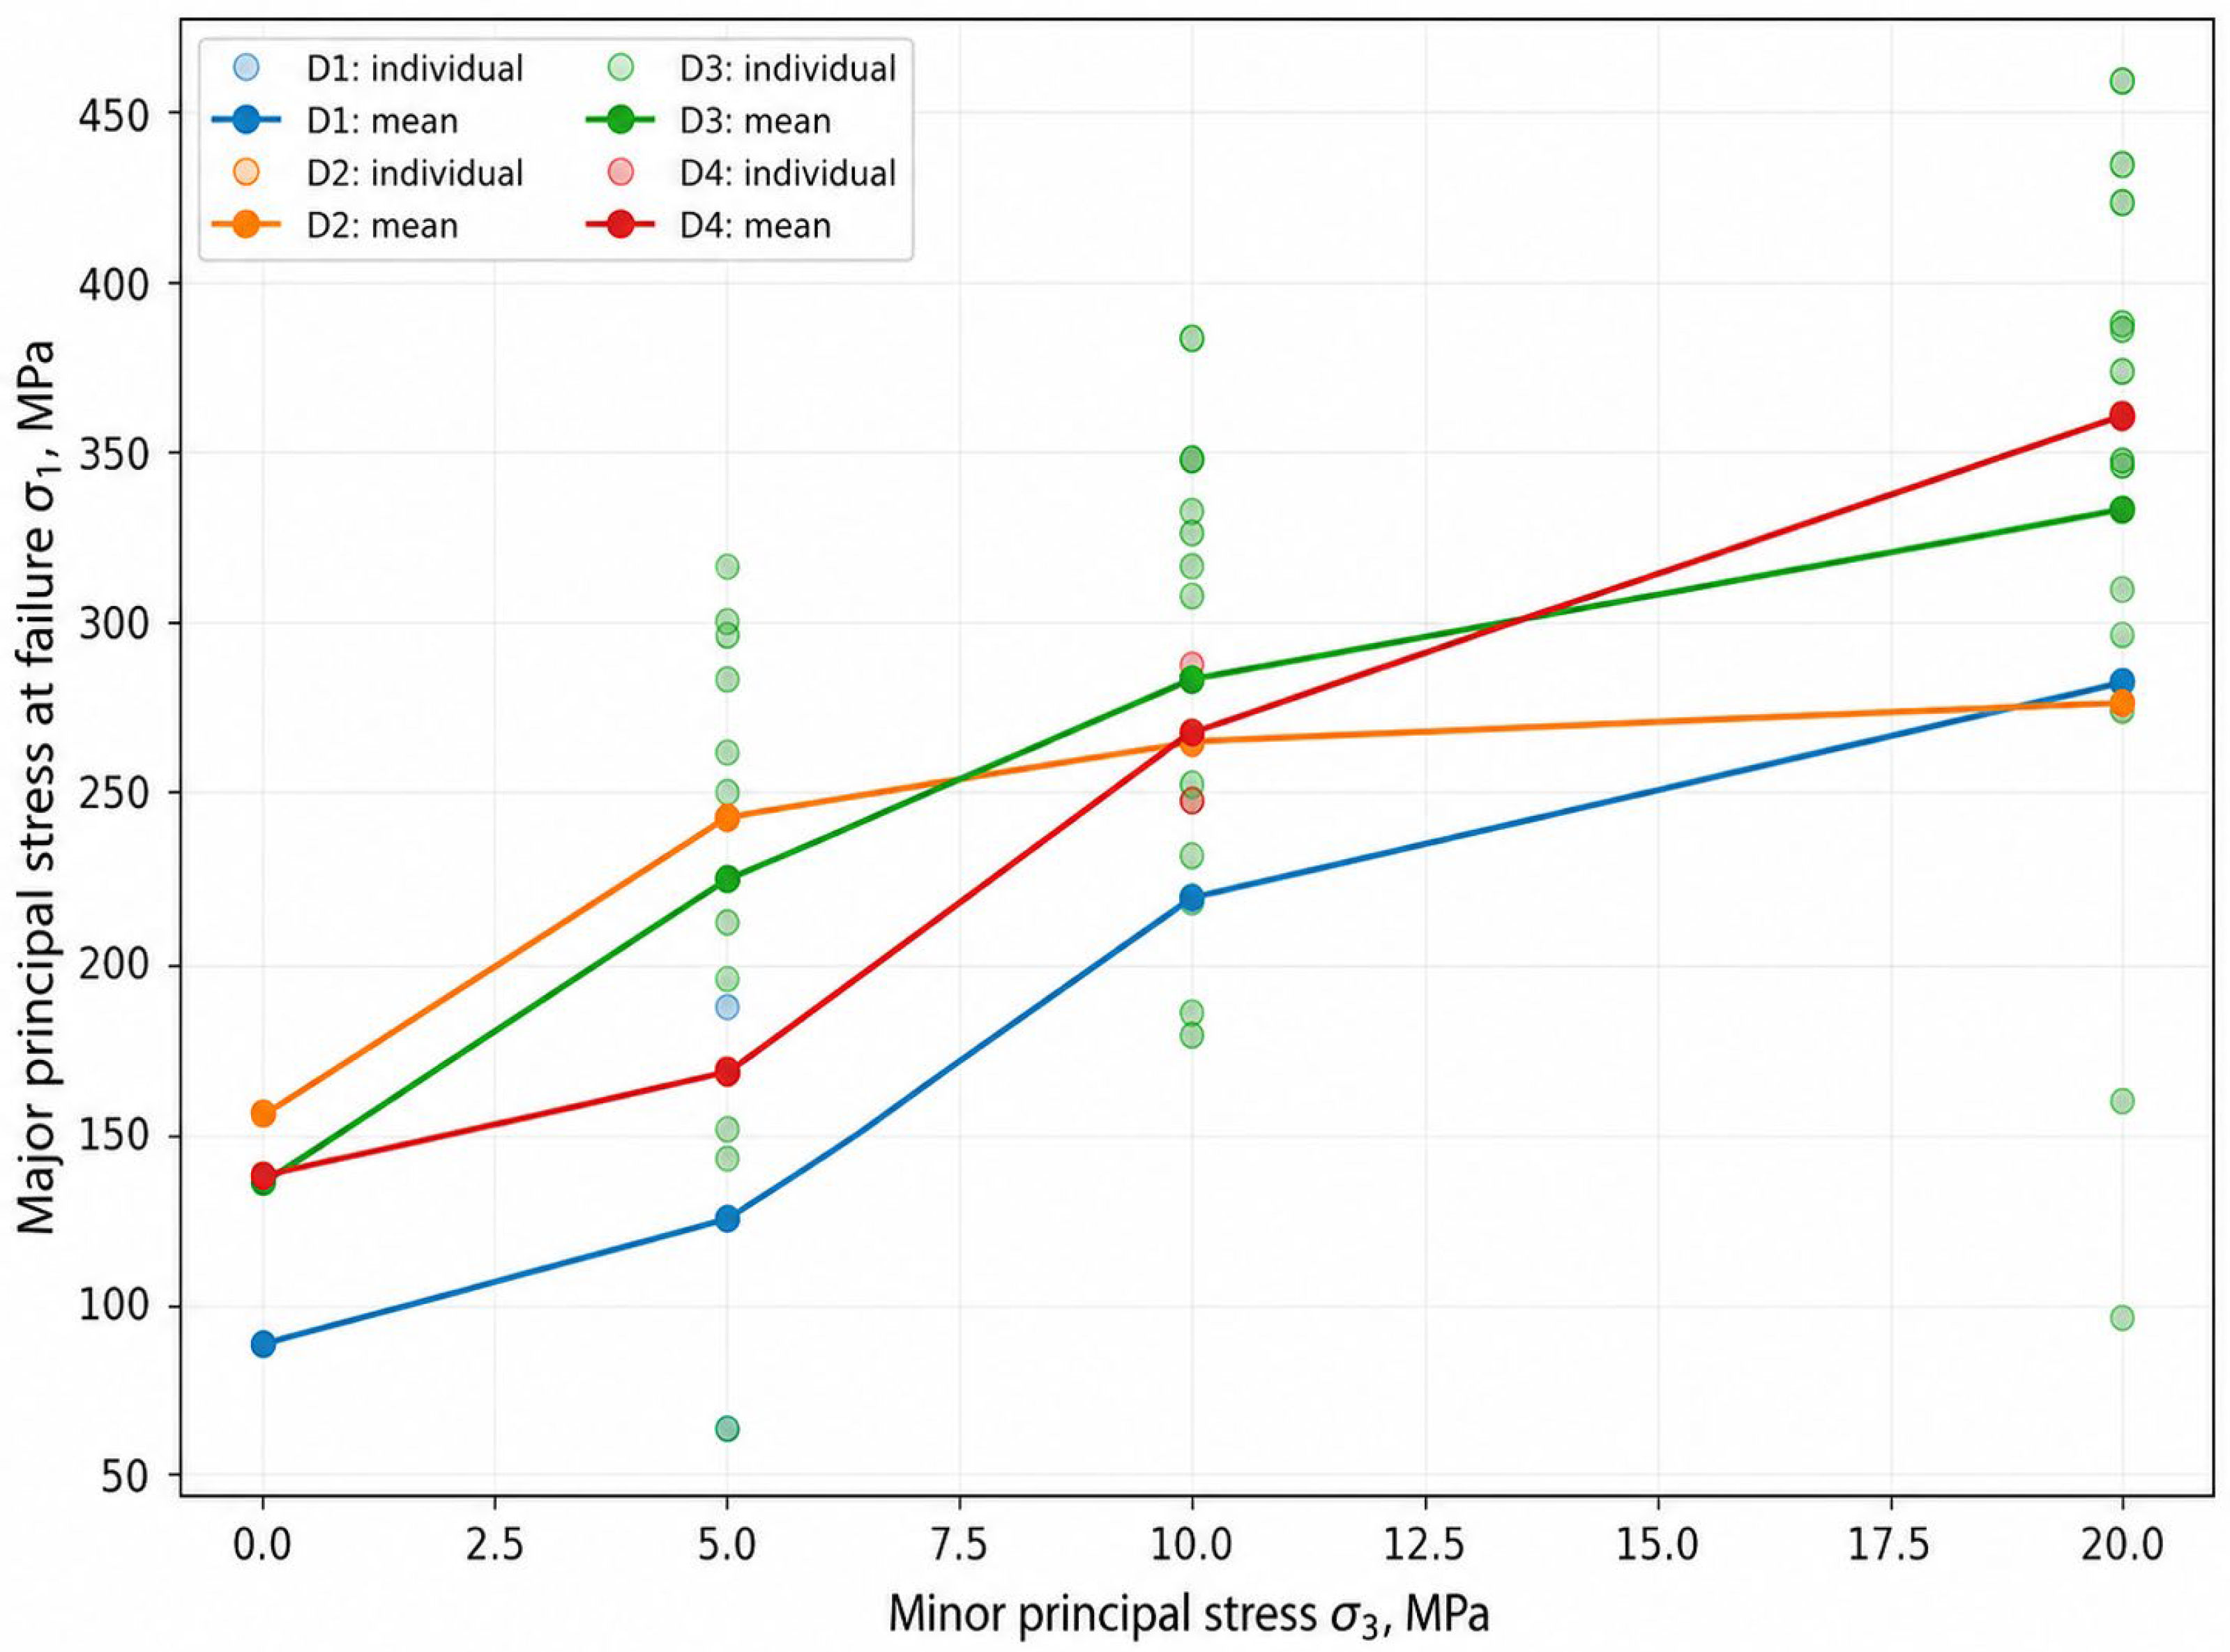
Triaxial tests were conducted at σ3 = 5, 10, and 20 MPa; mean UCS values at σ3 = 0 were added only to construct domain-level trends. In every domain, increasing confinement produced an increase in the maximum principal stress at failure, σ1. D3 provided the most complete relationship, with 38 actual triaxial specimens, whereas replication at individual σ3 levels was limited for D1, D2, and D4.
The individual observations confirm systematic strengthening with increasing confinement while also revealing substantial scatter, particularly in D3. In Figure 6, points represent individual triaxial tests and lines connect domain mean values.
Figure 6.
Maximum principal stress at failure versus confining pressure: individual observations and domain mean values.
Mean σ1 increased by more than twofold between σ3 = 0 and 20 MPa in D1 and D4. D3 showed a consistent increase across the complete confinement range and, because it contains the largest number of tests, provides the most representative estimate of triaxial behavior. D2 also exhibited increasing σ1 with σ3, but interpretation is constrained by the small experimental sample.
The broad spread of σ1 at identical confinement levels, especially in D3, reflects substantial natural heterogeneity. Confinement increases resistance to failure but does not eliminate the influence of initial variability. Domain-level interpretation should therefore consider both central tendencies and the full range of observations.
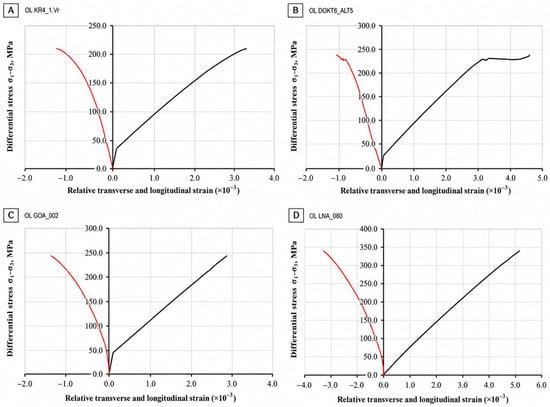
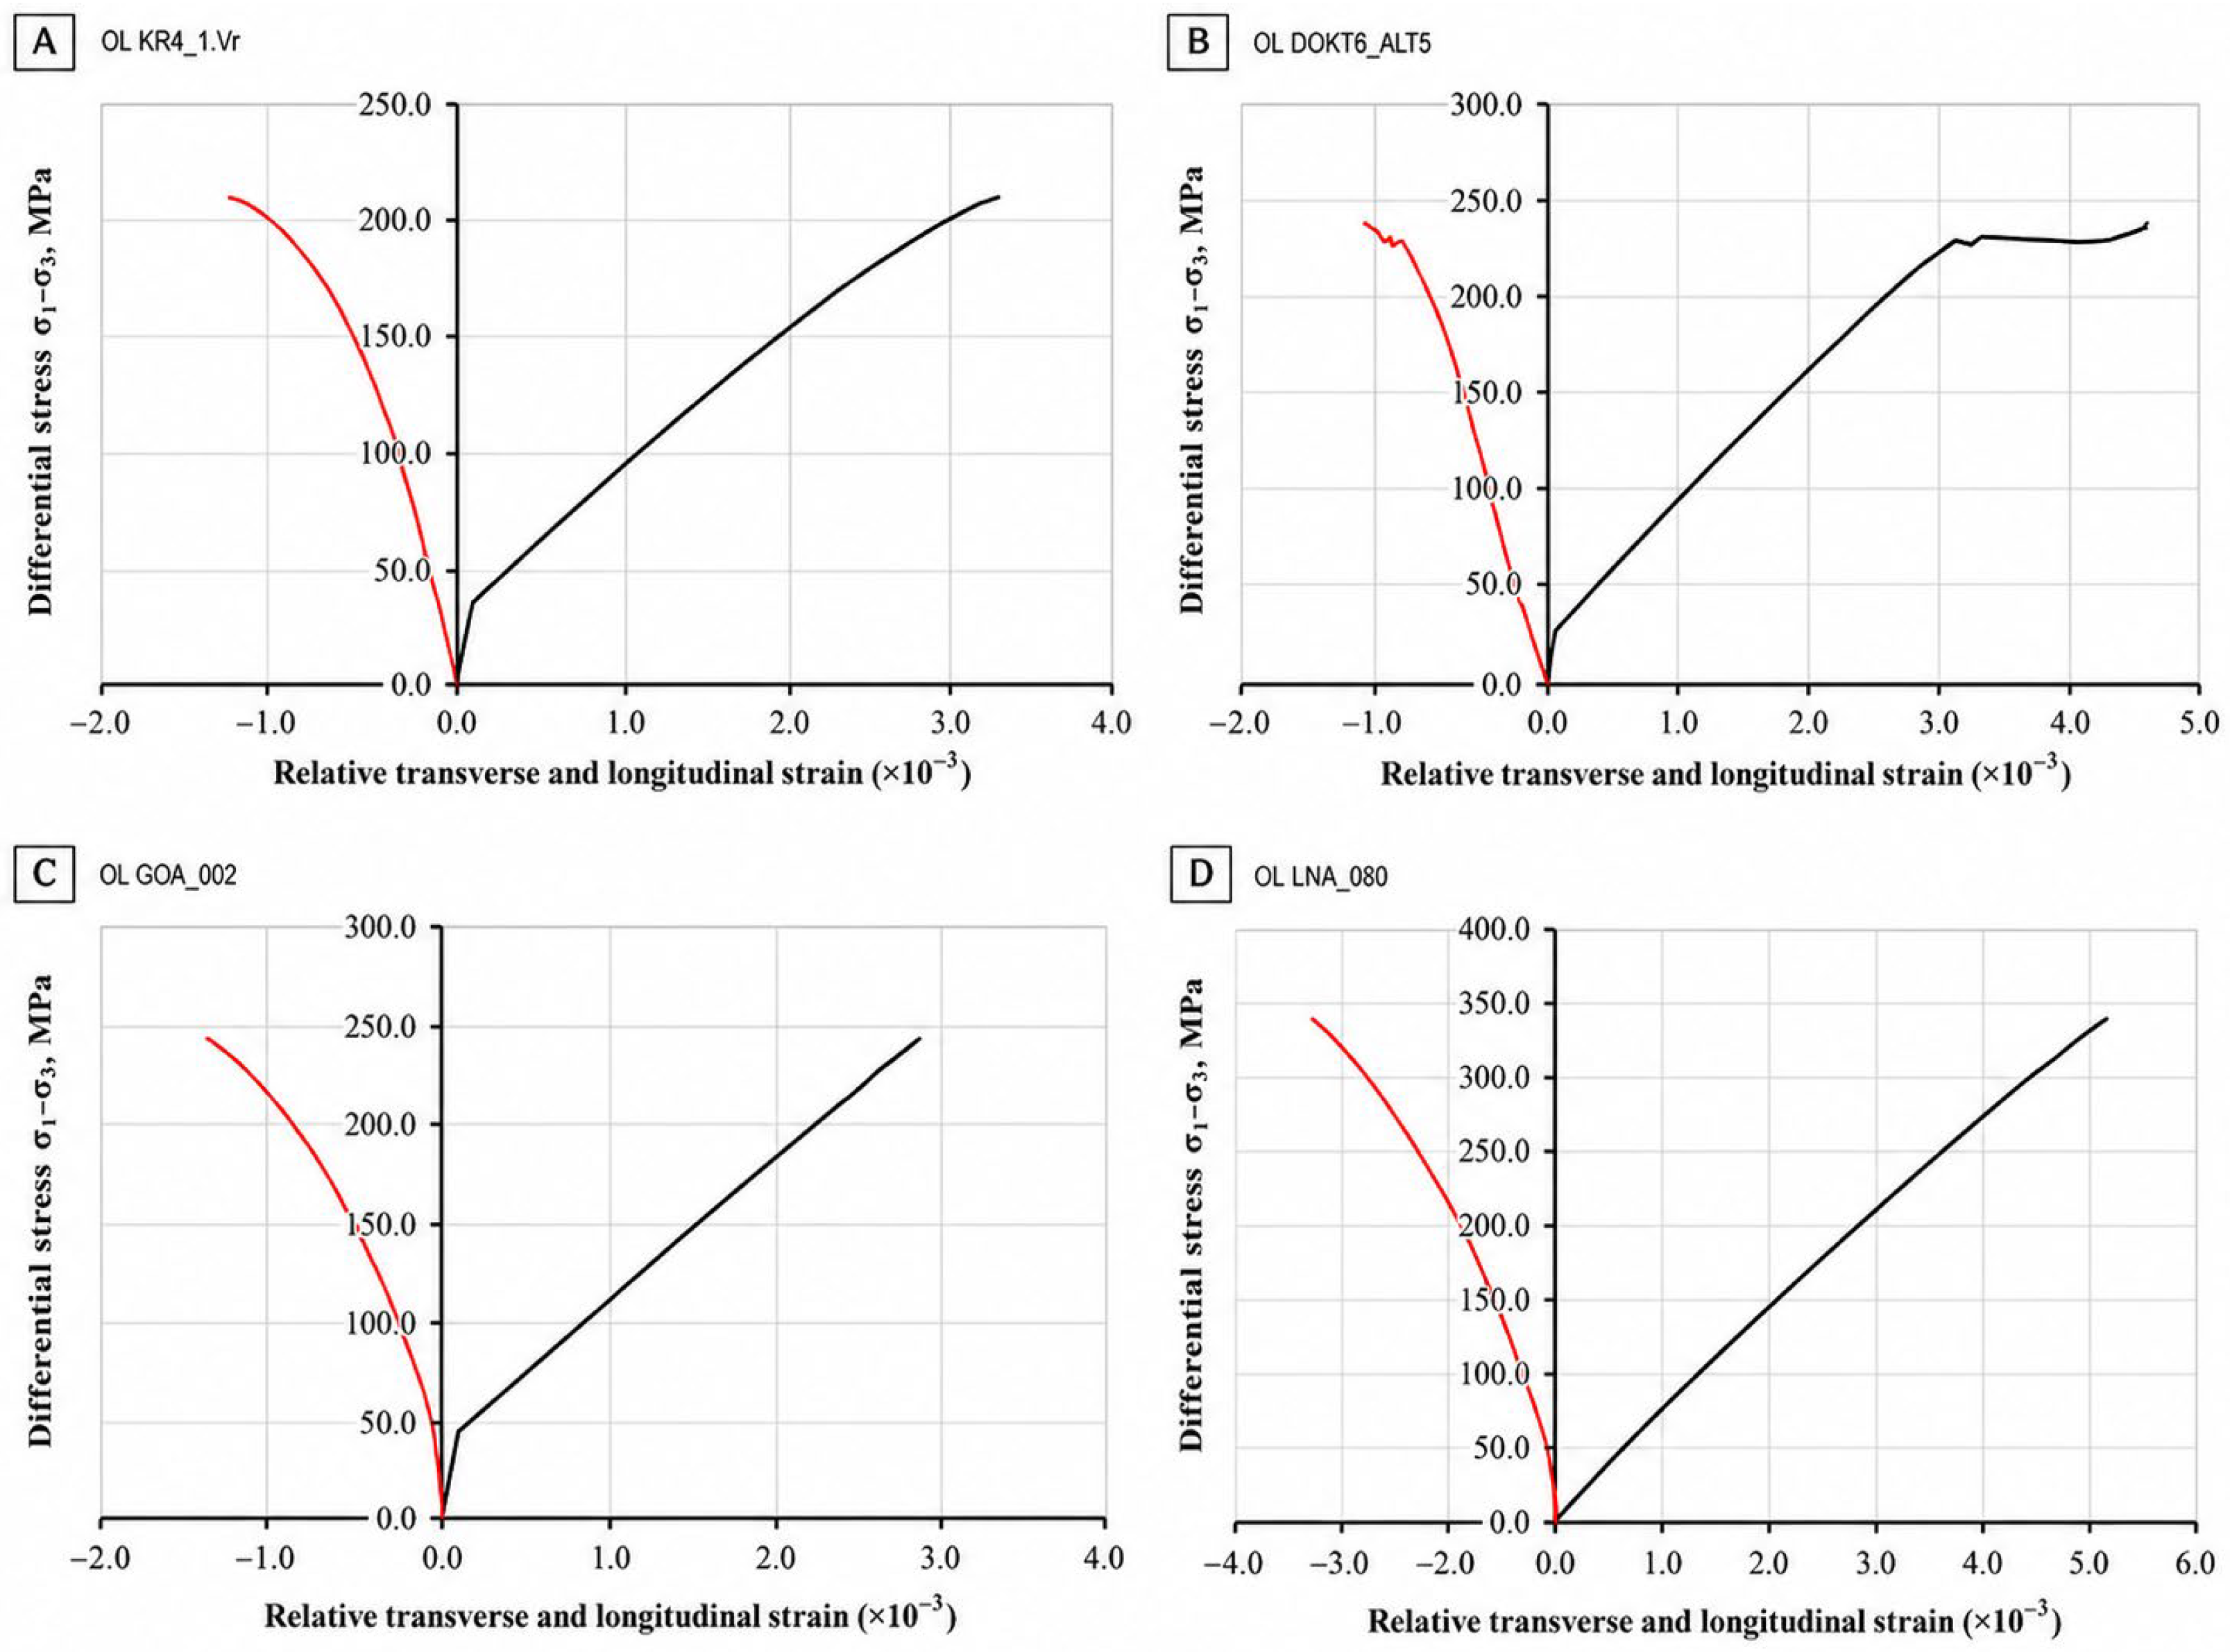
Representative stress–strain curves selected from Appendix B of the technical report [27] are presented in Figure 7 to illustrate the mechanical response under triaxial compression.
Figure 7.
Representative deformation behavior under triaxial compression: (A) D1; (B) D2; (C) D3; (D) D4.
Figure 7 presents representative stress–strain diagrams for individual specimens from D1–D4. Differential stress (σ1 − σ3) is plotted on the ordinate, and relative axial and lateral strains are plotted on the abscissa. The right branch represents axial compression, and the left branch represents lateral deformation.
The curves show an initial approximately linear stage dominated by elastic response, followed by progressive reduction in tangent stiffness as inelastic deformation and internal microdamage accumulate. This evolution represents the transition from quasi-elastic response to the limiting state under confinement.
Peak differential stress was approximately 210 MPa for the representative D1 specimen, exceeded 230 MPa for D2, reached approximately 245 MPa for D3, and was approximately 340 MPa for D4. No pronounced post-peak softening was captured for the representative D3 specimen within the recorded strain range.
These curves demonstrate differences in both stress level and deformation response among the selected specimens. They do not, however, provide an independent basis for definitive domain ranking because they represent individual curves rather than the complete statistical distributions, an important limitation for the sparsely sampled D2 and D4 domains.
Strength envelope parameters and deformation behavior should therefore be interpreted jointly with replication, confinement levels, actual loading paths, result dispersion, and observed failure mode. The representative curves complement, but do not replace, domain-level statistical analysis.
3.4. Shear Resistance of Natural Discontinuities
Direct shear was performed on 42 specimens at normal stresses of 1, 3, and 5 MPa, corresponding to 126 staged determinations of shear stress. Summary parameters are presented in Table 4.
Table 4.
Shear-resistance parameters of natural discontinuities.
For D1, the mean apparent cohesion cj was 0.125 MPa, and the mean friction angle φj was 12.28°. The most representative estimate was obtained for D3, with c_j = 0.140 ± 0.083 MPa and φj = 11.69 ± 2.77°. D2 was represented by one tested surface and D4 by two; their parameters therefore characterize only those individual specimens.
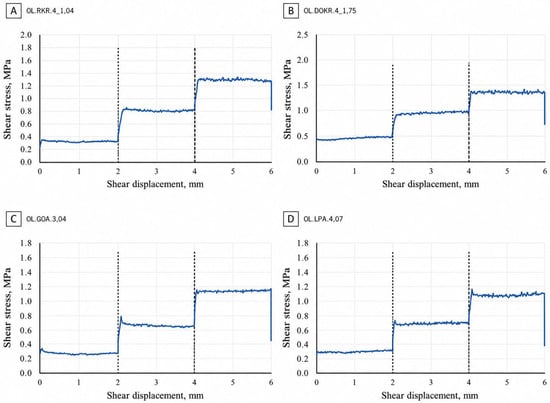
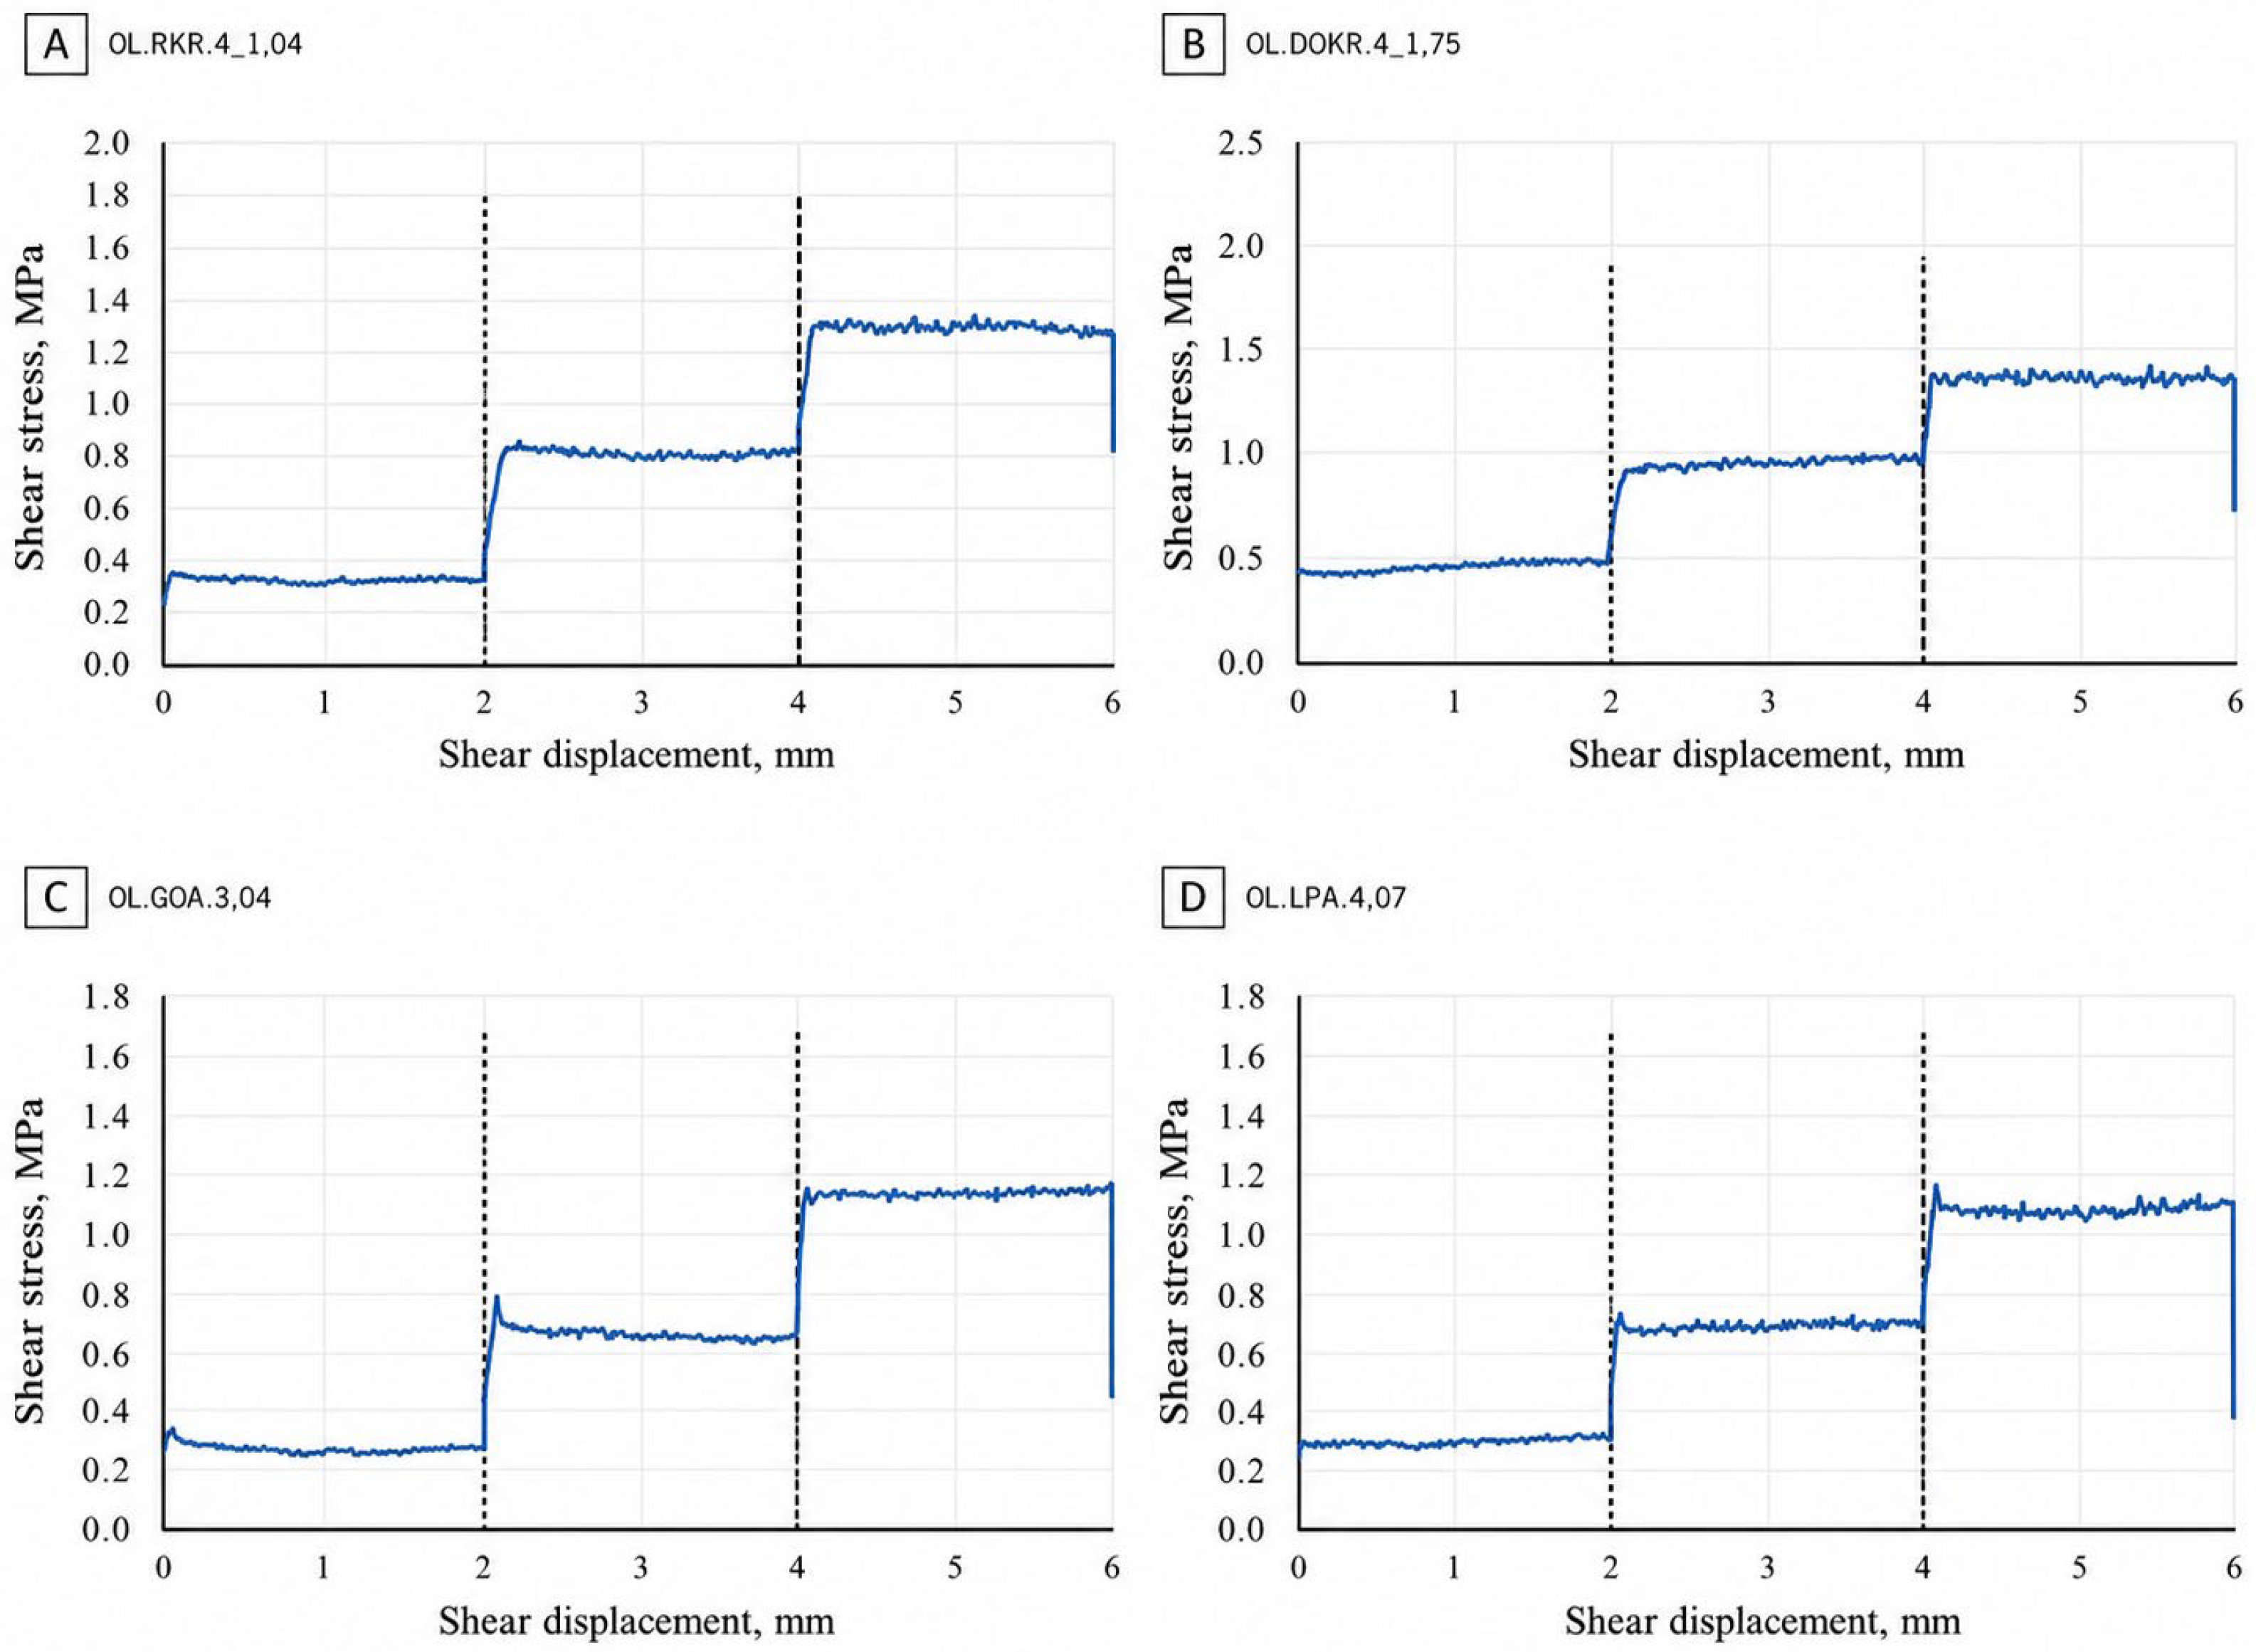
Representative shear stress–displacement curves are shown in Figure 8. Dashed lines indicate transitions between successive normal stress stages.
Figure 8.
Shear stress versus shear displacement for multistage direct shear tests on natural discontinuities: (A) D1; (B) D2; (C) D3; (D) D4.
Figure 8 shows the shear stress–displacement relationships obtained during multistage direct shear testing of natural discontinuities from D1–D4. Dashed lines mark changes in normal stress between successive loading stages.
The tested surfaces displayed a broadly similar sequence of response. At each constant normal stress stage, shear resistance remained relatively stable with local fluctuations attributable to surface roughness, changes in real contact area, and progressive damage to asperities. Increasing normal stress produced a stepwise increase in shear resistance followed by stabilization at a new quasi-steady level.
The maximum recorded shear stress was approximately 1.4 MPa for the tested D2 surface, approximately 1.3 MPa for D1, and about 1.1–1.2 MPa for the representative D3 and D4 surfaces. These values characterize the tested surfaces and must not be used for definitive inter-domain ranking without accounting for sample size, discontinuity condition, and loading history. This limitation is particularly important for D2 (one surface) and D4 (two surfaces).
No pronounced post-peak softening was observed within the recorded displacement range. Following each increase in normal stress, shear resistance generally stabilized at a higher level. The absence of a clear post-peak reduction in these individual curves should not be generalized to all discontinuities within a domain because curve shape depends on roughness, infill, wall condition, contact area, and the displacement reached during testing.
The curves confirm that shear resistance increases with normal stress and provide the experimental basis for deriving apparent cohesion cj and friction angle φj using a linear Mohr–Coulomb approximation. These parameters summarize the multistage response of each individual surface and were derived from sequential normal stress levels within a single test, not from independent specimens at each σn level.
Differences among the curves therefore reflect the mobilization of resistance along individual natural surfaces. Interpretation must consider the number of tested specimens, normal stress range, discontinuity characteristics, and domain-level scatter.
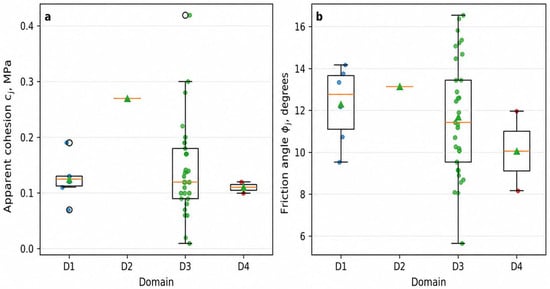
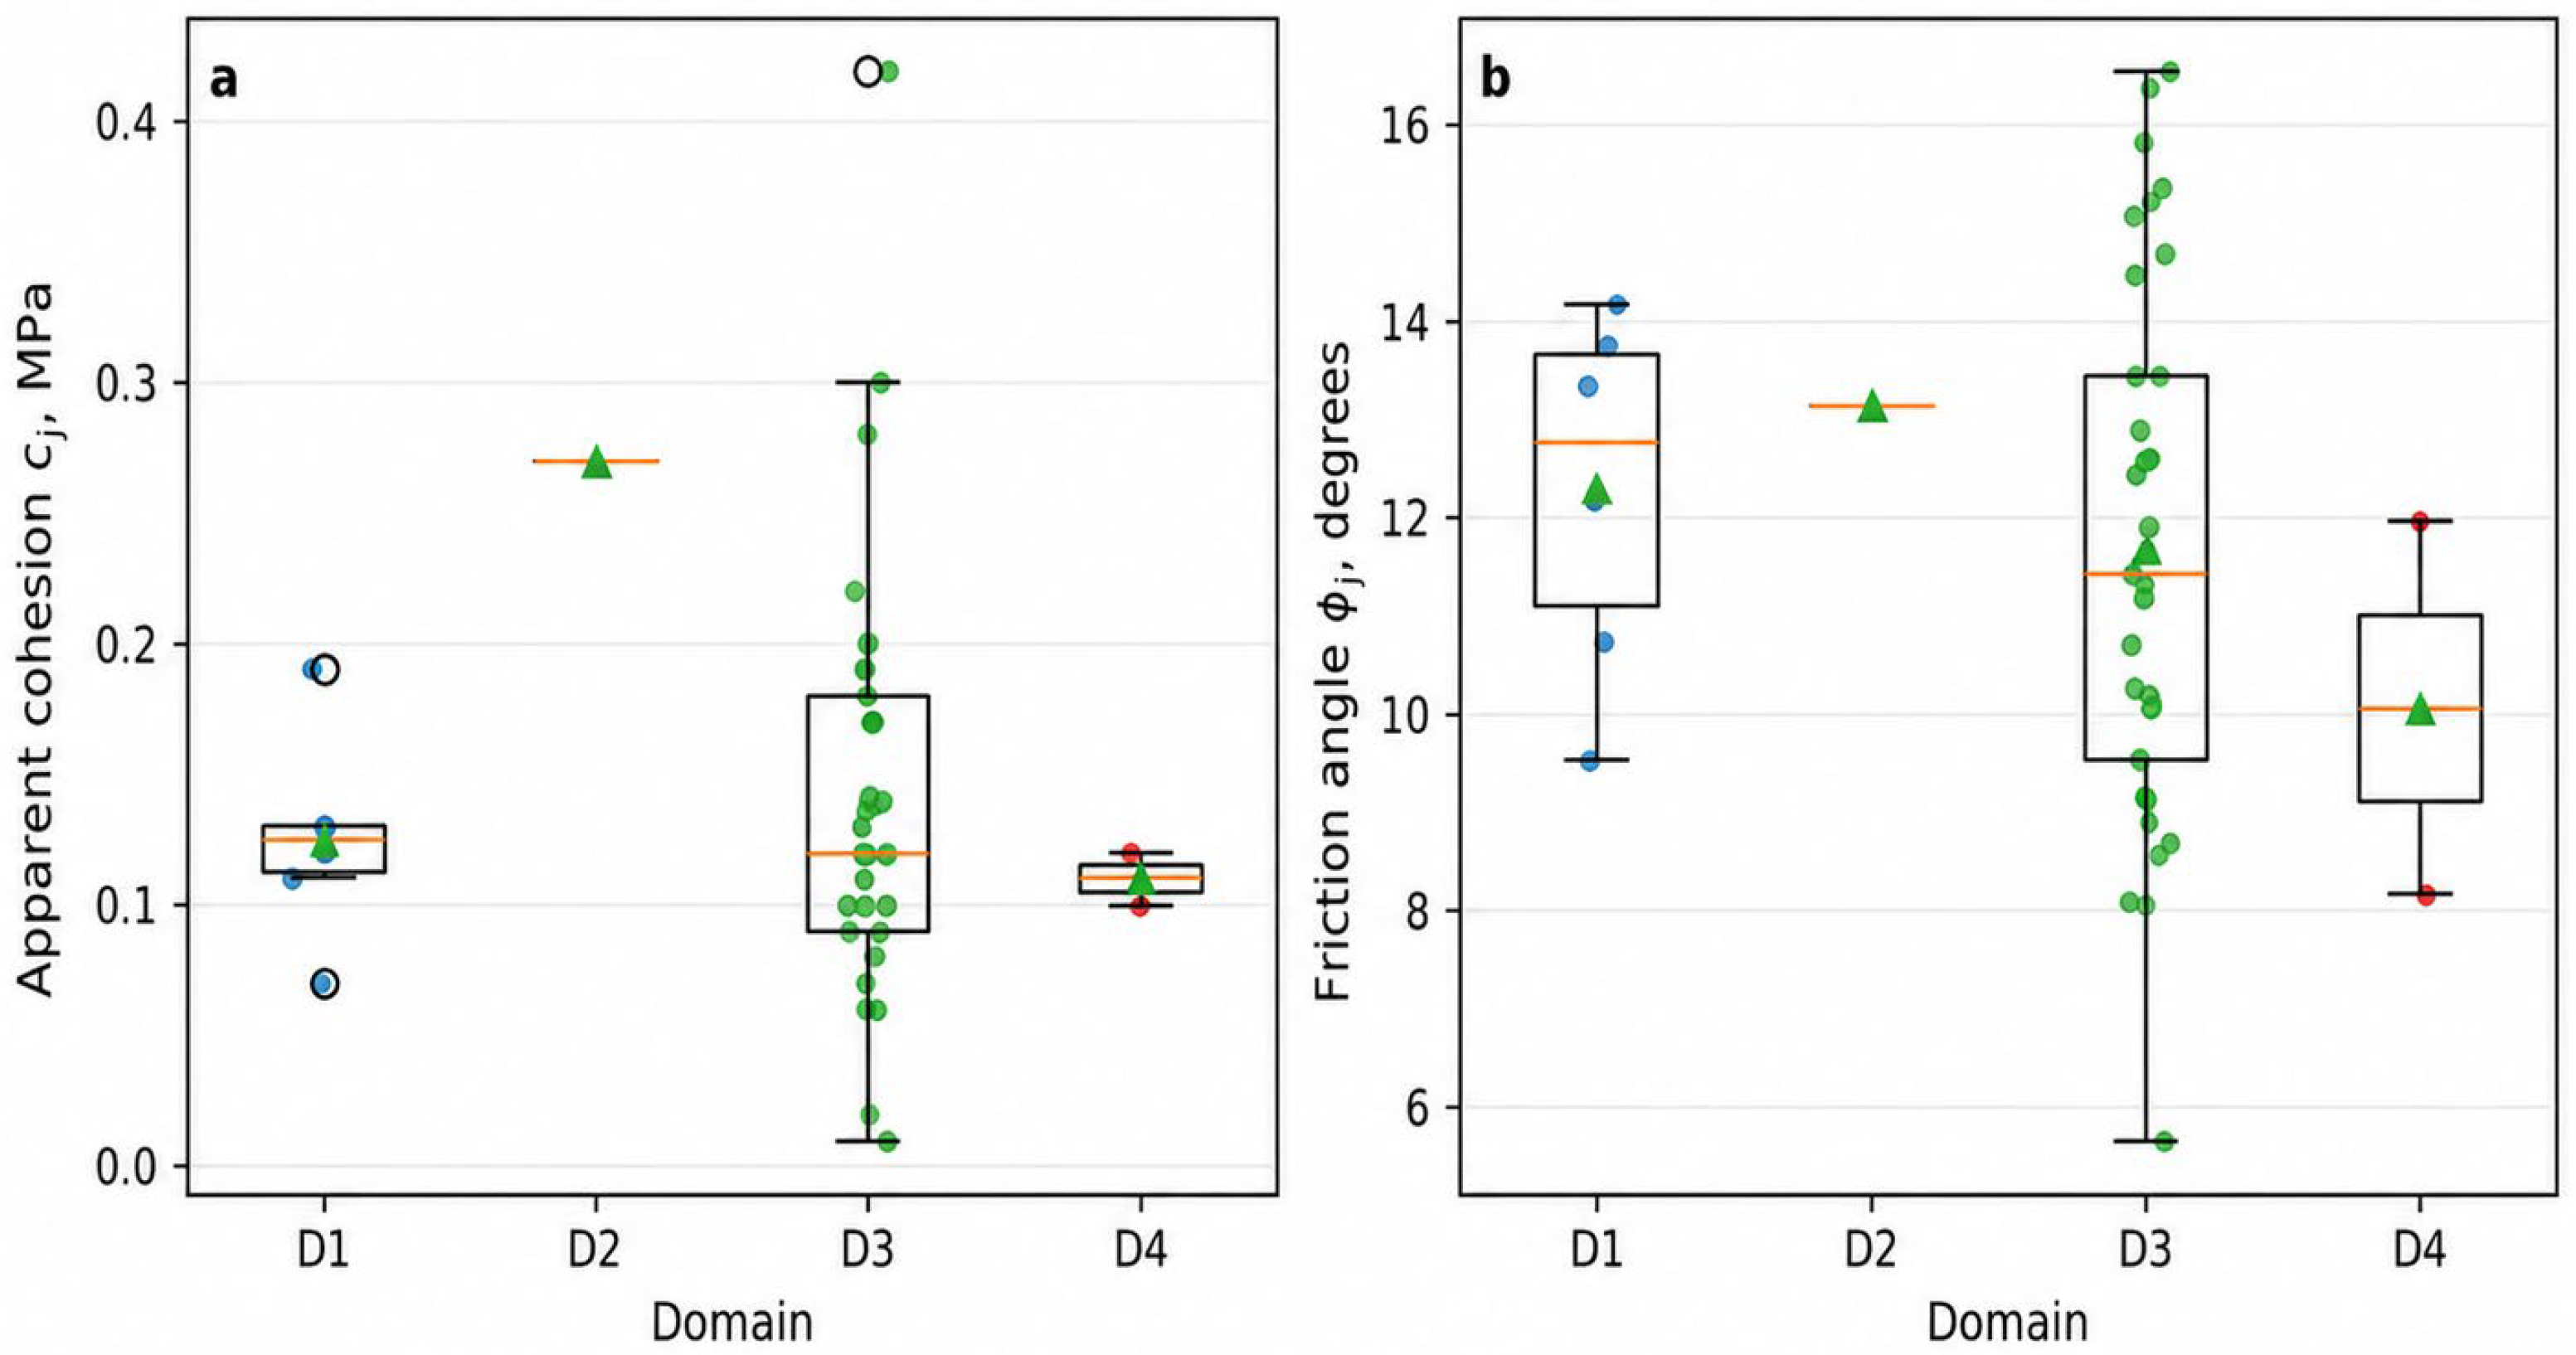
Figure 9 summarizes the distributions of cj and φj obtained for natural discontinuities in D1–D4.
Figure 9.
Distribution of direct shear parameters: (a) apparent cohesion; (b) friction angle. Circles indicate individual test results, triangles indicate mean values, boxes represent interquartile ranges, central horizontal lines indicate medians, and whiskers show the data range.
Mean apparent cohesion in D1 and D3 was approximately 0.12–0.14 MPa. D3 displayed the broadest range, from 0.01 to 0.42 MPa, indicating substantial heterogeneity in discontinuity surface conditions. D4 yielded values of approximately 0.10–0.12 MPa. The D2 value of approximately 0.27 MPa is based on a single test and must be treated as preliminary.
Friction angles for most domains fell within 8–16°. D3 showed the greatest variability, from 5.66° to 16.58°, consistent with differences in roughness, alteration, and surface condition. D1 and D4 exhibited narrower ranges, while the D2 friction angle of approximately 13° derives from one observation and is not statistically representative.
The results indicate that natural discontinuity shear resistance is dominated by friction, with a comparatively small contribution from apparent cohesion. The broad D3 distributions emphasize the need to account for intra-domain variability, whereas the limited D2 and D4 datasets require cautious interpretation and additional testing.
3.5. Scenario-Based Assessment of Rock Mass Parameters
Secondary Hoek–Brown parameters adopted from the technical report are summarized in Table 5. The σci values are RocData input values from that report and are not identical to arithmetic mean UCS values calculated from the present laboratory dataset; this distinction is retained to preserve transparency of the original calculation scheme.
Table 5.
Scenario-based Hoek–Brown rock mass parameters derived from secondary technical-report inputs.
The retained fraction of equivalent UCS ranges from 5.36% to 9.55%, whereas the calculated reduction ranges from 90.45% to 94.64%. The two indices are complementary and sum to 100% for every domain.
To quantify uncertainty associated with GSI, scenario calculations were performed by varying each domain value by ±5 points while holding σ_ci and D = 0 constant. This sensitivity analysis does not replace field-based reassessment of GSI but demonstrates the dependence of the calculated parameter on its classification input.
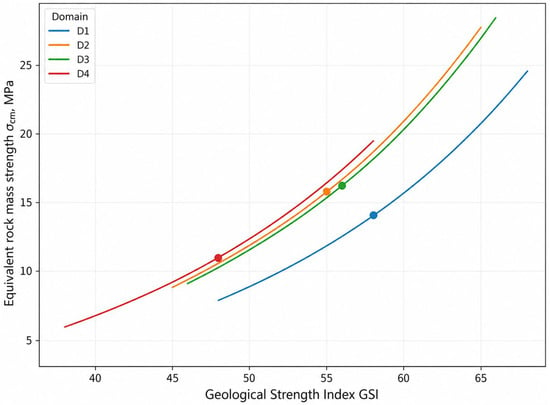
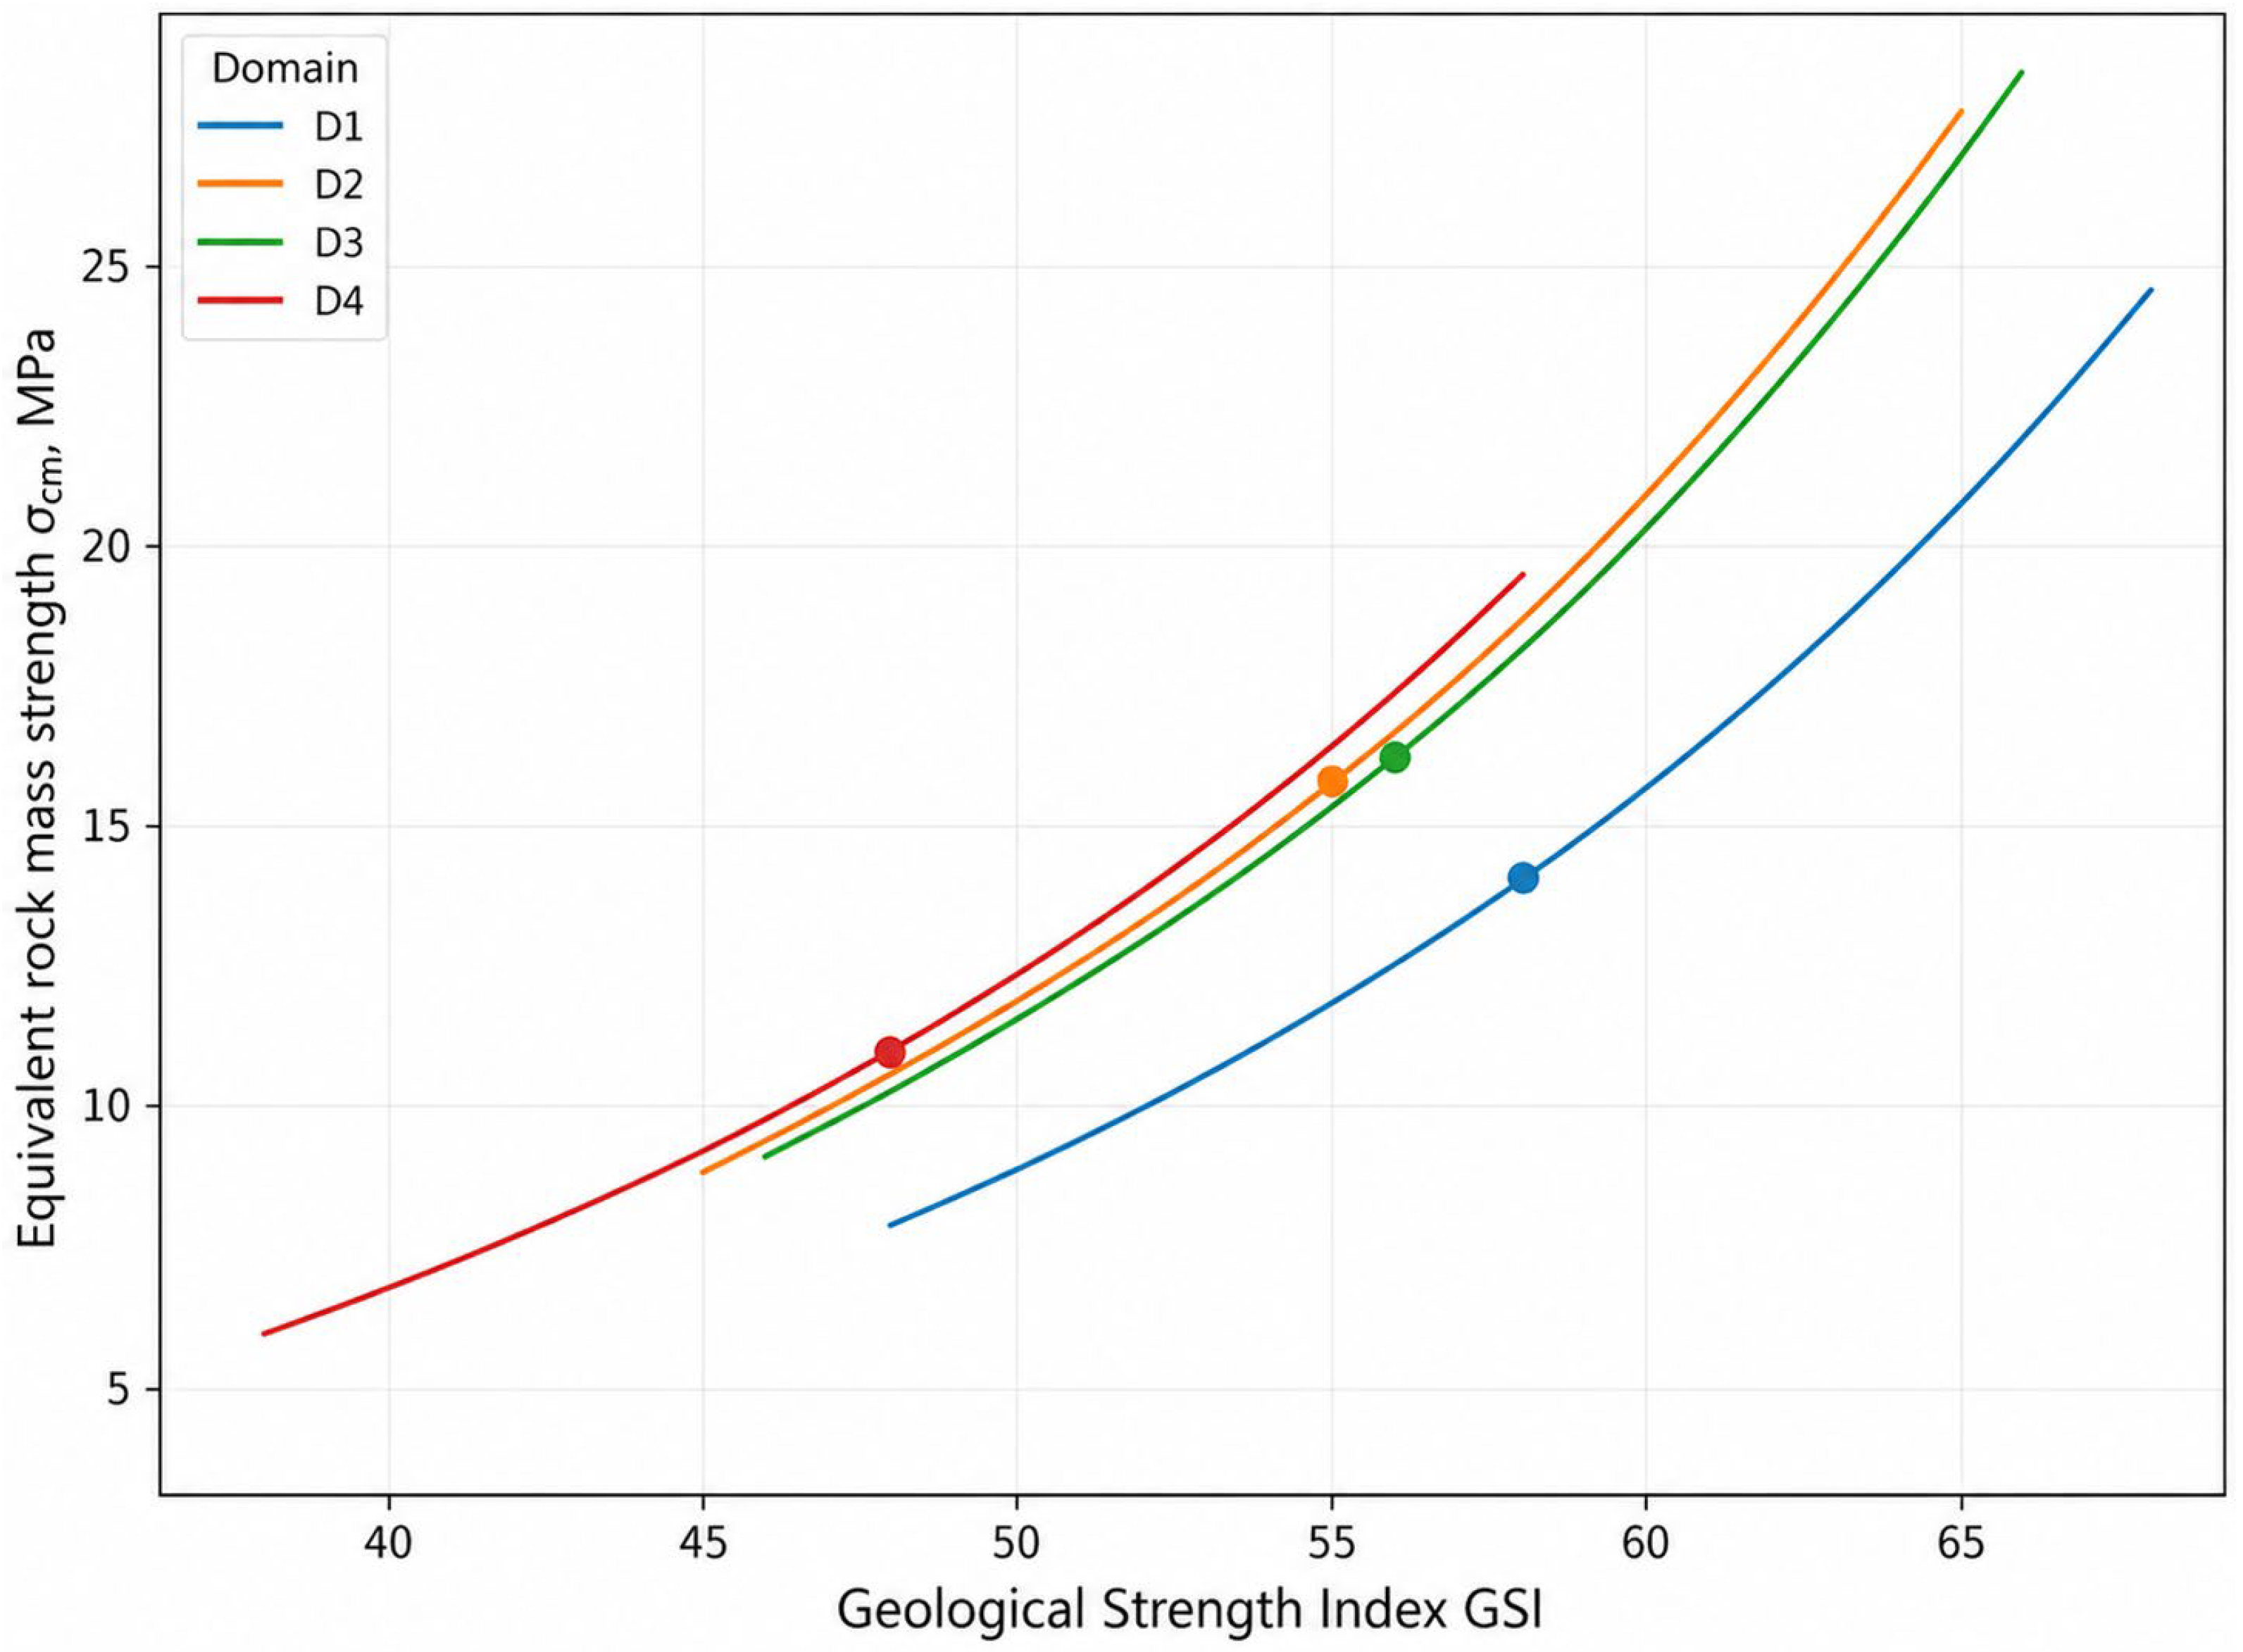
Figure 10 shows a nonlinear positive relationship between GSI and conditional equivalent rock mass strength for all domains. The convex curves indicate that the sensitivity of σcm to uncertainty in GSI increases as structural quality improves; consequently, an identical increase in GSI produces a larger strength increment at higher GSI values than at lower values.
Figure 10.
Sensitivity of conditional equivalent rock mass strength σ_cm to GSI at D = 0.
Equivalent shear parameters obtained by linearizing the Barton–Bandis criterion in the technical report are listed in Table 6. Their evidential basis for D2 and D4 is additionally constrained by the small numbers of direct-shear tests.
Table 6.
Conditional equivalent shear parameters for the fractured rock mass based on the technical report.
Table 6 is included to document the source of the previously reported calculated values. Until independent measurements of roughness, joint wall compressive strength, and representative normal stress are available, these parameters should not be treated as normative domain values.
At the baseline GSI values, σcm is approximately 14.0 MPa for D1 at GSI ≈ 58, 15.8 MPa for D2 at GSI ≈ 55, 16.2 MPa for D3 at GSI ≈ 56, and 11.0 MPa for D4 at GSI ≈ 48. Within comparable GSI ranges, the D2 and D3 curves are closely spaced, whereas D1 remains lower at moderate to high GSI. D4 shows a relatively rapid increase, but its curve predominantly covers lower and intermediate GSI values.
These relationships identify GSI as one of the most influential inputs in estimating equivalent rock mass strength. Uncertainty in GSI derived from mapping and core documentation can therefore propagate strongly into calculated parameters. Differences among domain curves reflect both GSI and intact rock inputs; direct domain comparisons must consider the complete Hoek–Brown parameter set.
4. Discussion
4.1. Domain-Scale Variability in Physical and Mechanical Properties
The results show that lithological domain subdivision preserves meaningful contrasts but does not eliminate intra-domain variability. Differences are most apparent in density and BTS, whereas UCS, E, and ν ranges overlap substantially. Because the dataset is unbalanced and some D2 and D4 properties are represented by only a few observations, inter-domain comparison must consider sample size, medians, ranges, and coefficients of variation in addition to means.
The elevated mean BTS, UCS, and E values in D2 describe the tested diorite specimens but cannot be regarded as validated parameters of the complete domain. D1 had the lowest mean UCS. A possible relationship between lower strength and beresite alteration is consistent with modification of mineral composition and primary rock fabric, but the present data do not establish causality. Confirmation would require quantitative mineralogical–petrographic analysis, porosity measurements, and microcrack density characterization.
D3 is both the best-represented domain and the domain with broad property ranges. Even the dominant lithology, therefore, cannot be represented adequately by a single mean. Engineering parameterization should preferentially use distributions, medians, interquartile ranges, and justified lower percentiles rather than one deterministic value.
4.2. Effect of Confinement and Interpretation of Triaxial Strength
All domains exhibited increasing σ1 at failure with increasing σ3. This behavior is consistent with confinement suppressing the opening and propagation of tensile microcracks, thereby requiring a higher axial stress to initiate macroscopic failure.
The most strongly supported σ1–σ3 relationship was obtained for D3 because it contained the largest number of tests. Nevertheless, substantial scatter at identical confinement levels demonstrates that confinement does not remove the influence of initial heterogeneity. Mineral composition, grain size, fabric orientation, microcracking, and local specimen defects remain important controls.
The ci and φi values derived from triaxial tests describe a conditional strength envelope for intact rock within the tested σ3 range. They must not be equated with the shear resistance of natural discontinuities or with equivalent rock mass parameters. Extrapolation outside the tested confinement range also requires caution because a linear approximation may not reproduce nonlinear behavior at very low or high confinement.
For D1, D2, and D4, the fitted envelopes remain preliminary because of limited specimen numbers and insufficient replication at individual σ3 levels. R2 must be interpreted together with sample size, number of pressure levels, and result dispersion. A high R2 based on a few mean points does not establish statistical robustness; ci and φi for small samples should therefore be used as indicative ranges rather than definitive domain constants.
4.3. Interpretation of Natural Discontinuity Shear Resistance
Direct shear results demonstrate the fundamental difference between intact rock strength and the resistance of natural discontinuities. Apparent cohesion is generally only a few tenths of a megapascal, and φj is substantially lower than friction parameters derived from triaxial failure envelopes of intact rock. Separate representation of rock material and discontinuity properties is therefore essential.
D3 provided the most representative set of shear surfaces. Its cj range of 0.01–0.42 MPa indicates substantial variability in natural surface conditions, potentially associated with roughness, infill composition, wall alteration, actual contact area, and previous displacement. Because JRC, surface morphology, infill thickness, and weathering were not incorporated quantitatively into a unified model, the observed scatter cannot be attributed uniquely to any single factor.
Only one natural surface was tested for D2 and two for D4. These sample sizes are insufficient for statistically defensible inter-domain ranking. The measured values describe only the tested specimens and must not be generalized to the complete domains without additional verification; an extreme value may reflect the morphology of one surface rather than a systematic domain characteristic.
At least four to five independent natural surfaces should be tested in each underrepresented domain. Each test should document surface orientation, JRC, wall condition, infill type and thickness, weathering, and evidence of previous displacement. Where nonlinear behavior occurs, both peak and residual resistance should be evaluated because a linear Mohr–Coulomb approximation may not fully represent roughness effects over a range of normal stresses.
4.4. Transition from Specimen Properties to Calculated Rock Mass Parameters
Rock mass parameters were calculated to present the adopted upscaling scheme transparently and to resolve the previous inconsistency between retained and reduced strength. Laboratory-derived intact rock properties were combined with adopted GSI and D values within the Hoek–Brown framework.
GSI values were taken from the original geotechnical documentation and interpreted as having been derived from borehole data. However, the primary classification sheets, scaled photographs for all intervals, and independent reassessments were unavailable. The calculated rock mass parameters therefore cannot be regarded as experimentally verified in situ properties; they are scenario estimates dependent on the adopted classification and intact rock inputs.
The complementary retained-strength and weakening indices satisfy:
This formulation eliminates the previous logical contradiction in which retained and reduced percentages did not form a complete balance. The calculated retained equivalent strength of approximately 5.4–9.6% of laboratory UCS must be interpreted solely as the outcome of the adopted model and does not imply that actual rock mass load-bearing capacity is a fixed fraction of intact specimen strength.
Scale separation was maintained throughout the study. UCS, BTS, E, ν, triaxial results, and direct shear results refer to the tested specimens. Rock mass characterization additionally requires discontinuity frequency, orientation, persistence, and condition; RQD; blockiness; a documented GSI range; disturbance; and the acting stress field. The transition from laboratory properties to rock mass parameters is therefore model-dependent rather than a direct experimental upscaling.
4.5. Sensitivity of Equivalent Rock Mass Strength to GSI
At D = 0, conditional σcm increased nonlinearly with GSI in all domains. The convex form of the curves in Figure 10 indicates that the effect of GSI uncertainty becomes more pronounced as rock mass quality improves. A change of several GSI points produces a relatively limited response at low GSI but a substantially larger change at higher GSI.
At the adopted baseline values, σcm is approximately 14.0 MPa for D1, 15.8 MPa for D2, 16.2 MPa for D3, and 11.0 MPa for D4. The proximity of the D2 and D3 curves reflects similar sensitivity over comparable GSI ranges, whereas the lower D1 curve reflects differences in intact rock inputs. D4 exhibits a relatively steep increase but predominantly occupies the lower-to-intermediate GSI range.
Varying GSI by ±5 points changed σcm substantially: decreasing GSI reduced calculated strength by approximately one quarter, whereas increasing it raised strength by approximately one third. The exact response depends on the domain and its position on the nonlinear curve. Ranking domains using single σcm values without an uncertainty range is therefore not robust.
A reproducible GSI procedure should include interval-based geotechnical core logging, scaled photographs, assessment of blockiness and discontinuity conditions, and independent evaluation by at least two specialists. Lower, central, and upper GSI bounds should be used in calculations instead of a single deterministic value. Reporting a σcm range more appropriately represents classification uncertainty and avoids false precision.
4.6. Study Limitations and Future Work
The principal limitation is the unbalanced dataset. D3 is much better represented than D1, D2, and D4, limiting statistical comparability. Particularly small samples were available for direct shear in D2 and D4 and for selected triaxial and deformation series. Future work should balance the domain datasets and include at least four to five independent shear surfaces in each underrepresented domain.
A second limitation is the high variability of E, UCS, and several other properties. The most pronounced dispersion occurs in D4 Young’s modulus and in selected strength datasets. Potential outliers should not be removed solely on statistical grounds. Exclusion is justified only by a documented preparation error, geometric nonconformity, equipment malfunction, or deviation from the test procedure; otherwise, extreme values should be retained as possible expressions of natural heterogeneity.
A third limitation is the absence of a fully reproducible structural model and of the primary information used to assign GSI. Subsequent assessment requires oriented drilling or reconstruction of discontinuity orientation, interval-specific RQD and fracture frequency, and systematic description of blockiness, roughness, infill, and wall alteration. GSI should be assigned as a range using combined core, photographic, and field evidence and independently checked.
A fourth limitation is the absence of joint verification against in situ stresses, deformations, and observed excavation response. The present results characterize laboratory properties and scenario-based upscaling but do not confirm the stability of specific excavations. Future work should determine the stress state, document excavation geometry and orientation and installed support, and compare model predictions with in situ monitoring.
Despite these limitations, the study establishes a coherent multilevel database that separates intact rock properties, the resistance of natural discontinuities, and model-derived rock mass parameters. This separation prevents direct mixing of parameters from different scales and provides a basis for statistical refinement of the domain model and subsequent field verification.
5. Conclusions
This study established a domain-based laboratory characterization of intact rock properties, shear resistance along natural discontinuities, and conditionally calculated rock mass parameters for Deposit X. The experimental database comprised 232 records linked to 36 geotechnical borehole identifiers and was subdivided into four domains: D1, beresite-altered granodiorites; D2, diorites; D3, granodiorites; and D4, lamprophyre dikes. This framework enabled the separate interpretation of intact rock properties, natural discontinuity behavior, and model-dependent rock mass characteristics.
Pronounced inter- and intra-domain variability was identified. D1 exhibited the lowest mean UCS of 91.75 MPa, whereas D2 showed the highest mean value; however, the limited sample size does not support its interpretation as a confirmed property of the entire domain. D4 displayed the greatest relative variability in Young’s modulus, with a coefficient of variation of 82.21%. The substantial overlap in UCS and Young’s modulus among the domains indicates that lithology alone is insufficient to predict the mechanical behavior of an individual specimen.
Triaxial tests confirmed that the major principal stress at failure (σ1) increased with increasing confining pressure (σ3) in all domains. The most representative relationship was obtained for D3, which included 38 actual triaxial specimens. The derived ci and φi parameters characterize intact rock only within the investigated confinement range and should not be interpreted as properties of natural discontinuities or the rock mass. In direct shear testing, the mean apparent cohesion was 0.125 MPa for D1 and 0.140 ± 0.083 MPa for D3. Because only one surface was tested for D2 and two for D4, the corresponding values remain preliminary and cannot support statistically robust inter-domain ranking.
Scenario-based Hoek–Brown upscaling yielded retained equivalent rock mass strength fractions of 5.36–9.55% and calculated strength reductions of 90.45–94.64%. These values are outputs of the adopted empirical model rather than direct in situ measurements. GSI values of 48–58 were taken from the technical report without independent reconstruction of the original classification. At D = 0, decreasing GSI by 5 points reduced σcm by approximately 25–26%, whereas increasing GSI by 5 points raised σcm by approximately 33–34%. This sensitivity demonstrates that GSI should be specified as a justified range rather than as a single deterministic value.
The results provide a laboratory–analytical basis for refining the geomechanical domain model but do not independently establish the stability of specific underground excavations. Engineering assessment requires integration with RQD, discontinuity frequency, orientation and condition, reproducible GSI estimates, disturbance effects, in situ stress measurements, excavation geometry, support characteristics, and monitoring data. Further work should focus on balancing sample sizes among domains, expanding the triaxial and direct shear datasets, quantitatively characterizing beresite alteration, and verifying the calculated parameters under in situ conditions.
Author Contributions
Conceptualization, D.-M.S., T.A. and C.D.; methodology, D.-M.S., T.A., R.Z. and C.D.; software, R.Z., B.B. and D.-M.S.; validation, T.A., D.-M.S. and R.Z.; formal analysis, D.-M.S., T.A. and N.S.; investigation, D.-M.S., T.A., R.Z. and C.D.; resources, T.A. and D.-M.S.; data curation, D.-M.S., T.A. and R.Z.; writing—original draft preparation, D.-M.S. and T.A.; writing—review and editing, T.A., C.D., R.Z. and A.D.; visualization, D.-M.S., N.S., B.B. and A.D.; supervision, T.A. and C.D.; project administration, T.A.; funding acquisition, T.A. All authors have read and agreed to the published version of the manuscript.
Funding
This research was carried out within the framework of project AP23489198, “Development of rational technology for conducting and fixing underground mine workings by means in-depth study of stress-strain state and stability”, implemented under grant funding for 2024–2026. The research was funded by the Committee of Science of the Ministry of Science and Higher Education of the Republic of Kazakhstan. Scientific Supervisor: T.M. Almenov.
Data Availability Statement
The data supporting the findings of this study are openly available in this article. All relevant experimental results, statistical parameters, and geomechanical interpretation data are included in the tables and figures of the manuscript.
Acknowledgments
The authors express their sincere gratitude to the Research Laboratory of Geomechanics and Geotechnology of Satbayev University, headed by Serik Moldabayev, for the technical and laboratory support provided during sample preparation, mechanical testing, and processing of experimental materials. During the preparation of this manuscript, the authors used ChatGPT by OpenAI for language editing, grammar correction, formatting improvement, and academic style refinement. The authors have reviewed and edited the output and take full responsibility for the content of this publication.
Conflicts of Interest
The authors declare no conflicts of interest.
Abbreviations
The following abbreviations are used in this manuscript:
| ASTM | American Society for Testing and Materials |
| CV | Coefficient of variation |
| DS | Direct shear test along a natural discontinuity |
| GSI | Geological strength index |
| ISRM | International Society for Rock Mechanics and Rock Engineering |
| JRC | Joint roughness coefficient |
| JCS | Joint wall compressive strength |
| RQD | Rock quality designation |
| SD | Standard deviation |
| TXC | Triaxial compression |
| UCS | Uniaxial compressive strength |
| PMP | Physical and mechanical properties |
References
- Alejano, R.; Perucho, A. (Eds.) Rock Engineering and Rock Mechanics: Structures in and on Rock Masses; CRC Press: London, UK, 2014. [Google Scholar]
- Aydan, Ö. Rock Mechanics and Rock Engineering; CRC Press: Boca Raton, FL, USA, 2020; Volumes 1–2. Available online: https://www.routledge.com/Rock-Mechanics-and-Rock-Engineering-Volume-2-Applications-of-Rock-Mechanics---Rock-Engineering/Aydan/p/book/9781032654294 (accessed on 1 May 2026).
- Wang, S.; Huang, L.; Cai, X.; Song, Z. (Eds.) Mathematical Problems in Rock Mechanics and Rock Engineering; MDPI: Basel, Switzerland, 2023; 262p. [Google Scholar]
- Hoek, E.; Carranza-Torres, C.; Corkum, B. Hoek-Brown failure criterion 2002 edition. In Proceedings of the 5th North American Rock Mechanics Symposium, Toronto, ON, Canada, 7–10 July 2002; Volume 1, pp. 267–273. [Google Scholar]
- Alejano, L.R. Rock mass classification systems: A useful rock mechanics tool often misused. Rock Mech. Rock Eng. 2024, 58, 11147–11167. [Google Scholar] [CrossRef] [Scilit]
- Bołoz, Ł. Interpretation of the results of mechanical rock properties testing with respect to mining methods. Acta Montan. Slovaca 2020, 25, 81–93. [Google Scholar] [CrossRef] [Scilit]
- Kang, H.; Gao, F.; Xu, G.; Ren, H. Mechanical behaviors of coal measures and ground control technologies for China’s deep coal mines: A review. J. Rock Mech. Geotech. Eng. 2023, 15, 37–65. [Google Scholar] [CrossRef] [Scilit]
- He, M.; Wu, Y.; Gao, Y.; Tao, Z. Advances in rock mechanics for deep mining. J. China Coal Soc. 2024, 49, 75–99. [Google Scholar] [CrossRef]
- Wang, Y.; Zhang, Q.; Yuan, L.; Wang, X.; Wang, S.; Wei, L. Spalling failure mechanism of surrounding rock in deep hard-rock tunnels. Geotech. Geol. Eng. 2024, 42, 7225–7242. [Google Scholar] [CrossRef] [Scilit]
- Mandaglio, M.C. Geomechanical characterization of the rock mass along a deep vertical borehole. Geotechnics 2024, 4, 209–228. [Google Scholar] [CrossRef] [Scilit]
- Waloski, R.; Korzeniowski, W.; Bołoz, Ł.; Rączka, W. Identification of rock mass critical discontinuities while borehole drilling. Energies 2021, 14, 2748. [Google Scholar] [CrossRef] [Scilit]
- Tamames, B.; Preinl, Z.T.; Pérez, M.; Hurtado Sola, J.M.; Vicente, I.; Varona, P.; Triviño, E. Ground characterization and structural analyses for tunnel design. In Proceedings of the ITA-AITES World Tunnel Congress 2019, Naples, Italy, 3–9 May 2019. [Google Scholar] [CrossRef] [Scilit]
- Muralha, J.; Grasselli, G.; Tatone, B.; Blümel, M.; Chryssanthakis, P.; Jiang, Y. ISRM suggested method for laboratory determination of the shear strength of rock joints: Revised version. Rock Mech. Rock Eng. 2014, 47, 291–302. [Google Scholar]
- Barton, N.; Choubey, V. The shear strength of rock joints in theory and practice. Rock Mech. 1977, 10, 1–54. [Google Scholar] [CrossRef] [Scilit]
- ASTM D4543-19; Standard Practices for Preparing Rock Core as Cylindrical Test Specimens and Verifying Conformance to Dimensional and Shape Tolerances. ASTM International: West Conshohocken, PA, USA, 2019.
- ASTM D7012-23; Standard Test Methods for Compressive Strength and Elastic Moduli of Intact Rock Core Specimens Under Varying States of Stress and Temperatures. ASTM International: West Conshohocken, PA, USA, 2023.
- ASTM D3967-23; Standard Test Method for Splitting Tensile Strength of Intact Rock Core Specimens with Flat Loading Platens. ASTM International: West Conshohocken, PA, USA, 2023.
- International Society for Rock Mechanics. Suggested methods for determining the strength of rock materials in triaxial compression: Revised version. Int. J. Rock Mech. Min. Sci. Geomech. Abstr. 1983, 20, 285–290. [Google Scholar] [CrossRef] [Scilit]
- Li, X.; Xue, Y.; Dang, F.; Ranjith, P.G.; Xie, H.; Hou, P.; Cai, C. Microscale damage evolution of high-temperature granite under liquid nitrogen thermal shock based on computed tomography analysis. Eng. Geol. 2025, 356, 108274. [Google Scholar] [CrossRef] [Scilit]
- Xue, Y.; Li, X.; Wang, L.; Liu, Y.; Cao, X.; Zhang, Y. Mesoscopic damage enhancement in granite under cyclic liquid nitrogen shocks characterized by computed tomography and texture analysis. Int. J. Rock Mech. Min. Sci. 2025, 194, 106217. [Google Scholar] [CrossRef] [Scilit]
- Zhanakova, R.; Almenov, T.; Shautenov, M.; Akkazina, N.; Kadukhin, N.; Shabaz, D.-M. Geomechanical Justification of Open-Pit Slope Stability and Beneficiation Process Solutions for Rare Earth and Noble Elements. Minerals 2026, 16, 401. [Google Scholar] [CrossRef] [Scilit]
- Shaiyakhmet, T.K. 3D Modeling of the Beskempir Deposit for the Assessment of Mineral Resources and Engineering Geological Conditions. Ph.D. Thesis, Satbayev University, Almaty, Kazakhstan, 2025. (In Russian) [Google Scholar]
- International Society for Rock Mechanics and Rock Engineering. Suggested Method on Brazilian Tension Test; ISRM: Lisbon, Portugal, 2018. [Google Scholar]
- International Society for Rock Mechanics and Rock Engineering. Suggested Method on Uniaxial Compressive Strength and Deformability of Rock Material, Revised Version; ISRM: Lisbon, Portugal, 2018. [Google Scholar]
- GOST 28985-91; Rocks. Method for Determination of Deformation Characteristics under Uniaxial Compression. Izdatel’stvo Standartov: Moscow, Russia, 2004. [Google Scholar]
- ASTM D5607-16; Standard Test Method for Performing Laboratory Direct Shear Strength Tests of Rock Specimens Under Constant Normal Force. ASTM International: West Conshohocken, PA, USA, 2016.
- Mining Research Group. Laboratory Study of Physical and Mechanical Properties of Rocks at Deposit X according to ISRM Standards; Unpublished Technical Report; Mining Research Group: Karaganda, Kazakhstan, 2020. [Google Scholar]

Disclaimer/Publisher’s Note: The statements, opinions and data contained in all publications are solely those of the individual author(s) and contributor(s) and not of MDPI and/or the editor(s). MDPI and/or the editor(s) disclaim responsibility for any injury to people or property resulting from any ideas, methods, instructions or products referred to in the content. |
© 2026 by the authors. Licensee MDPI, Basel, Switzerland. This article is an open access article distributed under the terms and conditions of the Creative Commons Attribution (CC BY) license.