


Abstract
This study develops two independent energy transition indices, the Global North energy transition index (GNETI) and the Global South energy transition index (GSETI), using principal component analysis (PCA) to evaluate energy transition performance during the period 2013–2022. Each index was calculated independently using a balanced panel of 70 observations, corresponding to 7 countries observed over 10 years. The Global North sample includes Denmark, Germany, Sweden, Japan, Canada, the United Kingdom, and the United States; while the Global South sample includes India, Brazil, South Africa, Indonesia, Mexico, Colombia, and Ghana. For the Global North, PCA results show that explains 59.68% of the total variance, while and describe 21.10% and 17.42% of the total variance, respectively. The first two components account for 80.78% of the total variance, while the first three components explain 98.20%, confirming the robustness of the index structure. The 2022 GNETI values indicate that Sweden has the highest performance (100.00), followed by Denmark (71.01), Canada (66.50), the United Kingdom (40.51), Germany (36.46), the United States (34.45), and Japan (11.86). The PCA results show that , , and explain 58.76%, 21.99%, and 9.63%, respectively, of the total variance. The cumulative variance described confirms the adequacy of the PCA approach for constructing the GSETI. In 2022, the highest GSETI values were observed in Ghana (90.39), Colombia (85.06), Brazil (70.98), India (59.00), Indonesia (52.97), Mexico (47.72), and South Africa (18.70). The findings indicate significant regional differences in the pathways of energy transition, based on variability in technological capability, renewable energy uptake and resources, energy security levels, and the fundamental structure of state energy systems.
1. Introduction
The global energy transition is one of the most fundamental and radical structural transformations of the 21st century. Drawing heavily on international climate governance frameworks like the United Nations Framework Convention on Climate Change, formalized through the Paris Agreement, countries of different stages of economic development have committed themselves in a strategic manner to deep decarbonization, expanding renewable energy capacity and overhauling energy infrastructures. While in the international literature, this transformation has been described in the language of policy as a technological substitution of technology exchanging fossil fuels for renewable energy technology, recent arguments argue that the transition is far more complicated and more than just this, involving various trade-offs with an economic, social, institutional and geopolitical context [1,2,3]. The literature highlights that energy transitions read decarbonization as a socio-technical process determined by political economy, institutional configurations, and power relations. Geels et al. (2017) inform that deep-rooted decarbonization requires re-organizations of production, consumption and governance systems on a systemic level [4]. In turn, Sovacool et al. (2020) state that the transition is characterized by variable socio-economic impacts mediated by domestic institutions and social contracts [5]. Recent political economy findings emphasize policy credibility, industrial strategy and financial framework as determinants of transition pathways, lending credence to the idea that decarbonization is structurally entwined within national development models [6,7]. Large percentages of renewable electricity should be technically possible in wealthy industrial countries, even though additional analysis indicates that increasing the level of penetration raises both the costs associated with system integration and co-operation difficulties. Many studies note that with more and more variable renewables, grid expansion, balancing services, and storage requirements evolve in a nonlinear fashion [8,9,10]. Reliability under the high renewable scenarios called for in the International Energy Agency (IEA—World Energy Outlook 2023) would involve heavy investments in transmission infrastructure, digitalized grid management, and market redesign. These constraints show that the transition bottlenecks in advanced economies are not only technological [11,12], but they are also systemic and institutional. At the same time, the reshuffle of carbon-intensive sectors will generate distributional tensions that will condition political feasibility. The decline in coal, oil, and gas operations results in less regional employment, a decrease in financial earnings and loss of industry competitiveness [13]. Sovacool et al. (2020) reported that these uneven effects often spark resistance unless credible, just transition mechanisms exist [5]. This dimension underpins that decarbonization is a social issue, and for political policies to sustain that, a wide range of processes should be linked, including labor displacement, regional inequity and public legitimacy. Beyond domestic political economy dynamics, the transition is also reconfiguring global interdependencies. To advance in the development of clean energy technologies, it is necessary to have critical minerals, including lithium (Li), cobalt (Co), nickel (Ni), and rare earth elements, whose extraction and processing are geographically concentrated [14,15]. According to new data released in 2024 from the International Renewable Energy Agency, supply chain concentration and global strategic competition over material resources in the energy transition are shaping geopolitics nowadays [16]. This transition represents a shift in global energy geopolitics away from fossil fuel reserves toward control over technology manufacturing and mineral value chains [17].
These dynamics call attention to how the energy transition is a multidimensional structural shift encompassing technological transformation, institutional capacity, socio-economic redistribution, industrial restructuring, and geopolitical realignment [18,19]. Realizing the complexity, an increasing body of literature has developed composite indicators for measuring and comparing energy transition performance at the country level. The energy transition index from the World Economic Forum, for example, measures indicators of system performance and transition readiness to benchmark national progress [20]. Similarly, Sovacool et al. (2020) construct multi-faceted metrics of energy security and sustainability to compare the performance of national energy systems [5]. At the methodological level, Organization for Economic Co-operation and Development (OECD) and Nardo et al. (2005) propose basic rules for the construction of composite indicators, with steps for normalization, weighting and aggregation that are generally adopted in energy transition measurement methods [21].
However, while these measures have important analytical implications, the existing measurement methods are primarily made up of aggregated or universal indicator structures, which assume an implicit concept of structural comparability among countries. If advanced and emerging economies are aggregated into a single composite grid, these indices run the risk of conflating the levels of economic development with the performance of transition. As a result, structural asymmetries in institutional capacity, productive structure, fiscal space, and technological specialization may be obscured and impact the realization of the relevant constraints shaping differentiated pathways to decarbonization. This limitation emphasizes the criticality of capturing structural heterogeneities as an explicit factor in assessments of energy transition dynamics across country groups [22,23].
Despite their useful analytical capabilities, current frameworks for measuring energy transition performance are also widely criticized for limiting their applications. The majority of global indices use one aggregate model (i.e., structural comparability between countries with very different stages of development) and combine advanced and emerging economies. This might confound development and transition performance to the extent that the majority of the variances in composite scores may be controlled for differences in income, technological capacity and institutional quality [24]. In addition, many indicators are based on predetermined or expert-based weighting strategies with the subsequent assumptions, and therefore, construct validity is reduced [21]. Moreover, the existing framework also focuses on outcome variables (e.g., emissions intensity and renewable energy shares) that may be underrepresented and are out of congruence with other structural variables, like the structure of production, labor market exposure to carbon-intensive industries, and asymmetric integration into global clean technology value chains [22].
To address these limitations, this study develops and estimates two structurally differentiated composite indices of energy transition performance for developed and emerging economies. The indices capture three interrelated dimensions of structural transformation: (i) institutional and fiscal capacity to manage system integration and infrastructure expansion; (ii) production structure and labor market exposure to carbon-intensive sectors; and (iii) the degree of integration into global value chains for clean technologies and critical minerals. By separating country groups prior to estimation and using data-driven multivariate techniques, the analysis improves construct validity, reduces development bias, and provides a theoretically consistent framework for comparing energy transition trajectories under asymmetric development conditions. The novelty of this study lies in the development of renewable energy transition indices based on a unique combination of indicators that, to the best of the authors’ knowledge, has not been previously applied in the renewable energy transition literature. In particular, the index for the Global South incorporates an -based measure of renewable energy diversification, capturing the heterogeneity of renewable energy sources. This indicator is not available as a pre-calculated measure in existing international databases and has not been commonly included in previous transition indices. Furthermore, the use of separate principal component analysis (PCA) models for the Global North and Global South allows the derivation of region-specific weighting structures, thereby accounting for differences in transition dynamics across heterogeneous economies. As a result, the proposed framework provides a more context-sensitive assessment of renewable energy transition pathways than conventional global indices.
2. Materials and Methods
2.1. Background
The energy transition refers to the long-term transformation of energy systems from fossil fuel-based production and consumption patterns toward low-carbon and renewable sources. It is shaped by technological advances and markets, as well as by climate policy commitments under frameworks such as the United Nations Framework Convention on Climate Change and the Paris Agreement. This change, in contrast to earlier transitions, is normatively focused on decarbonization, sustainability and resilience [19,25,26]. The metaphor of the energy transition as an iceberg, as illustrated in Figure 1, reflects the asymmetry between technological gains to be obtained and the more profound structural changes needed to establish sustainable decarbonization. The visible tip is mainly in the electricity sector, which makes up about 20% of global final energy consumption and is relatively easier to decarbonize owing to mature and more cost-competitive technologies like solar, wind, and battery storage [27,28]. The surface layer dominates policy discourse, since it provides measurable indicators in terms of progress, installation and uptake of renewable capacity and electrification rates. However, under the surface, it remains the residual 80% of energy consumption, which is focused on industrial heavy energy use, freight transportation, aviation, shipping, and other uses that require very high temperature heat or high-energy-density fuel sources. These sectors are much harder to decarbonize and require considerable technical, infrastructural and industrial change [28,29,30]. Meanwhile, the submerged part of this iceberg encompasses institutional capacity, regulatory coherence, financial mobilization, labor market adaptation, and geopolitical positioning, which together condition the scalability and sustainability of technological transitions. For net zero to be realized, there will be a two-fold challenge: speeding up electrification wherever technologically and economically viable and, at the same time, designing and deploying low-carbon molecules, such as green hydrogen and advanced biofuels, for those sectors that cannot easily be electrified [26,27,31].
Figure 1.
The energy iceberg metaphor.
The submerged part exhibits system integration issues, including grid flexibility, market redesign, and investment coordination, as the IEA’s most recent analysis has reported. It also involves distributional tensions, including regional job losses in carbon-intensive industries and the demand for just transition policies. Additionally, it implies that new, interrelated geopolitical relationships in critical minerals supply chains are emerging, which the International Renewable Energy Agency (IRENA) is considering within its material security and global value chains assessments [15,32]. This iceberg metaphor reflects the reality that deploying technology is not sufficient to grasp the energy transition. The degree of sustainability of this transformation will depend on institutional capacity, adaptability of economies, inclusiveness of social policies, and countries’ strategic positioning in global production networks. Therefore, such comparisons to this extent should be focused on the set of structures that foster or hinder decarbonization paths [33].
Historical energy balances of previous decades and forward-looking decarbonization scenarios make clear the size of the submerged challenge. Total energy supply is mainly in the hands of fossil fuels, according to the IEA’s report for 1990–2022. The absolute consumption of oil, coal, and natural gas has not declined globally. In fact, the total primary energy demand has increased at a pace comparable to economic growth, especially in emerging economies, despite the fast growth of renewable capacity, percentage-wise. It showcases inertia in capital-intensive energy systems, extended lifespan of assets in power and industrial plants, and enduring dependence on fossil fuels for transportation, petrochemicals, and heavy industry. Renewable growth, hence, primarily enhanced rather than completely replaced fossil-based supply [33,34].
Even for electricity, there is engineering complexity to be considered. Fueled by significant cost savings and supportive policy foundations, solar photovoltaics and wind power have exploded in size in the last decade. Nonetheless, according to statistics by the IEA for 2023, coal electricity generation is the world’s single largest source of electricity, which implies that generation fleets are established and turnover is slow. The shift of large quantities of firm fossil generation is further impacted by constraints from grid integration and dispatchability, seasonal variation, and capacity balancing. It highlights that scaling out variable renewables demands further investments, including in transmission expansion, storage technologies, demand-side management, and system flexibility [33,34,35,36]. Pathways to long-term transformation compatible with the Paris Agreement suggest a structural inversion of the global energy system. Concerning the 1.5 °C scenario, the IRENA expects the share of fossil fuel consumption in total energy supply to fall from roughly 82% in 2022 to near 16% by mid-century, and the share provided by renewables must rise from about 14% to about three-quarters of total supply. The quantitative gap between the existing fossil-intensive baseline and the required renewable-dominant architecture shows the extent of the hidden energy system challenge that lies under the surface [36,37,38].
2.2. Drivers of Change in the Energy Transition
The energy transition is driven by a multidimensional set of structural forces acting concurrently in the environmental, technological, economic, political, and social domains [39]. Instead of emerging through a single causal mechanism, decarbonization arises from the combination of interlocking forces reshaping incentives, infrastructure, and institutional arrangements. This process is organized into six interdependent determinants, whose forces drive systemic change toward low-carbon energy systems, as shown in Figure 2.
Figure 2.
Multidimensional drivers of the energy transition.
With scientific consensus supporting it, and extreme events giving material outcomes, the regulatory and policy impetus is firmly based on environmental and climate pressures. This has triggered binding international commitments (UNFCCC, Paris Agreement) that institutionalize decarbonization goals through nationally determined contributions, net-zero emissions commitments and increasingly stringent emissions standards, embedding climate risk in financial regulation and corporate disclosure systems [40]. Furthermore, technological innovations have made large-scale decarbonization technically more feasible due to new developments in renewable energy generation and storage technologies, including the progressive increase in photovoltaic efficiency, wind capacity factors, battery performance and digital grid management systems, which drive down the systemic cost and extend the integration potential. The learning curve and economies of scale have made it possible for renewables to become competitive against fossil fuels, creating positive feedback for political ambition and use [41,42,43].
Energy security issues and geopolitical considerations are also important factors that act as significant accelerators, as home-grown renewable assets become increasingly relevant with volatile markets for fossil fuels and concentrated supply chains. A diversification strategy has led to less reliance on imported hydrocarbons and increased long-term resilience (IEA), while IRENA maintains that the transition brings new geopolitical contexts involving critical minerals and clean technology manufacturing, restructuring global interdependence and industrial competition [16,32,44,45].
On the other hand, economic competitiveness has become a significant structural force in this process. The decrease in the levelized cost of electricity associated with solar and wind power-based technologies has made these promising as cost-effective and competitive options in several markets. With less investment in capital expenditures and a more stable economic position, renewable investments will deliver predictable costs and, thus, less risk of fuel price volatility, enabling decarbonization to be in line with industrial plans, investment in renewable energy and macroeconomic modernization policies beyond green initiatives [45,46].
Moreover, the coordination of regulation and policy through regulatory and policy drivers is critical. As a matter of fact, market signaling tools (e.g., carbon prices, renewable portfolio standards, tax credits, feed-in tariffs, and green public procurement) draw in private investment and provide stability in investment access [47]. In turn, regulatory reform in grid access and the design of the electricity markets ensure that the energy mix can diversify and enjoy more efficient utilization. Political credibility and institutional stability are also key factors that determine the route of transition [48,49,50].
Finally, social and corporate demand follows formal regulation: people are increasingly more aware of climate risks, and demand for clean energy, as well as corporate commitments to environmental, social and governance standards, are driving renewable and low-carbon consumption, corporate power purchase agreements and voluntary net-zero targets channel investment flows and place decarbonization as a strategic imperative. Therefore, social legitimacy and stakeholder participation are a prerequisite of political support for the long-term process of transformation [51].
2.3. International Frameworks Driving the Energy Transition
International frameworks provide the institutional underpinnings of the global energy transition, integrating national efforts into a shared normative, technical, and financial architecture. They serve wider functions than simply replicating the substitution of technologies, since they lead the way in long-term decarbonization, accountability frameworks and common standards that reduce fragmentation across jurisdictions. Governance here follows the United Nations Framework Convention on Climate Change, a multilateral forum for climate negotiations and transparency mechanisms. Its operationalization via the Paris Agreement institutionalizes nationally determined contributions, long-term temperature targets and the global stock take process, and it collectively positions energy transition strategies within measurable commitments [52,53,54].
As depicted in Figure 3, this worldwide architecture occurs in six interconnected functions that underlie contemporary energy governance. First, international frameworks set technical and regulatory parameters for renewable energy and efficiency, such as safety criteria, system performance, and guidelines for integrating variable sources, as well as for interoperability to reduce regulatory risks. Secondly, they steer the construction of sustainable energy systems by incorporating universal access, efficiency, emission reduction, and development goals as a coherent and cohesive structural transformation framework.
Figure 3.
Strategic pillars for a sustainable energy future.
Third, these frameworks support an ethical and just transition through consideration of equity, mitigation of labor impacts, and responsible sourcing of critical minerals for clean technologies, and they ensure that decarbonization does not exacerbate existing inequalities. Fourth, they achieve global co-operation via regulatory harmonization, cross-border electricity trade, and mobilization of climate finance through instruments such as the Green Climate Fund and multilateral development banks, thus bridging the gap between climate ambition and implementation capacity, particularly in the Global South.
The fifth purpose works toward technological innovation and energy digitalization. The IEA and the IRENA are among the organizations that set roadmaps and regulatory guidelines on smart grids, storage, hydrogen, sector coupling, and artificial intelligence (AI) applications in energy management, reducing technological fragmentation and helping the maturation of emerging solutions in hard-to-decarbonize sectors. Lastly, international frameworks promote resilience of energy infrastructure by integrating climate adaptation criteria, risk management, and the planning of extreme events to ensure systems are both low-carbon and resilient against physical and geopolitical shocks [55,56].
2.4. The Global North and the Global South
The terms Global North and Global South are applied to refer to the structural inequalities of the contemporary international system, rather than being a form of classification and representation, and do not consider only geographical issues. These terms are analytical clusters that interconnect economic, historical and political components. Countries of high industrialization, high per capita income, high technological capacity, and leadership across the globe are generally referred to as the Global North. This mostly accounts for the US, Germany and Japan, as well as other states with economic might and high human development indices. These countries have also helped determine international financial institutions, global trade rules, and essential multilateral institutions [57,58].
The Global South, however, refers to countries across Africa, Latin America, Asia, and Oceania that, while independently their own, have historically had a common trajectory, defined as such by colonialism, economic dependency, and late or uneven development. This term does not refer to a homogenous grouping but rather to a political category that points out asymmetries of global power. Brazil, India, South Africa, and Mexico are cited as some of the leading players in the Global South because of their unique position as emerging economies or due to the fact that they have taken a much fuller role in calling for shifts in the international financial and political architecture. Most of these countries are still grappling with persistent challenges related to social inequality, economic vulnerabilities, and dependency on primary commodities, but they have experienced rapid gains and productive diversification.
This dichotomy between north and south should not be confused with geographic hemispheres. Australia and New Zealand are located in the Southern Hemisphere, but they belong to the Global North because of their high levels of development and integration into advanced economies. In contrast, while nations like China and India are in the Northern Hemisphere, they are often positioned within the Global South based on their historical position in the international order and their tendency to take a more multi-polar political position [57,59].
2.5. Development and Estimation of Indicators for Energy Transition Performance
The current study takes a comparative, quantitative paradigm anchored in the structural political economy of energy. Energy transition is regarded not only as a technological change, but a transition conditioned by differentiated productive, fiscal, financial, and geopolitical forces. In this context, the aim is to develop two different synthetic indices that enable the analysis of energy transition processes in structurally diverse settings.
The first index is the Global South energy transition index (GSETI), which was constructed for nations in the Global South that exhibit persistent structural constraints, including fiscal limitations, dependency on the export of primary commodities, external vulnerability, and lower endogenous technological capacity. Such conditions influence both the speed and depth of the energy transition [57,58].
The second index, the Global North energy transition index (GNETI), was developed specifically for the Global North countries in which advanced economies have greater fiscal space, consolidated technological infrastructure, deeper capital markets, and more stable regulatory frameworks, all of which can lead to comparatively stronger institutional and financial support for decarbonization processes. The methodological decision to create two separate indices is made by means of a criterion of structural validity. The energy transition does not happen solely based on a single starting point of capabilities. In contrast, it occurs in the context of systemic asymmetries related to relative costs, technological pathways, and policy feasibility. If a factorial model were then applied to both groups at the same time, it would implicitly give rise to an assumption of structural equivalence in divergent development levels, introducing measurement bias, but also conflating relative performance with preexisting structural endowments [57,60].
The analysis was run between 2013 and 2022, with the global climate regime, particularly after the Paris Agreement, falling under consolidation. Thus, this temporal profile highlighted an era in which climate pledges came to be increasingly operationalized in national policy guidelines, in renewable energy investments and in regulatory reforms, representing a relatively coherent institutional context for longitudinal comparison.
2.5.1. Conceptual Delimitation of the Indices
Energy transition is a complex socio-technical process conditioned by economic structures, institutional capacities, and technological asymmetries [4]. The recent literature on energy transition metrics highlights that approaches using a single global index tend to conflate structural development effects with performance indicators, introducing interpretive biases when comparing highly heterogeneous countries. Consequently, the design of differentiated metrics for countries with systemic constraints versus those with consolidated capacities is methodologically robust and consistent with socio-technical systems theory [48,61].
2.5.2. Global South Energy Transition Index (GSETI)
The GSETI evaluates the extent to which energy transformation is possible under structural restraints, and it highlights systemic constraints as the condition that sets the stage for the transition in developing economies. This concept is consistent with that described in this work on how limitations on economics, productivity and innovation shape the pathways to technology adoption in emerging economies [62,63].
The GSETI is structured around multiple dimensions like renewable transformation, environmental pressure, energy inclusion, structural efficiency and diversification resilience. Each dimension is a distinct but interconnected component of systemic transition capacity, and its operationalization can be captured by empirically observable indicators [23]. The renewable transformation dimension describes the extent to which energy systems are structurally moving toward low-carbon sources. This reflects renewables integration into final energy demand, indicating gradual increments on top of electricity generation alone. In GSETI calculations, the renewable share () of final energy consumption (%) is calculated using Equation (1).
In contrast to the electricity-only indicators, this variable evaluates renewable penetration into all final-use sectors of consumption, including but not limited to industry, transport, and residential consumption. Higher values are a sign of much deeper, structural shifts, moving beyond isolated, sectoral improvement across levels. This dimension measures the extent to which fossil-based energy systems are being displaced at the economy-wide level.
The second dimension, environmental pressure (), is operationalized in terms of CO2 emissions per capita (tCO2 per capita). It is calculated as the total territorial emissions divided by population, as described in Equation (2). Defining emissions on a per capita basis helps maintain comparability between countries of varying size, as well as acknowledging the effect of the distributional nature of the carbon-intensive patterns of development.
The indicator captures the carbon burden associated with prevailing energy consumption structures and provides insight into the stage and composition of a country’s emissions profile. Although per capita emissions in the Global South generally remain below those of advanced economies, upward trends may signal increasing risks of carbon lock-in if fossil fuel-based infrastructure continues to expand [64]. By incorporating this measure, the index accounts for current environmental pressure and prospective transition vulnerabilities, thereby linking present emission levels to long-term structural risks in development pathways.
The third dimension captures the social pillar of the energy transition through access to electricity () in % of population, which is calculated as shown in Equation (3).
Access to electricity is a cornerstone of a fair energy transition, and it is especially critical in developing regions where structural energy poverty has long persisted. Predictable electricity distribution is associated with poverty reduction and other benefits to health, education and productive inclusion, as well as overall human development progress of society. Consequently, increasing access needs to be regarded as an essential part of sustainable and inclusive transition strategies instead of an add-on policy goal.
The decarbonization literature on energy justice highlights that decarbonization must be paired with distributive and development issues. Jenkins et al. (2016) introduce energy justice through the distributional, procedural, and recognition dimensions and argue that transitions should take into account justice issues associated with issues of access to energy services through the prism of distribution, procedures and recognition [65]. Additionally, Carley and Konisky (2020) argue that without explicit equity safeguards, such clean energy transitions can reproduce—or even widen—the existing socio-economic disparities [24]. From this point of view, having universal access to electricity serves as a quantifiable proxy for the universality of the energy system. The index explicitly addresses the justice factor of sustainability by considering access to electricity, demonstrated in Equation (3). This will ensure that transition performance is measured by environmental pressure, technical transformation indicators, and distributive outcomes. In this process, the framework acknowledges that an energy transition can be successful if it not only promotes decarbonization but also allows for widespread access to current, reliable, and affordable energy services. On the other hand, the fourth dimension measures structural efficiency and an economy’s ability to convert energy inputs into economic output. This dimension indicates the efficiency of utilizing energy resources in economic functioning so that growth, or the lack thereof, occurs via energy-intensive expansion, or by employing newer, more efficacious technologically advanced processes. This can also be observed in developing countries, which tend to have high energy intensity, which is generally explained by technological rigidity, limited industrial upgrading opportunities and/or industrial specialization in energy-intensive sectors. Therefore, structural energy efficiency constitutes a critical aspect for the explanation of the technological maturity of productive systems [66]. This dimension is operationalized by Energy Intensity (), which is calculated in megajoules per constant 2015 USD, adjusted for purchasing power parity-PPP (MJ per 2015 USD PPP). Formally, it is reported as the total energy use divided by real Gross Domestic Product (GDP) expressed in PPP terms (Equation (4)).
The PPP-adjusted GDP, which integrates the levels of prices across countries and exchange rate distortions from the IEA’s framework, enables systematic comparison across multiple developing economies at the structural level. Larger values correspond to less structural efficiency. The higher the value is, the higher the structural energy dependence per unit of real output, and lower technological upgrading and productive specialization per energy-intensive sector will be followed by this higher value [66].
Ultimately, the fifth dimension examines the heterogeneity of renewable sources of energy that could be ascertained if using the Herfindahl–Hirschman Index () based on renewable diversification (applied to renewables) through Equation (5).
where is the share of each renewable source j, like hydro, solar, wind, biomass, or geothermal, in the renewable generation of power. In this regard, for formalities, is the ratio between electricity produced from source j and all electricity produced from renewable sources. The computes how much of the fraction of the power of the renewable portfolio this share has by squaring and summing these shares. The index is unitless, with values ranging between 0 and 1, where higher values indicate concentration by one technology and lower values refer to a better diversified and balanced renewable mix.
The combination of the framework to estimate technological composition is empirically and conceptually well supported in the literature on the recent energy transition. The index is currently being adopted to measure how electricity generation is divided among the renewable sources, and diversification is an important structural characteristic that has been observed to enhance system resilience and decarbonization benefits. Recent system-level assessments highlight that the reliability of the diversified renewable portfolio is significantly enhanced, and the structural exposure to supply disruptions is considerably reduced [44,45]. A diversified renewable portfolio lowers exposure to source-specific variability, such as hydrological variability in hydro-dominant systems or seasonal variability in solar and wind generation, reducing dependence on any one resource, and it helps mitigate against energy-intensive industries. Distribution across technologies, with distinct production profiles, allows for operational flexibility and increases systemic stability under conditions of uncertainty (e.g., high penetration renewable systems).
Moreover, recent empirical analysis suggests that the internal configuration of the energy mixture affects broader sustainability and security outcomes. Based on global comparisons, countries with more balanced renewable models usually demonstrate both better adaptive capacity as well as more successful integration performance compared to the concentrated systems, which are more susceptible to climate-related volatility and infrastructure stress [44,45]. This evidence highlights the structural character of renewable generation, which is a dynamic underpinning of the system’s durability as opposed to a passive characteristic. Because of HHI and the aggregation of renewable shares through it, the index combines the scale of renewable deployment as well as the structural quality of the transition, which separates trends that are oriented towards technological concentration from those maintained by balanced and resilient portfolios.
2.5.3. Global North Energy Transition Index (GNETI)
As a reference, the GNETI assesses the depth, efficiency, and strategic autonomy of decarbonization processes among developed economies, where universal energy access and minimum investment capacity are largely consolidated. In such settings, the energy transition is less constrained by structural deficiencies and more shaped by technological sophistication, carbon efficiency, innovation intensity, and external energy exposure. Consequently, GNETI prioritizes mitigation performance, system decarbonization, technological leadership, and energy security, which is consistent with the literature on deep decarbonization pathways. This index is structured around five theoretically grounded dimensions [38,56].
The original component of the GNETI, the first dimension, captures the structural incorporation of renewable energy into the final energy demand. Conceptually, this dimension mirrors the renewable transformation dimension used by the GSETI, as both indices assess the extent to which fossil-based energy consumption is being substituted by renewable sources across end-use sectors. Nonetheless, in the Global South context, this dimension covers structural transformation capacity, but in the Global North, it is mainly a reflection of the depth and maturity of decarbonization processes involved in consolidated energy systems. In developed economies, such a transition involves decarbonizing electricity generation, as well as transforming heating, transport, and industrial consumption patterns. This higher level of renewable penetration is, therefore, indicative of substituting fossil fuels in the wider final demand sectors, demonstrating structural decarbonization beyond the power sector alone [30]. This dimension gets operationalized as the proportion of renewable resources consumed in final energy consumption (%), which can be described in Equation (1). This indicator is presented as a percentage (%), and higher numbers signify more structural decarbonization and higher penetration of low-carbon energy throughout the economy.
The second dimension records the carbon content of final energy consumption. Although a few macro-level measures emphasize emissions per unit of GDP or sectoral output, final energy carbon intensity measures energy system decarbonization effectiveness by estimating the emissions associated with the energy that is actually consumed across transport, industry, residential, and commercial sectors. This attention also reflects recent mitigation work that underlines fundamental systemic changes in fuel use and quality of electrification as principal factors for accelerated decarbonization [48]. In contrast to GDP-normalized measures, final energy carbon intensity isolates the performance of the energy system for comparison with emission profiles, regardless of economic growth or contraction. This is important for developed economies with more standardized energy access and production, but a policy challenge is to lower carbon intensity in absolute terms, not to drive up the rate of access. This aspect is measured by the final energy carbon intensity () indicator that records the emissions of CO2 per unit of final energy consumed. The indicator is calculated as given in Equation (6).
The indicator is expressed in grams of CO2 per megajoule (gCO2/MJ), where the numerator represents total CO2 emissions associated with final energy consumption. In turn, the denominator corresponds to total final energy use across end-use sectors.
The smaller the value of this indicator, the greater the reduction, in a structural sense, in the carbon content of energy consumed (i.e., the energy in one unit—as in final energy—provides economic and social services with a smaller emission level). Usually, this decline can be traced through three linked activities, including: (i) fuel switching, which replaces carbon-intensive fuels, such as coal and oil, with alternative lower-carbon products (e.g., natural gas, renewables, and low-carbon electricity); (ii) sectoral electrification, particularly in the transport, heating, and industry fronts, in association with the decarbonization of the power sector; and (iii) the spread of low-carbon technologies and improvements in end-use efficiency that diminish combustion-based energy consumption. Because the figure calculates emissions by energy unit, and not according to GDP, decreases cannot simply be attributed to an economic downturn or structural deceleration. In this regard, it is a manifestation of real changes in the structure and technology of the energy sector. In that sense, falling final energy carbon intensity is considered a robust proxy of effective end-use decarbonization and alignment with net-zero pathways [67].
The third dimension, renewable electricity self-sufficiency, reflects the extent of a nation’s generation of renewable electricity, meeting its domestic electricity demand and integrating decarbonization performance with strategic energy autonomy. Transport, heating, and industrial processes, especially large-scale electrification, are now well-accepted as a key component of deep decarbonization strategies in advanced economies. It is important to note that electrification, by itself, does not help reduce emissions unless the increased demand for electricity is supplied by low-carbon sources. Moreover, recent studies highlight that energy security and resilience concerns have become structurally linked with decarbonization objectives in the aftermath of global supply disruptions and geopolitical instability. Renewable electricity self-sufficiency, in this regard, is based on two crucial transition dynamics: (i) the carbon quality of electricity supply and (ii) the domestic capacity to generate renewable electricity without excessive reliance on external imports.
Recent empirical analyses show that countries combining high renewable penetration with domestic generation capacity exhibit stronger resilience to price shocks and accelerated decarbonization pathways [68]. Therefore, this dimension moves beyond simple renewable share metrics by incorporating the security and autonomy component of electricity systems.
The third dimension is operationalized through the renewable electricity self-sufficiency ratio (), as defined in Equation (7).
where the numerator stands for the total domestic renewable electricity generation. The denominator shows total electricity consumption. The indicator is expressed as a percentage (%). Less efficient ratios point to current structural dependency on fossil-based generation or imported electricity, and more attractive values reflect greater congruence between electrification strategies and domestic renewable capacity. By explicitly defining the deployment of renewable energy regarding domestic supply adequacy, this indicator represents a dual ambition, reinforced by growing emphasis in the post-2022 energy policy debate, toward rapid decarbonization and an increase in energy sovereignty and systemic resilience. Therefore, the renewable electricity self-sufficiency metric combines mitigation effectiveness with strategic autonomy. This is interesting, especially in the context of the analysis of the extent of transition in developed economies.
The fourth dimension is energy innovation intensity (EII), which reflects the extent of advanced economies with structural investments in the technological development of low-carbon energy systems. In the Global North, where basic infrastructure and access constraints are largely resolved, the long-term potential for deep decarbonization is going to require a strong focus on sustained investment in the research, development and demonstration () of clean technologies. Recent publications from post-2022 highlight that, in order to meet net-zero objectives, technologies, along with innovative solutions, must be deployed at a higher pace to minimize the cost of net-zero systems, improving the integration of systems, and realizing the possibilities of new frontiers of innovation like storage, hydrogen, carbon capture and digitalized grids [69]. It has been demonstrated empirically that countries with a high EII have faster patenting activity, greater cost reductions in renewables, and a higher diffusion of emerging low-carbon technologies [56]. In addition, innovation expenditure is being seen more and more as a forward-looking indicator of the credibility of a transition as being not just about the current decarbonization performance but also about the ability to maintain long-term emission reductions. Accordingly, this dimension characterizes the technological basis of long-term transition depth rather than short-term mitigation outcomes alone. This dimension is operationalized based on Energy Research Development and Demonstration () Intensity, defined as public energy research, development and demonstration expenditure relative to economic size, and can be obtained using Equation (8).
where the numerator is the overall public expenditure on energy research, development, and demonstration. The denominator is the gross domestic product. The indicator is expressed per thousand units of GDP (‰ of GDP), allowing for comparisons of economies of different sizes. High values reflect high levels of technological commitment, increasing institutional and public backing for innovation ecosystems, and high capacity to generate, evolve, and deploy clean energy technology. Low values may signal technology stagnation or reliance on imported innovations. By standardizing investment by GDP, the measure estimates the ranking of energy innovation on the national economic pyramid structure, rendering the measure a structurally comprehensive marker of long-term decarbonization capability [56].
The fifth aspect of the GNETI considers external energy dependence as a structural feature that impacts transition resilience. Even the most developed countries can be susceptible to geopolitical unrest, trade wars, and fluctuations in global prices when a significant share of their energy comes from outside their borders. In the wake of the energy crisis in 2022, the evidence of the relationship between decarbonization strategies and energy security has been reinforced as well because relying on imported fossil fuels can restrict policy independence, exacerbate macroeconomic instability and delay structural transition towards low-carbon systems. In that sense, external dependence becomes a structural asset of the energy model. High import dependence might strengthen the vulnerability to shocks in the price of fossil fuels and geopolitical leverage, and lower reliance, especially through internal renewables uptake and electrification, supports energy sovereignty and stabilizes long-term transition. In recent years, the literature has also considered that decarbonization paths need to consider the necessity of reducing emissions and the increased susceptibility to external supply risks [56]. Such a dimension is determined by the net energy import dependency ratio () computed in Equation (9).
In Equation (9), the numerator refers to the total net energy imports, which are defined as imports minus exports, and the denominator is the total primary energy supply. The indicator is expressed as %. In this regard, positive values represent net import dependence, and negative values indicate that the country is a net energy exporter. Lower values mean more energy autonomy and structural resilience, while higher values indicate stronger exposure to external supply conditions. By normalizing net imports to the total energy supply, the indicator allows for cross-regional comparability and captures the structural weight of foreign energy in domestic consumption by establishing net imports in accordance with total energy supply. Consequently, the external energy dependence (EED) dimension supplements decarbonization metrics by integrating the strategic security component of the energy transition, a dimension that has assumed increased salience as part of broader post-2022 analyses of global energy governance and transition resilience [56].
2.6. Sample Selection
The sample selection employs a methodological strategy that aims at structural comparability and analytical validity in the study of energy transition dynamics. As for the Global South, middle and lower-middle-income economies are classified according to the World Bank, including India, Brazil, South Africa, Indonesia, Colombia, Ghana and Mexico within these categories. In fact, these countries meet the requirements of comprehensive data covering the period 2013–2022, and they comprise key regional energy players with significant demographic, economic and geopolitical power. Their inclusion provides means to capture a broad spectrum of structural configurations, such as heavy fossil fuel dependence, substantial renewable resource endowments, present industrialization processes, and varying degrees of socio-economic vulnerability. This internal diversity is important for analyzing the influence of structural constraints, institutional capacity and productive heterogeneity on the transition pathways in development settings.
For the Global North, countries classified by the World Bank as high-income countries include Denmark, Germany, the United States, Sweden, Japan, the United Kingdom and Canada. These countries have largely overcome basic energy access roadblocks and have strong investment potential, advanced technology frameworks and cohesive regulatory environments for deep decarbonization. Each represents a different phase of a transition for the developed world, regardless of whether they are highly industrialized economies, high renewable energy penetration countries, or leadership cases. This variability makes possible both a comparative analysis of aggregate performance and many different mitigation strategies in structurally advantaged contexts.
Although the selected countries provide a representative framework for analyzing heterogeneous energy-transition pathways, the proposed methodology is not restricted to this specific group. Other countries could also be incorporated, provided that complete and consistent information is available for all indicators included in Table 1 and Table 2 over the analyzed period. If the sample was expanded, the same methodological framework and PCA procedure could be applied; however, the resulting index values and country rankings may vary because PCA weights depend on the correlation structure of the observations included in the analysis. Therefore, the inclusion of additional countries could modify the relative contribution of each indicator while maintaining the core objective of identifying differentiated transition pathways based on structural conditions, diversification capacity, and energy dependency. A broader sample would further strengthen the external validity of the framework by incorporating a wider range of transition contexts, as long as data availability, consistency, and comparability across countries and years are ensured.
Table 1.
Descriptive statistics of selected indicators for Global South countries, 2013–2022.
Table 2.
Descriptive statistics of selected indicators for Global North countries, 2013–2022.
2.7. Data Sources and Variable Definition
In this study, countries were grouped into two categories: the Global South and the Global North. Countries within each group were indexed by i, where identifies each country in group g, with for the Global South and for the Global North. The selected indicators are indexed by j, where represents the different variables included in the analysis. Therefore, the original data matrix can be formally defined as shown in Equation (10).
This means that is a real-valued matrix with rows (countries) and columns (indicators). The generic element represents the observed value of indicator j for country i in group g. In a general form, the matrix can be written as described in Equation (11).
For example, if countries and indicators, then would be a matrix. Each row corresponds to one country, and each column refers to one transition indicator, such as renewable energy share, carbon intensity, energy intensity, or . However, the PCA procedure was performed using pooled country-year matrices rather than a cross-sectional matrix of countries. Specifically, for the Global South, the input matrix was defined as (), including 70 observations corresponding to 7 countries observed annually from 2013 to 2022, and five transition indicators. Similarly, for the Global North, the PCA was estimated using (), consisting of 70 country-year observations and the same number of indicators. Therefore, the annual transition index values reported in results section are generated from the PCA scores obtained from the complete panel structure, rather than from a () cross-sectional matrix.
For the GSETI, five indicators were selected to capture structural transition constraints, mitigation performance, diversification capacity, and social inclusion in emerging and developing economies.
The first is , or the renewable share of final energy consumption, expressed in Equation (1). The figures were obtained from the IEA energy balances. Unlike the renewable share of electricity, this variable is able to reveal structural decarbonization in every end-use sector (e.g., transportation, industry, and buildings), which allows a more complete analysis of systemic change. The second indicator, , represents CO2 emissions per capita (Equation (2)). Data were obtained from the IEA database, which prepares national emissions inventories according to internationally harmonized reporting standards. This variable represents the net level carbon footprint for national production and consumption patterns and is a contributor to this distributive aspect of emissions. The third indicator, , describes electricity access in Equation (3). The data were taken from World Development Indicators published by the World Bank and from databases of the IEA. The third variable reflects the social inclusion aspect of the energy transition, which continues to be a major structural constraint for many emerging economies. The fourth one, , represents energy intensity (Equation (4)). The indicator is illustrated in megajoules per 2015 USD PPP (MJ per 2015 USD PPP). Thus, the GDP in PPP terms compensates for cross-country differences in price level and exchange rate factors, which should make for structural comparability across heterogeneous developing economies. Data were gathered from the IEA. This is an indicator of the role of effective economies in converting energy inputs into actual economic output. The fifth indicator, , corresponds to for renewable diversification, which was computed using Equation (5). The index varies between zero and one. The lower the value, the more diversified the renewable sources and, thus, the higher system resilience. Data were obtained from disaggregated renewable energy balances reported by the IEA and IRENA.
All the variables were changed to make the composite one so that the higher the value, the better the energy transition performance. Indicators that were expected to correlate positively with positive transition outcomes (e.g., renewable share in final energy consumption and access to electricity) were kept in their initial form. Variables opposite to transition performance, such as CO2 emissions per capita and energy intensity, were inversely adapted by multiplying the original values by negative one. It is formally defined that is the transformed variable; when the former value is higher, it can be used to prove better performance, while when the latter is higher, it can prove poorer performance; for a given value, it is said to be . This evolution achieves conceptual correspondence for all indicators, enabling logical interpretation and avoiding any distortion in the later standardization and PCA analyses. Indices of the included South Global countries in the research are compiled in Table 1.
The GNETI for advanced economies highlights technological depth, systemic electrification, decarbonization efficiency, innovation capacity, and strategic autonomy. However, high-income countries generally face fewer structural constraints than developing regions in terms of basic access or minimum institutional capacity. So, the chosen measures are centered on mitigation performance and the quality of structural transformation within mature energy systems. The first indicator, , is the renewable share in final energy consumption (Equation (1)). Data were obtained from IEA energy balances. This variable captures the structural integration of renewables across all end-use sectors, including transport, heating, and industry. In advanced economies, deep decarbonization requires moving beyond power sector transformation toward comprehensive substitution of fossil fuels in final energy demand. Therefore, this indicator reflects systemic rather than sector-specific progress. The second indicator, , corresponds to final energy carbon intensity (Equation (6)). Emissions data and energy balances were sourced from the IEA. This measure isolates the carbon content of energy use independently of economic scale effects, capturing fuel switching, electrification combined with renewable supply, and the deployment of low-carbon technologies within end-use sectors. The lower the value, the cleaner the patterns of energy consumption and the higher the decarbonization efficiency. The third indicator, , is renewable electricity self-sufficiency (Equation (7)). Data on electricity generation and consumption were provided by the IEA. This indicator measures the extent to which electrification is supported by domestically produced renewable electricity. The metric combines decarbonization performance and strategic energy autonomy. The fourth indicator, , corresponds to the intensity of energy research, development, and demonstration (Equation (8)). The data were drawn from the IEA. This indicator measures technological commitment and innovation capacity, key drivers for long-term decarbonization in advanced economies. Higher figures represent a stronger institutional commitment to low-carbon technology development and diffusion. The fifth indicator, , is the net energy import dependency ratio (Equation (9)). Energy trade and supply data were extracted from IEA energy balances. Positive values refer to import dependence; negative values are net exporters. This variable measures structural exposure to risks from external supply and geopolitical volatility. Lower values indicate more energy autonomy and system resilience, which is of increasing relevance in advanced economies for transition performance.
All indicators were directionally aligned in consideration of conceptual consistency in the composite index construction, so that higher values are uniformly indicative of stronger energy transition performance. The same indicators were retained, as they are associated with a higher level of transition progress, such as renewable share of final energy consumption, renewable electricity self-sufficiency, and intensity. Consequently, terms with a negative association with transition performance, for example, the final energy carbon intensity and net energy import dependency, were multiplied by negative one prior to standardization. In formal terms, the transformed variable equals when higher values indicate better performance, and it equals when higher values indicate weaker performance. Such alignment is important so as not to lose interpretative continuity and distortions of the sign in the later multivariate aggregation methods. The indicators of the selected North Global countries included in the study are provided in Table 2.
To eliminate scale heterogeneity across indicators and ensure internal comparability within each group, Z score standardization was applied to all directionally adjusted variables. Because the selected indicators are expressed in different units, such as percentages, metric tons of CO2 per capita, or energy use per unit of GDP, direct aggregation would introduce statistical distortions driven by magnitude rather than substantive variation. Variables with larger numerical ranges or higher dispersion would disproportionately influence the results. The transformation was performed separately for each group according to Equation (12).
where denotes the standardized value of indicator j for country i in group g; is the directionally aligned value of the indicator; is the mean of indicator j within group g; and is the corresponding group-specific standard deviation, with . This transformation centers each variable around the group mean and scales it relative to its dispersion, producing standardized values with a mean of zero and unit variance within each group. As a result, represents how many standard deviations a given country deviates from its group average, allowing relative performance within a structural context. This transformation produces the standardized data matrix, as shown in Equation (13).
The dimensions of are identical to those of the original matrix , as represented in Equation (14). It contains rows (countries) and columns (indicators). However, each column now has a mean of zero and a variance of one. Substantively, represents the normalized and directionally consistent version of the original data, expressed in standard deviation units relative to the structural context of group g.
2.8. Statistical Analysis of the Energy Transition Index
The statistical analysis of the energy transition index is based on a multivariate dimensionality reduction framework designed to extract the dominant latent structure embedded in a set of correlated energy transition indicators. Energy transition performance is inherently multidimensional, incorporating decarbonization dynamics, improvements in energy efficiency, structural transformation of the energy mix, and technological upgrading. As these dimensions are theoretically related, the empirical indicators are associated with a strong correlation. When this happens, simple averaging would produce redundancy and double-counting of information, as well as directly assigning equal weight, with no statistical justification.
To address these limitations, a PCA framework is applied to the standardized indicator matrix belonging to each structural group. This method detects orthogonal linear combinations of variables that incrementally maximize the variance, accounting for the features in the data. The first principal component expresses the direction in the multidimensional space where cross-country dispersion is greatest and it is, therefore, the most characteristic typical predictor of the indicators. This dominant element is, thus, analyzed in this work as the latent dimension of structural energy transition performance. A crucial methodological benefit of this approach is that weights are generated endogenously from the empirical correlation structure, rather than being imposed in advance. The loadings are used to approximate the contribution of each indicator to the common variance of the system, ensuring that more informative variables receive a greater statistical weight. Furthermore, the orthogonal nature of principal components ensures the absence of internal multi-collinearity and also maximizes informational efficiency, thus increasing robustness and interpretability.
PCA in the construction of composite indices is well-represented in studies of multidimensional measurement and sustainability assessment methodologies. The OECD Handbook on Constructing Composite Indicators offers a formal basis for weighting schemes using PCA when indicators are correlated and when theoretical priors on weights are weak [21]. Recently, the PCA algorithm has been used in environmental and energy performance measurement methodologies to synthesize complex transition dynamics into statistically consistent indices through recent empirical applications that can also be related to those studies [70,71]. These studies show that PCA-based aggregation improves internal validity, minimizes arbitrariness in weighting and offers a transparent, replicable platform for multidimensional policy analysis.
The procedure begins with the standardized matrix ; PCA is not applied directly to the raw standardized observations in isolation; it is applied to their internal correlation structure. The correlation matrix of the indicators () within group g is defined as shown in Equation (15).
where is the number of countries in group g, and is the transpose of the standardized data matrix. Since has dimension , the product yields a square matrix . This matrix describes relationships among indicators. Each element measures the linear correlation between indicators j and within group g. Therefore, while represents countries in standardized indicator space, captures the structural interdependence among the variables themselves. The dimensionality of the PCA problem depends on the number of indicators , rather than on the number of countries . The latent structure is extracted by solving the eigenvalue problem, as described in Equation (16).
where are eigenvalues, m denotes the index of the principal component () and are the corresponding eigenvectors, which represent the weights associated with each standardized indicator. Each eigenvector provides a set of weights assigned to each standardized indicator . The eigenvalues measure the amount of variance explained by each component. Because the eigenvalue problem admits infinitely many proportional solutions, a normalization constraint is required to ensure a unique and well-defined eigenvector. Therefore, the normalization condition presented in Equation (17) is imposed to fix the scale of the loading vector and guarantee identification of the principal component.
The principal components score for country i on component m in group g is computed as shown in Equation (18).
Equation (18) expresses the component score as a weighted linear combination of the standardized indicators defined in Equation (12). Each country’s position along component m, therefore, depends on both its standardized performance in each indicator and the relative importance of the indicator, as determined by the loading coefficients. The statistical importance of each component is determined by its associated eigenvalue (). As established in Equation (19), the variance of component m equals its eigenvalue.
Because eigenvalues are ordered from largest to smallest (), the first principal component in group g () corresponds to the largest eigenvalue in group g, denoted as , as described by Equation (20).
Consequently, captures the largest proportion of shared variation across variables within group g and represents the dominant latent dimension of the system. Component retention was determined using multiple complementary criteria applied separately for each group g. First, the Kaiser criterion required that . Second, the cumulative explained variance threshold was established as , ensuring that the retained components account for at least 70% of the total variance in group g. Third, sampling adequacy was verified through the Kaiser–Meyer–Olkin statistic (). Finally, Bartlett test significance was applied under the null hypothesis , where denotes the identity matrix. Rejection of confirms that the correlation matrix is not an identity matrix and that sufficient inter-variable correlation exists for factor extraction within group g. In both groups , the first principal component concentrated the largest share of the total variance, that is , and satisfied all retention criteria. It was, therefore, interpreted as the structural energy transition factor in group g. The energy transition index for country i and group was consequently defined, as shown in Equation (21). The KMO and Bartlett’s sphericity tests were calculated using the same pooled matrices employed in the PCA estimation (N = 70). Thus, these tests assess the adequacy and correlation structure of the five indicators across the full set of country-year observations used for index construction. Although pooled panel observations may include temporal dependence due to repeated observations for the same countries, the objective of the PCA in this study is to derive a composite index by identifying the common variation structure among transition indicators, rather than to estimate causal effects or independent country-level parameters. Furthermore, PCA models were estimated separately for the Global North and the Global South, allowing the extracted components and indicator weights to reflect the specific structural characteristics and transition dynamics of each group.
To enhance interpretability, the index is rescaled using the min-max transformation presented in Equation (22).
where is the PCA score of country i in group g, and and are the maximum and minimum values within group g, respectively.
This final transformation preserves the ordinal structure derived from Equation (21) while mapping the results onto a bounded 0 to 100 scale. Because all steps from Equation (12) through Equation (22) are implemented separately for each structural group, the resulting index reflects within-group variation and avoids cross-group structural bias. and denote the normalized principal component score for country i in the Global South and the Global North, respectively. Therefore, is equal to and is equal to . These indices are dimensionless composite measures derived from standardized variables and are normalized to a scale ranging from 0 to 100. A comparative assessment of the relative performance of structural energy transition in the given sample enables a consistent set of comparisons among countries.
The PCA for constructing the GSETI and GNETI indices was conducted in R, version 4.5.2 (2025). This software facilitated the efficient preprocessing of the panel data, the standardization of the variables, and the extraction of the principal components that account for the greatest part of structural variance per the bloc of countries represented. The use of R allows for reproducibility and consistency in the index calculations, as well as validation of statistical results and robustness checks on the results. A flowchart of the R code workflow from data preparation to index estimation is illustrated in Figure 4.
Figure 4.
Flowchart of the calculation process for the GSETI (Global South) and GNETI (Global North) indices.
2.9. Net Zero 2050 Benchmark Definition for Ideal Country Profiles
To ensure methodological consistency and policy relevance, the ideal country benchmarks used to normalize the PCA-based energy transition indices are aligned with internationally recognized Net Zero 2050 pathways. Specifically, targets are consistent with the mitigation trajectories outlined by the Intergovernmental Panel on Climate Change, the IEA Net Zero Emissions scenario, and the United Nations Sustainable Development Goals framework. As presented in Table 3, the Global South ideal profile reflects a just and feasible transition pathway, combining universal electricity access at 100%, a renewable share of at least 80% in final energy consumption, per capita CO2 emissions approaching 0 to 0.5 tCO2 per capita, where a value of 0.25 tCO2 per capita was used, and a substantial reduction in energy intensity of at least 40 to 60% relative to current averages. Therefore, If the current average value of Energy Intensity (MJ per 2015 USD PPP) for the set of countries studied in the Global South group is 3545.17, and a 50% reduction was assumed for the Net Zero 2050 (NZ2050) ideal scenario, the target value would be 1772.59 MJ per 2015 USD PPP. Finally, there is a diversified renewable portfolio with an below 0.15. For the Global North, where structural decarbonization is expected to occur earlier, the ideal profile is more stringent, including renewable shares above 90%, final energy carbon intensity below 5 gCO2 per MJ, renewable electricity self-sufficiency above 95%, research and development intensity exceeding 1.0 per thousand units of GDP, and net energy import dependency approaching 0. These benchmark values provide a theoretically grounded and policy-consistent reference point against which country performance can be evaluated. Importantly, the empirical indicators can be normalized relative to these fixed targets, enabling cross-country comparability while avoiding endogeneity problems that arise when the benchmark is derived from the sample itself.
Table 3.
Descriptive statistics of selected indicators for an ideal country under the Net Zero 2050 benchmark.
3. Results and Discussion
3.1. Descriptive Analysis of Indicators
Analysis of performance and challenges across the four indicators of the energy transition from the Global South to that of the Global North shows considerable heterogeneity. In the Global South, the share of renewable energies differs sharply: Ghana and Brazil have relatively high penetration (about 35.77–48.11% and 41.74–50%), while South Africa lags considerably (5.61–7.69%), revealing the ongoing reliance on fossil fuels. CO2 emissions per capita are also markedly different: South Africa is the most affected country (≈5.92–7.95 tCO2/cap), followed by Ghana and India (≈0.46–0.62 tCO2/cap) and (≈1.43–1.77 tCO2/cap) in terms of emissions, depending on the energy infrastructure and the level of industrial intensity. Electricity access is fairly widespread (e.g., India, Brazil, and Mexico have near universal coverage), with Ghana lacking in its coverage (≈70.80–88.80%). Energy intensity, in terms of the efficiency of energy use against economic output, is highest in South Africa (≈6154.60–7285.03 MJ/GDP), whereas Colombia and then Mexico have lower values (≈2009.66–2386.48 MJ/GDP) and (≈2888.89–3349.44 MJ/GDP), respectively, demonstrating a difference in structural efficiency. The for renewable energy, additionally, indicates that countries like Ghana and Colombia have a concentrated renewable portfolio (≈0.82–0.99) and (≈0.88–0.96), whereas Brazil has a diversified renewable portfolio ( ≈ 0.44–0.76), hinting towards higher adaptation in energy generation plans.
On the other hand, renewable integration in the Global North is both higher and more consistent. Sweden and Denmark are in front with a renewable share of 47.27–59.65% and 27.05–39.37%, respectively, and minimal end energy carbon intensity (≈24.71–28.44 gCO2/MJ) for Sweden and (≈47.84–68.50 gCO2/MJ) for Denmark, indicating that their renewable energy systems are efficient and low-carbon. These countries achieve quite high renewable electricity self-sufficiency (RESS) (i.e., strategic independence in terms of how energy is made). In contrast, countries such as Japan and the United Kingdom have moderate renewable penetration (≈5.06–9.26%) and (≈5.23–13.81%), respectively, and net energy import dependency (≈88.71–95.67%) for Japan and (≈28.50–50.61%) for the United Kingdom, indicating significant structural dependency on imported energy and fossil fuels. In Sweden and Denmark, the intensity of research, development, and demonstration () is relatively high (≈0.37–0.51 per thousand GDP units) and (≈0.28–0.62 per thousand GDP units), which corresponds to technological innovation for the decarbonization goals, while other northern economies invest less in energy innovation.
These differences emphasize the importance of normalizing indicator data for the purposes of constructing composite indices, such as the PCA-based GSETI and GNETI, for comparative purposes across heterogeneous countries. In addition, the Net Zero 2050 scenario allows defining an “ideal” country in each group, covering the best performance against RES, CO2 emissions, electricity access, energy intensity, and renewable diversification. Comparing actual performance of countries with these targets can assist policy experts and researchers in prioritizing areas of intervention that can yield value, such as energy efficiency in South Africa, renewable portfolios in Japan and the United Kingdom, or electricity access in Ghana, thereby advancing the global energy transition.
3.2. Principal Component Analysis (PCA)
PCA was conducted separately for the Global South and Global North to ensure that structural heterogeneity in energy transitions between South and North is effectively captured. The drivers, policy environments, technological bases, and underlying energy conditions are quite different in developing vs. developed economies, and if all those countries were to be included in a single PCA, the risk for this approach being sensitive to group-level structures of variation and for altering the relative weights of indicators would be to mask them. The first PCA factor from each of the PCA determined separately for each group estimates the predominant transition feature and, thus, their corresponding subgroup and own structurally relevant context. The composite indices (GSETI and GNETI) ensure internal coherence, statistical robustness, and sensitivity to the distinct dynamics of decarbonization trends for emerging versus advanced economies, thereby rendering meaningful intra-group comparability and preventing structural bias due to cross-group asymmetries.
Table 4 lists the loadings of the first principal component for both the Global South and Global North groups. The loadings highlight the relative value of individual indicators for the composite index intensity in the Global North. The low discriminatory power in each example can be found.
Table 4.
Loading of the first principal component ().
Prior to the PCA estimation, variables representing adverse transition outcomes were reverse-coded to ensure that all indicators followed the same theoretical direction, where higher values indicate a better renewable energy transition performance. Specifically, for the Global South index, CO2 emissions per capita and energy intensity were multiplied by -1 before standardization and PCA application. Consequently, the transformed variables represent improvements in transition performance rather than environmental costs. This transformation is essential because PCA identifies statistical patterns in the covariance structure of the variables, but the mathematical sign of the principal components is arbitrary and can be inverted without changing the amount of variance explained or the information captured by the component.
Therefore, the negative signs reported in the loadings in Table 4 should not be interpreted as negative contributions to the transition index. The sign orientation of was adjusted after extraction, and the resulting component scores were normalized to a 0–100 scale, where higher index values indicate better renewable energy transition performance. Under this convention, countries with higher renewable energy penetration, lower carbon intensity, lower energy intensity, greater renewable diversification, and higher electricity access obtain higher transition index values. Thus, the interpretation of country rankings is based on the final normalized PC1 scores after reverse-coding and sign adjustment, rather than on the raw loading signs reported by the PCA algorithm.
3.2.1. Principal Component Analysis of Global South
For the seven selected Global South countries, PCA was conducted to reduce the dimensionality of the selected energy transition indicators and to obtain a composite index based on joint variable variation. It also reveals that the first principal component () explains 58.7% of the variance, which shows that a single latent dimension reflects the structural differences in energy transition performance of the countries covered. In addition, the total variance accounted for by the first two components is greater than 80%, indicating the strength of the dimensionality reduction.
Based on the loadings of , CO2 emissions per capita (–0.545), energy intensity (–0.506), renewable energy share (–0.473) and renewable diversification (, –0.471) are significant contributors to the component, while electricity access (0.041) has a negligible impact. This trend implies that the latent dimension represented by is more indicative of the evolution of structural decarbonization and energy efficiency dynamics, and not a difference across the basic level of electrification.
For the selected Global South countries, the comparative evolution of the GSETI over the 10-year period of the analysis (2013–2022) is shown in Figure 5. This figure represents the dynamic performance of the composite index between countries, allowing for the analysis of relative measures of performance, convergence or divergence trends, and the speed of structural change in the energy transition. By plotting the timelines of each country, the figure points to both enduring structural leaders and laggards, as well as countries that made slow improvement or showed cyclical changes in their performances in the decade.
Figure 5.
Evolution of the Global South energy transition index (GSETI), 2013–2022.
A country with the highest value of GSETI is not just the most renewable nation, since this index is based on the statistical structure that the PCA gives, referring to the country that has the optimal combination of all indicators. As the first principal component accounts for 58.76% of the variance in the Global South sample, the country with the highest index is the one with the lowest value of lower CO2 emissions per capita, lower energy intensity, higher participation in renewable energy, and a more diversified renewable structure in relative terms among the group composition. However, on the other hand, it is found that electricity access is an insignificant factor in differentiation, and this means that the index of the country does not result from small gains in coverage, but deeper structural features that lead to better index performance. This index is normalized from 0 to 100 in the sample, but it does require particular attention. Thus, a country scoring 100 is not a “perfect” nation in absolute terms; it just reflects the best relative performance among all the selected countries during the period analyzed. The country with the highest index is the one whose multidimensional energy profile is most closely aligned with the direction of the first principal component. Additionally, it is indicative that its energy system configuration is better aligned with the structural pattern that the PCA recognizes as the energy transition, with a more advanced energy transition within the group. In another sense, this means that the index is not a moral assessment, nor is it any sort of absolute ranking, but it is a relative position that describes the structural integration between decarbonization, energy efficiency, and renewable development.
However, between 2013 and 2022, the Global South was vastly heterogeneous in its levels of energy transition. The GSETI results indicate three distinct patterns: countries with structurally high and relatively stable performance; intermediate economies, which display moderate progress or stagnation in performance; and countries with deep structural constraints but exhibiting recent signs of improvement. In the high-performance group, Ghana, Colombia and Brazil are highlighted. Throughout this period, Ghana has had the highest index values, reaching its relative maximum in 2013 and remaining above 90 points in most years. However, this course starts slipping somewhat near the end, and this implies a relative loss of structural advantage. This is neither an absolute regression nor representative of any one sample, as this is a measure of the effect being carried out, and there can be no direct association between the measures. As for increasing levels, Colombia has an impressive stability of high levels, which usually appear between 84.53 and 86.85 points, representing a relatively clean and diverse energy mix overall, as well as low energy intensity. Brazil also scores high, with only a slight downward trend since 2019, possibly due to variations in renewable uptake or changes in the energy intensity.
A second group, represented by India and Indonesia, is in the intermediate slot. India experiences a gradual decrease over these years, with values above 64.24 in 2013, falling to as low as 58.99 in 2022. This development suggests that the reduced energy intensity and per capita emissions have not been sufficiently effective to underpin structural gains on the new composite index, even as access to electricity improves. Indonesia is not an exception; its declining trend, although gradual and moderate, reflects relatively few opportunities still preventing the country from transforming its energy matrix. The index indicates structural constraints that nevertheless influence how fast the transition progresses in both societies.
Mexico is a little behind the intermediate position, with an inclination towards the lower part with values fluctuating around 45.87 to 50.55 points, with no clear upward trend. For example, due to their relative stability, individual indicators are not changing enough to change the relative position of the index within the group.
The most structurally constrained case is South Africa. The values measured from the outset are very low, and their relative minimum was reached in 2014. However, gradual improvement emerges from 2018, notably peaking by 2022. Although its total is still less than the mean absolute level of the other countries, the rise of its recent increase indicates emerging structural accommodations. This means that, even if one begins from a very carbon-intensive starting point, it is possible for substantial transformation dynamics to occur. It indicates that energy transition in the Global South is not solely characterized by the expansion of renewable energy, but rather bigger changes in energy intensity and emissions reduction in the system of the region. Countries with historically cleaner energy systems or structurally lower energy intensity are typically shown to lead the index, while fossil fuel-dependent or energy-intensive productive structures have more pronounced delays. Relative positions in this sector remain broadly fixed over time and converge less within the group during the decade being studied.
3.2.2. Principal Component Analysis of Global North
From the PCA of the data, the GNETI data show a clear structural dimension responsible for cross-country differences in performance. The first principal component accounts for 59.68% of the total variance, meaning most of the variability within advanced economies can be summarized by a latent factor. Such a high concentration of explanatory power allows assembling the composite index according to the model, as it captures the dominant structural transformation pattern found in the analysis.
The component loadings make clear the substantive significance of this latent dimension. Renewable energy share, final energy carbon intensity, renewable electricity self-sufficiency, and net energy import dependency show the greatest absolute contributions, whilst intensity plays only a marginal role. Cross-country differentiation is, thus, based on the extent of decarbonization of final energy use, the degree of renewable deployment, and how widely countries rely on domestic energy resources rather than imports. For long-term transformation, investment in research and development is important; nonetheless, it hardly distinguishes performance in the dataset reviewed.
The negative sign in the loadings simply indicates the statistical orientation of the component with no normative value. Higher GNETI values following normalization indicate more favorable structural conditions, consisting of lower carbon intensity, stronger renewable integration, and lower external dependency. Hence, the index corresponds to closeness to the structural decarbonization profile, as determined by .
The results are highly heterogeneous across Global North economies. Sweden consistently occupies the top position, reaching the highest relative score in 2022, utilizing a developed low-carbon electricity mix and high renewable self-sufficiency. Denmark and Canada exhibit persistent upward trends, consistent with ongoing structural adjustment throughout the decade. Germany and the United Kingdom are slowly but steadily improving, showing gradual changes concerning the way their energy systems are reshaping. Japan is near the bottom of the distribution with a moderate recovery after 2016, with it still being a transitional country because of moving on from the post-Fukushima energy reform and still depending on imported fossil fuels. Collectively, the PCA-based GNETI highlights that energy transition leadership in advanced countries is due to common structural alignment across different dimensions of its structure, instead of isolated changes resulting from progress in a single factor. Such performance differences last across time, indicating that national-level energy systems evolve progressively through time and maintain deep ties with prevailing inherited technological configurations, institutional structures and resource endowments.
As illustrated in Figure 6, the evolution of GNETI across the period to 2022 and the pace and structural trajectories of energy change in some of the advanced economies have fluctuated significantly during this period. The PCA-based GNETI covers diverse dimensions of decarbonization, i.e., renewable energy penetration, final energy carbon intensity, renewable self-sufficiency and external energy dependence. This is coherent with multidimensional models of energy transition [41,45]. Sweden and its high index value, eventually hitting a relative maximum in 2022, are consistent with the policy focus on high renewables integration and low-carbon final energy systems in the recent comparative literature on Nordic decarbonization [72,73]. Likewise, Denmark’s progressive upward trajectory mirrors structural investments in wind and grid modernization [74,75]. Furthermore, the moderate but incremental improvements in Canada reflect the recent literature on the complex connections between hydro and emission-reduction policies [76]. The evidence of structural advances for Germany and the United Kingdom correlates with observed policy commitments in the European Green Deal and also with the strategies of national energy transition. On the other hand, Japan’s relatively low index scores on a continuous basis for the entire timeframe, albeit gradually improving since 2016, aligns with the problems and challenges reported about post-Fukushima energy policy, high fossil fuel import dependency and the slower integration of renewables compared with Western European peers.
Figure 6.
Evolution of the Global North energy transition index (GNETI), 2013–2022.
3.2.3. Discussion
The GSETI and GNETI cannot be directly compared in absolute numerical terms because each index is constructed using a separate PCA applied to different country samples and different indicator structures. PCA is a data-driven dimensionality reduction technique, meaning that the weights of each variable depend entirely on the internal variance–covariance structure of the specific dataset. As a result, the first principal component in the Global South captures the dominant pattern of variation among developing economies, while the first component in the Global North reflects the structural dynamics specific to advanced energy systems. Even though both indices are normalized on a 0 to 100 scale, this normalization is internal to each sample. Therefore, a value of 100 in the GSETI represents the best relative performance within the selected South countries, and a value of 100 in the GNETI represents the best relative performance within the North sample. These maxima have no common reference point and, therefore, are not numerically equivalent. The indices are dimensionless composite scores that summarize relative positions in separate statistical spaces and do not represent absolute indicators of transition performance.
In this regard, since a direct quantitative comparison is not methodologically viable, an analytical comparison is valid and informative. From a structural point of view, components account for the same high proportion of variance (60%), meaning the energy transition is a manifestation of a dominant latent dimension for both cohorts. Within the Global South, this dimension refers largely to emissions per capita, energy intensity, renewable energy share, and diversification, while the lack of access to power has a marginal discriminatory capacity. This indicates that transitions in the South are increasingly less about fundamental electricity transition and more about structural efficiency and decarbonization. The dominant factor in the Global North is heavily correlated with renewable integration, carbon intensity, self-sufficient renewable electricity, and energy import dependency, while research and development intensity is slightly less significant. This suggests that advanced economies differ not so much by changes in the level of innovation expenditure as by the nature of the configurations and carbon profiles of their developed energy systems. Analytically, the differences suggest that while the structural decarbonization process shapes both groups, the nature of differentiation is different. For the South, the transition gap indicates both structural constraints in efficiency and an increasing dependency on fossil fuels, which is often related to the stage of development and infrastructure. Heterogeneity arises in the North through longer-term energy system configurations, resource endowments, and policy trajectories. Thus, the indices are not comparable to absolute rankings; they contribute on a conceptual level to demonstrate how the forces of transition vary across developing vs. developed economies. This analytical comparison serves to bolster its interpretation by reiterating that the energy transition is context-bound and structurally situated in various economic and institutional settings.
Based upon the data, the indices were constructed with an analytical framework that was coherent and that conceptualizes the energy transition as a multidimensional process deeply embedded in broader structural transformation. Instead of focusing on technological substitution or renewable deployment, the study frames transition dynamics as the intersection of institutional capacity, production structure, and international economic integration. This involved translating abstract dimensions into measurable proxies that regarded structural conditions governing national energy systems. For institutional and fiscal capacity, the indicators of energy system performance and efficiency were used, which indirectly reflect the capability to synchronize infrastructure expansion and system integration. The production and labor exposure and the structure of such carbon-intensive activities were represented by carbon intensity, fossil fuel dependence, and energy intensity as indicators of structural lock-in and economic cost of transformation. Finally, penetration into the global clean technology value chains and access to diversified renewable energies were linked by the metrics of renewable penetration, diversification, electrification, and energy import dependency, which are indicative of the level of structural fit with emerging low-carbon systems.
Methodologically, these dimensions permitted them to emerge statistically through an independent PCA applied to each block. By applying the strategy, the relative importance of each indicator was then grounded in empirical covariance patterns within comparable development contexts so that theoretical consistency was preserved, but subjective bias was minimized. Through the application of a coherent theoretical framework coupled with data-informed aggregation, the indices produced offer an instrument to examine transition trajectories, without ignoring the structural asymmetries that differentiate Global South and Global North economies.
Recent geopolitical developments in 2023–2026 have shown the dynamic nature of energy-transition pathways that are both shaped by structural conditions and external shocks. The long-standing Russia–Ukraine conflict, the growing tension between Iran and the United States, and the worsening instability in global energy markets have only created more uncertainty about the availability of fossil fuels, energy prices, and international energy trade. By reducing external energy dependence, countries that are heavily reliant on imported fuels will also be better equipped to navigate geopolitical disruptions. Thus, the strategic autonomy and net energy import dependency indicators mentioned in the proposed framework are important because they represent a crucial aspect of the transition related to the ability for a country to sustain secure, resilient, and adaptable energy systems in the changing world order. The recent oil and gas market volatility also shows the intricate relationship between energy security and decarbonization. Increasing prices of fossil fuels boost investment in renewable energy, as the relative competitiveness of low-carbon technologies can be enhanced. They may also put in place economic constraints that limit the ability to undertake the transition in countries that have weak financial resources, technical capabilities or high levels of foreign trade dependence. Accordingly, the effects of external energy shocks are not homogeneous but depend upon national structural features. This justifies differentiated transition indices of the Global North and Global South in terms of being developed, since a single global benchmark might overlook differences in historical context, resources and ability to transition. Moreover, new evidence suggests that decreasing fossil fuel dependence does not wipe away reliance and vulnerability to energy disruption. Renewable energy investment is increasingly dependent on global supply chains for critical minerals, technological components and manufacturing capacity, opening up new vectors of dependency. These findings make the -based diversification indicator embedded in this study more relevant, as countries with large renewable construction densities remain vulnerable to external risks even when renewable consumption is increasing. Therefore, the suggested transition index should be considered as a comparative measure of transition ability of the two groups and its relationship to the ability of each group to decarbonize because it captures the relative situation of a historical capacity and structure and does not act as a guarantee of the attainment of a decarbonized future scenario. In general, the geopolitical circumstances also confirm that energy transition is a developmental and process-stratified phenomenon. The study trajectories identified in the years 2013–2022 evidence the variation in the transition pattern by country. Future developments in energy markets, geopolitical dynamics, and technology supply chains could influence their different standing. Thus, by integrating energy performance, diversification, and dependency-related factors, the new framework helps elaborate the strategies used by other countries to negotiate the energy transition as global uncertainty grows.
3.2.4. Benchmarking Energy Transition Indices Against the Net Zero 2050 Scenario
As depicted in Figure 7, the evolution of GSETI and GNETI indices between 2013–2022 is plotted against the Net Zero 2050 ideal benchmark scenario. In addition to displaying the internal dynamics of each group, the figure also illustrates the relative distance of observed trajectories from the theoretical net-zero pathway. Although several countries progressively exhibit improvements over time, none consistently converge to the idealized benchmark, demonstrating the structural gap that persists between current transition performance and the decarbonization pace required to achieve climate neutrality by mid-century.
Figure 7.
Evolution of energy transition index against the Net Zero 2050 scenario, 2013–2022.
The comparison with an ideal Net Zero 2050 country acts as a conceptual reference. The benchmark is a stylized configuration with very low carbon intensity, high renewable penetration, strong energy efficiency performance, and structural diversification. However, there are also some methodological constraints in the use of empirical PCA-based indices against such an ideal construct. The perfect case is normative and forward-looking, while the indices are statistically based on past data within each group. PCA measures relative variation among observed countries rather than distance to an externally defined absolute target. The extent of the deviation between a country’s index and the ideal line does not, in fact, correspond to how far the country is from achieving net zero, but rather the divergence in the structure.
On the other hand, the normalization of the indices within each group limits interpretation. Since both GSETI and GNETI are scaled from 0 to 100 based on sample-specific minima and maxima, their upper bounds reflect relative leadership within the group instead of an adherence to an externally validated decarbonization threshold. The Net Zero 2050 benchmark, nevertheless, is based on global climate objectives consistent with pathways outlined by the IEA and recent mitigation scenarios assessed by the Intergovernmental Panel on Climate Change. These global pathways define emissions trajectories compatible with limiting warming to 1.5 °C, which are not directly embedded in the statistical construction of the indices. Furthermore, structural heterogeneity across countries means that convergence toward a single ideal configuration may not follow a uniform pathway. Energy systems are shaped by resource endowments, industrial structure, institutional capacity, and geopolitical positioning. As emphasized in recent transition assessments, including the 2023 and 2024 editions of the World Economic Forum Energy Transition Index reports, transition pathways remain context- and path-dependent. Consequently, measuring performance against a stylized ideal may understate transitional complexity or overstate comparability across fundamentally different energy systems.
The comparison is analytically useful. The Net Zero 2050 benchmark serves as a directional anchor to help understand the extent to which improvements with respect to indices reflect structural decarbonization as part of global climate goals. The ideal line should be understood as a high-level reference point that indicates the scale of change that has still to be achieved. In this way, Figure 7 displays a visual representation of both progress and structural inertia. This further demonstrates that incremental changes based on the adoption of renewables in the grid without accompanying broader systems-level changes in energy intensity, carbon content, and overall energy system configuration are too small to justify the gradual growth.
4. Conclusions
Energy transition from 2013 to 2022 between selected Global South and Global North countries, as the focus of this study, was assessed in terms of structure using PCA-based composite indices GSETI and GNETI. The findings indicate that advancement in energy transition is driven by structural enhancements in energy efficiency, per capita emissions, and diversification of renewables instead of the expansion of a single indicator. Comparative performance with the Net Zero 2050 scenario in the Global South is best provided by Ghana, Colombia, and Brazil. The bulk (est) of Ghana’s GSETI values were above 79 points, and these peaked in 2014, with an average of 83.6, demonstrating an energy system that was both low-carbon and efficient at that time. Colombia was around 77.9–80.6 points, while Brazil averaged between 70 and 73.8 points. Small changes after 2019 are probably secondary to renewable uptake, and the magnitude of energy intensity varied. India and Indonesia have achieved relatively moderate performance (55.2 and 65.3 points, respectively, in 2013 and 2022), indicating improving access to electricity and modest decarbonization. Indonesia was further along the same path, at 60.7 in 2022. Mexico has stability around 51.6–57.2 points and shows relatively limited structural change. South Africa, in turn, had previously been the worst-performing country, with GSETI = 0 in 2014, and has seen substantial recoveries up to 20.5 in 2022, reflecting structural transition; nevertheless, the carbon emissions at baseline were relatively high. Sweden, Denmark, and Canada are the largest global leaders in performance (with respect to the energy transition around the Net Zero 2050 scenario At 59 points, Sweden continues to lead GNETI, having registered its highest score (68.8) in 2021. Denmark rose from 34.8 in 2013 to 48.1 in 2020, demonstrating gradual structural adjustment, while Canada reached 51.8 points in 2022, indicating efficient measures and renewables incorporation. Both Germany and the UK managed to move up modestly in 2022 to 20–23 points in terms of general GNETI values. However, Japan, on the other hand, had the lowest GNETI (8.8 GNETI) in 2022, showing a fossil economy with a high level of imports. This is opposed to Net Zero 2050, in which neither country fully realizes the pathway demanded. Even the world’s leading countries, such as Sweden and Ghana, have not arrived at the Net Zero 2050 goal of 100 points, demonstrating the structural and technological barriers to the achievement of net-zero emissions. It looks at relative performance and structural alignment, not compliance with decarbonization goals.
The findings verify that the path for renewable energy transition is not characterized by a discrete route, since different countries demonstrate various trends as a function of structural energy factors, resource endowments, technological strengths and decarbonization obstacles. The PCA dual framework proposed in this work accounts for these divergences by projecting new integrated transition indices for the Global South and Global North for different development contexts, avoiding the imposition of national weighting structures for the gradual transition pattern and defining regionally adapted transition patterns. The results also illustrate that a high-performance score on transition does not predict a convergence toward a one-size-fits-all decarbonization scheme but provides a measure of relative development of an individual to its members. That is the reason why policy approaches should be personalized according to the specific transition profile determined by the index. Larger values for countries with lower diversification and greater concentration of renewable energy sources, indicating a higher percentage of renewable sources, such as Ghana and Colombia, warrant policies that would help to broaden technology portfolios, diversify renewable sources and reduce energy source reliance on specific forms of energy. On the other hand, countries that are a step ahead and are in transition, like Japan, should also place a stronger emphasis on deeper decarbonization measures, such as emission reductions in the carbon-intensive sectors that remain, better efficiency, and technology for innovation. Overall, the proposed framework provides a new perspective to plan varied energy-transition policies that take into account the non-linearity and context-dependent nature of decarbonization pathways. Although this study contributes greatly to methods, a few technical limitations should be acknowledged. First, PCA-based weighting was employed for index construction, leading to a presumption that the covariance structure of the selected indicators reflects the underlying renewable energy transition process as well. Therefore, estimated weights are adjusted for the sample composition and the period analyzed, which means that when the number of countries, years, and selected indicators changes, the contribution of each variable to the index can evolve. Secondly, independent PCA models of the Global North and Global South (to account for regional heterogeneity) were estimated; however, this procedure does not allow for comparison of the loadings of the components between the groups, as every index is calculated independently in a model. Third, the size of the index varies according to the normalization and reverse coding algorithms that are used to ensure a higher index corresponds to better transition performance, and other transformed methods would yield different index scales. Finally, the analysis was conducted using 70 observations per group of each country for 2013–2022, a balanced panel that can provide temporal continuity within renewable energy transitions, but this is limited in capturing the longer-term structural changes occurring in renewable energy transitions. Additionally, future research may extend the model with more countries, longer time horizons, and further parameter-reduction methods to test the robustness of the proposed indices. The proposed indices aid in the design of energy-transition policies in terms of pinpointing specific areas, according to the nature of a country’s transition profile that need intervention. At the other end of the spectrum, for countries with high dependence on energy imports, a policy focus on deepening energy security should be considered by increasing domestic renewable capacity, grid modernization, deployment of energy storage systems and diversification of energy supply. In countries with a high generation of renewables, as evident through high values, policy priorities might involve advancing a larger renewable mix by bringing in alternative renewable technology in the form of solar, wind, hydro, biomass and other low-carbon technologies to reduce potential vulnerability to technological or resource-specific risks. Low-transition-implementation countries may need policies based on developing energy efficiencies, lowering carbon intensity and extending access to clean energy and institutional and technological capacity. In more advanced transition contexts, policies might turn toward deep decarbonization strategies that might range from electrification of end-use sectors to advanced low-carbon industrial processes, as well as carbon-management technologies and innovation support. Therefore, the indices constitute diagnostic criteria that assist in aligning policy instruments with the structural challenges and opportunities of the countries, with the subsequent enhancement of more efficient and context-dependent transition strategies.
Author Contributions
Conceptualization, A.R.-C., S.A.F. and E.C.; Software, E.C.; Validation, A.R.-C., S.A.F. and E.C.; Methodology, A.R.-C., S.A.F. and E.C.; Investigation, A.R.-C., S.A.F. and E.C.; Data curation, A.R.-C., S.A.F. and E.C.; Formal analysis, A.R.-C., S.A.F. and E.C.; Writing—original draft, A.R.-C., S.A.F. and E.C.; Visualization, A.R.-C. and E.C. Writing—review & editing, A.R.-C. and E.C. All authors have read and agreed to the published version of the manuscript.
Funding
The authors gratefully acknowledge the financial support provided by the Colombian Ministry of Science, Technology, and Innovation “MinCiencias” through “Patrimonio Autonomo Fondo Nacional de Financiamiento para la Ciencia, la Tecnologia y la Innovacion, Francisco Jose de Caldas” (Perseo Alliance, Contract No. 112721-392-2023).
Data Availability Statement
The original contributions presented in the study are included in the article; further inquiries can be directed to the corresponding author.
Conflicts of Interest
The authors declare that they have no conflicts of interest that could potentially influence the findings presented in this work.
References
- Shen, L.; Elshkaki, A.; Li, D.; Zhong, S.; Wu, X.; Hu, X. Progress and policy considerations to achieve energy transition and carbon mitigation. Energies 2025, 18, 5680. [Google Scholar] [CrossRef] [Scilit]
- Yue, M.; Ren, B.; Zhu, T.; Jin, Z. Asymmetric decarbonization in the digital age: Divergent pathways of advanced versus emerging economies. Front. Environ. Sci. 2025, 13, 1659906. [Google Scholar] [CrossRef] [Scilit]
- Hassan, H.; Sampene, A.K.; Xiaoying, W.; Xu, L. The socio-economic and technological dimensions of energy transition: Do financial mechanisms enhance renewable energy generation? Energy Strategy Rev. 2025, 62, 101895. [Google Scholar] [CrossRef] [Scilit]
- Geels, F.W.; Sovacool, B.K.; Schwanen, T.; Sorrell, S. Sociotechnical transitions for deep decarbonization. Science 2017, 357, 1242–1244. [Google Scholar] [CrossRef] [Scilit] [PubMed]
- Sovacool, B.K.; Hook, A.; Martiskainen, M.; Brock, A.; Turnheim, B. The decarbonisation divide: Contextualizing landscapes of low-carbon exploitation and toxicity in Africa. Glob. Environ. Change 2020, 60, 102028. [Google Scholar] [CrossRef] [Scilit]
- Steckel, J.C.; Hilaire, J.; Jakob, M.; Edenhofer, O. Coal and carbonization in sub-Saharan Africa. Nat. Clim. Change 2020, 10, 83–88. [Google Scholar]
- Chipangamate, N.S.; Nwaila, G.T. Assessment of challenges and strategies for driving energy transitions in emerging markets: A socio-technological systems perspective. Energy Geosci. 2024, 5, 100257. [Google Scholar] [CrossRef] [Scilit]
- Reichenberg, L.; Hedenus, F.; Odenberger, M.; Johnsson, F. The marginal system LCOE of variable renewables–Evaluating high penetration levels of wind and solar in Europe. Energy 2018, 152, 914–924. [Google Scholar]
- Laugs, G.A.; Benders, R.M.; Moll, H.C. Balancing responsibilities: Effects of growth of variable renewable energy, storage, and undue grid interaction. Energy Policy 2020, 139, 111203. [Google Scholar] [CrossRef] [Scilit]
- Heptonstall, P.J.; Gross, R.J. A systematic review of the costs and impacts of integrating variable renewables into power grids. Nat. Energy 2021, 6, 72–83. [Google Scholar]
- Guerra, K.; Haro, P.; Gutiérrez, R.E.; Gómez-Barea, A. Facing the high share of variable renewable energy in the power system: Flexibility and stability requirements. Appl. Energy 2022, 310, 118561. [Google Scholar] [CrossRef] [Scilit]
- Aghahadi, M.; Bosisio, A.; Merlo, M.; Berizzi, A.; Pegoiani, A.; Forciniti, S. Digitalization processes in distribution grids: A comprehensive review of strategies and challenges. Appl. Sci. 2024, 14, 4528. [Google Scholar] [CrossRef] [Scilit]
- Parziale, A.; Gatto, A. Economic challenges from carbon intensity reduction and energy transition: Oil demand shocks, business profitability and market structures. Int. Environ. Agreem. Politics Law Econ. 2025, 25, 669–691. [Google Scholar] [CrossRef] [Scilit]
- Khan, A.; Irshad, M.K.; Ullah, W. Geopolitics of energy: How resource dependency shapes global power dynamics. Contemp. J. Soc. Sci. Rev. 2025, 3, 204–208. [Google Scholar]
- Müller, M. The ‘new geopolitics’ of mineral supply chains: A window of opportunity for African countries. S. Afr. J. Int. Aff. 2023, 30, 177–203. [Google Scholar] [CrossRef] [Scilit]
- International Renewable Energy Agency (IRENA). Geopolitics of the Energy Transition: Energy Security; International Renewable Energy Agency: Abu Dhabi, United Arab Emirates, 2024. Available online: https://www.irena.org/-/media/Files/IRENA/Agency/Publication/2024/Apr/IRENA_Geopolitics_transition_energy_security_2024.pdf (accessed on 20 February 2026).
- Kuzemko, C.; Blondeel, M.; Bradshaw, M.; Bridge, G.; Faigen, E.; Fletcher, L. Rethinking energy geopolitics: Towards a geopolitical economy of global energy transformation. Geopolitics 2025, 30, 531–565. [Google Scholar]
- Radtke, J. Understanding the complexity of governing energy transitions: Introducing an integrated approach of policy and transition perspectives. Environ. Policy Gov. 2025, 35, 595–614. [Google Scholar] [CrossRef] [Scilit]
- Sharma, V.K.; Monteleone, G.; Braccio, G.; Anyanwu, C.N.; Aneke, N.N. A comprehensive review of green energy technologies: Towards sustainable clean energy transition and global net-zero carbon emissions. Processes 2024, 13, 69. [Google Scholar] [CrossRef] [Scilit]
- World Economic Forum. Fostering Effective Energy Transition 2023. 2023. Available online: https://www.weforum.org/reports/fostering-effective-energy-transition-2023/ (accessed on 20 February 2026).
- Nardo, M.; Saisana, M.; Saltelli, A.; Tarantola, S.; Hoffman, A.; Giovannini, E. Handbook on Constructing Composite Indicators: Methodology and User Guide; OECD Statistics Working Papers No. 2005/03; OECD Publishing: Paris, France, 2005. [Google Scholar] [CrossRef]
- Karatayev, M.; Hall, S. Establishing and comparing energy security trends in resource-rich exporting nations (Russia and the Caspian Sea region). Resour. Policy 2020, 68, 101746. [Google Scholar] [CrossRef] [Scilit] [PubMed]
- Singh, H.V.; Bocca, R.; Gomez, P.; Dahlke, S.; Bazilian, M. The energy transitions index: An analytic framework for understanding the evolving global energy system. Energy Strategy Rev. 2019, 26, 100382. [Google Scholar] [CrossRef] [Scilit]
- Carley, S.; Konisky, D.M. The justice and equity implications of the clean energy transition. Nat. Energy 2020, 5, 569–577. [Google Scholar] [CrossRef] [Scilit]
- Akrofi, M.M.; Mclellan, B.C.; Okitasari, M. Characterizing ‘injustices’ in clean energy transitions in Africa. Energy Sustain. Dev. 2024, 83, 101546. [Google Scholar] [CrossRef] [Scilit]
- Igliński, B.; Kiełkowska, U.; Mazurek, K.; Drużyński, S.; Pietrzak, M.B.; Kumar, G.; Veeramuthu, A.; Skrzatex, M.; Zinecker, M.; Piechota, G. Renewable energy transition in Europe in the context of renewable energy transition processes in the world: A review. Heliyon 2024, 10, e40997. [Google Scholar] [CrossRef] [Scilit] [PubMed]
- Schudy, H. Metaphors of transformation: An analysis of the discourse on energy transition in the Turow and Eastern Wielkopolska brown coal region. Ruch Praw. Ekon. I Socjol. 2025, 87, 305. [Google Scholar] [CrossRef] [Scilit]
- Wang, Q.; Hou, Z.; Guo, Y.; Huang, L.; Fang, Y.; Sun, W.; Ge, Y. Enhancing energy transition through sector coupling: A review of technologies and models. Energies 2023, 16, 5226. [Google Scholar] [CrossRef] [Scilit]
- Meng, J.; Zhao, W.; Li, J.; Ma, S.; Wu, X.; Guo, S.; Zhang, X. Technologies and gaps in deep decarbonization of hard-to-abate industrial sectors. Nat. Rev. Clean Technol. 2025, 1, 578–595. [Google Scholar]
- Sorknæs, P.; Johannsen, R.M.; Korberg, A.D.; Nielsen, T.B.; Petersen, U.R.; Mathiesen, B.V. Electrification of the industrial sector in 100% renewable energy scenarios. Energy 2022, 254, 124339. [Google Scholar] [CrossRef] [Scilit]
- Ajanovic, A.; Haas, R. Renewable energy systems implementation in road transport: Prospects and impediments. Renew. Energy Environ. Sustain. 2021, 6, 39. [Google Scholar] [CrossRef] [Scilit]
- International Energy Agency (IEA). Global Critical Minerals Outlook 2025; IEA: Paris, France, 2025; Available online: https://www.iea.org/reports/global-critical-minerals-outlook-2025 (accessed on 20 February 2026).
- Capitanescu, F.; Gibon, T. The energy transition’s hidden iceberg: Practical barriers and proposed solutions toward sustainable electricity systems. IEEE Energy Sustain. Mag. 2025, 1, 66–76. [Google Scholar] [CrossRef] [Scilit]
- Grasso, M.; Delatin Rodrigues, D. Sustainability transitions through fossil infrastructure deactivation. Sustainability 2025, 17, 6465. [Google Scholar] [CrossRef] [Scilit]
- Lu, J.; Li, X. Transmission expansion planning for renewable-energy-dominated power grids considering climate impact. J. Mod. Power Syst. Clean. Energy 2024, 12, 1737–1748. [Google Scholar]
- International Energy Agency (IEA). Electricity Grids and Secure Energy Transitions: Enhancing the Foundations of Resilient, Sustainable and Affordable Power Systems; IEA: Paris, France, 2023; Available online: https://www.iea.org/reports/electricity-grids-and-secure-energy-transitions (accessed on 20 February 2026).
- Khosravani, A.; DeHaan, M.; Billings, B.W.; Powell, K.M. Electrification of residential and commercial buildings integrated with hybrid renewable energy systems: A techno-economic analysis. Energy 2024, 302, 131893. [Google Scholar] [CrossRef] [Scilit]
- International Renewable Energy Agency (IRENA). World Energy Transitions Outlook 2023: 1.5 °C Pathway; International Renewable Energy Agency: Abu Dhabi, United Arab Emirates, 2023. Available online: https://www.irena.org/-/media/Files/IRENA/Agency/Publication/2023/Jun/IRENA_World_energy_transitions_outlook_summary_2023.pdf (accessed on 20 February 2026).
- Bridge, G.; Gailing, L. New energy spaces: Towards a geographical political economy of energy transition. Environ. Plan. A Econ. Space 2020, 52, 1037–1050. [Google Scholar] [CrossRef] [Scilit]
- Intergovernmental Panel on Climate Change (IPCC). Climate Change 2023: Synthesis Report; Contribution of Working Groups I, II and III to the Sixth Assessment Report of the Intergovernmental Panel on Climate Change; IPCC: Geneva, Switzerland, 2023; Available online: https://www.ipcc.ch/report/ar6/syr/downloads/report/IPCC_AR6_SYR_FullVolume.pdf (accessed on 20 February 2026).
- International Renewable Energy Agency (IRENA). Renewable Power Generation Costs in 2023; International Renewable Energy Agency: Abu Dhabi, United Arab Emirates, 2024. Available online: https://www.irena.org/-/media/Files/IRENA/Agency/Publication/2024/Sep/IRENA_Renewable_power_generation_costs_in_2023.pdf (accessed on 20 February 2026).
- Intergovernmental Panel on Climate Change (IPCC). Innovation, technology development and transfer. In Climate Change 2022: Mitigation of Climate Change; Contribution of Working Group III to the Sixth Assessment Report of the Intergovernmental Panel on Climate Change; IPCC: Geneva, Switzerland, 2022; Available online: https://www.ipcc.ch/report/ar6/wg3/chapter/chapter-16/ (accessed on 20 February 2026).
- Khan, K.; Su, C.W.; Rehman, A.U.; Ullah, R. Is technological innovation a driver of renewable energy? Technol. Soc. 2022, 70, 102044. [Google Scholar] [CrossRef] [Scilit]
- International Energy Agency (IEA). World Energy Outlook 2023; IEA: Paris, France, 2023; Available online: https://www.iea.org/reports/world-energy-outlook-2023 (accessed on 20 February 2026).
- International Energy Agency (IEA). Energy Technology Perspectives 2023; IEA: Paris, France, 2023; Available online: https://www.iea.org/reports/energy-technology-perspectives-2023 (accessed on 20 February 2026).
- Allan, B.; Lewis, J.I.; Oatley, T. Green industrial policy and the global transformation of climate politics. Glob. Environ. Politics 2021, 21, 1–19. [Google Scholar] [CrossRef] [Scilit]
- Adelekan, O.A.; Ilugbusi, B.S.; Adisa, O.; Obi, O.C.; Awonuga, K.F.; Asuzu, O.F.; Ndubuisi, N.L. Energy transition policies: A global review of shifts towards renewable sources. Eng. Sci. Technol. J. 2024, 5, 272–287. [Google Scholar] [CrossRef] [Scilit]
- Intergovernmental Panel on Climate Change (IPCC). Climate Change 2022: Mitigation of Climate Change; Contribution of Working Group III to the Sixth Assessment Report of the Intergovernmental Panel on Climate Change; Cambridge University Press: Cambridge, UK, 2022; Available online: https://www.ipcc.ch/report/ar6/wg3/ (accessed on 20 February 2026).
- Polzin, F. Mobilizing private finance for low-carbon innovation—A systematic review of barriers and solutions. Renew. Sustain. Energy Rev. 2017, 77, 525–535. [Google Scholar]
- Khan, J.; Johansson, B. Adoption, implementation and design of carbon pricing policy instruments. Energy Strategy Rev. 2022, 40, 100801. [Google Scholar] [CrossRef] [Scilit]
- Creutzig, F.; Roy, J.; Devine-Wright, P.; Díaz-José, J.; Geels, F.W.; Grubler, A.; Maïzi, N.; Masanet, E.; Mulugetta, Y.; Onyige, C.D.; et al. Demand, services and social aspects of mitigation. In Climate Change 2022: Mitigation of Climate Change; Contribution of Working Group III to the Sixth Assessment Report of the Intergovernmental Panel on Climate Change; Cambridge University Press: Cambridge, UK, 2022; pp. 503–612. Available online: https://www.ipcc.ch/report/ar6/wg3/chapter/chapter-5/ (accessed on 20 February 2026).
- United Nations Framework Convention on Climate Change (UNFCCC). United Nations Framework Convention on Climate Change. United Nations Treaty Ser. 1992, 1771, 107. Available online: https://unfccc.int/documents/649617 (accessed on 20 February 2026).
- United Nations. Paris Agreement. United Nations Treaty Collection. 2015. Available online: https://unfccc.int/sites/default/files/english_paris_agreement.pdf (accessed on 20 February 2026).
- Winkler, H.; Mantlana, B.; Letete, T. Transparency of action and support in the Paris Agreement. Clim. Policy 2017, 17, 853–872. [Google Scholar] [CrossRef] [Scilit]
- International Renewable Energy Agency (IRENA). Innovation Landscape for Smart Electrification: Decarbonising End-Use Sectors with Renewable Power; IRENA: Abu Dhabi, United Arab Emirates, 2023. Available online: https://www.irena.org/-/media/Files/IRENA/Agency/Publication/2023/Jun/IRENA_Innovation_landscape_smart_electrification_2023.pdf (accessed on 20 February 2026).
- International Energy Agency (IEA). Net Zero Roadmap: A Global Pathway to Keep the 1.5 °C Goal in Reach (2023 Update); IEA: Paris, France, 2023; Available online: https://www.iea.org/reports/net-zero-roadmap-a-global-pathway-to-keep-the-15-c-goal-in-reach (accessed on 20 February 2026).
- Akizu, O.; Urkidi, L.; Bueno, G.; Lago, R.; Barcena, I.; Mantxo, M.; Basurko, I.; Lopez-Guede, J.M. Tracing the emerging energy transitions in the Global North and the Global South. Int. J. Hydrogen Energy 2017, 42, 18045–18063. [Google Scholar] [CrossRef] [Scilit]
- Carvalho, P.; Webster, E.; Amos, R. Comparing energy transitions in the Global South and Global North. In The Elgar Companion to Energy and Sustainability; Edward Elgar Publishing: Cheltenham, UK, 2024; pp. 183–197. [Google Scholar]
- Apergi, M.; Eicke, L.; Goldthau, A.; Hashem, M.; Huneeus, S.; de Oliveira, R.L.; Otieno, M.; Schuch, E.; Veit, K. An energy justice index for the energy transition in the global South. Renew. Sustain. Energy Rev. 2024, 192, 114238. [Google Scholar]
- Sánchez Contreras, J.; Matarán Ruiz, A.; Campos-Celador, A.; Fjellheim, E.M. Energy colonialism: A category to analyse the corporate energy transition in the Global South and North. Land 2023, 12, 1241. [Google Scholar] [CrossRef] [Scilit]
- Azubuike, S.I.; Emeseh, E.; Amakiri, D.Y. Climate change, energy transition, and the Global South: Learnings from the international framework on the ozone layer. J. Energy Nat. Resour. Law 2024, 42, 255–277. [Google Scholar] [CrossRef] [Scilit]
- Truffer, B.; Murphy, J.T.; Raven, R. The geography of sustainability transitions: Contours of an emerging theme. Environ. Innov. Soc. Transit. 2015, 17, 63–72. [Google Scholar] [CrossRef] [Scilit]
- Lema, R.; Fu, X.; Rabellotti, R. Green windows of opportunity: Latecomer development in the age of transformation toward sustainability. Ind. Corp. Change 2020, 29, 1193–1209. [Google Scholar] [CrossRef] [Scilit]
- Unruh, G.C. Understanding carbon lock-in. Energy Policy 2000, 28, 817–830. [Google Scholar] [CrossRef] [Scilit]
- Jenkins, K.; McCauley, D.; Heffron, R.; Stephan, H.; Rehner, R. Energy justice: A conceptual review. Energy Res. Soc. Sci. 2016, 11, 174–182. [Google Scholar] [CrossRef] [Scilit]
- Stern, D.I. Energy and economic growth. In Routledge Handbook of Energy Economics; Soytas, U., Sari, R., Eds.; Routledge: London, UK, 2019; pp. 28–46. [Google Scholar]
- Kikstra, J.S.; Nicholls, Z.R.J.; Smith, C.J.; Lewis, J.; Lamboll, R.D.; Byers, E.; Sandstad, M.; Meinshausen, M.; Gidden, M.J.; Rogelj, J.; et al. The IPCC Sixth Assessment Report WGIII climate assessment of mitigation pathways: From emissions to global temperatures. Geosci. Model Dev. 2022, 15, 9075–9109. [Google Scholar] [CrossRef] [Scilit]
- Bogdanov, D.; Ram, M.; Aghahosseini, A.; Gulagi, A.; Oyewo, A.S.; Child, M.; Caldera, U.; Sadovskaia, K.; Farfan, J.; Barbosa, L.; et al. Low-cost renewable electricity as the key driver of the global energy transition towards sustainability. Energy 2021, 227, 120467. [Google Scholar] [CrossRef] [Scilit]
- Meckling, J.; Nahm, J. Strategic state capacity: How states counter opposition to climate policy. Comp. Political Stud. 2022, 55, 493–523. [Google Scholar]
- Huang, C.; Lin, B. How digital economy index selection and model uncertainty will affect energy green transition. Energy Econ. 2024, 136, 107774. [Google Scholar] [CrossRef] [Scilit]
- Wu, T.H.; Huang, S.W.; Lin, M.C.; Wang, H.H. Energy security performance evaluation revisited: From the perspective of the energy supply chain. Renew. Sustain. Energy Rev. 2023, 182, 113375. [Google Scholar] [CrossRef] [Scilit]
- Kartal, M.T.; Shahbaz, M.; Taşkın, D.; Depren, S.K.; Ayhan, F. How are energy transition and energy-related R&D investments effective in enabling decarbonization? Evidence from Nordic Countries by novel WLMC model. J. Environ. Manag. 2024, 365, 121664. [Google Scholar]
- Lund, P.D.; Skytte, K.; Bolwig, S.; Bolkesjø, T.F.; Bergaentzlé, C.; Gunkel, P.A.; Kirkerud, J.G.; Klitkou, A.; Koduvere, H.; Gravelsins, A.; et al. Pathway analysis of a zero-emission transition in the Nordic-Baltic region. Energies 2019, 12, 3337. [Google Scholar]
- Johansen, K. Blowing in the wind: A brief history of wind energy and wind power technologies in Denmark. Energy Policy 2021, 152, 112139. [Google Scholar] [CrossRef] [Scilit]
- Johansen, K. Wind energy in Denmark: A short history [History]. IEEE Power Energy Mag. 2021, 19, 94–102. [Google Scholar] [CrossRef] [Scilit]
- Ali, M.I.; Ceh, B.; Salahuddin, M. The energy-growth nexus in Canada: New empirical insights. Environ. Sci. Pollut. Res. 2023, 30, 122822–122839. [Google Scholar] [CrossRef] [Scilit]
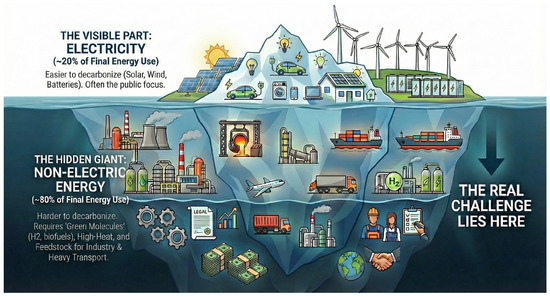
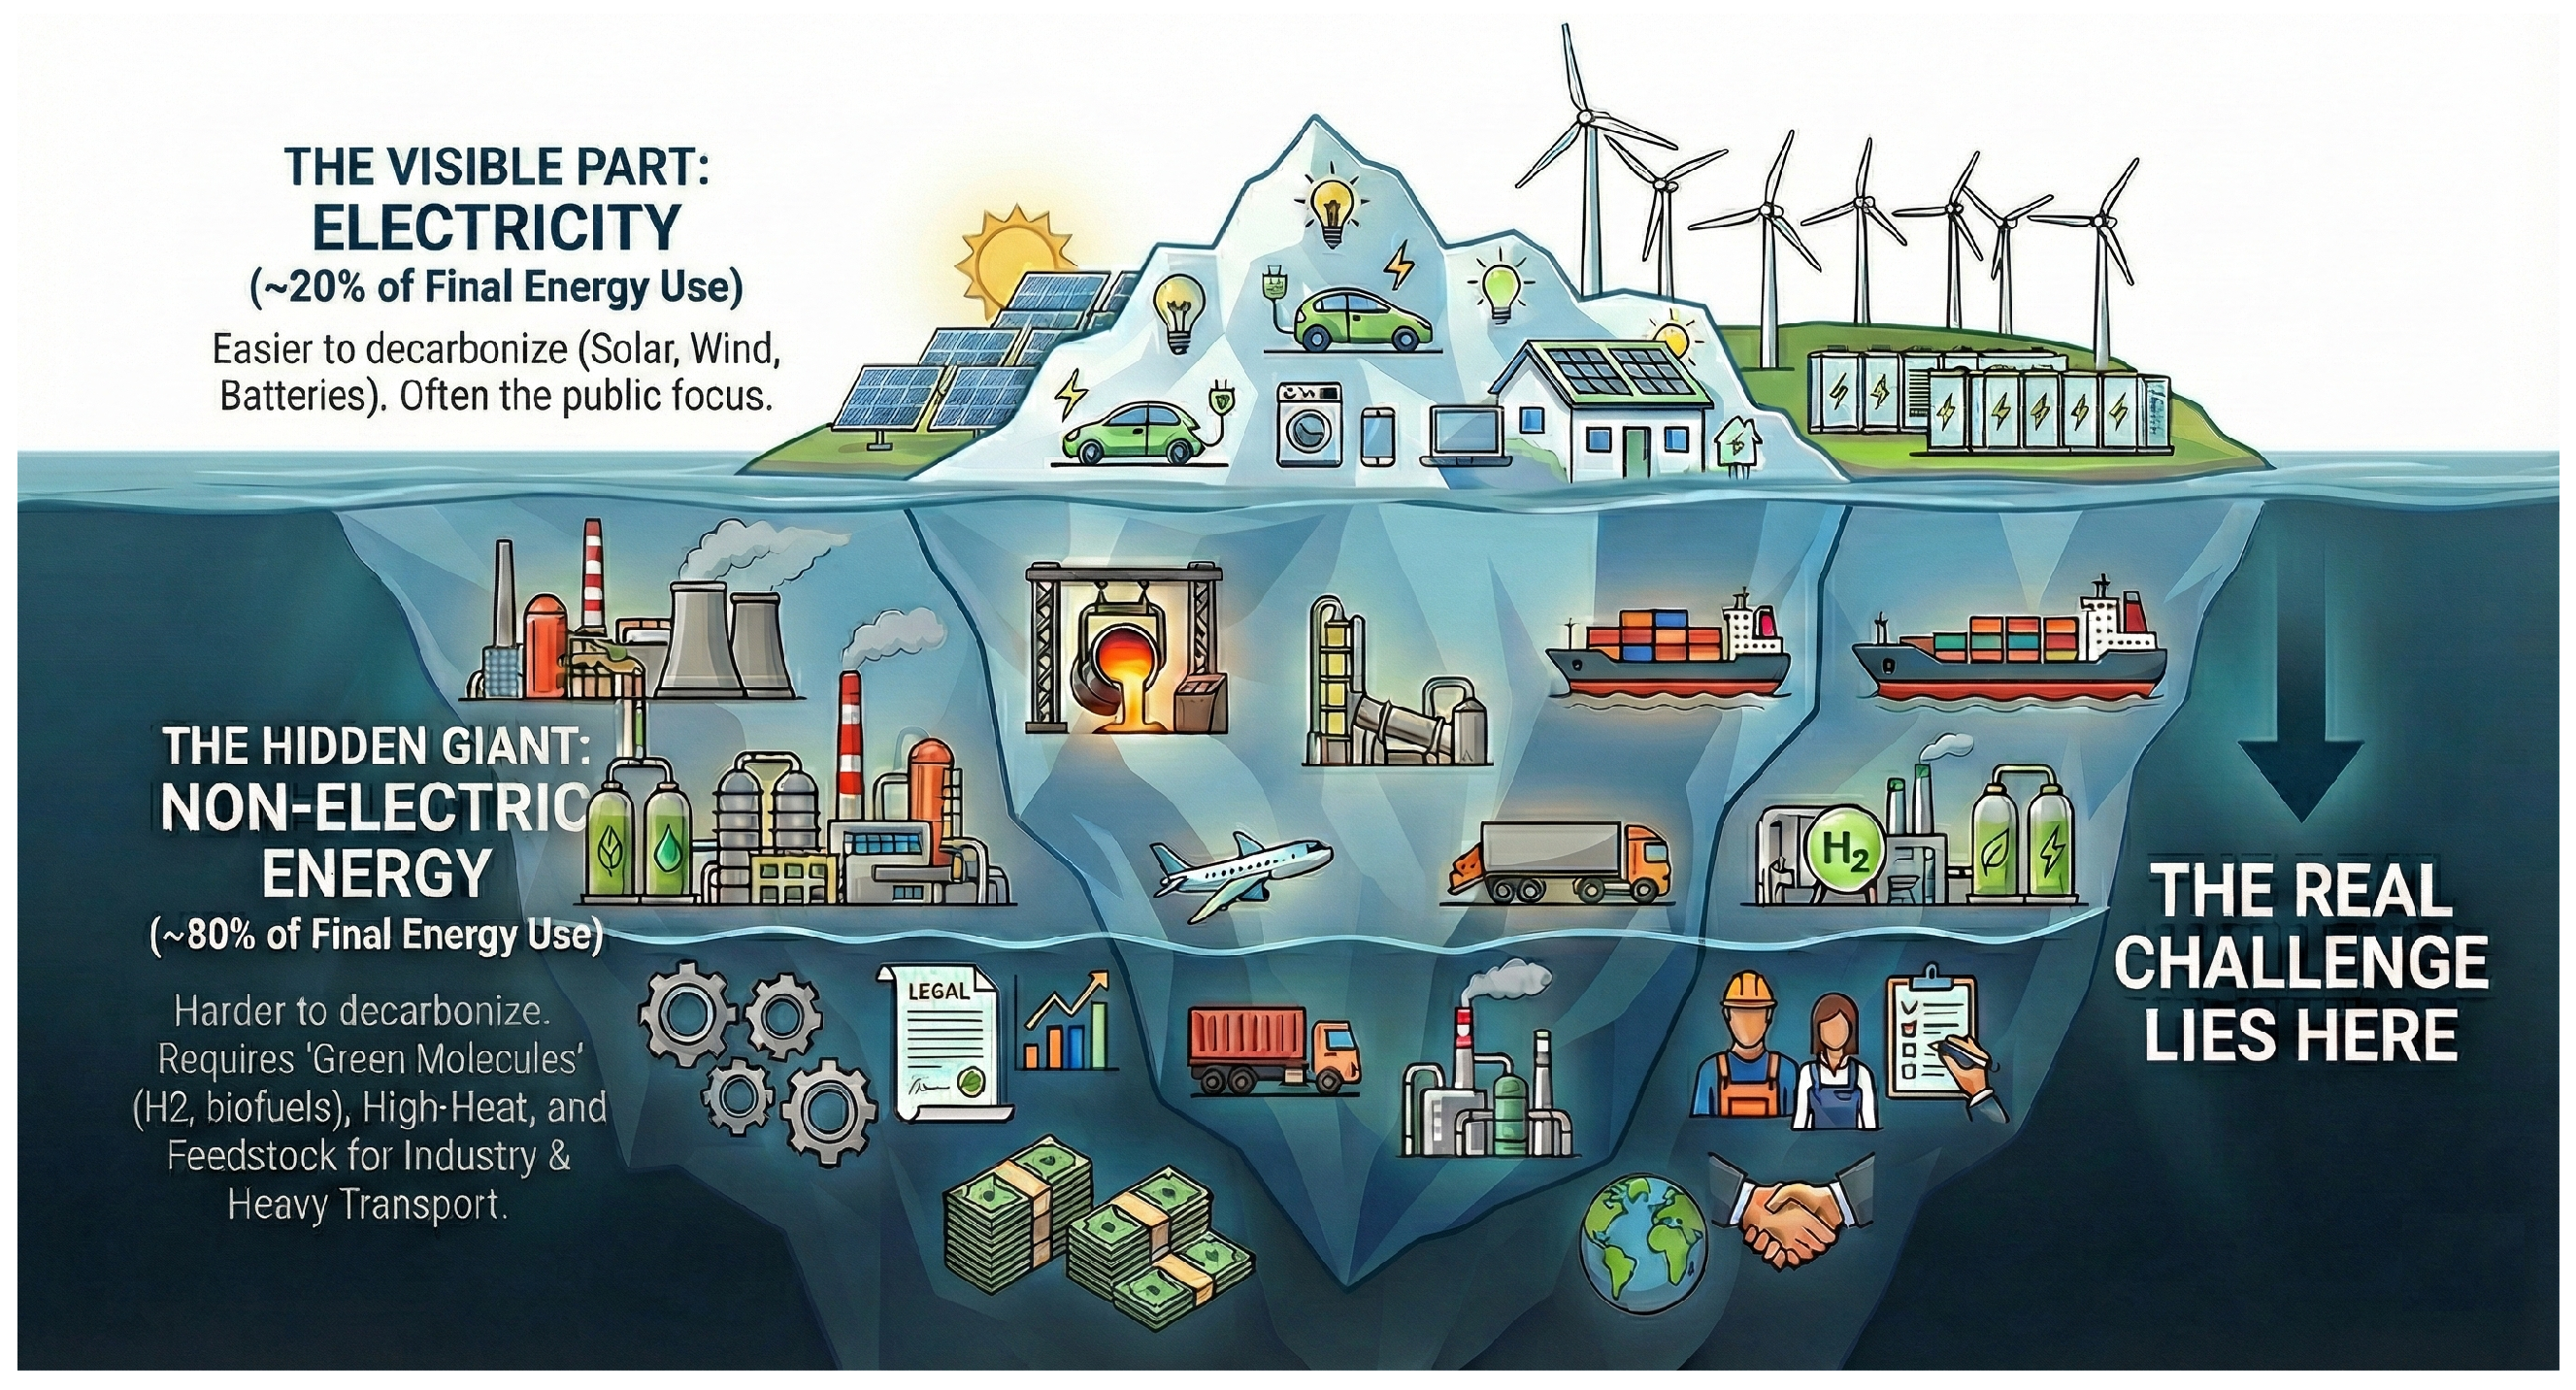
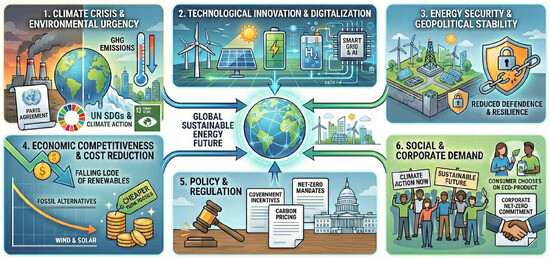
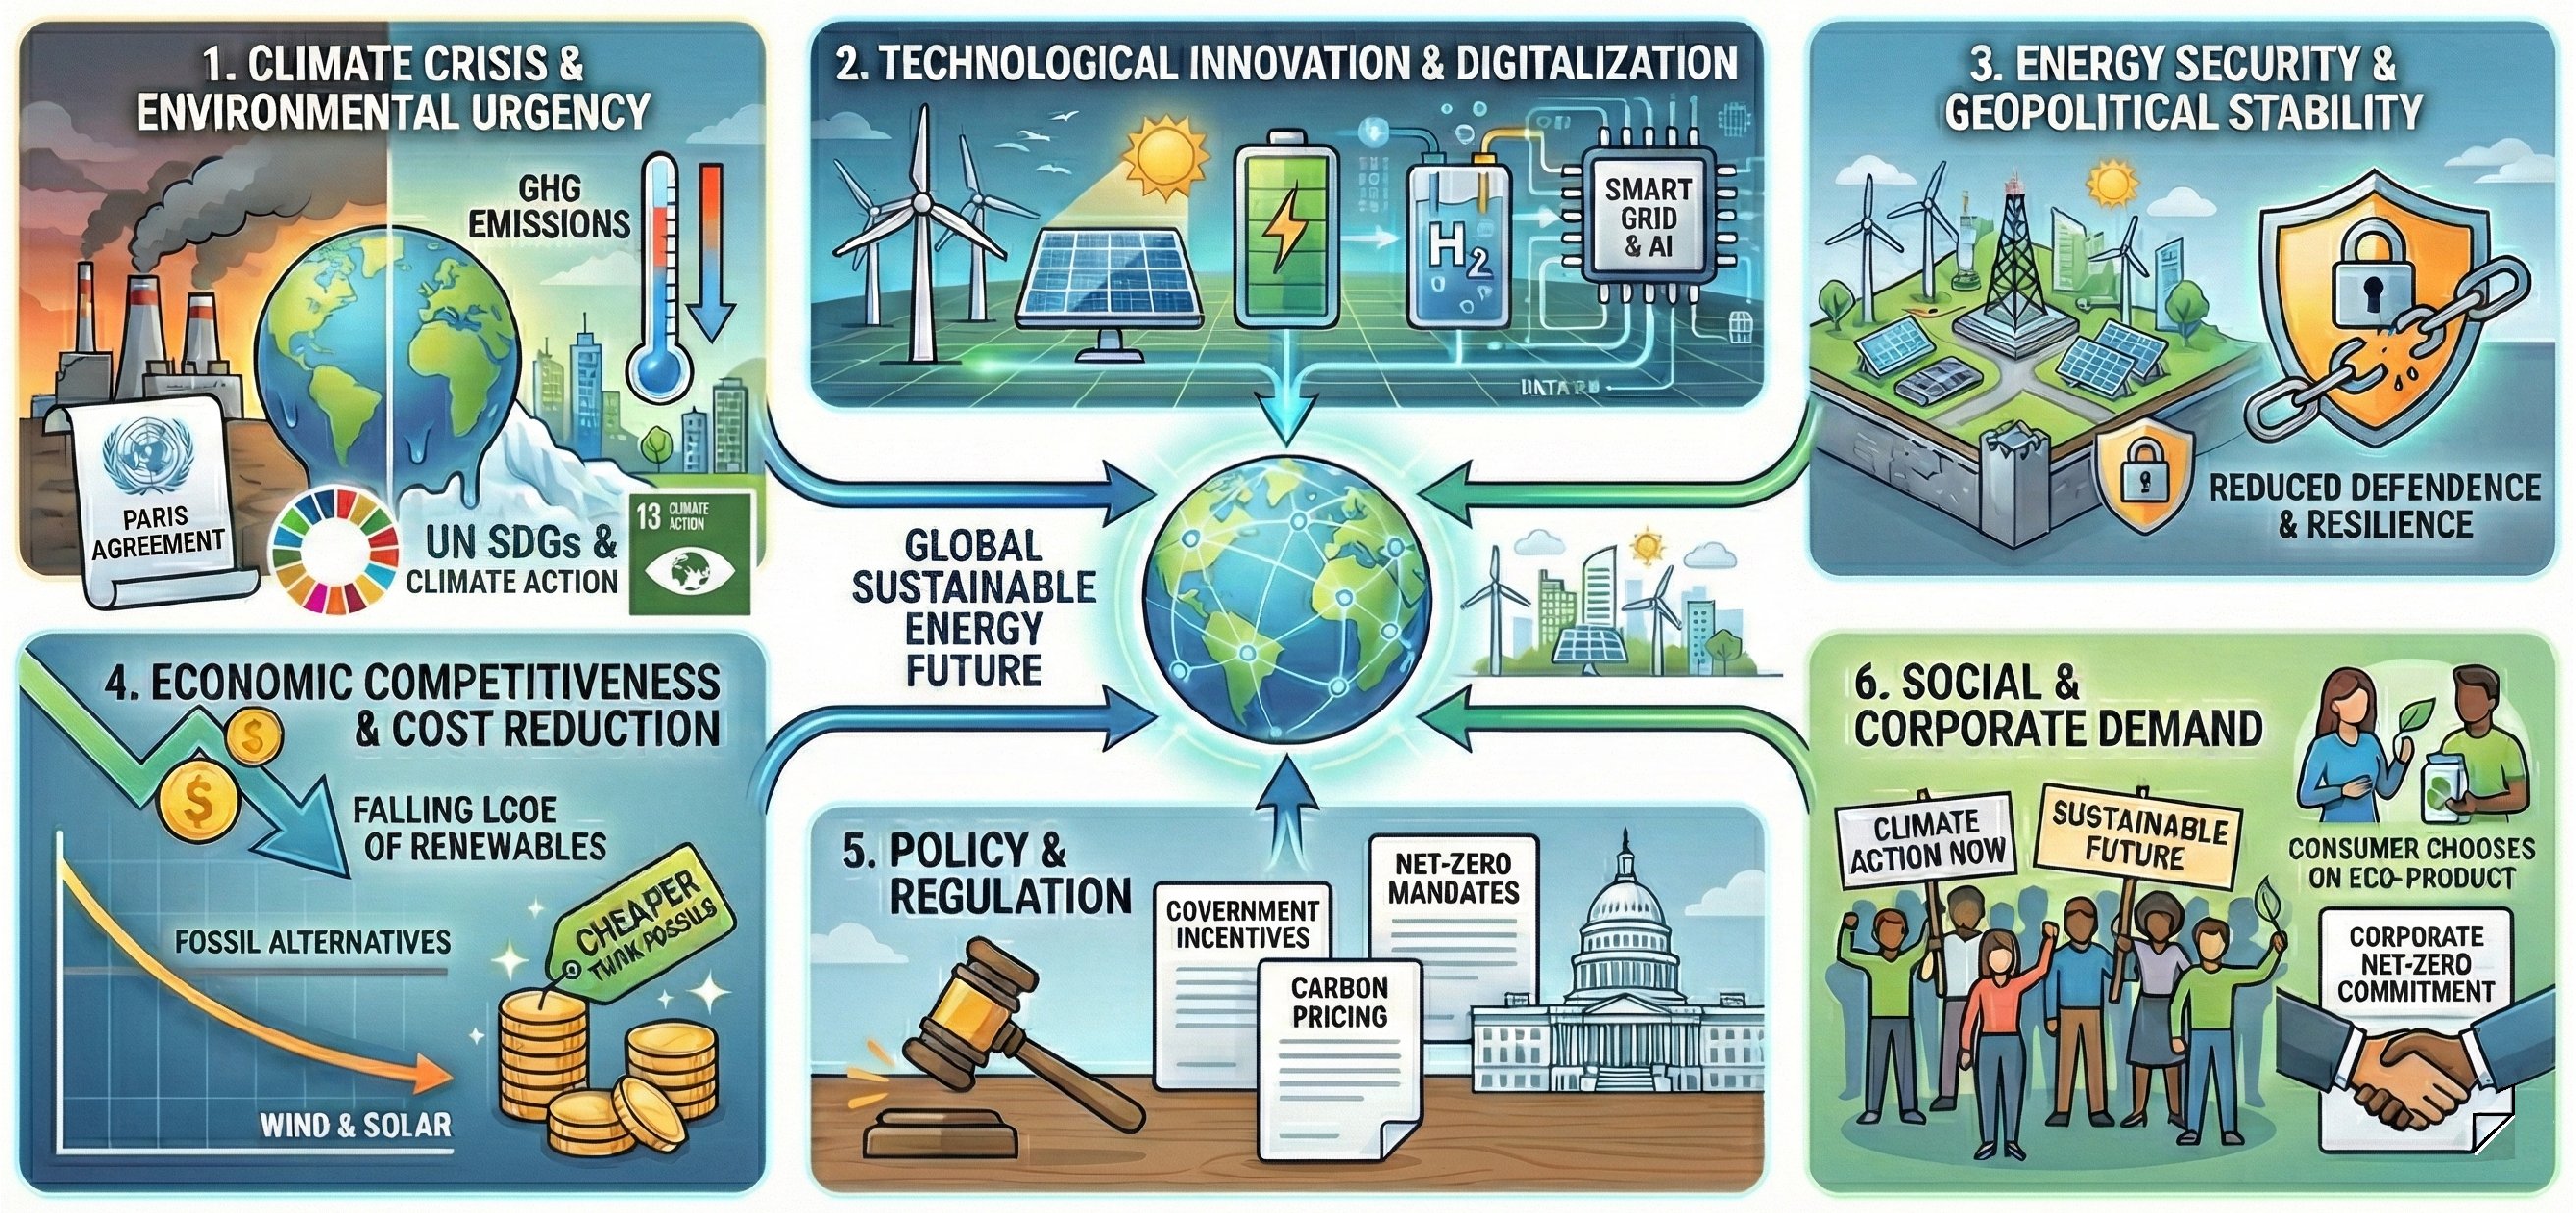
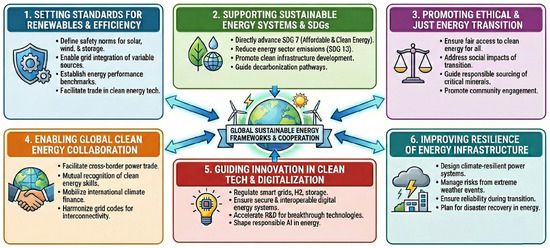
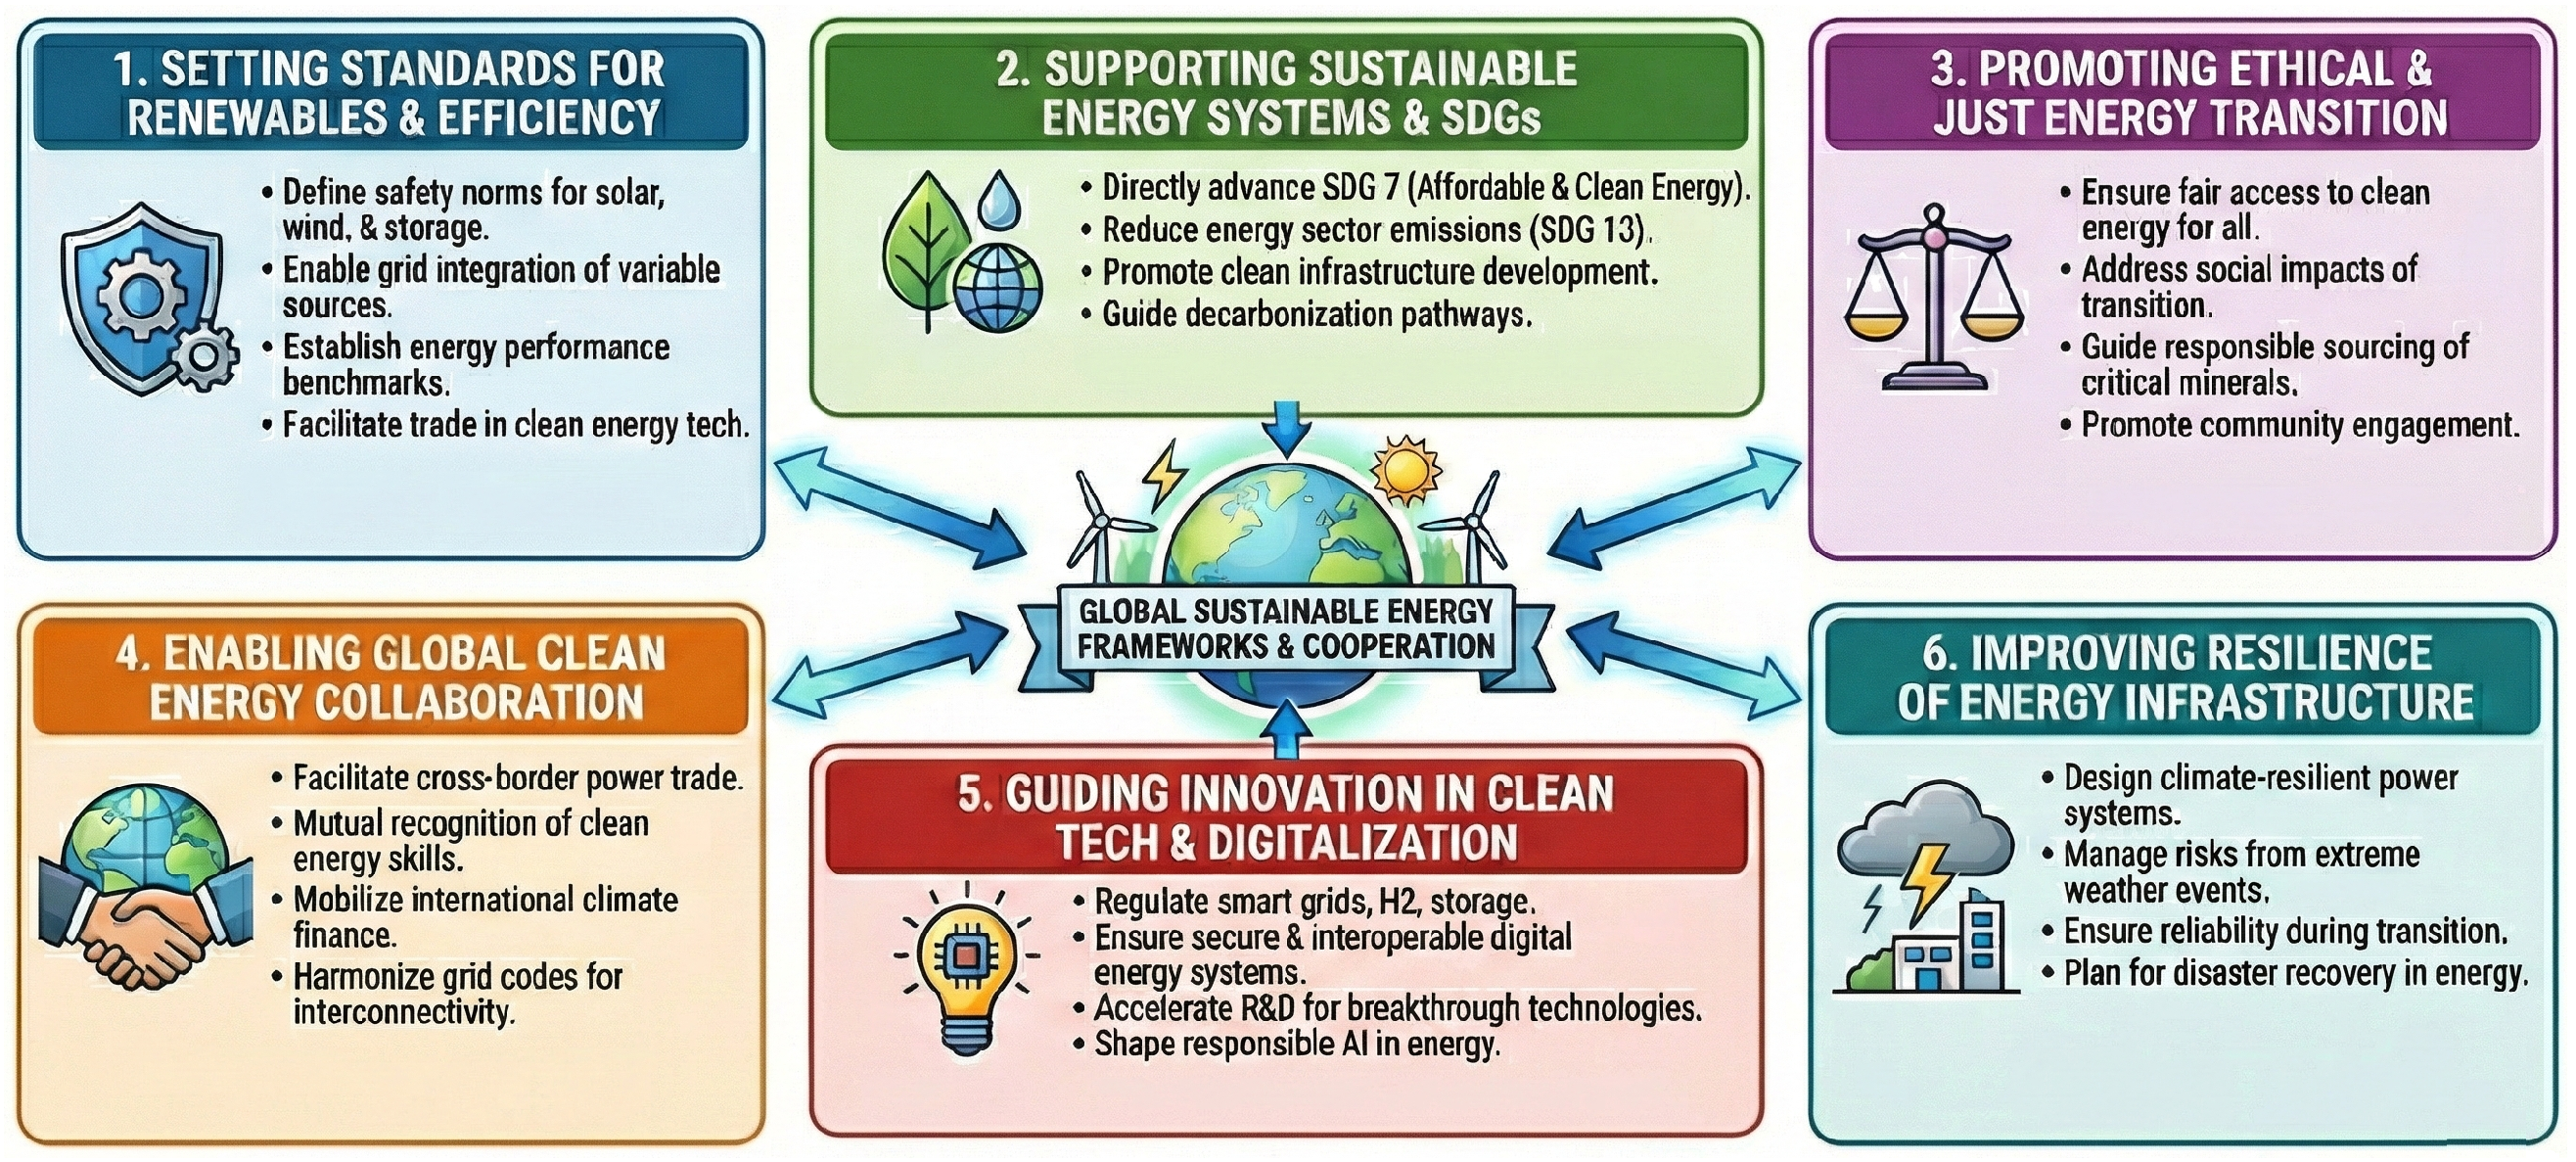
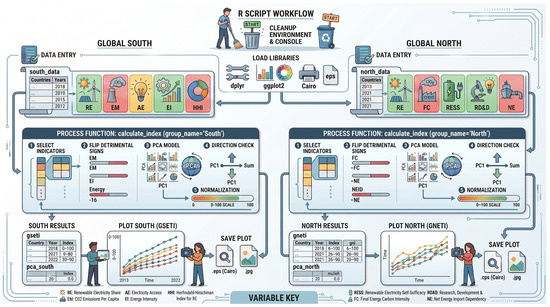
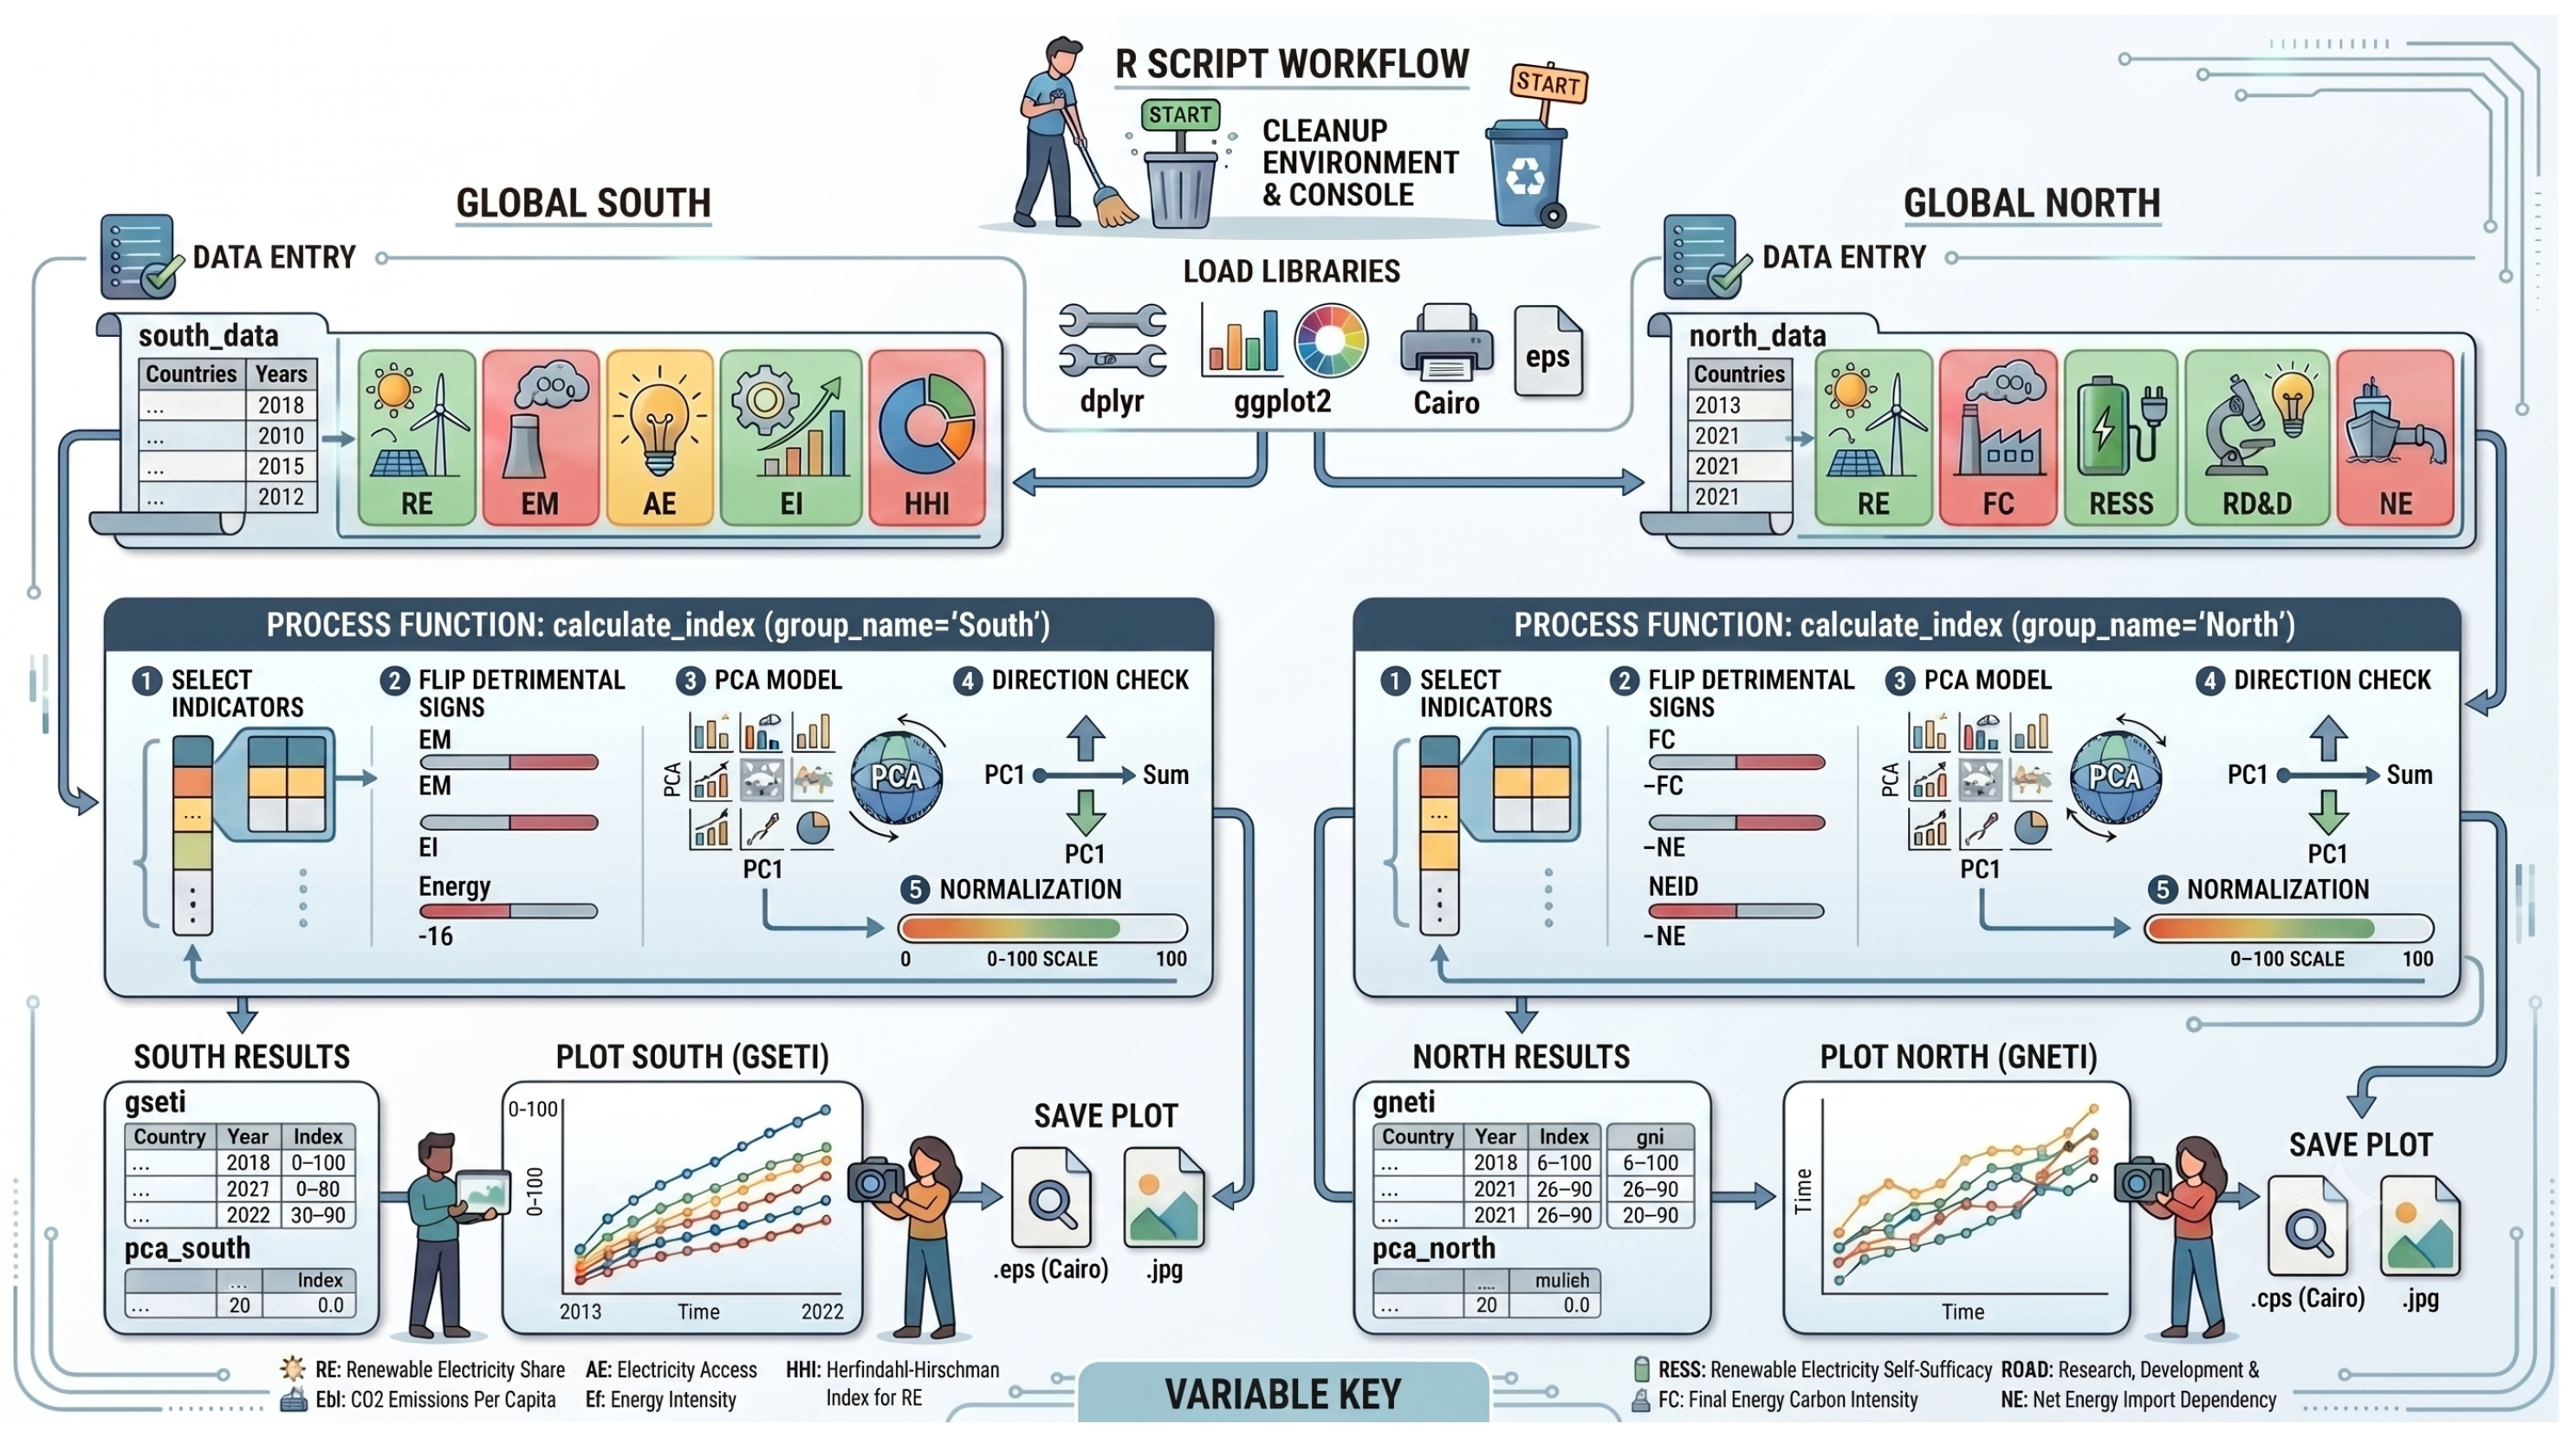
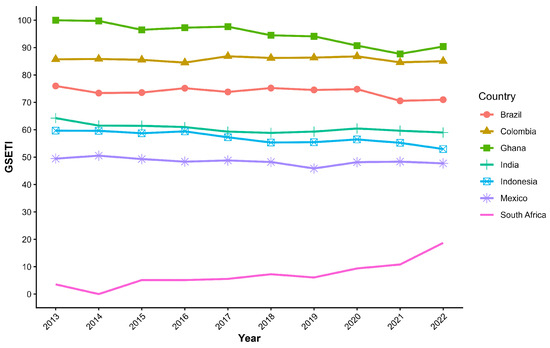
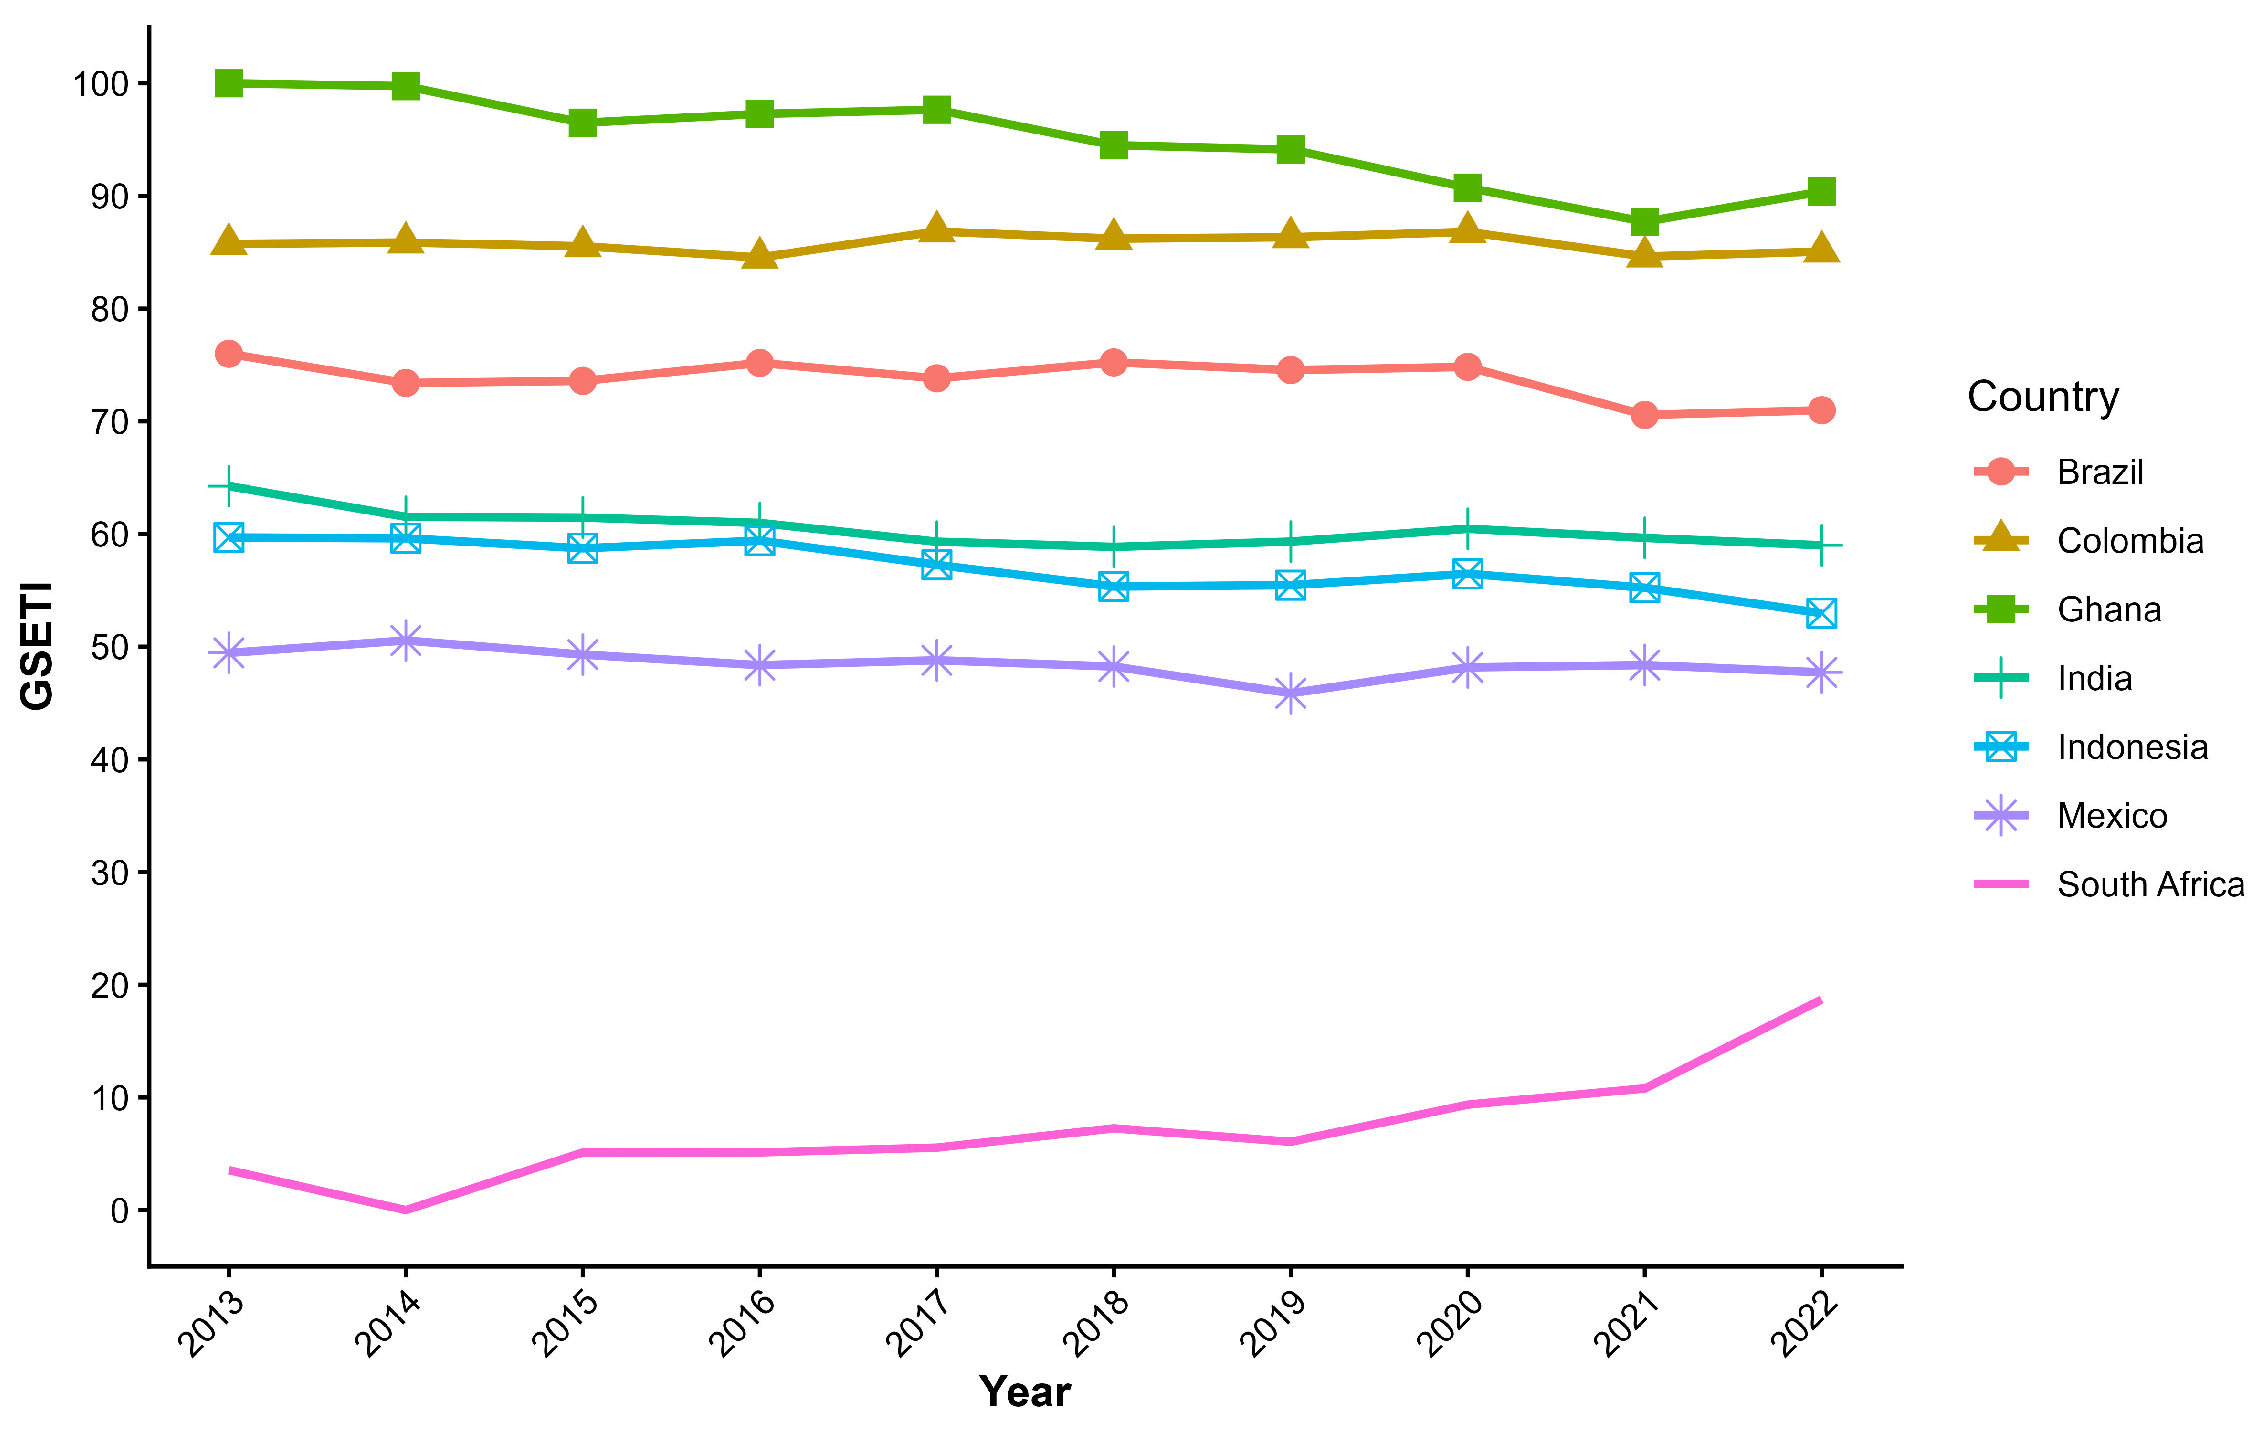
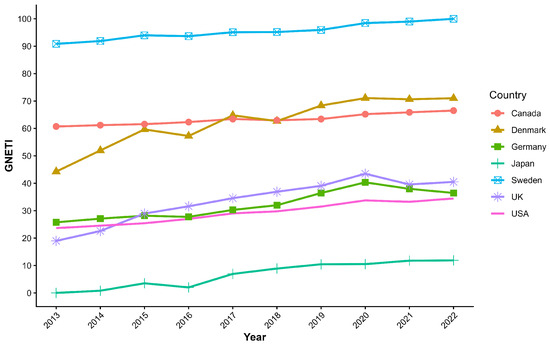
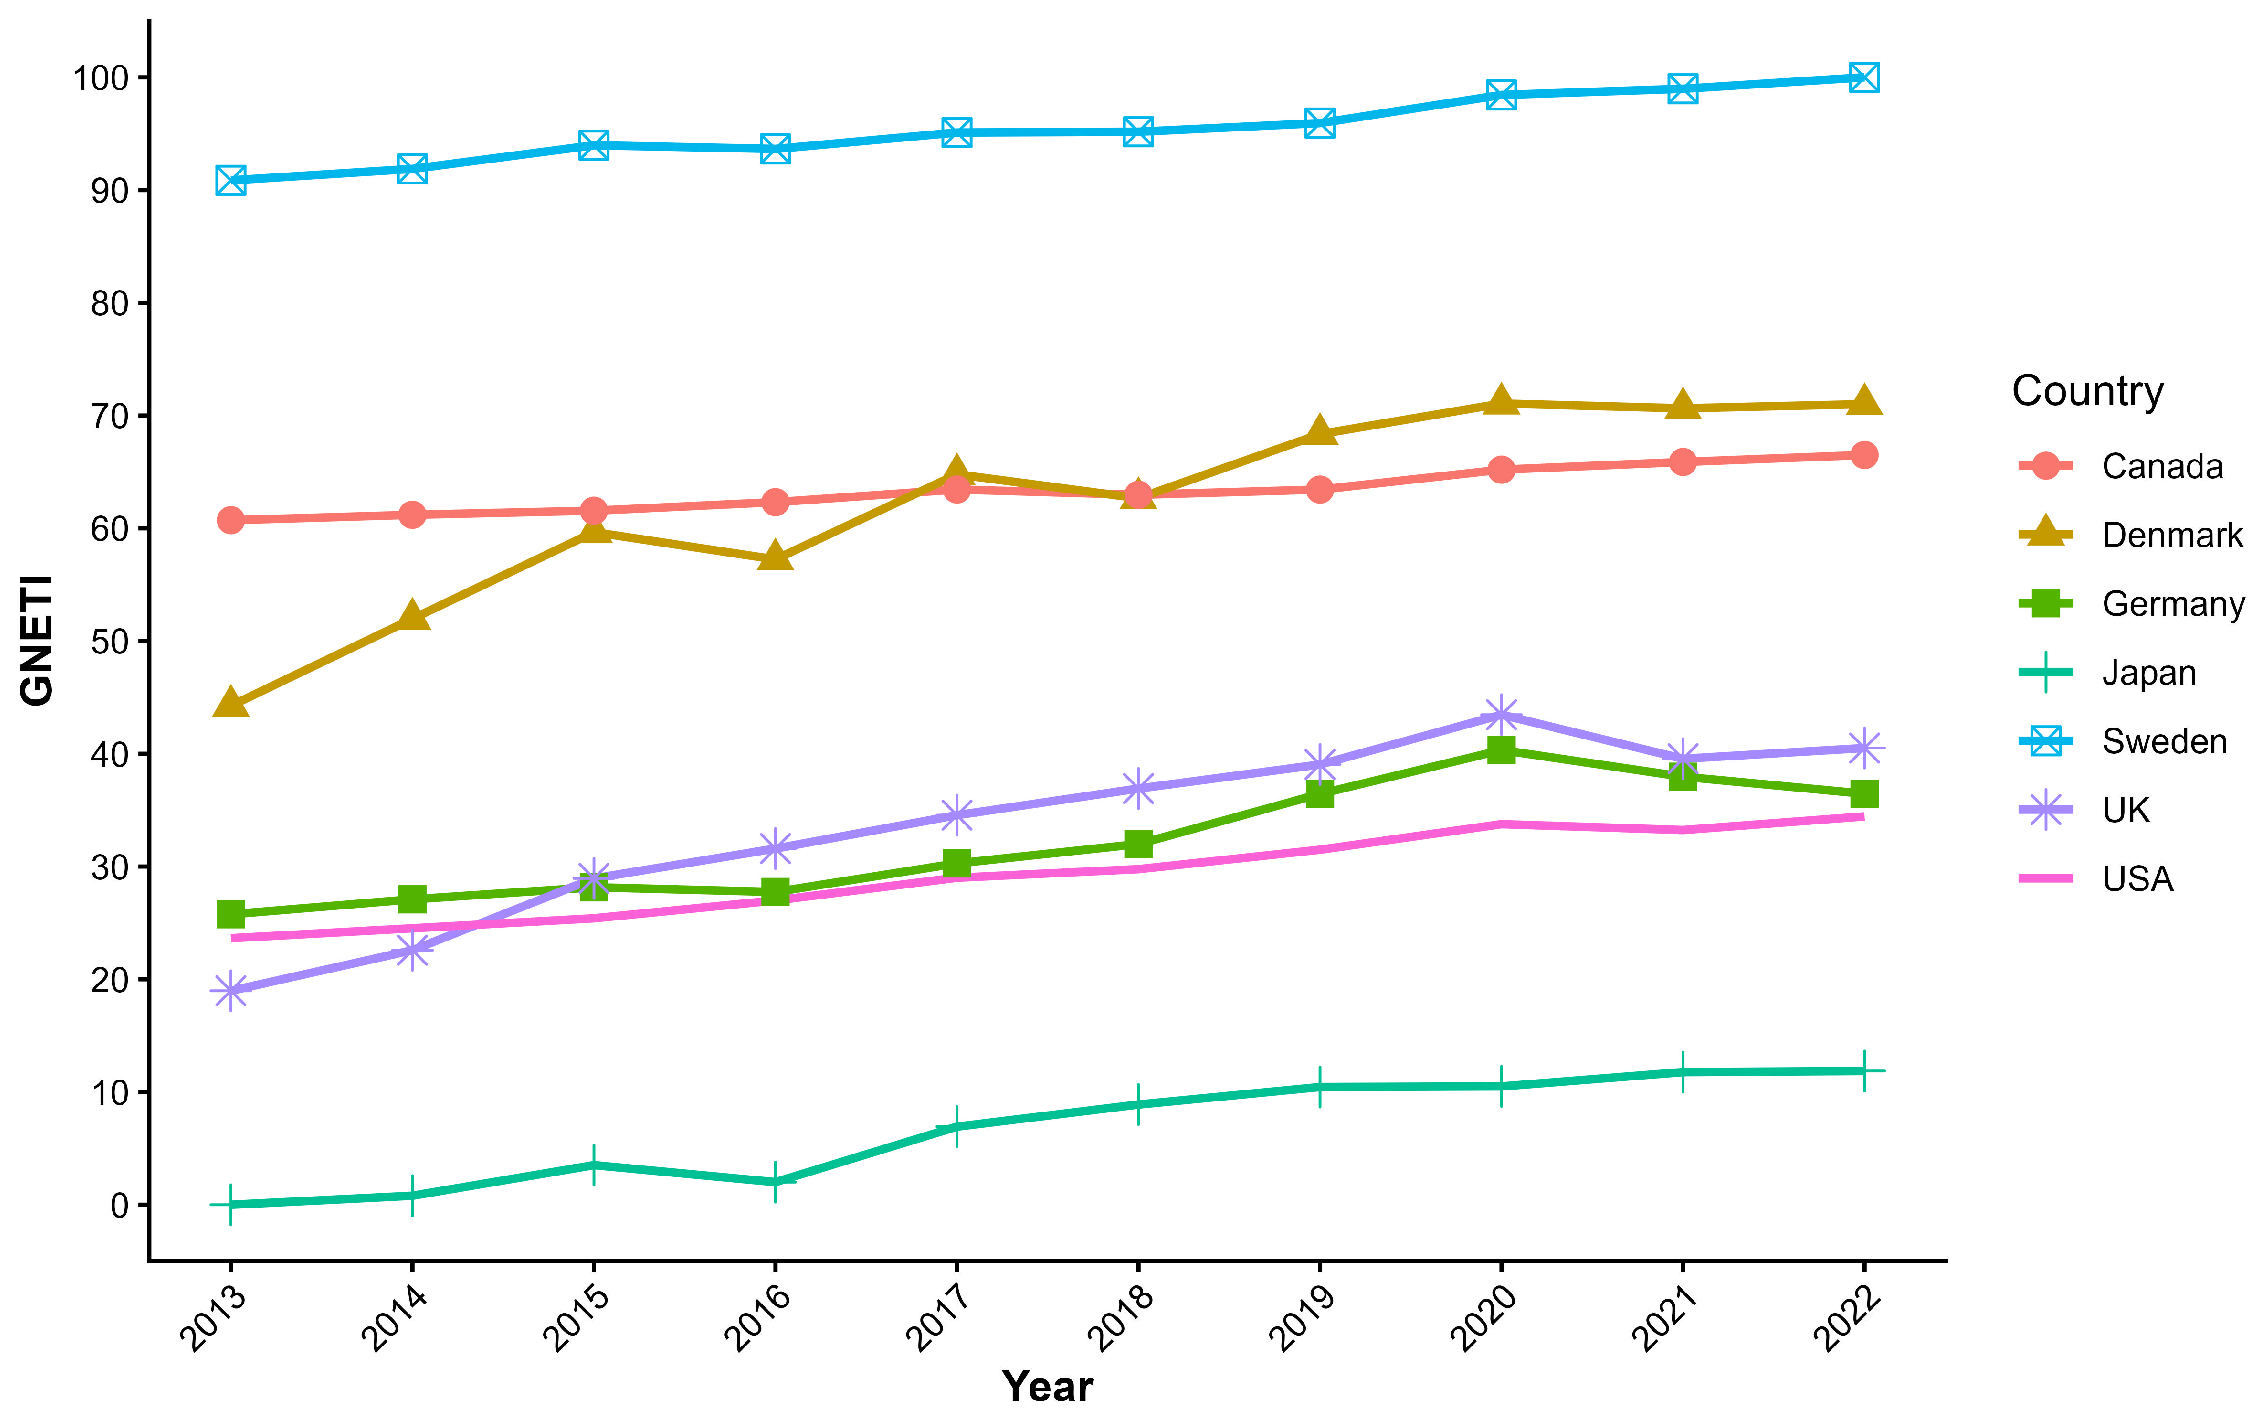
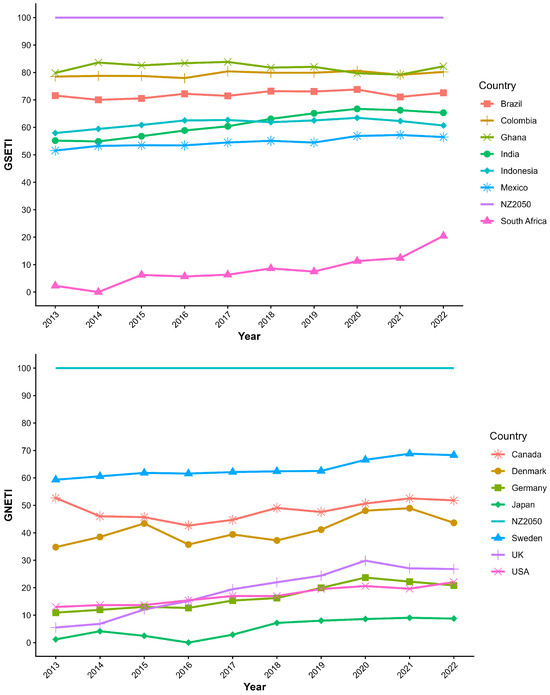
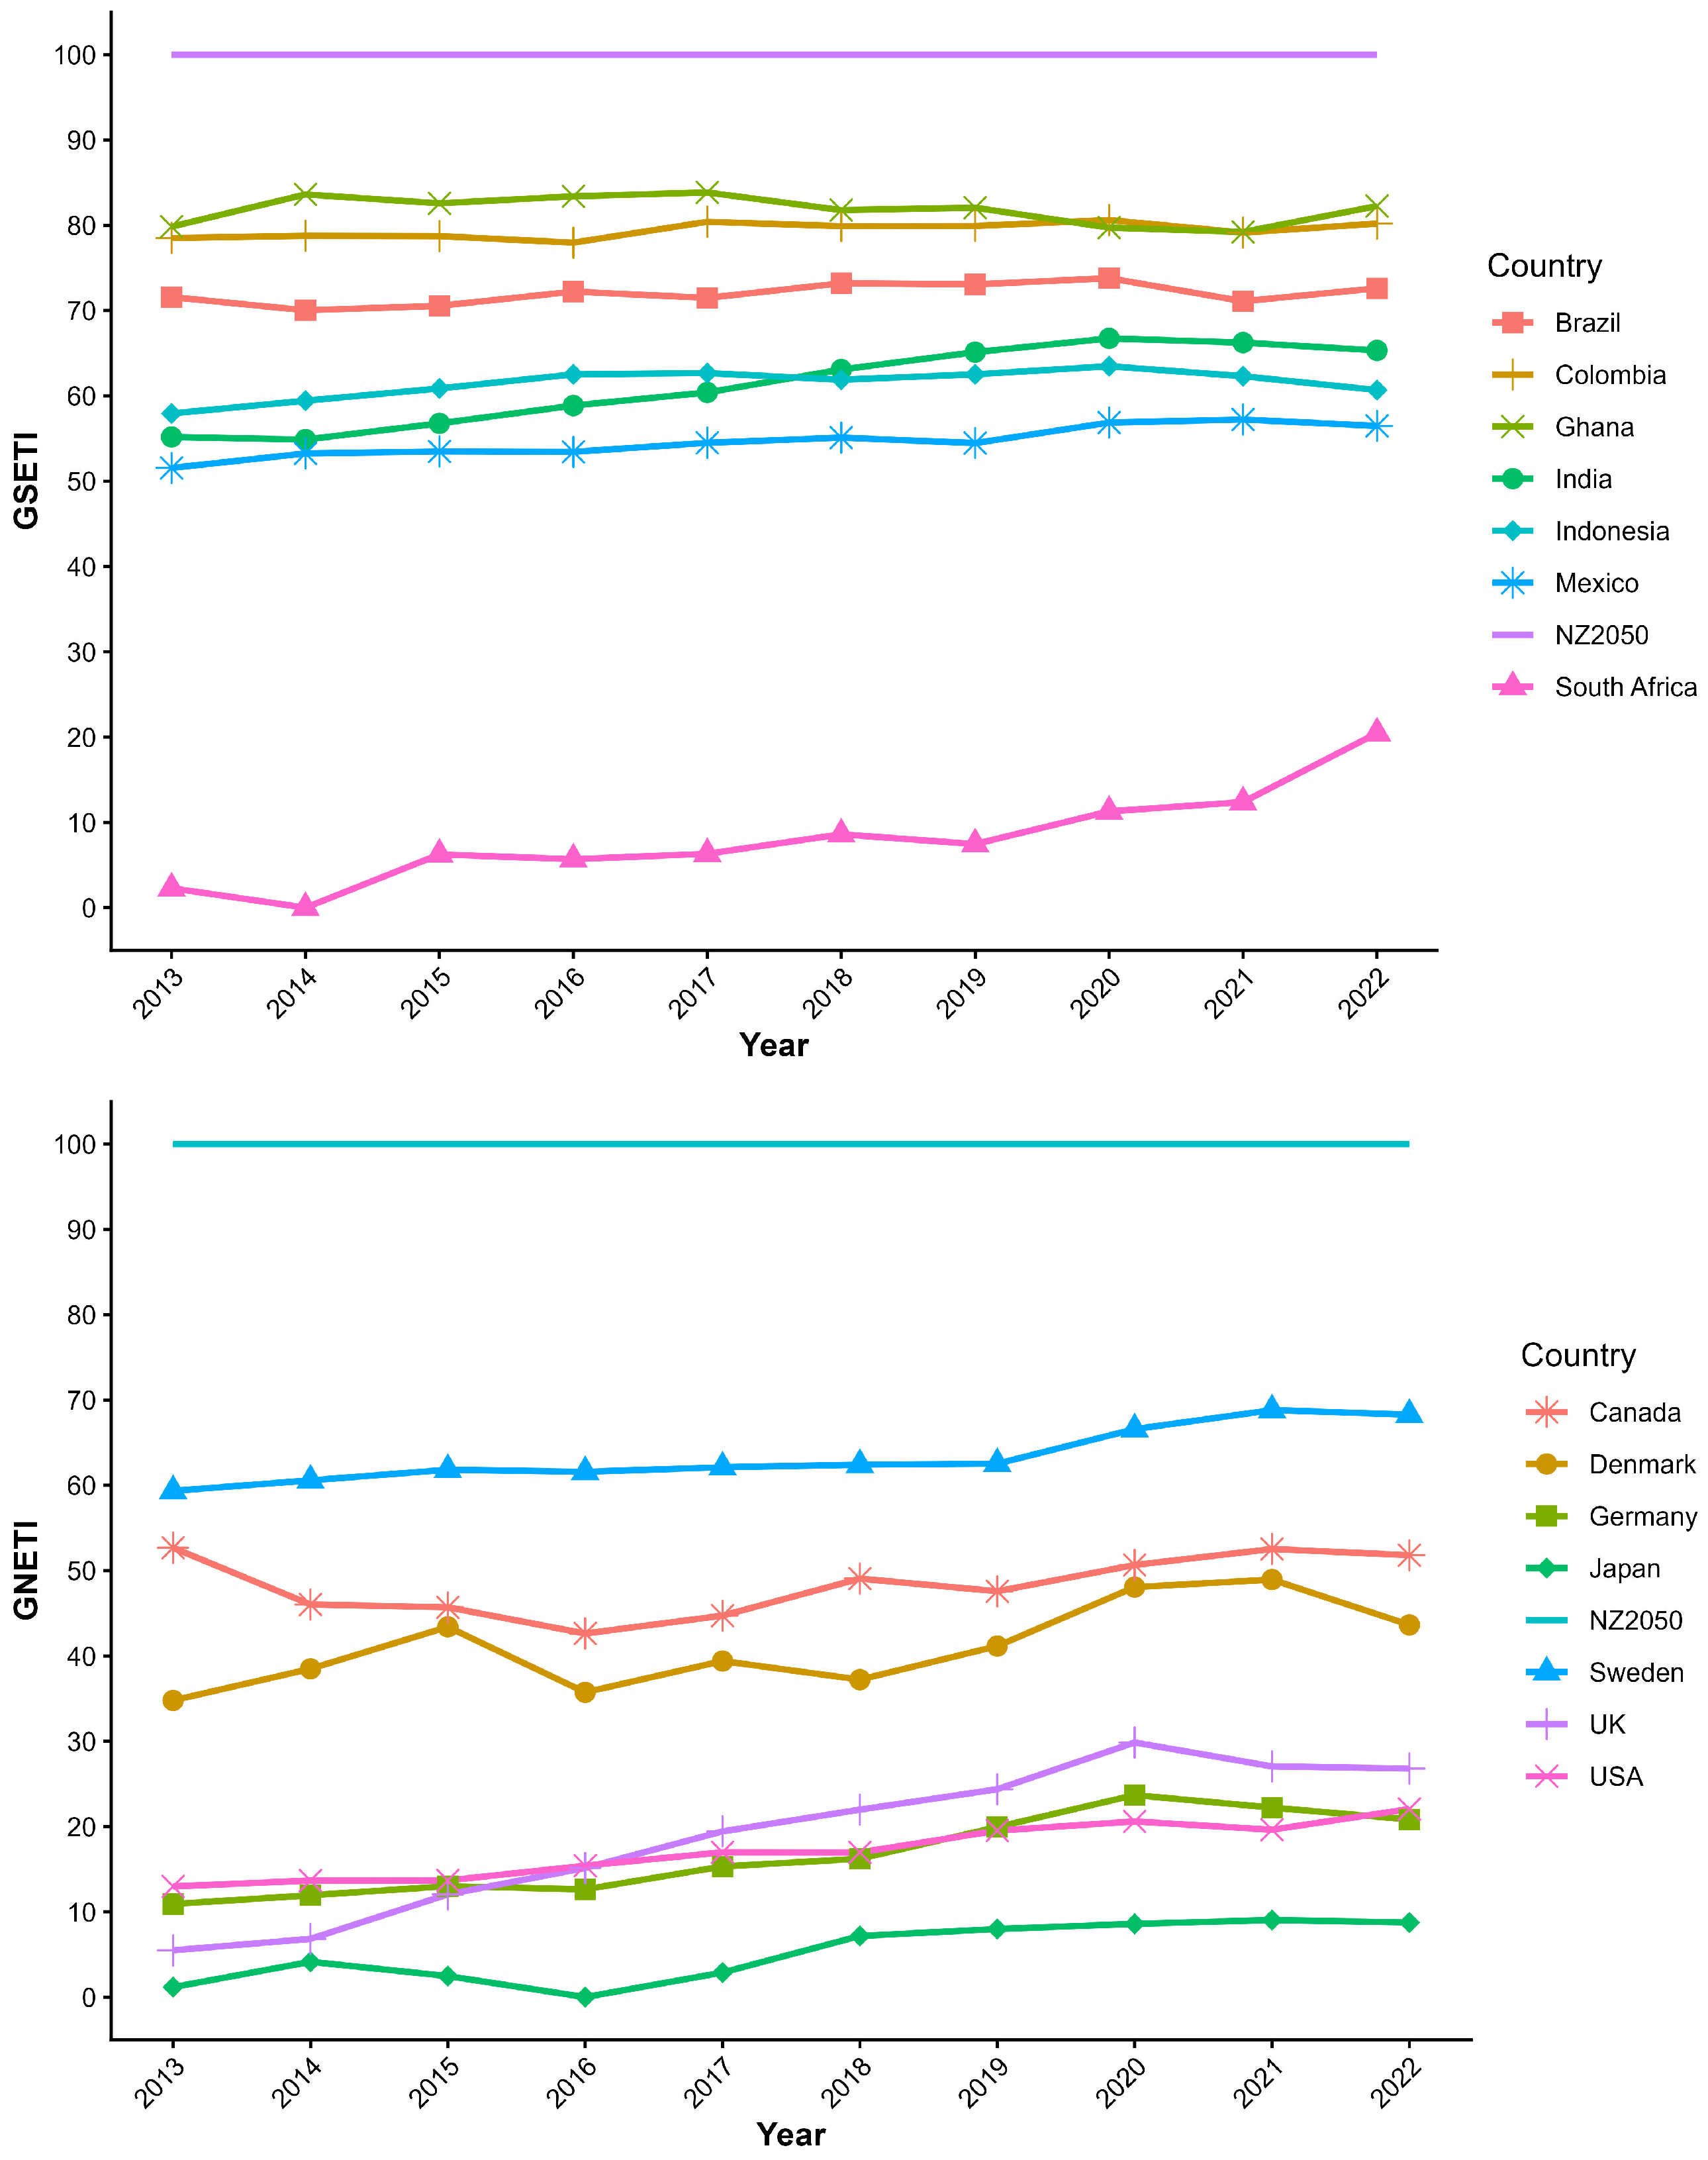

Disclaimer/Publisher’s Note: The statements, opinions and data contained in all publications are solely those of the individual author(s) and contributor(s) and not of MDPI and/or the editor(s). MDPI and/or the editor(s) disclaim responsibility for any injury to people or property resulting from any ideas, methods, instructions or products referred to in the content. |
© 2026 by the authors. Licensee MDPI, Basel, Switzerland. This article is an open access article distributed under the terms and conditions of the Creative Commons Attribution (CC BY) license.