


Abstract
Background: Predicting rehabilitation outcomes at admission supports tailored therapy plans and efficient use of resources for patients undergoing intensive inpatient rehabilitation, including those with stroke, orthopedic, and other neurological conditions. Nonetheless, current machine learning (ML) methods face limitations, including the ceiling effect in absolute functional gain measures, the uniform treatment of diverse patient groups, and reliance on black-box models that lack clinical transparency. Methods: This retrospective observational study analyzed a fully anonymized, publicly available dataset of 3419 patients admitted to the intensive rehabilitation unit at IRCCS San Raffaele Hospital, Rome, Italy, from 2015 to 2018. To mitigate the ceiling effect, a normalized Barthel Index gain metric was developed. K-means clustering (K = 2, trained solely on the training set) identified patient admission profiles based on functionality, which were then used as predictive features. Eight machine learning classifiers were tested across three groups (All Patients, Orthopedic, Neurological). SHAP-based explainability was employed at four levels: global, diagnostic group, patient functional profile, and individual. Finally, clinical decision rules and bedside stratification profiles were derived and validated with an internal held-out test set (n = 684). Results: Normalization significantly increased the correlation between admission BI and gain (r = 0.130 to r = 0.520), supporting the presence of a ceiling-related limitation in absolute gain metrics. Two distinct functional admission profiles with statistically significant group differences were identified—High-Burden (38% below-median recovery) and Moderate-Burden (21%)—with cluster membership the third most important predictor (13.9% SHAP importance). The highest AUC-ROC values were 0.831 for all patients (XGBoost), 0.864 for neurological patients (Gradient Boosting), and 0.839 for orthopedic patients (Gradient Boosting). Multilevel SHAP analysis showed age as the primary predictor for neurological patients (mean |SHAP| = 0.360) but the third for orthopedic patients (0.350), highlighting clinical relevance. Validation using SHAP values from the Gradient Boosting model showed a Spearman correlation of ρ = 0.925 (p = 1.13 × 10⁻³⁰), with eight of the top ten features overlapping, indicating that these patterns are not model-specific but reflect the underlying data. Risk zone stratification found 80.7% of patients in high-confidence zones (accuracy > 80%). The clinical decision rules achieved 70.8% accuracy with full transparency, and the elderly (≥75 years) combined with a low BI (<25) profile showed an 89.6% model accuracy with only 10.4% recovery above the median. Conclusions: This explainable, profile-informed ML pipeline addresses key methodological limitations in predicting rehabilitation outcomes. It also provides a foundation for integrating models into clinical practice, pending prospective, external validation of the results. Before clinical implementation, validation across multicenter cohorts is essential.
1. Introduction
Globally, more than one billion people live with disabilities, many of whom require rehabilitation to maintain or restore their functional independence [1]. The rising burden of stroke, traumatic injury, musculoskeletal disorders, and neurodegenerative diseases has significantly increased the demand for intensive inpatient rehabilitation, which is one of the most resource-intensive components of post-acute care [2]. Consequently, the early prediction of functional recovery at admission is a critical clinical priority, enabling individualized treatment planning, efficient resource allocation, and realistic goal-setting with patients and families [3].
The Barthel Index (BI) is a well-validated, widely used metric for assessing functional independence in daily activities [4,5] and plays a crucial role in predicting rehabilitation outcomes [6]. However, relying solely on the absolute BI gain as a predictor has limitations, mainly due to the ceiling effect, where patients with higher initial scores have less room for measurable improvement, which can lead to underestimating their recovery [7]. Despite its significance, this challenge has not been sufficiently addressed in machine learning (ML) studies of rehabilitation.
ML approaches have demonstrated strong potential for predicting clinical outcomes by capturing complex non-linear relationships beyond the capabilities of traditional statistical methods [8,9]. In rehabilitation, ML models have shown promising performance in predicting discharge destination, length of stay, and functional outcomes across various conditions [10,11,12,13], including orthopedic populations such as those undergoing total hip arthroplasty [14]. Gradient boosting methods, particularly XGBoost [15] and LightGBM [16], have consistently achieved high performance in structured clinical datasets [17].
Nevertheless, key gaps remain. First, most studies do not adequately address the ceiling effect in functional outcome measures [7,10]. Second, rehabilitation populations are often treated as homogeneous, overlooking important clinical differences between neurological and orthopedic patients [3,18]. Third, prior studies have largely emphasized predictive accuracy while neglecting model explainability, which is essential for clinical adoption, regulatory compliance, and patient communication [9,19].
SHAP (SHapley Additive exPlanations) offers a solid, game-theoretic approach for understanding ML models by measuring feature impacts at both the overall and individual levels [20,21]. While its application is common in other medical fields [22], its use in predicting rehabilitation outcomes is still limited, especially in multi-level analyses across different diagnostic and phenotypic subgroups. Unsupervised clustering provides an alternative method to capture patient variability by creating data-driven functional admission profiles [23,24]. Nonetheless, incorporating these clustering-based profiles into supervised ML models and thoroughly validating their additional predictive value has not been extensively studied in rehabilitation research.
This study addresses these gaps by analyzing a large dataset of 3419 patients undergoing intensive inpatient rehabilitation at IRCCS San Raffaele Hospital, in accordance with the TRIPOD reporting standards [25,26]. It offers three key contributions to predicting rehabilitation outcomes, all of which are both clinically relevant and methodologically robust. Firstly, it introduces a normalized gain metric that better captures individual recovery potential than the traditional absolute Barthel Index gain. Secondly, it identifies two distinct functional admission profiles, revealing significant heterogeneity within rehabilitation populations. Thirdly, it employs a multi-level SHAP-based explainability approach across different diagnostic groups and functional profiles, enhancing the clinical interpretability of rehabilitation outcome predictions.
2. Materials and Methods
2.1. Study Design and Dataset
This retrospective observational study used a publicly available, fully anonymized dataset of 3419 patients admitted to the intensive rehabilitation unit of the IRCCS San Raffaele Hospital, Rome, Italy, between 2015 and 2018. All data were extracted from the standardized Acceptance and Discharge Report (ADR) form, mandated by Italian national law (DGR 731/2005). Institutional ethics approval and patient consent were obtained before data collection (Ethics Committee code: 07/18). The dataset is publicly available on Figshare [27] and is distributed under the Creative Commons Attribution 4.0 International (CC BY 4.0) license. This license permits unrestricted use, distribution, and reproduction in any medium, provided that appropriate credit is given to the original authors and the source. All data were fully anonymized prior to public release. The study was conducted and reported in accordance with the TRIPOD guidelines for multivariable clinical prediction models [26].
The full ADR form contains 120 items. After excluding administrative fields (e.g., hospital name and attending physician), 71 clinically relevant features were retained across seven categories: (i) demographics (age, gender, and nationality; 3 features); (ii) pathology responsible for the rehabilitation intervention (COD_1), encoded using ICD-9-CM codes and recoded into 9 diagnostic categories (COD_1_Cat_1 to COD_1_Cat_9): (1) hereditary and degenerative diseases of the CNS, (2) other disorders of the CNS, (3) cerebrovascular disease, (4) musculoskeletal and connective tissue diseases, (5) symptoms and ill-defined conditions, (6) fracture, (7) late effects of injuries and poisonings, (8) complications of surgical and medical care, and (9) organ or tissue replaced by other means (e.g., prosthetic implants); (iii) main pathology (COD_2), recoded into 13 diagnostic categories, including 7 neurological and 6 orthopedic categories; (iv) Barthel Index total score at admission (COD_25; 1 feature); (v) Barthel Index activity-level sub-scores at admission (COD_25_1 to COD_25_11), including feeding, bathing, personal hygiene, dressing, bowel control, bladder control, toilet use, chair/bed transfers, ambulation, stair climbing, and wheelchair use; (vi) comorbidities or associated pathologies (COD_3 through COD_10), grouped into 17 comorbidity macro-categories, including cardiovascular, musculoskeletal, circulatory, fracture, and others; and (vii) functional impairments, comprising impairment domains recorded in the ADR form and encoded as absent, present, or non-evaluable. COD_1 and COD_2 were treated as distinct variables: COD_1 represents the pathology responsible for the rehabilitation intervention, whereas COD_2 represents the main pathology category used to distinguish neurological and orthopedic patient groups.
Outcome Definition: Normalized Barthel Index Gain
The primary outcome was defined as normalized Barthel Index gain, calculated as:
This formulation expresses recovery as a proportion of the patient’s theoretical maximum and as the percentage of their remaining functional potential realized during rehabilitation. The normalized gain ranged from 0 (no improvement) to 1 (full theoretical recovery). To create a binary classification target aligned with a triage-oriented decision-support framing, patients were classified as Above Median (favorable outcome) or Below Median (unfavorable outcome) using the sample median as a threshold. This approach provides balanced outcome classes suitable for comparative model evaluation. We confirm that the sample median is not intended to represent a validated clinical threshold, and the binary classification framework should not be interpreted as a clinical criterion for treatment decisions. Instead, this formulation was adopted to provide a statistically tractable and class-balanced prediction target for comparative model evaluation. Future studies should investigate more clinically meaningful alternatives, including thresholds based on the Minimal Clinically Important Difference for normalized BI gain, or continuous, regression-based approaches.
2.2. Data Partitioning and Preprocessing
The dataset was partitioned using a stratified 80/20 train/test split (training: n = 2735; test: n = 684), preserving the distribution of outcome classes across the partitions. No data imputation was performed; patients with missing admission BI (COD_52) were excluded from the dataset. Categorical features were one-hot encoded, and ordinal impairment variables were label-encoded (0 = absent, 1 = present, 2 = non-evaluable). Continuous features (age and admission BI) were standardized (zero mean, unit variance) using only the training set statistics, with the same transformation applied to the test set.
2.3. Patient Functional Admission Profiling via Unsupervised Clustering
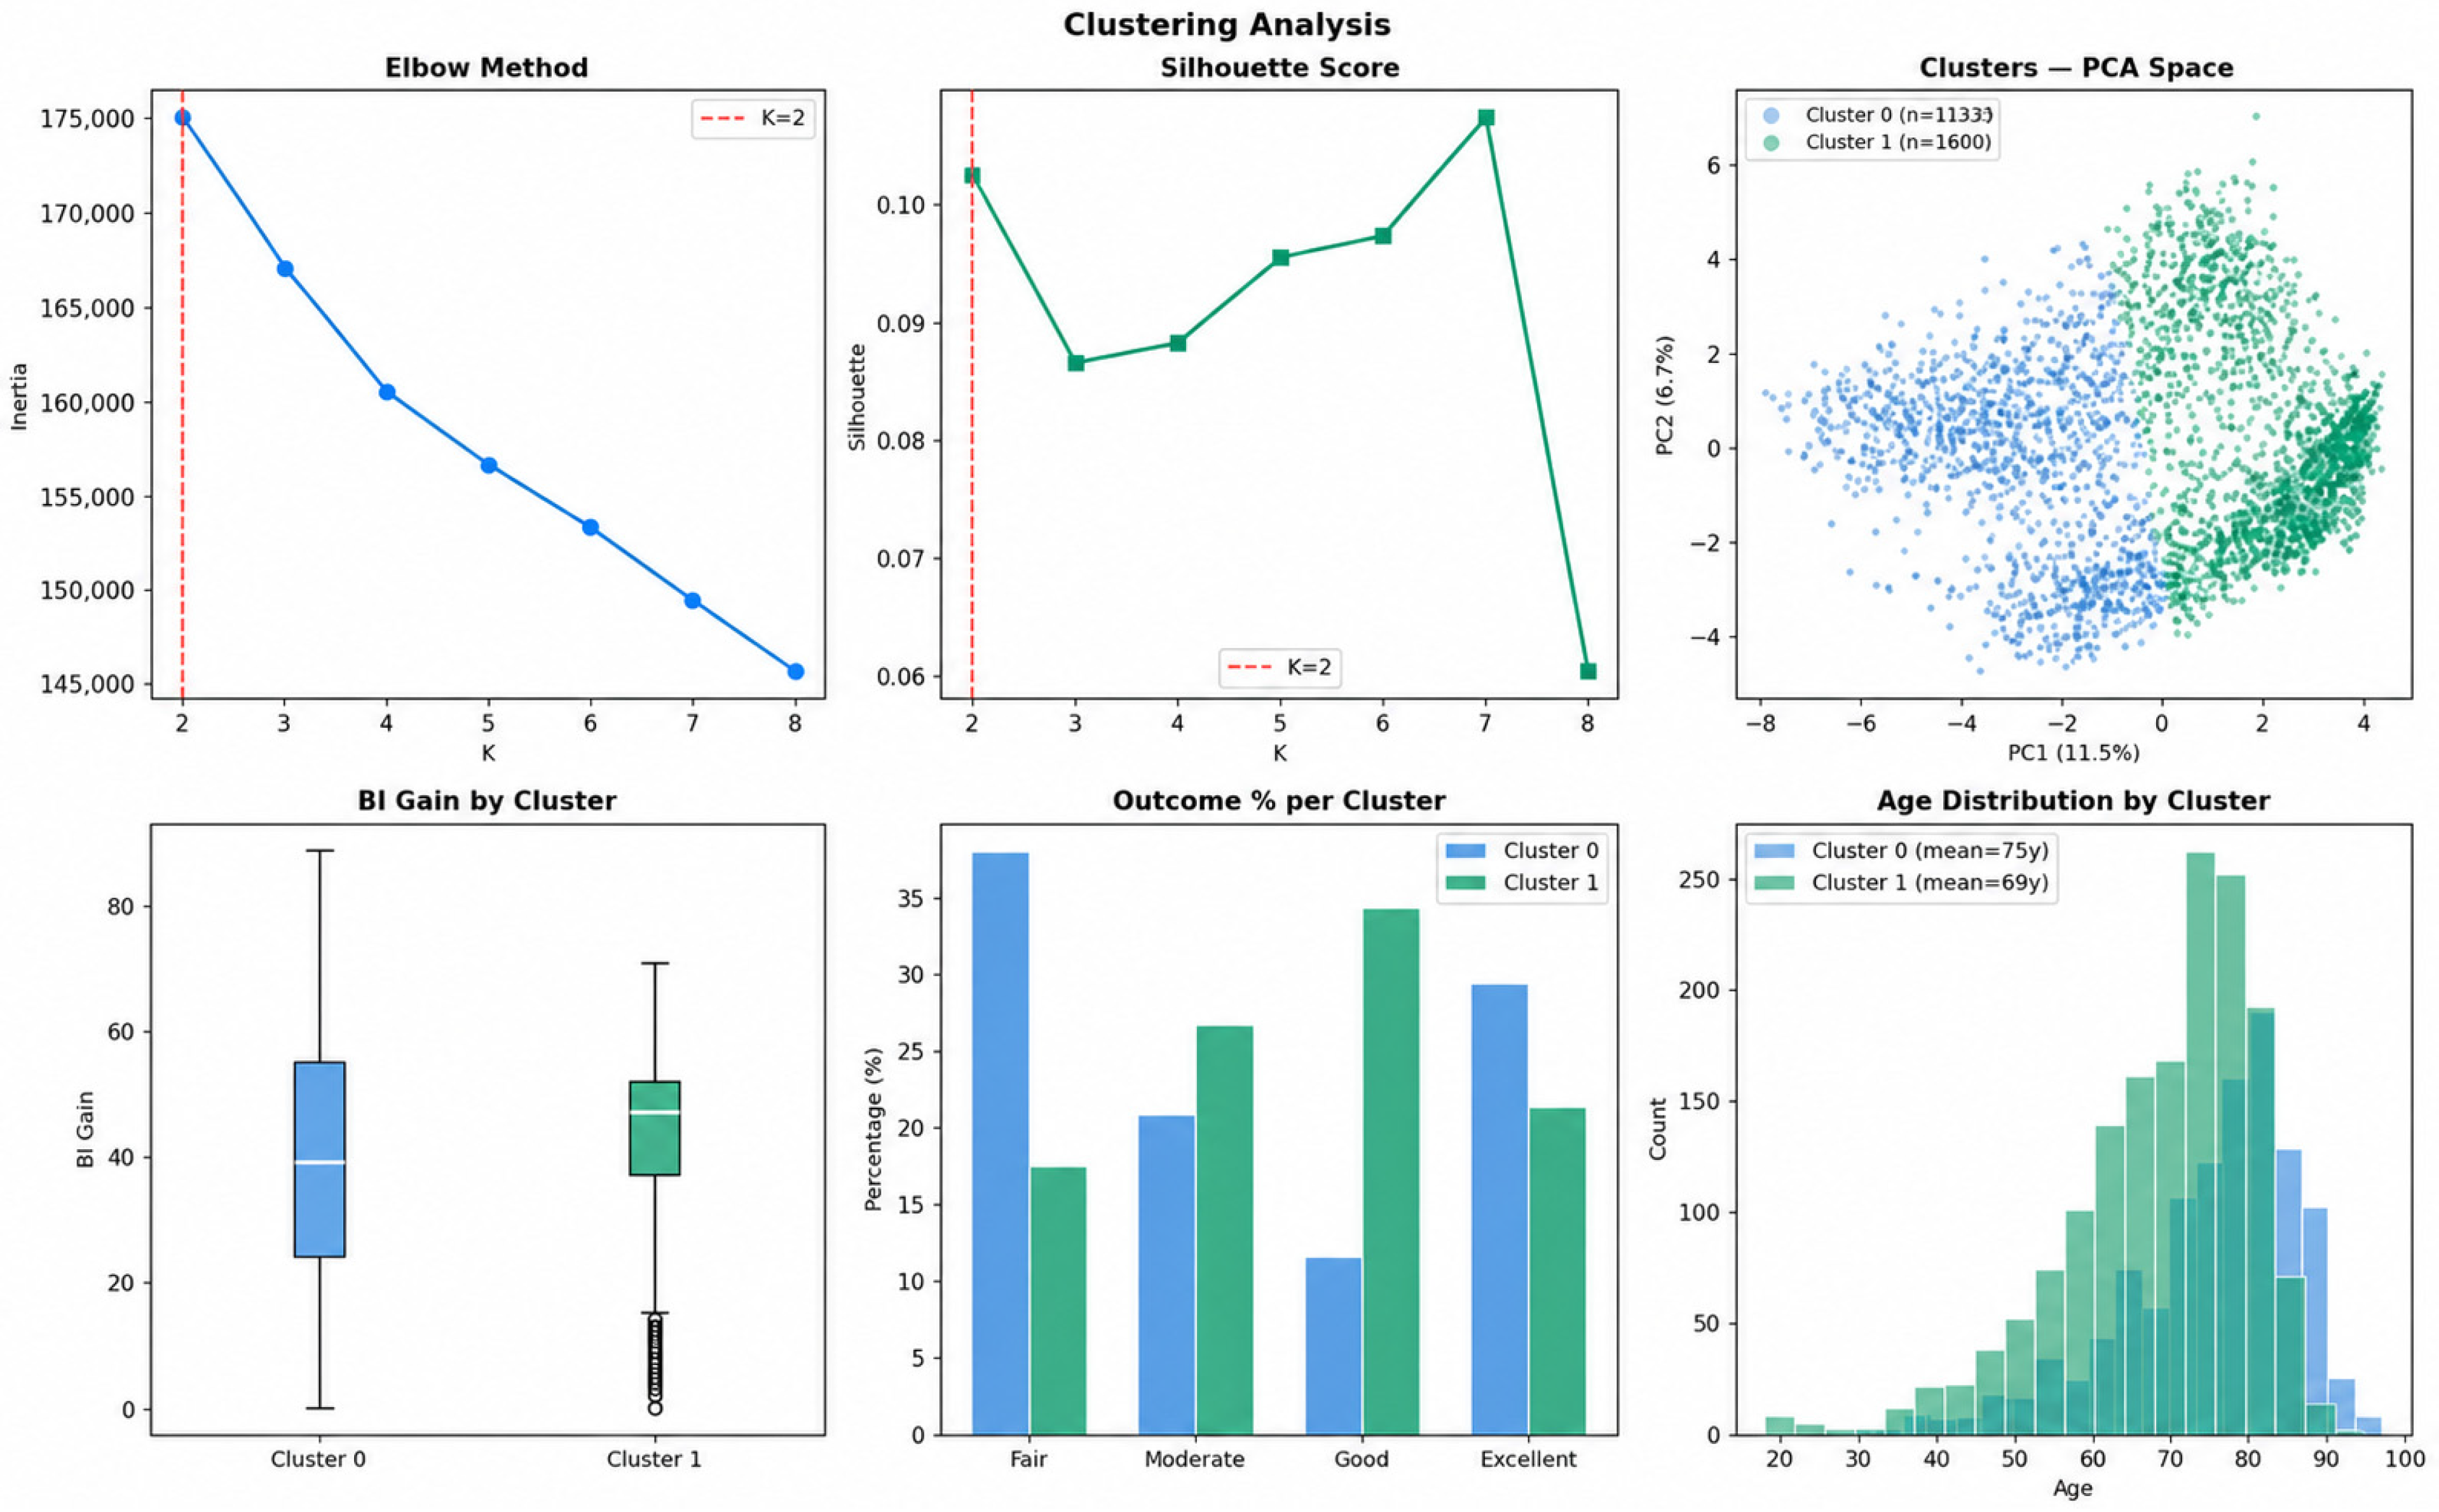
K-means clustering was fitted exclusively on the training set (n = 2735) to prevent data leakage; the fitted cluster model was then applied to assign cluster membership to test-set patients without refitting. All training features were z-score-normalized before clustering. The optimal K was determined by evaluating three internal validity indices across K = 2 to 8: Silhouette Score, Calinski–Harabasz Index (CHI), and Davies–Bouldin Index (DBI). K = 2 was selected (Silhouette = 0.100; CHI = 317.15; DBI = 3.078) with n_init = 20 and a fixed random seed. To assess the reproducibility of the cluster solution, a stability analysis was conducted by re-running K-means with 10 different random seeds (0, 1, 7, 13, 21, 99, 123, 256, 500, 999) and computing the Jaccard index between each solution and the reference solution (seed = 42). The mean Jaccard index was 0.999 (range: 0.999–1.000, SD = 0.000), indicating near-perfect stability across initializations. A subsampling stability analysis (10 runs, 80% of training data per run) yielded a mean Jaccard index of 0.996 (range: 0.993–0.999), suggesting that the cluster assignments were highly reproducible and unlikely to be artifacts of initialization or sampling variability. Although the Silhouette Score was modest, a result expected in high-dimensional, heterogeneous clinical data where natural cluster boundaries are rarely sharp, the cluster solution showed statistically meaningful differentiation between functional admission profiles, confirmed by significant between-cluster differences across BI gain, age, and outcome distribution (all p < 0.001). The primary purpose of clustering in this pipeline was feature engineering to capture the patient’s functional admission profile membership as a predictive signal rather than segmentation per se.
The cluster membership binary variable was included as an additional feature in all downstream classification models. The full analytical pipeline followed the sequence (1) target engineering via normalized BI gain, (2) a stratified 80/20 train/test split, (3) K-means clustering on the training data only, (4) cluster assignment applied to the test set, (5) classification model training and cross-validation, (6) SHAP explainability analysis, and (7) clinical rule extraction, all evaluated on the held-out test set without re-fitting. Cluster labels were assigned once to the full training set before cross-validation, rather than being refitted within each fold. The held-out test set remained fully isolated throughout preprocessing, clustering, and feature engineering. The close agreement between 10-fold cross-validation accuracy (range: 0.742–0.765) and held-out test accuracy (range: 0.741–0.765) suggests that any optimistic bias introduced by this approach is negligible in practice. To assess model generalization, training accuracy was compared with 10-fold cross-validation and held-out test accuracy across all eight models. Training accuracy was expectedly higher than test accuracy for ensemble methods (gap range: +0.013 to +0.202), reflecting memorization of training patterns, a well-documented characteristic of high-capacity ensemble models. The close agreement between cross-validation accuracy (0.742–0.766) and held-out test accuracy (0.732–0.759), with a mean CV-to-test gap below 0.010, suggests that the models generalize reasonably well to unseen data with limited evidence of substantial overfitting that could compromise clinical applicability.
2.4. Classification Models
Eight supervised classification models were trained on the training set and evaluated on the held-out test set: Logistic Regression (L2 regularization), Random Forest, Gradient Boosting, XGBoost [15], LightGBM [16], Multi-Layer Perceptron (MLP), and three ensemble configurations: Voting Ensemble (soft voting across LR, RF, GB, XGB, LGBM), Stacking Ensemble (GB meta-learner on LR, RF, XGB, LGBM predictions), and Decision Tree (max_depth = 3; trained separately for clinical rule extraction only, not evaluated for predictive performance). All models were trained independently on three cohort configurations: All Patients (n = 3419), orthopedic-only (n = 1844), and neurological-only (n = 1575). Table 1 presents the model descriptions.
Table 1.
Description of Machine Learning Models implemented in this study.
2.5. Hyperparameter Optimization
Hyperparameters were optimized via RandomizedSearchCV (40 iterations, 10-fold stratified CV on the training set) over the predefined grids. For XGBoost: n_estimators ∈ {200, 300, 500}, max_depth ∈ {4, 5, 6, 7}, learning_rate ∈ {0.01, 0.05, 0.1}, subsample ∈ {0.7, 0.8, 0.9}, and colsample_bytree ∈ {0.7, 0.8, 0.9}. For Gradient Boosting: n_estimators ∈ {200, 300, 500}, max_depth ∈ {3, 4, 5, 6}, and learning_rate ∈ {0.01, 0.05, 0.1}. Tuning yielded negligible improvements (ΔAUC ≤ 0.002 across all models), confirming that the default configurations were near-optimal.
2.6. Model Evaluation
The primary performance metric was AUC-ROC, evaluated on the held-out test set (n = 684). The secondary metrics included test accuracy, Brier Score, and 10-fold stratified cross-validation accuracy (CV accuracy). Pairwise AUC comparisons were reported with 95% bootstrap confidence intervals (1000 iterations, seed = 42) rather than p-values to avoid interpreting exploratory comparisons as confirmatory hypothesis tests [28]. Calibration was assessed using the Brier Score [29] and zone-stratified calibration error. The statistical significance threshold was set at α = 0.05.
2.7. SHAP-Based Explainability Analysis
SHAP (SHapley Additive exPlanations) is a post hoc interpretability method grounded in cooperative game theory and applied after model training [20,21]. The TreeExplainer variant used in this study is specifically optimized for tree-based ensemble models such as XGBoost. SHAP provides global explanations by quantifying feature importance across all patients via aggregated beeswarm and bar plots, and local explanations by attributing model predictions to individual patients using waterfall plots. Importantly, SHAP explanations characterize model behavior rather than causal relationships, and correlated features may share attribution values in ways that do not necessarily represent independent clinical mechanisms.
In this study, SHAP analysis was performed on the XGBoost model, which achieved the highest overall AUC, across four levels of interpretation: (i) global beeswarm analysis; (ii) group-stratified analysis (orthopedic vs. neurological); (iii) cluster-stratified analysis within each functional admission profile; and (iv) individual waterfall plots for representative patients. To evaluate the robustness of feature importance rankings across model architectures, SHAP values were additionally generated for the Gradient Boosting model using the same TreeExplainer framework. The global SHAP importance rankings from XGBoost and Gradient Boosting demonstrated a strong Spearman rank correlation (ρ = 0.925, p = 1.13 × 10⁻³⁰), with 8 of the top 10 features shared between models. This high degree of cross-model consistency suggests that the identified predictive patterns are more likely to reflect stable underlying data characteristics rather than model-specific artifacts.
2.8. Clinical Rule Extraction
Two complementary approaches were used to operationalize the model outputs into clinical guidance. A shallow Decision Tree (max_depth = 3, sklearn DecisionTreeClassifier) was trained on SHAP-ranked features to extract transparent if–then rules without researcher discretion. SHAP-guided stratification profiles were defined as clinically meaningful patient archetypes and validated against outcomes from a held-out test set. Both are presented as exploratory decision-support tools and not prescriptions, and require prospective validation before clinical use.
2.9. Error Analysis
Misclassified test patients were characterized by comparing mean age and mean BI at admission between False Positives (FP; predicted Above Median, actual Below Median) and False Negatives (FN; predicted Below Median, actual Above Median). Differences were assessed descriptively; formal statistical testing was not performed.
2.10. Software and Reproducibility
Python 3.10 with scikit-learn 1.8.0 (all ML models, including MLP, preprocessing, cross-validation), XGBoost 2.0.3, LightGBM 4.1.0, SHAP 0.44.0, NumPy 1.26.0, pandas 2.1.3, Matplotlib 3.8.0, Seaborn 0.13.2, SciPy 1.11.0. A global random seed of 42 was applied to all stochastic components, including the train/test splitting, K-means clustering, model initialization, and cross-validation shuffling, to ensure full reproducibility. The complete hyperparameter search grids, preprocessing steps, and SHAP configuration details are provided in Supplementary Material S2. The dataset is publicly available at https://doi.org/10.17632/57fr3nfz3m.1 [25].
3. Results
3.1. Dataset Characteristics and Outcome Definition
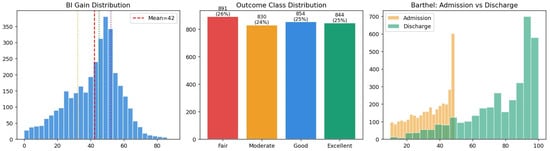
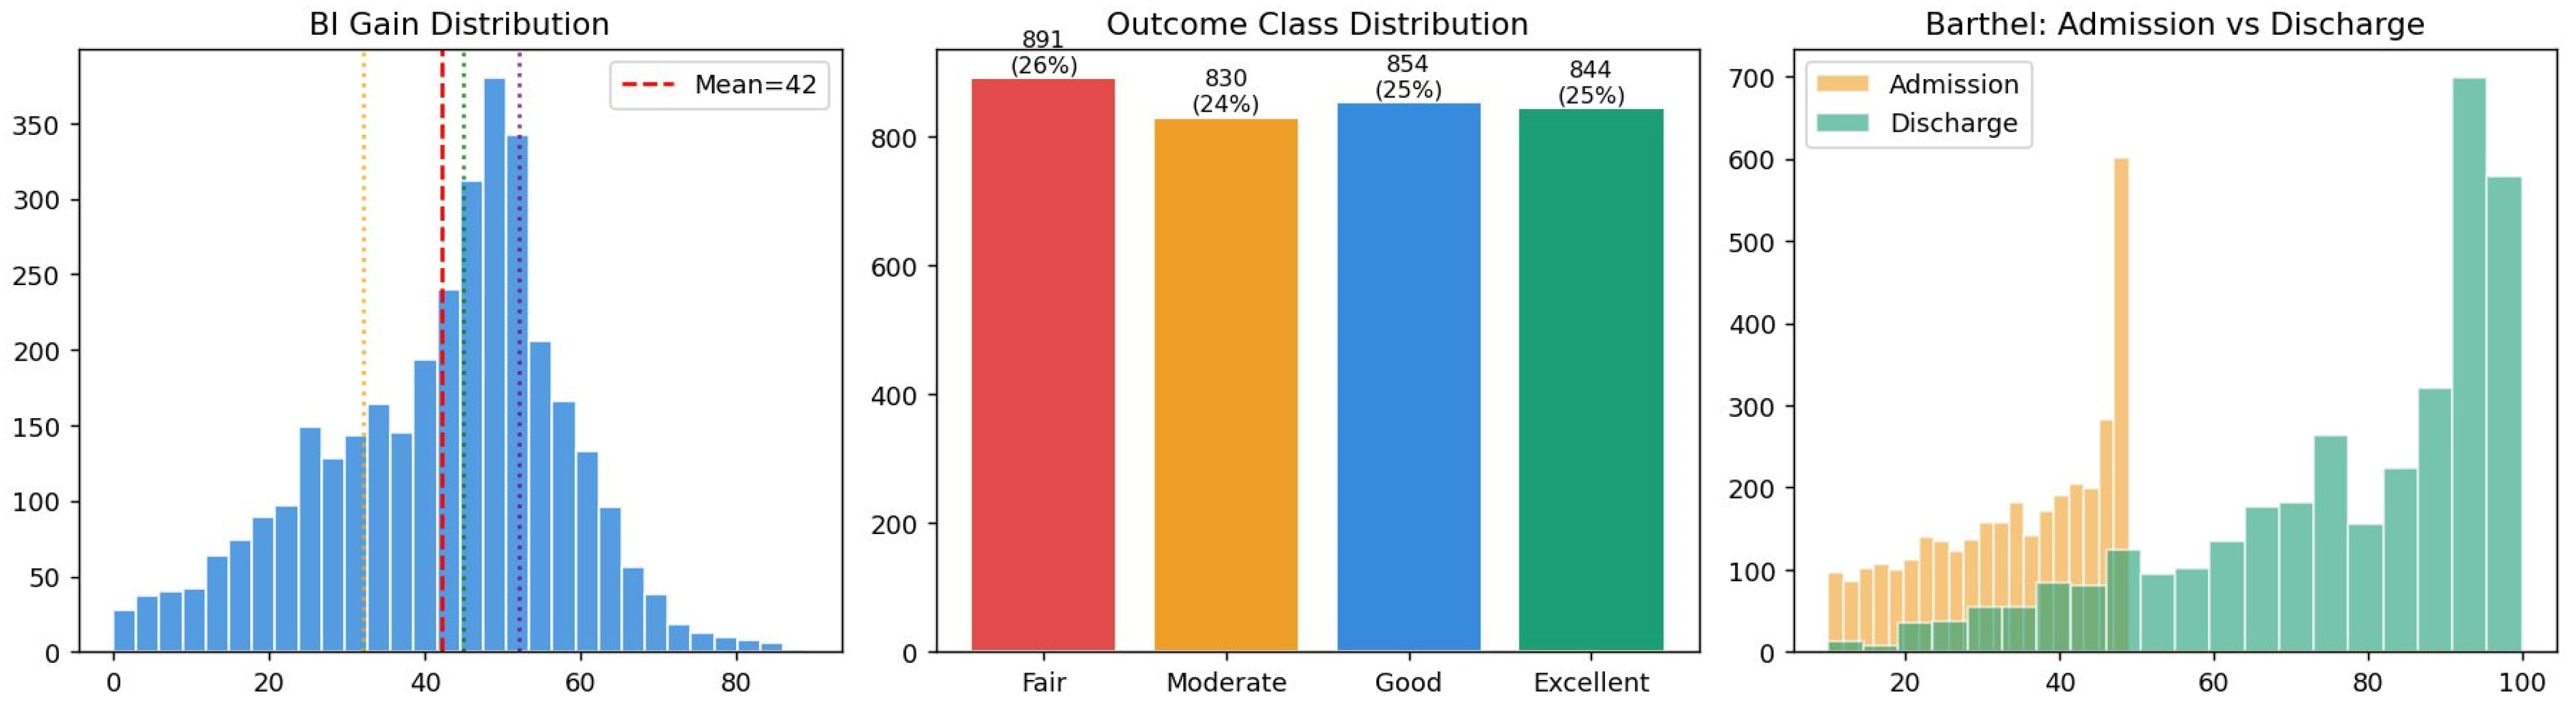
The cleaned dataset comprised 3419 patients (orthopedic: n = 1844, 53.9%; neurological: n = 1575, 46.1%), with a mean age of 71.2 ± 12.5 years and 57.0% male. The Barthel Index at admission ranged from 10 to 49 (mean = 34.6 ± 11.7). At discharge, the mean BI increased to 76.8 ± 20.8, yielding a mean absolute BI gain of 42.2 ± 15.8 points. The binary outcome was near-balanced (Above Median: n = 1711, 50.0%; Below Median: n = 1708, 50.0%), as illustrated in Figure 1.
Figure 1.
Exploratory Data Analysis Overview. (Left): BI gain distribution with mean (red) and quartile markers (Q1 = 32, Q2 = 45, Q3 = 52). (Center): Binary outcome class distribution (Above/Below Median, 50%/50%). (Right): Barthel Index at admission vs. discharge, illustrating the substantial functional improvement achieved during the intensive rehabilitation.
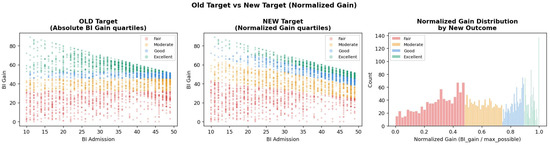
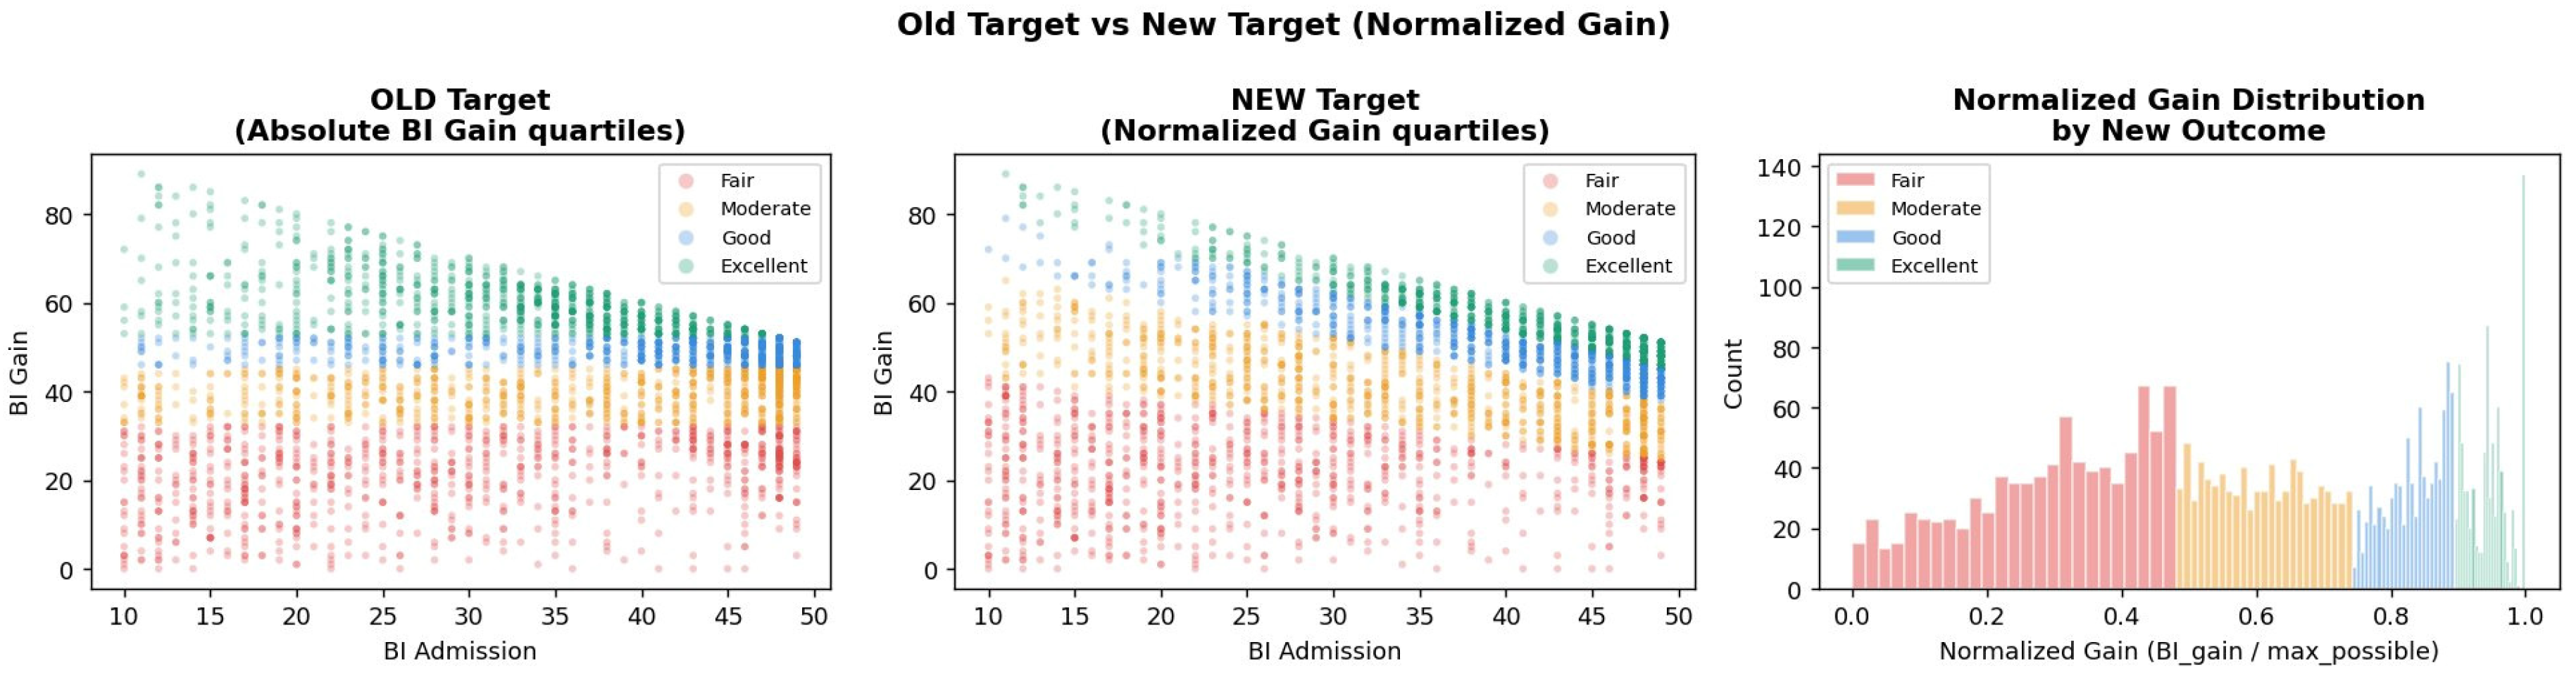
The findings supported the presence of a ceiling-related limitation in absolute BI gain (Figure 2): the Pearson correlation between admission BI and absolute gain was weak (r = 0.130, p = 2.28 × 10⁻¹⁴). In contrast, the correlation between admission BI and normalized gain was substantially stronger (r = 0.520, p = 2.69 × 10−236), suggesting that normalization better reflects recovery relative to the individual’s baseline potential. However, this improvement in correlation is partly a mathematical consequence of the normalization formula, in which admission BI appears in both the numerator and denominator; therefore, the association should be interpreted as supporting the conceptual value of normalization rather than as a purely empirical finding. The median normalized gain was 0.743 (IQR: 0.481–0.895).
Figure 2.
Target Engineering—Ceiling Effect Correction. (Left): Absolute BI gain quartiles showing severe class overlap. (Center): Normalized gain quartiles showing improved class separation. (Right): Normalized gain distribution by outcome class (Pearson’s r increased from 0.130 to 0.520).
3.2. Patient Functional Admission Profiling via Unsupervised Profiling
K-means clustering (K = 2) was trained exclusively on the training cohort (n = 2735) to avoid data leakage, and the resulting model was subsequently used to assign cluster labels across the full dataset. Cluster validity indices were as follows: Silhouette Score = 0.100, Calinski–Harabasz Index (CHI) = 317.15, and Davies–Bouldin Index (DBI) = 3.078. Although the Silhouette Score indicated limited geometric separation, which is common in high-dimensional clinical datasets, the identified clusters demonstrated clinically and statistically meaningful differences in patient admission profiles. Significant between-cluster differences were observed for BI gain (Mann–Whitney U = 1,199,765; p = 2.85 × 10⁻¹⁴), age (t = 14.456; p = 5.08 × 10−46), and rehabilitation outcome distribution (χ2 = 622.9; df = 1; p = 1.75 × 10−137; Figure 3).
Figure 3.
Profiling Analysis—Patient Phenotype Discovery. Top row: Elbow Method (left) and Silhouette Score (center) across K = 2 to K = 8, both supporting K = 2; PCA scatter plot (right) showing spatial separation of the two functional admission profiles (PC1 = 11.5%, PC2 = 6.7%). Bottom row: BI Gain boxplot by cluster (p = 2.85 × 10⁻¹⁴); outcome distribution per cluster; age distribution showing Profile 0 is substantially older (mean 75 y vs. 69 y).
Profile 0: High-Burden Phenotype (n = 1135 in training; 41.5% of training set): mean age, 74.8 years; BI at admission, 23.1. Within Profile 0, 38% of patients were classified as Below Median, substantially higher than the 21% within Profile 1. These clusters represent data-driven functional admission profiles that support clinical stratification, rather than biologically or pathologically distinct disease categories.
Profile 1: Moderate-Burden Phenotype (n = 1600 in training; 58.5% of training set): mean age 68.8 years, BI at admission 42.8. Recovery was modulated by multiple features (top |SHAP| = 0.44), reflecting greater clinical heterogeneity.
3.3. Classification Model Performance
All eight models were evaluated in three cohorts using 10-fold stratified cross-validation and a held-out test set (n = 684). The cross-validation results closely mirrored the test set performance across all models (CV accuracy range: 0.742–0.762 vs. test accuracy range: 0.741–0.765), indicating stable generalization with minimal overfitting. Pairwise bootstrap tests revealed overlapping 95% confidence intervals across top-performing models (XGBoost: AUC = [0.803–0.860]; Logistic Regression: AUC = [0.784–0.847]; Random Forest: AUC = [0.787–0.852]; MLP: AUC = [0.784–0.846]), suggesting limited additional predictive signals in the currently available feature set rather than algorithmic limitations. A focused comparison of all eight models in the All Patients cohort is provided in Supplementary Figure S2.
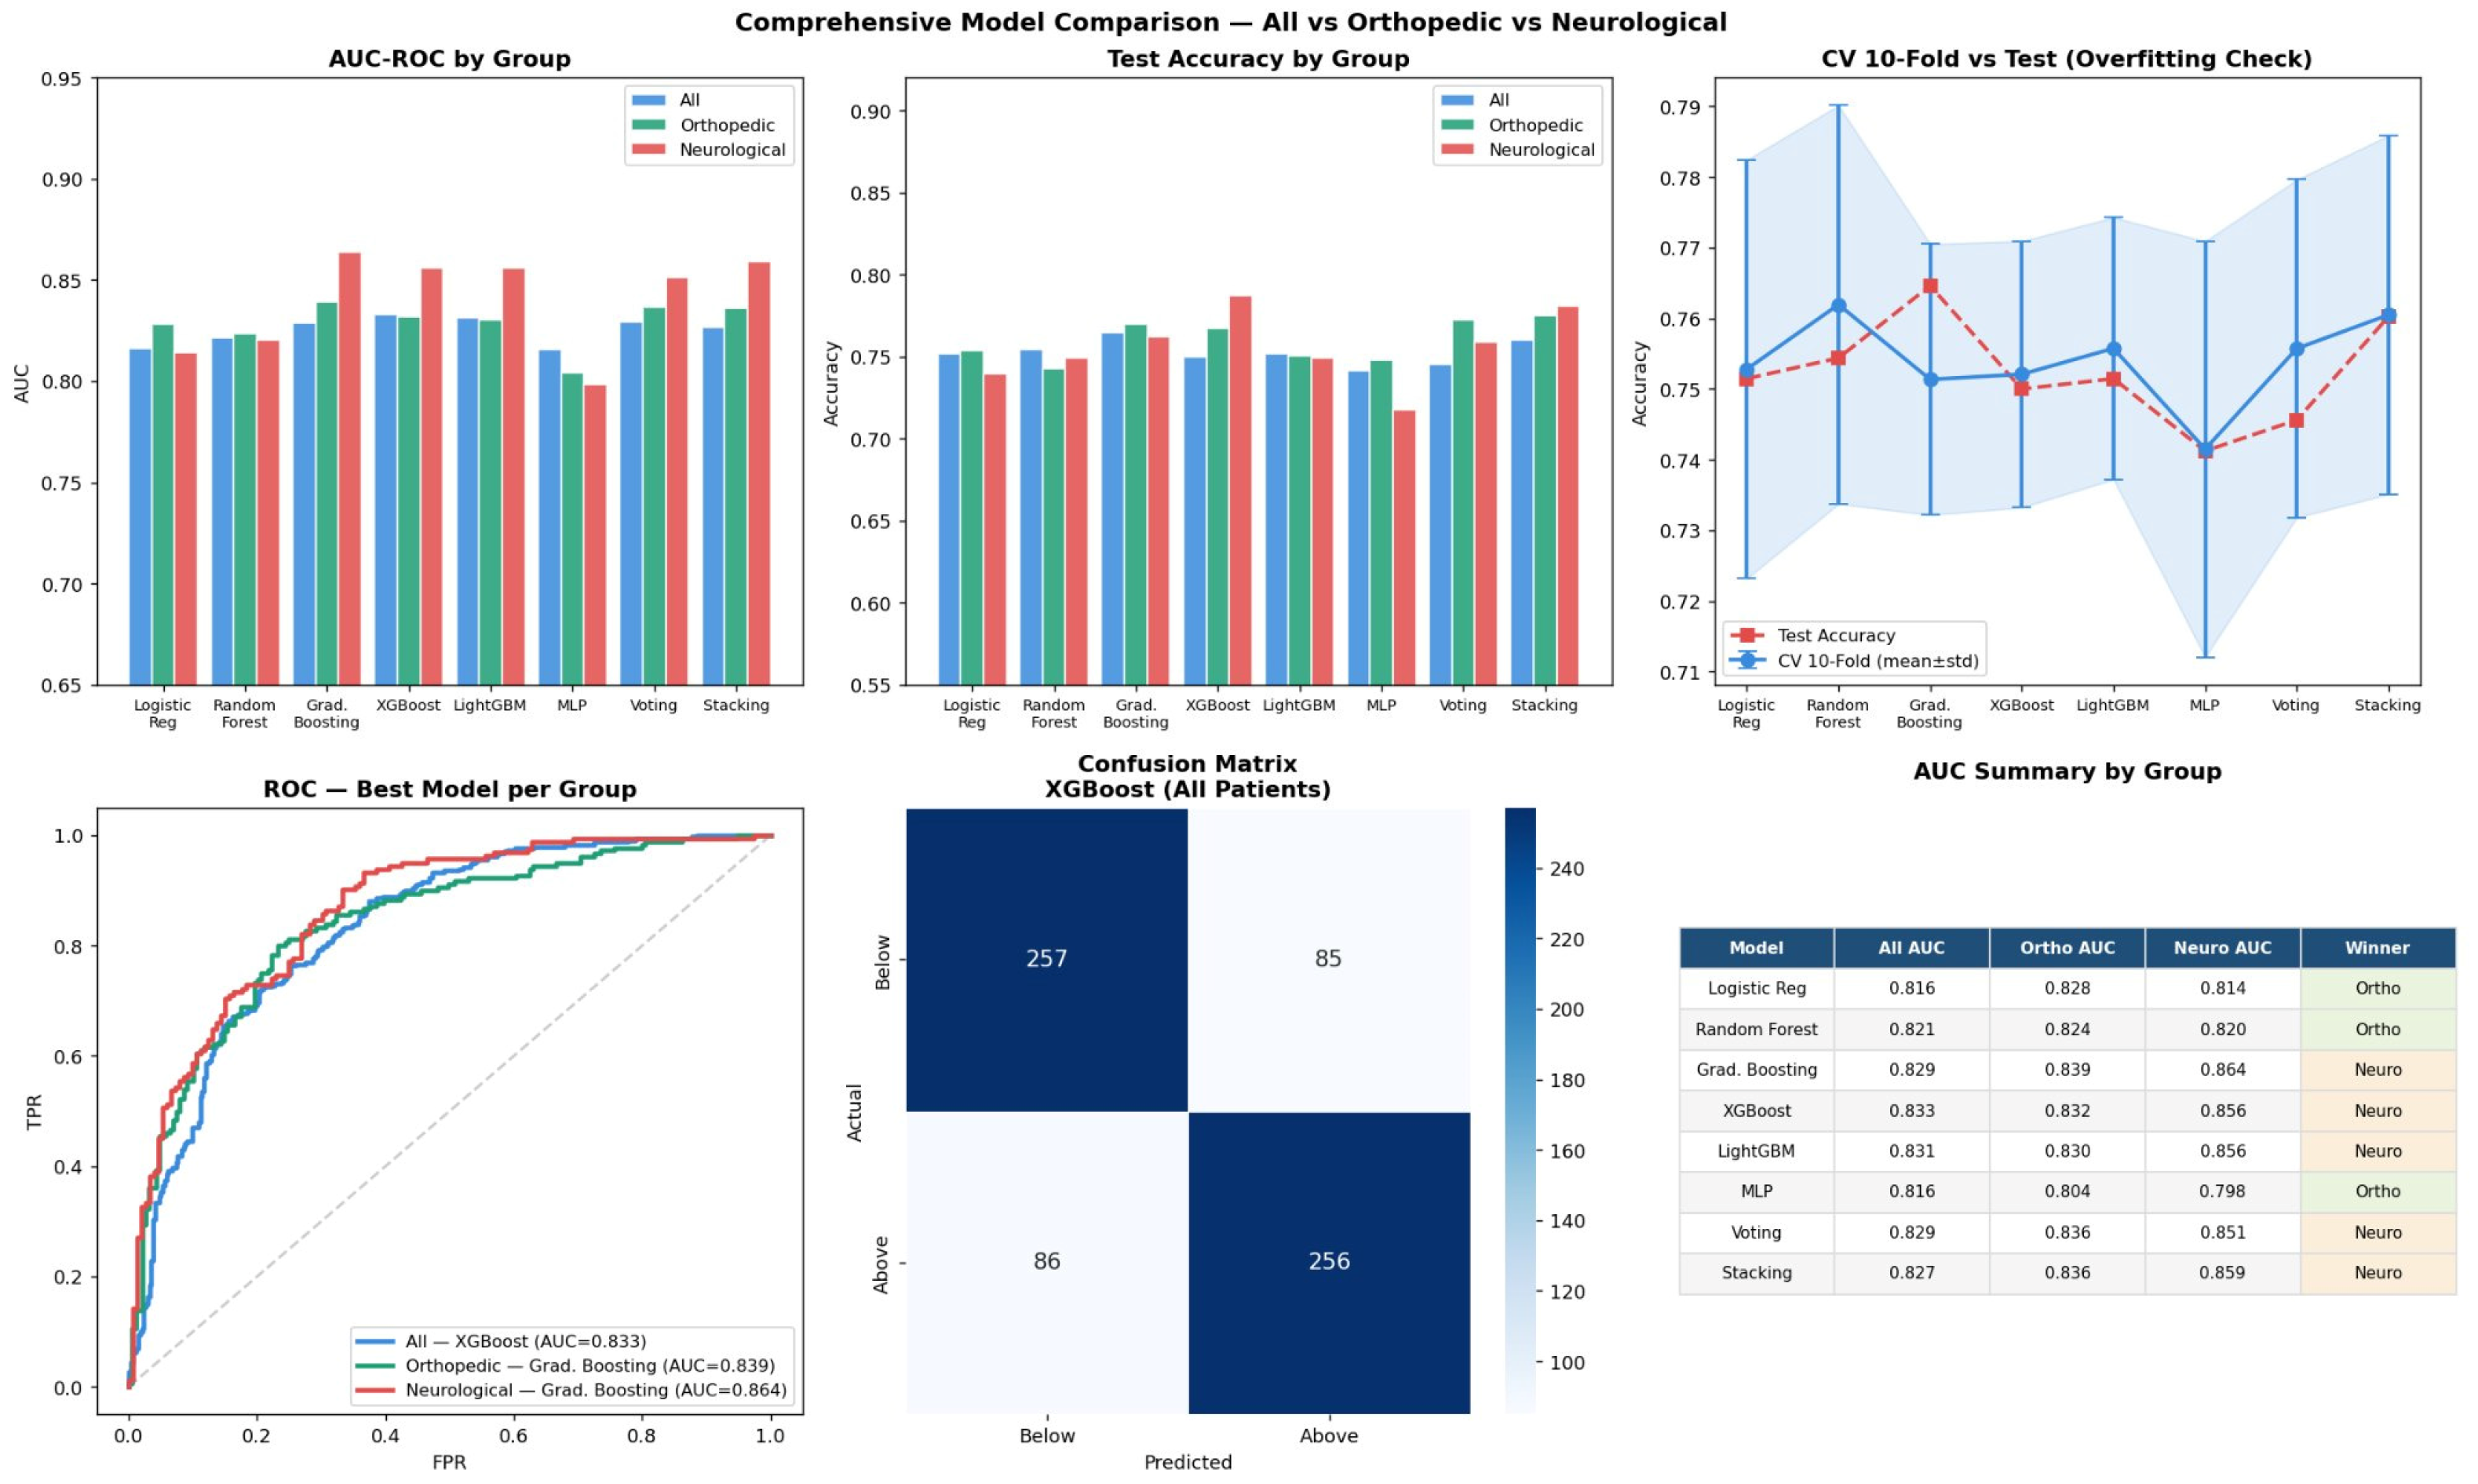
Neurological patients demonstrated greater predictability of outcomes than orthopedic patients. The best-performing model in the neurological cohort (Gradient Boosting) achieved an AUC of 0.864, whereas the highest AUC in the orthopedic cohort reached 0.839 (bootstrap comparison: ΔAUC = +0.025; 95% CI: [0.014, 0.036]). Across the overall cohort, XGBoost achieved the highest AUC (0.831) and was therefore selected for SHAP-based explainability analysis. In contrast, Gradient Boosting yielded the best performance within both subgroup-specific cohorts. These findings indicate that no single model consistently outperformed others across all cohorts. Detailed performance metrics are provided in Table 2 and Figure 4.
Table 2.
Model Performance—AUC-ROC and Accuracy across All, Orthopedic, and Neurological cohorts. Brier Score reported only for the All Patients cohort. ★ = best overall AUC.
Figure 4.
Comprehensive Model Comparison—All vs. Orthopedic vs. Neurological Cohorts. Top row: AUC-ROC by group (left), Test Accuracy by group (center), and 10-fold CV vs. test accuracy overfitting check (right), demonstrating stable generalization. Bottom row: ROC curves for best model per group (left), confusion matrix for XGBoost-All (center), and AUC summary table by group (right). The neurological cohort consistently outperforms the orthopedic cohort across all models.
3.4. Model Calibration and Risk Zone Analysis
Brier Scores ranged from 0.150 for the neurological Gradient Boosting model to 0.173 for Logistic Regression and MLP models, indicating overall acceptable calibration across all evaluated classifiers. Calibration curves for all model configurations are presented in Supplementary Figure S1, which demonstrates reasonable agreement between predicted probabilities and observed outcome frequencies throughout the probability range.
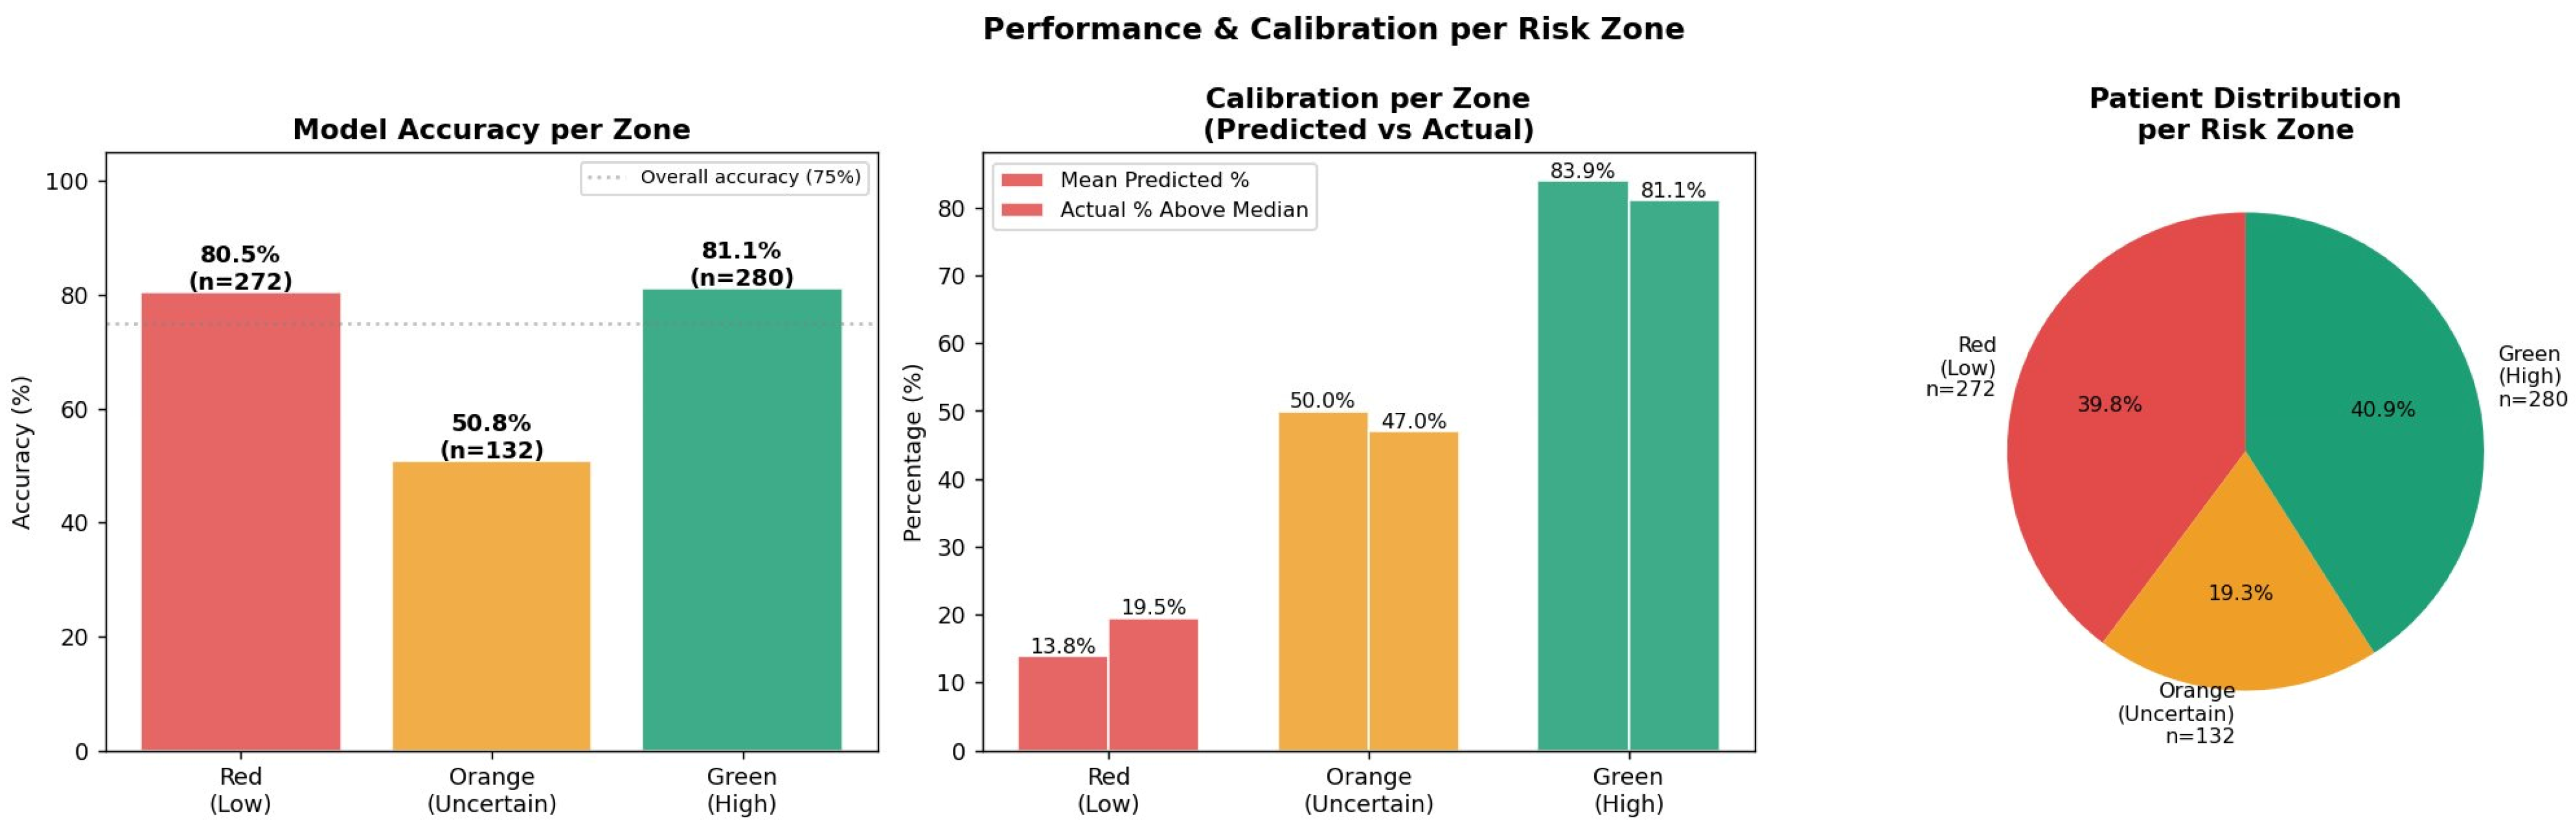
To facilitate clinical interpretation, predicted probabilities were stratified into three risk zones using predefined thresholds of 35% and 65% (Figure 5). These thresholds were selected a priori to reflect clinically intuitive categories of low-confidence recovery, uncertain prognosis, and high-confidence recovery, rather than being derived adaptively from the training data.
Figure 5.
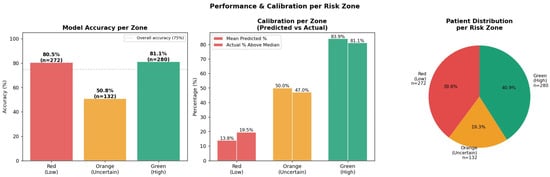
Performance and Calibration for Each Risk Zone. (Left): Model accuracy per risk zone—high accuracy in the red (80.5%) and green (81.1%) zones and near-random in the orange (50.8%) zone. (Center): Calibration per zone—low calibration error in Green (2.9%) and Orange (3.0%). (Right): Patient distribution (red: 39.8%, orange: 19.3%, green: 40.9%).
The high-probability “Green” zone (>65%; n = 280; 41.0% of test patients) achieved a prediction accuracy of 81.1% with a calibration error of 2.9%. The intermediate “Orange” zone (35–65%; n = 132; 19.3%) showed near-random classification performance (50.8% accuracy) and represented the model’s primary zone of prognostic uncertainty, with a calibration error of 3.0%. The low-probability “Red” zone (<35%; n = 272; 39.8%) achieved an accuracy of 80.5% with a calibration error of 5.7%. Overall, 80.7% of patients (n = 552) were classified within high-confidence zones where predictive accuracy exceeded 80%, whereas the remaining 19.3% required additional clinical interpretation and judgment.
3.5. SHAP-Based Global Explainability
Category-level aggregation of mean absolute SHAP values revealed that Barthel Index sub-scores at admission constituted the largest collective predictor category (22.9% of total importance), followed by Main Diagnosis type (18.5%), Functional Profile membership (13.9%), demographics, primarily age (9.6%), functional impairments (7.6%), comorbidities (6.1%), and rehabilitation reason (5.1%). To verify that these rankings were not specific to the XGBoost architecture, SHAP values were computed for the Gradient Boosting model. The Spearman rank correlation between the global feature importance rankings of both models was ρ = 0.925 (p = 1.13 × 10⁻³⁰), with 8 of the top 10 features shared, confirming the cross-model robustness of the identified predictive structure.
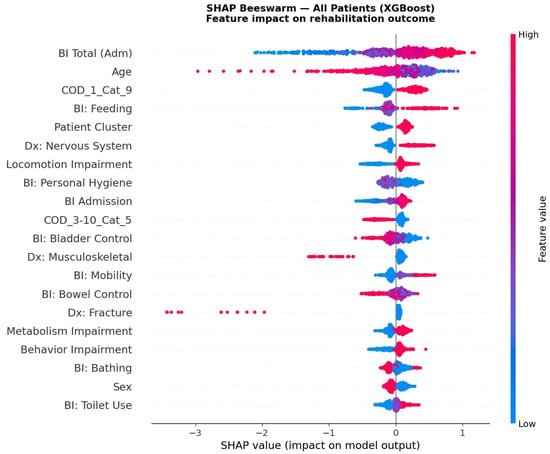
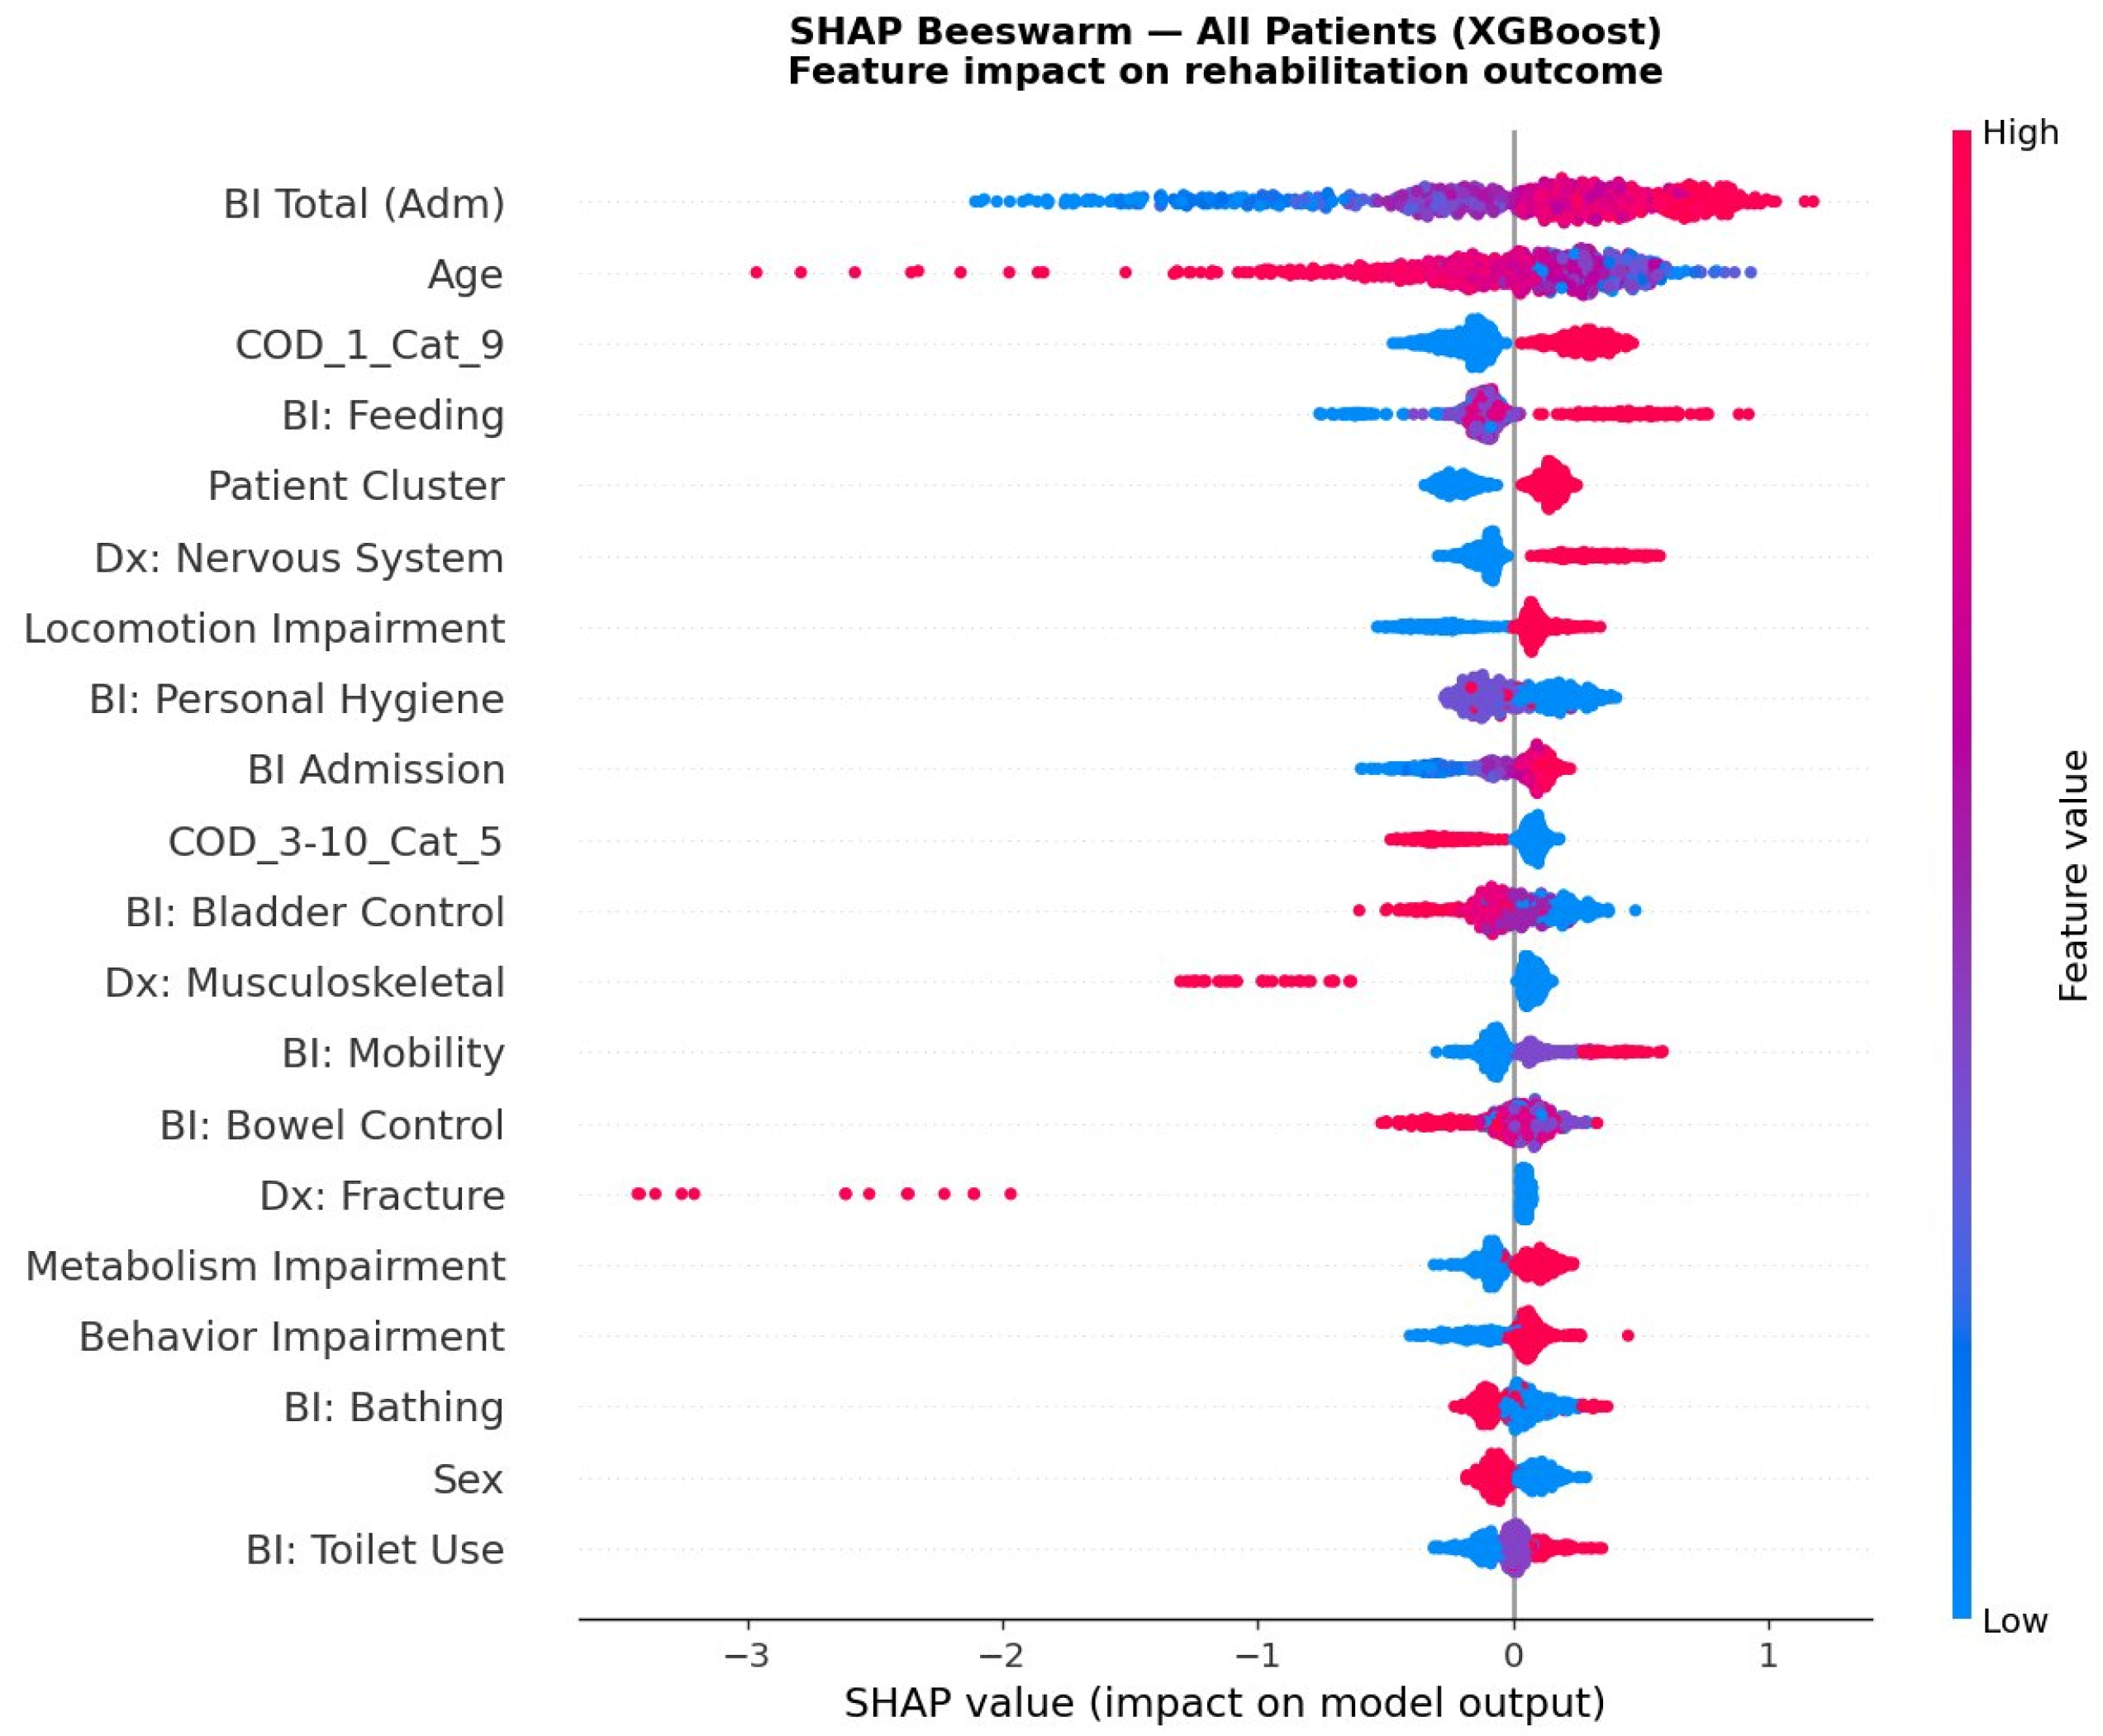
The global beeswarm plot in Figure 6 reveals consistent directional patterns in SHAP attributions, capturing descriptive model behavior rather than formal statistical associations or causal relationships. A Higher BI Total at admission was associated with positive SHAP values (contributing toward above-median prediction), whereas older age was associated with negative SHAP values. Notably, musculoskeletal diagnosis was associated, in descriptive SHAP terms, with lower normalized recovery relative to baseline potential in this cohort; this is an observational pattern that should not be interpreted causally and warrants replication in independent data sets. Feature importance was stable across 10-fold cross-validation (Functional Profile: mean importance = 0.203 ± 0.063; Dx: Musculoskeletal = 0.049 ± 0.006).
Figure 6.
SHAP Beeswarm Plot—Global Feature Importance (XGBoost, All Patients). Top 20 features ranked by the mean |SHAP value|. Each point represents one test patient, and the color indicates the feature value (red = high, blue = low). Points right = positive contribution toward Above Median. BI Total at admission was the dominant predictor, whereas age showed the opposite directional pattern. The functional Profile (ranked 5th) demonstrates a consistent directional influence.
3.6. Group-Stratified SHAP: Orthopedic vs. Neurological
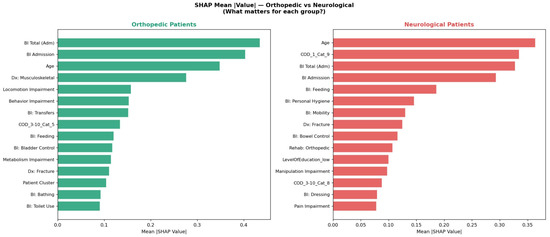
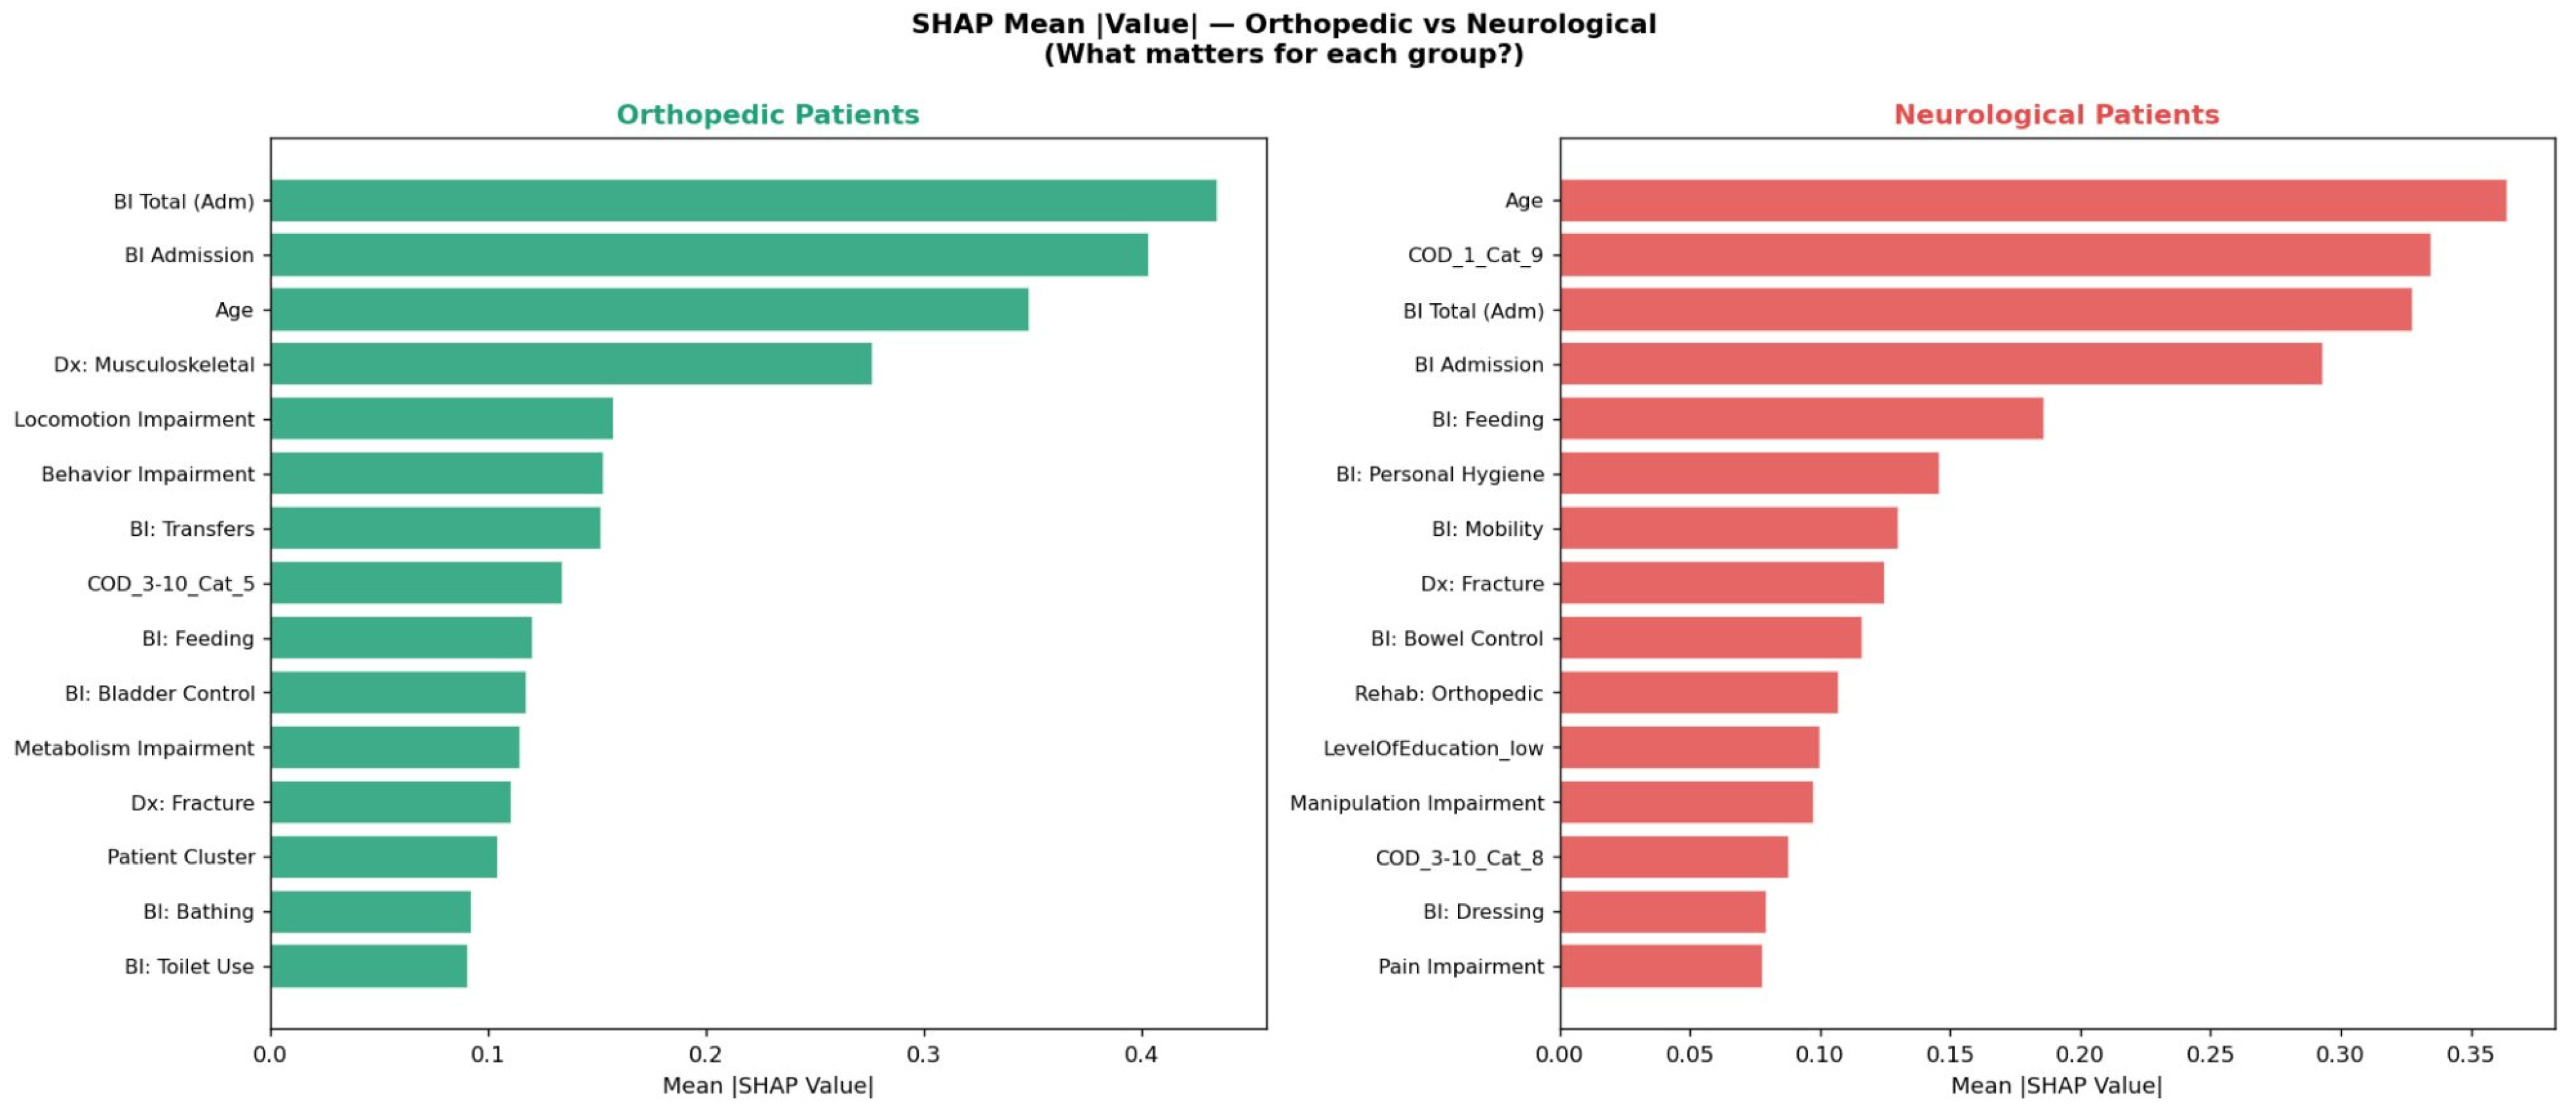
Distinct predictive architectures emerged across diagnostic groups, with age becoming the dominant predictor only in the neurological cohort (Figure 7). Among orthopedic patients, the top predictors were BI Total at admission (mean |SHAP| = 0.430), BI at admission (0.405), age (0.350), musculoskeletal diagnosis (0.275), and Locomotion Impairment (0.160). Functional status at entry dominated prediction. Among neurological patients, age had the highest SHAP importance (mean |SHAP| = 0.360), surpassing BI Total at admission (0.325) and BI at admission (0.295). This reversal, with age ranking #1 for neurological and #3 for orthopedic, represents a key finding in the differential predictive structure of the two patient groups. Additionally, BI: Feeding (0.185) and BI: Personal Hygiene (0.148) appeared among the top neurological predictors.
Figure 7.
SHAP Mean |Value|—Orthopedic vs. Neurological Patients. Side-by-side bar charts showing the top 15 predictors for Orthopedic (green) and Neurological (red) patients. Key finding: Age is the top predictor for Neurological patients (mean |SHAP| = 0.360), but ranks third for Orthopedic patients (0.350). These are descriptive SHAP patterns, not formal statistical associations.
3.7. Profile-Stratified SHAP Analysis
SHAP analysis within each patient’s functional admission profile revealed additional determinants. In Profile 0 (High-Burden), BI Total at admission was the dominant predictor, with a mean |SHAP| of 0.700, nearly twice that of the second predictor (Age: 0.440). Initial functional status was the dominant predictor, suggesting a more constrained predictive structure in this functional admission profile. These findings support the clinical relevance of the identified functional admission profiles.
In Profile 1 (Moderate-Burden), predictive importance was distributed more broadly: BI Total at admission (0.440), Age (0.270), COD_1_Cat_9: Organ or tissue replaced by other means (e.g., prosthetic implants) (0.265), BI: Feeding (0.215), and BI: Personal Hygiene (0.155). This broader distribution reflects greater clinical heterogeneity. Full cluster-stratified SHAP bar charts are provided in Supplementary Figure S3.
3.8. Clinical Rule Extraction
3.8.1. Decision Tree-Derived Rules
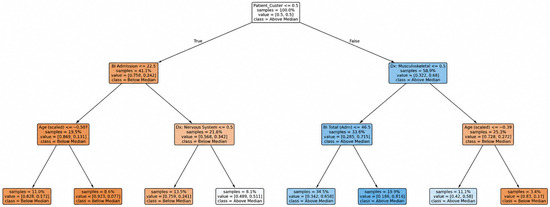
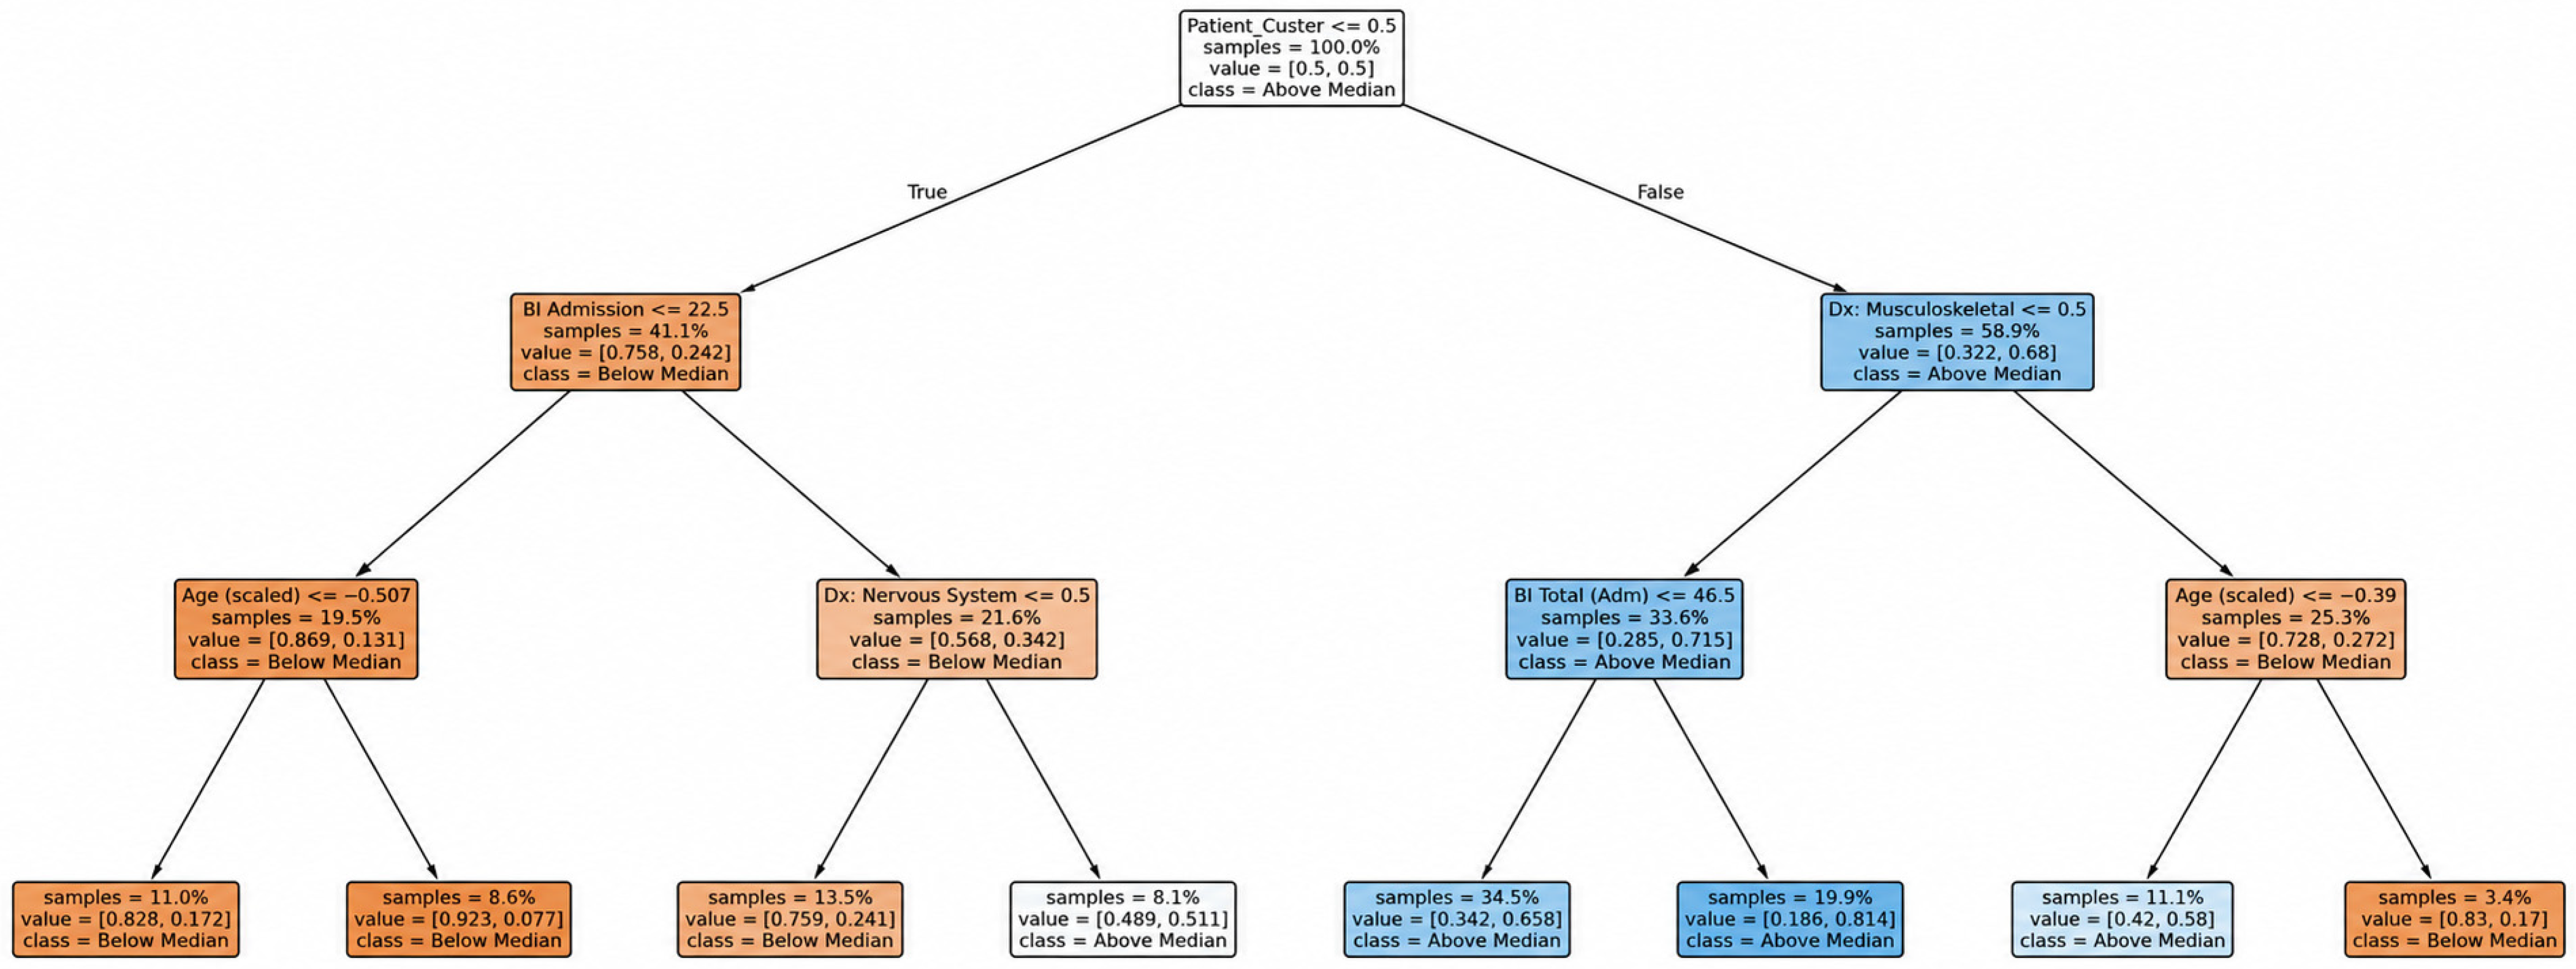
A shallow Decision Tree (max_depth = 3; overall accuracy: 70.8%) was trained to extract objective, threshold-based rules without researcher discretion. Functional Profile served as the root split (Figure 8), consistent with its ranking as the most discriminative single feature across multiple complementary analyses (SHAP global importance: 13.9%; 10-fold CV stability: mean 0.203 ± 0.063). Four rules were extracted:
Figure 8.
Decision Tree Rules (max_depth = 3)—Automated Clinical Rule Extraction. Root split on Functional Profile is consistent with its discriminative primacy across multiple complementary analyses. Orange nodes = predicted Below Median; blue nodes = Above Median. Branch proportions [Below, Above] are shown at each node—tree designed for interpretability rather than maximum predictive performance (accuracy: 70.8%).
Rule A: Profile 0 + BI at admission ≤ 22.5 → Below Median (83–92% of cases). Severely impaired, older patients represent the highest-risk group.
Rule B—near-equipoise zone: Profile 0 + BI at admission > 22.5 + Nervous System diagnosis → 51% Above Median. This subgroup falls near chance probability and represents a clinically uncertain zone; it should not be used as a unilateral decision rule and requires individual clinical evaluation.
Rule C: Profile 1 + No Musculoskeletal Diagnosis → Above Median (65–81% of cases). Moderate-Burden patients without musculoskeletal diagnoses have a high likelihood of recovery.
Rule D: Profile 1 + Musculoskeletal + Older Age → Below Median (83% of cases). Moderate-Burden patients with musculoskeletal diagnoses and older age show reduced probability of above-median recovery.
3.8.2. SHAP-Guided Bedside Stratification Profiles
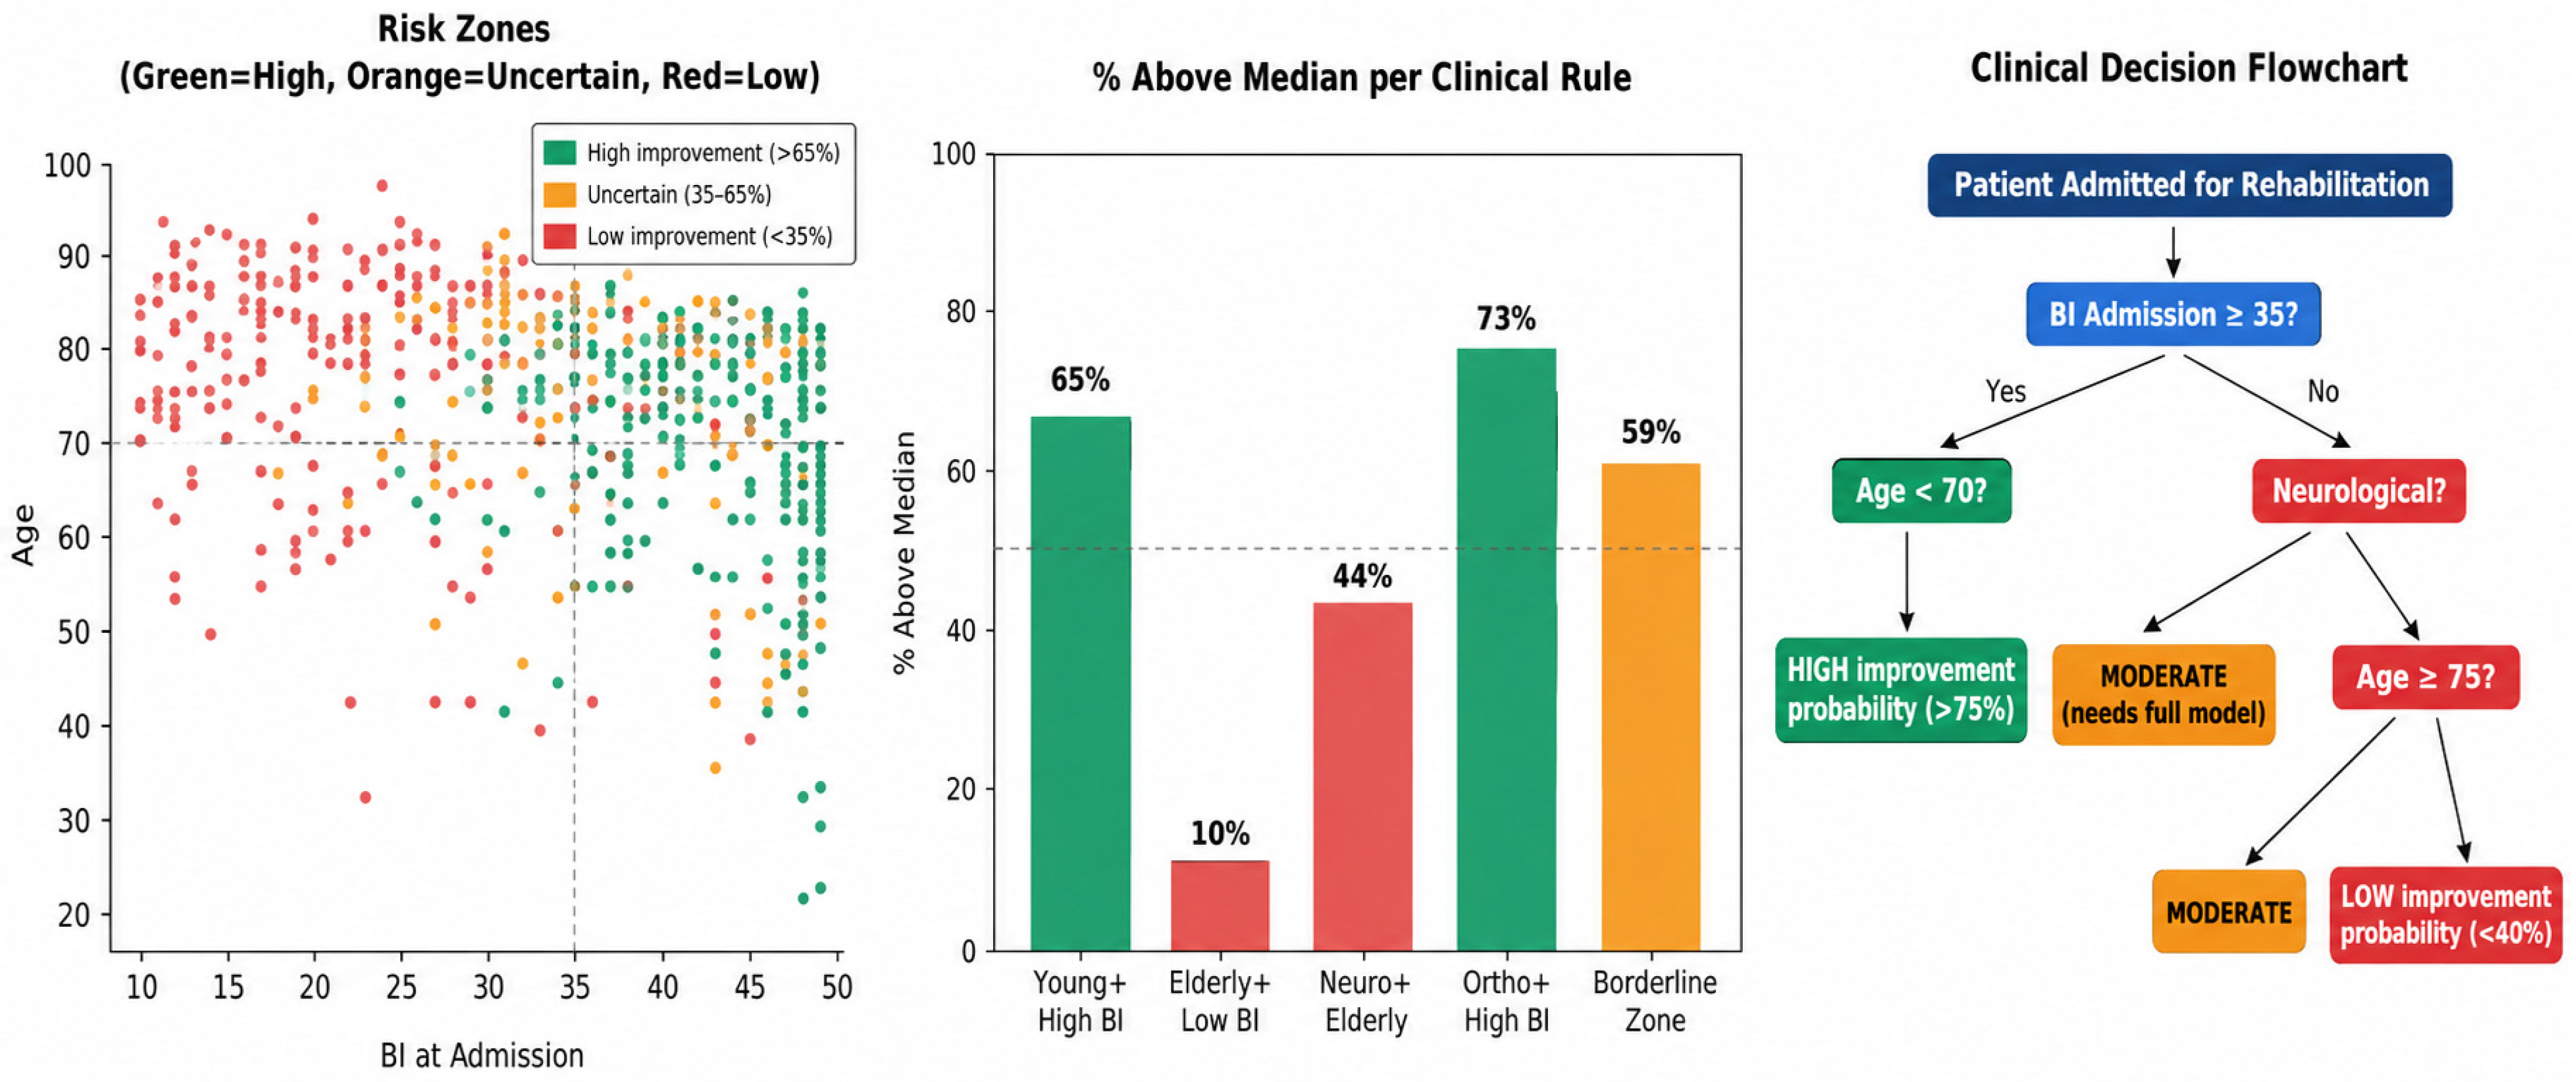
Five clinically meaningful patient profiles were identified and validated against observed outcomes in the independent test set (Table 3; Figure 9). These profiles were developed as exploratory decision-support tools intended to assist clinical interpretation and rehabilitation planning, particularly in cases with clearer prognostic patterns. However, they are not intended to replace comprehensive model-based assessment in borderline or complex cases and have not yet undergone prospective clinical validation. To further support interpretability at the individual-patient level, representative SHAP explanations for both high- and low-improvement cases are presented in Supplementary Figure S4.
Table 3.
SHAP-Guided Bedside Stratification Profiles—empirical outcome rates and model accuracy validated on the held-out test set. Recommendations reflect probability-based decision support, not clinical prescriptions.
Figure 9.
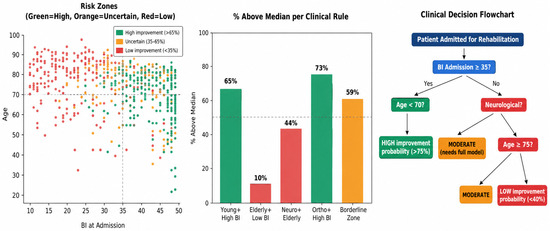
Clinical Decision Support—Risk Zones, Rules, and Triage Flowchart. (Left): Test patients (Age vs. BI at admission) colored by predicted risk zone (Green = High improvement > 65%, Orange = Uncertain 35–65%, Red = Low improvement < 35%). (Center): % Above Median for each SHAP-guided profile. (Right): Clinical decision flowchart translating model logic into a practical two-step triage algorithm.
3.9. Error Analysis
Among the 684 patients in the test cohort, 171 (25.0%) were misclassified. Errors were distributed almost equally between False Positives (FP; n = 85; 49.7% of errors) and False Negatives (FN; n = 86; 50.3% of errors), suggesting the absence of a systematic directional prediction bias. Differences in age and admission BI scores between error subgroups were examined descriptively; however, formal statistical comparisons were not performed because this analysis was exploratory.
False-positive patients, who were predicted to achieve above-median recovery but did not meet this outcome, tended to be younger (mean age 65.9 years versus 71.5 years among correctly classified patients) and to present with higher admission BI scores (mean 40.8 versus 34.1). These findings may reflect the influence of unmeasured factors, including patient motivation, adherence to rehabilitation programs, family or social support, and other psychosocial variables not captured in the ADR dataset. These factors are therefore considered hypothetical contributors rather than directly measured determinants.
Conversely, False Negative patients, who were predicted to achieve below-median recovery but ultimately exceeded expectations, were generally older (mean age 72.3 years) and had lower admission BI scores (mean 31.7). This pattern suggests that the model may underestimate the recovery potential of certain severely impaired patients who respond exceptionally well to intensive rehabilitation despite initially unfavorable clinical profiles.
4. Discussion
The predictive performance achieved in this study, AUC-ROC of 0.831 for the overall cohort, 0.864 for neurological patients, and 0.839 for orthopedic patients, is consistent with prior machine learning studies in inpatient rehabilitation [10,11,30]. The absence of statistically significant differences in AUC across the top eight models (bootstrap 95% CIs overlapping across all models [28]) suggests that predictive ceilings reflect the informational limits of routinely collected admission data rather than algorithmic constraints [17]. Nevertheless, the inclusion of complex ensemble methods was justified on three empirical grounds. First, Gradient Boosting achieved a meaningfully higher AUC in the neurological subgroup (AUC = 0.864 vs. 0.816 for Logistic Regression), suggesting that non-linear models better capture complex interaction effects, such as the age–diagnosis relationship, in this clinically distinct group. Second, ensemble models demonstrated marginally superior probability calibration (Brier Score: XGBoost = 0.168, Logistic Regression = 0.173), a small but meaningful difference that reflects more accurate probability estimates when communicating individualized risk to clinicians. Third, XGBoost was required to enable TreeSHAP-derived feature attribution computation via TreeExplainer, which underpins the multi-level explainability analysis central to this study. Notably, 80.7% of patients fell within high-confidence prediction zones (accuracy > 80%), indicating that the pipeline can reliably stratify most patients at admission.
Compared with prior studies using the same dataset, Santilli et al. [31] predicted absolute modified Barthel Index at discharge without addressing ceiling effects, patient profiling, or calibration assessment. Their feature importance analysis identified admission BI as the dominant predictor across both diagnostic groups, consistent with our orthopedic findings, but did not capture the age-dominant pattern observed in neurological patients. Buscarini et al. [32] reported very high cross-validation accuracies (96–98%) on an oversampled training set, which the authors themselves described as potentially unrealistic. Their study also lacked AUC-ROC evaluation, SHAP explainability, patient clustering, and clinically interpretable decision-support analysis. The present study addresses these methodological limitations through calibration analysis, subgroup-specific modeling, explainability, and clinically oriented patient profiling.
The improvement in the correlation between admission Barthel Index and functional gain, from r = 0.130 with absolute gain to r = 0.520 with normalized gain, provides empirical support for the clinical inadequacy of absolute gain as an outcome metric [3,7]. From a clinical standpoint, two patients who each gain 35 BI points during rehabilitation may be indistinguishable in terms of absolute gain. Yet, one may have realized only 39% of their remaining functional potential, while the other achieved 64%. Normalized functional gain corrects for this confound by anchoring recovery to each patient’s theoretical maximum, providing a fairer and more clinically informative basis for prognostic comparison and outcome benchmarking across patients with varying admission severity.
Patient functional admission profiling via unsupervised clustering identified two data-driven functional admission profiles with statistically significant between-group differences that carried predictive value. Although the geometric separation between clusters was modest, as expected in high-dimensional, heterogeneous clinical populations, the two-functional admission profile solution demonstrated statistically significant between-cluster differences in functional gain, age, and outcome distribution (all p < 0.001), and cluster membership ranked as the third most important predictive feature globally (13.9% SHAP importance), consistent across SHAP analysis, decision tree root-split, and 10-fold cross-validation stability [23,24]. Within the High-Burden functional admission profile (older patients, mean age 74.8 years; severe functional impairment, mean admission BI 23.1), the admission Barthel Index exerted a near-exclusive prognostic influence, suggesting a more constrained predictive structure in this profile. Within the Moderate-Burden functional admission profile (mean age 68.8 years; mean admission BI 42.8), predictive importance was distributed across multiple clinical features, suggesting greater heterogeneity in predictive structure, which, pending validation, may reflect greater potential for individualized rehabilitation planning and intervention.
A clinically important finding of this study is the differential prognostic role of age across diagnostic groups. Age showed the highest SHAP-derived importance in neurological patients (mean |SHAP| = 0.360), surpassing the admission Barthel Index. In contrast, in orthopedic patients, admission functional status remained the dominant prognostic anchor (mean |SHAP| = 0.430), with age ranking third (0.350). This divergence is consistent with a hypothesized difference in recovery biology: neurological recovery may be substantially influenced by neuroplasticity, which declines with advancing age [18], whereas orthopedic recovery may be more directly influenced by pre-operative and pre-admission functional capacity [14]. These observations should be interpreted as hypothesis-generating rather than causal conclusions. The significantly higher predictability of neurological outcomes (AUC = 0.864 vs. 0.839; ΔAUC = +0.025, 95% CI: [+0.014, +0.036]) is consistent with the stronger prognostic signal conferred by age in this population. These findings support a differential prognostic approach in clinical practice: when counseling neurological patients and their families about expected recovery, age should be given greater weight. At the same time, baseline functional status serves as the primary prognostic anchor for orthopedic patients [3].
The clinical decision support tools derived from this pipeline provide actionable prognostic guidance at the bedside. The Elderly (≥75 years) and Low Admission BI (<25) profile demonstrated 89.6% model accuracy with only 10.4% of patients achieving above-median recovery, supporting a cautious, individualized approach to goal-setting and family communication in this high-risk group. Conversely, the risk stratification pipeline identified that 80.7% of patients fell within high-confidence zones (Green and Red zones; accuracy > 80%), where model predictions can meaningfully supplement clinical judgment in admission-stage decision-making, pending prospective external validation.
Misclassification analysis revealed a balanced distribution of false positives and false negatives (49.7% vs. 50.3%), confirming the absence of systematic directional bias in the model. Patients predicted to achieve above-median recovery who did not (false positives) were younger (mean age 65.9 years) with higher admission BI (mean 40.8), suggesting that unmeasured factors, including patient motivation, rehabilitation adherence, social support, and discharge environment, may constrain functional outcomes in patients who appear prognostically favorable at admission. Conversely, patients who exceeded predictions (false negatives) were older (mean age 72.3 years) with lower admission BI (mean 31.7), suggesting that the model may underestimate recovery capacity in some severely impaired patients who respond exceptionally well to intensive, individualized rehabilitation. These findings highlight the clinical importance of dynamic reassessment and the need to incorporate psychosocial predictors in future model iterations. Calibration was fair across all models (Brier Score: 0.150–0.173 [29]), with a slight tendency to underestimate the probability of above-median recovery in the Red zone (calibration error: 5.7%), which should be considered when applying low-probability model outputs to individual clinical decisions.
From a clinical implementation perspective, the value of this pipeline lies not only in its predictive accuracy but also in its potential to support admission-stage stratification in a clinically interpretable manner, pending prospective external validation. By combining normalized functional gain with functional admission profiles and explainability, the pipeline may, if validated, contribute to more realistic goal-setting, clearer communication with patients and families, and more tailored rehabilitation planning. All outputs should be treated as exploratory decision-support tools that complement, and do not replace, clinical judgment.
5. Limitations
Several limitations should be considered when interpreting these findings. First, this study used a single-center dataset collected between 2015 and 2018, and prospective multi-center external validation is required before clinical implementation. The 80/20 train–test split does not represent true external validation, as both subsets originated from the same institution and time period. Consequently, the models may partially reflect local case mix, documentation practices, and rehabilitation workflows, limiting generalizability to other healthcare settings. Although cross-validation performance closely matched held-out test performance (0.742–0.765 vs. 0.741–0.765), this agreement reflects internal consistency rather than external validity.
Second, the admission dataset did not capture several important determinants of rehabilitation outcomes, including patient motivation, family support, premorbid functional independence, neuroimaging findings, detailed comorbidity severity, pharmacotherapy regimens, or the intensity of multidisciplinary rehabilitation interventions. These factors likely contributed to a proportion of the observed prediction errors, particularly among older and clinically complex patients. Future studies should incorporate structured comorbidity indices, medication data, and rehabilitation intensity metrics to better capture the complexity of inpatient rehabilitation populations.
Third, the modest cluster separation (Silhouette Score = 0.100) reflects the inherent heterogeneity of rehabilitation populations and suggests that more granular admission-profiling approaches may improve subgroup characterization in future work. Accordingly, the identified clusters should be interpreted as pragmatic predictive groupings rather than distinct latent clinical phenotypes. Furthermore, cluster labels were assigned once to the full training set prior to cross-validation, rather than being refitted within each fold. While the close agreement between cross-validation performance and held-out test accuracy provides some reassurance, the possibility of optimistic bias cannot be entirely ruled out. This remains a methodological limitation, and future studies should address it by integrating the clustering procedure within each cross-validation fold.
Finally, SHAP explanations describe model behavior rather than causal clinical relationships. Feature attributions may be influenced by correlations between variables, and the identified patterns have not yet been prospectively validated in independent cohorts. In addition, SHAP interpretations remain model-specific and may not generalize across alternative machine learning architectures. Therefore, all explainability findings and proposed clinical stratification profiles should be considered hypothesis-generating and require further prospective validation, including future decision curve analysis to evaluate net clinical benefit across decision thresholds [33].
6. Conclusions
This study presents an explainable, profile-informed machine learning pipeline for predicting rehabilitation outcomes at admission in 3419 patients undergoing intensive inpatient rehabilitation. By introducing a normalized functional gain measure, identifying two data-driven admission profiles, and generating clinically interpretable predictions, the proposed approach addresses key limitations in prior rehabilitation outcome research, including ceiling effects, patient heterogeneity, and model explainability. The findings suggest that age demonstrated the highest SHAP-derived importance in neurological patients, whereas baseline functional status showed the strongest predictive contribution in orthopedic patients. The models achieved stable performance across diagnostic groups, with 80.7% of patients classified into high-confidence prognostic categories at admission. The proposed pipeline may support future decision-support research to improve early goal-setting, communication, and individualized rehabilitation planning. Nevertheless, prospective multi-center external validation remains essential before clinical implementation.
Supplementary Materials
The following supporting information can be downloaded at: https://www.mdpi.com/article/10.3390/sci8060129/s1: Figure S1: Model Calibration Analysis. Left: Calibration curves for all model configurations compared with the perfect calibration diagonal. Models follow the diagonal reasonably well, with slight overconfidence in the 0.3–0.5 probability range. Right: Distribution of predicted probabilities for correct versus incorrect predictions, showing that errors concentrate near the 0.50 decision threshold, whereas high-confidence predictions (probability <0.20 or >0.80) are predominantly correct; Figure S2: Baseline Model Comparison—All Patients Cohort. Left: Test Accuracy and AUC-ROC for all nine models, demonstrating a performance plateau among tree-based ensembles (AUC range: 0.816–0.833). Center: ROC curves showing close clustering of all models except the Decision Tree. Right: Confusion matrix for Gradient Boosting, which achieved the best test accuracy (76.5%), showing near-balanced false-positive (n = 85) and false-negative (n = 86) classification errors; Figure S3: SHAP Mean |Value| by Patient Cluster. Left: Cluster 0 (High-Burden, n = 1135 full dataset; n = 284 test patients), where BI Total at admission dominates at mean |SHAP| = 0.70, indicating that functional entry status is the primary recovery determinant in this phenotype. Right: Cluster 1 (Moderate-Burden, n = 1600 full dataset; n = 400 test patients), where importance is distributed across multiple features (top |SHAP| = 0.44), reflecting greater clinical heterogeneity; Figure S4: SHAP Waterfall Plots—Individual Patient Explanations. Left: High-improvement patient (predicted probability P = 0.991; actual outcome: Above Median), showing positive SHAP contributions from high BI Total at admission, younger age, independent feeding, preserved mobility, and Cluster 1 membership. Right: Low-improvement patient (P = 0.004; actual outcome: Below Median), showing negative contributions from older age, low BI Total, locomotion impairment, and Cluster 0 membership. The model’s expected value E[f(X)] = 0.002 reflects the balanced class distribution; Supplementary Material S2: Reproducibility details, including preprocessing sequence, target engineering, leakage removal, hyperparameter search grids, SHAP configuration, software/package versions, and global random seed settings; Supplementary Material S3: Completed TRIPOD+AI checklist for transparent reporting of the prediction model study. All references cited in the supplementary files are also included in the main reference list [34,35].
Author Contributions
Z.M.H., T.N.A. and A.H.O. contributed to the study’s conceptualization and design. T.N.A. developed the methodology, implemented the software, conducted formal analysis and visualization, and drafted the original manuscript. Z.M.H. contributed to study supervision and project administration. A.S.S., M.I.S., A.M.J., R.S.M., D.F.N. and M.Z.H. contributed to investigation, clinical interpretation, and data-related input. Z.M.H. and A.H.O. contributed to manuscript review and editing. All authors have read and agreed to the published version of the manuscript.
Funding
This research received no external funding.
Institutional Review Board Statement
Ethical review and approval were waived for this study, due to this study using a publicly available, fully anonymized dataset. Ethical approval was obtained by the original data providers prior to data collection (Ethics Committee code 07/18). No additional ethical approval was required for this secondary analysis.
Informed Consent Statement
Informed consent was waived due to the dataset usage terms and the absence of direct human participant recruitment, intervention, or access to private clinical records.
Data Availability Statement
The dataset used in this study is publicly available through Figshare at https://figshare.com/s/7aab7ad2d351f53dbe2f (accessed on 9 April 2026) and is associated with the data article by Seccia et al. The dataset can also be accessed on Figshare using the DOI 10.6084/m9.figshare.11663277.
Acknowledgments
The authors would like to acknowledge the original contributors of the rehabilitation dataset, publicly available through Figshare, and the clinical teams at IRCCS San Raffaele Hospital, Rome, Italy, for their role in data collection and curation. The availability of this high-quality, anonymized dataset enabled the development and validation of the present study.
Conflicts of Interest
The authors declare no conflicts of interest.
References
- Cieza, A.; Causey, K.; Kamenov, K.; Hanson, S.W.; Chatterji, S.; Vos, T. Global estimates of the need for rehabilitation based on the Global Burden of Disease study 2019: A systematic analysis. Lancet 2020, 396, 2006–2017. [Google Scholar] [CrossRef] [Scilit]
- GBD 2019 Stroke Collaborators. Global, regional, and national burden of stroke and its risk factors, 1990–2019: A systematic analysis for the Global Burden of Disease Study 2019. Lancet Neurol. 2021, 20, 795–820. [Google Scholar] [CrossRef] [Scilit]
- Stinear, C.M.; Smith, M.-C.; Byblow, W.D. Prediction tools for stroke rehabilitation. Stroke 2019, 50, 3314–3322. [Google Scholar] [CrossRef] [Scilit]
- Mahoney, F.I.; Barthel, D.W. Functional evaluation: The Barthel Index. Md. State Med. J. 1965, 14, 61–65. [Google Scholar]
- Wade, D.T.; Collin, C. The Barthel ADL Index: A standard measure of physical disability? Int. Disabil. Stud. 1988, 10, 64–67. [Google Scholar] [CrossRef] [Scilit] [PubMed]
- Ocagli, H.; Cella, N.; Stivanello, L.; Degan, M.; Canova, C. The Barthel Index as an indicator of hospital outcomes: A retrospective cross-sectional study with healthcare data from older people. J. Adv. Nurs. 2021, 77, 1751–1761. [Google Scholar] [CrossRef] [Scilit] [PubMed]
- Kwon, S.; Hartzema, A.G.; Duncan, P.W.; Min-Lai, S. Disability measures in stroke: Relationship among the Barthel Index, the Functional Independence Measure, and the Modified Rankin Scale. Stroke 2004, 35, 918–923. [Google Scholar] [CrossRef] [Scilit] [PubMed]
- Rajpurkar, P.; Chen, E.; Banerjee, O.; Topol, E.J. AI in health and medicine. Nat. Med. 2022, 28, 31–38. [Google Scholar] [CrossRef] [Scilit]
- Topol, E.J. High-performance medicine: The convergence of human and artificial intelligence. Nat. Med. 2019, 25, 44–56. [Google Scholar] [CrossRef] [Scilit]
- Scrutinio, D.; Monitillo, V.; Guida, P.; Nardulli, R.; Multari, V.; Monitillo, F.; Calabrese, G.; Fiore, P. Functional Gain After Inpatient Stroke Rehabilitation: Correlates and Impact on Long-Term Survival. Stroke 2015, 46, 2976–2980. [Google Scholar] [CrossRef] [Scilit]
- Heo, J.; Yoon, J.G.; Park, H.; Kim, Y.D.; Nam, H.S.; Heo, J.H. Machine learning-based model for the prediction of outcomes in acute stroke. Stroke 2019, 50, 1263–1265. [Google Scholar] [CrossRef] [Scilit]
- Harari, Y.; O’Brien, M.K.; Lieber, R.L.; Jayaraman, A. Inpatient stroke rehabilitation: Prediction of clinical outcomes using a machine-learning approach. J. Neuroeng. Rehabil. 2020, 17, 71. [Google Scholar] [CrossRef] [Scilit]
- Lin, W.-Y.; Chen, C.-H.; Tseng, Y.-J.; Tsai, Y.-T.; Chang, C.-Y.; Wang, H.-C.; Chen, C.-K. Predicting post-stroke activities of daily living through a machine learning-based approach on initiating rehabilitation. Int. J. Med. Inform. 2018, 111, 159–164. [Google Scholar] [CrossRef] [Scilit]
- Clement, N.D.; Clement, R.; Clement, A. Predicting Functional Outcomes of Total Hip Arthroplasty Using Machine Learning: A Systematic Review. J. Clin. Med. 2024, 13, 603. [Google Scholar] [CrossRef] [Scilit] [PubMed]
- Chen, T.; Guestrin, C. XGBoost: A scalable tree boosting system. In Proceedings of the 22nd ACM SIGKDD International Conference on Knowledge Discovery and Data Mining; Association for Computing Machinery: New York, NY, USA, 2016; pp. 785–794. [Google Scholar] [CrossRef] [Scilit]
- Ke, G.; Meng, Q.; Finley, T.; Wang, T.; Chen, W.; Ma, W.; Ye, Q.; Liu, T. LightGBM: A Highly Efficient Gradient Boosting Decision Tree. HAL (Le Centre Pour La Communication Scientifique Directe). 2017. Available online: https://hal.science/hal-03953007 (accessed on 1 January 2026).
- Shwartz-Ziv, R.; Armon, A. Tabular data: Deep learning is not all you need. Inf. Fusion 2022, 81, 84–90. [Google Scholar] [CrossRef] [Scilit]
- Bernhardt, J.; Hayward, K.S.; Kwakkel, G.; Ward, N.S.; Wolf, S.L.; Borschmann, K.; Krakauer, J.W.; Boyd, L.A.; Carmichael, S.T.; Corbett, D.; et al. Agreed definitions and a shared vision for new standards in stroke recovery research: The Stroke Recovery and Rehabilitation Roundtable taskforce. Neurorehabilit. Neural Repair 2017, 31, 793–799. [Google Scholar] [CrossRef] [Scilit]
- Rudin, C. Stop explaining black box machine learning models for high stakes decisions and use interpretable models instead. Nat. Mach. Intell. 2019, 1, 206–215. [Google Scholar] [CrossRef] [Scilit]
- Lundberg, S.M.; Lee, S.-I. A unified approach to interpreting model predictions. Adv. Neural Inf. Process. Syst. 2017, 30, 4765–4774. [Google Scholar]
- Lundberg, S.M.; Erion, G.; Chen, H.; DeGrave, A.; Prutkin, J.M.; Nair, B.; Katz, R.; Himmelfarb, J.; Bansal, N.; Lee, S.-I. From local explanations to global understanding with explainable AI for trees. Nat. Mach. Intell. 2020, 2, 56–67. [Google Scholar] [CrossRef] [Scilit]
- Nohara, Y.; Matsumoto, K.; Soejima, H.; Nakashima, N. Explanation of machine learning models using Shapley additive explanation and application for real data in hospital. Comput. Methods Programs Biomed. 2022, 214, 106584. [Google Scholar] [CrossRef] [Scilit]
- Fleuren, L.M.; Klausch, T.L.T.; Zwager, C.L.; Schoonmade, L.J.; Guo, T.; Roggeveen, L.F.; Swart, E.L.; Girbes, A.R.J.; Thoral, P.J.; Ercole, A.; et al. Machine learning for the prediction of sepsis: A systematic review and meta-analysis of diagnostic test accuracy. Intensive Care Med. 2020, 46, 383–400. [Google Scholar] [CrossRef] [Scilit]
- Zhang, Z.; Ho, K.M.; Hong, Y. Machine learning for the prediction of volume responsiveness in patients with oliguric acute kidney injury in critical care. Crit. Care 2021, 23, 112. [Google Scholar] [CrossRef] [Scilit] [PubMed]
- Seccia, R.; Boresta, M.; Fusco, F.; Tronci, E.; Di Gemma, E.; Palagi, L.; Mangone, M.; Agostini, F.; Bernetti, A.; Santilli, V.; et al. Data of patients undergoing rehabilitation programs. Data Brief 2020, 30, 105419. [Google Scholar] [CrossRef] [Scilit] [PubMed]
- Collins, G.S.; Reitsma, J.B.; Altman, D.G.; Moons, K.G. Transparent reporting of a multivariable prediction model for individual prognosis or diagnosis (TRIPOD): The TRIPOD statement. BMJ 2015, 350, g7594. [Google Scholar] [CrossRef] [Scilit] [PubMed]
- Seccia, R.; Boresta, M.; Fusco, F.; Tronci, E.; Di Gemma, E.; Palagi, L.; Mangone, M.; Agostini, F.; Bernetti, A.; Santilli, V.; et al. Rehabilitation Dataset [Data Set]. Figshare. Available online: https://figshare.com/s/7aab7ad2d351f53dbe2f (accessed on 1 January 2026).
- DeLong, E.R.; DeLong, D.M.; Clarke-Pearson, D.L. Comparing the areas under two or more correlated receiver operating characteristic curves: A nonparametric approach. Biometrics 1988, 44, 837–845. [Google Scholar] [CrossRef] [Scilit] [PubMed]
- Brier, G.W. Verification of forecasts expressed in terms of probability. Mon. Weather Rev. 1950, 78, 1–3. [Google Scholar] [CrossRef] [Scilit]
- Campagnini, S.; Arienti, C.; Patrini, M.; Liuzzi, P.; Mannini, A.; Carrozza, M.C. Machine learning methods for functional recovery prediction and prognosis in post-stroke rehabilitation: A systematic review. J. Neuroeng. Rehabil. 2022, 19, 54. [Google Scholar] [CrossRef] [Scilit]
- Santilli, V.; Mangone, M.; Diko, A.; Alviti, F.; Bernetti, A.; Agostini, F.; Palagi, L.; Servidio, M.; Paoloni, M.; Goffredo, M.; et al. The use of machine learning for inferencing the effectiveness of a rehabilitation program for orthopedic and neurological patients. Int. J. Environ. Res. Public Health 2023, 20, 5575. [Google Scholar] [CrossRef] [Scilit]
- Buscarini, L.; Romano, P.; Cocco, E.S.; Damiani, C.; Pournajaf, S.; Franceschini, M.; Infarinato, F. Enhancing patient rehabilitation outcomes: Artificial intelligence-driven predictive modeling for home discharge in neurological and orthopedic conditions. J. Neuroeng. Rehabil. 2025, 22, 117. [Google Scholar] [CrossRef] [Scilit]
- Vickers, A.J.; van Calster, B.; Steyerberg, E.W. Net benefit approaches to the evaluation of prediction models, molecular markers, and diagnostic tests. BMJ 2016, 352, i6. [Google Scholar] [CrossRef] [Scilit]
- Collins, G.S.; Moons, K.G.; Dhiman, P.; Riley, R.D.; Beam, A.L.; Van Calster, B.; Ghassemi, M.; Liu, X.; Reitsma, J.B.; Van Smeden, M.; et al. TRIPOD+AI statement: Updated guidance for reporting clinical prediction models that use regression or machine learning methods. BMJ 2024, 385, e078378. [Google Scholar] [CrossRef] [Scilit]
- Debray, T.P.; Collins, G.S.; Riley, R.D.; Snell, K.I.; Van Calster, B.; Reitsma, J.B.; Moons, K.G. Transparent reporting of multivariable prediction models developed or validated using clustered data: TRIPOD-Cluster checklist. BMJ 2023, 380, e071018. [Google Scholar] [CrossRef] [Scilit]

Disclaimer/Publisher’s Note: The statements, opinions and data contained in all publications are solely those of the individual author(s) and contributor(s) and not of MDPI and/or the editor(s). MDPI and/or the editor(s) disclaim responsibility for any injury to people or property resulting from any ideas, methods, instructions or products referred to in the content. |
© 2026 by the authors. Licensee MDPI, Basel, Switzerland. This article is an open access article distributed under the terms and conditions of the Creative Commons Attribution (CC BY) license.