


Abstract
This study investigates the influence of extraction method and solvent on the UV spectral characteristics of extracts obtained from selected agro-industrial waste materials. Conventional maceration and ultrasound-assisted extraction (UAE) were applied using distilled water and 70% (v/v) ethanol as solvents. The analyzed materials included spent coffee grounds, orange peel, rosehip, milk thistle, eucalyptus leaves, and chili pepper. UV spectrophotometric analysis (190–400 nm) was used to compare the absorption profiles of the obtained extracts and to evaluate the effect of extraction conditions on spectral features. The results showed that both solvent type and extraction technique significantly influenced the intensity and shape of the absorption spectra. Ethanol generally resulted in higher absorbance values and more defined spectral features in the 250–350 nm region, while aqueous extracts exhibited stronger absorption in the lower UV range. Overall, UV spectroscopy proved to be a rapid and effective screening tool for evaluating extraction performance and comparing spectral characteristics of complex plant extracts, supporting the valorization of agro-industrial waste. Total phenolic content (TPC) was additionally determined to support the evaluation of extraction efficiency.
1. Introduction
Bioactive compounds are naturally occurring substances found in various plants, animals, and microorganisms in the form of antioxidants, vitamins, and different phytochemicals [1,2]. These bioactive compounds are increasingly being explored for industrial applications, particularly in the food, pharmaceutical, cosmetic, and packaging sectors, where they serve as natural preservatives, functional ingredients, and sustainable alternatives to synthetic additives [3,4]. In the current era, where industrial waste poses a major environmental challenge, it is essential to identify alternative materials to synthetic ones [5]. Beyond reducing the use of unsustainable, non-renewable resources, industries should aim to maximize the utilization of existing waste as a source of raw material in production processes, aligning with the principles of the circular economy [6]. Agro-industrial waste represents a valuable and underutilized source of compounds that can be recovered and valorized for various applications. Such materials can serve as sources of UV-absorbing compounds associated with conjugated chromophore systems. Bioactive compounds can be extracted from agro-industrial waste [7]. When improperly disposed of, this type of waste can cause significant environmental problems; however, when recognized and utilized as a valuable and abundant source of functional compounds, it can yield byproducts of considerable economic and functional value [8,9]. Byproducts from the fruit and vegetable industry are particularly interesting, as they are inexpensive and readily available in large quantities [10]. Bioactive compounds can be extracted using conventional and modern extraction techniques [11]. Recent advances in extraction techniques have focused on minimizing solvent use [12]. These newer methods are more environmentally friendly, as they require fewer synthetic and organic chemicals, operate in shorter times, and yield extracts of higher quality and quantity [13].
UV–Vis spectroscopy is widely used as a rapid and cost-effective analytical technique for the characterization of plant extracts. Although it does not enable definitive identification of individual compounds in complex mixtures, it provides valuable information on absorption features associated with chromophore systems and allows comparative evaluation of extraction efficiency.
In this study, compounds were extracted from spent coffee grounds, orange peel, chili pepper, milk thistle, and eucalyptus leaves using maceration and ultrasound-assisted extraction, with distilled water and a 70% ethanol solution as solvents. Spent coffee grounds are reported in the literature as a source of various phenolic-type compounds [14]. Orange peel is also recognized as a source of compounds exhibiting characteristic UV absorption [15,16]. Chili pepper contains compounds with conjugated structures that contribute to UV absorption [17,18,19]. Milk thistle is reported to contain flavonolignan-type compounds with characteristic absorption in the UV region [20,21,22]. Eucalyptus globulus are also described as a source of phenolic-type compounds contributing to UV spectral features [23,24].
The aim of this study was to compare the influence of extraction medium (water vs. ethanol) and ultrasound-assisted extraction on the UV spectral characteristics of extracts obtained from chemically diverse natural matrices (spent coffee grounds, orange peel, milk thistle, rosehip, eucalyptus, and chili pepper). Conventional maceration was used as a reference method to evaluate the effect of ultrasound on extraction efficiency and spectral profiles. The objective was to evaluate differences in spectral characteristics of the obtained extracts and to assess the suitability of UV spectroscopy as a rapid screening tool, and to complement the analysis by evaluating total phenolic content (TPC) as a quantitative indicator of extraction efficiency.
2. Materials and Methods
2.1. Chemicals
L-ascorbic acid (≥99%), trans-Ferulic acid (≥99%), gallic acid (97.5–102.5%), caffeic acid (≥98%), silymarin (flavonolignan mixture, ≥30% silybin by HPLC area) and Folin—Ciocalteu’s phenol reagent (2N) were obtained from Sigma-Aldrich (Merck, St. Louis, MO, USA). Sodium carbonate anhydrous (≥99.5%, p.a.) was obtained from T.T.T. d.o.o., Sveta Nedjelja, Croatia. Ethanol (analytical grade) and distilled water were used to prepare 70% (v/v) ethanol solutions, which were employed as solvents. Stock solutions of standards were prepared at 0.01 M in the appropriate solvent and stored at 4 °C until use.
2.2. Preparation of Bioactive Standard Solutions
The solutions of pure compounds were prepared to enable subsequent identification and correlation of their presence in plant matrix extracts. For each compound, one aqueous and one alcoholic solution were prepared. The initial 0.01 M solutions of the following bioactive compounds were prepared: L-ascorbic acid, trans-Ferulic acid, gallic acid, caffeic acid and silymarin. After weighing out the compounds—0.0440 g of L-ascorbic acid, 0.0485 g of trans-Ferulic acid, 0.0425 g of gallic acid, 0.0450 g of caffeic acid, 0.1206 g of silymarin, distilled water/ethanol 70% v/v was added until the total volume reached 25 mL. Ascorbic acid is known to be highly soluble in distilled water. While soluble in water, it is not easily dissolved in alcohol [25], so its alcoholic solution had to be additionally stirred on a magnetic stirrer (IKA RCT basic IKAMAG® safety control, Staufen im Breisgau, Germany) without heating, for 10 min until dissolution. Trans-Ferulic acid, gallic acid, caffeic acid and silymarin are known to be less soluble in water. The solubility of phenolic compounds in water increases exponentially with rising temperature [26,27]. To enhance their solubility, the aqueous solutions were placed on the previously mentioned magnetic stirrer equipped with a heater and heated to 50 °C for 10 min while stirring. Silymarin showed limited dissolution in hot water—upon cooling to room temperature, phase separation occurred where silymarin separated from the aqueous phase [28,29]. In this case, ethanol 70% v/v proved to be a more favourable solvent, although the phase separation could still be noticed, suggesting partial rather than complete solubility of silymarin. The absorbance of the prepared solutions was measured using a UV–Vis spectrophotometer.
2.3. Preparation of Plant Matrix Extracts
The plant materials used in this study were spent coffee grounds, orange peel, rosehip fruit, milk thistle seeds, eucalyptus leaves, and chili pepper. Prior to extraction, the raw materials were mechanically ground using laboratory tube mill (IKA TUBE-MILL 100 control, IKA-Werke GmbH & Co. KG, Staufen im Breisgau, Germany) at 10 000 rpm for 5 min and sieved to obtain the desired particle size (<1 mm), then stored in sealed containers at room temperature until use. The extraction solvents were distilled water and ethanol 70% v/v, diluted from 96% v/v.
2.3.1. Maceration
Conventional extraction by maceration was performed as a reference method. A defined mass of 5 g of the ground plant material was placed in a closed glass container and mixed with a defined volume of 50 mL of solvent resulting in a solid-to-liquid ratio 1:10. The mixture was kept at 23 ± 1 °C for 30 min under static conditions, with occasional manual stirring to enhance mass transfer. After maceration, the extracts were separated from the solid residue by centrifugation at 6000 rpm for 5 min (IKA® mini G, IKA-Werke GmbH & Co. KG, Staufen im Breisgau, Germany). The obtained supernatants were stored in dark containers at 5 ± 1 °C until further analysis. Additionally, the maceration process was extended to 7 days, after which the extracts were analyzed to evaluate the effect of prolonged extraction time.
2.3.2. Ultrasound-Assisted Extraction (UAE)
Extractions were also performed using ultrasound-assisted extraction (UAE). For each sample, a defined mass of 5 g of the ground plant material was placed in a closed glass container and mixed with a defined volume of 50 mL of solvent resulting in a solid-to-liquid ratio 1:10. The mixture was subjected to ultrasound treatment with an ultrasonic probe-type processor (UP100H, Hielscher Ultrasonics GmbH, Teltow, Germany) at a frequency of 30 kHz, nominal power 100 W, for 10, 20 and 30 min with temperature reaching 30 °C after 10 min, 40 °C after 20 min and 50 °C after 30 min. The temperature of the ultrasonic bath was maintained constant (at 30 °C) by periodic cooling in order to minimize thermal effects during sonication. After extraction, the suspensions were allowed to cool to room temperature and the solid residues were separated from liquid extracts by centrifugation at 6000 rpm, 5 min and pipetting off the supernatant from the sediment. The resulting aqueous and alcoholic extracts were stored in dark glass containers at 5 °C until UV analysis.
2.4. UV Spectroscopy
UV spectroscopic measurements were carried out using a UV–Vis spectrophotometer (UV-model 1900i, Shimazdu, Kyoto, Japan) equipped with quartz cuvettes of 1 cm optical path length. Spectra were recorded in the UV region from 190 to 400 nm, with a scanning interval of 1.0 nm and a scanning speed of 40 s. The corresponding solvent (water or ethanol medium) was used as a blank under identical measurement conditions. All samples were prepared and measured under consistent extraction conditions and solid-to-liquid ratios; however, no additional spectral normalization or concentration adjustment was performed. All experiments were conducted without replicates; therefore, no statistical analysis (e.g., standard deviation or variance) was performed. The results should be interpreted as comparative and indicative.
2.5. Gallic Acid Calibration Curve
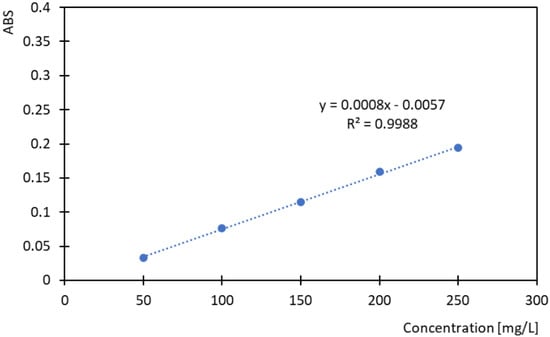
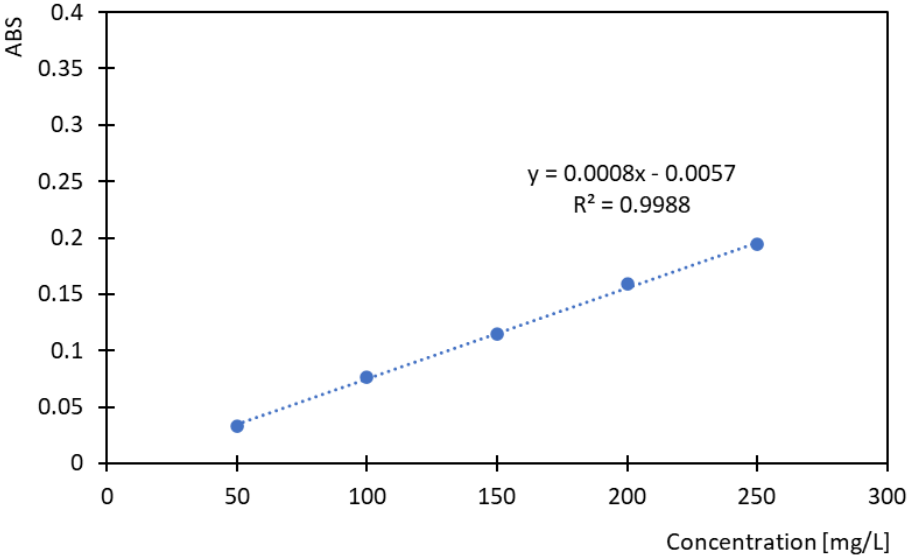
A gallic acid stock solution (1000 mg/L) was prepared by accurately weighing 0.025 g of gallic acid, dissolving it in distilled water, and diluting it to a final volume of 25 mL. A series of standard solutions with concentrations of 50, 100, 150, 200, and 250 mg/L were prepared by appropriate dilution of the stock solution. An aliquot of 40 µL of each standard solution was mixed with 3.16 mL of distilled water, 200 µL of the Folin–Ciocalteu reagent, and 600 µL of 7.5% sodium carbonate solution. The mixtures were vortexed for 15 s using a NEUATION iSwix Jr. VT vortex mixer (Accumax Lab Devices Pvt. Ltd., Gandhinagar, India) and subsequently incubated at 40 °C for 30 min using a Heratherm incubator (Thermo Fisher Scientific Inc., Waltham, MA, USA). Following incubation, the absorbance was measured at 765 nm using a UV–Vis spectrophotometer against a reagent blank. The obtained absorbance values at different gallic acid concentrations were used to construct a calibration curve, and the total phenolic content (TPC) was calculated using the corresponding regression equation obtained from Figure 1.
Figure 1.
Standard gallic acid calibration curve.
2.6. Total Phenolic Content Assay
Total phenolic content (TPC) was determined spectrophotometrically using the Folin–Ciocalteu reagent method. The reaction mixture for each extract was prepared by combining 3.16 mL of distilled water, 40 µL of extract, 200 µL of the Folin–Ciocalteu reagent, and 600 µL of 7.5% sodium carbonate solution in a test tube. The samples were vortexed for 15 s and subsequently incubated at 40 °C for 30 min. After incubation, the absorbance was measured at 765 nm using a UV–Vis spectrophotometer against a reagent blank prepared in the same manner, containing all reagents except the extract. The TPC was expressed as milligrams of gallic acid equivalents per gram of dry weight (mg GAE/g DW) and calculated using a gallic acid calibration curve.
3. Results and Discussion
3.1. UV Spectral Analysis of Standards
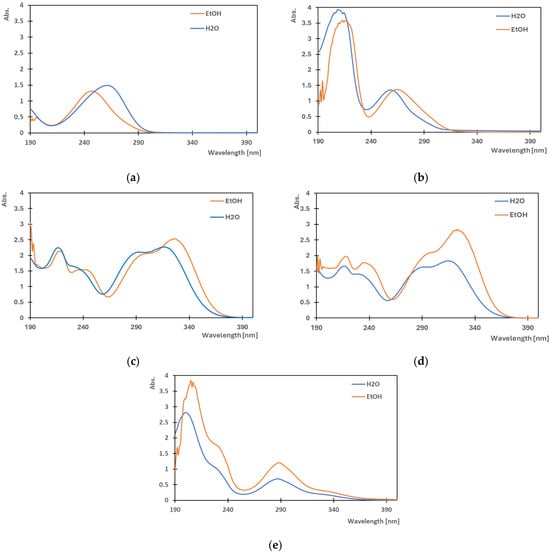
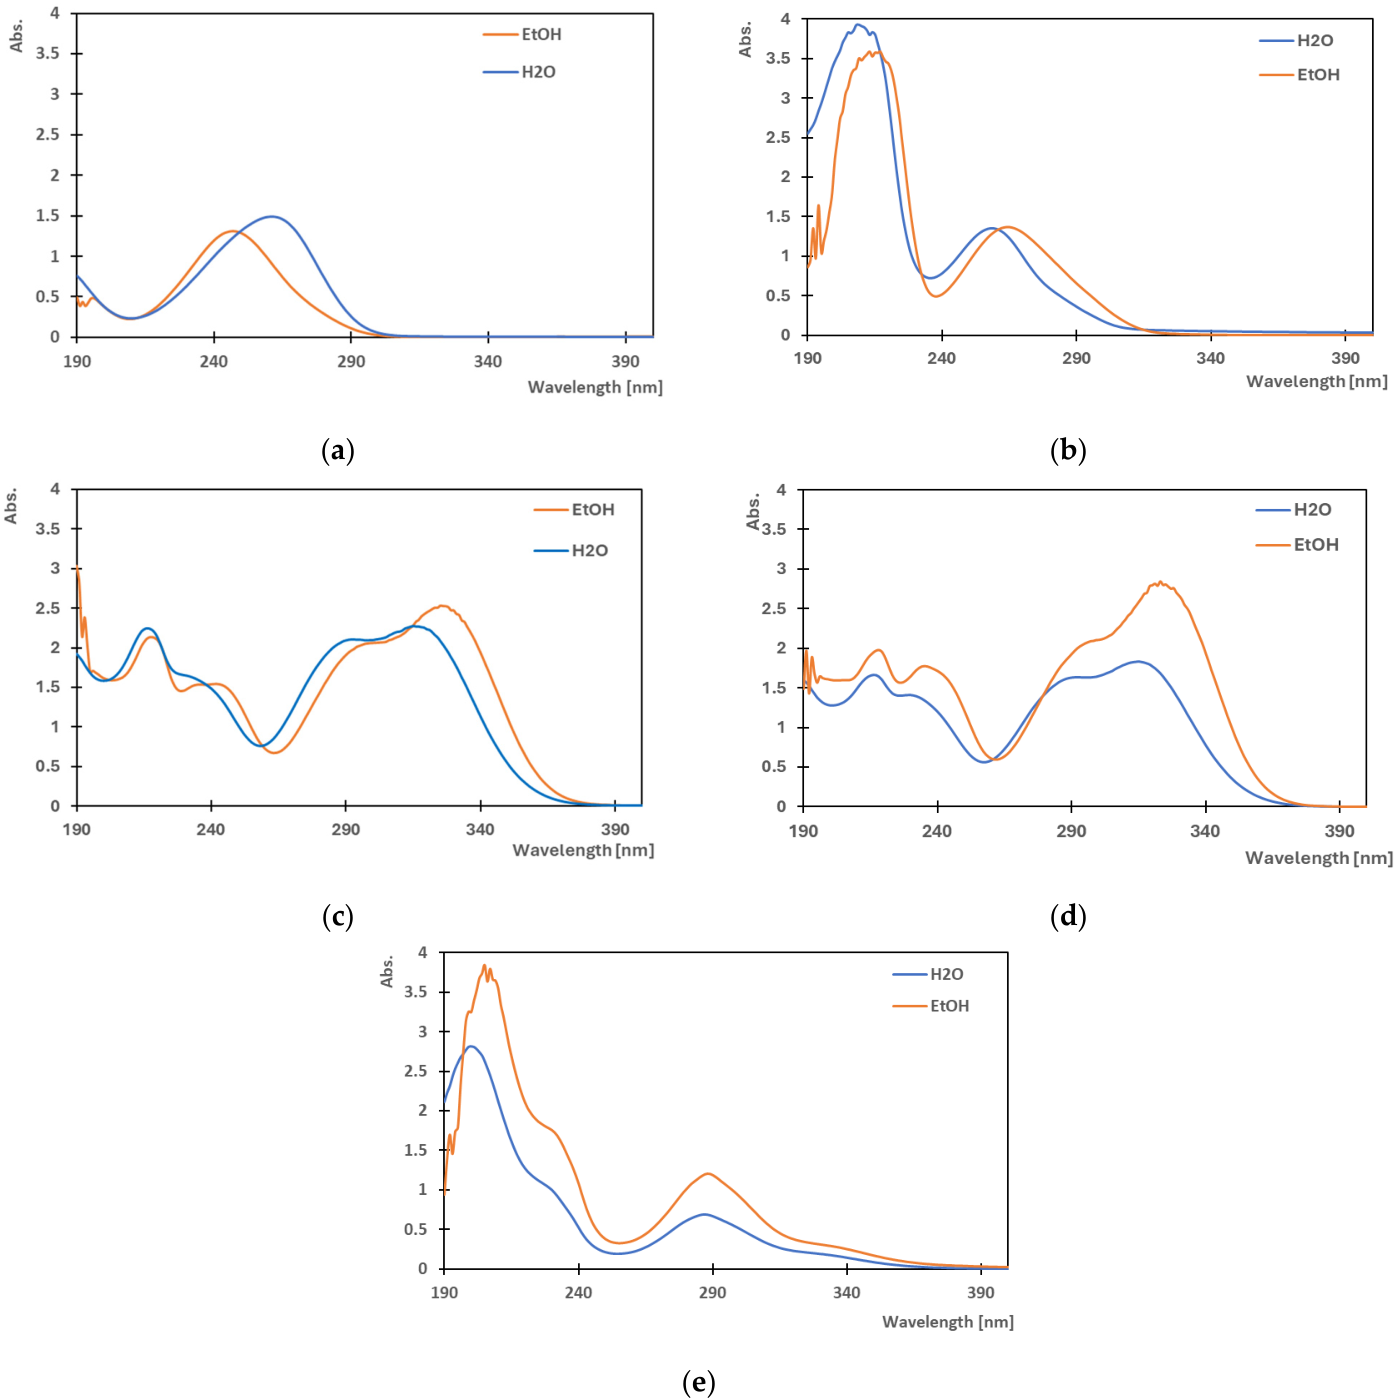
The UV spectra of standards (Figure 2) were recorded to provide reference fingerprints for the interpretation of absorption features detected in food waste extracts. The obtained spectra revealed distinct absorption patterns that could be directly related to molecular structure, degree of conjugation, and solvent environment [30].
Figure 2.
UV absorption spectra of standard solutions relevant to plant extract analysis (a) ascorbic acid, (b) gallic acid, (c) caffeic acid, (d) ferulic acid and (e) silymarin.
The UV spectra of L-ascorbic acid dissolved in ethanol and water exhibited a characteristic absorption band in the 200–300 nm region (Figure 2a). In ethanol, the absorption maximum (λmax) was observed at approximately 245 nm, whereas in water a slight bathochromic shift toward higher wavelengths (≈260 nm) was detected (Figure 2a, Table 1). Additionally, the aqueous solution showed higher absorbance intensity compared to the ethanolic solution. These differences can be attributed to solvent polarity and hydrogen-bonding interactions, as water, being more polar, enhances stabilization of the excited state of the molecule. The observed absorption band corresponds to π → π* electronic transitions within the conjugated system of ascorbic acid [31]. No significant absorption was detected above 300 nm in either solvent.
Table 1.
UV absorption maxima and corresponding UV regions of selected bioactive compounds in water and ethanol.
In contrast, phenolic acids showed more complex spectral behaviour characterized by multiple absorption bands. Gallic acid displayed two pronounced bands at approximately 220 nm and 260–280 nm (Figure 2b), typical of hydroxybenzoic acids and attributed to π–π* transitions within the aromatic ring [32]. Hydroxycinnamic acids (ferulic and caffeic) demonstrated additional absorption at longer wavelengths due to conjugation between the aromatic ring and the side-chain double bond. Caffeic acid exhibited two characteristic maxima around 290 nm and 320 nm (Figure 2c) [30,33], while ferulic acid showed a dominant maximum at 320–330 nm (Figure 2d), reflecting its higher degree of conjugation and electron-donating substituents that enhance π-electron delocalization [33]. These absorption features correspond to the typical Band II region (240–280 nm) and Band I region (300–380 nm), characteristic of phenolic compounds containing benzoyl and cinnamoyl systems, respectively [34]. For gallic, caffeic, and ferulic acids measured in both aqueous and ethanolic media, differences in λmax values and band intensities were observed. In ethanolic solutions, slight bathochromic shifts and increased absorbance were generally detected compared to aqueous solutions. These effects can be attributed to solvatochromic behaviour arising from differences in solvent polarity and hydrogen-bonding capacity, which influence the stabilization of ground and excited electronic states (Figure 2, Table 1) [35].
Silymarin exhibited a broad and intense absorption band cantered around approximately 290 nm (Figure 2e). As a mixture of structurally related flavonolignans, its spectrum represents a composite profile resulting from multiple overlapping chromophores with varying degrees of conjugation [36].
Overall, the spectral characteristics observed for individual standards confirm that UV absorption in the 240–380 nm region is strongly associated with aromatic structures and conjugated systems. Structural modifications such as hydroxylation and methylation further influence absorption maxima, where hydroxylation generally induces bathochromic shifts, particularly in hydroxycinnamic acids, while methylation may lead to hypochromic effects due to chromophore stabilization (Table 1) [37,38,39]. When interpreting these spectra, solvent effects must also be considered. Solvent–solute interactions can broaden absorption peaks, making fine structural details difficult to distinguish. Therefore, attention must be paid to the baseline cutoff of each solvent. For example, the baseline cutoff for ethanol is approximately 210 nm, whereas for water it is around 190 nm [40].
3.2. UV Spectral Analysis of Plant Extracts
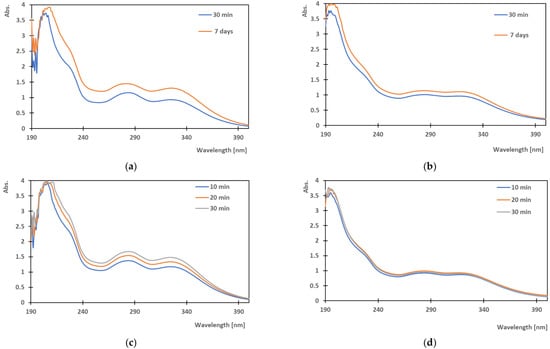
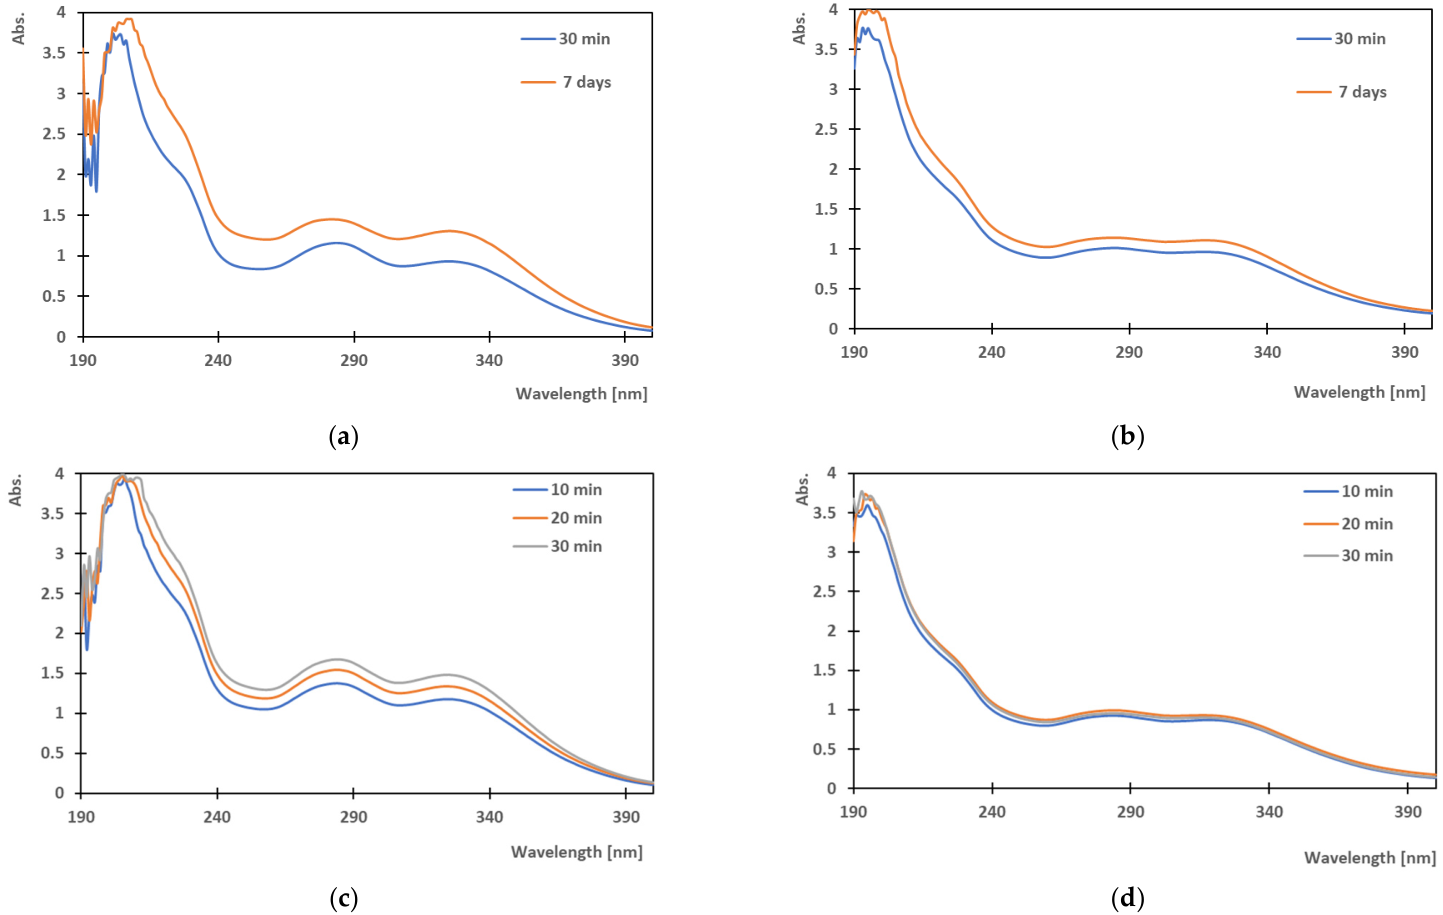
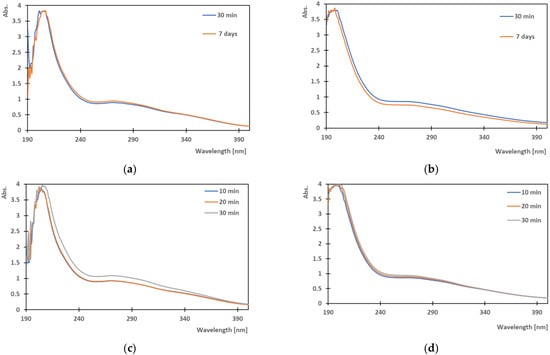
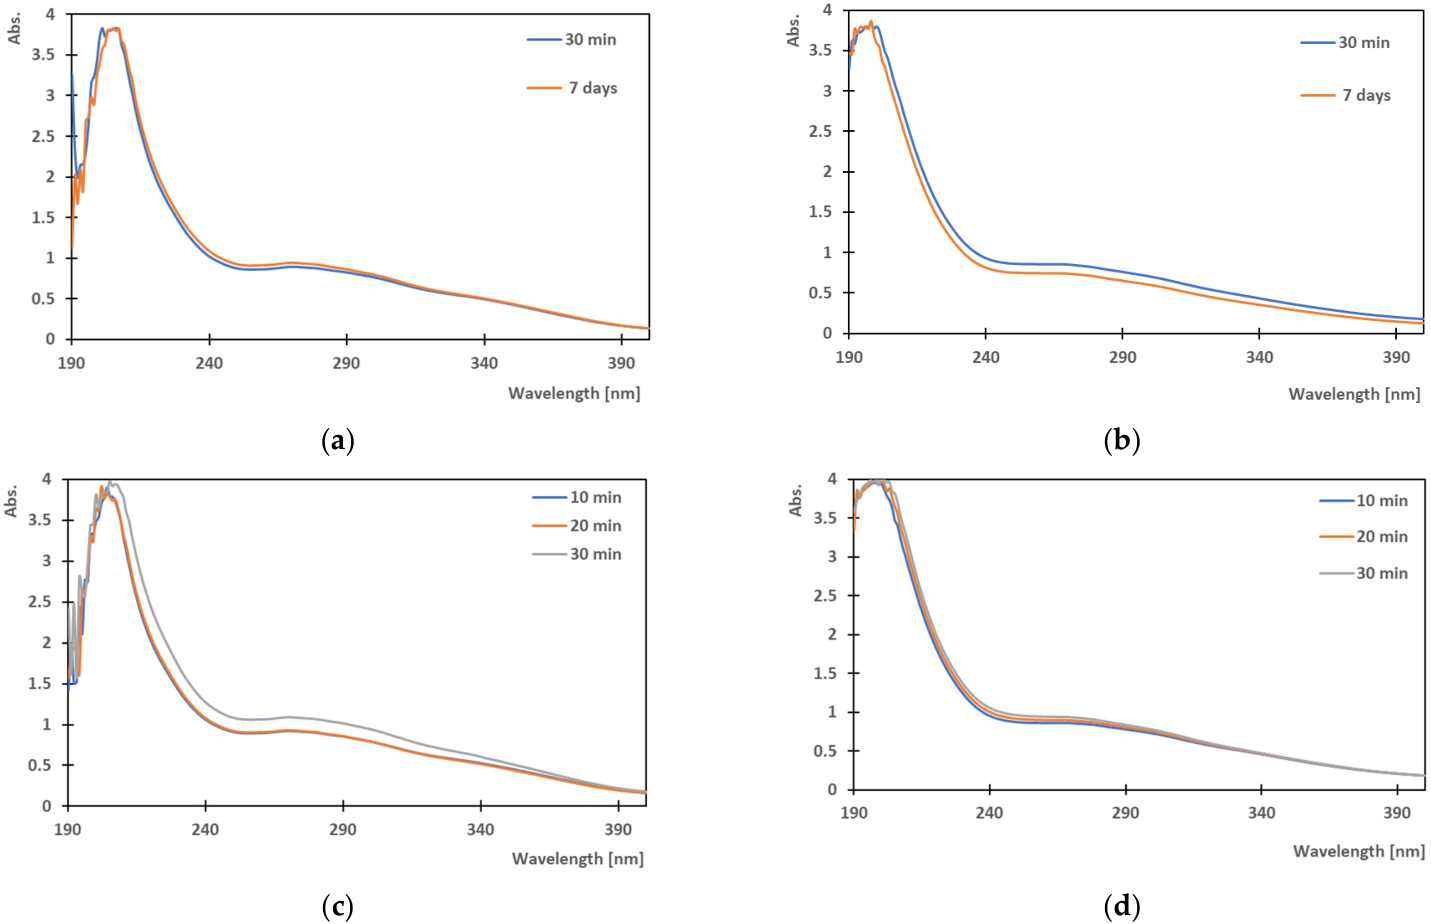
The extraction performance of different plant matrices was evaluated using conventional maceration and ultrasound-assisted extraction (UAE), with particular emphasis on the influence of solvent type and extraction time. The results are presented in Figure 3, Figure 4, Figure 5, Figure 6, Figure 7 and Figure 8. It should be noted that UV absorbance values are used here as a semi-quantitative measure and do not represent absolute extraction yields.
Figure 3.
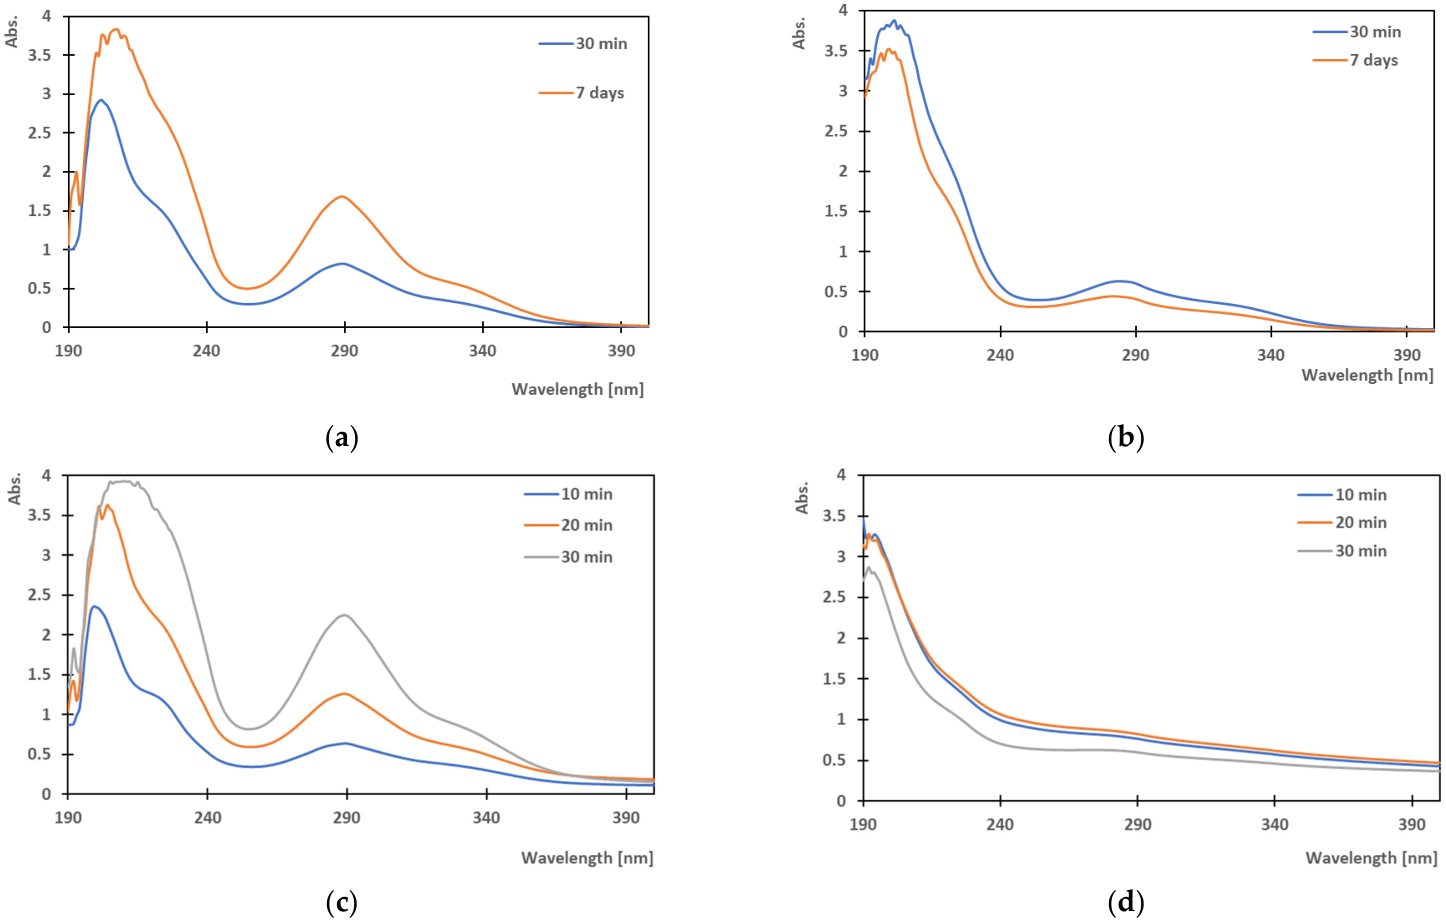
UV absorption spectra of milk thistle extracts: (a) maceration in ethanol, (b) maceration in water, (c) ultrasound-assisted extraction in ethanol, and (d) ultrasound-assisted extraction in water.
Figure 4.
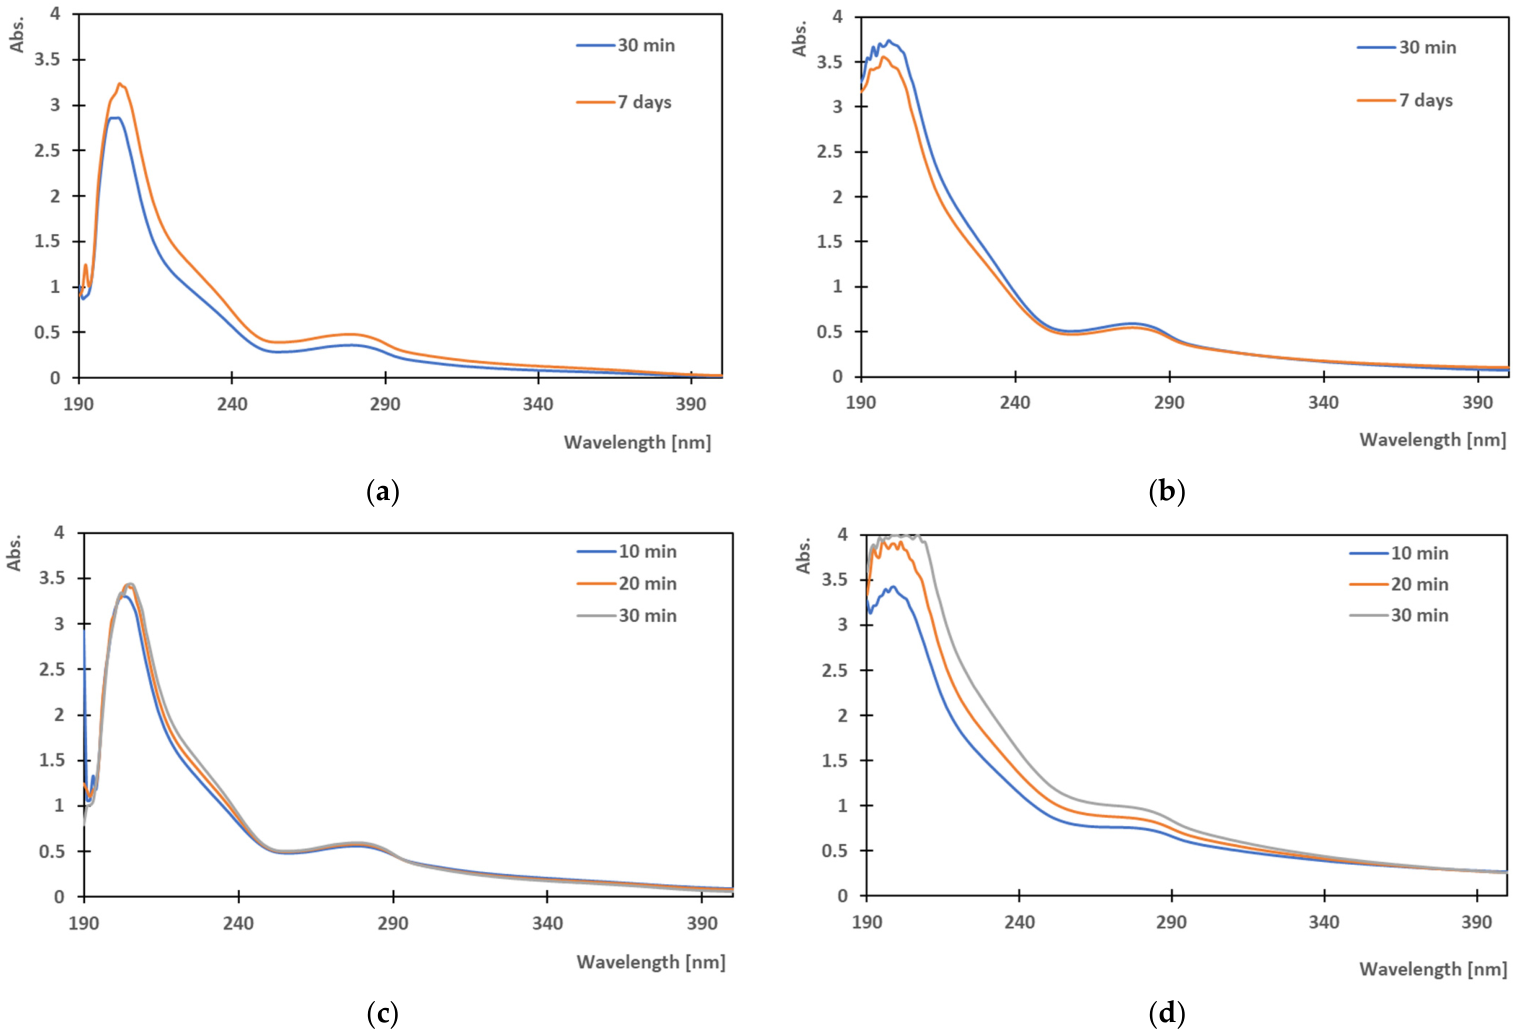
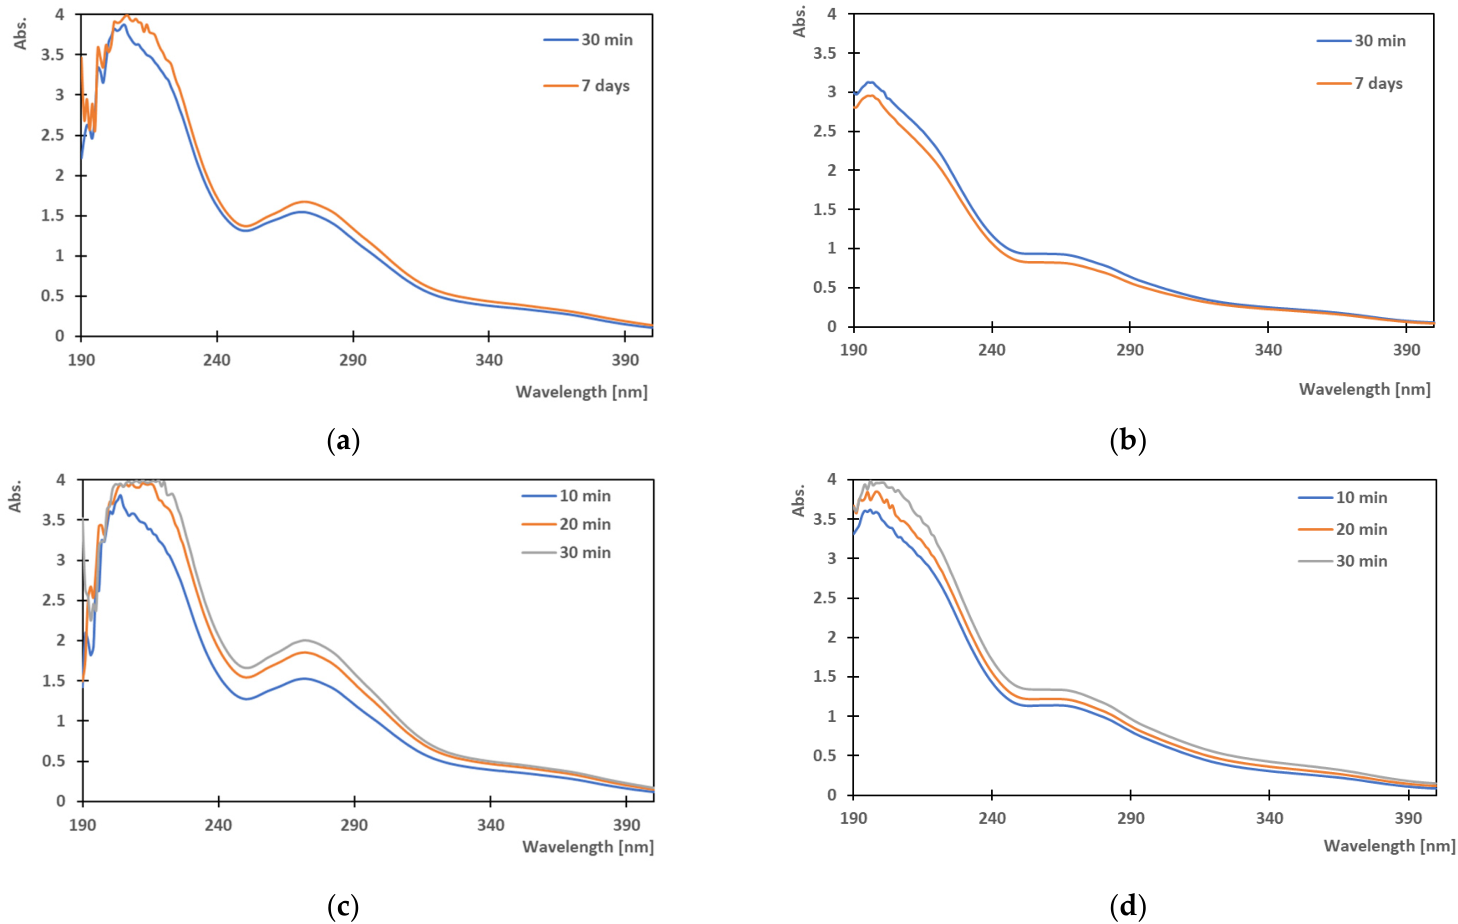
UV absorption spectra of rosehip extract: (a) maceration in ethanol, (b) maceration in water, (c) ultrasound-assisted extraction in ethanol, and (d) ultrasound-assisted extraction in water.
Figure 5.
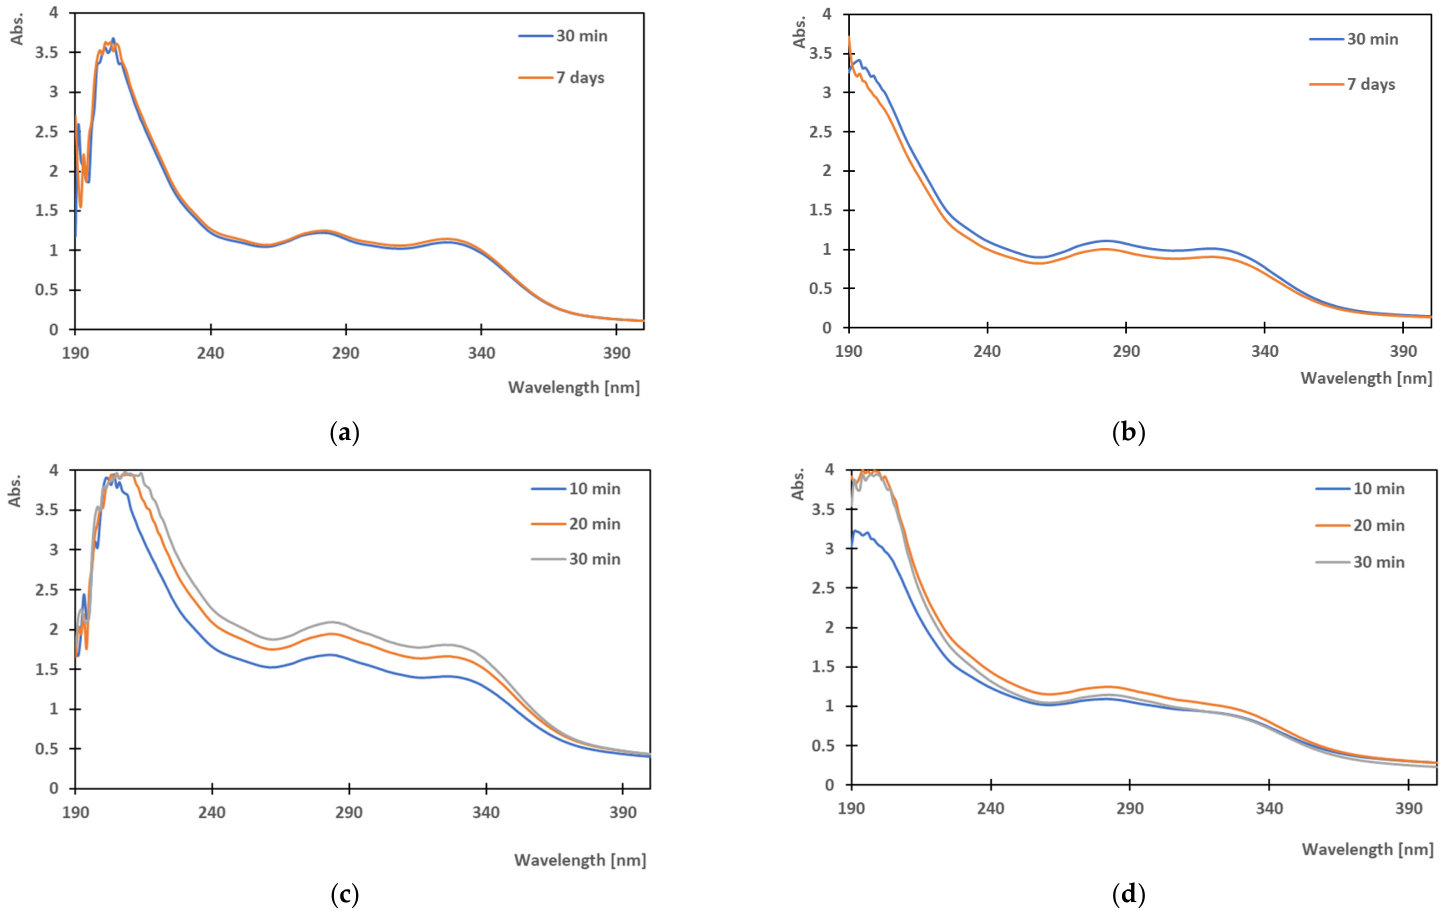
UV absorption spectra of eucalyptus leaves extract: (a) maceration in ethanol, (b) maceration in water, (c) ultrasound-assisted extraction in ethanol, and (d) ultrasound-assisted extraction in water.
Figure 6.
UV absorption spectra of coffee beans extract: (a) maceration in ethanol, (b) maceration in water, (c) ultrasound-assisted extraction in ethanol, and (d) ultrasound-assisted extraction in water.
Figure 7.
UV absorption spectra of orange peel extract: (a) maceration in ethanol, (b) maceration in water, (c) ultrasound-assisted extraction in ethanol, and (d) ultrasound-assisted extraction in water.
Figure 8.
UV absorption spectra of chilli pepper extract: (a) maceration in ethanol, (b) maceration in water, (c) ultrasound-assisted extraction in ethanol, and (d) ultrasound-assisted extraction in water.
The UV spectra of milk thistle extracts obtained by maceration in ethanol and water exhibit clear differences in both absorption intensity and spectral profile. This indicates a pronounced influence of the solvent (Figure 3a,b). The recorded spectrum of milk thistle extract shows similarities to the UV spectrum of silymarin (Figure 2e), which is reported in the literature as a characteristic compound of milk thistle. Silymarin is described as a mixture of flavonolignans, including silibinin, silychristin, and silidianin [41]. All flavonolignans exhibit a distinctive absorption peak between 280 and 290 nm [42,43]. Silymarin shows λmax values of 287 nm in water and 288 nm in ethanol (Table 1). The absorption band at 287 nm in water extract (Figure 3b) is less pronounced compared to the ethanol extract (Figure 3a) and this may indicate a lower amount of UV-absorbing compounds extracted by water under maceration conditions. The enhanced absorbance observed for the ethanolic extract suggests higher extraction efficiency of ethanol for compounds contributing to absorption in this spectral region. Such absorption may be associated with conjugated chromophore systems reported for flavonolignan-type structures. These compounds exhibit limited solubility in water. Consequently, maceration in ethanol favours the extraction of compounds contributing to the observed UV absorption, resulting in higher absorbance and more defined spectral features.
Ultrasound-assisted extraction using ethanol resulted in the highest recorded absorbance values (Figure 3c), indicating improved extraction efficiency for compounds contributing to UV absorption from milk thistle seeds. The same method with water as solvent resulted in lower absorbance values in the corresponding spectral region (Figure 2d). The peaks of the milk thistle extract are similar to those observed for silymarin, λmax = 289 nm. This observation is consistent with literature reports indicating higher solubility of silymarin-like compounds in ethanol compared to water (Figure 2e). The highest absorption of milk thistle extract is in the UV-B range. In addition, the UV spectra of milk thistle extracts obtained by ultrasound-assisted extraction show an increase in absorbance with prolonged extraction time (10, 20, and 30 min), indicating an increased amount of UV-absorbing compounds in the extracts (Figure 3c,d). The extract obtained after 30 min exhibits the highest absorbance values across the entire measured range, suggesting improved extraction efficiency with longer ultrasound treatment. The observed increase is likely due to the cavitation effect of ultrasound. This enhances mass transfer and facilitates disruption of the plant matrix. Overall, the results indicate that extending the extraction time up to 30 min positively affects the extraction of compounds contributing to the observed UV absorption from milk thistle.
The UV spectra of wild rosehip extracts prepared in ethanol and water (Figure 4a,b) show absorption maximum at 281 nm. This may be associated with overlapping absorption bands and a bathochromic shift arising from multiple UV-absorbing compounds in the extract (Table 1). Rosehip fruit extract is reported in the literature as a source of ascorbic acid and other phenolic-type compounds [44,45]. Based on comparison with the UV spectra of pure compounds (Figure 2), the observed absorption may be associated with compounds exhibiting spectral features similar to ascorbic acid (Figure 2a). The water extract (Figure 4b) exhibits consistently higher absorbance than the ethanol extract (Figure 4a), indicating higher extraction efficiency for compounds contributing to UV absorption under the applied conditions. Overall, the spectral profiles suggest that water extracts higher amounts of highly polar UV-absorbing compounds than ethanol.
According to Figure 4c,d, higher absorbance values were observed for the aqueous extract obtained by ultrasound-assisted extraction, indicating more efficient extraction of compounds contributing to UV absorption in water compared to ethanol. Ultrasound-assisted extraction showed no significant change in absorbance values for ethanolic extracts under the applied conditions (Figure 4c). Compounds exhibiting spectral features similar to ascorbic acid show absorption maxima at approximately 260 nm in water and 245 nm in ethanol. The UV spectra of rosehip extract indicate that the extract shows strongest absorbance in the UV-C region, moderate absorbance in the UV-B region, and minimal absorbance in the UV-A region, which may be associated with the presence of highly polar UV-absorbing compounds with spectral characteristics similar to ascorbic acid.
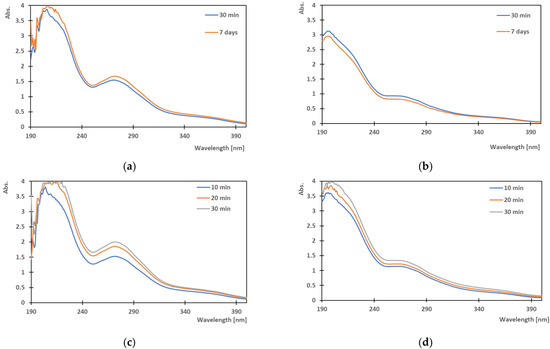
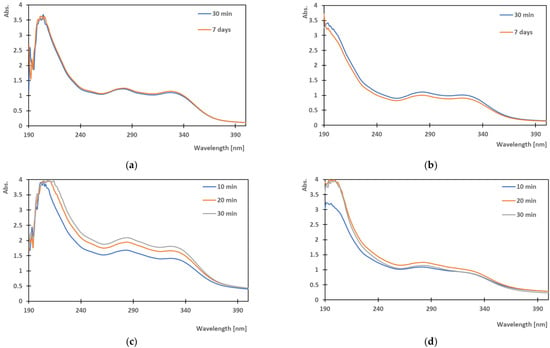
Figure 5a,b show the UV spectra of eucalyptus leaves maceration extract analysis after 30 min of extraction and after 7 days of extraction in ethanol and water as solvents. According to literature, eucalyptus leaves have been reported to contain gallic acid as a major phenolic constituent, alongside hydroxycinnamic acids, including caffeic and ferulic acid [46,47,48]. The results presented in Figure 5a,b show absorption features that are similar to those of pure gallic acid (Figure 2b). Gallic acid displays λmax values of 266 nm in water and 272 nm in ethanol (Figure 2b, Table 1), which may suggest differences in solvent-dependent spectral behaviour. This observation is consistent with higher absorbance values obtained for ethanolic extracts of eucalyptus leaves (Figure 5a). The greatest extraction was achieved using ultrasound-assisted extraction with ethanol (Figure 5c). Maceration in ethanol yielded comparable results, although slightly lower (Figure 5a). In contrast, lower extraction efficiencies were observed with maceration and ultrasound-assisted extraction when water was used as the solvent (Figure 5b,d). The λmax of the eucalyptus extract obtained by ultrasound-assisted extraction in ethanol was observed at 272 nm, which is similar to the absorption maximum reported for gallic acid in ethanol. The extract exhibits the highest absorbance in the UV-C region of the spectrum.
Caffeic and ferulic acids are reported in the literature as phenolic-type compounds present in coffee beans [49], while other compounds such as gallic acid may also be present in smaller amounts [50,51]. Analysis of coffee extract peaks (Figure 6a,b) reveals a strong overlap with absorption features similar to those of caffeic acid (λmax = 315 nm in water, 326 nm in ethanol) and ferulic acid (λmax = 315 nm in water, 323 nm in ethanol) as presented in Figure 2c,d. From Figure 6a,b, the obtained spectral profiles indicate that ultrasound-assisted extraction in ethanol results in higher absorbance values compared to other conditions (Figure 6c), with extraction efficiency increasing noticeably with prolonged extraction time, which may be related to improved solubility of compounds contributing to absorption in this spectral region. The λ max of extract is at 284 nm—observed shifts in absorption maxima, peak broadening, and variations in absorbance intensity compared to peaks of pure compounds likely reflect the complex composition of the extracts [52]. The extract exhibits the highest absorption in the UV-C and UV-B regions, with a slight elevated tail and shift towards the UV-A part of the spectrum which may be associated with overlapping contributions of multiple UV-absorbing compounds present in the extract matrix [53].
The UV spectra of orange peel extracts obtained by maceration in ethanol (Figure 7a) show higher absorbance after 7 days compared to 30 min across the entire measured range (190–400 nm). A pronounced maximum is observed around 200–220 nm. Broader bands in the 270–350 nm region become more intense after prolonged extraction. This increase indicates a greater extraction yield over time, particularly of compounds contributing to UV absorption in this spectral region. Previous studies suggest that ferulic and caffeic acids may be among the dominant phenolic acids present in orange peel extracts, with ferulic acid potentially occurring in higher concentrations. Ascorbic acid has also been reported, although generally in lower amounts compared to orange fruit pulp [54,55]. These observations are consistent with the spectral features obtained in the present study (Figure 2a,c,d). In contrast, the aqueous extracts (Figure 7b) also exhibit a main absorption maximum near 200–220 nm, but the differences between 30 min and 7 days are less pronounced than in ethanol. Although a slight increase in absorbance after 7 days is visible, especially in the 250–350 nm region, the overall enhancement is moderate. These results suggest that ethanol is more effective than water in extracting a broader range of compounds contributing to UV absorption, particularly those associated with less polar constituents.
The UV absorption spectra of orange peel extracts obtained by ultrasound-assisted extraction (UAE) at different extraction times (10, 20, and 30 min) in two solvents (ethanol and water) are presented in Figure 7c,d. In the ethanolic extracts, absorption features were observed in the range of approximately 270–330 nm. These bands may be associated with conjugated chromophore systems (e.g., Band II around 240–280 nm and Band I around 300–380 nm, depending on substitution patterns). The presence of more defined and intense absorption maxima in this region indicates efficient extraction of compounds contributing to UV absorption into ethanol (Figure 7c). Similarly, the aqueous extracts exhibited absorption in the 270–330 nm region (Figure 7d); however, the bands were broader and less intense compared to those obtained in ethanol. This may indicate lower extraction efficiency for compounds contributing to absorption in this region, as well as stronger solvent–solute interactions affecting spectral resolution. An increase in absorbance intensity was observed with increasing extraction time (10 < 20 < 30 min) in both solvents, indicating that ultrasound-assisted extraction enhances mass transfer and facilitates the release of UV-absorbing compounds into the solvent. Overall, ethanol demonstrated higher extraction efficiency for compounds contributing to UV absorption from orange peel, as evidenced by higher absorbance values and better-defined absorption bands in the 270–330 nm region. In particular, the most prominent absorption band was observed in the extract obtained by ultrasound-assisted extraction using ethanol, with a maximum around 284 nm. This may be associated with compounds exhibiting spectral features similar to ferulic and caffeic acids. This absorption maximum is similar to that observed in the coffee extract, which may indicate the presence of structurally related UV-absorbing compounds. However, definitive identification would require complementary analytical techniques. Overall, the orange peel extract shows the strongest absorption in the UV-C and UV-B regions, with a moderately elevated absorption tail extending toward the UV-A region.
Chili peppers are reported in the literature to contain capsaicinoids and other compounds exhibiting UV absorption [56,57,58]. The UV analysis of the chili pepper extract showed no well-defined sharp peaks, but rather a broad absorption band cantered around 270 nm (Figure 8a,b). This feature may be associated with compounds exhibiting spectral characteristics similar to capsaicin, which exhibits a reported absorption maximum around 280 nm [59,60]. Furthermore, the absence of well-defined characteristic peaks and the presence of a broad absorption tail indicate a complex mixture of compounds; however, the presence of specific constituents such as ferulic, caffeic, or ascorbic acids cannot be conclusively confirmed based solely on the UV spectra. It has been reported that the wavelengths at which absorbance peaks appear can be influenced by the presence of other compounds. Therefore, the peak around 270 nm may be associated with capsaicin; however, overlapping contributions from other UV-absorbing compounds cannot be excluded, while another peak at 205 nm may be associated with aromatic-type structures [61]. The chili pepper extract shows the strongest absorption in the UV-C region, with absorption gradually decreasing through the UV-B region. The same observation was noticed in the ultrasonic assisted extraction (Figure 8c,d).
A comparative evaluation across all investigated matrices indicates that spent coffee grounds and orange peel extracts exhibited the broadest UV absorption range, extending from the UV-C to the UV-A region. This suggests the presence of a wide range of UV-absorbing compounds with conjugated chromophore systems. In contrast, rosehip extracts were characterized by absorption primarily in the UV-C region, while milk thistle extracts showed characteristic absorption in the UV-B region which may be associated with compounds exhibiting spectral features similar to flavonolignan-type structures. These differences reflect matrix-specific spectral characteristics and solvent-dependent extraction selectivity.
3.3. Total Phenol Content in Extracts
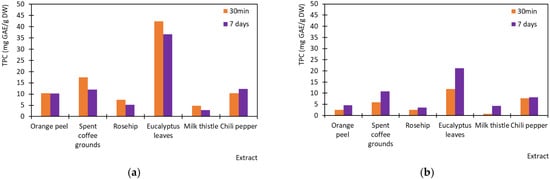
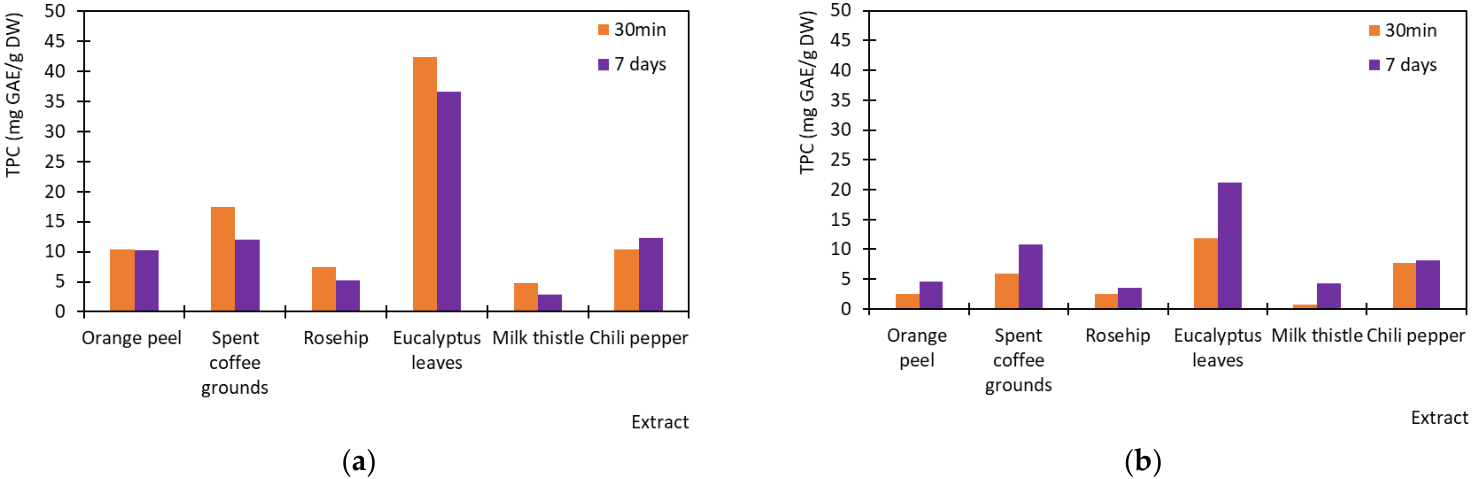
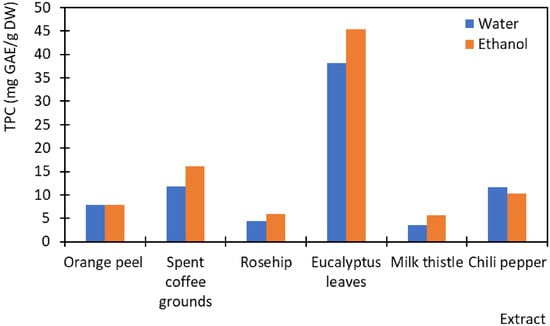
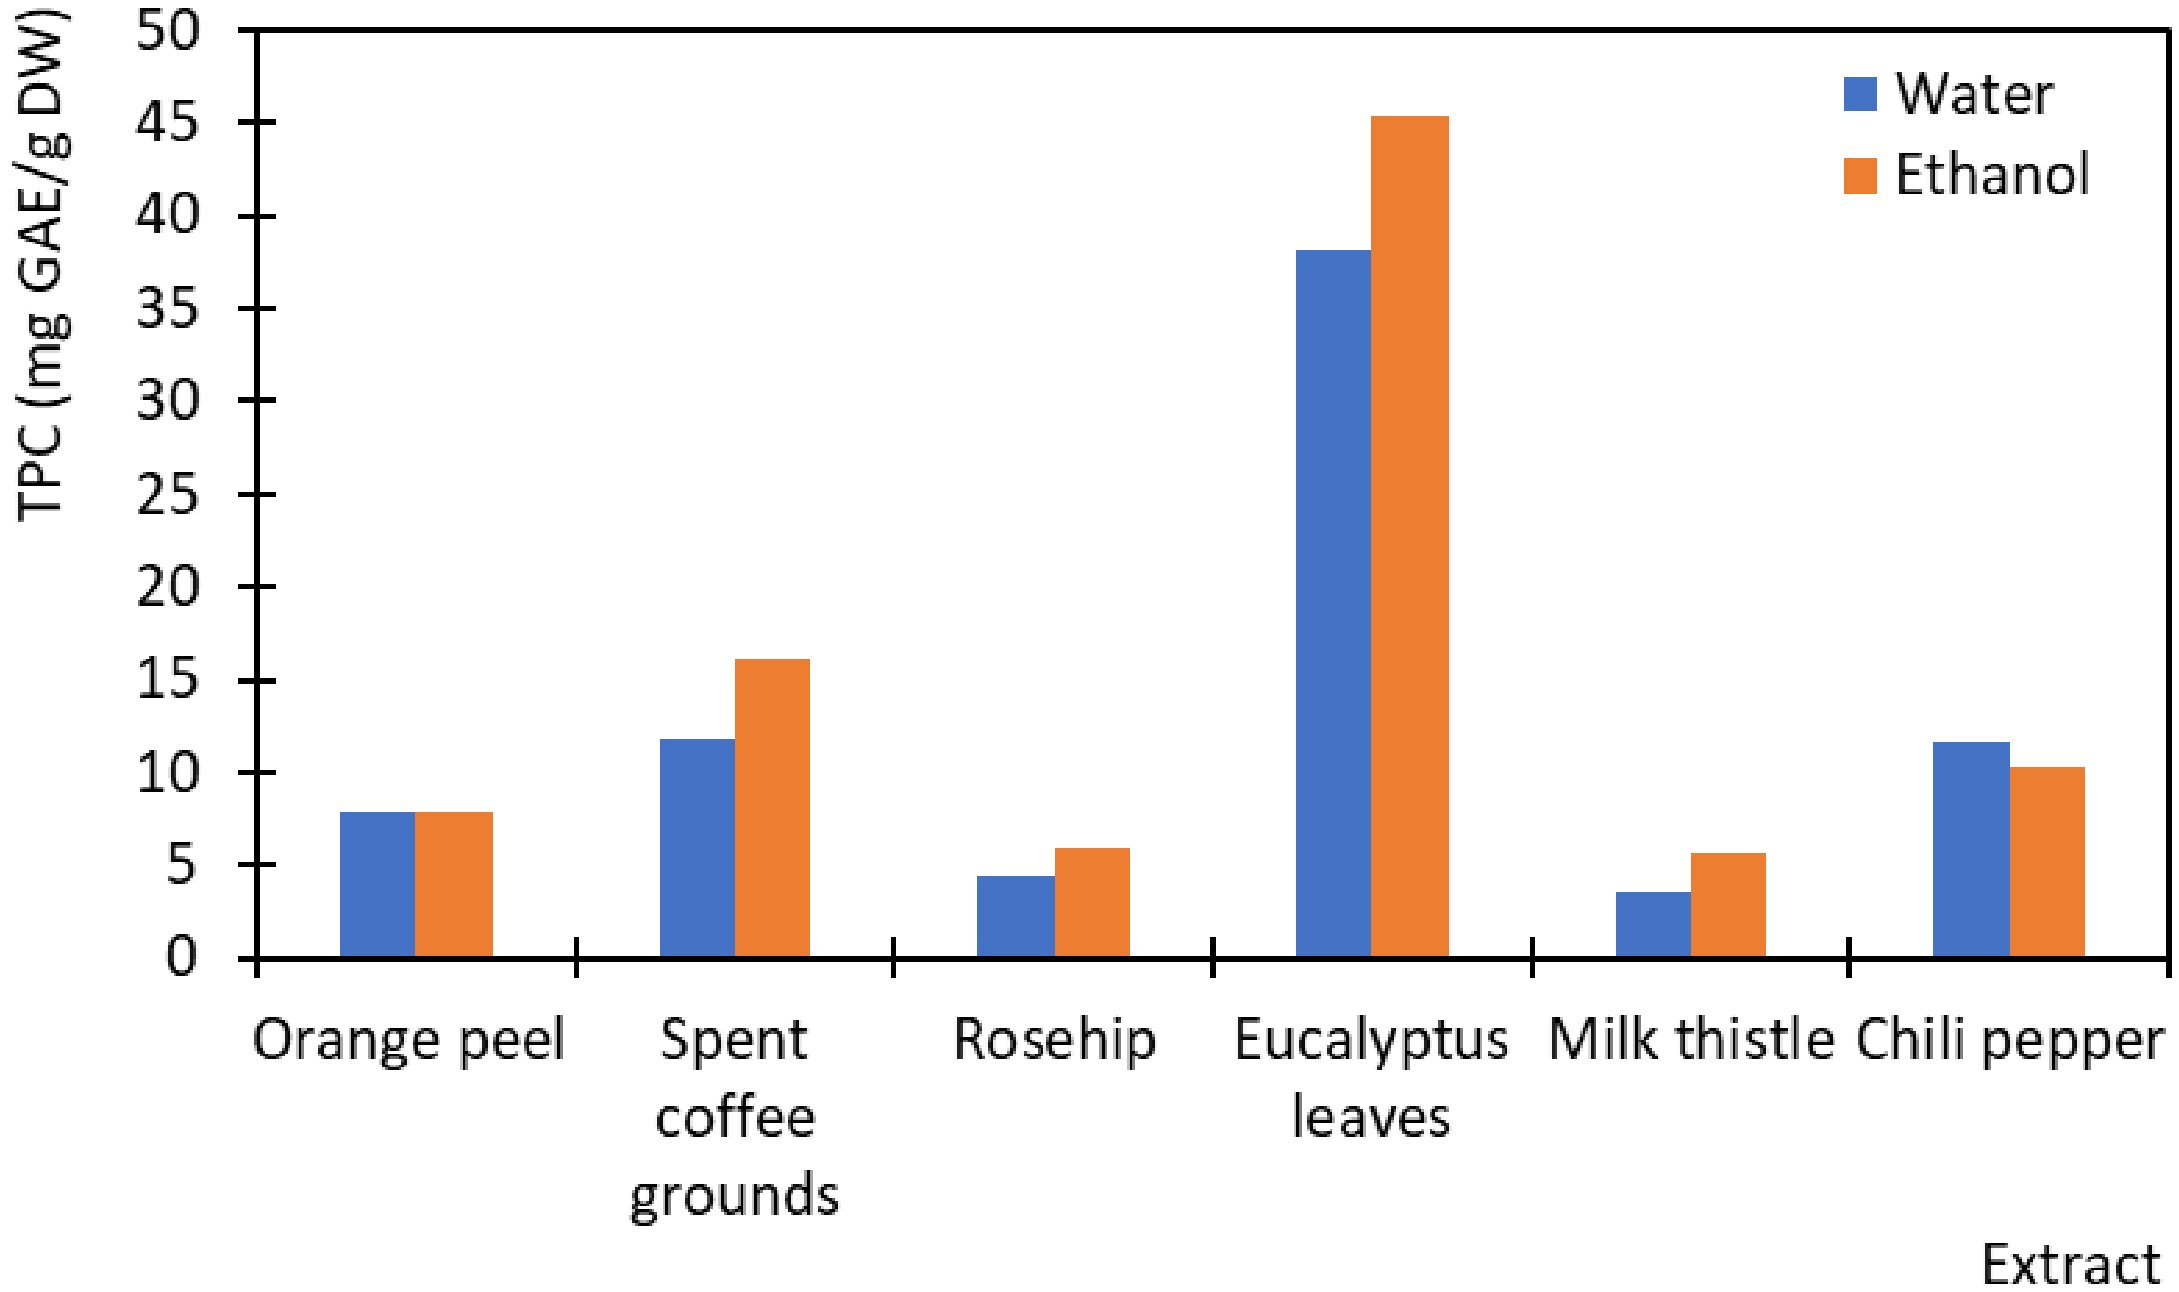
As shown in Figure 9a, the total phenolic content (TPC, mg GAE/g DW) of extracts obtained by maceration using water as the solvent, both after 30 min and after 7 days of extraction, is noticeably higher than that of extracts obtained using ethanol under the same conditions. Extraction yield is strongly influenced by several factors, including the type of solvent, its polarity, and the presence of interfering substances [62]. The higher TPC observed in water extracts is likely attributable to the presence of non-phenolic reducing compounds, such as ascorbic acid, which can interfere with the Folin–Ciocalteu reagent assay [63,64]. The Folin–Ciocalteu method measures overall reducing capacity rather than phenolics exclusively; therefore, in addition to phenolic compounds, sugars, ascorbic acid, amino compounds, and other reducing agents may also contribute to the measured signal, resulting in artificially elevated values [65,66]. A decline in TPC values after 7 days of maceration with water as the solvent was observed, which may be attributed to the decomposition and oxidation of labile compounds, particularly ascorbic acid. Although ethanol extracts obtained by maceration initially exhibit lower TPC values (Figure 9b), they show a significant increase with prolonged extraction time and with ultrasound-assisted extraction (UAE), indicating more efficient recovery of phenolic compounds. As shown in Figure 10, UAE with ethanol proved to be the most effective method for the majority of the tested samples. This can be explained by enhanced cell disruption and improved mass transfer associated with ultrasonic treatment, particularly in combination with ethanol as the solvent. Comparison of the results presented in Table 2 and Table 3 shows that eucalyptus leaf extracts obtained by UAE with ethanol exhibited the highest TPC (4535.00 mg GAE/L), as determined by the Folin–Ciocalteu method, and these values remained consistent across the tested extraction methods. This is in agreement with literature data, as eucalyptus leaves are known to be rich in gallic acid as a major phenolic constituent. Extracts from spent coffee grounds also showed high TPC values (1620.31 mg GAE/L) when UAE with ethanol was applied, which is consistent with their known content of caffeic and ferulic acids. Similarly, orange peel extracts yielded the highest TPC when UAE with ethanol was used (785.94 mg GAE/L). Notably, these extracts exhibited relatively stable TPC values over time, which may suggest a synergistic effect between ascorbic acid and ferulic acid, potentially slowing oxidation-driven degradation. Milk thistle extracts exhibited the lowest TPC values across all tested extraction methods, with a maximum of 572.19 mg GAE/L obtained using UAE with ethanol. In contrast, chili pepper samples displayed a distinct extraction pattern across all methods, differing from the other tested materials. This behavior may be attributed to the complex chemical composition of chili peppers, which includes both water-soluble reducing compounds (e.g., ascorbic acid) and less polar compounds such as capsaicinoids.
Figure 9.
Total phenolic content (mg GAE/g DW) of extracts obtained by maceration using (a) water as solvent and (b) ethanol as solvent, after 30 min and after 7 days of extraction.
Figure 10.
Total phenolic content (TPC, mg GAE/g DW) obtained by ultrasound-assisted extraction (UAE) using water and ethanol as solvents.
Table 2.
Concentration of liquid extracts obtained using water as solvent via maceration and ultrasound-assisted extraction (UAE).
Table 3.
Concentration of liquid extracts obtained using ethanol as solvent via maceration and ultrasound-assisted extraction (UAE).
4. Conclusions
This study evaluated the influence of solvent type (water vs. 70% ethanol) and extraction technique (conventional maceration vs. ultrasound-assisted extraction) on the UV spectral characteristics of extracts obtained from chemically diverse agro-industrial plant matrices, including spent coffee grounds, orange peel, milk thistle, rosehip, eucalyptus leaves, and chili pepper. The results indicate that solvent polarity plays an important role in extraction selectivity. Ethanol generally enabled higher extraction of compounds contributing to absorption in the UV-B and UV-A regions, as reflected by increased absorbance intensity and more defined spectral features. In contrast, water proved more suitable for compounds contributing to absorption in the UV-C region, as demonstrated in rosehip extracts. Observed bathochromic shifts and differences in band intensity between solvents further highlight the impact of solvatochromic effects and solvent–solute interactions on spectral interpretation. Ultrasound-assisted extraction (UAE) enhanced extraction efficiency in most investigated matrices compared to maceration. Increased absorbance values with prolonged sonication time indicate improved mass transfer and plant cell disruption due to cavitation effects. However, while ultrasound increased extraction yield, it did not substantially alter the qualitative spectral profiles, suggesting that UAE primarily intensifies compound release rather than changing extract composition. The comparative UV spectral analysis revealed characteristic absorption regions that may be associated with different types of conjugated chromophore systems present in the investigated materials. Although UV spectroscopy does not enable definitive identification in complex mixtures, the obtained spectral fingerprints are consistent with literature-reported compounds exhibiting similar absorption characteristics and allow rapid comparative assessment of extraction performance. Overall, the findings demonstrate that UV spectroscopy represents a simple, rapid, and cost-effective screening tool for evaluating extraction efficiency and estimating the presence of UV-absorbing compounds in plant-derived waste. The combination of ethanol as solvent and ultrasound-assisted extraction appears particularly effective for increasing the extraction of compounds contributing to UV absorption under the applied conditions. These results support the valorisation of agro-industrial residues and provide a basis for their potential use in value-added applications. Future research should include quantitative analyses, such as the determination of total phenolic content and antioxidant capacity, as well as incorporation studies in functional matrices, in order to further validate their applicability in sustainable material development. It should be emphasized that the presented results are comparative in nature and based on a screening approach rather than precise quantitative analysis.
Author Contributions
Conceptualization, M.V.B. and T.L.; methodology, M.V.B. and T.L.; software, T.L.; validation, M.V.B. formal analysis M.V.B. and T.L.; investigation, T.L.; resources, M.V.B., I.Š. and T.L.; data curation, I.Š.; writing—original draft preparation, M.V.B. and T.L.; writing—review and editing, I.Š.; visualization, M.V.B.; supervision, M.V.B.; project administration, M.V.B. funding acquisition, M.V.B., I.Š. and T.L. All authors have read and agreed to the published version of the manuscript.
Funding
This research was funded by Croatian Science Foundation, grant number IP-2022-10-3864 Improvement of packaging products by application of eco-friendly materials and inclusive design.
Institutional Review Board Statement
Not applicable.
Data Availability Statement
The original contributions presented in this study are included in the article. Further inquiries can be directed to the corresponding author.
Conflicts of Interest
The authors declare no conflicts of interest.
References
- Bhadange, Y.A.; Carpenter, J.; Saharan, V.K. A Comprehensive Review on Advanced Extraction Techniques for Retrieving Bioactive Components from Natural Sources. ACS Omega 2024, 9, 31274–31297. [Google Scholar] [CrossRef] [Scilit] [PubMed]
- Patil, B.S.; Jayaprakasha, G.K.; Chidambara Murthy, K.N.; Vikram, A. Bioactive compounds: Historical perspectives, opportunities and challenges. J. Agric. Food Chem. 2009, 57, 8142–8160. [Google Scholar] [CrossRef] [Scilit] [PubMed]
- Guaadaoui, A.; Benaicha, S.; Elmajdoub, N.; Bellaoui, M.; Hamal, A. What is a bioactive compound? A combined definition for a preliminary consensus. Int. J. Nutr. Food Sci. 2014, 3, 17–179. [Google Scholar] [CrossRef] [Scilit]
- Bisht, S.; Jain, P.; Gaikwad, K.K. Printable edible ink based on Hibiscus for food safety and sustainable packaging, and printing. Color. Technol. 2025; Early View. [CrossRef] [Scilit]
- Di Maio, F.; Rem, P.C. A Robust Indicator for Promoting Circular Economy through Recycling. J. Environ. Prot. 2015, 6, 1095–1104. [Google Scholar] [CrossRef]
- Foschi, E.; Bonoli, A. The commitment of packaging industry in the framework of the european strategy for plastics in a circular economy. Adm. Sci. 2019, 9, 18. [Google Scholar] [CrossRef] [Scilit]
- Shirahigue, L.D.; Ceccato-Antonini, S.R. Agro-industrial wastes as sources of bioactive compounds for food and fermentation industries. Cienc. Rural. 2020, 50, e20190857. [Google Scholar] [CrossRef] [Scilit]
- Singh, R.; Das, R.; Sangwan, S.; Rohatgi, B.; Khanam, R.; Peera, S.K.P.G.; Das, S.; Lyngdoh, Y.A.; Langyan, S.; Shukla, A.; et al. Utilisation of agro-industrial waste for sustainable green production: A review. Environ. Sustain. 2021, 4, 619–636. [Google Scholar] [CrossRef] [Scilit]
- Wijngaard, H.; Hossain, M.B.; Rai, D.K.; Brunton, N. Techniques to extract bioactive compounds from food by-products of plant origin. Food Res. Int. 2012, 46, 505–513. [Google Scholar] [CrossRef] [Scilit]
- Vodnar, D.C.; Călinoiu, L.F.; Dulf, F.V.; Ştefănescu, B.E.; Crişan, G.; Socaciu, C. Identification of the bioactive compounds and antioxidant, antimutagenic and antimicrobial activities of thermally processed agro-industrial waste. Food Chem. 2017, 231, 131–140. [Google Scholar] [CrossRef] [Scilit]
- Bitwell, C.; Indra, S.S.; Luke, C.; Kakoma, M.K. A review of modern and conventional extraction techniques and their applications for extracting phytochemicals from plants. Sci. Afr. 2023, 19, e01585. [Google Scholar] [CrossRef] [Scilit]
- Chemat, F.; Vian, M.A.; Cravotto, G. Green extraction of natural products: Concept and principles. Int. J. Mol. Sci. 2012, 13, 8615–8627. [Google Scholar] [CrossRef] [Scilit] [PubMed]
- Azmir, J.; Zaidul, I.S.M.; Rahman, M.M.; Sharif, K.M.; Mohamed, A.; Sahena, F.; Jahurul, M.H.A.; Ghafoor, K.; Norulaini, N.A.N.; Omar, A.K.M. Techniques for extraction of bioactive compounds from plant materials: A review. J. Food Eng. 2013, 117, 426–436. [Google Scholar] [CrossRef] [Scilit]
- Mussatto, S.I.; Ballesteros, L.F.; Martins, S.; Teixeira, J.A. Extraction of antioxidant phenolic compounds from spent coffee grounds. Sep. Purif. Technol. 2011, 83, 173–179. [Google Scholar] [CrossRef] [Scilit]
- Ortiz-Sanchez, M.; Cardona Alzate, C.A.; Solarte-Toro, J.C. Orange Peel Waste as a Source of Bioactive Compounds and Valuable Products: Insights Based on Chemical Composition and Biorefining. Biomass 2024, 4, 107–131. [Google Scholar] [CrossRef] [Scilit]
- Hegazy, A.; Ibrahium, M. Antioxidant Activities of Orange Peel Extracts. World Appl. Sci. J. 2012, 18, 684–688. [Google Scholar]
- Hervert-Hernández, D.; Sáyago-Ayerdi, S.G.; Goñi, I. Bioactive compounds of four hot pepper varieties (Capsicum annuum L.), antioxidant capacity, and intestinal bioaccessibility. J. Agric. Food Chem. 2010, 58, 3399–3406. [Google Scholar] [CrossRef] [Scilit]
- Rosa, A.; Deiana, M.; Casu, V.; Paccagnini, S.; Appendino, G.; Ballero, M.; Dessí, M.A. Antioxidant activity of capsinoids. J. Agric. Food Chem. 2002, 50, 7396–7401. [Google Scholar] [CrossRef] [Scilit]
- Škrovánková, S.; Mlček, J.; Orsavová, J.; Juríková, T.; Dřímalová, P. Polyphenols content and antioxidant activity of paprika and pepper spices. Potravin. Slovak J. Food Sci. 2017, 11, 52–57. [Google Scholar] [CrossRef] [Scilit]
- Elhassaneen, Y.A.; Nasef, A.Z.; Arafa, R.S.; Bayomi, A.I. Bioactive compounds and antioxidant activities of milk thistle (Silybum marianum) extract and their potential roles in the prevention of diet-induced obesity complications. Am. J. Food Sci. Technol. 2023, 11, 70–85. [Google Scholar] [CrossRef] [Scilit]
- Bijak, M. Silybin, a Major Bioactive Component of Milk Thistle (Silybum marianum L. Gaernt.)—Chemistry, Bioavailability, and Metabolism. Molecules 2017, 22, 1942. [Google Scholar] [CrossRef] [Scilit]
- Viktorova, J.; Stranska-Zachariasova, M.; Fenclova, M.; Vitek, L.; Hajslova, J.; Kren, V.; Ruml, T. Complex evaluation of antioxidant capacity of milk thistle dietary supplements. Antioxidants 2019, 8, 317. [Google Scholar] [CrossRef] [Scilit] [PubMed]
- Gullón, B.; Gullón, P.; Lú-Chau, T.A.; Moreira, M.T.; Lema, J.M.; Eibes, G. Optimization of solvent extraction of antioxidants from Eucalyptus globulus leaves by response surface methodology: Characterization and assessment of their bioactive properties. Ind. Crops Prod. 2017, 108, 649–659. [Google Scholar] [CrossRef] [Scilit]
- González-Burgos, E.; Liaudanskas, M.; Viškelis, J.; Žvikas, V.; Janulis, V.; Gómez-Serranillos, M.P. Antioxidant activity, neuroprotective properties and bioactive constituents analysis of varying polarity extracts from Eucalyptus globulus leaves. J. Food Drug Anal. 2018, 26, 1293–1302. [Google Scholar] [CrossRef] [Scilit] [PubMed]
- Alberts, A.; Moldoveanu, E.T.; Niculescu, A.G.; Grumezescu, A.M. Vitamin C: A Comprehensive Review of Its Role in Health, Disease Prevention, and Therapeutic Potential. Molecules 2025, 30, 748. [Google Scholar] [CrossRef] [Scilit]
- Srinivas, K.; King, J.W.; Howard, L.R.; Monrad, J.K. Solubility of gallic acid, catechin, and protocatechuic acid in subcritical water from (298.75 to 415.85) K. J. Chem. Eng. Data 2010, 55, 3101–3108. [Google Scholar] [CrossRef] [Scilit]
- Mota, F.L.; Queimada, A.J.; Pinho, S.P.; Macedo, E.A. Aqueous solubility of some natural phenolic compounds. Ind. Eng. Chem. Res. 2008, 47, 5182–5189. [Google Scholar] [CrossRef] [Scilit]
- Shakeel, F.; Anwer, M.K.; Shazly, G.A.; Jamil, S. Measurement and correlation of solubility of bioactive compound silymarin in five different green solvents at 298.15 K to 333.15 K. J. Mol. Liq. 2014, 195, 255–258. [Google Scholar] [CrossRef] [Scilit]
- Di Costanzo, A.; Angelico, R. Formulation strategies for enhancing the bioavailability of silymarin: The state of the art. Molecules 2019, 24, 2155. [Google Scholar] [CrossRef] [Scilit]
- Rice-Evans, C.A.; Miller, N.J.; Paganga, G. Structure-antioxidant activity relationships of flavonoids and phenolic acids. Free Radic. Biol. Med. 1996, 20, 933–956. [Google Scholar] [CrossRef] [Scilit]
- Bendich, A.; Machlin, L.J.; Scandurra, O.; Burton, G.W.; Wayner, D.D.M. The antioxidant role of vitamin C. Adv. Free. Radic. Biol. Med. 1986, 2, 419–444. [Google Scholar] [CrossRef] [Scilit]
- Lama-Muñoz, A.; del Mar Contreras, M. Extraction Systems and Analytical Techniques for Food Phenolic Compounds: A Review. Foods 2022, 11, 3671. [Google Scholar] [CrossRef] [Scilit]
- Sroka, Z.; Cisowski, W. Hydrogen peroxide scavenging, antioxidant and anti-radical activity of some phenolic acids. Food Chem. Toxicol. 2003, 41, 753–758. [Google Scholar] [CrossRef] [Scilit]
- Luis Aleixandre-Tudo, J.; du Toit, W. The Role of UV-Visible Spectroscopy for Phenolic Compounds Quantification in Winemaking. In Frontiers and New Trends in the Science of Fermented Food and Beverages; IntechOpen: London, UK, 2019. [Google Scholar]
- Homocianu, M. Exploring solvatochromism: A comprehensive analysis of research data. Microchem. J. 2024, 198, 110166. [Google Scholar] [CrossRef] [Scilit]
- Walash, M.I.; Ibrahim, F.; El Abass, S.A. Derivative spectrophotometric and micellar high performance liquid chromatographic methods for simultaneous determination of silymarin and dimethyl-4,4′-dimethoxy-5,6,5′,6′-dimethylene dioxybiphenyl-2,2′-dicarboxylate (DDB) in raw materials and capsules. Anal. Methods 2014, 6, 1158–1166. [Google Scholar] [CrossRef] [Scilit]
- Anouar, E.H.; Gierschner, J.; Duroux, J.L.; Trouillas, P. UV/Visible spectra of natural polyphenols: A time-dependent density functional theory study. Food Chem. 2012, 131, 79–89. [Google Scholar] [CrossRef] [Scilit]
- Kaeswurm, J.A.H.; Scharinger, A.; Teipel, J.; Buchweitz, M. Absorption coefficients of phenolic structures in different solvents routinely used for experiments. Molecules 2021, 26, 4656. [Google Scholar] [CrossRef] [Scilit]
- Lv, X.; Mu, J.; Wang, W.; Liu, Y.; Lu, X.; Sun, J.; Wang, J.; Ma, Q. Effects and mechanism of natural phenolic acids/fatty acids on copigmentation of purple sweet potato anthocyanins. Curr. Res. Food Sci. 2022, 5, 1243–1250. [Google Scholar] [CrossRef] [Scilit]
- De Caro, C.; Claudia, H. UV/Vis Spectrophotometry—Fundamentals and Applications; Mettler-Toledo: Greifensee, Switzerland, 2025. [Google Scholar]
- Bhattacharya, S. Phytotherapeutic properties of milk thistle seeds: An overview. J. Adv. Pharm. Educ. Res. 2011, 1, 69–79. [Google Scholar] [CrossRef] [Scilit]
- Csupor, D.; Csorba, A.; Hohmann, J. Recent advances in the analysis of flavonolignans of Silybum marianum. J. Pharm. Biomed. Anal. 2016, 130, 301–317. [Google Scholar] [CrossRef] [Scilit]
- Meghreji, M.A.; Patel, C.N.; Dave, J.B.; Badmanaban, R.; Pate, J.A. Validated method for Silymarin by Spectrophotometry in Bulk drug and Pharmaceutical formulations. J. Chem. Pharm. Res 2010, 2, 396–400. [Google Scholar]
- Negrean, O.R.; Farcas, A.C.; Nemes, S.A.; Cic, D.E.; Socaci, S.A. Recent advances and insights into the bioactive properties and applications of Rosa canina L. and its by-products. Heliyon 2024, 10, e30816. [Google Scholar] [CrossRef] [Scilit] [PubMed]
- Taneva, I.; Petkova, N.; Dimov, I.; Ivanov, I.; Denev, P. Characterization of Rose Hip (Rosa canina L.) Fruits Extracts and Evaluation of Their In Vitro Antioxidant Activity. J. Pharmacogn. Phytochem. 2016, 5, 35–38. [Google Scholar]
- Park, J.Y.; Kim, J.Y.; Son, Y.G.; Kang, S.D.; Lee, S.W.; Kim, K.D.; Kim, J.Y. Characterization of Chemical Composition and Antioxidant Activity of Eucalyptus globulus Leaves under Different Extraction Conditions. Appl. Sci. 2023, 13, 9984. [Google Scholar] [CrossRef] [Scilit]
- Hingston, F.J. Activity of polyphenolic constituents of leaves of Eucalyptus and other species in complexing and dissolving iron oxide. Aust. J. Soil Res. 1963, 1, 63–73. [Google Scholar] [CrossRef] [Scilit]
- Chapuis-Lardy, L.; Contour-Ansel, D.; Bernhard-Reversat, F. High-performance liquid chromatography of water-soluble phenolics in leaf litter of three Eucalyptus hybrids (Congo). Plant Sci. 2002, 163, 217–222. [Google Scholar] [CrossRef] [Scilit]
- da Silva, W.B.; Rocha, L.M.; Soares, M.S.; Good God, P.I.V.; da Silva, S.A.; Moreira, D.B.; Silva, G.H. Validation of Methodology for Quantifying Caffeic and Ferulic Acids in Raw and Roasted Coffee Extracts by High-Performance Liquid Chromatography. J 2025, 8, 8. [Google Scholar] [CrossRef] [Scilit]
- Andrade, C.; Perestrelo, R.; Câmara, J.S. Bioactive Compounds and Antioxidant Activity from Spent Coffee Grounds as a Powerful Approach for Its Valorization. Molecules 2022, 27, 7504. [Google Scholar] [CrossRef] [Scilit]
- Nakkong, K.; Tangpromphan, P.; Jaree, A. The Design of Three-Zone Simulated Moving Bed Process for the Separation of Chlorogenic and Gallic Acids Extracted from Spent Coffee Grounds. Waste Biomass Valor. 2021, 12, 2389–2405. [Google Scholar] [CrossRef] [Scilit]
- Casoni, D.; Cobzac, S.C.A.; Simion, I.M. Feasibility of UV–Vis spectroscopy combined with pattern recognition techniques to authenticate the medicinal plant material from different geographical areas. J. Anal. Sci. Technol. 2024, 15, 17. [Google Scholar] [CrossRef] [Scilit]
- Misto; Indarti, S.; Safitri, Y.; Mutmainnah; Mulyono, T.; Alawiyah, D.D. Identification of Chlorogenic Acid, Caffeine, Melanoidin, Sucrose, and Protein Content of Local Indonesia Arabica Coffee Base on Its Cupping and Variety Variation. BIO Web Conf. 2024, 101, 01003. [Google Scholar] [CrossRef] [Scilit]
- Liew, S.S.; Ho, W.Y.; Yeap, S.K.; Bin Sharifudin, S.A. Phytochemical composition and in vitro antioxidant activities of Citrus sinensis peel extracts. PeerJ 2018, 6, e5331. [Google Scholar] [CrossRef] [Scilit] [PubMed]
- Sabry, B.A.; Badr, A.N.; Mohammed, D.M.; Desoukey, M.A.; Farouk, A. Validating the protective role of orange and tangerine peel extracts foramending food safety against microorganisms’ contamination using molecular docking. Heliyon 2024, 10, e27737. [Google Scholar] [CrossRef] [Scilit] [PubMed]
- Wu, S.; Feng, X.; Ma, H.; Zhao, Y.; Sun, Z.; Zhang, M.; Ke, Z.; Qiu, J.; Qian, Y.; Liu, G.; et al. Simultaneous Quantification of Phenolic Compounds and Capsaicinoids in Chili Peppers Using Ultra-High Performance Liquid Chromatography-Tandem Mass Spectrometry. Food Saf. Health, 2025; Early View. [CrossRef] [Scilit]
- Kumar Shaha, R.; Rahman, S.; Asrul, A.; Kelantan, M.; Campus, J. Bioactive compounds in chilli peppers (Capsicum annuum L.) at various ripening (green, yellow and red) stages. Sch. Res. Libr. Ann. Biol. Res. 2013, 4, 27–34. [Google Scholar]
- Jayan, L.S.; Rajan, S.S.; Mujahid, S.M.; Sharma, S.; Wani, K.M. Capsaicin: An in-depth review of its chemical properties, health benefits, and challenges in food applications. Food Prod. Process. Nutr. 2025, 7, 47. [Google Scholar] [CrossRef] [Scilit]
- Acharya, A.; Bhatta, N. Validation of UV spectrophotometric method for the analysis of capsaicin in ethanol. Int. J. Pharm. Anal. Res. 2022, 11, 115–120. Available online: https://www.ijpar.com/index.php/ijpar/article/view/19 (accessed on 22 February 2026).
- Koleva Gudeva, L.; Mitrev, S.; Maksimova, V.; Spasov, D. Content of capsaicin extracted from hot pepper (Capsicum annuum ssp. microcarpum L.) and its use as an ecopesticide. Chem. Ind. 2013, 67, 671–675. [Google Scholar] [CrossRef] [Scilit]
- Kumar Panda, S.; Suresh, M. Estimation of Pungency of Green Chillies using UV Spectrophotometer. Int. J. Adv. Res. Electr. Electron. Instrum. Eng. 2018, 6, 65–72. [Google Scholar] [CrossRef]
- Akomeng, N.; Adusei, S. Organic solvent extraction and spectrophotometric quantification of total phenolic content of soil. Heliyon 2021, 7, e08388. [Google Scholar] [CrossRef] [Scilit]
- Lester, G.E.; Lewers, K.S.; Medina, M.B.; Saftner, R.A. Comparative analysis of strawberry total phenolics via Fast Blue BB vs. Folin-Ciocalteu: Assay interference by ascorbic acid. J. Food Compos. Anal. 2012, 27, 102–107. [Google Scholar] [CrossRef] [Scilit]
- Bastola, K.P.; Guragain, Y.N.; Bhadriraju, V.; Vadlani, P.V. Evaluation of Standards and Interfering Compounds in the Determination of Phenolics by Folin-Ciocalteu Assay Method for Effective Bioprocessing of Biomass. Am. J. Analyt. Chem. 2017, 08, 416–431. [Google Scholar] [CrossRef]
- Dominguez-López, I.; Pérez, M.; Lamuela-Raventós, R.M. Total (poly)phenol analysis by the Folin-Ciocalteu assay as an anti-inflammatory biomarker in biological samples. Crit. Rev. Food Sci. Nutr. 2024, 64, 10048–10054. [Google Scholar] [CrossRef] [Scilit]
- Kim, S.Y. Fluctuations in phenolic content and antioxidant capacity of green vegetable juices during refrigerated storage. Prev. Nutr. Food Sci. 2015, 20, 169–175. [Google Scholar] [CrossRef] [Scilit]

Disclaimer/Publisher’s Note: The statements, opinions and data contained in all publications are solely those of the individual author(s) and contributor(s) and not of MDPI and/or the editor(s). MDPI and/or the editor(s) disclaim responsibility for any injury to people or property resulting from any ideas, methods, instructions or products referred to in the content. |
© 2026 by the authors. Licensee MDPI, Basel, Switzerland. This article is an open access article distributed under the terms and conditions of the Creative Commons Attribution (CC BY) license.