


Abstract
Accurate prediction of radiation shielding performance is essential for selecting materials for future spacecraft and long-duration exploration missions. Monte Carlo radiation transport codes are widely used to simulate particle interactions, energy deposition, attenuation, and secondary radiation production; however, their reliability depends on validation against measurements obtained under controlled irradiation conditions. This study experimentally benchmarks FLUKA predictions for Aluminum 6061-T6, high-density polyethylene, a boron nitride nanotube composite, and boronated polyethylene exposed to a monoenergetic 150 MeV proton beam. Transmitted and secondary detector responses were measured using calibrated silicon detector instrumentation and compared with FLUKA models constructed from matched beam, material, and geometric definitions. Agreement was evaluated using normalized transmitted response, relative percent difference, root-mean-square error, spectral trend consistency, and combined experimental–simulation uncertainties. FLUKA reproduced the monotonic attenuation trends and identical material-performance ranking observed experimentally. Differences between predicted and measured transmitted responses remained within approximately ±5.1%, with an overall root-mean-square error of 0.035. Aluminum 6061-T6 produced the greatest downstream secondary response, whereas the hydrogen-rich and boron-containing materials produced lower integrated responses. The results provide a quantitative beam-based benchmark for FLUKA spacecraft shielding applications and identify material definition, detector response, secondary-particle transport, and geometric idealization as principal sources of residual discrepancy.
1. Introduction
Space radiation remains a major environmental constraint in the design of human and robotic exploration systems. Beyond the protective influence of Earth’s atmosphere and magnetosphere, spacecraft are exposed to galactic cosmic rays, solar energetic particles, trapped radiation, and secondary particles generated through interactions between incident radiation and spacecraft structures [1,2,3,4,5]. These radiation fields can degrade electronic components, alter material properties, and increase biological risks during extended missions in cislunar space, on the lunar surface, and during Mars transit [2,3,4,5]. As mission durations increase and opportunities for rapid return decrease, experimentally supported radiation protection strategies become increasingly important.
Material selection is a central element of spacecraft radiation protection. Aluminum alloys remain widely used as structural baselines; however, shielding performance depends not only on structural mass but also on elemental composition, areal density, incident particle energy, and the production of secondary radiation. Hydrogen-rich polymers can reduce proton and heavy-ion energy efficiently through ionization and scattering, while boron-containing materials may additionally suppress portions of the secondary-neutron field. Advanced nanocomposites offer the possibility of combining radiation attenuation with structural, thermal, electrical, or electromagnetic functionality [6,7,8,9,10,11]. Recent developments in multifunctional composites further demonstrate that material architectures can be tailored to provide multiple spacecraft functions, although electromagnetic interference shielding performance should not be interpreted as direct evidence of ionizing radiation attenuation [12].
Because full-scale testing in a complete space radiation environment is difficult and costly, Monte Carlo transport codes are routinely used to predict particle transport, energy deposition, nuclear interactions, and secondary-particle generation. FLUKA is a general-purpose Monte Carlo code capable of transporting hadrons, leptons, photons, heavy ions, and secondary products through complex material and geometric configurations [13,14,15,16,17,18]. It has therefore been applied to space-radiation dosimetry, shielding-material comparisons, detector-response calculations, and mission-level dose estimation [19].
Simulation predictions, however, are conditional on the fidelity of the physical models and input definitions. Material composition, density, geometric tolerances, beam energy and divergence, detector response, transport thresholds, and nuclear-interaction settings can all affect calculated outputs. Experimental benchmarking is therefore necessary to determine whether a transport model reproduces measured attenuation and secondary-response behavior within the uncertainty of the test configuration.
Monoenergetic beam experiments do not reproduce the full spectral and compositional complexity of galactic cosmic rays or solar particle events. They nevertheless provide a controlled means of isolating particle–material interactions and testing transport-model fidelity at a specific energy. Proton beams are particularly useful because protons are major contributors to solar particle environments and trapped radiation exposure and can generate recoil nuclei, neutrons, photons, and charged secondary particles in shielding materials.
A nominal energy of 150 MeV was selected for the present investigation for three reasons. First, this energy lies within the range relevant to energetic solar protons and is sufficiently high to penetrate spacecraft-relevant material areal densities while producing measurable differences in transmitted and secondary responses. Second, the selected energy provides a controlled intermediate-energy benchmark at which both electromagnetic slowing and nonelastic nuclear interactions contribute to detector response. Third, the beamline provides a well-characterized 150 MeV operating condition with stable current, repeatable geometry, and calibrated dosimetry. The fixed energy was therefore selected to isolate material-dependent transport behavior rather than to reproduce the complete operational space spectrum.
The novelty of the present work lies in the direct, geometry-matched comparison of measured and FLUKA-predicted transmitted and secondary responses for four distinct spacecraft shielding strategies under identical 150 MeV proton irradiation. Previous studies have established the benefits of polyethylene, boron-containing materials, and other low-atomic-number shielding concepts [6,7,8,9,10]. The present investigation extends this body of work by quantifying FLUKA model fidelity using common normalization, uncertainty propagation, spectral comparison, and material ranking metrics. It also examines why model–experiment deviations differ between a homogeneous polymer, a conventional aluminum alloy, a boronated polymer, and a heterogeneous BNNT composite.
The objective of this study is to determine whether FLUKA reproduces the measured attenuation trends, downstream secondary response, and relative shielding performance ranking of candidate spacecraft materials under controlled proton irradiation. The resulting benchmark is intended to establish confidence bounds for comparative material screening while clearly identifying the limitations of extrapolating a single-energy laboratory result to mixed-field mission environments.
2. Materials and Methods
2.1. Study Overview
The investigation combined controlled proton-beam measurements with geometry-matched FLUKA simulations. Four candidate shielding materials were characterized, mounted in a repeatable beamline configuration, irradiated under identical nominal conditions, and evaluated using a downstream silicon detector. Equivalent numerical models were then constructed using measured sample dimensions, material definitions, beam parameters, transport settings, and detector geometry. Experimental and simulated responses were processed using the same open-beam normalization convention and compared using relative percent difference, root-mean-square error, spectral trend consistency, material ranking, and combined uncertainty.
The principal novelty of the methodology is the preservation of experimental–simulation equivalence. Sample geometry, beam diameter, source energy, intervening transport regions, detector location, response quantity, and normalization procedures were matched to minimize comparison bias unrelated to FLUKA transport physics.
2.2. Candidate Shielding Materials
The evaluated materials were Aluminum 6061-T6, high-density polyethylene (HDPE), a boron nitride nanotube (BNNT)-reinforced polymer composite, and boronated polyethylene. This material set represents four distinct shielding concepts: a conventional metallic spacecraft structural baseline, a homogeneous hydrogen-rich polymer, an advanced heterogeneous nanocomposite, and a hydrogen-rich material containing boron for potential mitigation of secondary-neutron contributions [6,7,8,9,10,11].
All coupons had nominal in-plane dimensions of 100 mm × 100 mm. Thicknesses were selected to produce material areal densities of approximately 2.7–3.0 g/cm2 for the principal comparison condition. Five independently mounted and measured specimens or repeated specimen conditions were evaluated for each material configuration. Table 1 summarizes the principal physical properties of the shielding coupons.
Table 1.
Shielding coupon composition and manufacturing details.
Coupon thickness was measured at five locations (center and four peripheral locations) using a digital micrometer (Mitutoyo America Corporation, Aurora, IL, USA) with a resolution of 0.001 mm, and the reported thickness represents the arithmetic mean of those measurements. Thickness nonuniformity was calculated as the maximum deviation from the mean. Coupon mass was measured using a precision laboratory balance (METTLER TOLEDO, Columbus, OH, USA) with a readability of 0.001 g, and the measured areal density was calculated by dividing the coupon mass by the exposed planar area. The specific archived instrument model numbers were not preserved and therefore were not retrospectively assigned. The elemental compositions used in FLUKA were obtained from supplier certificates, technical data sheets, and the published literature [6,7,8,9,10,11]. Where a supplier provided only a bulk engineering composition, the corresponding simplification was documented and propagated as a model-input limitation.
The BNNT composite presents greater compositional complexity than the other specimens because the modeled response depends on nanotube mass fraction, matrix chemistry, porosity, nanotube dispersion, and possible interfacial or density gradients. The FLUKA model treated the coupon as a homogenized bulk material unless otherwise stated. This approximation preserves average elemental composition but does not explicitly represent microscale nanotube orientation, agglomeration, void structure, or matrix–reinforcement interfaces.
2.3. Beam Irradiation Facility and Selection of Beam Conditions
Beam irradiation was performed using a monoenergetic 150 MeV proton beam. A nominal proton energy of 150 MeV and an equivalent beam current of approximately 1 nA were maintained for all material conditions. The beam was collimated to a nominal 2 cm diameter and was incident normal to the coupon surface throughout the experimental campaign.
The 150 MeV condition was selected as a controlled benchmark rather than as a complete representation of the space environment. This energy provides sufficient penetration through the selected areal densities, produces measurable attenuation differences among materials, and allows both continuous slowing down and proton-induced nuclear interactions to contribute to the downstream response. It also represents an energetic-proton condition relevant to portions of solar particle and trapped proton spectra. The limitations of this fixed-energy approach are addressed in Section 4.3 and Section 4.4.
The beam spot diameter at the coupon plane was approximately 2 cm, with measured uniformity within ±5% over the central irradiated region. Beam current was continuously monitored using the facility instrumentation to ensure stable irradiation conditions. The mean beam current variation during accepted acquisitions remained below ±2%, and runs exceeding this criterion were repeated or excluded.
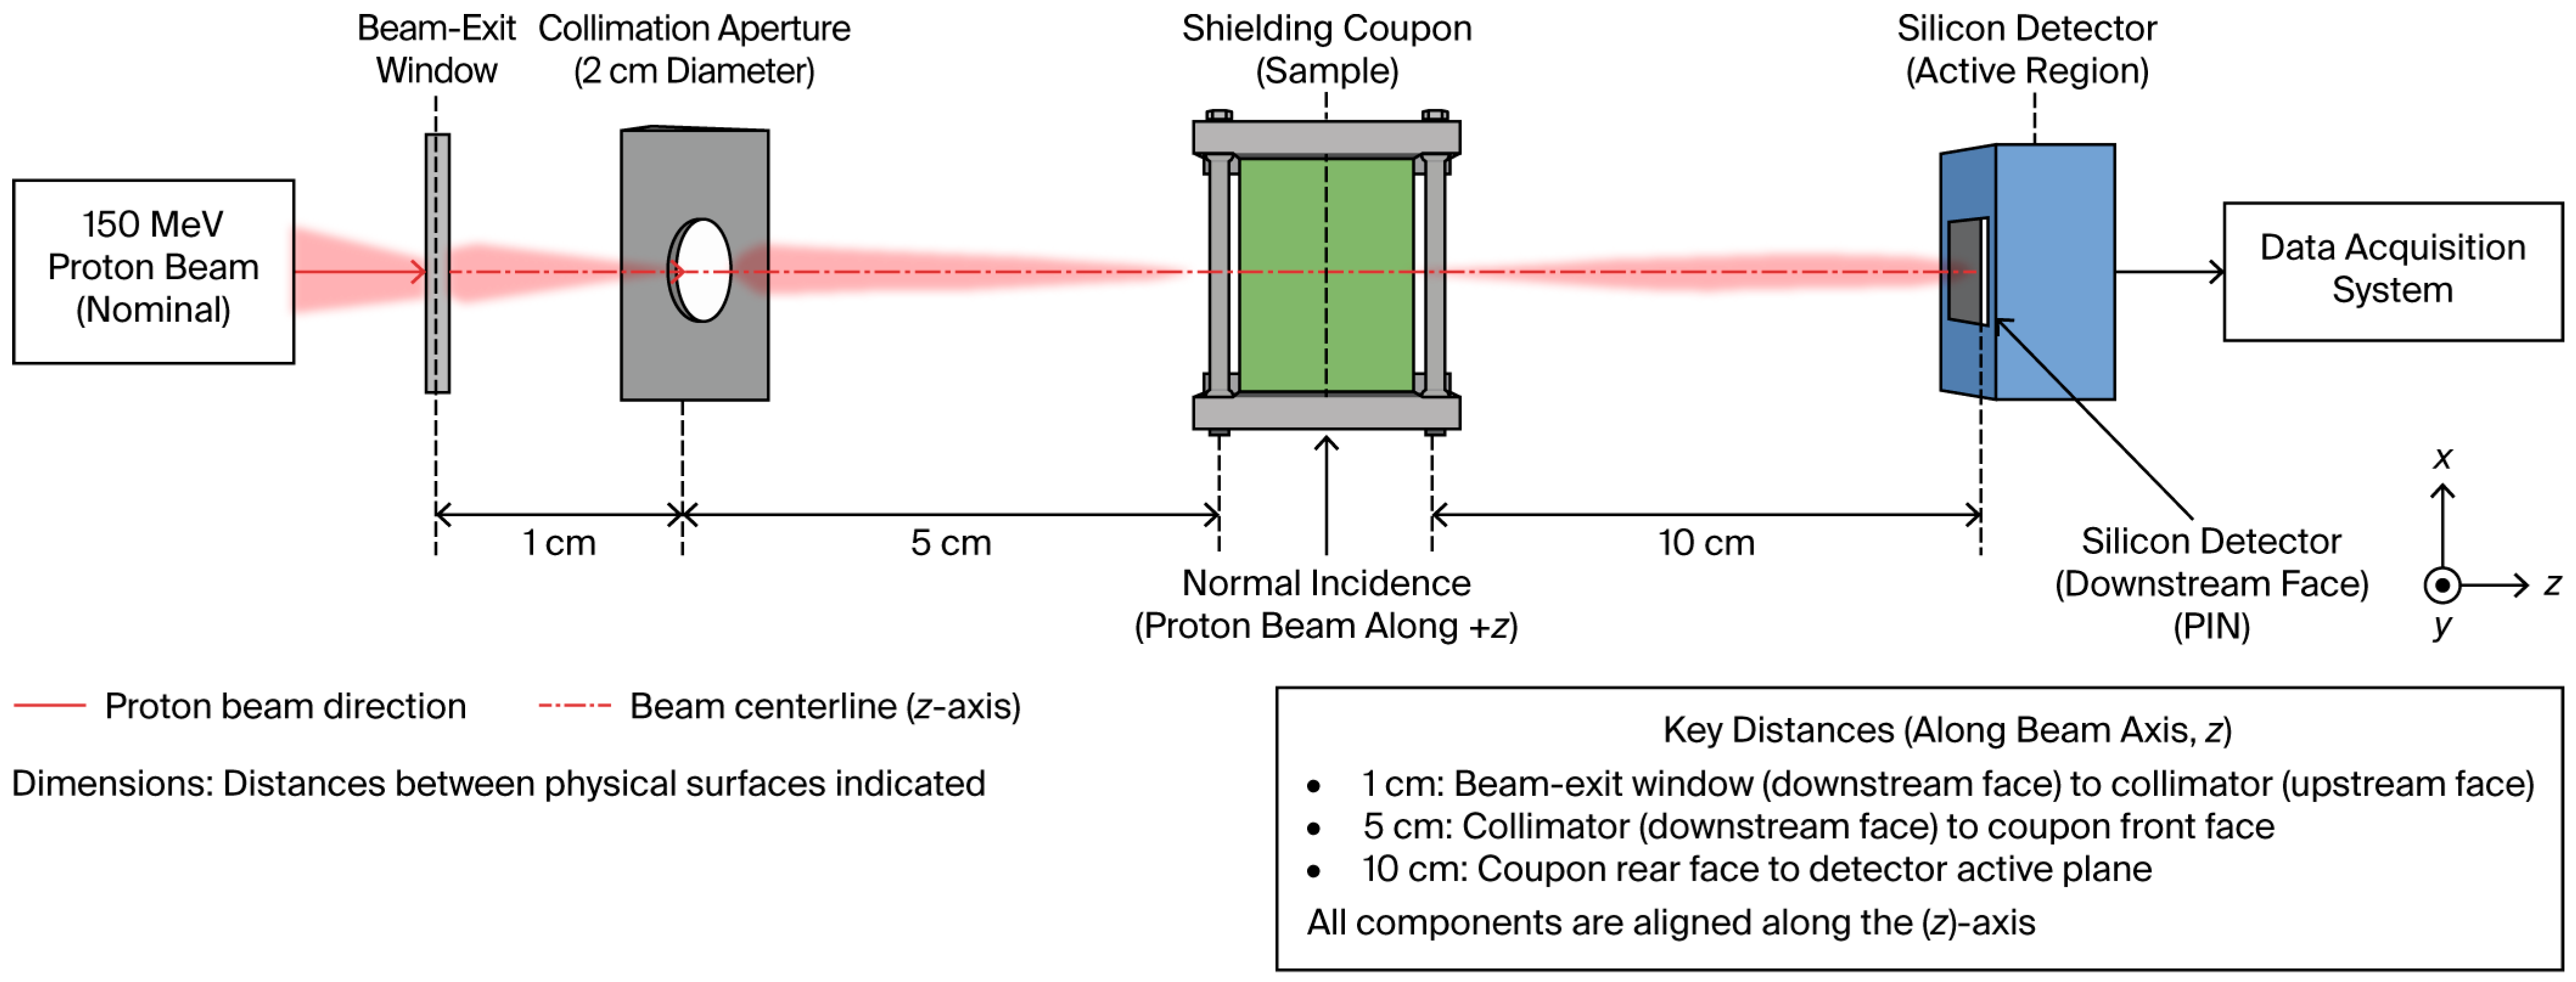
The beam exited through a beam-exit window before passing through the collimation aperture. The distance from the downstream surface of the exit window to the collimator was approximately 1 cm, from the collimator’s downstream surface to the coupon front face was 5 cm, and from the coupon’s rear face to the detector active plane was 10 cm. Air-path energy loss between these components was explicitly included in the FLUKA geometry.
2.4. Experimental Configuration and Sample Mounting
The experimental configuration consisted of the beam-exit window, a 2 cm diameter collimation aperture, a precision-machined coupon holder, a downstream silicon detector, and the associated data acquisition system. The aperture axis, coupon center, detector center, and proton-beam centerline were aligned along the positive z-axis.
Figure 1 shows the collimation aperture aligned parallel to the beam axis rather than perpendicular to it. All reference dimensions originate at the identified upstream and downstream component surfaces. The figure explicitly labels the following:
- Downstream surface of beam-exit window to collimator upstream surface: 1 cm;
- Collimator’s downstream surface to coupon front face: 5 cm;
- Coupon thickness: material-dependent;
- Coupon rear face to detector active plane: 10 cm.
Figure 1.
Experimental proton-beam irradiation and detector configuration. A nominal 150 MeV proton beam exits through the beam-exit window, passes through a 2 cm diameter collimation aperture aligned with the positive z-axis, irradiates the shielding coupon at normal incidence, and reaches the active region of the downstream silicon detector. The downstream surface of the beam-exit window is located 1 cm upstream of the collimator, the collimator downstream surface is located 5 cm upstream of the coupon front face, and the coupon rear face is located 10 cm upstream of the detector active plane. Dimensions are referenced between the physical upstream and downstream component surfaces indicated in the figure.
Coupon lateral position and surface normality were maintained using a precision alignment fixture with an estimated positional tolerance of ±0.5 mm and an angular tolerance of ±0.5°. The exposed coupon orientation was recorded and maintained throughout repeated acquisitions. Measurements were conducted in ambient laboratory air at approximately 20–25 °C and standard atmospheric pressure (approximately 101 kPa).
The initial conceptual schematic was generated using OpenAI ChatGPT Images 2.0 (accessed July 2026; exact internal model build not exposed) in accordance with the authors’ instructions and was subsequently reviewed, corrected, and approved by the authors. The prompt used is as follows: “Create a clean, publication-quality engineering schematic on a white background showing the experimental configuration for a nominal 150 MeV proton-beam irradiation benchmark. From left to right, show the incident proton beam, beam-exit window, 2 cm diameter collimation aperture aligned with the positive z-axis, shielding coupon mounted at normal incidence in a precision holder, downstream silicon detector active region, and data-acquisition system. Label the distance from the beam-exit window to the collimator as 1 cm, the collimator to the coupon as 5 cm, and the coupon rear face to the detector active plane as 10 cm. Include coordinate axes, a component legend, a key-distance box, and a note that dimensions are referenced between the indicated physical surfaces. Use crisp technical typography and an MDPI-compatible scientific style.”
2.5. Detector System and Measured Response Quantities
The radiation response downstream of each coupon was measured using an R-Series ruggedized silicon surface-barrier charged-particle detector (AMETEK ORTEC, Oak Ridge, TN, USA) with an active area sufficient to intercept the nominal 2 cm diameter proton beam. Detector signals were processed using an ORTEC A-576 A-PAD spectroscopy chain and digitized using an ORTEC Model 928 EASY-NIM multichannel analyzer. Pulse-height spectra were acquired using ORTEC MAESTRO MCA Emulation Software (AMETEK ORTEC, Oak Ridge, TN, USA).
Detector calibration was performed in accordance with the facility’s standard calibration procedures before beam measurements. Calibration stability was verified using the facility’s beam-monitoring and dosimetry systems before and after each experimental series. The resulting calibration uncertainty was incorporated into the overall experimental uncertainty analysis presented in Section 2.11.
The primary experimental response was the normalized transmitted detector response,
where (Ri) is the background-subtracted detector response behind material condition (i), and (R0) is the corresponding open-beam response. Secondary-response spectra and integrated counts in the detector energy interval 0–2000 keV were also recorded to evaluate material-dependent downstream secondary behavior.
Five repeated acquisitions were performed for each condition. The reported result is the arithmetic mean, and repeatability is represented by the standard deviation of the repeated measurements. Background spectra were acquired under beam-off conditions and subtracted before normalization.
Detector operating conditions were established from the available experimental documentation, calibration records, and facility procedures. The detector, spectroscopy electronics, and data-acquisition system were operated using the manufacturer-recommended settings applicable to the experimental configuration. Where individual operating parameters, such as detector bias, amplifier shaping constants, discriminator settings, or acquisition-channel configuration, were not preserved in the archived experimental record, they were not retrospectively estimated. These unavailable settings do not affect the reported normalized detector-response comparisons because all material conditions and corresponding open-beam measurements were acquired using the same detector configuration and data-acquisition methodology.
2.6. Experimental Procedure
Before each test series, the detector baseline, beam alignment, collimator alignment, beam current, and the open-beam response were verified. Open-beam measurements were obtained before and after each material series to identify instrument or beam drift. A material run was accepted only when the beam-current variation remained within ±2%, the open-beam detector response remained within ±2% of its initial value, and coupon alignment was verified.
Each coupon was inserted without altering the collimator or detector position. Five repeated acquisitions were obtained for each material condition using identical beam conditions and acquisition parameters. The test order was alternated with periodic open-beam measurements to minimize systematic temporal bias. When the same coupon was removed and reinstalled between measurements, remounting variability was included in the repeatability estimate.
2.7. Data Reduction and Derived Experimental Metrics
Raw detector outputs were corrected for electronic background, beam-off background, acquisition duration, calibration coefficients, and beam-current normalization where applicable. The shielding effectiveness was defined as
where represents the fractional reduction relative to the unshielded condition.
Spectral measurements were processed using identical energy-bin boundaries for all materials. The integrated secondary response was calculated by summing the background-subtracted counts over 0–2000 keV and normalizing to the corresponding open-beam result.
Experimental data reduction, statistical analysis, uncertainty propagation, and preparation of the processed response datasets were performed using MATLAB R2026a (The MathWorks, Inc., Natick, MA, USA). MATLAB was used to perform background-subtraction calculations, open-beam normalization, calculation of mean responses and standard deviations from repeated measurements, relative percent-difference calculations, root-mean-square error calculations, uncertainty propagation, and preparation of the numerical datasets used for comparison with the FLUKA simulation results.
The experimental standard uncertainty in (T_i) included detector calibration, beam stability, measurement repeatability, background subtraction, geometric positioning, coupon thickness, and open-beam normalization. The uncertainty budget is defined in Section 2.11.
2.8. FLUKA Model Development
The experimental configuration was prepared using the Flair graphical user interface, version 3.2, and particle-transport calculations were performed using FLUKA version 4-3.1 (CERN, Geneva, Switzerland) [13,14,15,16,17,20]. The model geometry, material definitions, beam parameters, transport settings, and detector-equivalent scoring regions were defined and inspected in Flair, while FLUKA was used to perform the Monte Carlo particle-transport calculations.
The numerical model was developed to reproduce the documented experimental geometry, beam conditions, material definitions, and detector configuration. When original simulation implementation records (e.g., detailed transport settings, execution parameters, or auxiliary configuration information) were unavailable, the corresponding FLUKA configuration was reconstructed from the validated benchmark model, available experimental documentation, and the standard FLUKA implementation appropriate for the reported benchmark. These reconstructed implementation details do not alter the experimental measurements or the reported model–experiment comparisons but are provided to improve methodological transparency and reproducibility.
The model explicitly represented the source region, beam-exit window, air gaps, collimator body and aperture, coupon, holder components capable of affecting transport, detector housing when relevant, detector active volume, and outer boundary. Dimensions were taken from beamline measurements and facility documentation.
The FLUKA transport configuration used for the benchmark model is summarized in Table 2.
Table 2.
FLUKA transport configuration parameters.
Material cards were generated from measured or certified elemental mass fractions. Aluminum 6061-T6 was modeled using its certified alloy composition rather than as pure aluminum. HDPE and boronated polyethylene were modeled using the supplier-specified bulk density and elemental composition. The BNNT composite was represented as a homogenized material consisting of boron nitride nanotubes uniformly distributed within a polymer matrix, using the nominal bulk density and elemental composition of the fabricated coupon. This homogenization preserves the average elemental composition and mass density but does not explicitly represent nanotube orientation, agglomeration, porosity, or local matrix–reinforcement interfaces. The potential influence of these simplifications was considered in the interpretation of the simulation results [6,7,8,9,10,11].
Energy deposition within the silicon detector active volume was scored using the FLUKA USRBIN card. The scored quantity represents total ionizing energy deposited within the detector-equivalent volume and was converted to a normalized detector response using the same open-beam normalization procedure applied to the experimental measurements. Because USRBIN scores total deposited energy, the present comparison evaluates ionizing energy deposition and detector response rather than individual particle fluence, displacement damage, or non-ionizing energy loss (NIEL). Dedicated particle-fluence scoring cards (e.g., USRTRACK or USRBDX) and damage-equivalent scoring were not employed in the present study.
The five repeated experimental measurements were not modeled as five identical physical coupons unless their measured properties differed. Instead, one nominal simulation was performed per unique material–thickness condition, with independent Monte Carlo cycles used to estimate statistical uncertainty.
SRIM was not used as an independent benchmark because the principal study outputs include nuclear secondary production and detector-region response, which extend beyond a continuous-slowing-down comparison. A future code-to-code comparison using Geant4, PHITS, or MCNP may provide a more comparable transport benchmark.
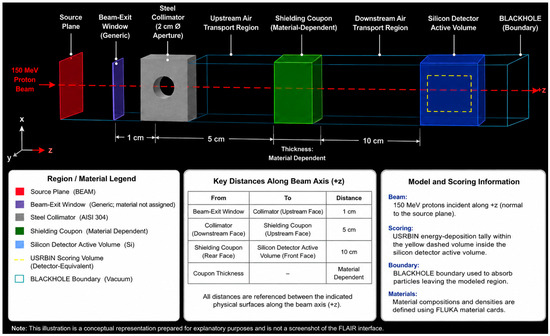
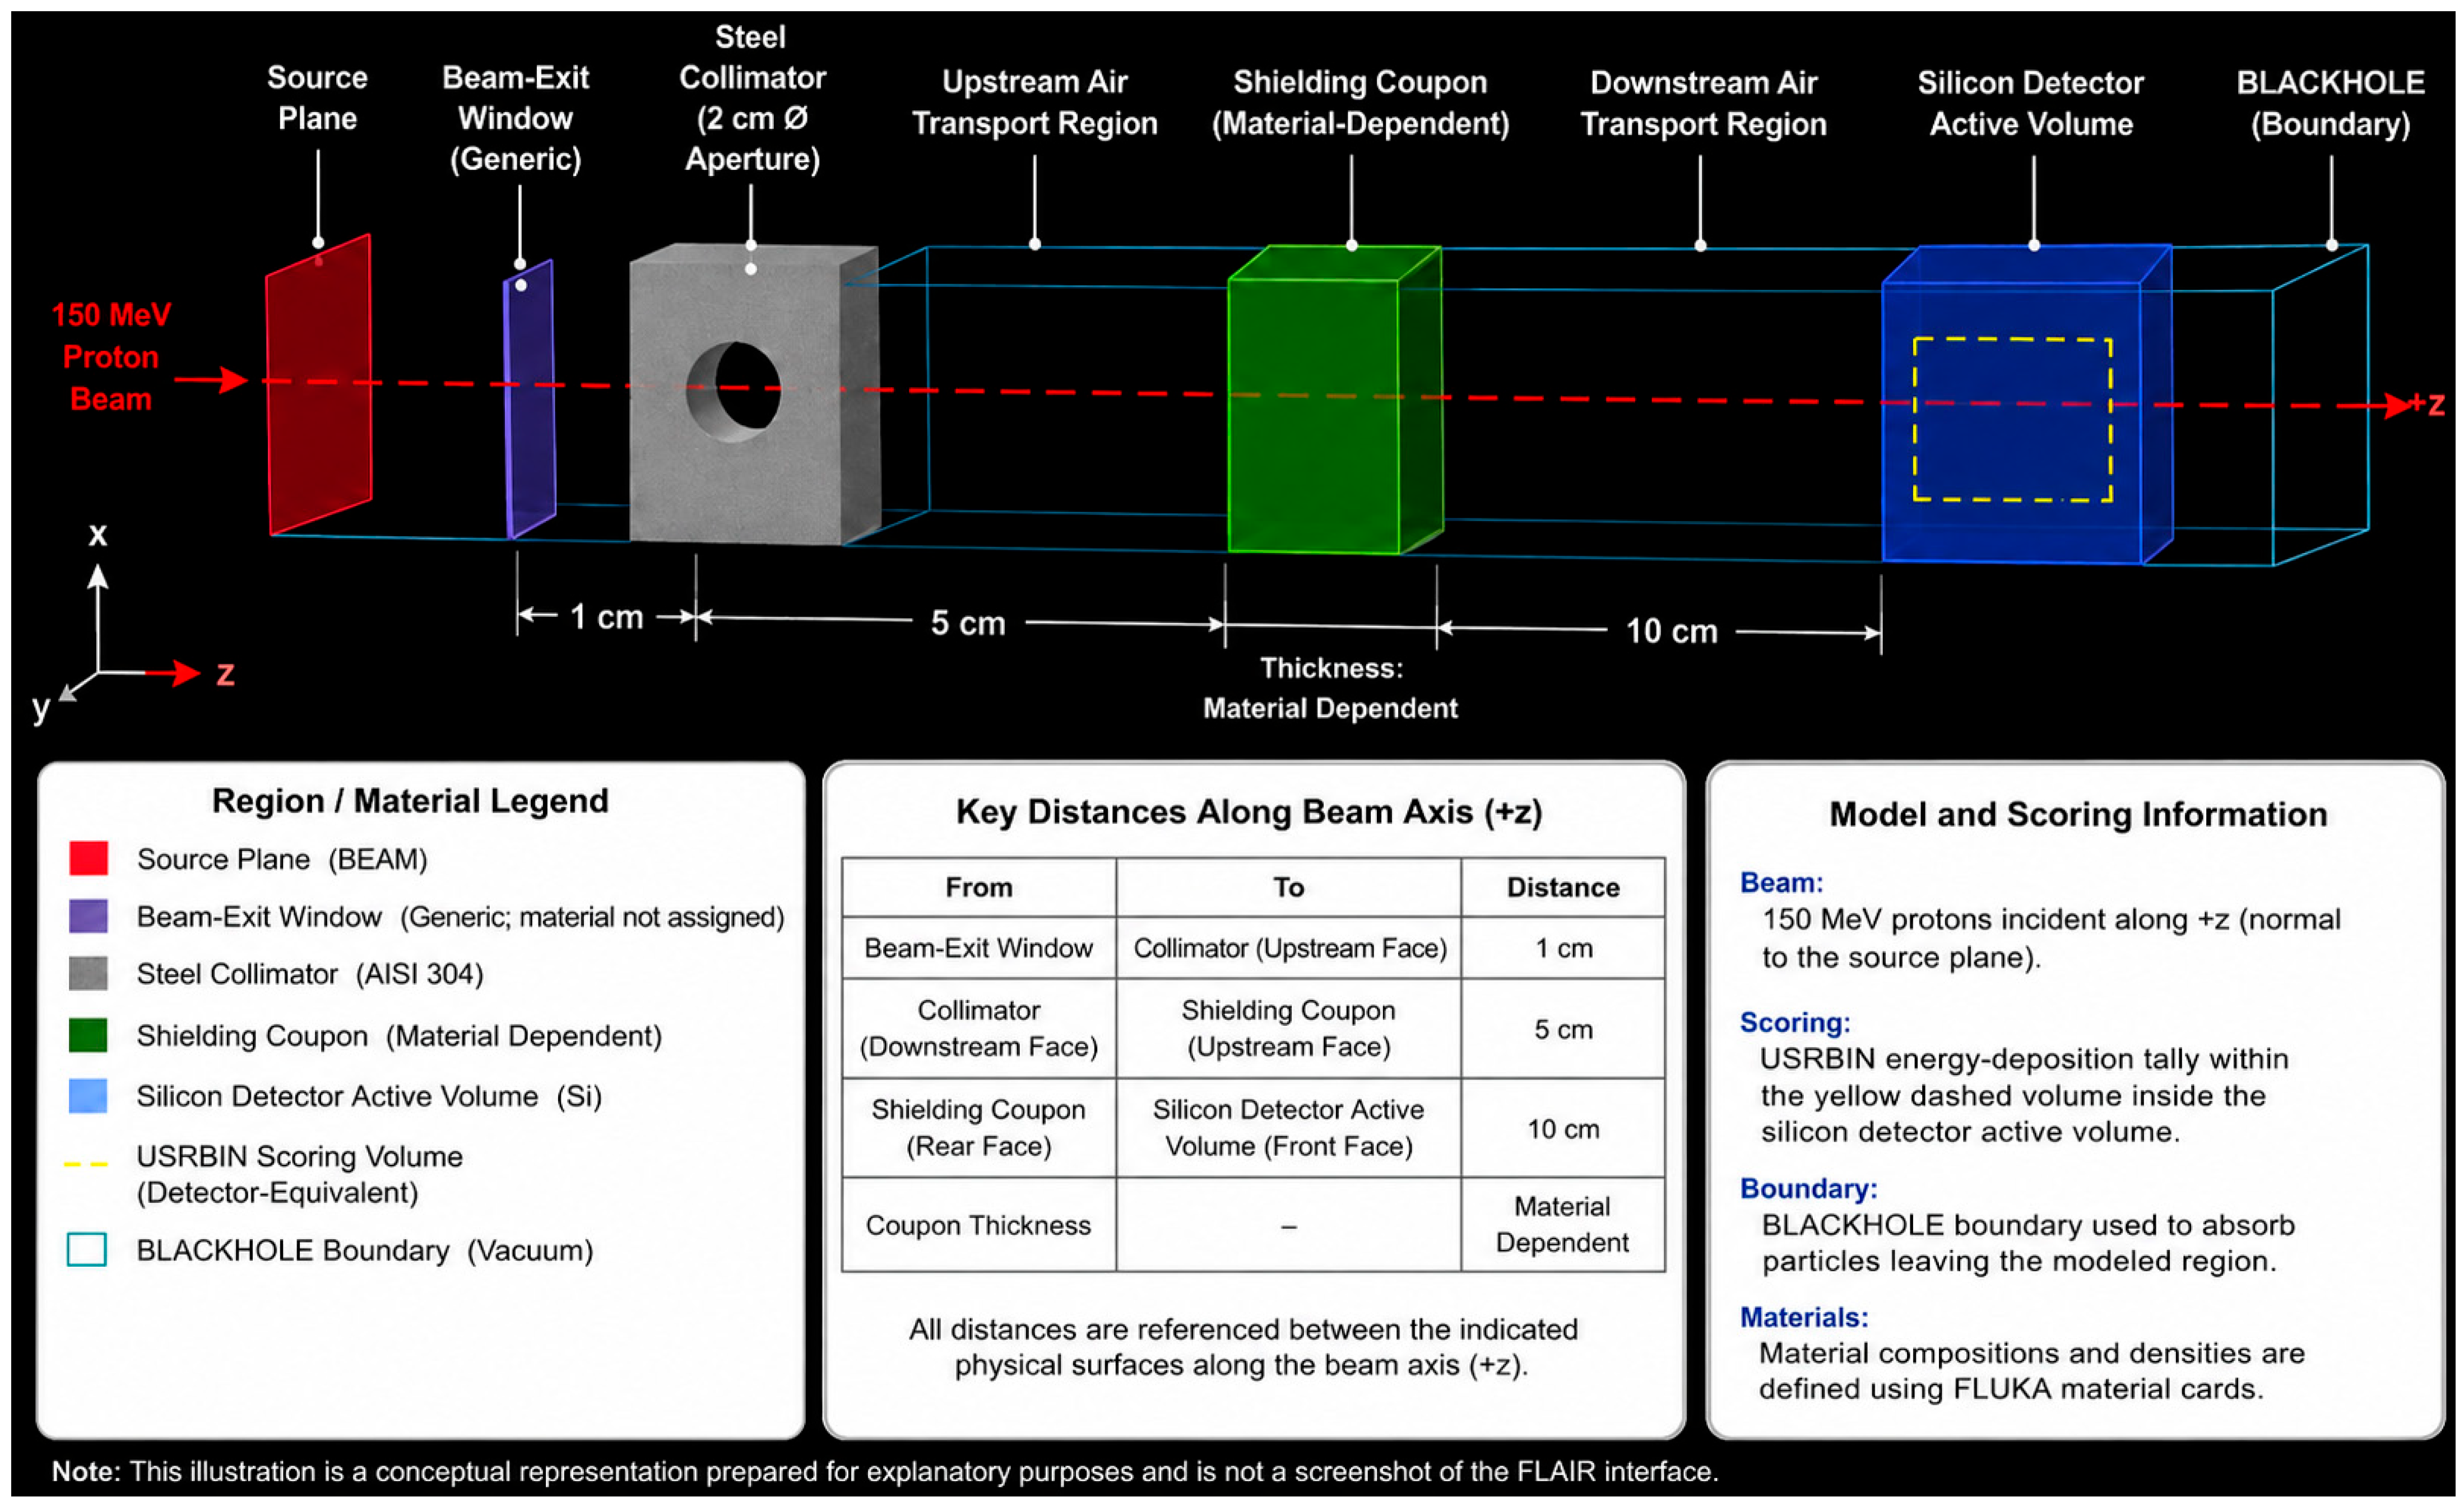
The FLUKA model explicitly represents the beam transport geometry, shielding coupon, detector-equivalent scoring region, and surrounding transport media required to reproduce the experimental configuration. A FLAIR visualization of the implemented geometry is presented in Figure 2.
Figure 2.
FLAIR-style representation of the FLUKA geometry used for the 150 MeV proton benchmark. The model includes the beam-exit window, collimator and aperture, upstream and downstream air transport regions, material-dependent shielding coupon, silicon-detector active volume, and outer BLACKHOLE transport boundary. The red dashed arrow indicates the 150 MeV proton-beam centerline and direction of propagation along the positive z-axis. The yellow dashed volume within the silicon detector represents the detector-equivalent USRBIN energy-deposition scoring region used to calculate the normalized detector response.
The initial conceptual graphic was generated using OpenAI ChatGPT Images 2.0 (accessed July 2026; exact internal model build not exposed) in accordance with the authors’ geometry and scoring definitions and was subsequently reviewed, corrected, and approved by the authors. The prompt used is as follows: “Create a publication-quality, three-dimensional FLAIR-style conceptual illustration on a black background of the FLUKA geometry for a 150 MeV proton benchmark. Show, in order along the positive z-axis, a source plane, generic beam-exit window, steel collimator with a 2 cm diameter vacuum aperture, upstream air transport region, material-dependent shielding coupon, downstream air transport region, silicon-detector active volume, and outer BLACKHOLE transport boundary. Show a red proton-beam centerline and a yellow dashed detector-equivalent USRBIN energy-deposition scoring volume located within the silicon-detector active volume. Label the beam-exit-window-to-collimator distance as 1 cm, the collimator-to-coupon distance as 5 cm, coupon thickness as material dependent, and coupon-to-detector distance as 10 cm. Include a key-distance table, model-and-scoring information box, and region/material legend. Do not assign an undocumented material or thickness to the beam-exit window.”
2.9. Simulation Post-Processing and Experimental Matching
FLUKA energy deposition within the silicon detector active volume was scored using USRBIN and converted to a detector-equivalent response by normalizing the deposited energy to the corresponding open-beam simulation.
FLUKA USRBIN scoring outputs were imported into MATLAB R2026a (The MathWorks, Inc., Natick, MA, USA) for numerical post-processing and comparison with the experimental measurements. MATLAB was used to apply open-beam normalization, calculate the simulated detector-equivalent responses, determine experiment–simulation residuals and relative percent differences, calculate aggregate root-mean-square error, propagate uncertainty terms, and generate the processed datasets used in the validation analysis.
Because both the experimental and simulated results were expressed as normalized transmitted response, detector-response convolution and energy-dependent efficiency corrections were not required. The simulated normalized response was calculated as
where (Si) is the simulated detector-equivalent score behind material condition (i), and (S0) is the corresponding simulated open-beam score.
2.10. Validation Metrics
The primary validation metric was the relative percent difference between the measured and simulated response for each material condition, defined as
where and (Ei) are the simulated and experimental normalized responses, respectively. Aggregate agreement was evaluated using
where is the total number of sample conditions compared [14].
The validation also considered material ranking consistency, spectral shape agreement, integrated secondary response, and whether the experimental–simulation residual fell within the combined uncertainty interval.
The ±10% acceptance criterion was established before analysis as an engineering benchmark reflecting the expected combined influence of detector calibration, beam stability, coupon tolerances, geometry reproduction, material-composition uncertainty, and Monte Carlo statistical error. It was not treated as a universal FLUKA accuracy standard. The criterion represents a practical screening threshold for comparative material studies under the present beamline conditions.
2.11. Comprehensive Uncertainty Assessment
Experimental and simulation uncertainties were combined using root-sum-square propagation for independent components, in accordance with the Guide to the Expression of Uncertainty in Measurement [21]:
To evaluate the statistical significance of the experimental–simulation agreement, an uncertainty budget was developed that includes the principal contributions from detector calibration, beam stability, measurement repeatability, specimen characterization, geometric positioning, and the Monte Carlo statistical uncertainty. The resulting uncertainty budget is summarized in Table 3.
Table 3.
Uncertainty budget.
The transport settings summarized in Table 2 were applied consistently to all material configurations to ensure that differences in the simulated detector response resulted from the shielding-material properties and geometry rather than from changes in numerical transport parameters. A total of 1.0 × 10⁶ particle histories was simulated for each configuration using 10 independent cycles of 1.0 × 10⁵ histories with independent random-number seeds. The independent-cycle approach provided a direct estimate of Monte Carlo statistical variability for the detector-equivalent USRBIN energy-deposition score. The PRECISIOn physics configuration and associated electromagnetic, hadronic, neutron, ion, and multiple-scattering treatments were maintained consistently across all simulations.
The combined standard uncertainty for each material was calculated using the root-sum-square (RSS) of the individual standard uncertainty contributions listed in Table 3, assuming the uncertainty sources were independent. Depending on the measurement repeatability observed for each material, the resulting combined relative standard uncertainty ranged from approximately 3.6% to 4.7%.
To determine whether a model–experiment residual was significant, the absolute difference, mid, was compared with the combined standard uncertainty of the experimental and simulated results. Residuals smaller than the combined standard uncertainty were interpreted as statistically consistent at approximately the one-standard-deviation (68%) confidence level. Where appropriate, expanded uncertainties corresponding to a coverage factor of k = 2 (approximately 95% confidence) may be obtained by doubling the reported combined standard uncertainties.
Material-model uncertainty was evaluated through sensitivity cases in which density, thickness, and constituent mass fractions were varied within their documented tolerances. This step is especially important for the BNNT composite because its homogenized material definition may not fully capture porosity, agglomeration, reinforcement orientation, or matrix heterogeneity.
2.12. Reproducibility and Data Availability
All sample dimensions, supplier certificates, beam parameters, detector settings, calibration records, FLUKA input assumptions, scoring definitions, and post-processing procedures were documented.
The FLUKA input decks, material definitions, geometry descriptions, processed normalized-response dataset, and uncertainty-analysis worksheet are available in the Supplementary Materials or from the corresponding author upon reasonable request, subject to facility and software-distribution restrictions.
3. Results
3.1. Experimental Measurements
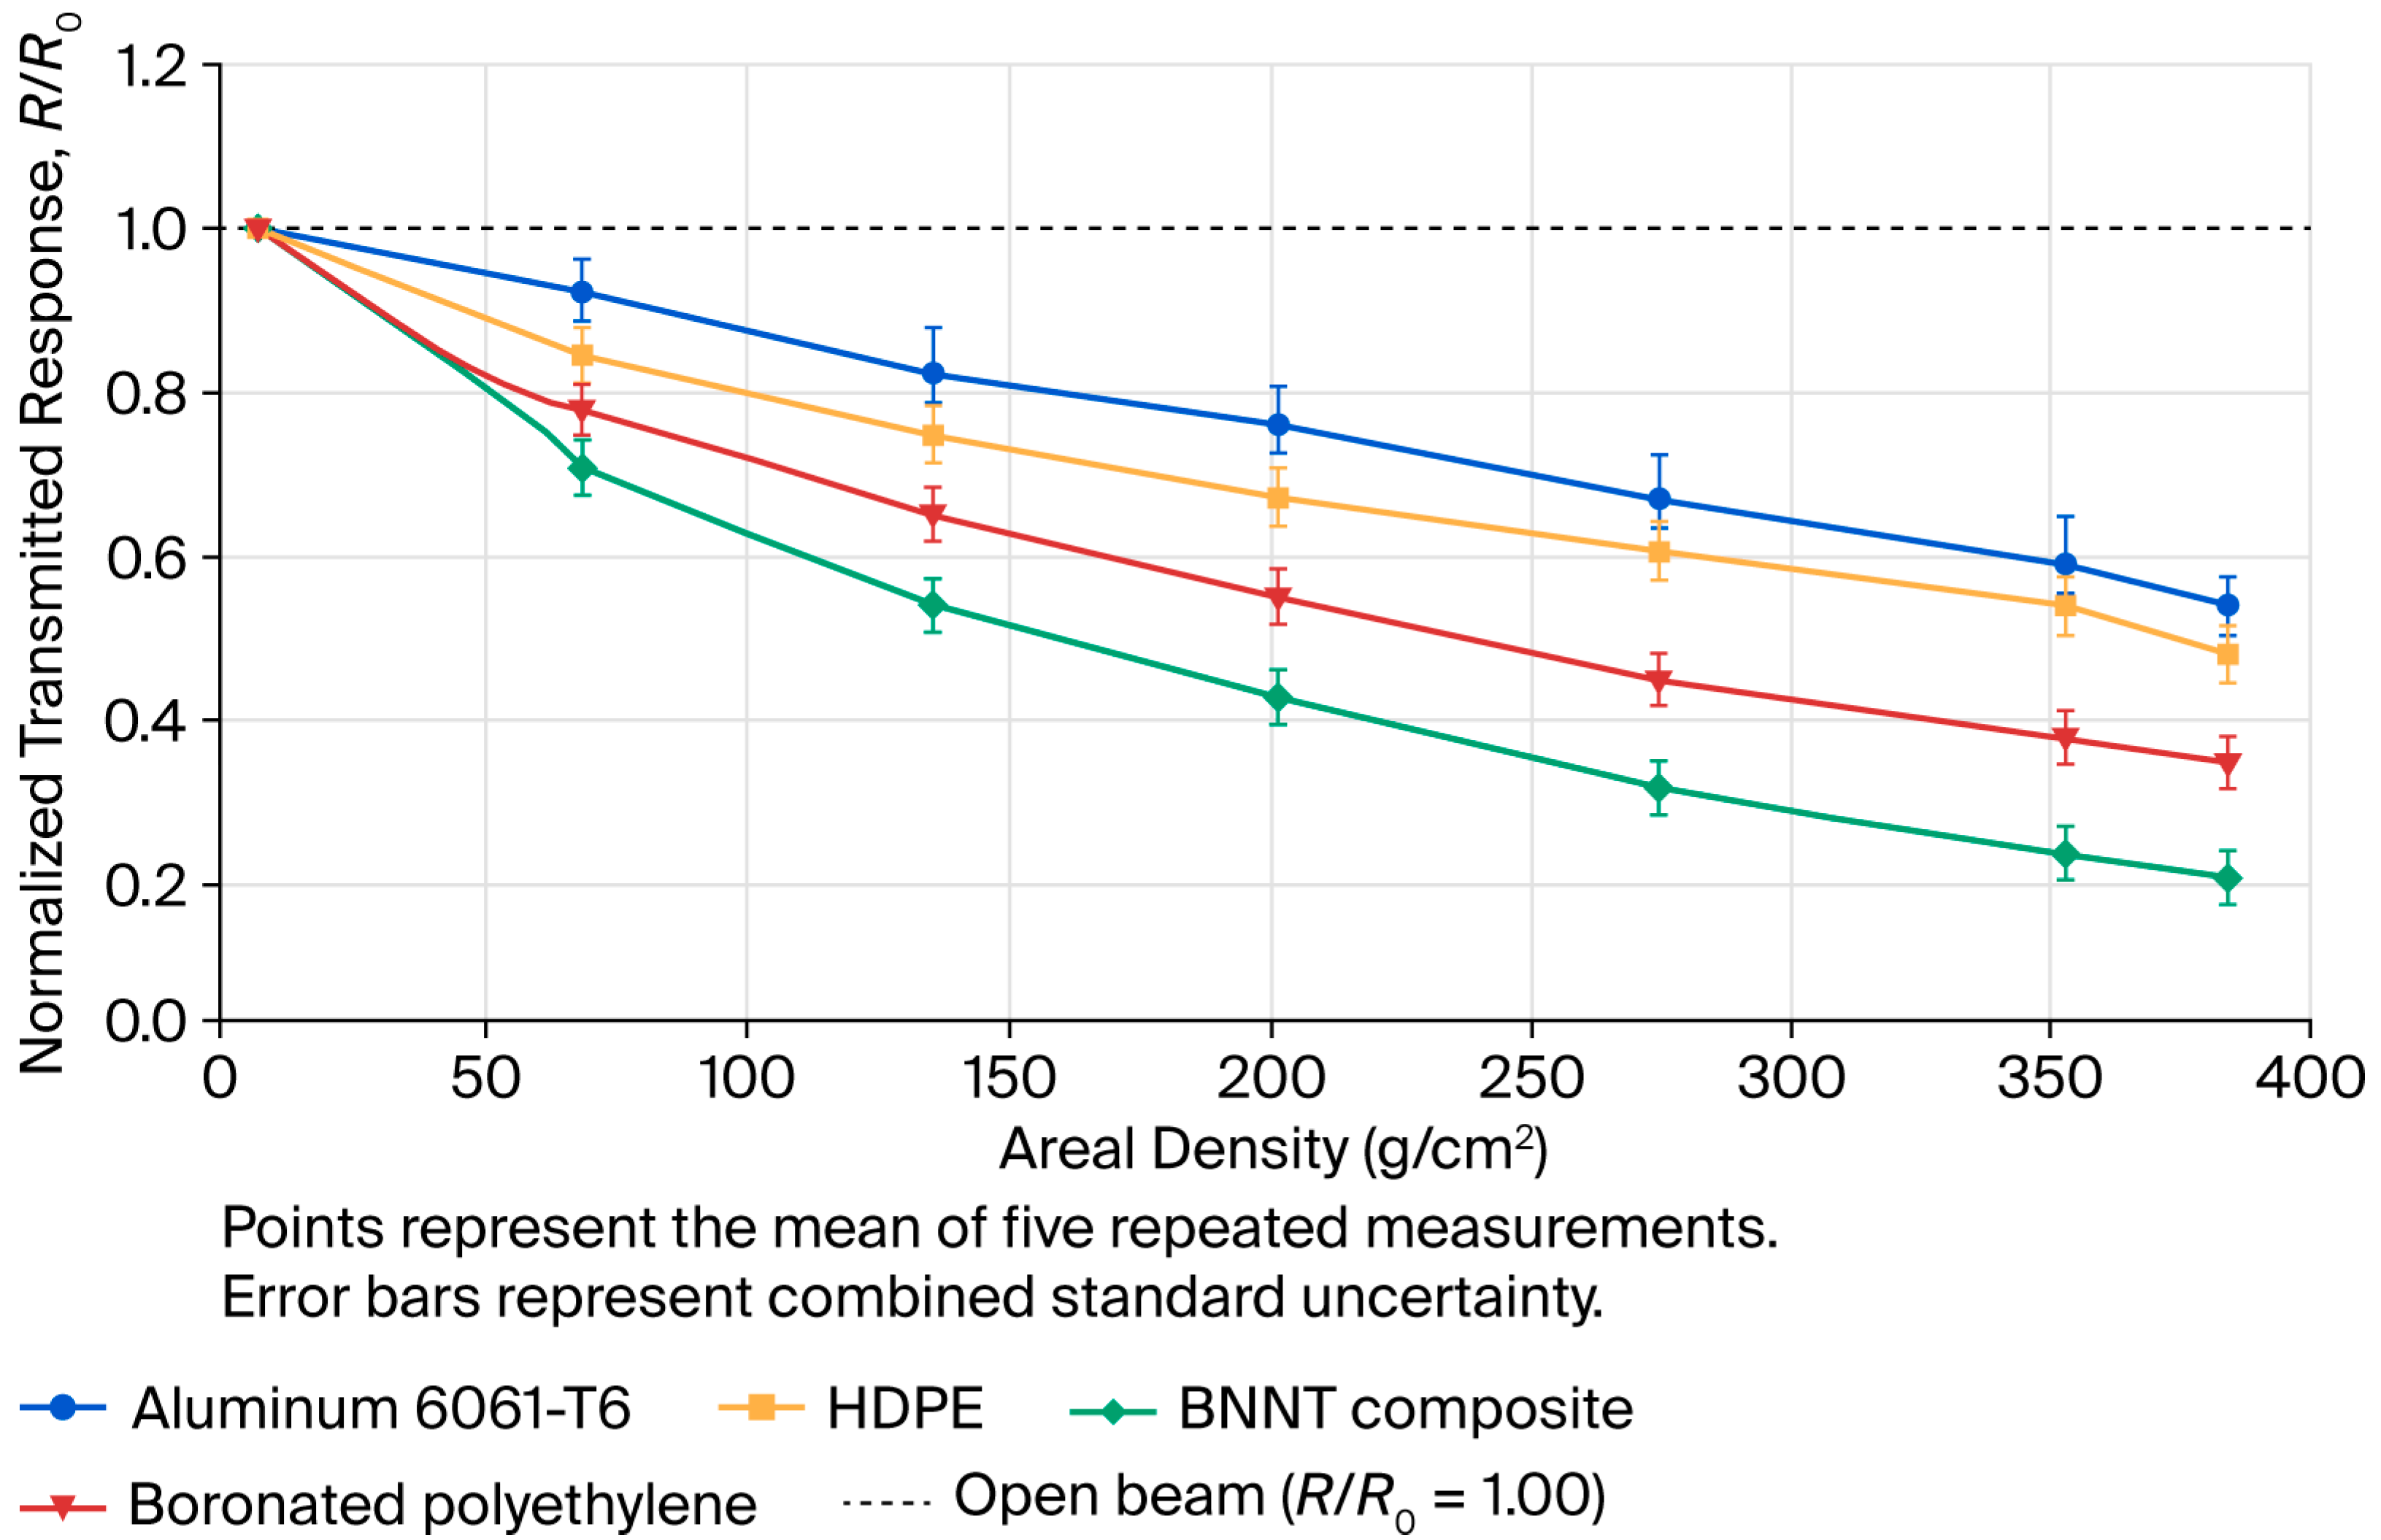
The normalized transmitted response decreased with increasing areal density for every evaluated material. This trend is consistent with established proton shielding behavior, in which attenuation and downstream detector response depend on material composition, hydrogen content, density, thickness, and secondary-particle production [6,7,8,9,10,22]. The present results therefore provide experimental confirmation of the expected dependence under the specific 150 MeV beam and detector configurations.
At approximately matched areal density, the polymeric and composite specimens produced a lower transmitted detector response than Aluminum 6061-T6. At 2.85 g/cm2, HDPE produced a measured normalized transmission of 0.65, compared with 0.78 for Aluminum 6061-T6 at the corresponding comparison condition. This represents a relative reduction of approximately 17% in the downstream response.
Boronated polyethylene produced the lowest integrated detector response, followed by the BNNT composite, HDPE, and Aluminum 6061-T6. This ordering should be interpreted as an integrated response of the particular silicon detector and energy interval rather than as a universal ordering of intrinsic proton stopping power. The detector response includes contributions from transmitted primaries and secondaries generated in the coupons.
The experimentally measured normalized transmitted response was used to quantify the attenuation performance of each candidate shielding material under 150 MeV proton irradiation. Figure 3 summarizes the measured response as a function of areal density for Aluminum 6061-T6, HDPE, BNNT composite, and boronated polyethylene, with error bars representing the combined standard uncertainty.
Figure 3.
Experimentally measured normalized transmitted response as a function of areal density under 150 MeV proton irradiation. Points represent the mean of five repeated measurements, and error bars represent combined standard uncertainty. Lower (R/R_0) indicates greater reduction in the downstream detector response.
3.2. Experimental and Simulated Secondary Response
The downstream secondary response spectra demonstrate material-dependent differences not captured by a transmitted-intensity metric alone. Aluminum 6061-T6 produced the largest integrated secondary response, followed by HDPE, the BNNT composite, and boronated polyethylene. FLUKA reproduced this qualitative ordering and the general spectral decay over the detector energy range.
The higher secondary response associated with Aluminum 6061-T6 is consistent with the greater role of nonelastic proton–nucleus interactions, recoil production, de-excitation photons, and secondary neutron and charged-particle generation in higher-atomic-number structural materials. The lower measured response behind the hydrogen-rich materials reflects a combination of efficient proton energy loss and a different secondary-particle field.
The energy-dependent detector response reveals systematic differences among the candidate shielding materials that cannot be explained solely by attenuation of the primary proton beam. These differences arise from the combined contributions of transmitted primary protons and secondary particles generated within each material.
Figure 4 shows the energy-dependent downstream detector response for each shielding material under 150 MeV proton irradiation.
Figure 4.
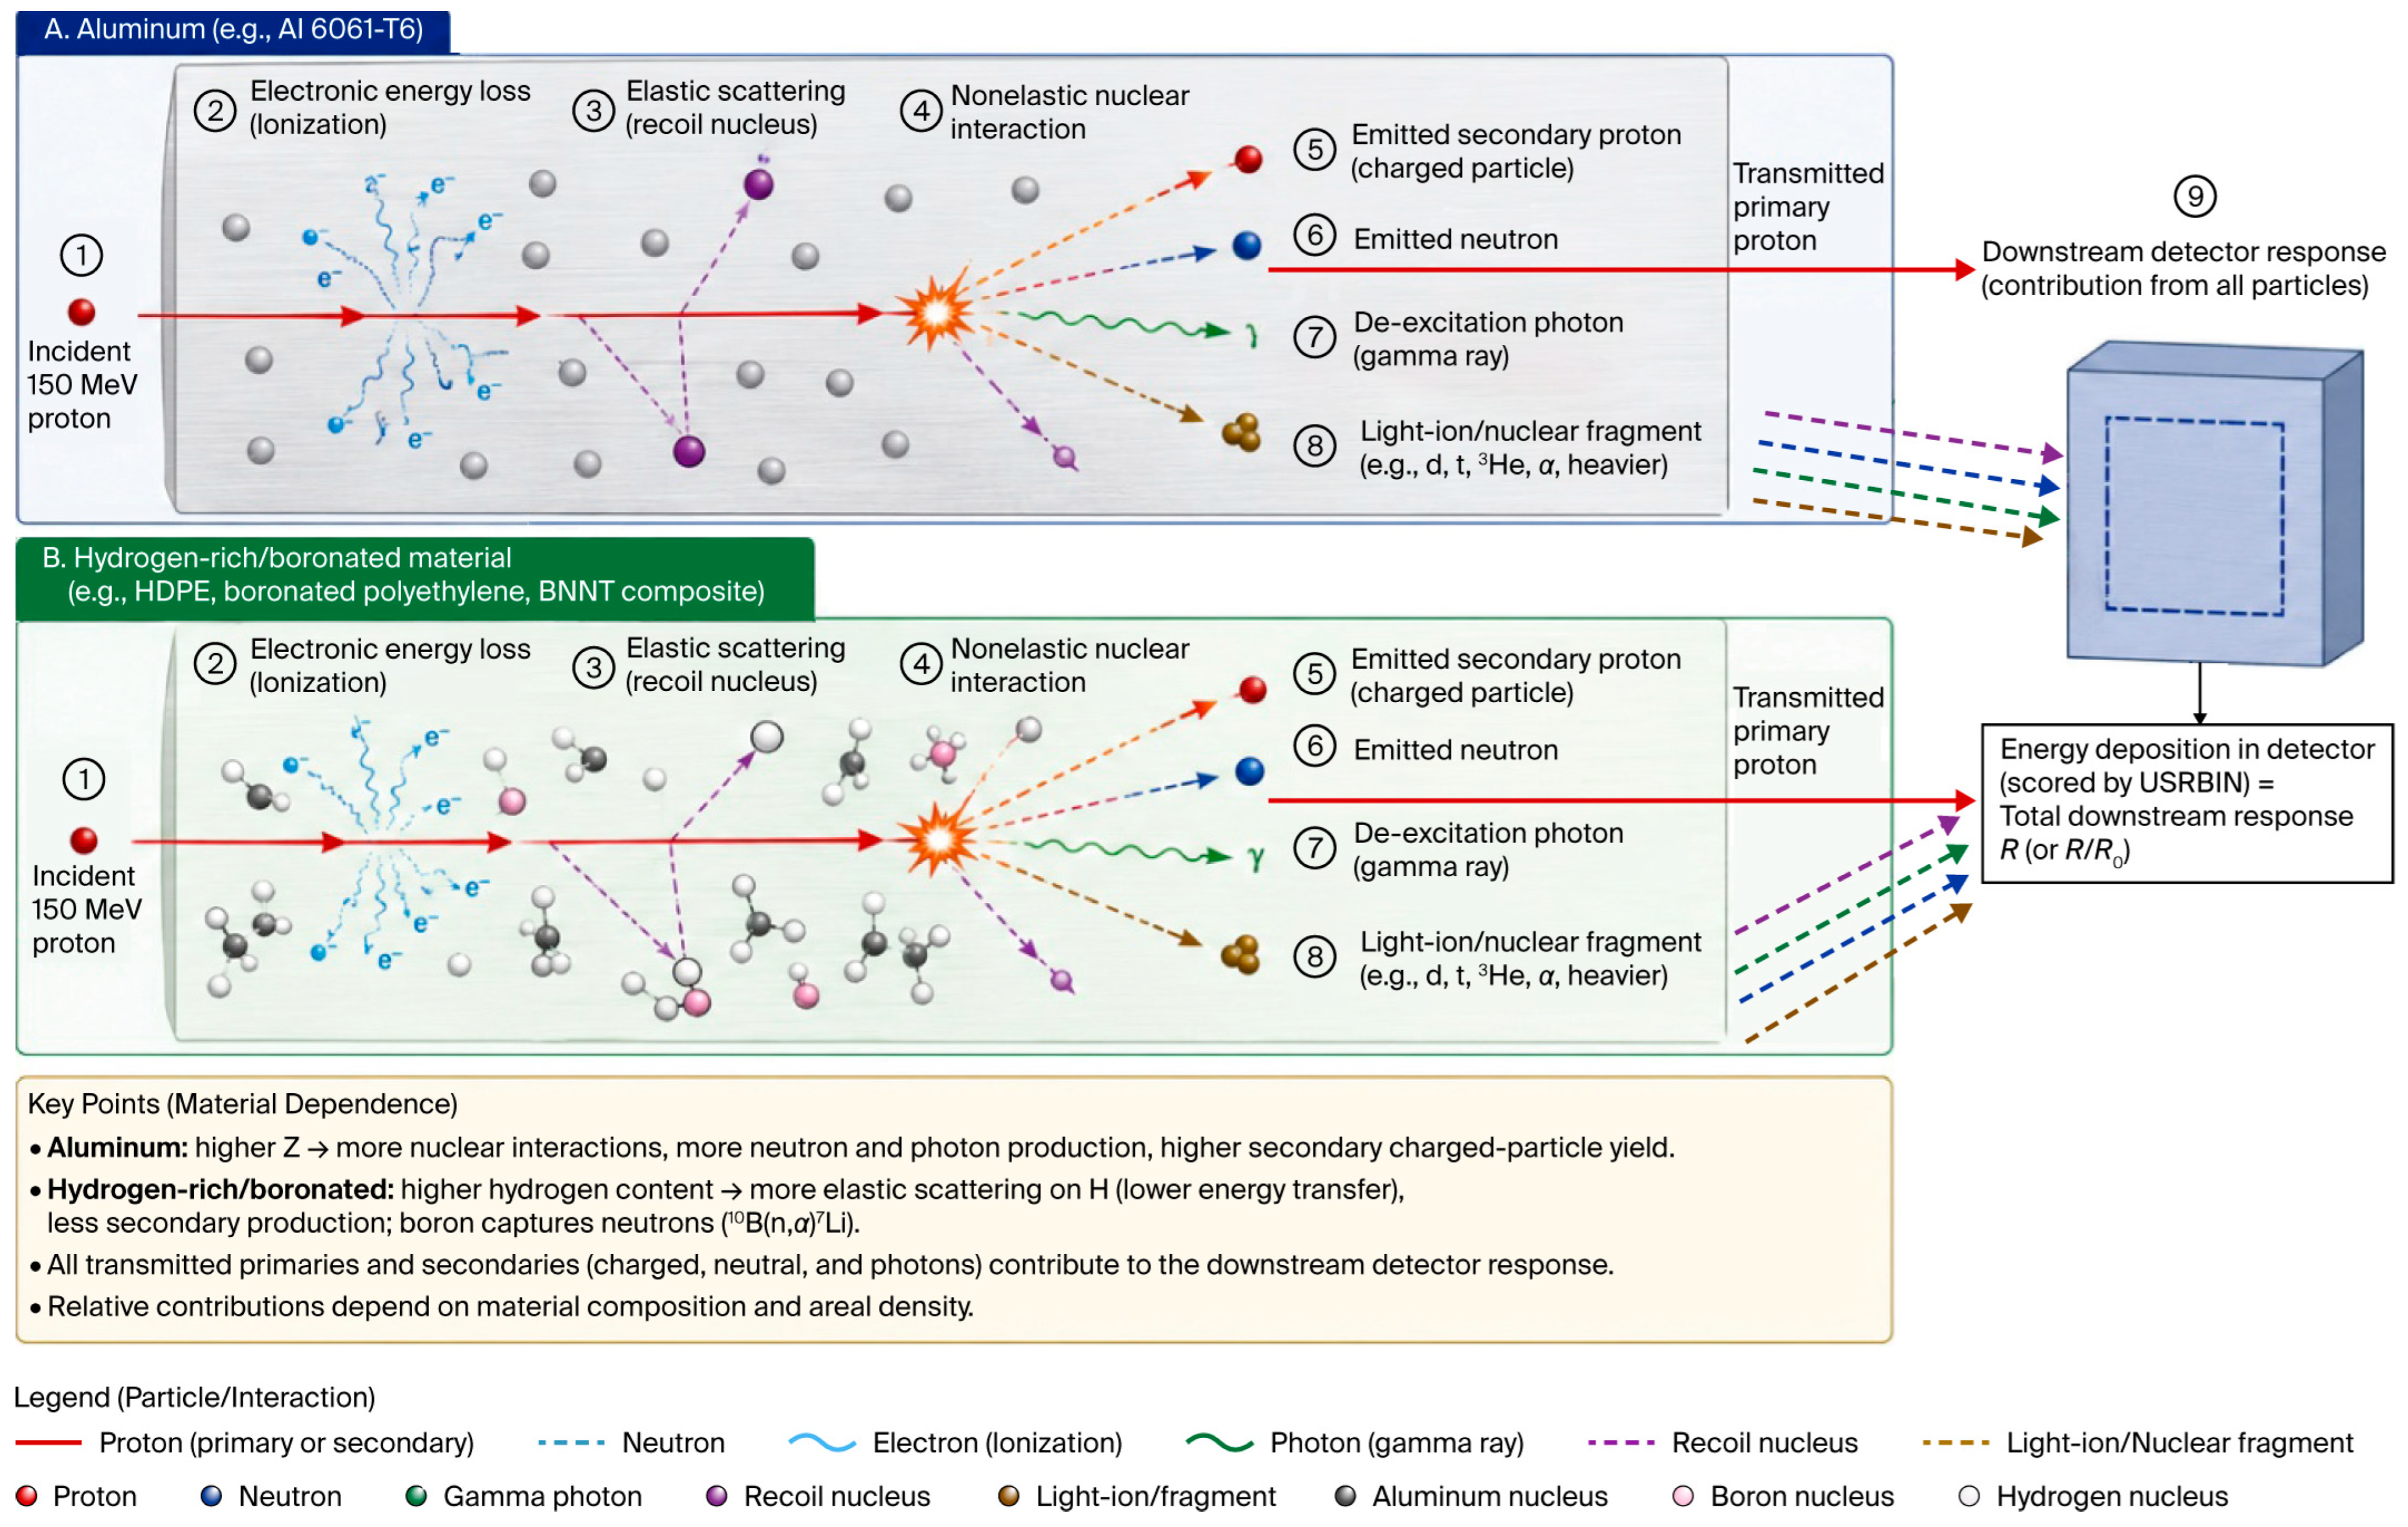
Experimental and FLUKA-predicted energy-dependent downstream detector response for the evaluated shielding materials. Differences among the materials reflect the combined influence of transmitted primary protons and secondary particles generated during proton transport. The silicon detector measures the integrated response to the mixed downstream particle field, and the physical mechanisms responsible for the observed trends are discussed with reference to the FLUKA transport model and illustrated conceptually in Figure 5.
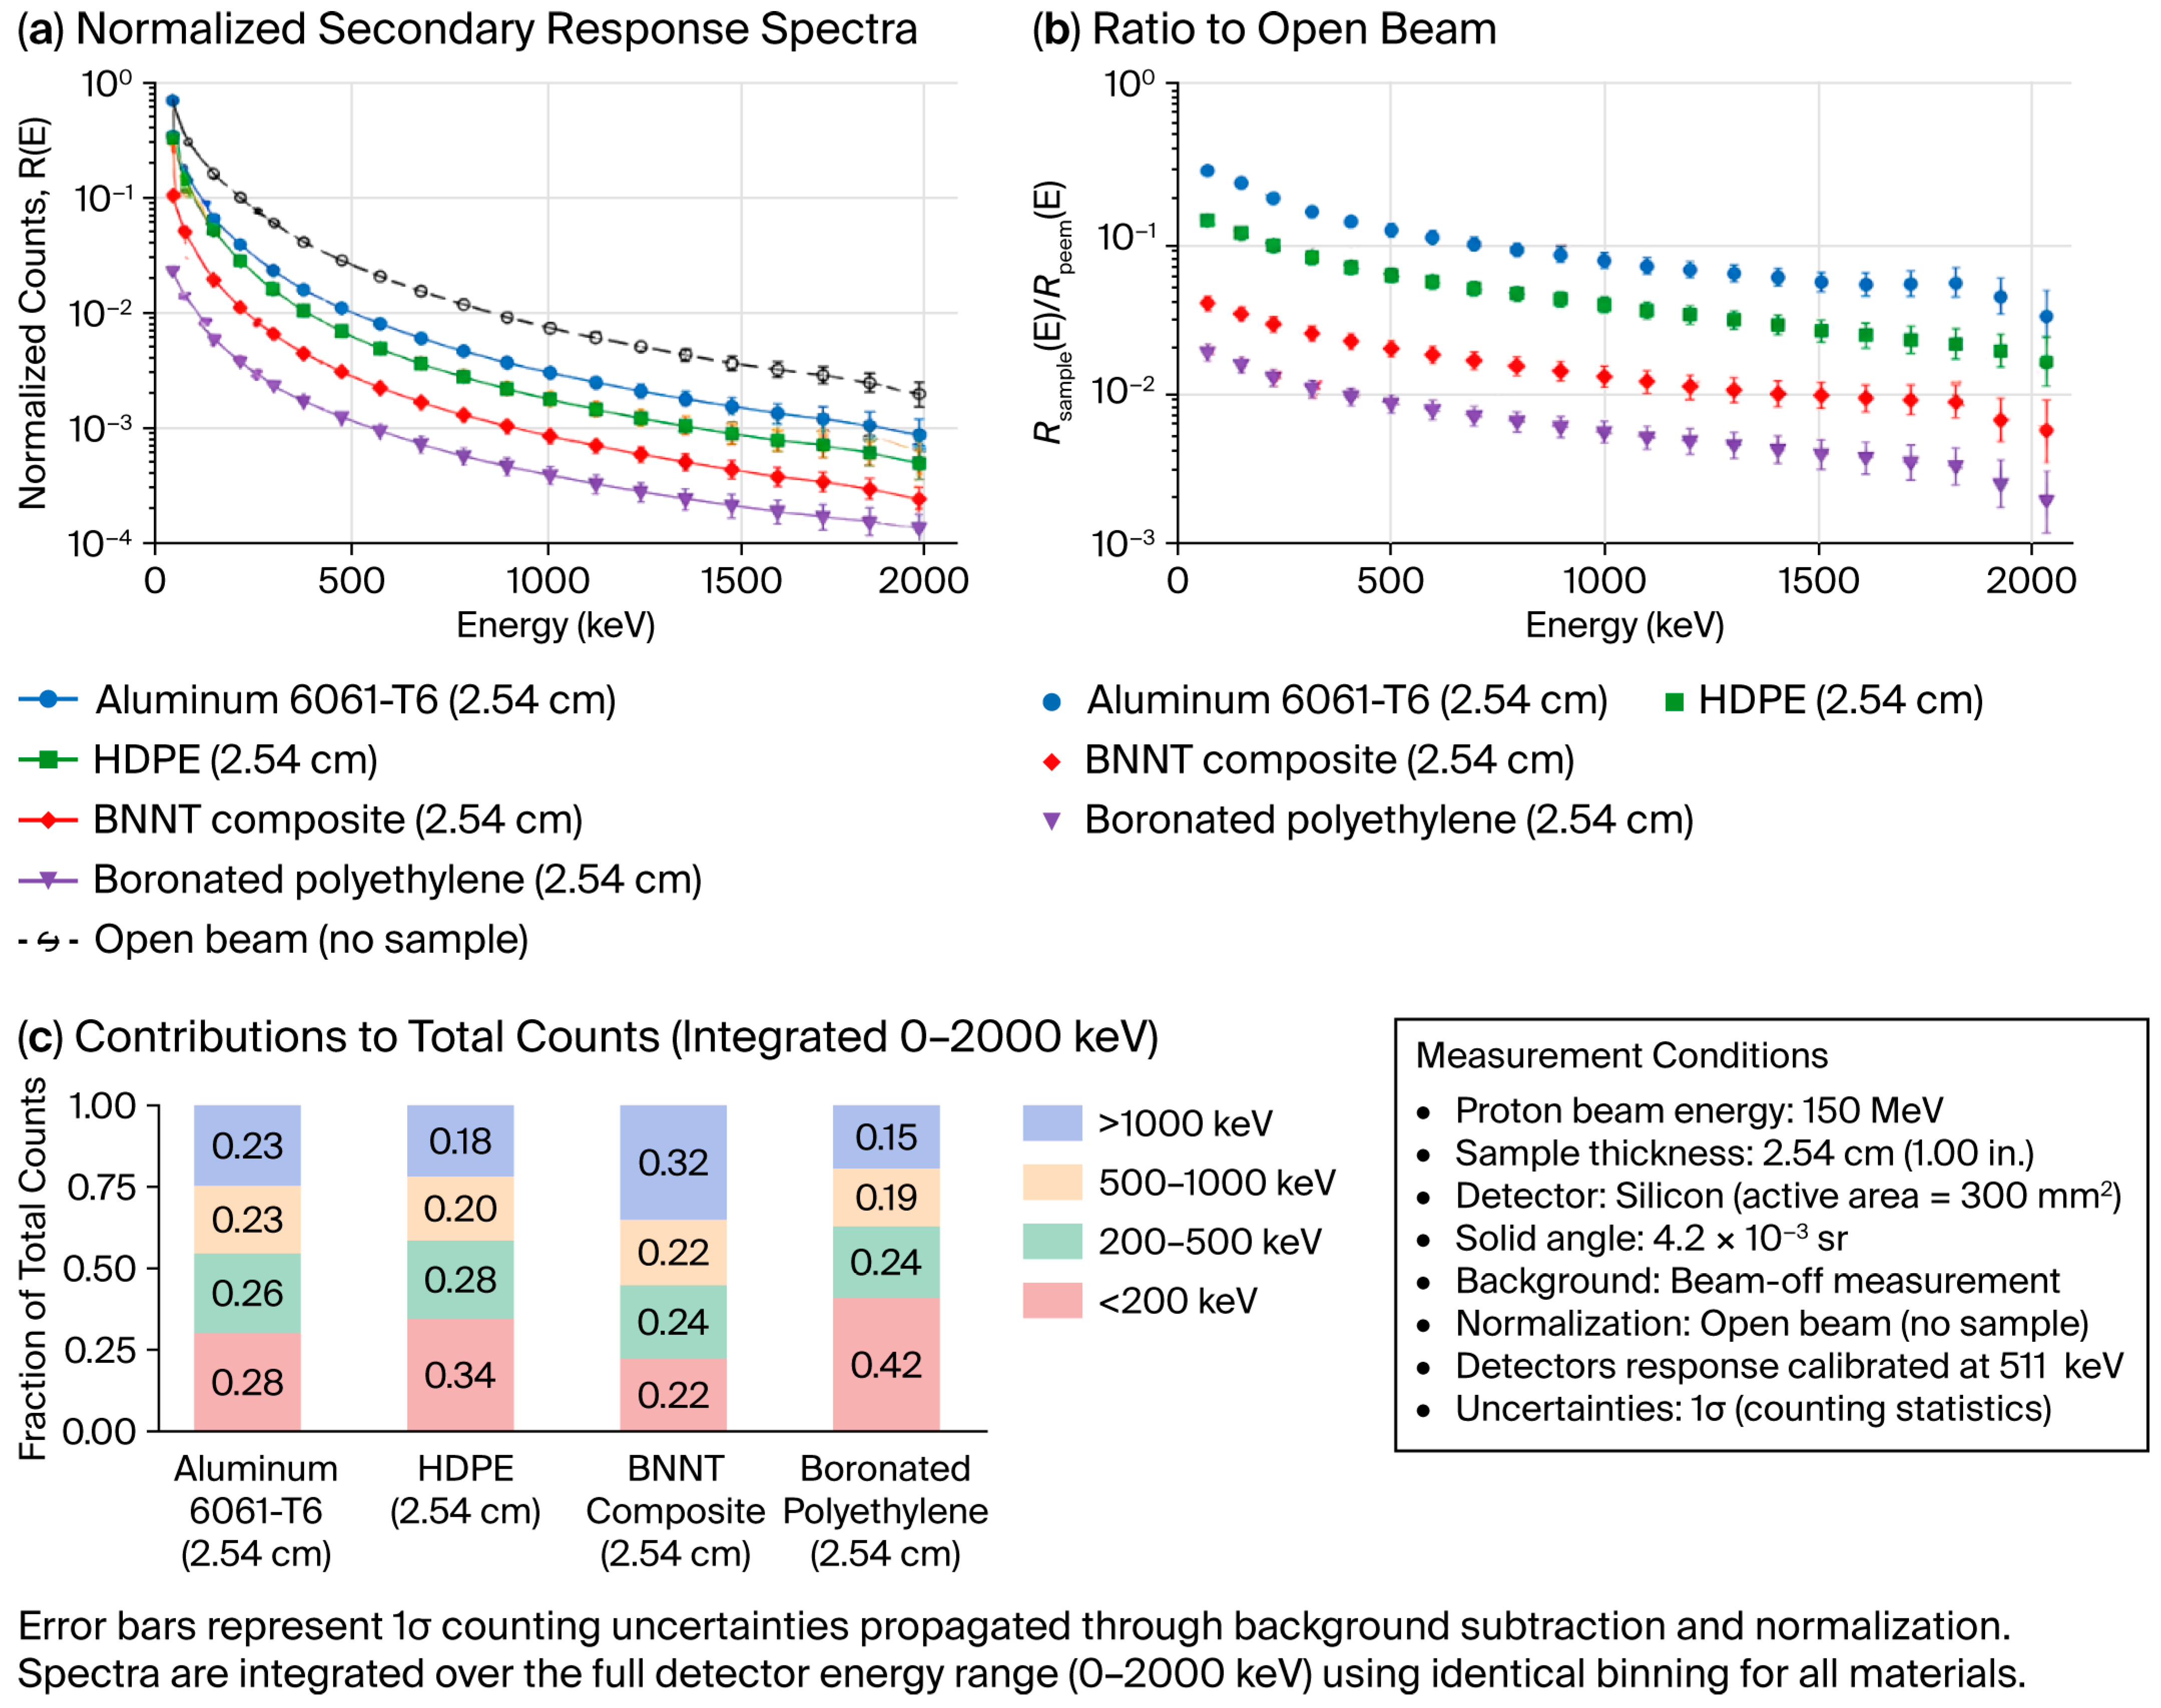
Figure 5.
Conceptual mechanisms of secondary-particle production and detector response during 150 MeV proton transport. Incident protons undergo electronic stopping, elastic scattering, and nonelastic nuclear interactions within the shielding material. The resulting transmitted primary protons, recoil nuclei, secondary charged particles, neutrons, and photons contribute to the downstream detector response in proportions that depend on material composition, atomic number, hydrogen content, boron content, and areal density. Red arrows indicate primary or secondary proton transport; dark-blue dashed arrows indicate neutrons; green wavy arrows indicate gamma photons; purple dashed arrows indicate recoil nuclei; brown dashed arrows indicate light ions or nuclear fragments; and light-blue wavy paths indicate electrons produced through ionization. All transmitted primary and secondary particle contributions are shown converging on the downstream silicon detector response. The diagram is conceptual and illustrates the principal interaction pathways represented by the FLUKA transport model; it is not a particle-resolved simulation output [13,14,15,16,17].
4. Discussion
4.1. Assessment of FLUKA Physics Fidelity
The comparison provides a direct test of FLUKA’s ability to reproduce proton transport and detector response across materially distinct shielding coupons. FLUKA reproduced the monotonic attenuation trend, the relative material ranking, and the principal differences in secondary response. Agreement within approximately ±5.1% and an aggregate RMSE of 0.035 indicate good predictive performance for the specific geometry, beam energy, scoring definition, and detector configuration.
The strongest agreement was obtained for HDPE and boronated polyethylene. These materials have comparatively homogeneous bulk compositions that can be represented using well-defined elemental fractions and densities. The resulting interaction pathways are dominated by proton energy loss, elastic scattering, and nuclear reactions in relatively low-atomic-number media, reducing uncertainty associated with microscale structural representation [6,7,8,9,10].
The greater deviations in the BNNT composite arise from its physical complexity. In this context, physical complexity includes heterogeneity in nanotube concentration, matrix composition, porosity, density gradients, reinforcement orientation, agglomeration, and interfaces between BNNT-rich and matrix-rich regions. A homogenized FLUKA material card preserves the average elemental composition but does not represent local variations in path length or interaction probability. Uncertainty in the BNNT mass fraction or matrix chemistry can therefore alter both attenuation and secondary production [11,12].
Aluminum 6061-T6 presents a different form of complexity. Its response is sensitive to alloy composition and to proton-induced nuclear processes that produce neutrons, recoil nuclei, photons, and charged fragments. Small differences in cross-section treatment, detector geometry, surrounding structures, or detector energy response can therefore produce a larger residual than in homogeneous hydrogen-rich polymers.
4.2. Secondary Radiation Mechanisms
Energetic protons lose energy in shielding through electronic stopping, elastic scattering, and nonelastic nuclear interactions. Electronic stopping transfers energy primarily to atomic electrons. Elastic nuclear scattering changes proton direction and transfers energy to recoil nuclei. Nonelastic reactions may generate secondary protons, neutrons, light ions, residual nuclei, and de-excitation photons. These products can reach the detector and contribute to the measured response even when the primary proton fluence is reduced.
Higher-atomic-number materials do not invariably produce a greater response under every condition, but they can generate a more consequential secondary field for a given spacecraft geometry and incident spectrum. In the present configuration, Aluminum 6061-T6 produced a larger downstream secondary signal than the hydrogen-rich materials. HDPE promotes energy loss through interactions with hydrogen and carbon, while boronated polyethylene combines hydrogen-rich slowing with boron-dependent interactions affecting portions of the secondary-neutron field [6,13,17].
The downstream detector response results from a combination of transmitted primary protons and secondary particles generated through electromagnetic and nuclear interactions within the shielding material. The principal interaction pathways represented by the FLUKA transport model are illustrated in Figure 5.
The initial conceptual graphic was generated using OpenAI ChatGPT Images 2.0 (accessed July 2026; exact internal model build not exposed) in accordance with the authors’ instructions and was subsequently critically reviewed, scientifically corrected, and approved by the authors. The prompt used is as follows: “Create a publication-quality conceptual scientific infographic comparing secondary-particle production during 150 MeV proton irradiation in: (A) Aluminum 6061-T6 and (B) hydrogen-rich or boron-containing materials, including HDPE, boronated polyethylene, and a BNNT composite. For each material class, show an incident 150 MeV proton undergoing electronic energy loss through ionization, elastic nuclear scattering with a recoil nucleus, and a nonelastic nuclear interaction. Show the possible transmitted primary proton and the production of a secondary proton, neutron, de-excitation gamma ray, light ion or nuclear fragment, and recoil nucleus. Show these primary and secondary contributions entering a downstream silicon detector and contributing collectively to the integrated detector response. Include a particle-and-interaction legend and concise material-dependent explanatory notes.”
4.3. Implications for Spacecraft Shielding Design
The results support the use of experimentally benchmarked FLUKA models for comparative material screening. The identical experimental and simulated material ranking indicates that the model can distinguish relative performance even when residual differences remain in the absolute response.
Hydrogen-rich and boron-containing materials produced lower downstream responses than the aluminum baseline under the tested conditions. This supports continued investigation of polymers and composites as multifunctional spacecraft materials. Recent composite research also highlights opportunities to combine radiation protection with structural, thermal, or electromagnetic-interference functions. Such functions remain physically distinct, and performance in one shielding domain should not be assumed to indicate performance in another [12].
The present results should not be interpreted as defining a universal spacecraft shielding ranking. Operational radiation environments include broad proton spectra, alpha particles, heavy ions, electrons, neutrons, and temporally variable solar events. Shielding performance may change with energy, particle species, geometry, and response metric. In particular, a material that minimizes silicon-detector response at 150 MeV may not minimize crew dose equivalent under a galactic cosmic ray field.
The principal design value of the present study is therefore methodological: it demonstrates how a controlled-beam benchmark can be used to establish confidence in transport-model predictions before the model is applied to more complex mission environments [2,3,4].
4.4. Limitations of the Single-Energy Benchmark
The monoenergetic 150 MeV proton condition isolates material-dependent transport behavior but does not reproduce the full operational space environment. The experiment does not directly validate FLUKA for broad solar particle spectra, galactic heavy ions, trapped electrons, mixed-field secondary transport, or vehicle-scale shielding geometries. The silicon-detector response is also not equivalent to human absorbed dose, dose equivalent, displacement damage, or single-event-effect probability.
The present benchmark therefore establishes model fidelity only for the tested particle, energy, material, geometry, and response definitions. Future work should repeat the methodology at multiple proton energies, include helium and representative heavy ions, use particle-resolved neutron and charged-fragment detectors, evaluate depth-dependent dose, and compare FLUKA with an independent general-purpose transport code [1,2,3,4].
5. Conclusions
This study experimentally benchmarked FLUKA predictions for four candidate spacecraft shielding materials exposed to a controlled 150 MeV proton beam. Unlike a purely computational material trade study, the investigation used matched experimental and numerical geometry, common open-beam normalization, secondary-response measurements, and quantitative uncertainty-based validation.
FLUKA reproduced the observed monotonic attenuation trends, material-dependent secondary-response behavior, and identical ranking of shielding performance. Experiment–simulation differences remained within approximately ±5.1%, with an overall RMSE of 0.035. The closest agreement was obtained for the comparatively homogeneous HDPE and boronated-polyethylene specimens. Larger residuals for the BNNT composite and Aluminum 6061-T6 were associated with different sources of physical complexity: heterogeneous composition and homogenized material representation for the BNNT composite, and greater sensitivity to nuclear secondary production for the aluminum alloy.
The central novelty of the study is the direct experimental quantification of FLUKA model fidelity across conventional metallic, hydrogen-rich, boron-containing, and nanocomposite shielding strategies under common proton-beam conditions. The results support FLUKA as a comparative screening and engineering trade study tool when material definitions, detector response, geometry, and uncertainty are treated explicitly.
The findings are limited to the tested 150 MeV proton condition and downstream silicon-detector response. They should not be extrapolated directly to complete mission dose or mixed-field performance without additional validation. Future studies should incorporate broader proton spectra, helium and heavy-ion beams, particle-resolved secondary measurements, depth–dose profiles, displacement damage metrics, multilayer configurations, and independent code-to-code comparisons.
Supplementary Materials
The following supporting information can be downloaded at: https://www.mdpi.com/article/10.3390/qubs10030021/s1. Figure S1: Experimental-to-simulation data-reduction and validation workflow. Experimental detector outputs are background-subtracted and normalized to corresponding open-beam measurements. FLUKA USRBIN detector-equivalent energy-deposition scores are independently normalized to the open-beam simulation. Experimental and simulated normalized responses are compared using relative percent difference, root-mean-square error, material-ranking and spectral-consistency checks, and combined standard uncertainty. MATLAB R2026a is used for data reduction, statistical analysis, uncertainty propagation, and preparation of the processed datasets. Table S1: Shielding coupon composition, supplier/location metadata, density, thickness, areal density, and manufacturing route used in the 150 MeV proton benchmark. Table S2: FLUKA transport configuration and software environment used for the benchmark model. Table S3: Uncertainty budget used to calculate the combined standard uncertainty for experiment–simulation comparison. Code S1: MATLAB script for data reduction, normalization, validation metrics, and uncertainty propagation. Code S2: MATLAB script for generating Figure 3 from the final processed normalized-response dataset. Code S3: MATLAB script for generating Figure 4 from the final processed secondary-response datasets. Code S4: MATLAB script for generating Figure S1. Data S1: Machine-readable shielding-material and coupon metadata. Data S2: Machine-readable FLUKA transport configuration and software-environment metadata. Data S3: Machine-readable uncertainty-budget values. Data S4: Data dictionary for the processed normalized-response dataset. Data S5: Data dictionary for the processed secondary-response spectral dataset. Data S6: Processed figure values. Prompt S1: Prompt used to prepare the conceptual experimental-configuration graphic in Figure 1. Prompt S2: Prompt used to prepare the conceptual FLAIR-style FLUKA geometry graphic in Figure 2. Prompt S3: Prompt used to prepare the conceptual secondary-particle interaction graphic in Figure 5.
Author Contributions
Conceptualization, C.J.B.; Methodology, C.J.B.; Validation, C.J.B. and S.J.S.; Investigation, C.J.B.; Resources, C.J.B.; Writing—original draft, C.J.B.; Writing—review and editing, S.J.S. All authors have read and agreed to the published version of the manuscript.
Funding
This research received no external funding.
Data Availability Statement
The original contributions presented in this study are included in the article/Supplementary Materials. Further inquiries can be directed to the corresponding author.
Acknowledgments
During preparation of this manuscript, OpenAI ChatGPT (GPT-5.5) was used solely as an editorial assistance tool to improve grammar and to assist in drafting conceptual engineering illustrations based on author-provided descriptions. All experimental methods, numerical models, simulations, data analyses, interpretations, figures containing scientific results, and conclusions were conceived, verified, critically reviewed, and approved by the authors. The authors accept full responsibility for the accuracy, originality, and integrity of all content presented in this manuscript.
Conflicts of Interest
The authors declare no conflicts of interest.
Abbreviations
The following abbreviations are used in this manuscript:
| Al | Aluminum |
| BNNT | Boron nitride nanotube |
| FLUKA | Monte Carlo particle transport code used for particle interaction and radiation transport simulations |
| GCR | Galactic cosmic ray |
| GUM | Guide to the Expression of Uncertainty in Measurement |
| HDPE | High-density polyethylene |
| MeV | Megaelectronvolt |
| NASA | National Aeronautics and Space Administration |
| NIST | National Institute of Standards and Technology |
| RMSE | Root-mean-square error |
| RSS | Root-sum-square |
| USRBIN | FLUKA three-dimensional scoring card used to calculate quantities such as energy deposition, particle fluence, or dose within user-defined volumetric bins |
References
- Benton, E.R.; Benton, E.V. Space radiation dosimetry in low-Earth orbit and beyond. Nucl. Instrum. Methods Phys. Res. Sect. B Beam Interact. Mater. At. 2001, 184, 255–294. [Google Scholar] [CrossRef] [Scilit] [PubMed]
- Durante, M.; Cucinotta, F.A. Physical basis of radiation protection in space travel. Rev. Mod. Phys. 2011, 83, 1245–1281. [Google Scholar] [CrossRef] [Scilit]
- Zeitlin, C.; Hassler, D.M.; Cucinotta, F.A.; Ehresmann, B.; Wimmer-Schweingruber, R.F.; Brinza, D.E.; Kang, S.; Weigle, G.; Böttcher, S.; Böhm, E.; et al. Measurements of energetic particle radiation in transit to Mars on the Mars Science Laboratory. Science 2013, 340, 1080–1084. [Google Scholar] [CrossRef] [Scilit] [PubMed]
- Hassler, D.M.; Zeitlin, C.; Wimmer-Schweingruber, R.F.; Ehresmann, B.; Rafkin, S.; Eigenbrode, J.L.; Brinza, D.E.; Weigle, G.; Böttcher, S.; Böhm, E.; et al. Mars’ surface radiation environment measured with the Mars Science Laboratory Curiosity rover. Science 2014, 343, 1244797. [Google Scholar] [CrossRef] [Scilit] [PubMed]
- Cucinotta, F.A.; Durante, M. Cancer risk from exposure to galactic cosmic rays: Implications for space exploration by human beings. Lancet Oncol. 2006, 7, 431–435. [Google Scholar] [CrossRef] [Scilit] [PubMed]
- Toto, E.; Lambertini, L.; Laurenzi, S.; Santonicola, M.G. Recent advances and challenges in polymer-based materials for space radiation shielding. Polymers 2024, 16, 382. [Google Scholar] [CrossRef] [Scilit] [PubMed]
- Guetersloh, S.; Zeitlin, C.; Heilbronn, L.; Miller, J.; Komiyama, T.; Fukumura, A.; Iwata, Y.; Murakami, T.; Bhattacharya, M. Polyethylene as a radiation shielding standard in simulated cosmic-ray environments. Nucl. Instrum. Methods Phys. Res. Sect. B Beam Interact. Mater. At. 2006, 252, 319–332. [Google Scholar] [CrossRef] [Scilit]
- Zeitlin, C.; Guetersloh, S.B.; Heilbronn, L.H.; Miller, J. Measurements of materials shielding properties with 1 GeV/nuc 56Fe. Nucl. Instrum. Methods Phys. Res. Sect. B Beam Interact. Mater. At. 2006, 252, 308–318. [Google Scholar] [CrossRef] [Scilit]
- Narici, L.; Casolino, M.; Di Fino, L.; Larosa, M.; Picozza, P.; Rizzo, A.; Zaconte, V. Performances of Kevlar and polyethylene as radiation shielding on-board the International Space Station in the high-latitude radiation environment. Sci. Rep. 2017, 7, 1644. [Google Scholar] [CrossRef] [Scilit] [PubMed]
- Thibeault, S.A.; Fay, C.C.; Lowther, S.E.; Earle, K.D. Radiation Shielding Materials Containing Hydrogen, Boron, and Nitrogen: Systematic Computational and Experimental Study; NASA Institute for Advanced Concepts: Washington, DC, USA, 2012.
- Patel, P.B.; Joseph, N.; Sharma, S.; Rogers, A.; Kalfon-Cohen, E.; Kessler, S.; Park, C.; Wiesner, V.L.; Wardle, B.L. Aligned Boron Nitride Nanotube Reinforced Polyethylene Nanocomposite for Space Radiation Shielding; NASA Technical Reports Server: Washington, DC, USA, 2025; Document ID 20250000962.
- Guo, X.; Liang, D.; Li, Y.; Zhang, H.; Zheng, N.; Zhang, Y.; Zhao, T.; Zhang, Q.; Yin, M.; Zhao, Z.; et al. Orientation-tunable electromagnetic interference shielding in carbon fiber-based composites with semi-empirical modeling of anisotropic charge transport. Carbon 2026, 252, 121400. [Google Scholar] [CrossRef] [Scilit]
- Andersen, V.; Ballarini, F.; Battistoni, G.; Campanella, M.; Carboni, M.; Cerutti, F.; Empl, A.; Fassò, A.; Ferrari, A.; Gadioli, E.; et al. The FLUKA code for space applications: Recent developments. Adv. Space Res. 2004, 34, 1302–1310. [Google Scholar] [CrossRef] [Scilit] [PubMed]
- Ferrari, A.; Sala, P.R.; Fassò, A.; Ranft, J. FLUKA: A Multi-Particle Transport Code; CERN-Library: Geneva, Switzerland, 2005; CERN-2005-10; INFN/TC_05/11; SLAC-R-773. [Google Scholar]
- Böhlen, T.; Cerutti, F.; Chin, M.; Fassò, A.; Ferrari, A.; Ortega, P.; Mairani, A.; Sala, P.; Smirnov, G.; Vlachoudis, V. The FLUKA code: Developments and challenges for high energy and medical applications. Nucl. Data Sheets 2014, 120, 211–214. [Google Scholar] [CrossRef] [Scilit]
- Battistoni, G.; Boehlen, T.; Cerutti, F.; Chin, P.W.; Esposito, L.S.; Fassò, A.; Ferrari, A.; Lechner, A.; Empl, A.; Mairani, A.; et al. Overview of the FLUKA code. Ann. Nucl. Energy 2015, 82, 10–18. [Google Scholar] [CrossRef] [Scilit]
- Ballarini, F.; Batkov, K.; Battistoni, G.; Bisogni, M.; Böhlen, T.; Campanella, M.; Carante, M.; Chen, D.; De Gregorio, A.; Degtiarenko, P.; et al. The FLUKA code: Overview and new developments. EPJ Nucl. Sci. Technol. 2024, 10, 16. [Google Scholar] [CrossRef] [Scilit] [PubMed]
- Ahdida, C.; Bozzato, D.; Calzolari, D.; Cerutti, F.; Charitonidis, N.; Cimmino, A.; Coronetti, A.; D’aLessandro, G.L.; Servelle, A.D.; Esposito, L.S.; et al. New capabilities of the FLUKA multi-purpose code. Front. Phys. 2022, 9, 788253. [Google Scholar] [CrossRef] [Scilit]
- Ramos, R.L.; Carante, M.P.; Ferrari, A.; Sala, P.; Vercesi, V.; Ballarini, F. A mission to Mars: Prediction of GCR doses and comparison with astronaut dose limits. Int. J. Mol. Sci. 2023, 24, 2328. [Google Scholar] [CrossRef] [Scilit] [PubMed]
- Vlachoudis, V. FLAIR: A powerful but user-friendly graphical interface for FLUKA. In Proceedings of the International Conference on Mathematics, Computational Methods & Reactor Physics, Saratoga Springs, NY, USA, 3–7 May 2009. [Google Scholar]
- JCGM 100:2008; Evaluation of Measurement Data—Guide to the Expression of Uncertainty in Measurement (GUM). Joint Committee for Guides in Metrology: Sèvres, France, 2008.
- Luoni, F.; Weber, U.; Lang, A.K.; Westermayer, M.; Horst, F.; Baricco, M.; Bocchini, L.; Giraudo, M.; Santin, G.; Schuy, C.; et al. Dose build-up of high-energy 1H and 4He ions in standard, innovative and in situ shielding materials for space radiation: Measurements and simulations. Radiat. Res. 2025, 203, 163–174. [Google Scholar] [CrossRef] [Scilit] [PubMed]

Disclaimer/Publisher’s Note: The statements, opinions and data contained in all publications are solely those of the individual author(s) and contributor(s) and not of MDPI and/or the editor(s). MDPI and/or the editor(s) disclaim responsibility for any injury to people or property resulting from any ideas, methods, instructions or products referred to in the content. |
© 2026 by the authors. Licensee MDPI, Basel, Switzerland. This article is an open access article distributed under the terms and conditions of the Creative Commons Attribution (CC BY) license.