


Abstract
Climate risk assessments for critical infrastructure are essential to identifying and predicting vulnerabilities early in the asset life cycle, enabling proactive mitigation through the implementation of technical and nature-based solutions (NbS) before impacts occur. However, such assessments often rely on dense quantitative indices that are difficult for non-technical stakeholders to interpret. To address this challenge, this paper presents an open-source decision support platform that combines OpenStreetMap site characterization, qualitative pre-screening, a quantitative IPCC AR6-aligned risk chain, and a downstream NbS recommendation layer. The approach deploys Large Language Models (LLMs) to translate analytical outputs into accessible narrative explanations. End-to-end site-characterization processing across three European demonstration sites took between 29 and 70 s. An exploratory ablation study investigated the faithfulness of the AI-generated explanations using three complementary metrics, demonstrating that the generated hazard assessments remained factually grounded and free from fabricated numerical values. Introducing example reports (exemplars) into the prompt context further stabilized the reliability of the output for complex risk indicators. Finally, a small blind expert evaluation with six researchers from adjacent technical domains provided convergent evidence: five of six raters independently rated with-exemplar Hazard Reports higher on completeness; among the five raters who expressed a directional preference, all five favored the with-exemplar condition (sign test, p = 0.031). Furthermore, seven of eight aggregate dimension-level comparisons confirmed that with-exemplar reports scored at least as high as their ablated counterparts.
1. Introduction
The frequency and severity of extreme weather events driven by climate change are escalating and placing unprecedented stress on critical infrastructure systems, including transportation networks, port facilities, energy grids, and hydraulic structures. The IPCC’s Sixth Assessment Report (AR6) [1] frames risk in terms of three interacting drivers, namely, hazard, exposure, and vulnerability. This framework establishes a robust scientific foundation for conducting infrastructure risk assessments. Despite this clear framework, creating tools that practitioners can easily use is a major challenge, as many existing climate risk decision support tools (DSTs) demand advanced technical skills. Several recent studies have proposed frameworks for climate adaptation and resilience assessment of infrastructure systems [2,3,4]. Nevertheless, non-experts often struggle to understand and apply the results. This was confirmed by Šedov’a et al. [5] in their recent 2024 review, where they identified communication of uncertainty as one of the main gaps in existing climate risk assessment tools. This is not a technical challenge, as the data layers required for an open-access alternative are nowadays available. OpenStreetMap (OSM) offers flexible, on-demand access to infrastructure data while being license-free, while European climate projection model suites such as EURO-CORDEX provide spatially consistent climate projections aligned with Representative Concentration Pathways (RCPs) across the continent [6]. By merging these datasets, it is possible to build intuitive interfaces for climate risk screening. Yet, developing a unified, reproducible platform that non-specialists can operate fluidly remains a challenge.
To mitigate these growing climate risks, nature-based solutions (NbS) have gained particular popularity as a mitigation strategy. Institutions such as IUCN [7], the World Bank [8], and the European Commission [9] have highlighted the role of NbS as cost-effective reinforcements, and in some cases alternatives, to conventional grey infrastructure, especially for hazards such as flooding, erosion, and landslides. Embedding NbS options within the risk assessment step itself, rather than scheduling them as a follow-on activity, could shorten the distance between identifying a problem and implementing a response. Despite their potential for disaster risk reduction, quantitative risk models have largely not been extended to incorporate NbS, and published work on spatial tools or software systems for deploying them at scale remains limited [10,11]. Researchers working on climate services have framed a related difficulty: even technically robust tools tend to fall short of actual use when their outputs are expressed in terms that practitioners cannot readily trust or act on [12,13]. Bridging that gap requires not just a strong computational backend, but an interpretation layer that turns index scores into contextually grounded narratives. Historically, that interpretation has only been delivered through manual expert reporting, at high cost and low scalability.
Recent advances in large language models (LLMs) open a new route to that interpretation layer: automated generation of natural-language reports from structured quantitative data. LLMs are being applied across different fields of science to generate context-aware summaries, answer domain-specific questions, and automate structured research narratives [14]. Yet, trusting LLMs with high-stakes infrastructure decisions brings a major complication [15]. These models might “hallucinate” and generate content that is plausible but factually unsupported [16,17]. Since this specific workflow relies on strict numerical indices to justify physical engineering interventions, any deviation from the raw data fatally compromises the tool. To mitigate this problem, several solutions have been proposed, including retrieval-augmented generation [18], chain-of-thought prompting [19], and in-context learning with worked exemplars [14,20].
Only a handful of recent projects have attempted to ground LLMs specifically in climate contexts, and their objectives differ sharply from the approach proposed here. ChatClimate [21], for example, anchors a chat interface in the IPCC AR6 corpus. It functions as an exploratory dialogue tool for climate science, which is functionally distinct from the goal of translating structured risk metrics into standardized practitioner reports. Another effort, CHATREPORT [22], targets corporate environmental, social, and governance (ESG) reporting. It extracts answers from sustainability documents based on templates from the Task Force on Climate-related Financial Disclosures (TCFD), focusing strictly on document-level analysis rather than data-to-text generation. The present work is also explicitly distinguished from ClimateBert [23]. Because ClimateBert operates as a domain-specific encoder, researchers use it primarily to classify claims or analyze sentiment, rather than to generate cohesive, readable narratives from scratch. The present work occupies a different point in this design space: it does not retrieve from a document corpus, and it does not classify text. Instead, it translates a small, highly structured input table of quantitative risk indices into a stakeholder-facing narrative through one-shot in-context learning, with the input data itself acting as the grounding source. To the authors’ knowledge, the systematic integration of LLM-generated narrative into a chained, index-driven climate risk assessment, together with a controlled ablation of the contribution of system instructions versus embedded exemplars, has not previously been reported in this domain (see Table 1).
Table 1.
Comparison of the proposed Grounded Reporting Framework (GRF) with adjacent LLM-in-climate systems on four design dimensions (target task, input modality, grounding strategy, and target audience). The contrast highlights that the design problem solved here, namely translating structured tabular inputs from an analytical chain into stakeholder-facing narratives under explicit grounding constraints, is not addressed by existing systems.
This paper addresses the interpretation and communication gap within the context of an end-to-end decision support platform developed by the authors. The platform, briefly described in Section 2.1, integrates polygon-based site characterization (OSM extraction plus Köppen-Geiger sampling), a qualitative perceived-risk workflow, and a quantitative IPCC AR6-aligned risk-assessment chain whose outputs feed a downstream nature-based solution recommendation engine. A Grounded Reporting Framework (GRF) is applied across each workflow’s analytical outputs, using one-shot in-context learning to translate quantitative results into stakeholder-facing narratives. The platform is introduced here solely as the deployment context for the methodological contribution; only the aspects directly relevant to the GRF are described, and the platform’s full capabilities are not evaluated in this paper.
The evaluation is organized around two research questions, examined in a single representative dam-infrastructure case as a first step toward broader infrastructure coverage:
- What does the embedded reference exemplar contribute to the faithfulness of generated reports, over and above the strict-protocol system instruction alone? This question is addressed under three complementary faithfulness metrics: a deterministic numeric token detector, sentence-level natural language inference against the input table, and an LLM-as-judge claim decomposition.
- Does the prompt pattern behave consistently across model families, so that the framework remains portable as the underlying LLM is updated or replaced? This question is addressed by replicating the experiment across three model families (Gemini 2.5 Flash Lite, Llama 3.1 8B Instruct, and GPT-5.4 mini) and comparing the direction of effects.
The empirical results provide preliminary evidence of the framework’s directional behavior under these two questions. The contributions of this paper are:
- A Grounded Reporting Framework that transforms structured analytical outputs from the platform’s workflow (OSM element counts and tags, Köppen-Geiger climate codes, and quantitative hazard/exposure/vulnerability indices) into stakeholder-facing narratives through a one-shot in-context learning pattern. The pattern combines strict-protocol system instructions with embedded reference exemplars, i.e., an example input table paired with an expert-written reference report, which is included in every prompt to demonstrate the desired output structure to the language model.
- A multi-metric faithfulness evaluation methodology for assessing the reliability of LLM-generated climate-risk reports, combining a deterministic numeric token detector with sentence-level NLI and an LLM-as-judge claim decomposition.
- A cross-model evaluation showing the directional consistency of the reporting framework across three LLM families, accompanied by the observation that judge-based support rates are sensitive to the choice of judging model.
- A small blind expert evaluation with six researchers from adjacent technical domains that provides convergent rater evidence for the exemplar’s contribution to report quality, most strongly on completeness for the Hazard Report.
The ablation results are framed throughout as exploratory empirical evidence rather than as established findings, and the limitations of the present evaluation, including the use of a single case study and the small scale of the expert evaluation, are discussed in Section 4.3.
The paper is structured as follows: Section 2 describes the workflow components and the evaluation methodology. Section 3 depicts the functional demonstration on three European case-study locations (Rotterdam Maasvlakte, Athens, Innsbruck-Brenner), while focusing on performance latency, the ablation study under three faithfulness metrics, and the cross-model replication on Llama 3.1 8B. Section 4 discusses methodological implications, practical relevance, and limitations; Section 5 presents the conclusions.
2. Methodology
This work is motivated by the need to effectively assess climate risks at critical infrastructure sites. Rather than a single question, an operator approaching such an assessment faces a set of largely independent analytical stages, which the platform exposes as three self-contained tools (Section 2.1) that can be used separately or in combination. Site delineation and infrastructure cataloging are performed by a geospatial extraction workflow (Section 2.2). Structured expert judgment on the qualitative risk profile is captured by a preparatory-screening tool. A separate quantitative workflow (Section 2.3) calculates hazard, exposure, and vulnerability indices and forms a composite potential risk score. Downstream, these quantified risks are mapped against available nature-based and technical solutions to identify effective mitigation strategies. Each of the three tools can be used independently: an operator does not need to complete one before starting the next, and the results of any single tool are informative on their own.
Each stage relies on distinct input types. Site delineation requires the ability to define an area of interest, since infrastructure portfolios do not always align with administrative boundaries. Infrastructure identification requires an open, queryable source of feature data with consistent European coverage. Climate framing requires a global classification reference so that the user can understand the climate regime of the chosen site before analyzing specific climate projections. Preparatory screening requires a structured way to capture expert opinion in a reproducible form. Quantitative evaluation requires access to projected climate indicators under standardized scenarios and time horizons, together with a transparent index-construction methodology. Adaptation choice requires a curated catalog of nature-based solutions linked to the hazards each is designed to mitigate. Across all of these steps, communicating the resulting analysis to non-technical stakeholders requires a layer that translates numerical indices and categorical codes into narrative form, since the audience for an infrastructure adaptation decision typically extends beyond the analyst who produced the indices.
These requirements dictate the design choices of the platform described below. The assessment boundary is established by manually delineating a custom polygon directly onto the platform’s mapping interface, directly establishing the spatial boundary as a system input. Infrastructure features are retrieved from OpenStreetMap through the Overpass API at query time, ensuring license-compliant, on-demand coverage of the European study area while eliminating the maintenance overhead of bundled datasets. Climate framing is provided by sampling the Köppen-Geiger 1991–2020 baseline raster [24] at the polygon centroid, which yields a compact climate-zone code (e.g., Cfb, Csa, or Dfb) suitable for inclusion in downstream narrative reports. Structured expert judgment is captured by a qualitative Level 1 perceived-risk module that records hazard scoring through guided indicators. Quantitative evaluation is performed by a Level 2 risk-assessment chain that consumes projected climate indicators retrieved at runtime from the project’s Climate-Indices-Visualization API (https://github.com/NATURE-DEMO/clima-ind-viz, accessed on 24 May 2026), which serves native EURO-CORDEX climate projections [6] on the EUR-11 grid. A nature-based solution recommendation engine consumes the Level 1 and Level 2 outputs to rank candidate solutions by their projected risk-reduction potential. The interpretation layer that connects all of these analytical outputs to a non-technical audience is the Grounded Reporting Framework (GRF), introduced in Section 2.4, which forms the core of the methodological evaluation reported later in this paper. The remainder of this section is organized in the order in which an operator encounters the workflow. Section 2.1 introduces the three analytical tools that implement the decision chain. Section 2.2 details the polygon-based site-characterization pipeline. Section 2.3 describes the Level 2 quantitative risk-assessment chain. Section 2.4 introduces the Grounded Reporting Framework that produces the narrative reports. Section 2.5 sets out the evaluation methodology, detailing the experimental execution against the deployed system.
2.1. Decision Support Tool: Workflow Overview
The Decision Support Tool (DST) developed for the NATURE-DEMO project is an open-source web platform that exposes the decision chain described above through a single point-and-click interface, deployed and publicly accessible across the EURO-CORDEX domain [6]. Figure 1 presents a simplified conceptual overview of the Custom Site Analysis environment, which integrates three distinct analytical modules under a unified interface and a shared reporting architecture.
Figure 1.
Simplified architecture of the Custom Site Analysis interface, showing the three independent analytical tools and the shared reporting layer. The top tier illustrates the polygon-based site-characterization workflow that supports site selection and infrastructure identification. The middle tier represents the qualitative Level 1 preparatory screening. The third tier outlines the quantitative Level 2 risk-assessment chain. The Grounded Reporting Framework, shown as the bottom horizontal layer, translates the analytical outputs of each tier into stakeholder-facing narrative reports through a shared one-shot prompting pattern.
The first tool, Extraction · Mapping & Data (top tier of Figure 1), implements the site-selection and infrastructure-identification steps of the decision chain described in Section 2. It facilitates the geospatial data retrieval process for the selected site. The user draws an arbitrary polygon on an interactive map, selects the infrastructure categories of interest, and receives a tabulated inventory of OpenStreetMap features within the polygon along with the Köppen-Geiger climate zone sampled at the polygon centroid. The underlying Large Language Model (Gemini AI) subsequently synthesizes this structured data into a cohesive narrative report, transforming raw geospatial extractions into a clear situational picture of the environment.
The second tool, Level 1 · Perceived Risks [25] (middle tier of Figure 1), implements the preparatory-screening step of the decision chain. It captures expert opinion on infrastructure risk through structured indicators and produces a narrative perceived-risk report. The qualitative screening logic of this tool is mentioned here for completeness; it is not evaluated further in this paper.
The third tool, Level 2 · Technical Analysis [26] (third tier of Figure 1), implements the quantitative-evaluation step of the decision chain. The user enters infrastructure-hazard pairings together with the climate-projection settings (RCP scenario and time horizon), and the tool retrieves the corresponding climate indicator from the Climate-Indices-Visualization API, computes the Hazard, Exposure, Vulnerability, and Potential Risk Indices, and produces two narrative reports: a Hazard Report that interprets the hazard table, and a PRI Assessment Report that interprets the integrated risk table. The outputs of this module feed the downstream nature-based solution recommendation engine.
The three tools are architecturally independent. The sole data point that crosses module boundaries is the polygon centroid produced by the first tool, which the user can optionally reuse as the location input for the climate-indicator retrieval performed by the third tool. This independence is a deliberate design choice: it allows an analyst to enter the workflow at any level depending on what is already known about the site, rather than forcing a fixed top-down sequence.
2.2. Polygon-Based Site Characterization
Site selection and infrastructure identification are managed via a polygon-based extraction pipeline. The assessed region is defined by manually tracing a custom shape on an interactive map, a method that avoids reliance on predefined administrative borders. The use of a hand-drawn polygon, rather than a pre-defined boundary, allows the assessed area to follow the actual extent of an infrastructure asset, such as a port complex, a railway corridor, or a dam catchment, instead of an unrelated municipal or regional outline.
The infrastructure categories of interest, such as roads, railways, bridges, or tunnels, are designated at query time via a chip-based interface toolbar; Figure 2 illustrates the full extraction workflow in detail. Each category label is mapped to one or more underlying OpenStreetMap tag values (e.g., the Roads category resolves to a small set of highway=* values such as motorway, primary, and secondary), and these mappings function as internal constraints within the Overpass query itself. Retrieval is limited strictly to relevant elements, rendering post-query classification unnecessary. The closed spatial geometry is then dispatched to the Overpass API as a single request, capturing only the categorized elements located within the drawn footprint.
Figure 2.
Polygon-based extraction in detail (Innsbruck case study, INN, Section 3.1). (a) The user draws a polygon over the area of interest after selecting infrastructure categories from the chip toolbar. (b) The polygon vertices are translated into an Overpass QL filter; an example query for the four selected categories is shown after the first occurrence to preserve readability. (c) The returned elements are tabulated and aggregated by category (the Bridges section is omitted for compactness; the same tabular format applies). (d) The polygon centroid is sampled against the Köppen-Geiger raster to obtain the climate class, here Dfb (cold without dry season, warm summer).
The polygon centroid and area are computed on a WGS84 sphere rather than on a flat projection. This approach mitigates area distortion: deployments across the EURO-CORDEX domain span approximately 35° to 70° N, and the distortion induced by a single planar projection at the upper end of that range is large enough to affect the element-density figures reported alongside the OSM extraction. Centroid computation on the sphere also avoids the discontinuities that would arise if the platform had to switch projections between sites at different latitudes. The centroid is then sampled against the Köppen-Geiger climate-classification map of [24], used at its 0.1° (∼11 km) resolution, which is sufficient for the single-point centroid sampling performed here, to extract the site’s climate-zone code. The polygon area is computed by spherical excess and reported alongside the OpenStreetMap element counts. The extracted element counts, the polygon area, and the climate-zone code together constitute the structured input that the reporting layer translates into a narrative Geographical Context report and a climate interpretation report.
2.3. Quantitative Risk-Assessment Chain
Quantitative risk evaluation is the role of the Level 2 module, which follows the multi-level framework of the parent project [26]. The user begins by selecting one or more impact models from a curated catalog. Each impact model describes a specific combination of infrastructure asset, climate hazard, and resulting consequence (e.g., “track buckling due to extreme heat” on a railway, or “embankment instability due to heavy precipitation” on a road) and carries with it a pre-attached EURO-CORDEX climate indicator that quantifies the relevant climate driver. The user therefore composes the assessment by choosing what to study, not by choosing how to measure it; the indicator-to-impact mapping is fixed in the catalog so that the same hazard is always characterized by the same climate variable across assessments.
Once the scope is composed, four indices are computed in sequence for each selected impact model. The Hazard Index (HI) is an ordinal value ranging from 1–5 derived from the climate indicator attached to that impact model. For each row of the user’s scope table, the platform issues a request to the Climate-Indices-Visualization API that includes the row’s indicator, the analysis location, the user-selected RCP scenario (RCP4.5 or RCP8.5), and the user-selected time horizon. The API serves native EURO-CORDEX climate projections on the EUR-11 grid (∼0.11°, approximately 12.5 km), aggregated to the requested location either by nearest-cell lookup or by spatial mean over an area, with the three available horizons corresponding to the 30-year windows 2011–2040, 2041–2070, and 2071–2100 under both RCP4.5 and RCP8.5. Each indicator is delivered as a multi-model ensemble statistic derived from up to 16 EURO-CORDEX simulations, formed by pairing four driving Global Climate Models (ICHEC-EC-EARTH, MPI-ESM-LR, CNRM-CM5, HadGEM2-ES) with four Regional Climate Models (RACMO22E, RCA4, REMO2015, COSMO-crCLIM). For each indicator, the API returns the ensemble mean together with its standard deviation and a 95% confidence interval (μ ± 1.96σ), in addition to the historical baseline value and the relative variation between the historical and projected periods. The platform then converts the returned indicator value into the 1–5 hazard index through an internally defined mapping function specified in [26]. The Exposure Index (EI) is computed from two user-supplied values, annual revenue exposure and capacity exposure, mapped to an integer 1–5 scale through a piecewise lookup. The Vulnerability Index (VI) is computed as , where sensitivity is rated 1–5 by the user and adaptive capacity is the sum of a base capacity and three normalized user inputs (asset lifetime, maintenance regime, and design topology), with adaptive capacity capped at 0.4. The Potential Risk Index (PRI) is the composite score PRI = HI × EI × VI, mapped to an ordinal six-class scale (No Risk, Very Low, Low, Medium, High, Extreme) by threshold lookup.
A key operational feature of this module is its dynamic execution. The indices are computed on demand from user inputs and live climate-indicator retrievals, eliminating the need for pre-calculated static tables. The polygon centroid from the site-characterization pipeline is optionally reused as the location input for the climate-indicator fetch, and the chain is integrated with the reporting framework described next.
2.4. Grounded Reporting Framework
While quantitative outputs are essential for technical analysis, they are often insufficient for communicating risk to non-technical stakeholders. Disconnected metrics, such as a discrete Hazard Index value, a categorical Potential Risk Index label, or raw geospatial element counts, do not intrinsically provide the descriptive context needed to communicate a site’s actual risk profile. The Grounded Reporting Framework (GRF) is the layer of the workflow that turns these structured outputs into stakeholder-facing narrative reports. It is instantiated independently in the site-characterization tool (where it produces a combined Geographical, Infrastructure, and Köppen Interpretation report), in the Level 1 tool (where it produces a narrative perceived-risk report), and in the Level 2 tool (where it produces a Hazard Report and a PRI Assessment Report). Each instance makes its own call to the underlying LLM with its own system prompt, exemplar, and structured input.
The GRF was designed against four constraints derived from the parent project’s data-management plan. Reports must be reproducible in tone and structure across runs and across analyzed sites, so that they can be compared across stakeholders and over time. Reports must contain no factual claims that are neither present in nor directly derivable from the data passed in the prompt. The same software pattern must extend to all report types produced by the workflow. The framework must remain model-agnostic to ensure that the underlying LLM can be replaced as new models become available without rewriting the application logic.
Each report prompt is built from three composable blocks, illustrated in the bottom layer of Figure 1:
- System prompt: fixes the analyst role and enumerates a small set of strict protocols (zero hallucination, narrative Markdown output, scope restriction to the input table, and terminology constraints specific to the report type).
- Reference exemplar: an embedded input/output pair consisting of a representative input table paired with an expert-written reference report; it fixes the desired structure, level of detail, terminology, and discussion logic of the output.
- Structured input data: the actual analytical output on which the report is to be produced, formatted as Markdown so that it matches the model’s training distribution.
This pattern is functionally equivalent to retrieval-augmented generation [18] with a single retrieved exemplar, conventionally referred to as one-shot in-context learning [14], which is the terminology adopted throughout the remainder of this paper.
In the deployed configuration of the platform, the PRI Assessment Report uses a low sampling temperature of 0.3 in the LLM. The sampling temperature controls the degree of variation in the generated text: a low temperature favors high-probability words and phrases and yields more consistent outputs across runs. The PRI Assessment Report inherits this low setting because it interprets the most consequential output of the risk chain and can influence stakeholder decisions regarding the implementation of nature-based solutions. The other GRF reports (the combined Geographical/Köppen report, the Level 1 narrative, and the Hazard Report) use a temperature of 0.7, which allows minor stylistic variation that improves readability. The ablation experiment in Section 3.3 mirrors these deployed temperatures so that its observations apply directly to the deployed configuration. These sampling temperatures and the embedded exemplar pair are fixed properties of the deployed configuration of the platform: both were set on operational grounds prior to and independently of the faithfulness evaluation reported in this paper, and were not optimized against the metrics described in Section 2.5.5. The configuration parameters for each report type are summarized in Table 2.
Table 2.
Configuration of the report types in the Grounded Reporting Framework. “Exemplar” indicates whether an input/output reference pair is embedded in the prompt. T is the sampling temperature. The first row lists the reports generated together in a single call by the site-characterization tool; the other two rows list the two reports generated by the Level 2 (L2) risk-assessment tool.
The reference exemplars used for the Hazard and PRI report types were authored by domain experts within the project consortium and reviewed for accuracy, terminology, and tone before being embedded in the prompt. The exemplars are deliberately specific: each describes a single representative case (a railway asset in mountainous terrain) at a fixed length and depth, rather than offering a generic template. This design anchors the model’s output style without constraining the content scope of the user’s specific analysis. As an illustration, the system instruction used for the PRI Assessment Report is reproduced verbatim below:
You are a senior infrastructure risk analyst. Write a formal PRI Assessment Report. STRICT PROTOCOLS: 1. Zero Hallucination, base analysis EXCLUSIVELY on provided table. 2. Narrative Markdown output (do not reconstruct the table). 3. Use abbreviations HI, EI, VI, PRI.
Every report rendered in the user interface is presented inside a uniformly styled “AI-Generated Content” panel that displays the model name and version, a permanent disclaimer about the non-deterministic nature of the output, and an “AI Limitations & Responsible Use” expander, in accordance with the European Union AI Act’s transparency requirements [27] and the data-management guidelines of the parent project.
2.5. Evaluation Methodology
The Custom Site Analysis workflow was assessed through five complementary evaluations, each targeting a distinct aspect of the platform’s behavior:
- A functional demonstration that confirms the workflow runs end-to-end and produces coherent outputs across three diverse European sites.
- A performance characterization that quantifies processing latency and identifies the dominant computational contributors.
- An ablation study on the Grounded Reporting Framework, which examines how individual prompt components affect the faithfulness of the generated reports relative to their structured inputs.
- A cross-model replication that tests whether the ablation findings hold when the underlying LLM is replaced.
- An expert evaluation featuring a small blind rating of Hazard and PRI reports by six researchers across four quality dimensions to complement the automated metrics with human oversight.
The ablation and cross-model evaluations are exploratory in scale, designed to provide directional evidence rather than statistically definitive findings.
2.5.1. Experimental Execution and Reproducibility
The ablation and cross-model evaluations were carried out through standalone Python (version 3.13.14) scripts that reproduce the prompt construction of the deployed DST verbatim. The system instructions, exemplar pairs, sampling temperatures, and Markdown input serializations used in the live platform are imported by the scripts as immutable string constants to ensure that the evaluated configuration matches the deployed configuration exactly. Report generation and faithfulness scoring are separated into two independent stages: a generation script outputs a unique Markdown file for each report by invoking the relevant model API (Gemini 2.5 Flash Lite, API identifier gemini-2.5-flash-lite, accessed May–June 2026), as well as two additional models evaluated exclusively for this comparative analysis: GPT-5.4 mini (via hosted endpoints, API identifier gpt-5.4-mini, accessed May–June 2026) and Llama 3.1 8B Instruct (via a local Ollama (version 0.32) runtime (http://ollama.com, accessed on 26 May 2026) in 4-bit quantization). A separate scoring script then computes the three faithfulness metrics across all generated reports. The deterministic numeric token detector is applied locally; the sentence-level natural language inference analysis is performed with a RoBERTa-large model fine-tuned on MNLI (checkpoint roberta-large-mnli, revision 2a8f12d, Hugging Face) running on local hardware; the LLM-as-judge analysis employs two distinct evaluation models (Llama 3.1 8B Instruct and GPT-5.4 mini, both configured at a sampling temperature of 0) to allow the sensitivity of the support-rate metric to the choice of judge to be examined directly. All generation and scoring scripts, the generated Markdown reports, and the per-report metric CSV files have been made publicly available as open-source repositories alongside the platform.
2.5.2. Functional Demonstration on Three Self-Selected Locations
To illustrate the workflow’s applicability across heterogeneous environments, three European polygons were defined to span distinct climate zones, infrastructure typologies, and dominant hazard families. The first (ROT) covers the Rotterdam Maasvlakte port complex (Köppen class Cfb), dominated by port and intermodal-transport infrastructure. The second (ATH) covers the central urban core of Athens (Köppen class Csa), characterized primarily by dense urban road networks and building stock. The third (INN) covers a section of Innsbruck’s Brenner highway and railway corridor (Köppen class Dfb), dominated by alpine highway and rail infrastructure with cross-cutting bridge, tunnel, and slope-stabilization features. The site-characterization workflow was executed end-to-end at each location, from polygon completion to fully rendered reports, and per-component latencies (Overpass extraction, Köppen sampling, and the LLM-driven generation of both the Geographical Context and Köppen Interpretation reports) were measured over three repetitions per site. The Level 2 risk chain was not included in this latency measurement because its latency profile depends primarily on user-supplied inputs rather than on the polygon-extraction pipeline.
2.5.3. Performance Characterization Protocol
End-to-end latency was further characterized by drawing 20 polygons over the centers of major European urban regions (Berlin, Paris, London, Madrid, Rome, Amsterdam, Brussels, Budapest, Prague, Lisbon, Dublin, Oslo, Zagreb, Bucharest, Athens, Innsbruck, Milan, Luxembourg, Maasvlakte, and Marseille). Polygon areas ranged approximately 0.5–100 km2, and returned element counts spanned almost three orders of magnitude, capturing a diverse spectrum of dataset sizes. Each polygon was queried three times against the public Overpass endpoint, enabling the isolation of within-polygon variance (driven by transient API load) from across-polygon variance (driven by spatial complexity). Köppen-Geiger sampling latency was recorded alongside each Overpass call.
2.5.4. Brief Definitions of Referenced Evaluation Metrics
The evaluation pipeline described in the remaining subsubsections of this section borrows several components from the natural-language-processing and statistical literatures. Since readers of this journal may not be familiar with them, short descriptions are given here for reference.
ROUGE-L [28] is one of the oldest automatic metrics for evaluating generated text. The variant used here scores a generated report against a reference text by finding the longest sequence of words that appears in both (in order, though not necessarily contiguously) and reporting the result as an F-measure. Two generated reports that paraphrase the reference with different vocabulary will receive low ROUGE-L scores even if both are correct, which is why ROUGE-L is treated here as a stylistic-alignment indicator rather than a faithfulness metric.
BERTScore [29] was introduced to address the lexical-overlap limitation of ROUGE-style metrics. Rather than counting matching words, it represents each token in the candidate and the reference as a contextual embedding (RoBERTa-large, in this paper’s configuration), then matches every candidate token to its most-similar reference token via cosine similarity. The resulting precision, recall, and F1 scores reward semantic agreement even when wording differs. BERTScore is therefore a stricter alignment test than ROUGE-L, but it shares the same fundamental property: it compares against a reference report, not against the input data table, and so is not by itself a measure of factual grounding.
MNLI [30] is a corpus, not a metric. It contains sentence pairs labeled entailment, contradiction, or neutral, where the label describes how the second sentence (the hypothesis) relates to the first (the premise). Language models fine-tuned on MNLI learn to predict these three labels for any new pair, and the resulting classifier is what is used in the NLI step described earlier in this section. In the configuration here, the premise is a sentence-by-sentence rendering of the input table, and the hypothesis is one sentence of the generated report, so the entailment classifier acts as a grounding test against the data rather than against a reference.
The sign test is evaluated in this paper via an exact binomial distribution [31] to determine whether raters, considered as independent trials, favor one experimental condition significantly more often than expected under the null of equal preference (probability of 0.5 for either condition). Under the null hypothesis, the number of raters favoring one condition follows a binomial distribution, and exact p-values can be computed from it directly without asymptotic approximation.
The Mann–Whitney U test [32] is a nonparametric statistical test used to compare two independent samples of ordinal data. It tests whether one sample tends to yield higher values than the other without assuming a specific distribution or requiring interval-scaled data. In this paper, it is applied to compare expert ratings under the with-exemplar and no-exemplar conditions along each dimension. A low p-value indicates that the observed difference in ratings is unlikely to have arisen by chance under the null hypothesis of no difference between the two conditions.
Krippendorff’s α [33] is a measure of inter-rater reliability that quantifies the extent to which multiple raters agree on the ratings of the same set of objects, correcting for the level of agreement expected by chance. It generalizes across measurement scales (nominal, ordinal, interval, and ratio) and handles missing values naturally, which makes it appropriate for evaluations in which each rater rates only a subset of the objects. Values range from −1 to +1: α = 1 indicates perfect agreement, α = 0 indicates agreement no better than chance, and negative values indicate systematic disagreement. As a rule of thumb, α ≥ 0.80 is generally regarded as good agreement and α ≥ 0.67 as acceptable for tentative conclusions.
2.5.5. Ablation Study Design
The contribution of the embedded reference exemplar to the GRF is examined by generating the Hazard Report and PRI Assessment Report under two prompt conditions. The first is the deployed full-prompt configuration, in which the exemplar pair is included; this is referred to in the result tables as the with-exemplar condition (WE). The second is an ablated no-exemplar configuration (NE), in which the reference exemplar is removed while the strict-protocol system instruction and the input data block are retained verbatim. The input table consists of analyst-validated impact-model rows and HI/EI/VI/PRI scores for a representative dam infrastructure site within one of the project demonstration regions, comprising five distinct infrastructure assets, including an intake tunnel, spillway chute, service road, service building, and dam, across ten impact-model rows. Each (type × condition) combination is sampled three times under independent calls to the deployed model, producing 12 generated reports.
The generated reports are scored under three complementary faithfulness metrics, each targeting a different category of failure that automatic similarity scores cannot directly detect. Each metric is described below first in terms of the failure mode it is intended to surface, then in terms of how that failure mode is operationalized. The three metrics are:
- (i)
- Deterministic numeric token detector
The motivation is straightforward: in a report whose role is to interpret a structured numerical input, every numerical value that appears in the prose should either be present in the input table or be directly derivable from it. Any numerical token in the output that is neither in the input nor derivable from it is, by construction, a value the model has invented, since the model has no other grounded source for the number. Counting such tokens therefore provides a conservative, non-semantic lower bound on numerical hallucination. The detector operationalizes this idea by tokenizing the generated report with a regular expression that captures all numeric tokens, including single digits, and flagging every token that does not appear in the input table. The legitimate ordinal index scale ranging from 0 to 5 used by HI, EI, VI, and PRI is whitelisted, since these single digits would otherwise be flagged trivially. Each flagged token is recorded together with ±40 characters of surrounding context so that a domain reviewer can rapidly distinguish a genuine fabrication from an arithmetic intermediate (e.g., the product HI × EI × VI shown before normalization) or a category-range label such as “Moderate-High PRI (2.0 to 2.9)”.
- (ii)
- Sentence-level natural language inference (NLI)
The numeric detector is blind to non-numeric fabrications. A sentence such as “embankment failure is driven by thermal shock to rebar” contains no flagged numbers but is, in the input considered here, an unsupported causal claim. To probe such cases, every sentence of the generated report is treated as a hypothesis and tested for entailment against a serialized version of the input table, used as the premise. The classifier is a RoBERTa-large model [34] fine-tuned on the MultiNLI corpus [30] (defined in Section 2.5.4), which labels each (premise, hypothesis) pair as entailed, neutral, or contradicted. The serialization of the input table is constructed row by row, with each header field rendered as “header is value.” so that the premise is natural-language prose rather than Markdown. The headline NLI metric is the entailment rate , where is the number of sentences labeled entailed and is the number labeled contradicted. Neutral sentences are excluded from the denominator because narrative reports legitimately include framing prose that the input table neither confirms nor contradicts (for example, generic statements about cascading risks or stakeholder context).
- (iii)
- LLM-as-judge claim decomposition
NLI evaluates one sentence at a time. A sentence may, however, contain several factual assertions, only some of which are grounded in the input table; sentence-level scoring therefore conflates a partially supported sentence with a fully supported one. To obtain a more fine-grained signal, each generated report is decomposed by a judging LLM into a set of atomic factual claims, following the FactScore decomposition approach [35]. Each claim is then adjudicated against the input table by a separate call to the same judging model and assigned one of four verdicts: supported (the claim is directly stated or trivially derivable from the table), partial (part of the claim is supported but part adds detail not in the table), contradicted (the claim asserts something the table refutes), or unverifiable (the claim addresses interpretive content the table is not expected to confirm, for example an adaptation recommendation). To avoid the bias of a model judging its own outputs, the primary judging model is Llama 3.1 8B Instruct, run at sampling temperature T = 0; a second judge, GPT-5.4 mini, is used as a robustness check (Section 3.4). The headline judge metric is the verifiable support rate:
where , , , and are the counts of supported, partial, contradicted, and unverifiable claims returned by the judge for the report under consideration. Unverifiable claims are excluded from the denominator because the metric is intended to characterize the verifiable share of the claim space; the raw support rate , where , is also reported in the result tables for completeness.
The unverifiable category itself warrants a brief comment, since its size affects how the verifiable support rate should be interpreted. A substantial share of unverifiable claims is expected in any narrative report on technical content, because legitimate framing prose (statements that establish context, name the relevant stakeholders, mention plausible cascading effects, or motivate the recommendation) is by construction not derivable from a narrow input table. At the same time, a very large unverifiable share can dilute the informational density of the report and risk introducing interpretive content that is neither verifiable nor falsifiable against the data. The unverifiable claim count is therefore reported alongside in all evaluation result tables, both as a check on the support rate (a rising accompanied by a falling unverifiable count reflects shallower interpretation rather than improved grounding, as discussed in Section 3.3) and as a quality signal whose operational use is discussed in Section 4.2.
In addition to the three faithfulness metrics above, ROUGE-L F-measure [28] and BERTScore F1 [29] (both defined in Section 2.5.4) are computed against a human-authored expert reference for the same dam-infrastructure site; the corresponding numbers are reported in Appendix A. These two scores measure stylistic and semantic alignment with the reference rather than faithfulness to the input table, and are therefore retained as supplementary indicators rather than headline metrics.
2.5.6. Cross-Model Replication Design
To examine whether the GRF prompt pattern is portable beyond the deployed proprietary model, the same four configurations were replicated across two additional models beyond the deployed Gemini 2.5 Flash Lite. Llama 3.1 8B Instruct [36] was served locally through the Ollama runtime with default 4-bit quantization. GPT-5.4 mini was accessed through its hosted OpenAI API. The same input table, system instructions, sampling temperatures, exemplar configurations, and three-repetition design were used in every arm, producing 36 generations across the three model families. The cross-model replication is designed not to establish quantitative equivalence between models, but rather to test whether the principal ablation effects observed under the deployed model reproduce in direction under different model families.
2.5.7. Expert Evaluation Procedure Overview
To complement the automatic faithfulness metrics with independent human judgment, a small blind expert evaluation was conducted on a subset of the Gemini-generated ablation reports. Six researchers from adjacent technical domains each rated eight anonymized reports on a 1–5 Likert scale along four quality dimensions: factual accuracy, technical clarity, completeness, and internal coherence. Returned evaluations were processed through a dedicated analysis pipeline to track aggregate directional shifts under a non-parametric framework. The resulting metrics were evaluated for aggregate differences using a two-sided Mann–Whitney U test, for absolute panel reliability using Krippendorff’s α, and for structural preference consistency via a sign test on directional preferences. The comprehensive procedural setup, evaluation rubrics, and detailed statistical outcomes are reported alongside the qualitative discussion in Section 3.5.
3. Results
3.1. Functional Demonstration Across the Three Case-Study Locations
To demonstrate the general applicability of the workflow across heterogeneous environments, three European polygons were defined to span distinct climate zones, infrastructure typologies, and dominant hazard families. The first polygon (ROT) covers the Rotterdam Maasvlakte port complex (centroid 51.97° N, 4.09° E; area 100.5 km2); the second (ATH) covers the central core of Athens (centroid 37.98° N, 23.74° E; area 19.5 km2); the third (INN) covers a section of Innsbruck’s Brenner corridor (centroid 47.24° N, 11.44° E; area 70.5 km2). The Köppen-Geiger sampling at the centroid of each polygon returned, respectively, Cfb (temperate oceanic), Csa (hot-summer Mediterranean), and Dfb (warm-summer humid continental), consistent with the intended climate-zone diversity.
The on-demand Overpass extraction returned 34,416 elements for ROT, 60,282 for ATH, and 18,872 for INN. The contrast between the ATH and INN counts is informative: ATH yields the highest element density of the three (approximately 3100 elements/km2), reflecting the dense building stock of central Athens (45,811 building features alone), whereas the INN polygon, despite spanning 3.6 times the area of ATH, yields the smallest element count because the polygon traverses alpine terrain in which infrastructure is concentrated along a narrow valley corridor. ROT lies between the two and is dominated by buildings (26,066) and roads (6887). Per-category extraction counts are reported in Table 3 and indicate that the polygon-based extraction captures the infrastructure profile of each location: railway and slope-stabilization features dominate the INN profile, urban-building density dominates ATH, and a mixed port/transport/building profile is returned for ROT, including 245 water-body features that reflect the Maasvlakte’s port and waterway character.
Table 3.
Per-component latencies and OSM extraction profile for the three case-study locations. Extraction and Köppen-sampling latencies are mean ± standard deviation (SD) over three repetitions; LLM-generation latencies are single-run measurements. “Total end-to-end” is the sum of all components. Dashes indicate categories with zero or negligible elements at that site.
End-to-end execution of the workflow produced the polygon-based extraction, the Köppen sample, the Geographical Context report, and the Köppen Interpretation report for each location. An excerpt from the generated reports for Rotterdam is illustrated in Figure 3. Single-pixel Köppen sampling completed in well under 0.6 s in all runs, as expected for a raster lookup. Overpass extraction times averaged 14.5 s across the three sites (ranging from 9.7 to 19.2 s, with substantial within-site variance reflecting the public-endpoint variability characterized in Section 3.2). LLM-generation times were dominated by the Geographical Context report, particularly for the data-rich ROT prompt (34.8 s), reflecting the larger number of detailed OSM tag dictionaries serialized into that prompt, and ranged from 8.4 s to 20.0 s for the Köppen Interpretation report. The total end-to-end execution time was 69.9 s for ROT, 42.4 s for ATH, and 29.2 s for INN.
Figure 3.
End-to-end Custom Site Analysis on the Rotterdam Maasvlakte polygon (ROT, Cfb, 100.5 km2, 34,416 elements). (a) Polygon outline on satellite imagery, centroid marked. (b) Köppen-Geiger classification map at the polygon centroid, returning class Cfb. (c) Condensed excerpt from the Geographical Context report generated by Gemini 2.5 Flash Lite; the coloured overlay lines on the base map (magenta administrative/coastal boundaries, blue dashed maritime routes, red hatched areas) are inherited from the OpenTopoMap base layer and are not part of the classification. (d) Condensed excerpt from the Köppen-Geiger Interpretation report generated by the same model. Reports are truncated for display. Both reports are shown condensed for display; the full text of all six reports across the three case-study sites is provided in the Supplementary Material.
Taken together, the three case studies establish that the workflow operates end-to-end across structurally and climatically dissimilar sites without bespoke configuration: a coastal industrial port complex in a temperate-oceanic climate, a dense urban core in a Mediterranean climate, and a mountainous transport corridor in a cold continental climate were all processed by the same pipeline with no site-specific tuning, parameter changes, or manual data preparation. The contrast in returned element counts and dominant feature types (Table 3) shows that the polygon-based extraction adapts to the actual infrastructure profile of each site rather than relying on a fixed schema, and the Köppen sample correctly recovered the expected climate class at each centroid (Cfb, Csa, Dfb). Figure 3 illustrates a representative fully rendered output for ROT, as the structural layout of the four panels remains identical across all three sites. The corresponding outputs for ATH and INN are provided in the open-access data repository alongside the per-site latency measurements.
The functional demonstration confirms that the workflow executes end-to-end and produces coherent outputs of the expected structure at each site. However, it does not validate the factual accuracy of the generated reports against ground truth; that question is addressed for the Hazard and PRI reports specifically by the ablation study in Section 3.3 and is designated as a critical objective for future expert evaluation in Section 4.3.
3.2. Performance Characterization
End-to-end latency was characterized to confirm that the workflow remains in the interactive-use regime and to identify the components that dominate response time. The total execution time to fully display reports was 29.2 s, 42.4 s, and 69.9 s for the three case-study locations (INN, ATH, ROT). Component-level measurements identified Overpass extraction as the dominant and most variable contributor, with site-level mean extraction times ranging from 9.7 to 19.2 s across the three case-study locations, reflecting transient load on the public Overpass endpoint rather than any property of the query itself. Köppen-Geiger sampling latency was negligible (0.45 ± 0.10 s per call). LLM generation via the hosted Gemini API was approximately 3 to 8 times faster than the equivalent local Llama 3.1 8B Instruct (4-bit quantized) generation; the deployed system uses hosted Gemini, with the Llama configuration retained only for the cross-model replication described in Section 3.4. These observations motivate caching Overpass responses in operational deployments and clarify the cost of model portability. A broader 20-polygon characterization, including the size-to-latency scaling fit and per-polygon distributions, is available in the open data repository.
3.3. Ablation Study on Embedded Exemplars
The ablation study compares the Hazard Report and the PRI Assessment Report under the two prompt conditions defined in Section 2.5, namely the deployed full-prompt configuration in which the reference exemplar pair is included (WE) and the ablated configuration in which the exemplar pair is removed (NE). Each combination was sampled three times under independent calls to the deployed Gemini 2.5 Flash Lite model, producing 12 generated reports in total. Reports were scored under the three faithfulness metrics described in Section 2.5.5.
Ablation Results
Pre-condition aggregates for the hazard and PRI assessment reports under both conditions are reported in Table 4, and the corresponding per-condition distributions are visualized in Figure 4. Throughout the rest of this paper, the two ablation conditions are referenced in tables using two short labels: WE (with exemplar) refers to the deployed full-prompt configuration of the GRF, in which the reference exemplar pair is embedded in the prompt as described in Section 2.4; NE (no exemplar) refers to the ablated configuration, in which the exemplar pair has been removed while every other element of the prompt, including the strict-protocol system instruction and the structured input data block, is kept identical. The column Δ reports the per-row difference NE − WE, so that a positive Δ on any metric indicates a larger value under the no-exemplar condition. Four observations emerge from Table 4.
Table 4.
Ablation results for the Climate Hazard and PRI Assessment Reports under Gemini 2.5 Flash Lite, evaluated with the three faithfulness metrics described in Section 2.5.5. Column WE (with exemplar) reports the deployed full-prompt configuration in which the reference exemplar pair is embedded in the GRF prompt. Column NE (no exemplar) reports the ablated configuration in which the exemplar pair is removed and only the strict-protocol system instruction and the input data block are retained. Column Δ reports the per-row difference NE − WE; a positive Δ therefore indicates a larger value under the no-exemplar condition. Each cell reports the mean over n = 3 independent generations. Hallucinations are counted per report under the deterministic numeric token detector. NLI ent. rate is computed over entailed + contradicted sentences. Judge ρsup is the verifiable support rate.
Figure 4.
Ablation effect on the three faithfulness metrics for the Hazard Report (top row) and PRI Assessment Report (bottom row) under Gemini 2.5 Flash Lite. (a,d) Numeric hallucinations under the deterministic numeric token detector. (b,e) NLI entailment rate against the input table (RoBERTa-large MNLI). (c,f) Judge verifiable support rate ρsup. Cross-model replication results (Section 3.4) follow the same patterns; see Table 5. Bars represent the mean values, and the individual black dots overlaying the bars represent the discrete scores from the n = 3 independent generations.
First, the exemplar’s effect on output length differs in sign between the two report types. Removing the exemplar shortened the Hazard Report (from 401 to 311 words) and lengthened the PRI Assessment Report (from 595 to 1109 words). Inspection of the no-exemplar PRI outputs showed that the additional length was produced by detailed per-risk breakdowns and explicit exposition of the HI × EI × VI arithmetic prior to normalization, a level of detail that the model omitted when an exemplar with the concise expert format was available. The exemplar, therefore, acts as a stylistic and structural anchor in this single case, with the apparent magnitude of anchoring depending on the structural strictness of the target report.
Second, the numeric token detector reveals a structured grounding pattern. Hazard reports produced no flagged tokens under either condition (zero across all six runs). PRI reports under the deployed full-prompt configuration produced 2.0 flagged tokens per report on average (6 across three runs); manual inspection of these tokens is reported below. PRI reports under exemplar removal produced 7.0 flagged tokens per report on average (21 across three runs), a 3.5-fold increase. The exemplar, therefore, appears to play a scope-limiting role on numeric content for the more interpretive of the two report types, in addition to its structural anchoring role. Manual inspection of the 6 tokens flagged under the deployed PRI configuration found these to consist of arithmetic intermediates from the HI × EI × VI product chain (e. g., 40, 32, 24, 12, 8) and one category-range label (“Moderate-High PRI (2.0 to 2.9)”); no token corresponded to a fabricated value with no derivable interpretation from the input table.
Third, NLI and LLM-judge metrics confirm a degradation in PRI grounding under exemplar removal that the length-and-overlap metrics could not see. For the PRI report, the number of NLI sentences classified as contradictions rose from 1.0 to 3.0 under exemplar removal, while the deterministic numeric token counts increased as noted previously. For Hazard, the number of contradictions rose more modestly (from 4.7 to 5.3), and the entailment rate fell slightly (from 0.56 to 0.46), but the baseline contradiction count in the Hazard condition is partially attributable to NLI classification of legitimate framing prose (statements about expected cascading effects, regional context) that the input table does not address. The deterministic-detector numeric-hallucination count remained zero under both Hazard conditions.
Fourth, the judge’s verifiable support rate rises under exemplar removal for the PRI report (from 0.53 to 0.68 under the Llama judge). This observation is explained by the shifting metrics in the unverifiable column: the deployed full-prompt PRI reports include substantial interpretive narrative (mean 11.3 unverifiable claims per report) that the judge cannot ground in the input table, while the no-exemplar PRI reports lean more heavily on direct restatement of table values (mean 6.0 unverifiable claims); the full verdict breakdown across all model and condition configurations is shown in Figure 5. The full-prompt reports therefore generate more material that is neither supportable nor contradictable by the table; the no-exemplar reports score more highly on partly because they make fewer interpretive claims, not because their interpretive claims are better grounded. Read alongside the deterministic-detector numeric-hallucination result (+5.0 per report), the judge result therefore reflects a trade-off introduced by exemplar removal: shallower interpretation but more numeric speculation. As Section 3.4 shows, this support-rate swing is itself judge-dependent and is absent when evaluated via the GPT-5.4 mini judge. The deployed configuration retains the exemplar.
Figure 5.
Judge verdict breakdown for the PRI Assessment Report across all six (model × condition) configurations, with the Gemini and Llama generations judged by Llama 3.1 8B Instruct (left of the separator) and the GPT-5.4 mini generations judged by GPT-5.4 mini (right). Bars show the proportion of decomposed claims labeled supported, partial, contradicted, and unverifiable. Under the Llama judge, the supported share swings markedly with condition; under the GPT-5.4 mini judge, it stays high and nearly flat. The contrast illustrates that the judge-based support rate is judge-dependent and must be read alongside the judge-independent metrics.
The ablation is intentionally small (n = 3 per condition, 12 generations total) and was designed to provide controlled directional evidence rather than to establish statistical significance. Given this sample size, the paired Wilcoxon signed-rank test [37] cannot reach a p-value below 0.25 even for the largest observed effect, so effect sizes and the directional consistency of those effects across the two model families (Section 3.4) are reported instead of inference statistics. Complementary direct expert judgment on the same generated reports is reported in Section 3.5.
Table 5.
Cross-model comparison: ablation results under Gemini 2.5 Flash Lite and Llama 3.1 8B Instruct, evaluated with the three faithfulness metrics described in Section 2.5.5. Columns labeled WE report the with-exemplar (deployed) configuration; columns labeled NE report the no-exemplar (ablated) configuration. The same WE / NE convention introduced in Table 4 is used throughout. Cells report the mean over n = 3 generations. The rightmost column reports whether the within-model Δ = NE − WE has the same sign in both models. “≈0” indicates that both deltas are below 0.01 in absolute value. The Hazard report’s exemplar effect is below the noise floor of these metrics in both models; the PRI report shows directional consistency on five of seven metrics.
3.4. Cross-Model Replication
To examine whether the GRF prompt pattern is portable beyond the deployed proprietary model, the Hazard and PRI report generations were replicated across all four model × condition configurations using two additional models: the open-weight Llama 3.1 8B Instruct, served locally through the Ollama runtime with default 4-bit quantization; and the proprietary GPT-5.4 mini, accessed through its hosted API. The same input table, system instructions, sampling temperatures, exemplar configurations, and three-repetition design were used in every arm. The Llama generations are reported in Table 5 alongside the Gemini results from Section 3.3; the GPT-5.4 mini generations are reported separately in Table 6. The cross-model replication was not designed to establish quantitative equivalence between models, but rather to verify whether the principal ablation effects observed under Gemini reproduce directionally across different model families. All 36 generations were completed successfully. Four observations stand out:
Table 6.
Third generation arm: ablation results under GPT-5.4 mini, with GPT-5.4 mini also acting as the judge. Cells report the mean over n = 3 generations. Columns WE and NE use the same with-exemplar/no-exemplar convention introduced in Table 4; Δ = NE − WE. Judge ρsup is the verifiable support rate. The numeric-hallucination and length asymmetries reproduce the pattern seen under Gemini and Llama; the judge support rate is discussed in the text alongside the Llama judge.
First, the prompt pattern produced reports of the intended structure, which are narratives divided into sections according to hazard level or PRI score with HI/EI/VI/PRI abbreviations preserved verbatim, across all 36 generations and model families, including all no-exemplar configurations. This is evidence that the framework’s design (strict-protocol system instruction, structured input table, exemplar block) is portable across model families rather than being a property of any single model.
Second, the central numeric-hallucination asymmetry reproduces under all three models: hazard reports stay near zero under both conditions, while PRI reports remain clean under the full prompt and acquire fabricated numeric tokens once the exemplar is removed (Gemini, 2.0 to 7.0; Llama, 0.0 to 2.3; GPT-5.4 mini, 0.0 to 3.0). The length asymmetry likewise reproduces, most strongly on PRI, where exemplar removal lengthens the report in every arm (Gemini +515 words, Llama +183, GPT-5.4 mini +545). Consequently, three independent models, comprising two proprietary architectures and one open-weight alternative, demonstrate directional alignment on the direction of the two effects on which the paper’s main claim rests (Figure 6).
Figure 6.
Reproduction of the two principal exemplar-removal effects on the PRI Assessment Report across three model families. (a) Flagged numeric tokens per report under the deterministic numeric token detector. (b) Output length in words. In both panels the no-exemplar bar exceeds the full-prompt bar for every model, confirming that exemplar removal raises numeric speculation and report length regardless of the underlying model. Bars are the means over n = 3 generations per condition.
Third, the exemplar-removal effect on the PRI report is directionally consistent across model families on five of seven metrics under the Llama judge: output length (Gemini +515/Llama +183), numeric hallucinations (Gemini +5.0/Llama +2.3), NLI entailment rate (Gemini +0.01/Llama +0.25), verifiable support rate (Gemini +0.16/Llama +0.10), and unverifiable claim count (Gemini −5.3/Llama −7.0). The hazard report shows weaker cross-model consistency precisely because its exemplar effect is small in absolute terms in both models; when the underlying effect is small, the sign of the residual is dominated by per-realization noise. This reinforces the per-model finding that the exemplar’s role is most consequential for the PRI report.
Fourth, the LLM-judge support rate proved sensitive to the choice of judging model, which is itself an informative result: Under the Llama judge, the verifiable support rate for the PRI report rose noticeably on exemplar removal (0.53 to 0.68), an effect attributed to the parallel fall in unverifiable claims. Under the GPT-5.4 mini judge, the same support rate barely moved (0.94 to 0.98) while the unverifiable count still rose (8.3 to 14.0), as GPT-5.4 mini classified a greater proportion of claims as supported regardless of condition. GPT-5.4 mini also decomposed reports more granularly and more consistently than Llama (35 to 111 claims per report, exhibiting none of the severe outlier variances observed with the Llama configuration). The two judges agree on the direction of the core asymmetry but disagree on the magnitude of the support-rate swing. The support-rate metric should therefore be read as judge-dependent and triangulated against the deterministic numeric token detector and the NLI metric, both of which are judge-independent and both of which reproduce the asymmetry. This divergence provides empirical validation of the single-judge-bias concern that would otherwise have to be stated only as a caveat.
Fifth, latency: Llama generations ran approximately 3 to 8 times slower than the equivalent Gemini-hosted inference, consistent with the cost of running an 8B-parameter model on consumer-grade local hardware in 4-bit quantization. This penalty is acceptable for a replication study but would be a deployment concern; the deployed system continues to use the hosted Gemini service, while the alternative model configurations are evaluated exclusively to demonstrate framework portability.
The cross-model replication thus provides preliminary evidence for the central architectural claims of the GRF: the prompt pattern produced the intended structured output across three model families; the exemplar’s role as a scope-limiting anchor on numeric content for the PRI report was preserved in direction across all three; and the asymmetry between hazard and PRI report types (hazard robust, PRI sensitive) held throughout. The replication does not establish quantitative equivalence between models, but rather confirms that absolute report quality scales with model capability as expected.
3.5. Expert Evaluation of Report Quality
The automatic faithfulness metrics reported in Section 3.3 and Section 3.4 measure grounding to the input table but cannot directly capture the dimensions of report quality that ultimately determine whether the reports support stakeholder communication. A small blind expert evaluation was therefore conducted as a complementary study.
3.5.1. Procedure
Six researchers from adjacent technical domains were recruited as raters. Each rater received a printed packet of eight anonymized reports drawn from the 12 Gemini-generated ablation reports (Section 3.3), with the sampling designed so that every report was rated by four different raters. Reports were randomized within each packet and stripped of any information identifying their generation condition. Raters were asked to rate each report on a 1–5 Likert scale along four dimensions: factual accuracy, technical clarity, completeness, and internal coherence, using a fixed rubric with anchor descriptions for the 1, 3, and 5 points. Ratings were returned on a spreadsheet form and analyzed with the same script as the automatic-metric pipeline.
3.5.2. Rating Results
Table 7 reports mean expert ratings per report type and prompt condition. Seven of eight WE-vs-NE comparisons showed with-exemplar reports scoring at least as high as no-exemplar reports at the aggregate mean level. Two comparisons reached conventional statistical significance under a two-sided Mann–Whitney U test, both on the Hazard Report: Hazard completeness (Δ = 0.67, p = 0.039) and Hazard factual accuracy (Δ = 0.50, p = 0.041). Three of the four PRI Assessment Report comparisons also showed with-exemplar reports scored higher at the aggregate mean level (factual accuracy Δ = 0.66, technical clarity Δ = 0.33, internal coherence Δ = 0.25), though none reached conventional significance in this small sample. The single reversed comparison, PRI completeness, showed a small aggregate difference in the opposite direction (NE mean 4.50 vs. WE mean 4.25, Δ = −0.25, p = 0.304) that did not reach significance.
Table 7.
Mean expert ratings per (report type × condition) with two-sided Mann–Whitney U-test p-values. WE = with exemplar, NE = no exemplar. Twelve ratings per cell (48 ratings across six raters).
Direction consistency across raters was analyzed by comparing each rater’s mean WE rating with their mean NE rating on each (report type × dimension) combination. On the Hazard Report completeness dimension, five of six raters rated WE higher than NE, with the sixth rating them equal; among the five raters expressing a directional preference, all five favored WE (binomial excluding ties, p = 0.031). This is the strongest single finding of the evaluation because it converges with the Mann–Whitney result and does not depend on the assumption that ratings from different raters are on the same absolute scale.
Inter-rater agreement (Krippendorff’s α) was low on absolute rating levels: α = 0.150 for factual accuracy, 0.071 for technical clarity, 0.090 for completeness, and 0.386 for internal coherence. These values are below the conventional acceptable threshold of 0.67 [33]. Part of this pattern is attributable to range restriction in the rating distribution: reports were of consistently high quality, so most individual ratings fell in the 4–5 band of the scale, and Krippendorff’s α mathematically penalizes such range-restricted distributions [33]. The direction-consistency analysis above, which is not sensitive to range restriction, corroborates that raters agreed substantially on the direction of the exemplar effect on the Hazard Report even when absolute rating levels differed.
3.5.3. Interpretation
The expert evaluation converges with the automatic-metric findings on the Hazard Report, providing two statistically significant with-exemplar advantages (factual accuracy and completeness) and a robust direction-consistency finding on completeness (5 of 6 raters, binomial p = 0.031). Seven of eight aggregate comparisons across both report types showed that with-exemplar reports scored at least as high as no-exemplar reports. These findings are consistent with the ablation-study result that the deployed with-exemplar configuration produced no fabricated numeric tokens in Hazard Reports, since expert raters who read the same Hazard Reports also perceived them as more factually accurate and complete than the no-exemplar counterparts. The PRI Assessment Report showed a directionally consistent but smaller-magnitude effect: three of four PRI dimensions showed with-exemplar reports scoring higher at the aggregate level, but the reduced effect sizes did not reach conventional statistical significance in this small sample. This pattern is consistent with the automatic-metric finding that PRI is a more interpretive report type in which the exemplar’s role is more subtle than on the Hazard Report, and it is also consistent with the ablation showing that PRI reports vary more across generation runs. This expert evaluation is treated as convergent supporting evidence for the automatic-metric findings rather than as a quantitative benchmark of stakeholder utility. However, these human validation findings should be considered preliminary given the small panel size and low absolute inter-rater agreement, highlighting the need for broader validation in future work.
4. Discussion
4.1. Applied Contribution
The principal contribution of this work is the Grounded Reporting Framework introduced in Section 2.4: a structured one-shot in-context learning pattern that translates a chained, IPCC AR6-aligned set of quantitative climate-risk indices into stakeholder-facing narrative reports under explicit grounding constraints. The framework is deployed and evaluated within the open-source DST described in Section 2.1, Section 2.2 and Section 2.3, which provides its application context: a polygon-based OSM extraction pipeline, a Köppen-Geiger classification step, and the Level 2 risk chain produce the structured inputs that the reporting layer interprets. While the DST itself represents a valuable technical artifact of the present work, it is not the object of evaluation in this paper. To the authors’ knowledge, no prior open decision support tool for the climate risk assessment of critical infrastructure has incorporated a structured, one-shot in-context learning reporting layer of this kind. A comparison with adjacent LLM applications in the climate domain illuminates this distinction. ChatClimate [21] retrieves from the AR6 corpus to support open-ended dialogue; CHATREPORT [22] mines ESG disclosures using TCFD-aligned question templates; ClimateBert [23] provides a domain-adapted encoder for downstream NLP tasks. None of these address the specific design problem solved here: translating a structured table of quantitative risk indices, generated by a chained climate-risk workflow, into a stakeholder-facing narrative under explicit grounding constraints. The present work demonstrates that, in this restricted setting, a single embedded exemplar paired with strict-protocol system instructions can produce structured output suitable for a transparent decision-support panel.
The ablation results in Section 3.3 provide exploratory empirical evidence that refines, rather than confirms, the standard intuition about in-context learning [14,20]. Under three complementary faithfulness metrics (deterministic numeric token detector, NLI against the input table, LLM-as-judge claim decomposition), the deployed full-prompt configuration produced zero fabricated numeric tokens within the hazard reports and an average of two flagged tokens per PRI report. Upon manual inspection, all such tokens were identified as arithmetic intermediates or category-range labels rather than fabricated values. Exemplar removal had an asymmetric effect: hazard reports were robust to it, while PRI reports lengthened sharply and acquired fabricated numeric tokens (a mean of seven per report under Gemini, 2.3 under Llama, and 3.0 under GPT-5.4 mini). In this prompt design, the exemplar therefore appears to play not only a stylistic anchoring role but a scope-limiting role on numeric speculation for the more interpretive report type. Non-numeric and causal hallucinations are not directly addressed by these metrics and remain a target for expert review in future work. The asymmetric pattern was directionally consistent across all three model families, providing preliminary evidence that the prompt pattern of the GRF is model-portable. The LLM-judge support rate, by contrast, diverged between the Llama and GPT-5.4 mini judges, which is taken here as direct evidence that judge-based support rates must be triangulated against the judge-independent metrics rather than read in isolation. The small blind expert evaluation reported in Section 3.5 provides human-judgment evidence for the direction of these findings on the Hazard Report: with-exemplar Hazard Reports were rated higher than no-exemplar ones on factual accuracy (p = 0.041) and completeness (p = 0.039), with five of six independent raters expressing a directional preference on completeness, all five favoring the with-exemplar condition (sign test, p = 0.031). The Potential Risk Index Reports showed a smaller but directionally consistent pattern, with three of four dimensions favoring the with-exemplar condition at the aggregate level.
The judge-divergence finding deserves a brief methodological remark. The verifiable support rate produced by the LLM-as-judge analysis was sensitive to the choice of judging model: the same PRI exemplar-removal comparison registered as a 0.15-point swing under the Llama judge and as a flat trend under the GPT-5.4 mini judge. This sensitivity has implications for the credibility of LLM-as-judge evaluation as a community practice. Three responses follow from the present finding. First, LLM-judge metrics should not be reported in isolation; judge-independent metrics, such as the deterministic numeric token detector and the NLI entailment rate used here, should accompany them so that the reader can see whether the judge metric is consistent with metrics that do not depend on a judging model. Second, where an LLM-judge metric is reported, the analysis should use at least two judges of substantially different capabilities so that judge sensitivity is directly visible to the reader rather than left as an unstated caveat. Third, where an LLM-judge metric is intended as a community benchmark, the judging model and its version should be pinned as a fixed reference, so that scores remain comparable across studies even as the family of available judging models continues to evolve. The cross-judge divergence reported in Section 3.4 is offered as direct evidence to support the adoption of the first two recommendations as standard benchmarking practices.
4.2. Practical Implications for Climate-Adaptation Decision Support
The polygon-based extraction pipeline detailed in Section 2.2, which is implemented through the Extraction · Mapping & Data tool, lowers the barrier to understanding the geospatial and climatic context of a candidate infrastructure site by automating two previously manual steps: obtaining and pre-processing OpenStreetMap data for an arbitrary polygon, and locating the polygon within the global Köppen-Geiger climate classification. The Geographical Context and Köppen Interpretation reports produced from these inputs translate raw OSM tag dictionaries and a four-letter climate code into professionally styled narrative summaries accessible to infrastructure managers lacking specialized GIS or climatology expertise. The Extraction tool is a context-gathering workflow rather than a risk-assessment workflow: it does not produce hazard, exposure, or vulnerability indices, and it is not connected by an internal data pipeline to the two risk-assessment tools (Level 1 and Level 2). Its output is intended to inform a user’s subsequent independent judgment or to serve as documentation alongside a separately conducted risk assessment. The performance characterization of Section 3.2, supplemented by a broader 20-polygon extraction characterization in the open data repository, quantifies the latency profile of this workflow: end-to-end (extraction + climate sample + LLM reports) times of 29–70 s on the three case-study locations, with Overpass extraction identified as the dominant and most variable contributor due to public-endpoint load variability. These figures place the workflow firmly in the regime of interactive use, consistent with recent calls in the climate-services literature for tools that bridge the “useful, used, usable” gap [13].
The narrative reports themselves serve a complementary function. Quantitative risk indices are powerful for technical analysts but are generally opaque to non-technical stakeholders, who, in many critical-infrastructure operators, include senior management, municipal authorities, and regulators. The combination of strict system-instruction protocols, embedded exemplars, persistent disclaimers, and a low-temperature configuration for the highest-stakes report (PRI Assessment, T = 0.3) appears to be a defensible compromise between the communication benefits of generative AI and the trustworthiness requirements of decision-support contexts. The ablation results offer preliminary support for this design: hazard reports were robust to exemplar removal across all three faithfulness metrics, while PRI reports under the deployed configuration produced an average of two flagged numeric tokens per report (all benign on manual inspection) and demonstrated high verifiable support rates across the LLM-as-judge benchmarks. The exemplar’s apparent contribution to limiting numeric speculation under the more interpretive PRI configuration argues for retaining exemplar-anchored prompting in production deployments. This trustworthy narrative layer is what allows the platform’s downstream nature-based solution recommendations to be communicated in context: an adaptation measure such as slope stabilization or drainage reinforcement is far more likely to be acted upon when it is presented alongside a grounded, stakeholder-readable explanation of the hazard, exposure, and vulnerability drivers that motivate it, rather than as an isolated index score. In this sense, the reporting framework is not an adjunct to the risk-and-NbS workflow but the component that makes its outputs usable by the non-specialist audiences who commission and approve infrastructure adaptation.
A related operational consideration emerges from the evaluation pipeline itself. In the LLM-as-judge analysis reported in Section 3.4, the share of decomposed claims labeled unverifiable, that is, the claims that the input table neither supports nor contradicts, is a meaningful quality signal: a small share is consistent with grounded interpretive framing, but a large share suggests that the report is drifting toward speculative content the underlying analysis does not support. The PRI Assessment Report under the deployed full-prompt configuration produced approximately 11 unverifiable claims per report under the Llama judge (roughly one third of all decomposed claims) and 8 under the GPT-5.4 mini judge (roughly one eighth), with these magnitudes demonstrating a clear judge-dependency analogous to the support-rate metric (Section 4.1), which reinforces the recommendation that LLM-judge measurements be triangulated against judge-independent metrics. The deployed platform itself does not currently include a faithfulness-scoring pipeline; the judge analysis was carried out by a separate scoring script, run independently of the deployed platform, that processed reports written to disk, with the Llama judge running on local hardware and the GPT-5.4 mini judge accessed through the hosted OpenAI API. A natural engineering extension, which would convert the unverifiable share into a deployment-level quality check rather than only an evaluation-time signal, would integrate such a post-generation scoring step into the deployed platform, with an indicative threshold to be calibrated empirically against the expert ratings collected in the planned human-evaluation extension (Section 4.3).
4.3. Limitations
Several limitations of the present work warrant discussion. First, the OSM extraction inherits all known limitations of OpenStreetMap as a data source, including spatially heterogeneous completeness and tag-quality variation by region [38]. The workflow partially mitigates this by displaying raw element counts alongside the AI-generated narrative, allowing users to detect cases where extraction is incomplete, but it does not actively assess OSM data quality.
Second, the ablation study (Section 3.3) is intentionally small (n = 3 per condition, 12 generations per model family) and was conducted on a single case study of dam infrastructure. The cross-model replication (Section 3.4) extends this to 36 generations across three model families, but a more diverse ablation across multiple infrastructure types and report inputs is left for future work. The expert evaluation reported in Section 3.5 is likewise small in scale: six researchers from adjacent technical domains rated eight anonymized reports each, without a rubric-calibration pilot. Inter-rater agreement on absolute rating levels was low (Krippendorff’s α between 0.07 and 0.39), which reflects a combination of individual scoring-style differences and range restriction in the ratings distribution. Direction-of-effect findings on the Hazard Report were consistent across raters (5 of 6 favor with-exemplar on completeness, binomial p = 0.031), but the small panel size and the researcher (rather than stakeholder) profile of the raters mean that this evaluation should be read as convergent supporting evidence rather than as a stakeholder-utility benchmark. A properly designed expert evaluation with domain infrastructure stakeholders, rubric calibration, and a larger panel remains the highest-priority extension of the present work; such an evaluation would also probe non-numeric and causal hallucinations that the deterministic detector used here cannot identify.
Third, the three faithfulness metrics used in Section 3.3 each have well-known limitations and are reported together precisely because they are complementary rather than substitutable. The deterministic numeric detector is blind to non-numeric and causal hallucinations; the NLI classifier assigns “neutral” classification to legitimate framing prose that the input table does not address; the LLM-as-judge analysis depends on the judging model’s own behavior, and its sensitivity to that choice was demonstrated directly by the divergence between the Llama and GPT-5.4 mini judges in Section 3.4. The ROUGE-L and BERTScore values against an expert reference, also computed for each report, are reported as supplementary stylistic-alignment indicators in Appendix A; they measure surface and semantic similarity to a single expert-authored interpretation rather than faithfulness to the input table. All metrics are reported with their respective caveats, and the convergent direction of the judge-independent metrics, rather than any one metric in isolation, is what supports the qualitative findings.
Fourth, the platform’s geographic operating range is partially asymmetric. The site-characterization tool (polygon drawing, OSM extraction, and Köppen-Geiger sampling) operates worldwide, since OpenStreetMap and the global Köppen-Geiger raster cover the whole globe. The Level 2 quantitative risk-assessment chain, in contrast, depends on the Climate-Indices-Visualization API, whose underlying climate projections cover the EURO-CORDEX domain only. Operators outside this domain can therefore use the platform for site characterization but not for the full quantitative risk-assessment workflow. The three case-study locations evaluated in Section 3.1 are demonstrative rather than representative, and generalization of the latency estimates to markedly different urban-density or network-topology contexts should be verified empirically before deployment.
Fifth, the GRF was exercised in this paper on tabular inputs of moderate size, specifically the HI, EI, VI, PRI index tables produced by Level 2 and the OSM element counts and Köppen-Geiger code produced by the site-characterization workflow. More complex structured outputs (gridded simulation results, multi-scenario time-series projections, multi-scenario comparison tables) would require additional input-serialization strategies, such as schema-aware Markdown rendering of multi-dimensional arrays, chart-to-text intermediate representations, or per-scenario report decomposition, before the GRF pattern could be applied to them. These extensions are natural future work.
Sixth, the currently deployed instance of the platform performs narrative generation through a hosted commercial LLM (Gemini 2.5 Flash Lite), which assumes that the user is willing to transmit the structured input table to a third-party API. This assumption may not hold for operators handling sensitive critical-infrastructure data. Within the present design, such operators can use the quantitative analytical tools (Extraction · Mapping & Data, Level 1, and Level 2) without invoking the LLM-based reporting layer at all: the narrative reports are an opt-in interpretation step atop independent quantitative workflows, and the structured numerical outputs (HI, EI, VI, PRI scores, OSM element counts, Köppen-Geiger codes) remain available without generation, so the workflow’s decision-support value is preserved without any data leaving the operator’s environment. Integrating a self-hosted generation option into the deployed platform is left as future work.
5. Conclusions
This paper has presented an exploratory evaluation of a Grounded Reporting Framework (GRF) for translating chained quantitative climate-risk indices into stakeholder-facing narrative reports. The framework combines domain-specific strict-protocol system instructions, an embedded input/output reference exemplar pair, and a low-temperature sampling configuration for the highest-stakes report type, applied through a one-shot in-context learning pattern. The framework is deployed within an open-source, web-based decision support tool (DST) for climate risk assessment and nature-based adaptation planning for critical infrastructure in Europe, organized into three independent analytical modules: a geospatial extraction and context-gathering workflow (Extraction · Mapping & Data), a perceived-risk screening tool (Level 1), and a quantitative hazard–exposure–vulnerability indexing tool (Level 2) whose outputs feed a nature-based solution recommendation engine. The DST is the deployment context that motivates and grounds the framework, but is not itself the object of evaluation in this paper.
Demonstrations on three European locations spanning temperate-oceanic, Mediterranean, and alpine settings showed end-to-end latency of 29.2–69.9 s from polygon completion to fully displayed reports, well within the regime of interactive use, with Overpass extraction identified as both the dominant and the most variable contributor. An exploratory ablation study on real expert-validated dam-site input data, applied to the Level 2 Hazard Report and PRI Assessment Report and evaluated with three complementary faithfulness metrics (deterministic numeric token detector, sentence-level NLI against the input table, LLM-as-judge claim decomposition), revealed an asymmetric pattern: hazard reports were robust to exemplar removal, while PRI reports lengthened substantially and showed a clear rise in flagged numeric tokens once the exemplar was removed. Under the deployed full-prompt configuration, hazard reports produced zero flagged numeric tokens. The two flagged PRI tokens per report were identified, on average and upon manual inspection, as arithmetic intermediates or category-range labels rather than fabricated values. The exemplar’s apparent contribution, therefore, extends beyond stylistic anchoring to actively limiting the scope of speculative numeric content, particularly for the more interpretive of the two report types. Replication across three model families (Gemini 2.5 Flash Lite, Llama 3.1 8B Instruct, and GPT-5.4 mini) reproduced the direction of this asymmetry, while a divergence between two LLM judges established that judge-based support rates must be triangulated against judge-independent metrics. A small blind expert evaluation with six independent researchers from adjacent technical domains provided convergent human-judgment evidence, showing that with-exemplar Hazard Reports were rated higher than no-exemplar Hazard Reports on completeness (Mann–Whitney p = 0.039; five of six raters agreeing on the direction, sign test, p = 0.031) and on factual accuracy (p = 0.041), and the Potential Risk Index Reports showed the same directional pattern at reduced magnitude across three of four dimensions.
Future extensions of this work include a properly designed expert evaluation of stakeholder utility with domain infrastructure stakeholders, rubric calibration, and a larger panel (identified as the highest-priority next step), characterizing the framework across a broader range of asset classes beyond transportation and dam infrastructure, evaluating self-hosted Overpass deployments that would reduce latency variance, and extending the ablation to additional open-weight model scales.
For infrastructure operators, the engineering value of the framework lies in three concrete operational properties. First, the time between a completed quantitative risk assessment and a stakeholder-readable communication is reduced from manual analyst drafting to seconds of automated generation, enabling the practical generation of site-specific narrative reports at the exact frequency at which assessments are commissioned rather than batching them. Second, exemplar-anchored prompting offers a deployment-ready way to enforce factual grounding without requiring manual review of every generated report; the deterministic numeric token detector detailed in Section 3.3 can function as an automated post-generation check that flags reports needing review. Third, the framework’s directional consistency across three LLM families means that an operator is not locked into a single commercial model provider; if a hosted model is deprecated or its terms become commercially unfavorable, the same prompt pattern can be redeployed on an alternative model with predictable behavior. These three properties matter most in operational contexts where adaptation decisions must be communicated quickly, defensibly, and across a portfolio of assets, which is precisely the setting in which nature-based solutions must compete with conventional engineered alternatives for investment.
Together, these results provide support for the idea that carefully constrained generative AI can play a useful role as a stakeholder-communication layer atop quantitative climate risk assessment and nature-based-solution recommendation, provided that the framework around it enforces grounding, transparency, and reproducibility. For infrastructure operators weighing nature-based adaptation measures, the value of such a platform lies in lowering the expertise barrier between a quantitative risk assessment and an actionable, well-communicated adaptation decision. The framework presented here uses a functional decomposition between system instruction (primary numerical grounding) and embedded exemplar (style anchoring plus scope-limiting of numeric speculation on interpretive report types), and this pattern was successfully reproduced across three distinct model families. The evaluation provides evidence that the reporting layer is both reliable and portable as underlying models evolve, with broader validation left to future work. The tool is publicly available (https://nature-demo-dst.dic-cloudmate.eu, accessed on 26 May 2026) and the source code, deployment configuration, and all measurement data are released as open-source on github (https://github.com/NATURE-DEMO/Decision_Support_Tool, accessed on 24 May 2026).
Author Contributions
Conceptualization, F.A., J.P.; methodology, F.A., J.P.; software, F.A.; validation, F.A.; formal analysis, F.A.; investigation, F.A.; data curation, F.A.; writing—original draft preparation, F.A., J.P.; writing—review and editing, J.P., P.S., and M.I.; visualization, F.A.; supervision, J.P., P.S. and M.I. All authors have read and agreed to the published version of the manuscript.
Funding
This research was funded by the European Union under the Horizon Europe research and innovation program, project NATURE-DEMO (Demonstrating Nature-Based Solutions for the Resilience of Critical Infrastructures), Grant Agreement No. 101157448. The views and opinions expressed are, however, those of the author(s) only and do not necessarily reflect those of the European Union or the granting authority. Neither the European Union nor the granting authority can be held responsible for them.
Institutional Review Board Statement
Not applicable.
Informed Consent Statement
Not applicable.
Data Availability Statement
The source code of the Decision Support Tool, the deployment configuration, the raw measurement data and aggregate metrics underlying the results in Section 3.1, Section 3.2, Section 3.3 and Section 3.4, and the test scripts used for the latency characterization and the ablation study, are openly released under an open-source license at https://github.com/saturngreen67/MDPI1 (accessed on 24 May 2026). The deployed application is publicly accessible at https://nature-demo-dst.dic-cloudmate.eu (accessed on 24 May 2026).
Acknowledgments
The authors thank the University of Cantabria team for the multi-level risk assessment framework that underpins the Level 2 quantitative chain used in this work; the BOKU team for the Level 1 perceived-risk methodology and for the Level 1 NbS ranking method, both communicated to the implementation team in consortium working meetings; the ANRI team for the Level 2 NbS scoring methodology, also communicated in working meetings; the IBM Research team for their work on their Climate Indices Visualization API; and all NATURE-DEMO consortium partners for their feedback during the design, testing, and deployment of the platform. During the preparation of this manuscript, the authors used Claude Opus 4.7 and Google Gemini 3.5 Flash for the purposes of proofreading and refining the writing. The authors have reviewed and edited the output and take full responsibility for the content of this publication.
Conflicts of Interest
The authors declare no conflicts of interest. The funders had no role in the design of the study; in the collection, analyses, or interpretation of data; in the writing of the manuscript; or in the decision to publish the results.
Abbreviations
The following abbreviations are used in this manuscript:
| AI | Artificial Intelligence |
| API | Application Programming Interface |
| AR6 | IPCC Sixth Assessment Report |
| DST | Decision Support Tool |
| EI | Exposure Index |
| GIS | Geographic Information System |
| GRF | Grounded Reporting Framework |
| HI | Hazard Index |
| IPCC | Intergovernmental Panel on Climate Change |
| LLM | Large Language Model |
| NbS | Nature-Based Solutions |
| OSM | OpenStreetMap |
| PRI | Potential Risk Index |
| RCP | Representative Concentration Pathway |
| VI | Vulnerability Index |
Appendix A. Supplementary Stylistic-Alignment Metrics
Table A1.
Stylistic alignment with the human-authored expert reference, measured by ROUGE-L F-measure (surface n-gram overlap) and BERTScore F1 (semantic similarity, RoBERTa-large), under both ablation conditions and both model families. These metrics measure alignment between the generated report and a single expert reference, not faithfulness to the input table; they are retained for transparency but are not used as faithfulness indicators in the main text (Section 3.3 and Section 3.4). Cells report mean ± SD over n = 3 generations.
The four columns show consistent patterns: both ROUGE-L and BERTScore decrease on exemplar removal in every cell of the 2 × 2 × 2 (type × condition × model) design. These declines indicate reduced stylistic and lexical alignment with the expert reference under exemplar removal. They do not, however, measure whether the generated content is faithful to the input table; that role is filled by the three metrics in Section 3.3 and Section 3.4. BERTScore values near 0.83–0.85 are characteristic of coherent English text on related topics, and the small absolute deltas (Δ BERTScore ≈ 0.01–0.03) sit within the range where surface lexical overlap on shared domain vocabulary (HI, EI, VI, PRI, asset names) can dominate the metric.
References
- Pörtner, H.O.; Roberts, D.C.; Tignor, M.; Poloczanska, E.S.; Mintenbeck, K.; Alegría, A.; Craig, M.; Langsdorf, S.; Löschke, S.; Möller, V.; et al. (Eds.) Climate Change 2022: Impacts, Adaptation and Vulnerability. Contribution of Working Group II to the Sixth Assessment Report of the Intergovernmental Panel on Climate Change; Cambridge University Press: Cambridge, UK; New York, NY, USA, 2022. [Google Scholar]
- Hajializadeh, D.; Imani, M. RV-DSS: Towards a resilience and vulnerability-informed decision support system framework for interdependent infrastructure systems. Comput. Ind. Eng. 2021, 156, 107276. [Google Scholar] [CrossRef] [Scilit]
- Chang, C.M.; Hossain, A. A climate adaptation asset risk management approach for resilient roadway infrastructure. Infrastructures 2024, 9, 226. [Google Scholar] [CrossRef] [Scilit]
- Vlachogiannis, D.; Zarikos, I.; Sfetsos, A.; Rimlinger, J.; Jaumouillé, A.; Freissinet, C.; Santala, V.; Tzempelikos, D.; Dubovik, M. A Uniform Framework for Climate Change Adaptation of Critical Infrastructure Using Nature-Based Solutions. Infrastructures 2026, 11, 65. [Google Scholar] [CrossRef] [Scilit]
- Šedová, B.; Binder, L.; Michelini, S.; Schellens, M.; Rüttinger, L. A Review of Climate Security Risk Assessment Tools. Environ. Secur. 2024, 2, 175–210. [Google Scholar] [CrossRef] [Scilit]
- Jacob, D.; Petersen, J.; Eggert, B.; Alias, A.; Christensen, O.B.; Bouwer, L.M.; Braun, A.; Colette, A.; Déqué, M.; Georgievski, G.; et al. EURO-CORDEX: New High-Resolution Climate Change Projections for European Impact Research. Reg. Environ. Change 2014, 14, 563–578. [Google Scholar] [CrossRef] [Scilit]
- IUCN. IUCN Global Standard for Nature-Based Solutions: A User-Friendly Framework for the Verification, Design and Scaling Up of NbS, 1st ed.; International Union for Conservation of Nature: Gland, Switzerland, 2020. [Google Scholar]
- World Bank. Implementing Nature-Based Flood Protection: Principles and Implementation Guidance; World Bank Group: Washington, DC, USA, 2017. [Google Scholar]
- European Commission. Evaluating the Impact of Nature-Based Solutions: A Handbook for Practitioners; Publications Office of the European Union: Luxembourg, 2021. [Google Scholar]
- Kabisch, N.; Frantzeskaki, N.; Pauleit, S.; Naumann, S.; Davis, M.; Artmann, M.; Haase, D.; Knapp, S.; Korn, H.; Stadler, J.; et al. Nature-Based Solutions to Climate Change Mitigation and Adaptation in Urban Areas: Perspectives on Indicators, Knowledge Gaps, Barriers, and Opportunities for Action. Ecol. Soc. 2016, 21, 39. [Google Scholar] [CrossRef] [Scilit]
- Sowińska-Świerkosz, B.; García, J. What are Nature-based Solutions (NBS)? Setting Core Ideas for Concept Clarification. Nat.-Based Solut. 2022, 2, 100009. [Google Scholar] [CrossRef] [Scilit]
- Vincent, K.; Daly, M.; Scannell, C.; Leathes, B. What Can Climate Services Learn from Theory and Practice of Co-Production? Clim. Serv. 2018, 12, 48–58. [Google Scholar] [CrossRef] [Scilit]
- Lemos, M.C.; Kirchhoff, C.J.; Ramprasad, V. Narrowing the Climate Information Usability Gap. Nat. Clim. Change 2012, 2, 789–794. [Google Scholar] [CrossRef] [Scilit]
- Brown, T.B.; Mann, B.; Ryder, N.; Subbiah, M.; Kaplan, J.; Dhariwal, P.; Neelakantan, A.; Shyam, P.; Sastry, G.; Askell, A.; et al. Language Models are Few-Shot Learners. In Proceedings of the NeurIPS, Virtual, 6–12 December 2020; Volume 33. [Google Scholar]
- Ploennigs, J.; Berger, M.; Wortmann, T.; Kirchner, J.; Beetz, J.; Roitberg, A.; Menzel, K.; Ommer, B. Building foundation models-potentials, challenges and research directions for using LLM and LVM in AEC. In Proceedings of the EC3, Porto, Portugal, 14–17 July 2025; Volume 6. [Google Scholar]
- Maynez, J.; Narayan, S.; Bohnet, B.; McDonald, R. On Faithfulness and Factuality in Abstractive Summarization. In Proceedings of the ACL, Virtual, 5–10 July 2020; pp. 1906–1919. [Google Scholar] [CrossRef] [Scilit]
- Ji, Z.; Lee, N.; Frieske, R.; Yu, T.; Su, D.; Xu, Y.; Ishii, E.; Bang, Y.J.; Madotto, A.; Fung, P. Survey of Hallucination in Natural Language Generation. ACM Comput. Surv. 2023, 55, 248. [Google Scholar] [CrossRef] [Scilit]
- Lewis, P.; Perez, E.; Piktus, A.; Petroni, F.; Karpukhin, V.; Goyal, N.; Küttler, H.; Lewis, M.; Yih, W.t.; Rocktäschel, T.; et al. Retrieval-Augmented Generation for Knowledge-Intensive NLP Tasks. In Proceedings of the NeurIPS, Virtual, 6–12 December 2020; Volume 33. [Google Scholar]
- Wei, J.; Wang, X.; Schuurmans, D.; Bosma, M.; Ichter, B.; Xia, F.; Chi, E.; Le, Q.V.; Zhou, D. Chain-of-Thought Prompting Elicits Reasoning in Large Language Models. In Proceedings of the NeurIPS, New Orleans, LA, USA, 28 November–9 December 2022; Volume 35. [Google Scholar]
- Min, S.; Lyu, X.; Holtzman, A.; Artetxe, M.; Lewis, M.; Hajishirzi, H.; Zettlemoyer, L. Rethinking the Role of Demonstrations: What Makes In-Context Learning Work? In Proceedings of the EMNLP, Abu Dhabi, United Arab Emirates, 7–11 December 2022; pp. 11048–11064. [Google Scholar]
- Vaghefi, S.A.; Stammbach, D.; Muccione, V.; Bingler, J.; Ni, J.; Kraus, M.; Allen, S.; Colesanti-Senni, C.; Wekhof, T.; Schimanski, T.; et al. ChatClimate: Grounding Conversational AI in Climate Science. Commun. Earth Environ. 2023, 4, 480. [Google Scholar] [CrossRef] [Scilit]
- Ni, J.; Bingler, J.; Colesanti-Senni, C.; Kraus, M.; Gostlow, G.; Schimanski, T.; Stammbach, D.; Vaghefi, S.A.; Wang, Q.; Webersinke, N.; et al. CHATREPORT: Democratizing Sustainability Disclosure Analysis through LLM-based Tools. In Proceedings of the EMNLP, Singapore, 6–10 December 2023; pp. 21–51. [Google Scholar] [CrossRef] [Scilit]
- Webersinke, N.; Kraus, M.; Bingler, J.A.; Leippold, M. ClimateBert: A Pretrained Language Model for Climate-Related Text. arXiv 2021, arXiv:2110.12010. [Google Scholar] [CrossRef] [Scilit]
- Beck, H.E.; McVicar, T.R.; Vergopolan, N.; Berg, A.; Lutsko, N.J.; Dufour, A.; Zeng, Z.; Jiang, X.; van Dijk, A.I.J.M.; Miralles, D.G. High-resolution (1 km) Köppen-Geiger maps for 1901–2099 based on constrained CMIP6 projections. Sci. Data 2023, 10, 724. [Google Scholar] [CrossRef] [Scilit] [PubMed]
- Strauss, A.; Fernandes, S.; Ionescu, F.D.; Hübl, J.; Stangl, R.; Kuschel, E.; Obriejetan, M.; Machí Castañer, L.; Wirth, M.; Canga, E.; et al. Methodology for NbS Integration into Digital Tools. In Technical Report Deliverable D1.2, NATURE-DEMO: Nature-Based Solutions for Demonstrating Climate-Resilient Critical Infrastructure; Horizon Europe Grant Agreement No. 101157448; NATURE-DEMO Consortium, 2026; Available online: https://drive.google.com/file/d/16GoIKuBdApLv_9ql-czmsZiMJNn_Njr-/view?usp=drive_link (accessed on 24 May 2026).
- Barrios Crespo, E.; Fuentes Álvarez de Eulate, M.; López Lara, J. Methodological Framework for Risk Reduction Analysis of Infrastructures Based on Nature-Based Solutions; Deliverable D2.1; NATURE-DEMO Consortium, 2025; Available online: https://drive.google.com/file/d/1K26Wd1IEt4tAOPj7kSmGepz3zbm8iPLR/view?usp=drive_link (accessed on 24 May 2026).
- European Parliament and Council of the European Union. Regulation (EU) 2024/1689 of the European Parliament and of the Council of 13 June 2024 Laying Down Harmonised Rules on Artificial Intelligence (Artificial Intelligence Act). 2024. Available online: https://eur-lex.europa.eu/legal-content/EN/TXT/PDF/?uri=OJ:L_202401689 (accessed on 31 May 2026).
- Lin, C.Y. Rouge: A package for automatic evaluation of summaries. In Proceedings of the Annual Meeting of the Association for Computational Linguistics, Barcelona, Spain, 21–26 July 2004; pp. 74–81. [Google Scholar]
- Zhang, T.; Kishore, V.; Wu, F.; Weinberger, K.Q.; Artzi, Y. BERTScore: Evaluating Text Generation with BERT. In Proceedings of the ICLR, Addis Ababa, Ethiopia, 26–30 April 2020. [Google Scholar]
- Williams, A.; Nangia, N.; Bowman, S. A broad-coverage challenge corpus for sentence understanding through inference. In Proceedings of the NAACL-HLT, New Orleans, LA, USA, 1–6 June 2018; pp. 1112–1122. [Google Scholar]
- Agresti, A. A survey of exact inference for contingency tables. Stat. Sci. 1992, 7, 131–153. [Google Scholar] [CrossRef] [Scilit]
- McKnight, P.E.; Najab, J. Mann–Whitney U Test. In The Corsini Encyclopedia of Psychology; Weiner, I.B., Craighead, W.E., Eds.; Wiley: Hoboken, NJ, USA, 2010; pp. 1–2. [Google Scholar]
- Krippendorff, K. Content Analysis: An Introduction to Its Methodology, 4th ed.; SAGE Publications: Thousand Oaks, CA, USA, 2018. [Google Scholar]
- Liu, Y.; Ott, M.; Goyal, N.; Du, J.; Joshi, M.; Chen, D.; Levy, O.; Lewis, M.; Zettlemoyer, L.; Stoyanov, V. RoBERTa: A Robustly Optimized BERT Pretraining Approach. arXiv 2019, arXiv:1907.11692. [Google Scholar] [CrossRef] [Scilit]
- Min, S.; Krishna, K.; Lyu, X.; Lewis, M.; Yih, W.t.; Koh, P.; Iyyer, M.; Zettlemoyer, L.; Hajishirzi, H. FActScore: Fine-grained Atomic Evaluation of Factual Precision in Long Form Text Generation. In Proceedings of the Conference on Empirical Methods in Natural Language Processing, Singapore, 6–10 December 2023; pp. 12076–12100. [Google Scholar]
- Grattafiori, A.; Dubey, A.; Jauhri, A.; Pandey, A.; Kadian, A.; Al-Dahle, A.; Letman, A.; Mathur, A.; Schelten, A.; Vaughan, A.; et al. The Llama 3 Herd of Models. arXiv 2024, arXiv:2407.21783. [Google Scholar] [CrossRef] [Scilit]
- Wilcoxon, F. Individual Comparisons by Ranking Methods. Biom. Bull. 1945, 1, 80–83. [Google Scholar] [CrossRef] [Scilit]
- Barrington-Leigh, C.; Millard-Ball, A. The World’s User-Generated Road Map Is More Than 80% Complete. PLoS ONE 2017, 12, e0180698. [Google Scholar] [CrossRef] [Scilit] [PubMed]
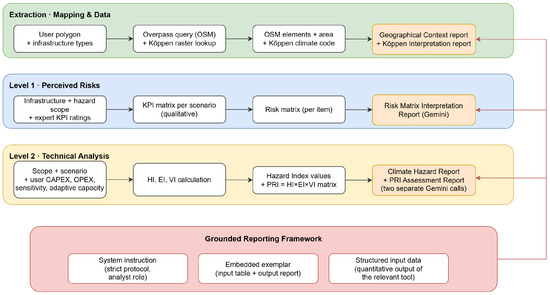
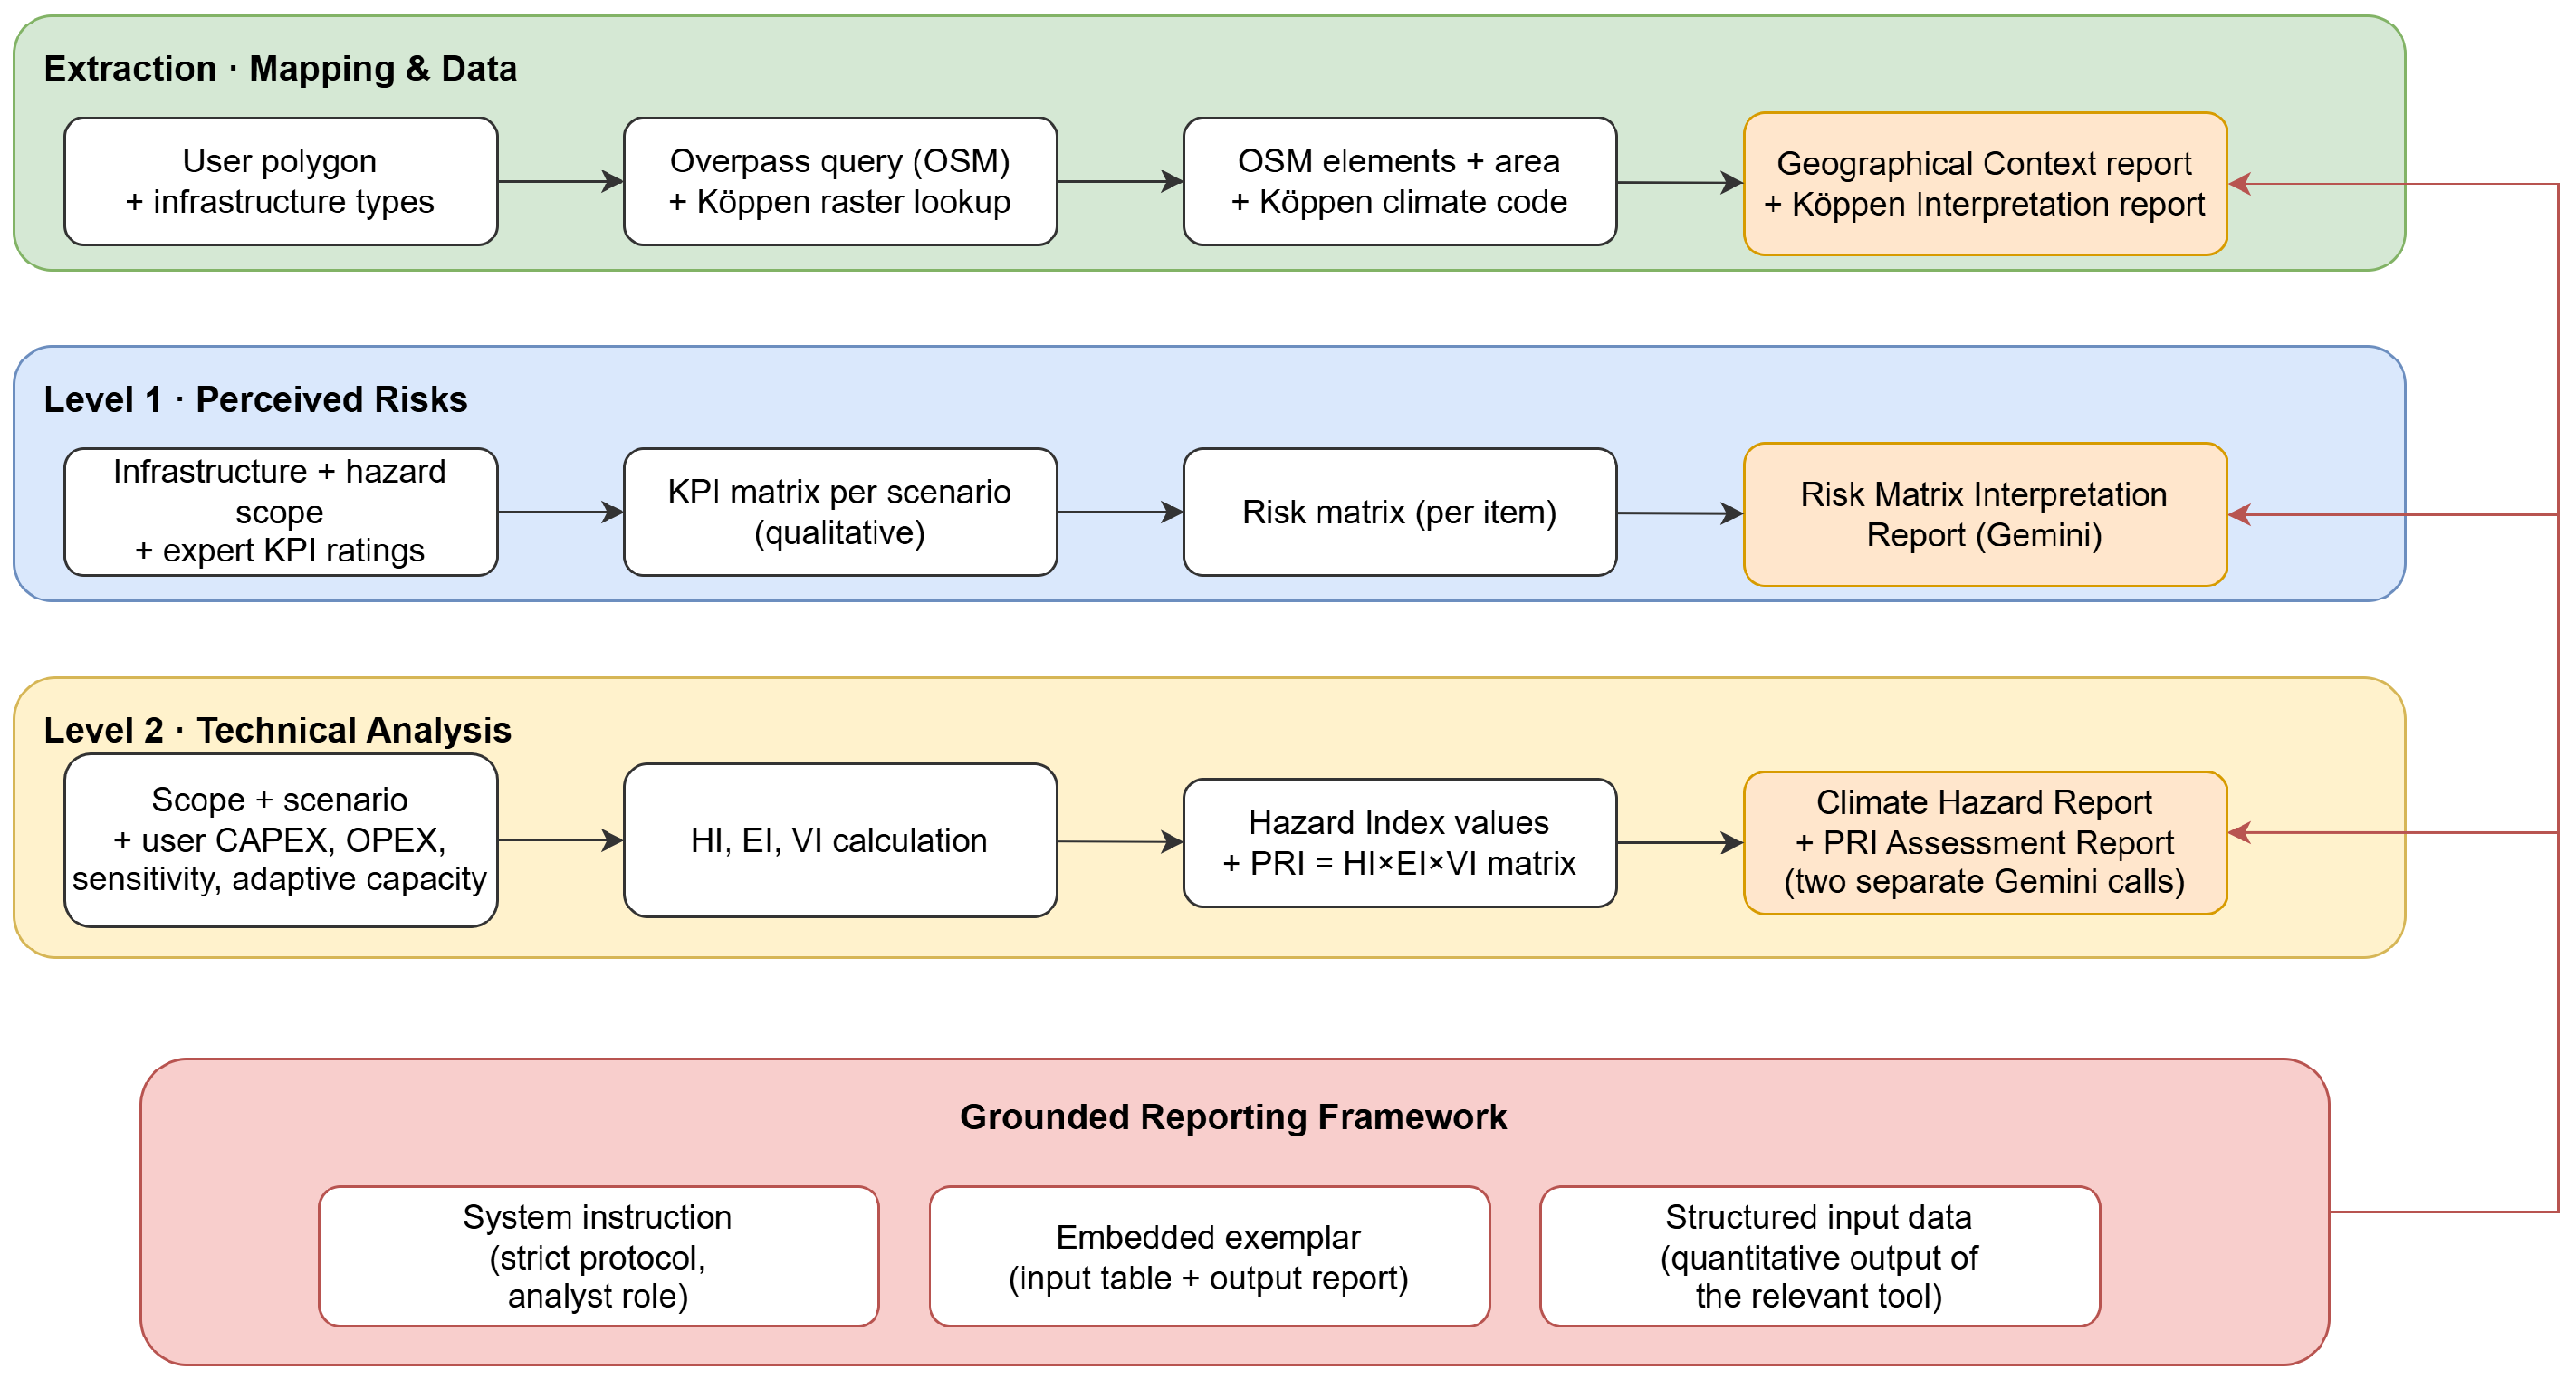
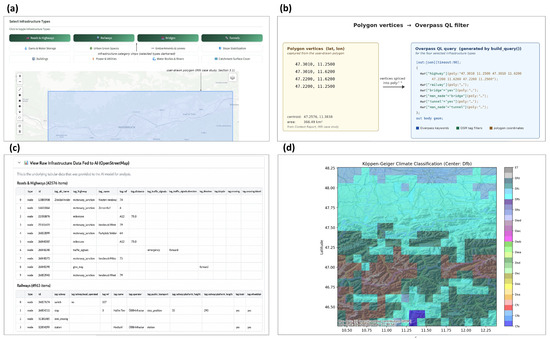
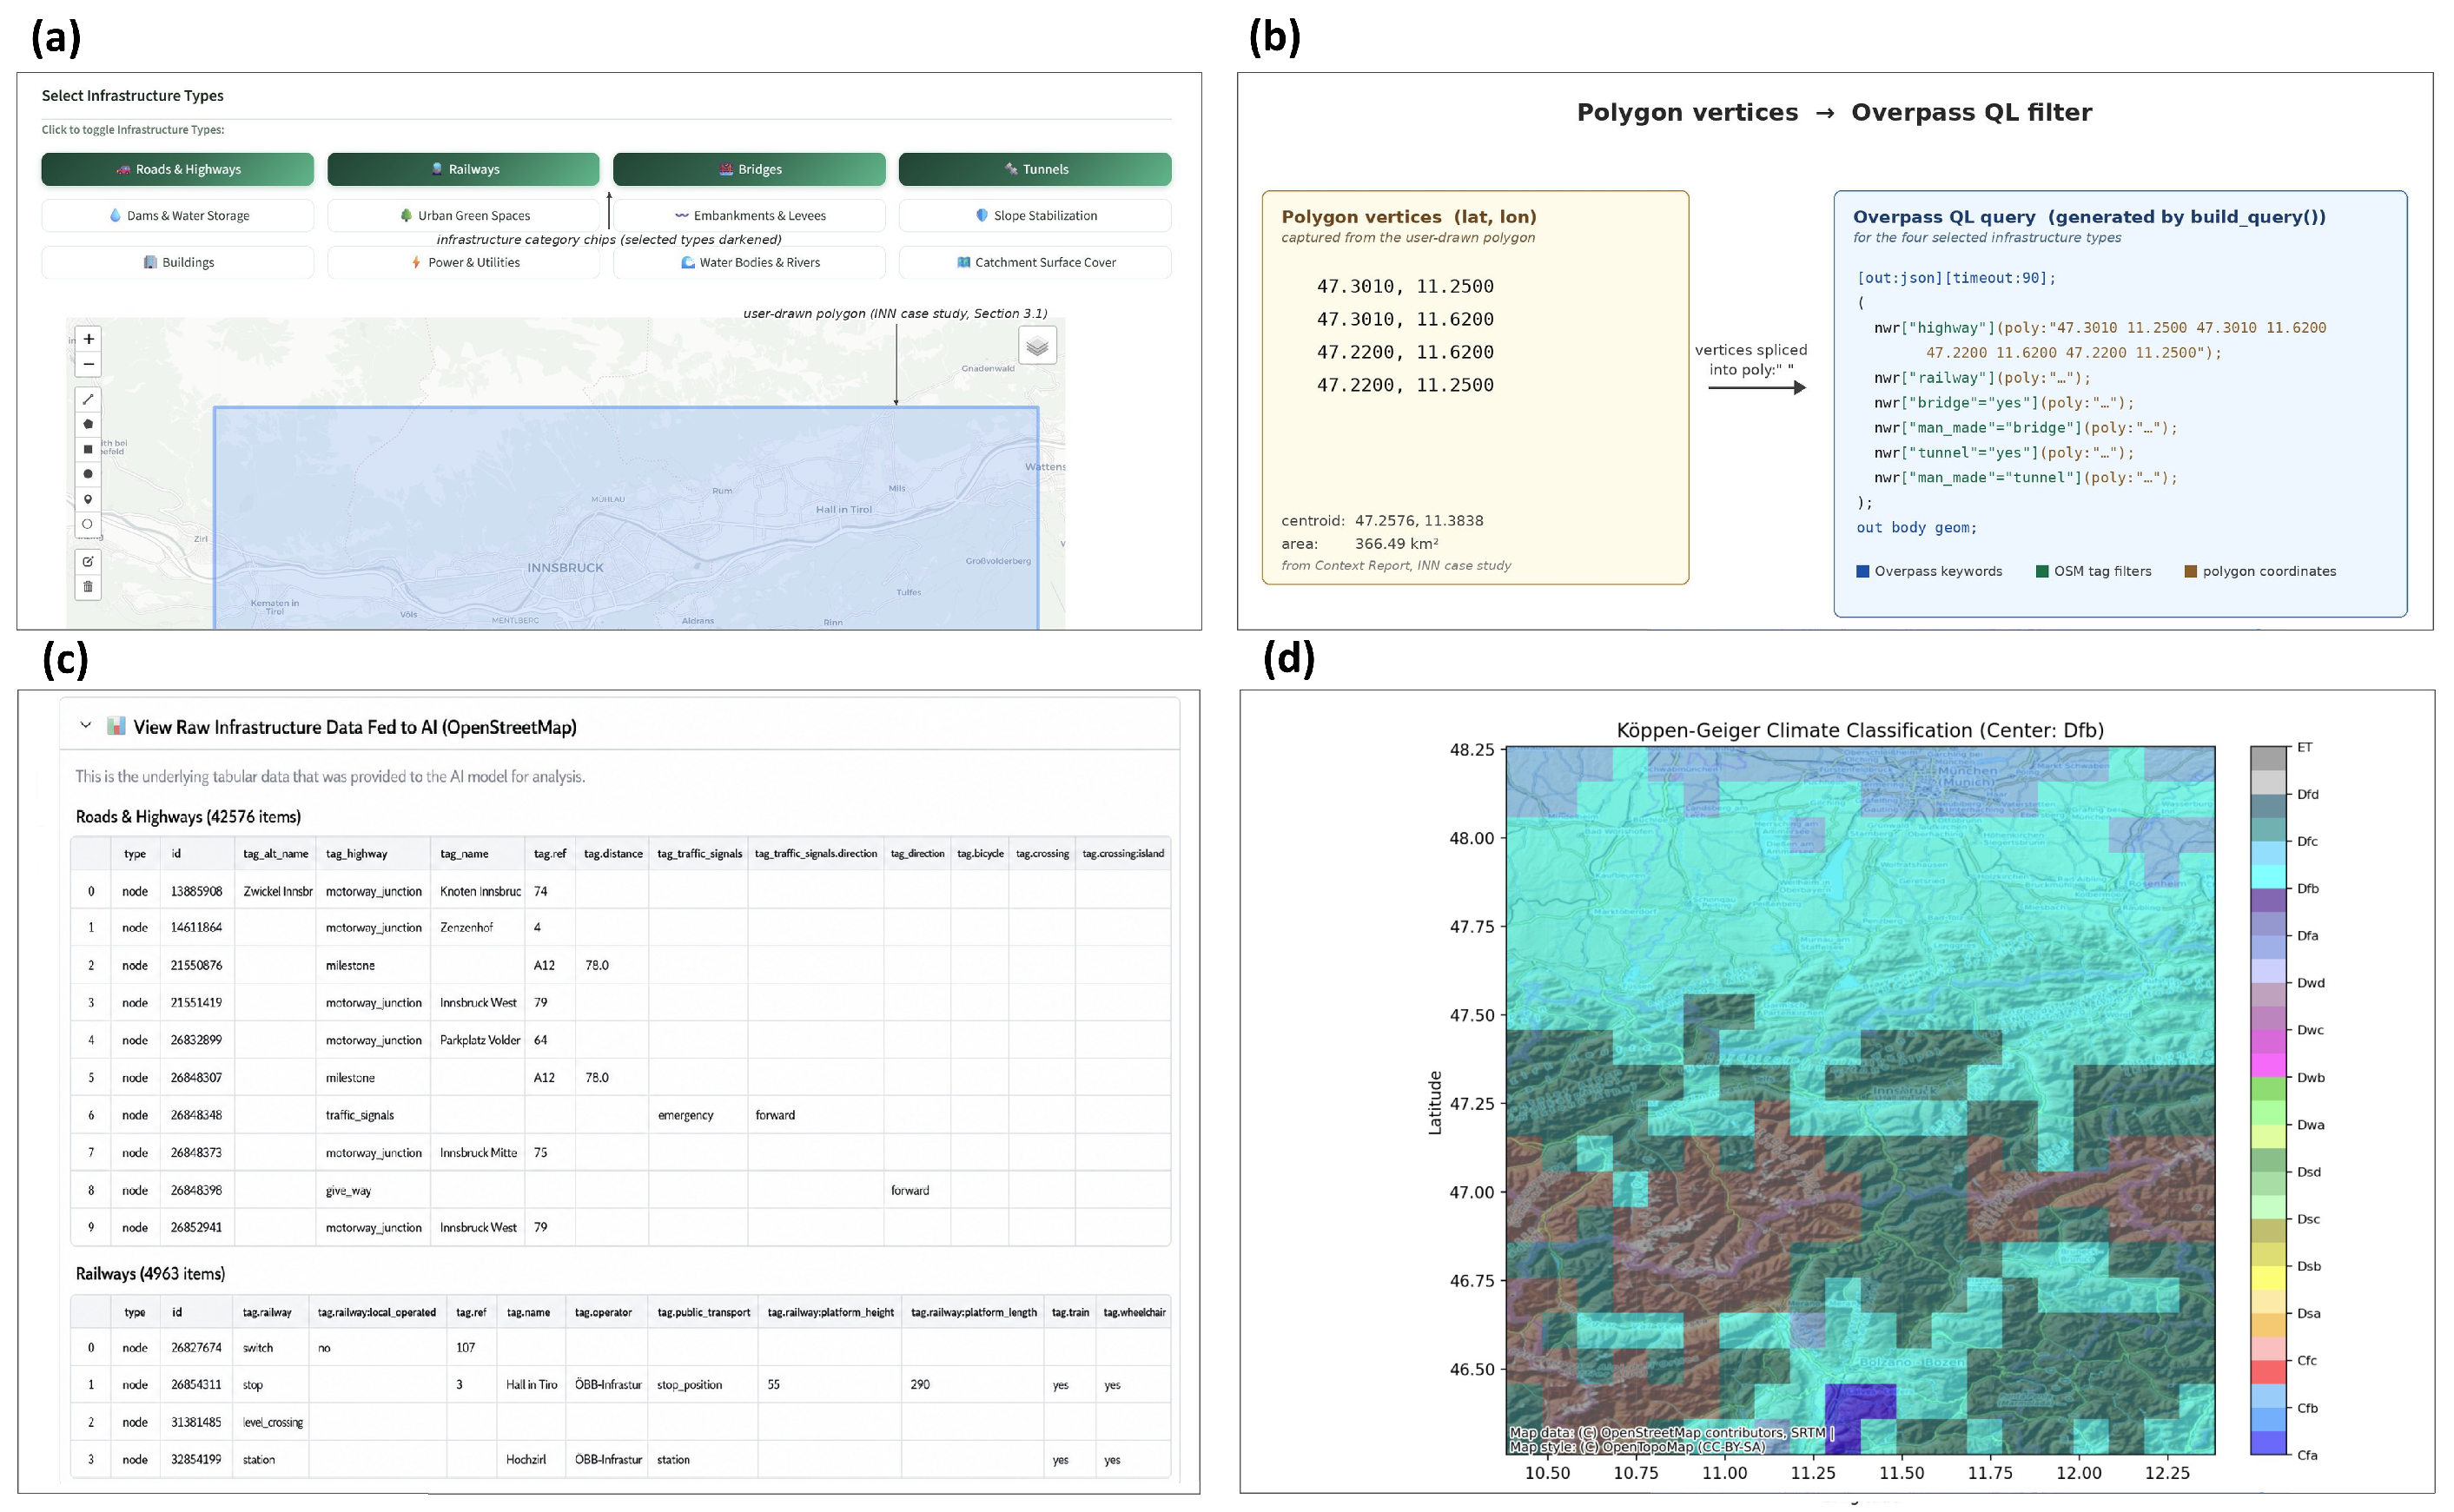
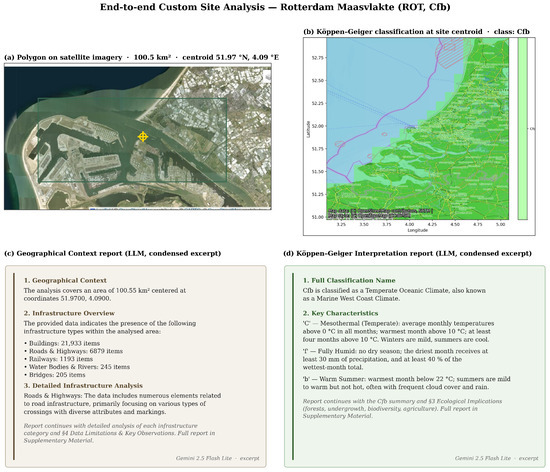
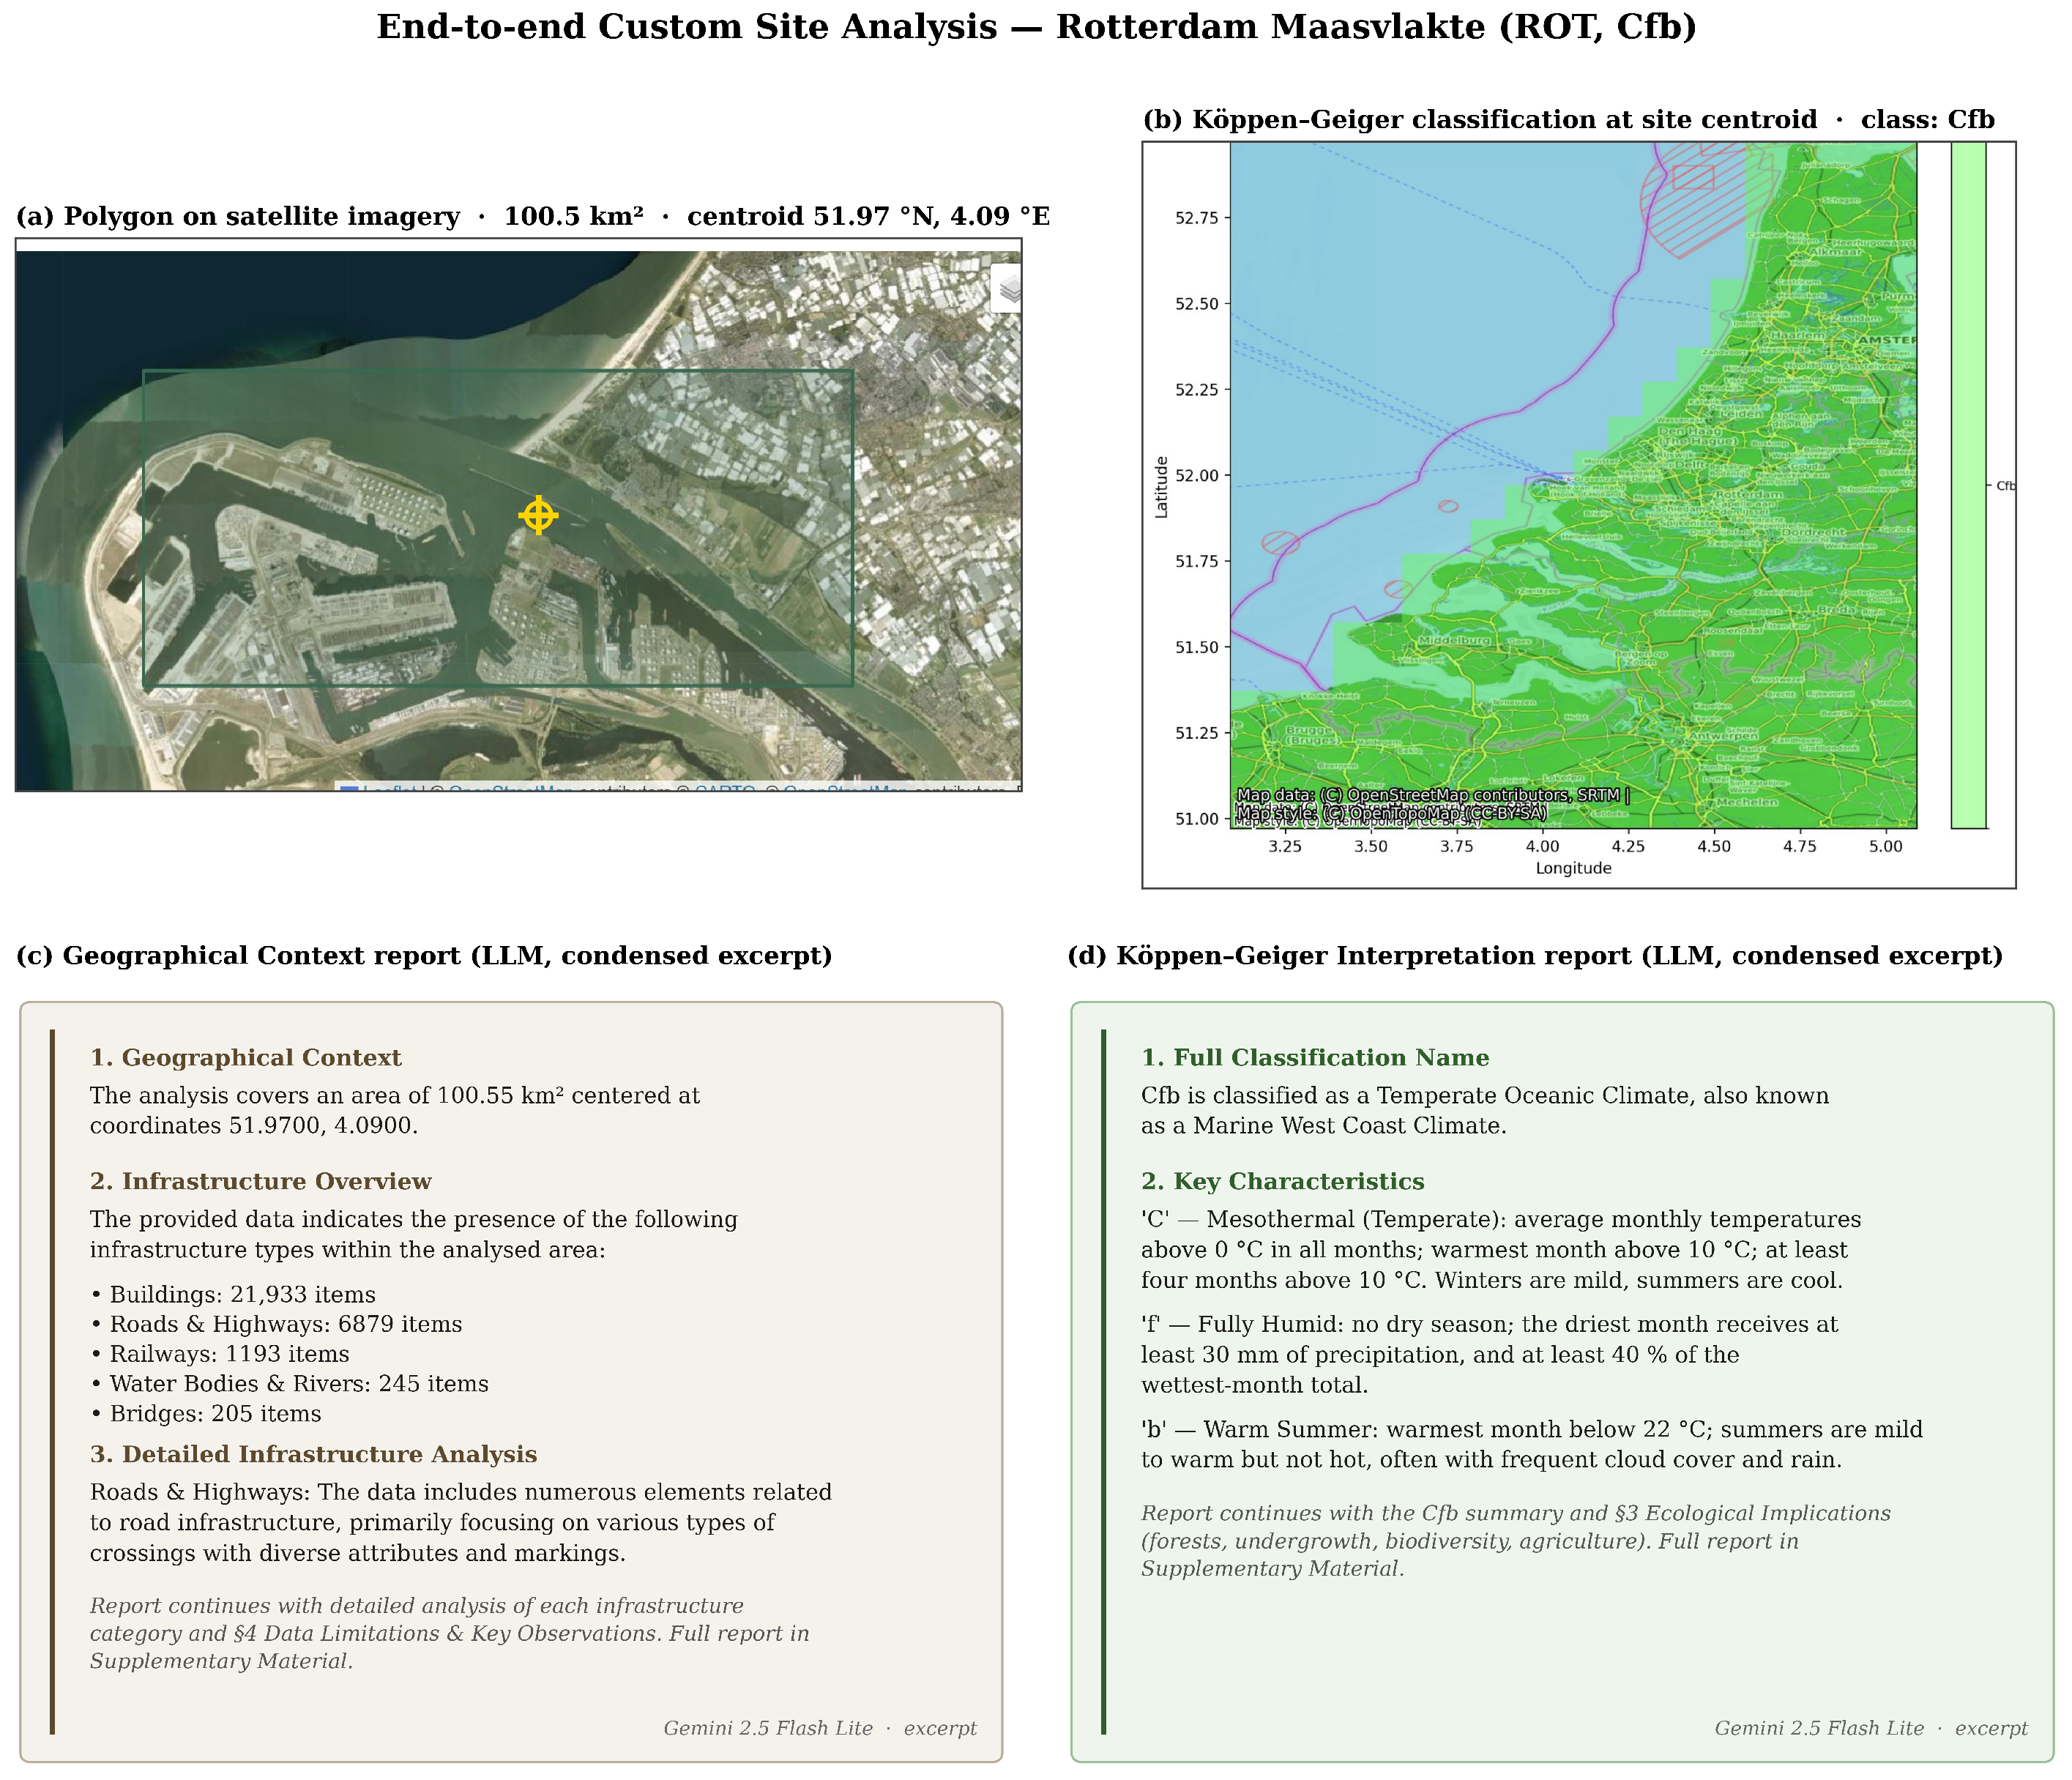
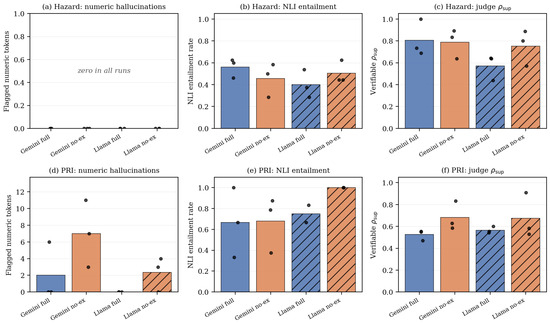
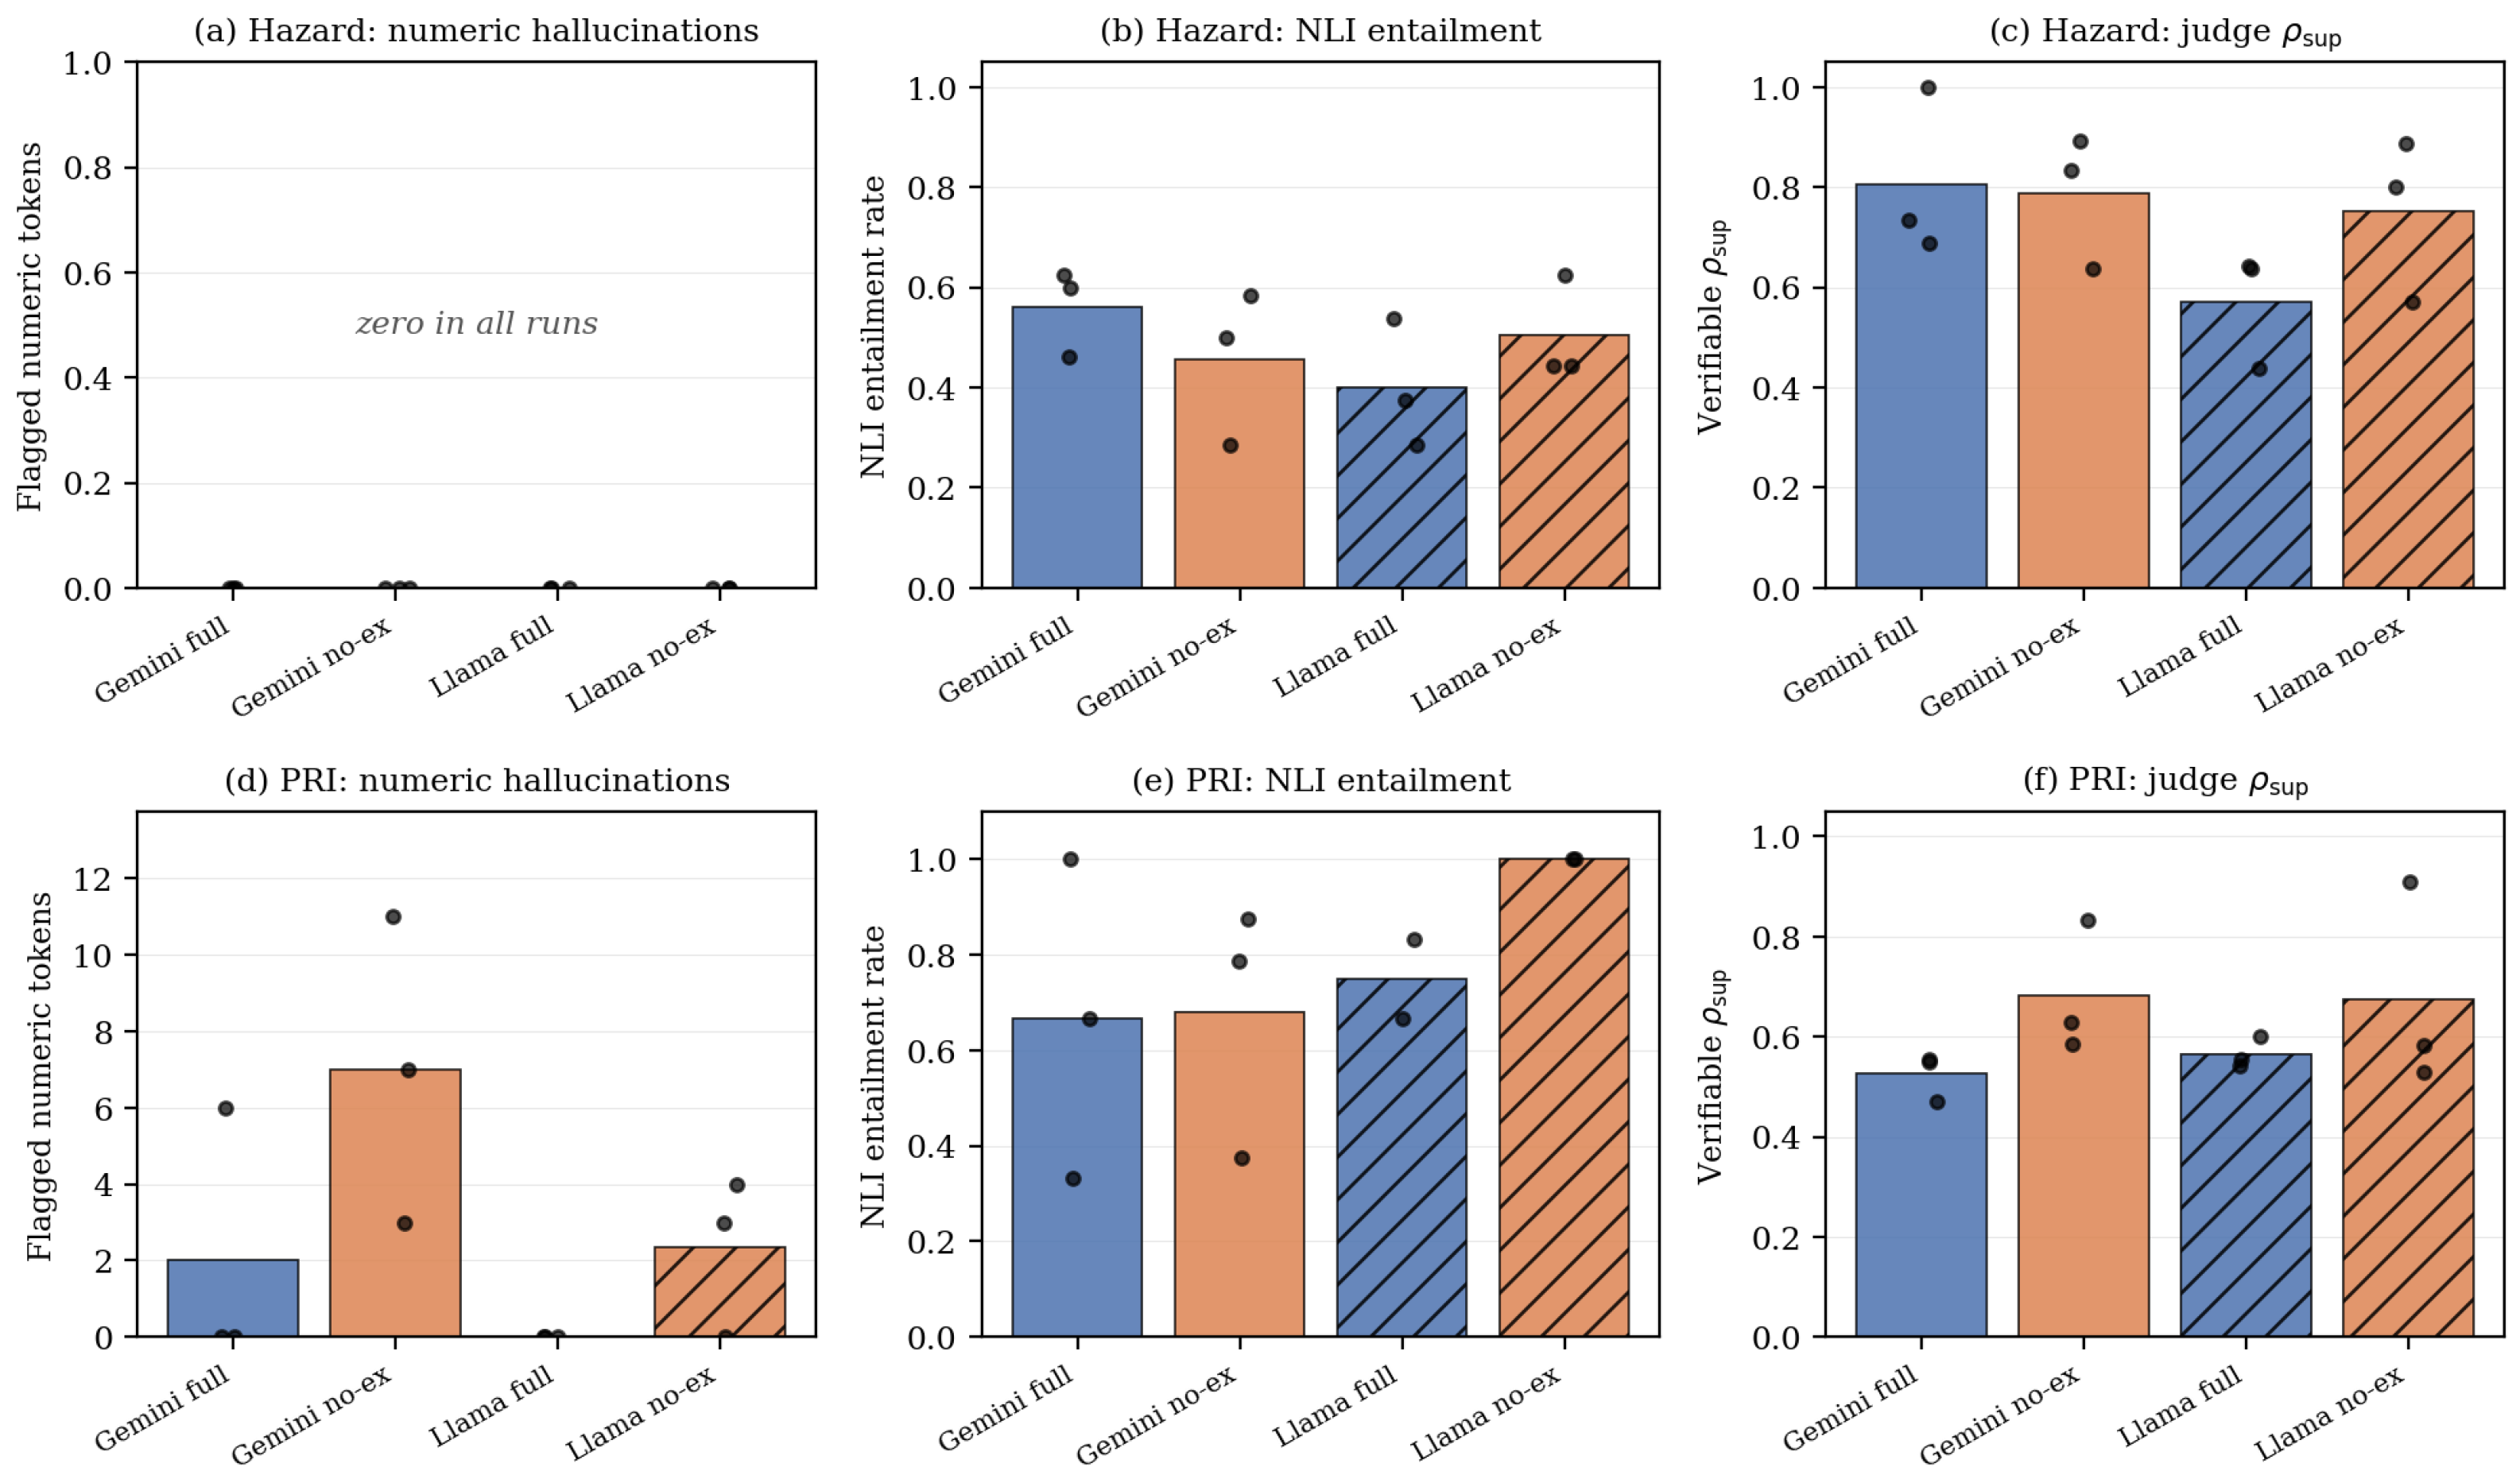
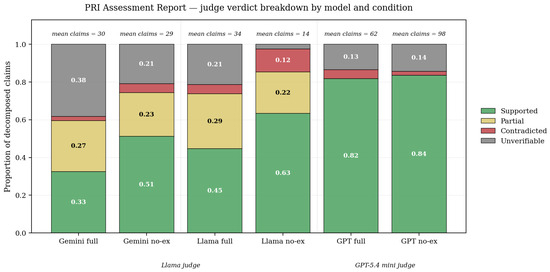
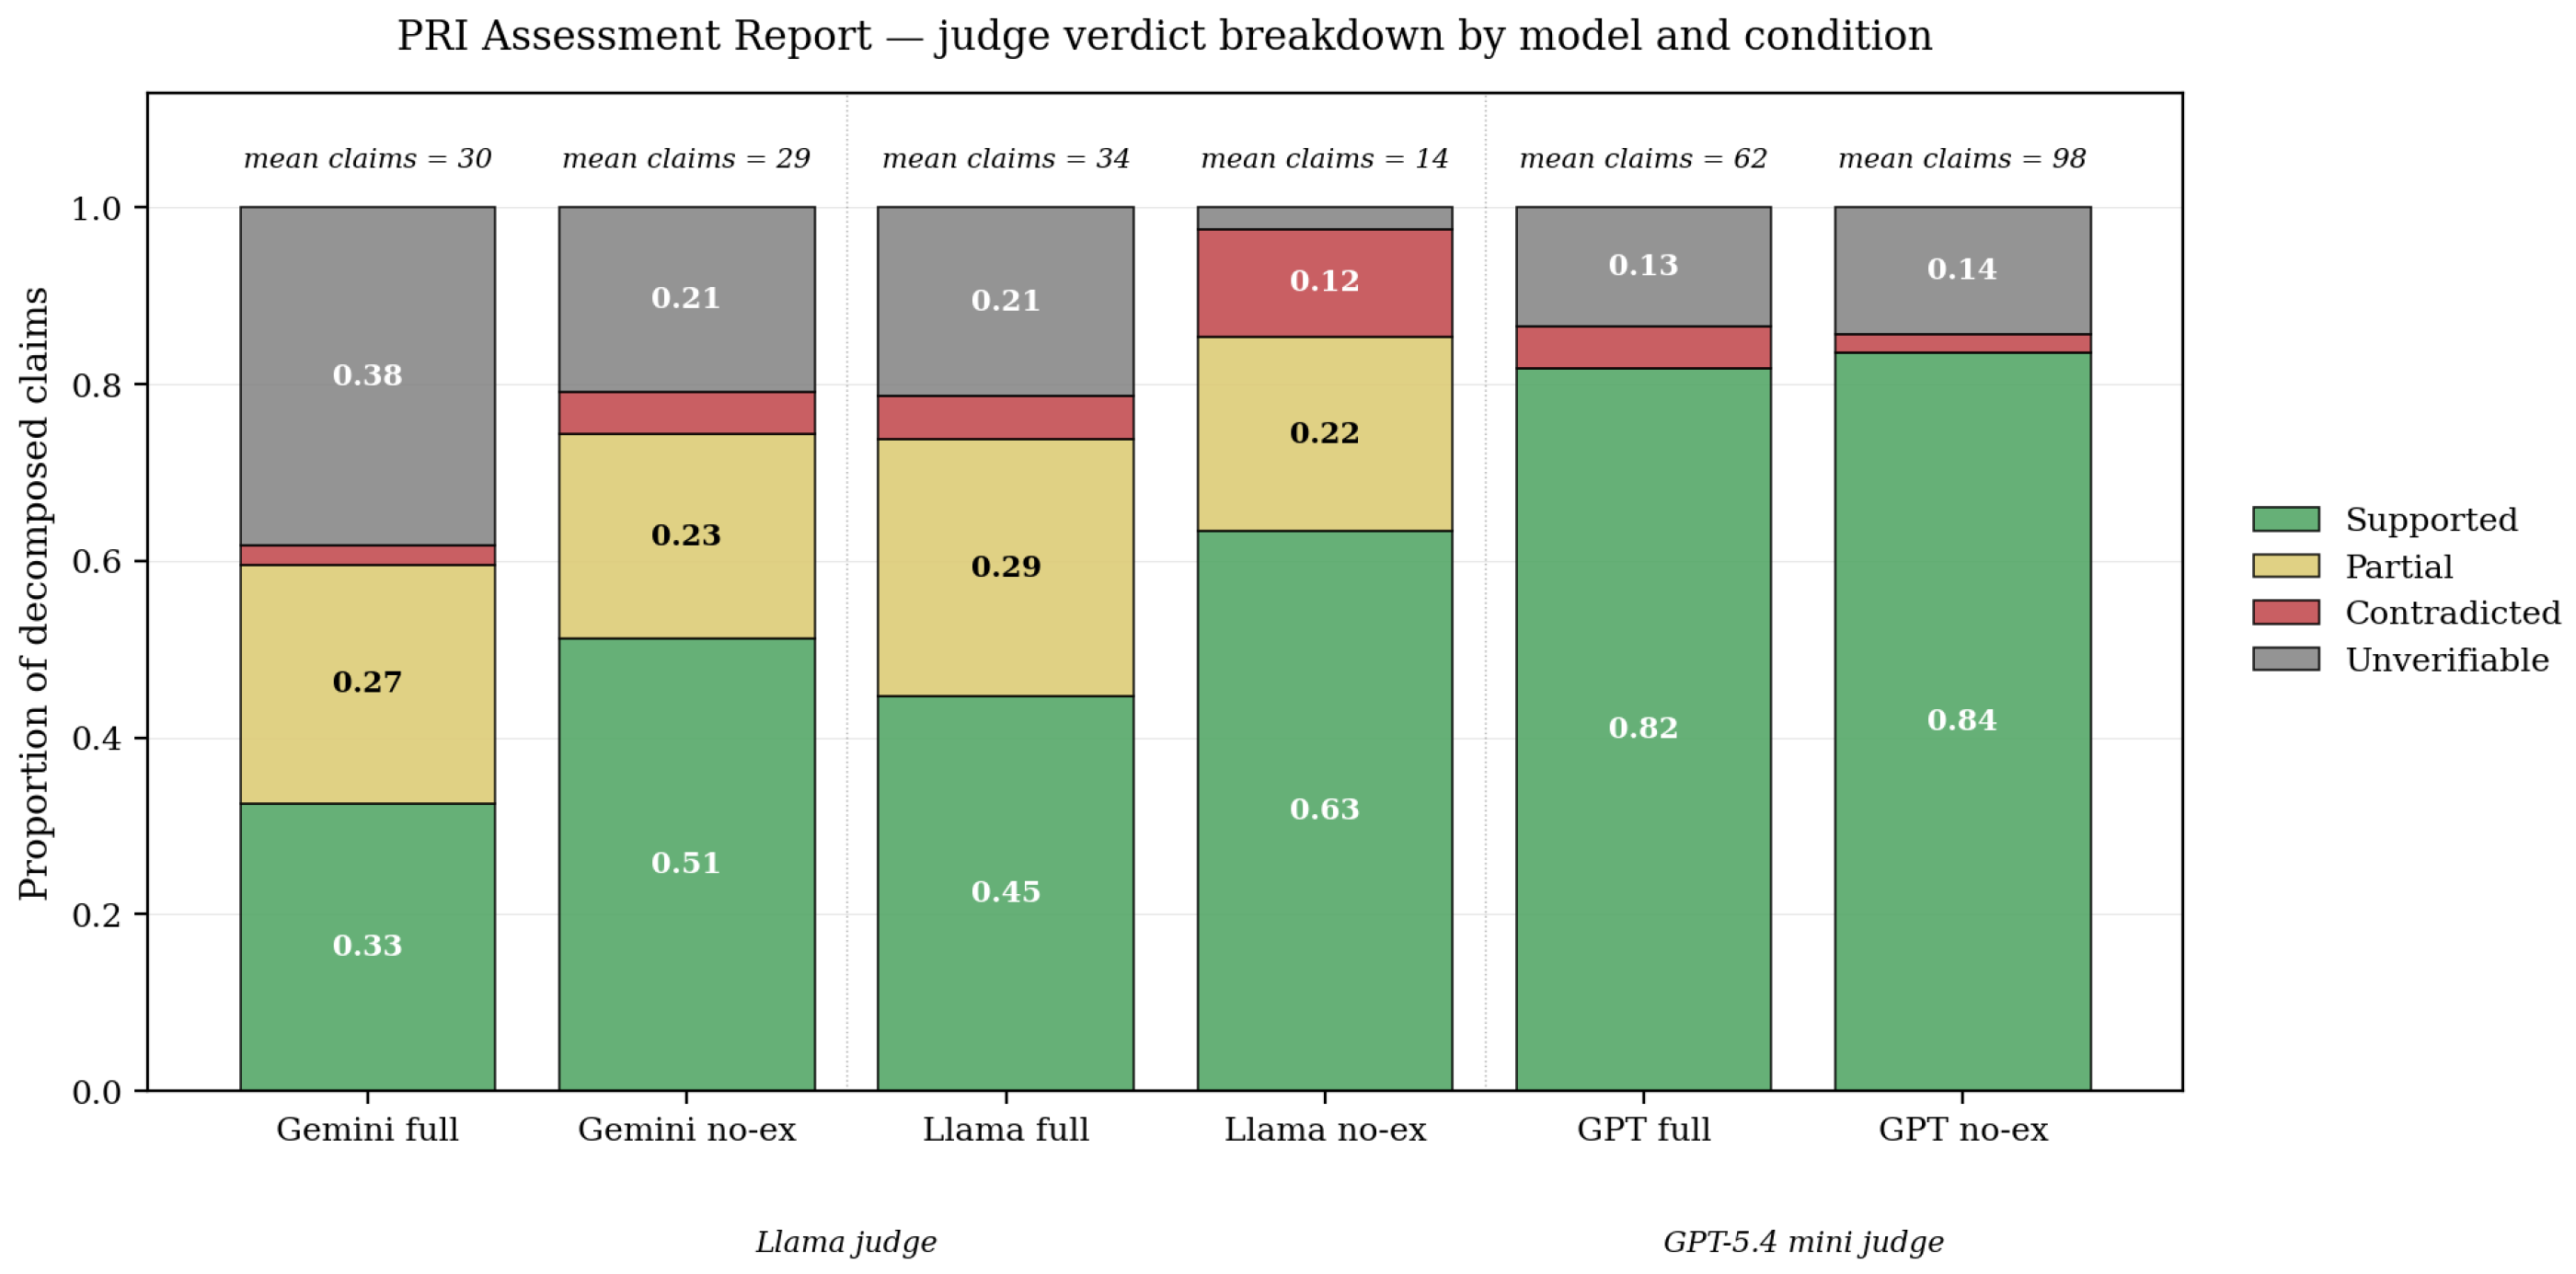
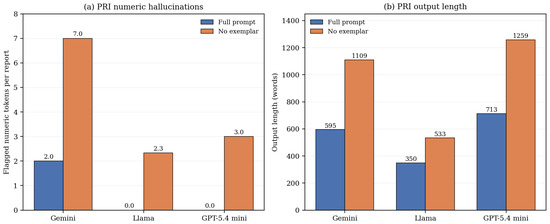
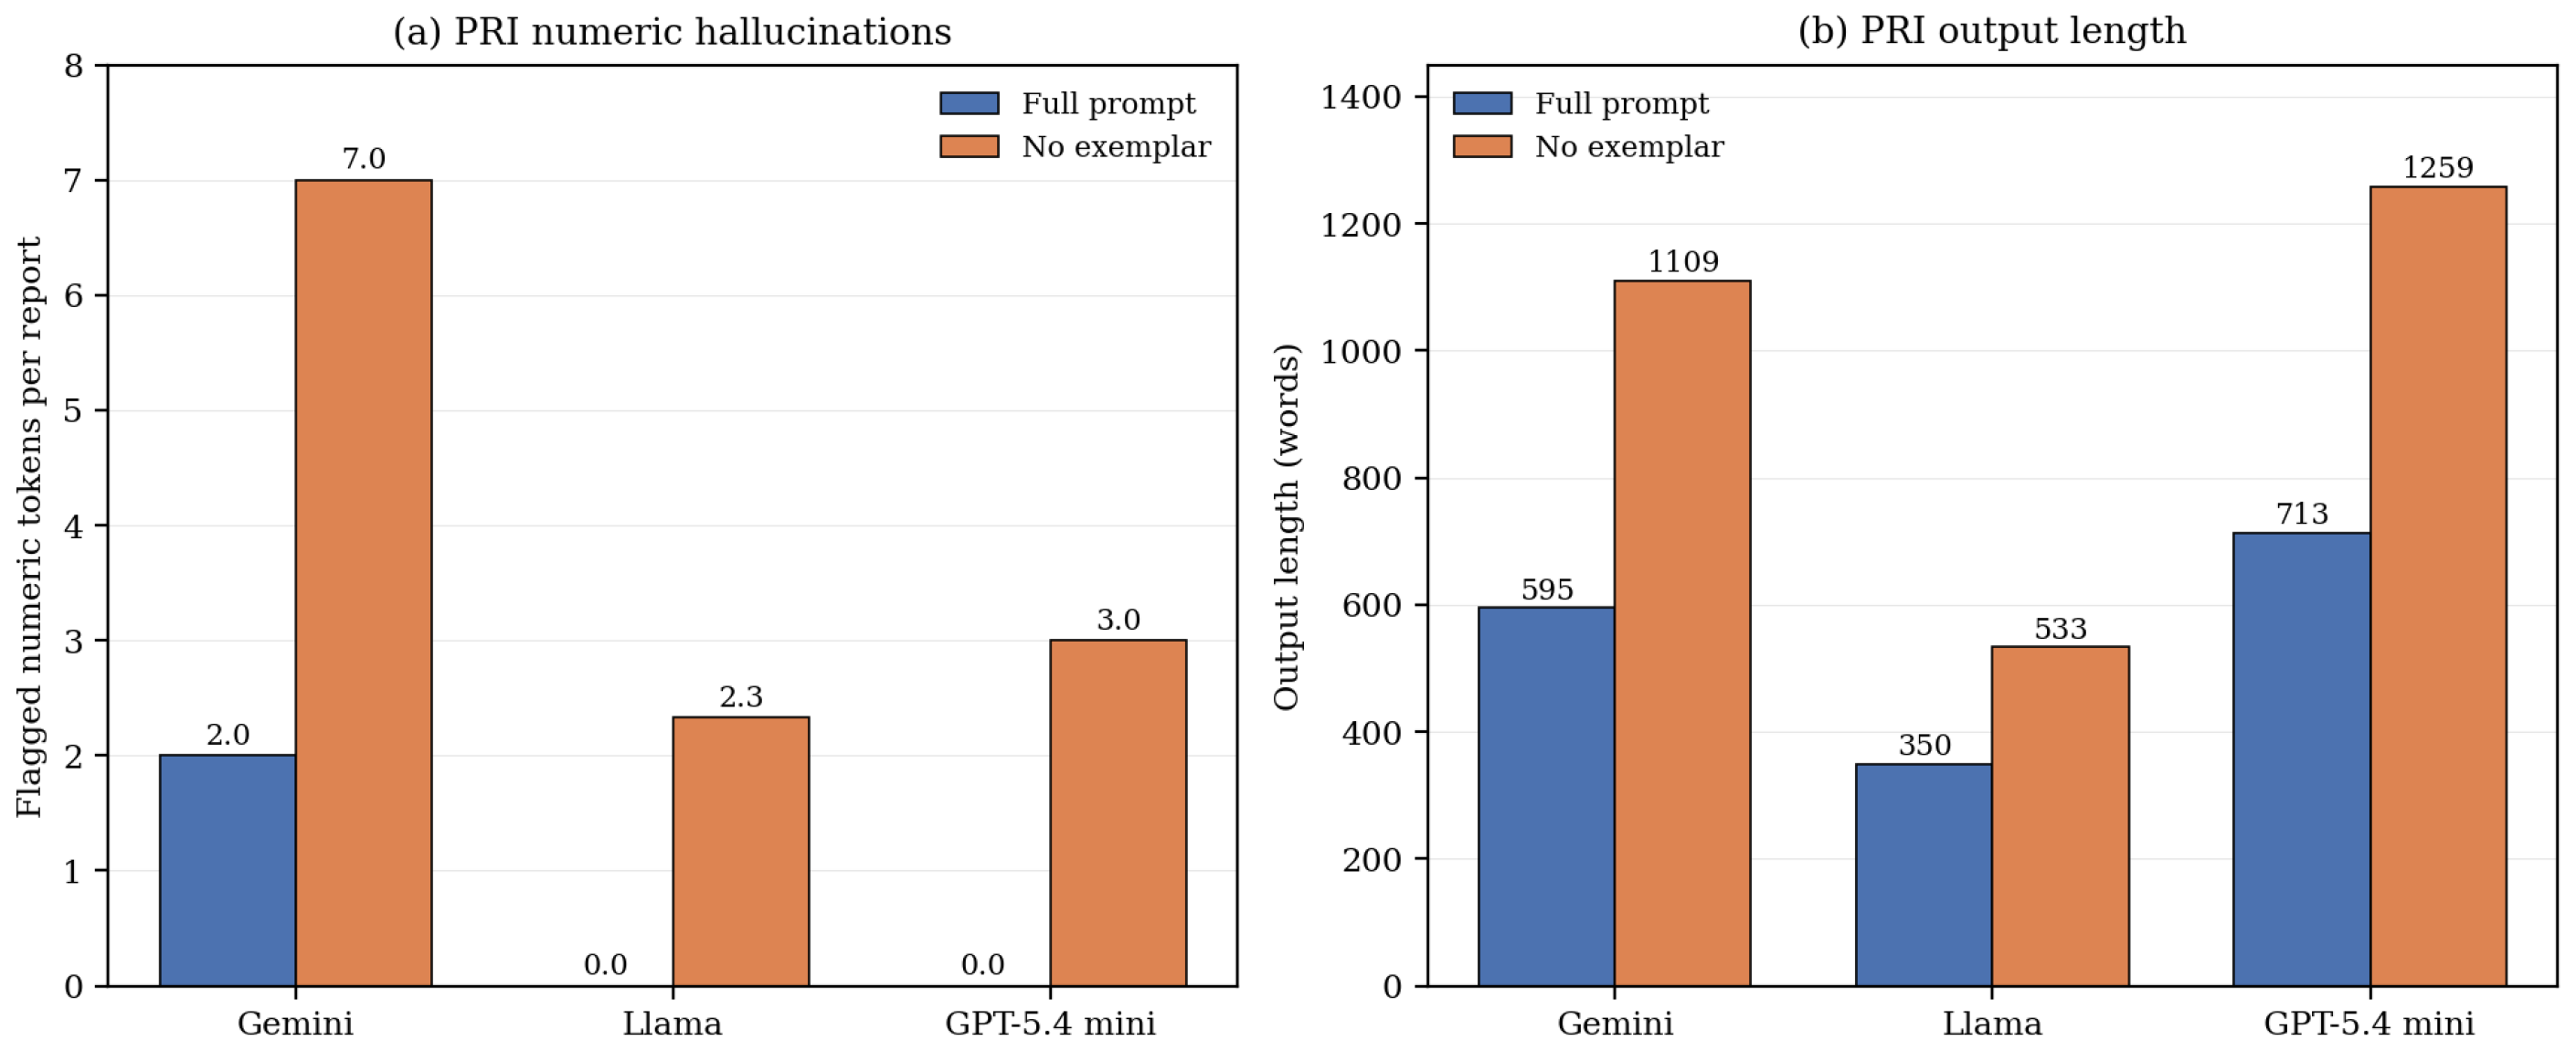

Disclaimer/Publisher’s Note: The statements, opinions and data contained in all publications are solely those of the individual author(s) and contributor(s) and not of MDPI and/or the editor(s). MDPI and/or the editor(s) disclaim responsibility for any injury to people or property resulting from any ideas, methods, instructions or products referred to in the content. |
© 2026 by the authors. Licensee MDPI, Basel, Switzerland. This article is an open access article distributed under the terms and conditions of the Creative Commons Attribution (CC BY) license.