


Abstract
A comprehensive diagnosis of the railway line aims to control its actual structure and geometric arrangement. Such railway inspections can help detect potential track deformation caused by operational loads and climatic effects. Geodetic monitoring appears to be a beneficial component of such diagnostics, particularly when modern terrestrial or aerial laser-scanning techniques are employed. The reliable determination of track deformation using geodetic contactless methods relies on precise measurements, high-quality instruments, and point-cloud processing, which is based on specific numerical procedures that help reveal possible track displacements or deformations. At the same time, the used geodetic methods should reflect the required minimal resolution depending on the size and type of the measured track geometric parameter. The paper presents a brief description of a comprehensive diagnostic conducted on the Tatra Electric Railway, a single-track, narrow-gauge line in the mountain tourist resort of northern Slovakia, with a closer focus on point-cloud processing acquired using geodetic methods.
1. Introduction
The geometric and structural parameters of the railway superstructure change over time due to the influence of operational loads and climatic effects. Slovak Railways, as the highest authority responsible for the safety and quality of the national railway lines, controls the regular implementation of railway diagnostics to prevent accidents caused by their inadequate quality. Suppose the permissible elasticity limits of the tested railway body are exceeded, permanent deformations of the track geometry occur, and this causes discomfort for passengers and an increase in operational and maintenance costs. The railway-monitoring companies have a wealth of reliable, accurate technology for determining relative changes in the structure. However, the track’s spatial changes relative to railway benchmarks, as determined by coordinates in the global national system, can only be defined using geodetic methods. The railways’ modernisation has increased operating speeds and introduced new structural elements to the track body, placing greater demands on track maintenance and diagnostics. The current measurement railway technologies reflect the requirements for the safe, fast, and precise determination of track geometric and structural parameters. The diagnostics wagon fully meets these requirements, but it is primarily intended for large-scale railway diagnostics due to its high operating costs. It is characterised by fast, continuous data recording using contact sensors mounted on the vehicle’s underside and by direct online transmission to the evaluation unit. Instead of the vast and expensive diagnostic wagons, low-cost, portable mobile lidar mapping systems or manual measuring vehicles are used for precise, reliable track measurement within a smaller diagnostic range. Geodetic measurement methods are also adapted for the continuous monitoring of the railway line’s spatial position. Robotic total stations, terrestrial or aerial laser scanners, and the kinematic method of a Global Navigation Satellite System (GNSS) are all considered suitable for railway diagnostics. An inertial measurement unit (IMU) with automatic tilt compensation can significantly improve data-acquisition accuracy. Recently, the popularity of satellite interferometry in geodetic applications has increased due to its ability to obtain detailed information about the Earth with sub-centimetre accuracy by combining special corner reflectors, GNSS observations, and precise levelling measurements. Accuracy was the main reason why terrestrial laser scanning (TLS) was chosen for deformation measurements in railway diagnostics.
The paper focuses on numerical processing of point clouds with a dataset of 3D coordinates (x, y, z), which is submitted to the preprocessing steps based on data filtering, cleaning, registering, and sampling to remove unnecessary noise and prepare for the processing phase, which consists of creating a 3D model, digital terrain model, drawing profiles or applying other numerical solutions. The primary expectations consisted not only of determining the digital model but especially of defining changes in the track geometric parameters over time, caused by operational and climatic loads. While one-time diagnostics provides the current railway track condition, deformation analysis requires comparing data from multiple measurements over various time cycles. This fact remains a challenge for processing laser-scanning data, as comparing at least two clouds of data obtained under different conditions and time periods requires a specific approach. If the digital model is the preferred output of laser scanning, we can compare corresponding model elements or complete the 3D model using relevant software tools. Another option for addressing deformations in point clouds is to use graphical-analytical tools to compare data arranged in longitudinal and transverse profiles of the appropriate model. Determining deformations via numerical techniques requires developing an algorithm that uses segmentation, feature extraction, clustering, and other tools to compare identical parts of the railway structure obtained at different times. Unlike the classical deformation analysis, which is based on comparing identical discrete points, the point cloud solution requires more extensive and more precise preparation of raw data to meet accuracy and reliability requirements. This paper describes the three sections of the Tatra Electric Railway that underwent comprehensive diagnostics using the mobile railway system KRAB and terrestrial laser scanning.
2. History and Characteristics of Tatra Electric Railway
The Tatra Electric Railway (TER) connects tourist centres in the High Tatras mountain resort in northern Slovakia. The High Tatras are a highly popular destination for both winter and summer tourism in Central Europe. Tourism began to develop here, thanks to the construction of railway lines in Slovakia in the mid-19th century. First, the mountain cogwheel railway began operating; later, other forms of transport, such as horse-drawn carriages, omnibuses, and trolleybuses, were introduced. The Tatra Electric Railway commenced construction in 1906, and by 1909, the entire Tatra railway network was operational. The development of tourism has also led to the construction of tourist centres, hotels, mountain huts, and sports facilities. Consequently, in addition to passenger wagons, freight wagons began operating to transport coal, bricks, cement, and other needed cargo. This single-track, narrow-gauge, electrified railway line is further connected by a high mountain cable car and lifts [1]. Currently, TER is part of the national railway network, managed by Slovak Railways, the authority responsible for national railway infrastructure. The Railway Company provides passenger services, and railway freight transport is controlled by the private company Cargo Slovakia. The entire Tatra Electric Railway is 35.060 km long, with a maximum elevation of about 650 m, and connects all the tourist destinations in the High Tatras. The nominal track gauge is 1000 mm. The railway top is based on a classical construction with a track grid, consisting of rails mounted on rib bases, set on wooden sleepers, and running on a gravel track bed. The design railway speed is approximately 50–60 km/h.
3. Materials and Methods of Comprehensive Diagnostics
Comprehensive railway diagnostics is the process of monitoring the actual condition of a railway section to determine its geometrical and structural parameters. The results of the railway diagnostics are evaluated against several criteria, including the Track Quality Index (see Section 4).
The diagnostics of Tatra Electric Railway were divided into three railway sections, which varied in terms of constructional and geometric parameters, as listed in Table 1. These sections lie along the railway’s height and directional curves, featuring various radii and planned traffic speeds. The total length of the experimental locality was approximately 1.5 km. Section No. 1 is situated over the bridge, near the railway station. The section is 250 m long, and the suggested traffic speed is 50 km/h. Its height difference in the longitudinal direction is 5.02 m. Section No. 2 is the longest, measuring 700 m, with a directional curve radius of 300 m and a designed traffic speed of 60 km/h. The longitudinal height difference in this section is about 19.70 m. Section No. 3 has an equal directional curve radius and designed speed as the second section, but the whole longitudinal elevation of the section is about −3.15 m.
Table 1.
Design characteristics of the three railway tested sections.
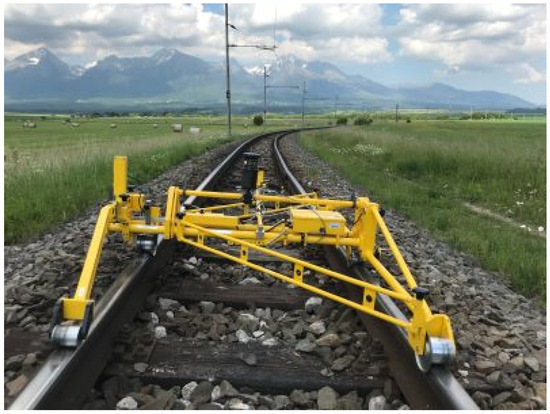
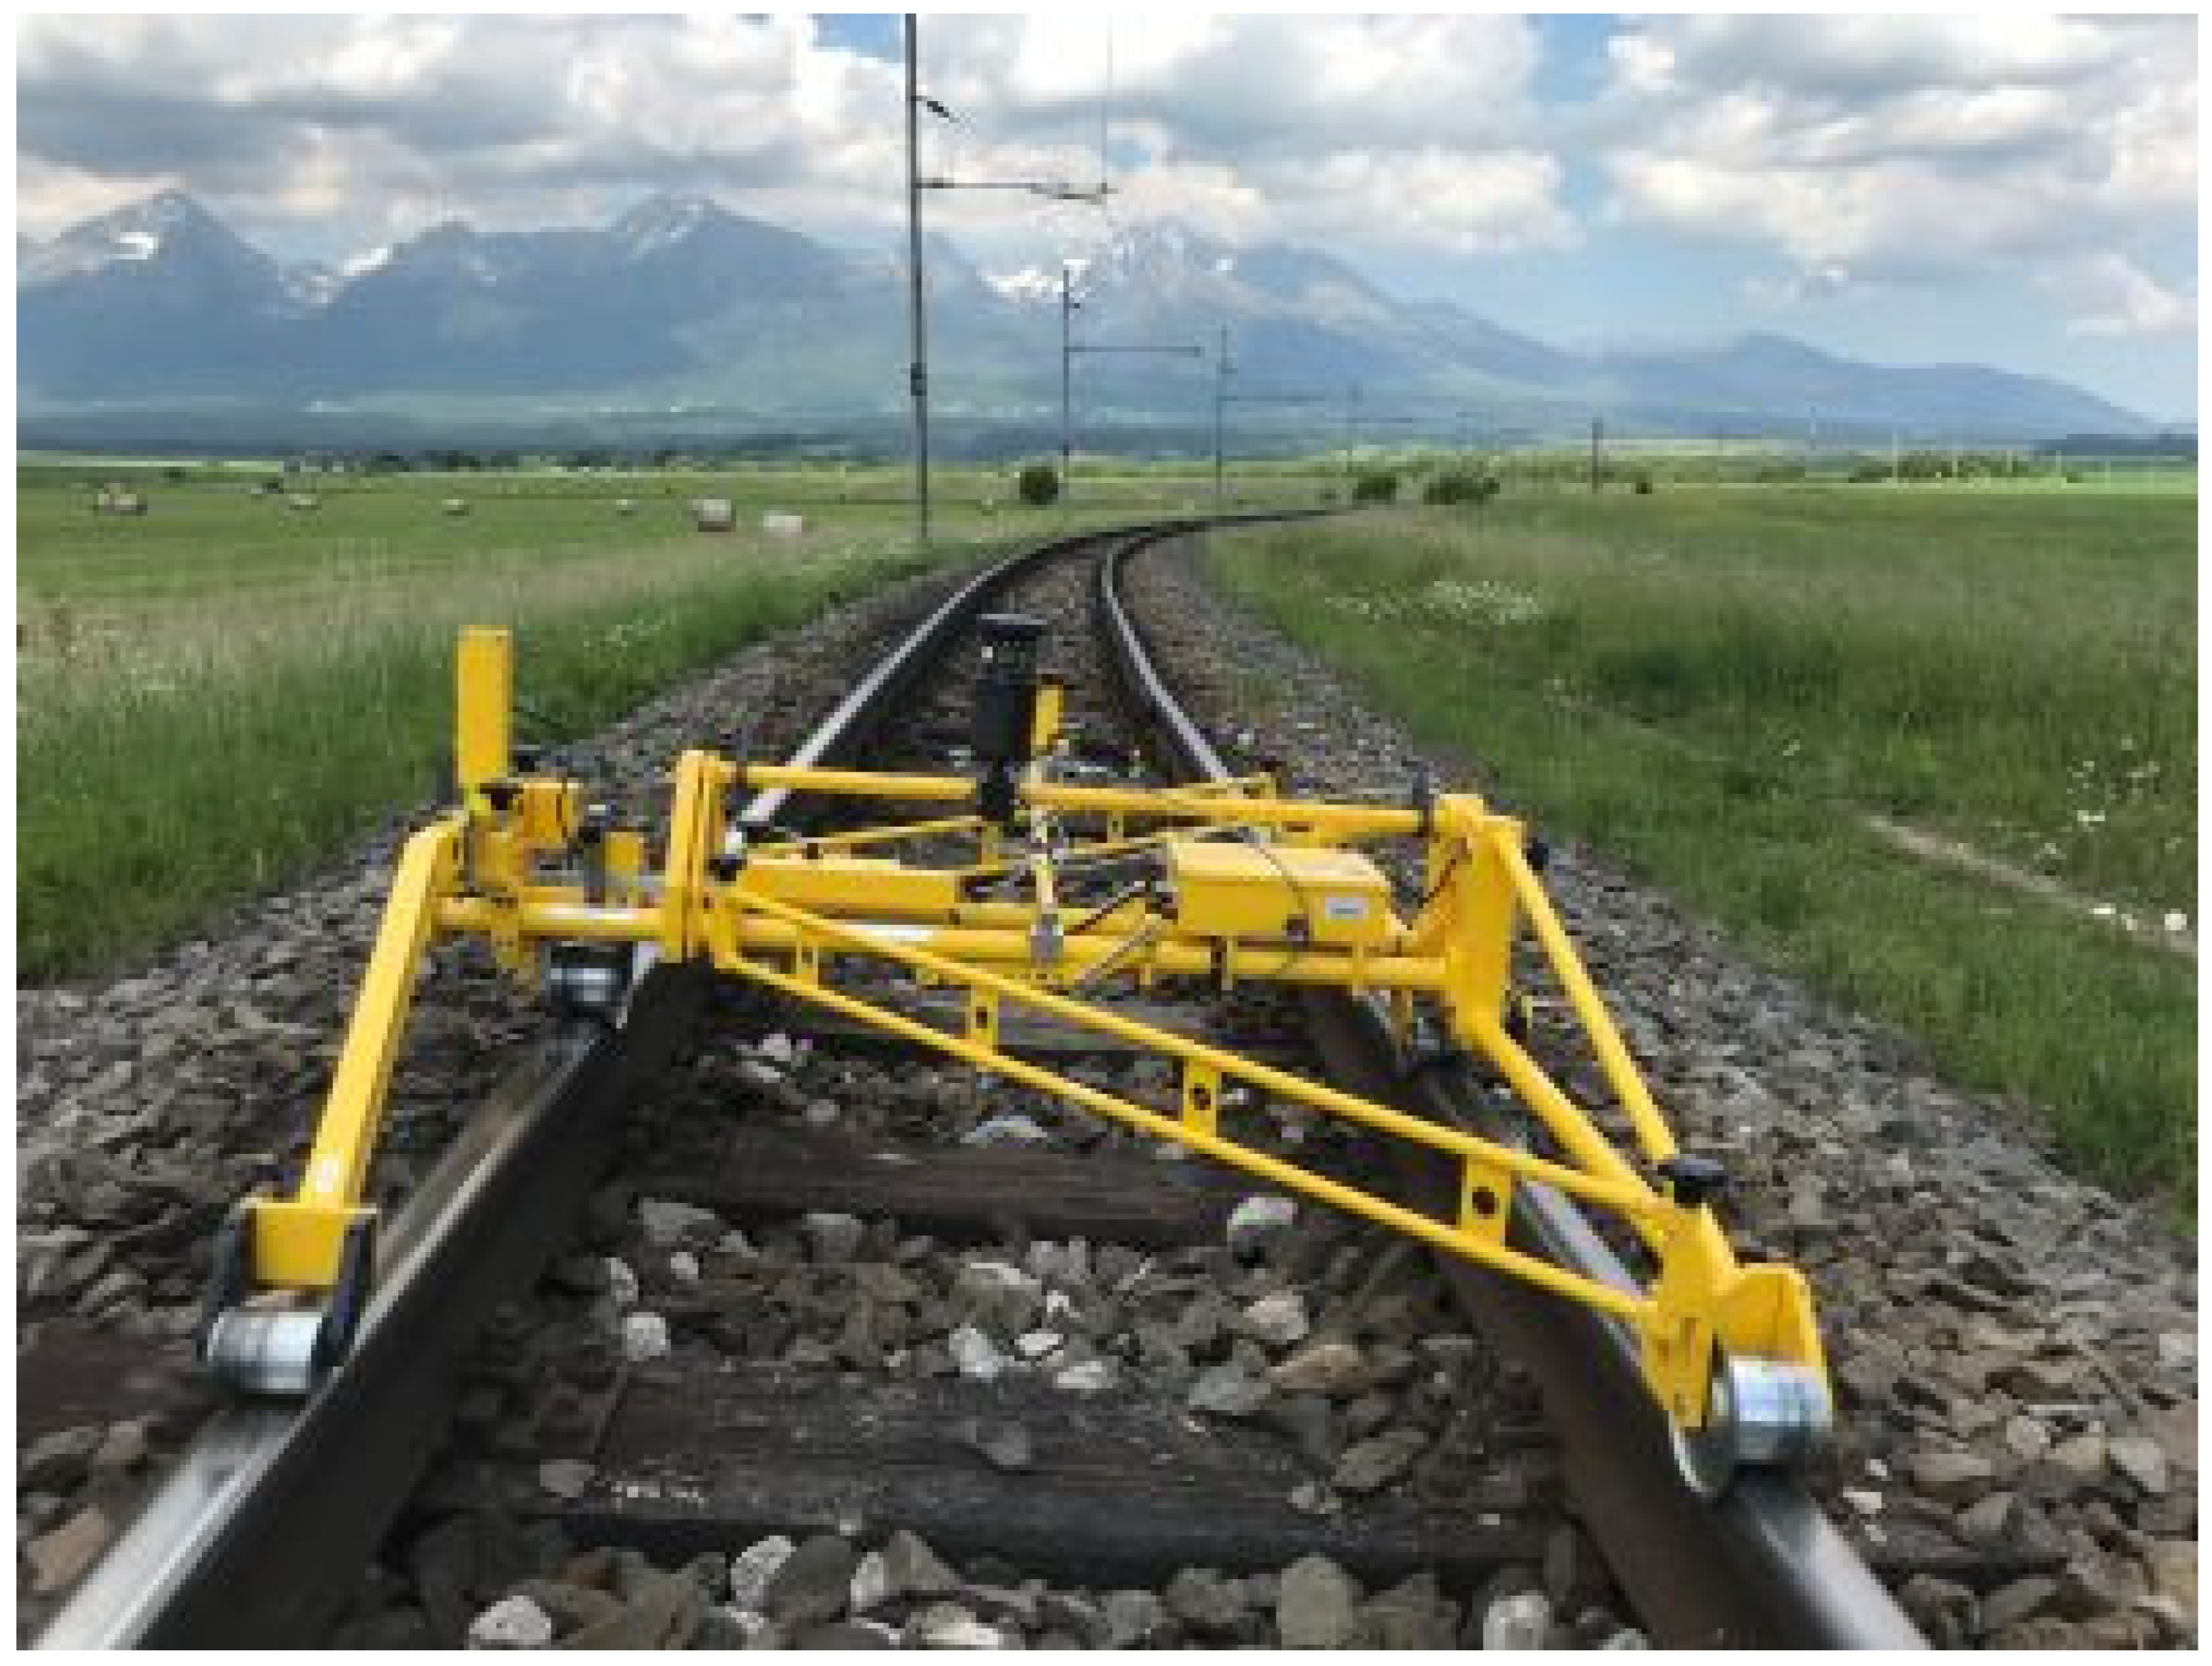
The comprehensive diagnostics was conducted by the Department of Railway Construction and Track Management and the Department of Geodesy at the University of Žilina, at the initiative of Slovak Railways. The diagnostics process involved applying several technologies with different physical principles. The overall track condition was determined by continuous measurement of the track’s relative geometric position using a mobile system, KRABTM–Light (KRAB), which identifies the character and magnitude of directional and longitudinal track displacements by tracking longitudinal changes in the track grid and rail strips. This measuring vehicle (Figure 1) provides digital outputs of the complete geometric track parameters, including track gauge measured by a potentiometer, horizontal and vertical track rise, track elevation measured by an inclinometer, track short collapse, and travelled distance obtained by an incremental rotary sensor.
Figure 1.
Digital mobil system KRABTM–Light with mounted reflector of robotic total station. Source: Comprehensive diagnostics of Tatra Electric Railway.
Static loading tests were conducted to assess deformation resistance at the railway subgrade plain and the sleeper bearing surface at 50 m intervals along the tested section. The static tests were carried out on the inner rail strip, rail toe, ballast layer, and in the track axis, in two loading and unloading cycles with basic load levels of 0, 50, 100, 150, and 200 kPa. For both loading cycles, the static modulus of deformation Edef1 and Edef2 (MPa) were calculated according to the formula:
where Poisson’s number μ depends on the properties of the bulk material, r is the load plate radius, Δp is the change in contact stress in MPa, and Δy is the change in load plate drop in metres. The quality of the layer material of the tested railway subgrade is considered satisfactory if the compaction rate Edef2/Edef1 is less than 2.6. The static tests performed at 37 points lying in the railway subgrade plain and 10 points lying in the sleeper bearing surface show that none of the compaction-rate values exceeded the permissible number 2.6. This means that the compaction quality of the built-in material meets the specified requirements. From the four test pits in which static loading tests were also conducted, railway body material was collected and subjected to granulometric analysis at the university geotechnical laboratory. The tested material, consisting of sandy clay, high-plasticity clay, and low-plasticity clay, was evaluated using the software SOILAB 1.0 to determine soil moisture and physical-mechanical properties. From the granulometric analysis, it is clear that the track gravel contained a larger proportion of washable particles, and even the grain shape index is not satisfactory in many cases. This finding correlates with the fact that the track gravel has not been cleaned for a long time.
The results of all measurements are presented in the research report [1] and have been submitted to the responsible personnel of Slovak Railways for assessment of the need for reconstruction by introducing a new type of railway structure.
3.1. Methods of Geodetic Monitoring
Terrestrial laser scanning was the primary method used for geodetic monitoring to determine deformations in the railway line construction caused by operational loads and climatic changes over three years. Laser scanning is a convenient method for railway measurements because it is contactless, eliminating the need to enter the operating area. This fact follows from the principle of laser scanning, which involves emitting high-speed light pulses to the object, causing it to reflect and return to the Leica LiDAR sensor. The distance between the scanner and object is measured by determining the elapsed time between the sent and received pulses. Laser scans are acquired from multiple positions along a railway line using a precise terrestrial laser scanner, the Leica ScanStation P30, with a defined 3D positional accuracy of 6 mm at 100 m or 3 mm at 50 m. The raw data were based on the 3D coordinates of each point on the scanned railway object, with an instrument resolution of 1.6 mm per 10 m. In addition to terrestrial laser scanning, the kinematic continuous GNSS method, using a manually operated mobile vehicle, was also applied. The data-acquisition speed was substantially higher, but accuracy decreased slightly, even with an Inertial Measurement Unit (IMU) that incorporates an accelerometer and a gyroscope as tilt-compensating sensors for the GNSS antenna. The fast-static GNSS method and the spatial polar method were also used to georeference 34 ground control points (GCPs) and 12 railway benchmarks to the European Terrestrial Reference System (ETRS89) using a Leica VIVA SmartStation, achieving positional accuracy of 2 mm and height accuracy of 4–5 mm. Georeferencing involves a least-squares adjustment of GCPs, applied in the Burša–Wolf seven-element similarity transformation with Jung’s additional post-transformation. The heights of GCPs were determined by a two-way levelling line using a precise digital level (Leica DNA03), with a defined unit standard deviation of 0.3 mm.
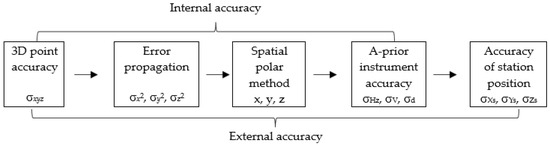
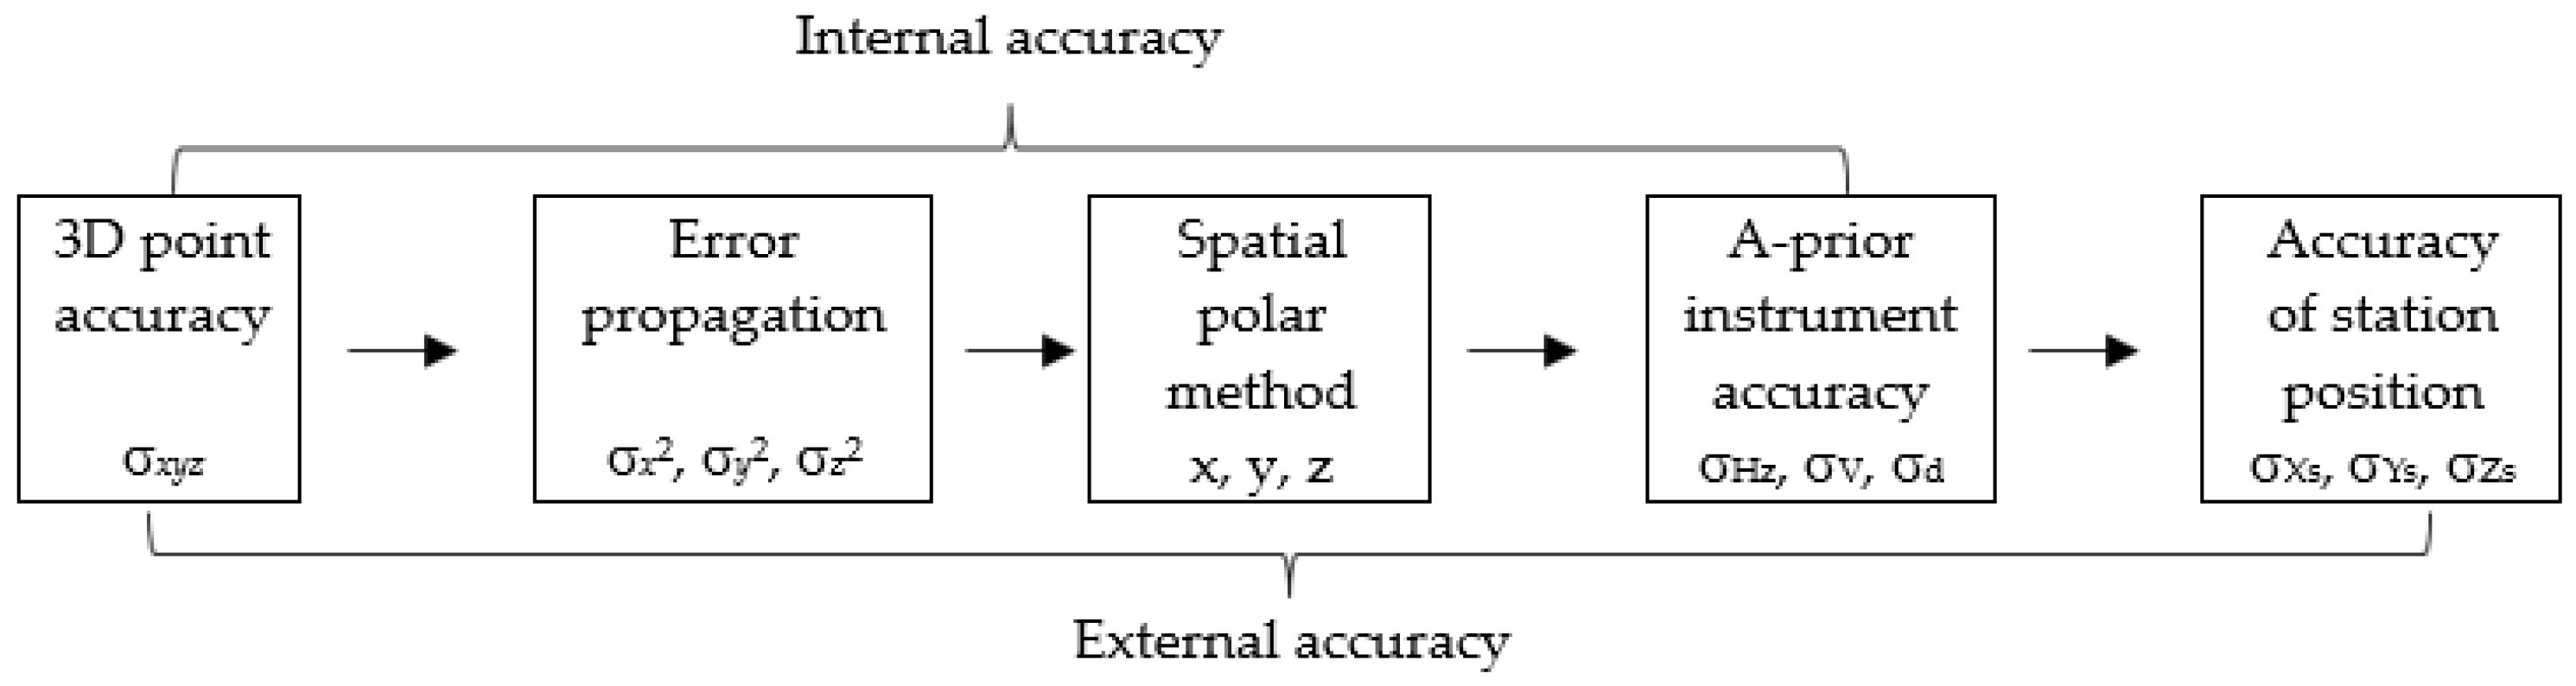
The accuracy of a point involved in the point cloud obtained by laser scanning is calculated by the method of error propagation, schematically displayed in Figure 2, where spatial standard deviation σxyz depends on the square root of the sum of variances σx2, σy2, and σz2 of a point’s coordinates obtained by the spatial polar method. Standard deviations σHz, σV, and σd represent the instrument accuracy of measured horizontal angle Hz, vertical angle V, and distance d, and σXs, σYs, and σZs are standard deviations of a GCP related to the GNSS static method and digital levelling. In point-cloud georeferencing to the global coordinate system, external accuracy is taken into account. Otherwise, internal accuracy is sufficient.
Figure 2.
Scheme of error propagation of a point cloud.
3.2. Numerical Solutions of a Point Cloud
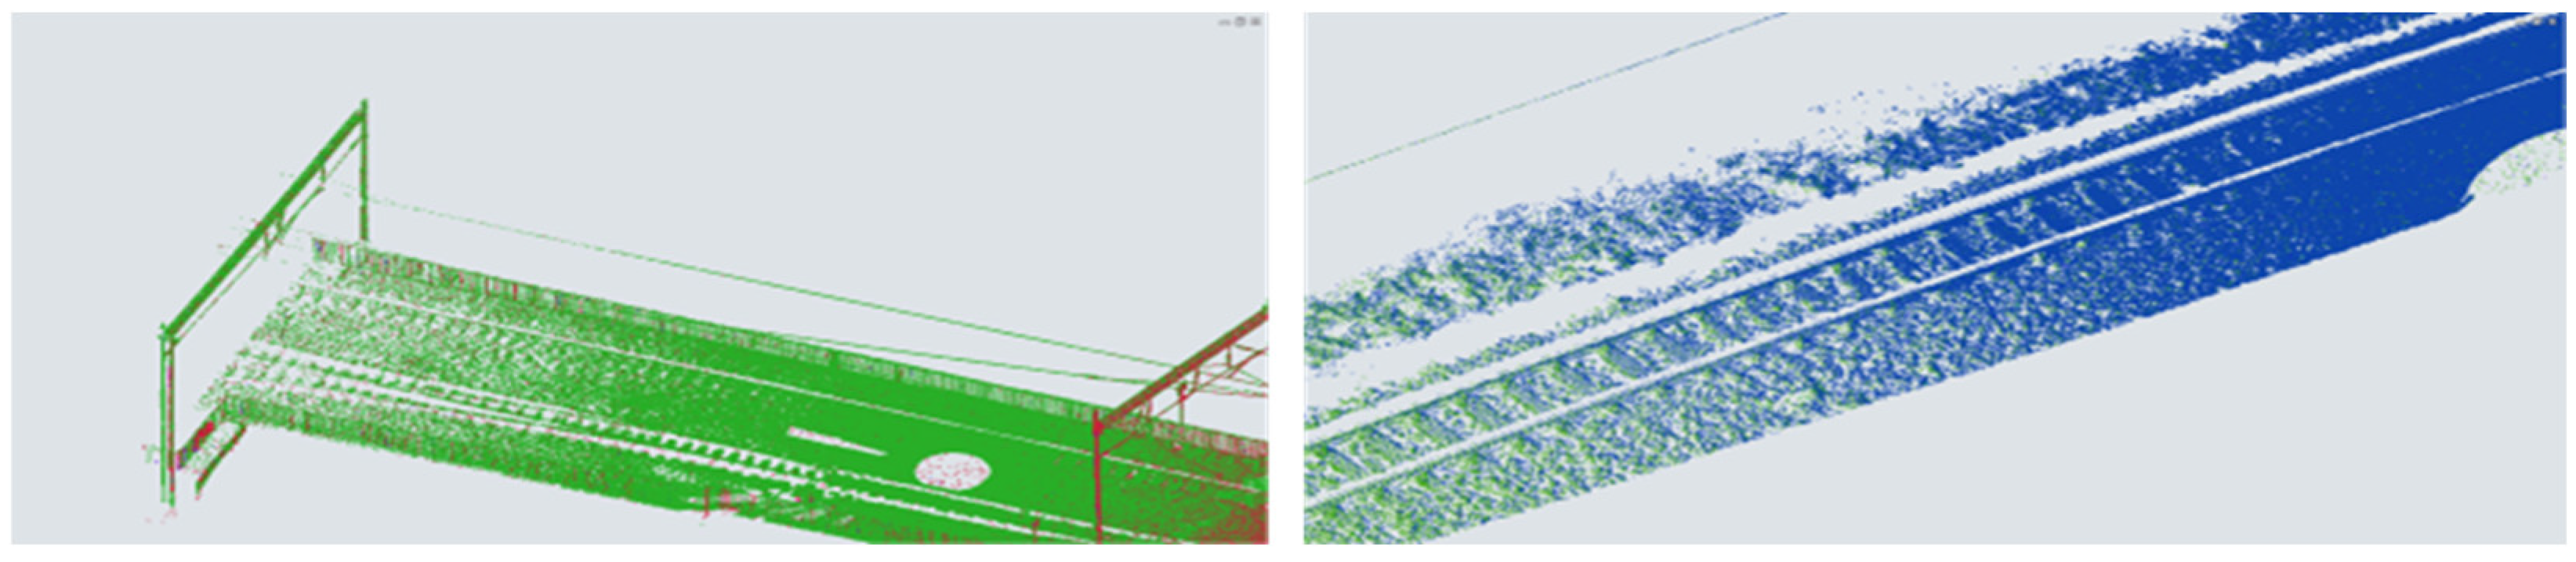
The point-cloud solution is the most time-consuming phase, which requires specialised software and hardware with sufficient memory and cloud storage. The processing phase is preceded by a preprocessing that involves preparing raw data (Figure 3) into a format suitable for the solution and involves data filtering, which removes points that are either invalid or unnecessary; data sampling, which helps minimise memory requirements and reduce computational requirements in the processing phase; data registration and integration, which involves joining and combining data from multiple sources to create a unified dataset; and data conversion into form appropriate for further solutions and analysis.
Figure 3.
Point-cloud sample from two railway sections. Different colours represent different altitude. Source: Terrestrial laser scanning in Tatra Electric Railway.
A significant portion of the point-cloud processing was devoted to identifying identical parts (clusters) of the railway track, which were compared with those acquired in other measurement cycles. A least-squares and robust method was used to estimate the weighted mean of a cluster. Weights were based on the dispersion of data within a cluster. The development of numerical algorithms (Figure 4) was inspired by the application of procedures such as clustering, segmentation, and filtering used in professional 3D modelling software.
Figure 4.
Algorithm of point-cloud solution and analysis.
The principle of point-cloud segmentation is a well-established method for object recognition, classification, and tracking in 3D modelling, based on deep learning, with wide applications in robotics, autonomous mobile systems, medical diagnostics, construction, transportation infrastructure, farming, crop cultivation, and protection, as well as other industries utilising augmented reality. IT experts have developed algorithms for point cloud segmentation, each with its own strengths and weaknesses [2]. These algorithms are part of applications whose primary limitation is the computational complexity of large datasets. They are based on various numerical approaches that employ filtering procedures derived from statistical methods, differential equations, and hybrid techniques [3,4,5,6,7,8]. The numerical algorithm was applied to the extracted transverse track profiles, created at 5 m intervals along the longitudinal track axes. Clustering was performed along each transverse profile in a local transversal system with a step of 0.05 m in the x and z axes and 0.03 m in the y axis, while the z-coordinate was located at the cluster median. The point cloud segmentation and clustering were performed within a cluster dimension of 0.05 m × 0.03 m, which defined the limits for outlier detection and the calculation of cluster statistics, such as median and dispersion. The dispersion was calculated from all internal cluster points and was used to determine the cluster’s weight. The median appears to be a suitable option due to its robustness to outliers in data files. So, the size of the cluster represents the limits for identifying outliers outside the cluster, which were not used in further data processing. The primary condition for comparing data across measurement cycles was to maintain the positional accuracy of the transversal profiles and to apply the same numerical algorithm to the most precisely defined clusters. The accuracy of the deformation calculation depends significantly on the a priori accuracy of data collection, the accuracy of point-cloud registration, and the error propagation during numerical calculations. Leica Cyclone Register provides a useful tool for data accuracy analysis and graphical quality control by its Accuracy Report, which includes Root Mean Square (RMS) computed from residuals of each link between two stations and Target Error computed for each individual target. The overall quality of cloud-to-cloud registration is given by the Absolute Mean Error, which represents the bundle error. Table 2 provides an overview of the overall error computed for each measurement cycle in each TER section.
Table 2.
Overall errors computed in the TER sections.
The overall errors represent the accuracy of point-cloud registration. The deformation analysis needs another way to determine the final accuracy. One way is to compare the tested track parameter obtained from point-cloud processing with the in situ measurements. Another way is comparison with the KRAB data. Both possibilities lead to another type of error, resulting from the inability to identify identical parts of the railway structure with the theoretical ones obtained from point cloud processing. with sufficient accuracy. KRAB is a mobile vehicle with continuous data acquisition in a geocoding system, unlike a point cloud, which is processed in a 3D Cartesian coordinate system via georeferencing. The third possibility for accuracy analysis is to compare the computed railway gauge with the projected one in a straight section of the railway track. The result of such an analysis is RMS error in the first TER section is 0.007 m; in the second one, 0.012 m; and in the third one, 0.011 m; while the number of compared points lying in the straight line was n1 = 12, n2 = 34 and n3 = 18.
4. Results and Analysis
The results of the comprehensive diagnostics and geodetic monitoring of the Tatra Electric Railway were submitted to the competent persons of Slovak Railways in the form of a research report [1], which includes graphical and numerical summaries, an accuracy evaluation, and relevant recommendations. The values obtained by the manual vehicle KRAB were processed by KRAB 8.1 software, which generates numerical and graphical outputs of track geometrical parameters; a list of local errors represented the standard deviations determined in the railway sections, which exceed limit values prescribed in technical direction [9]; and sectional and overall quality assessment of the track geometrical parameters, which is given by Track Quality Index (TQI) calculated according to the formula
where SDOtg, SDOtd, SDOte and SDOle are standard deviations defined as the measures of dispersion of the directional and height parameters obtained every 0.25 along the railway line: track gauge, transversal direction, track transversal elevation, and track longitudinal elevation. An infrastructure manager recommends a method for calculating the TQI that varies by country [10,11]. In Slovakia, the values of weighted factors are specified in the technical railway direction [9] as follows: wtg = 0.6, wtd = 0.16, wte = 0.16, and wle = 0.16. The limit values of TQI and other quality indices are also recommended by the direction, which helps reliably evaluate the diagnosed railway line. The standard deviations in Formula (2) are the accuracy characteristics computed using the well-known formula
where n is the number of measured values, and ei are the residuals calculated as the differences from the mean value of the relevant i-th geometrical parameter. Table 3 presents the quality assessment of three TER sections based on the estimated standard deviation of a relevant geometric parameter and the computed TQI (1). This widely used quality index is compared with recommended values based on the railway section’s design characteristics (speed, gauge, overall track arrangement).
Table 3.
Assessment of the quality of Tatra Electric Railway sections.
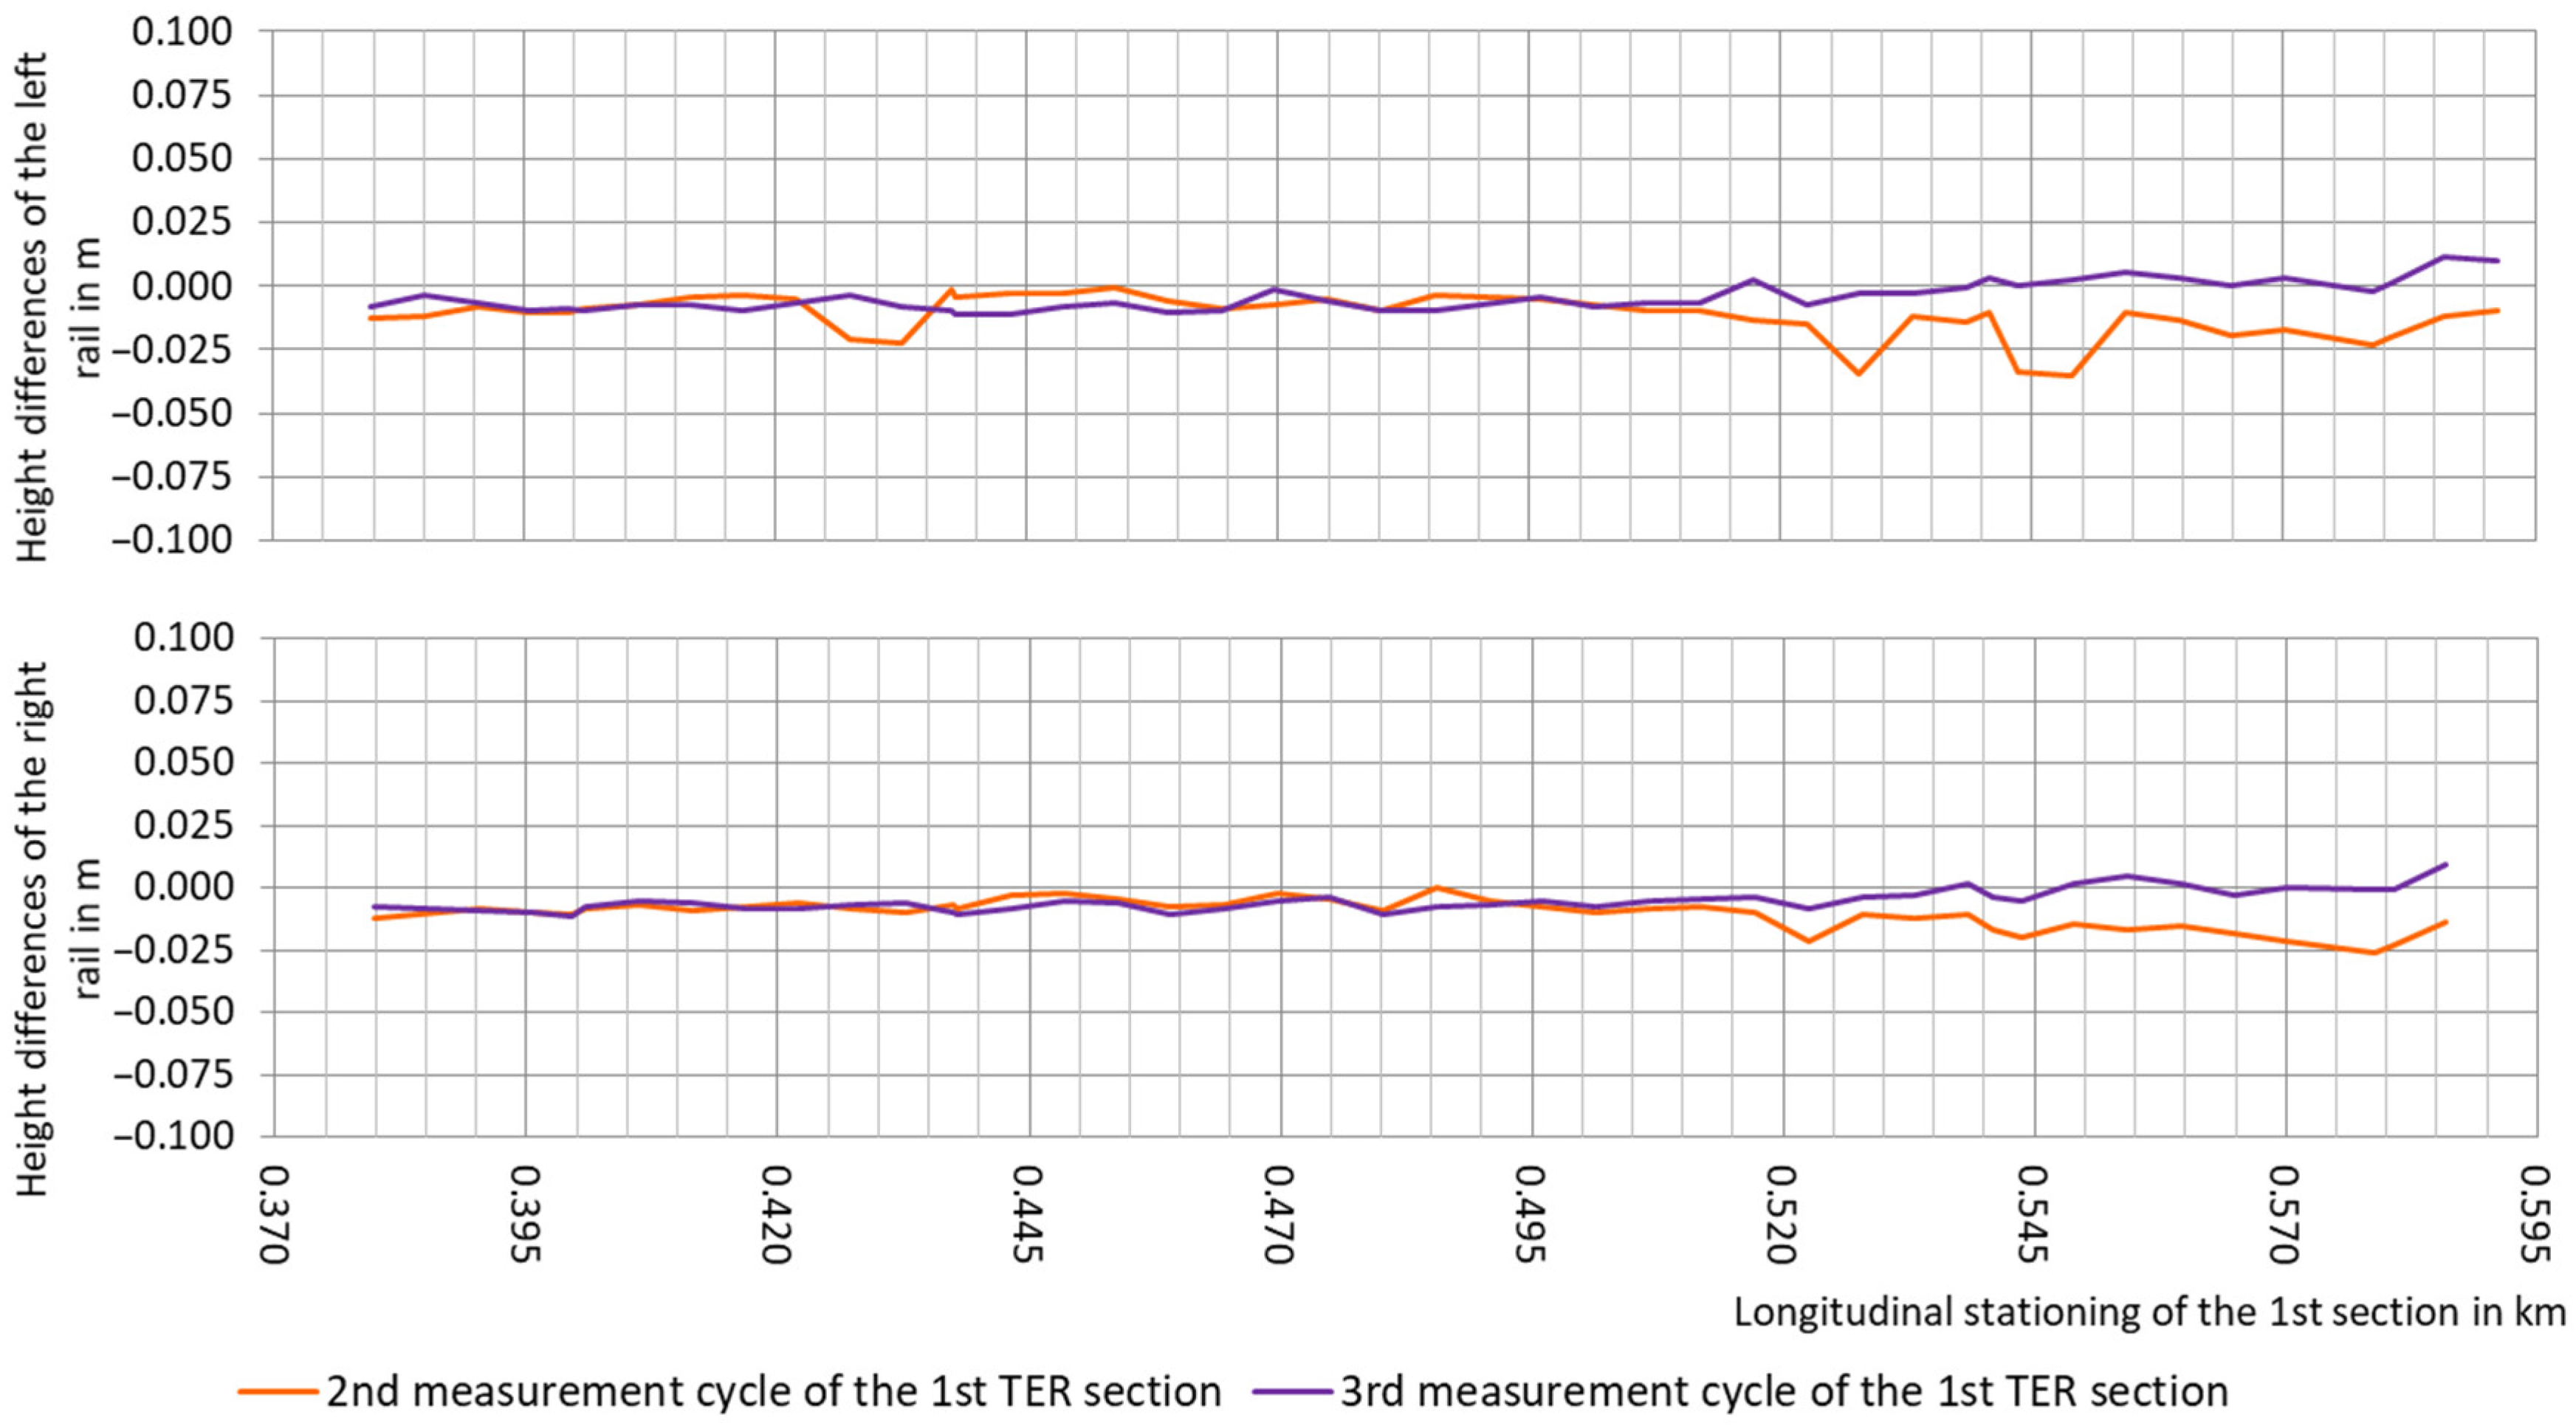
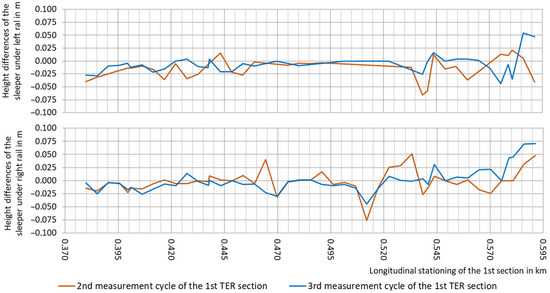
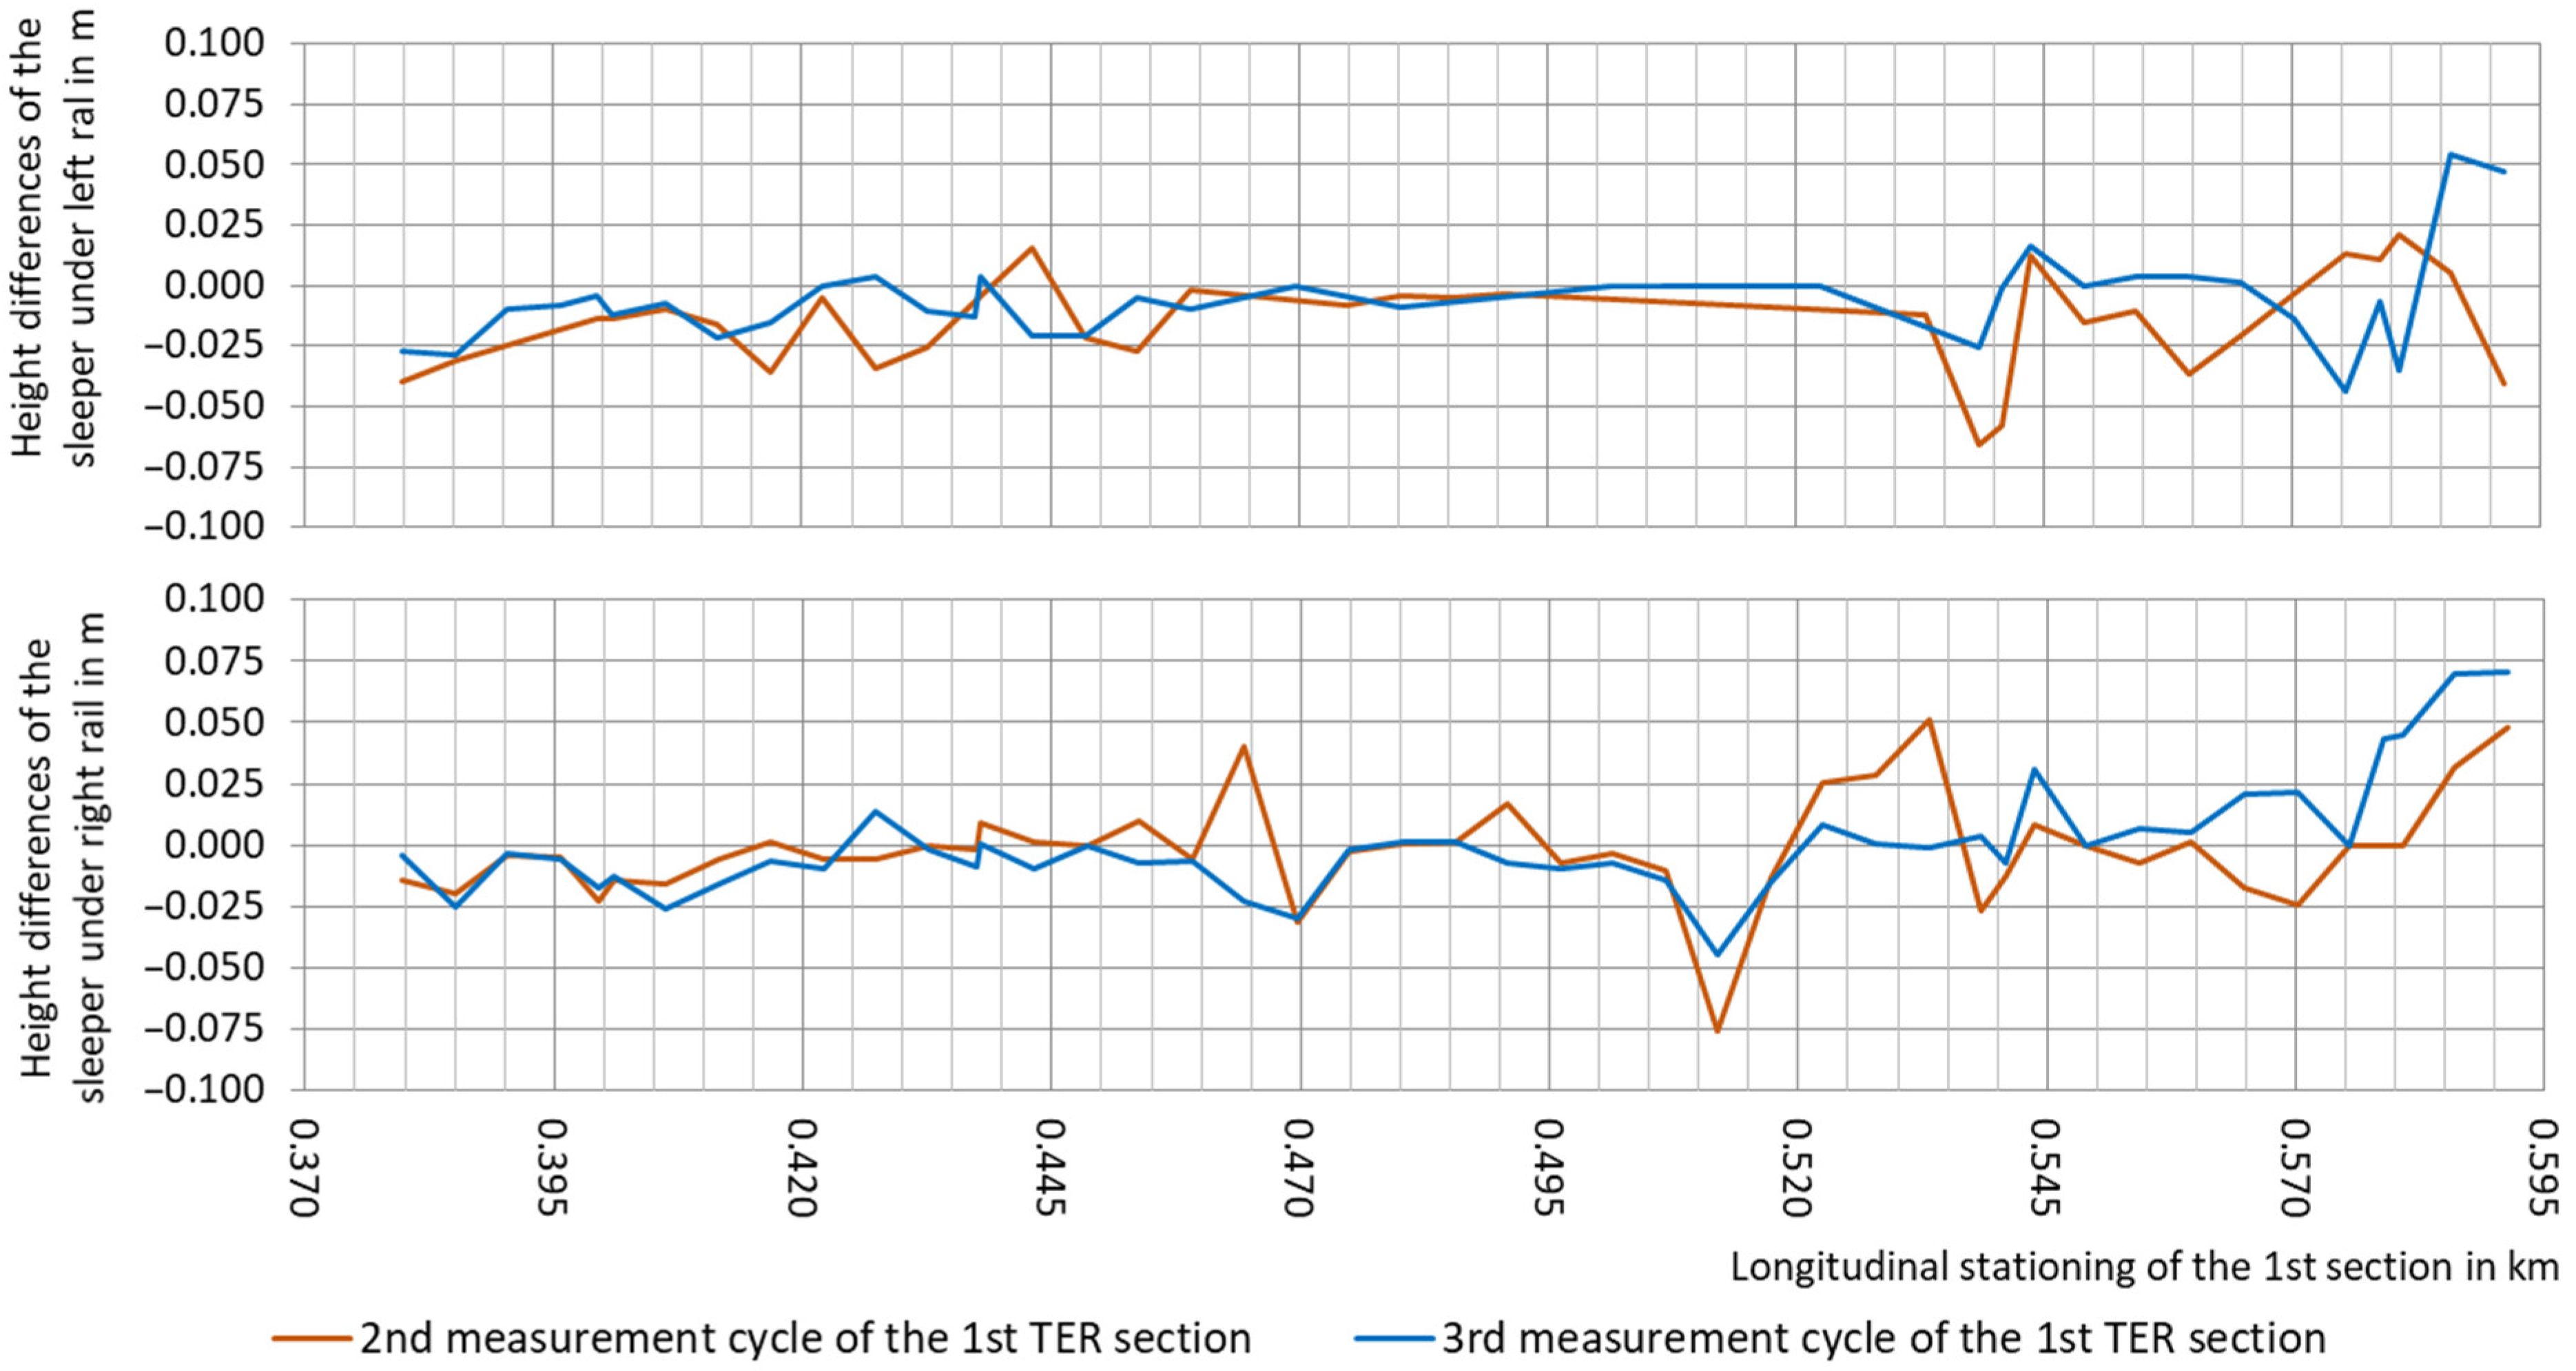
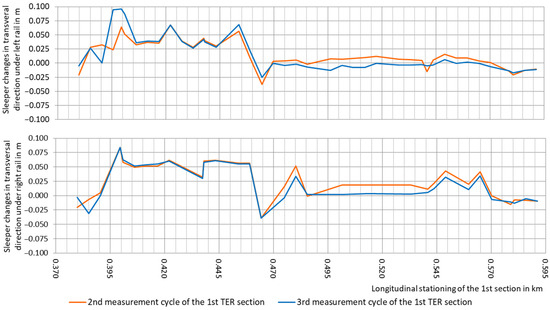
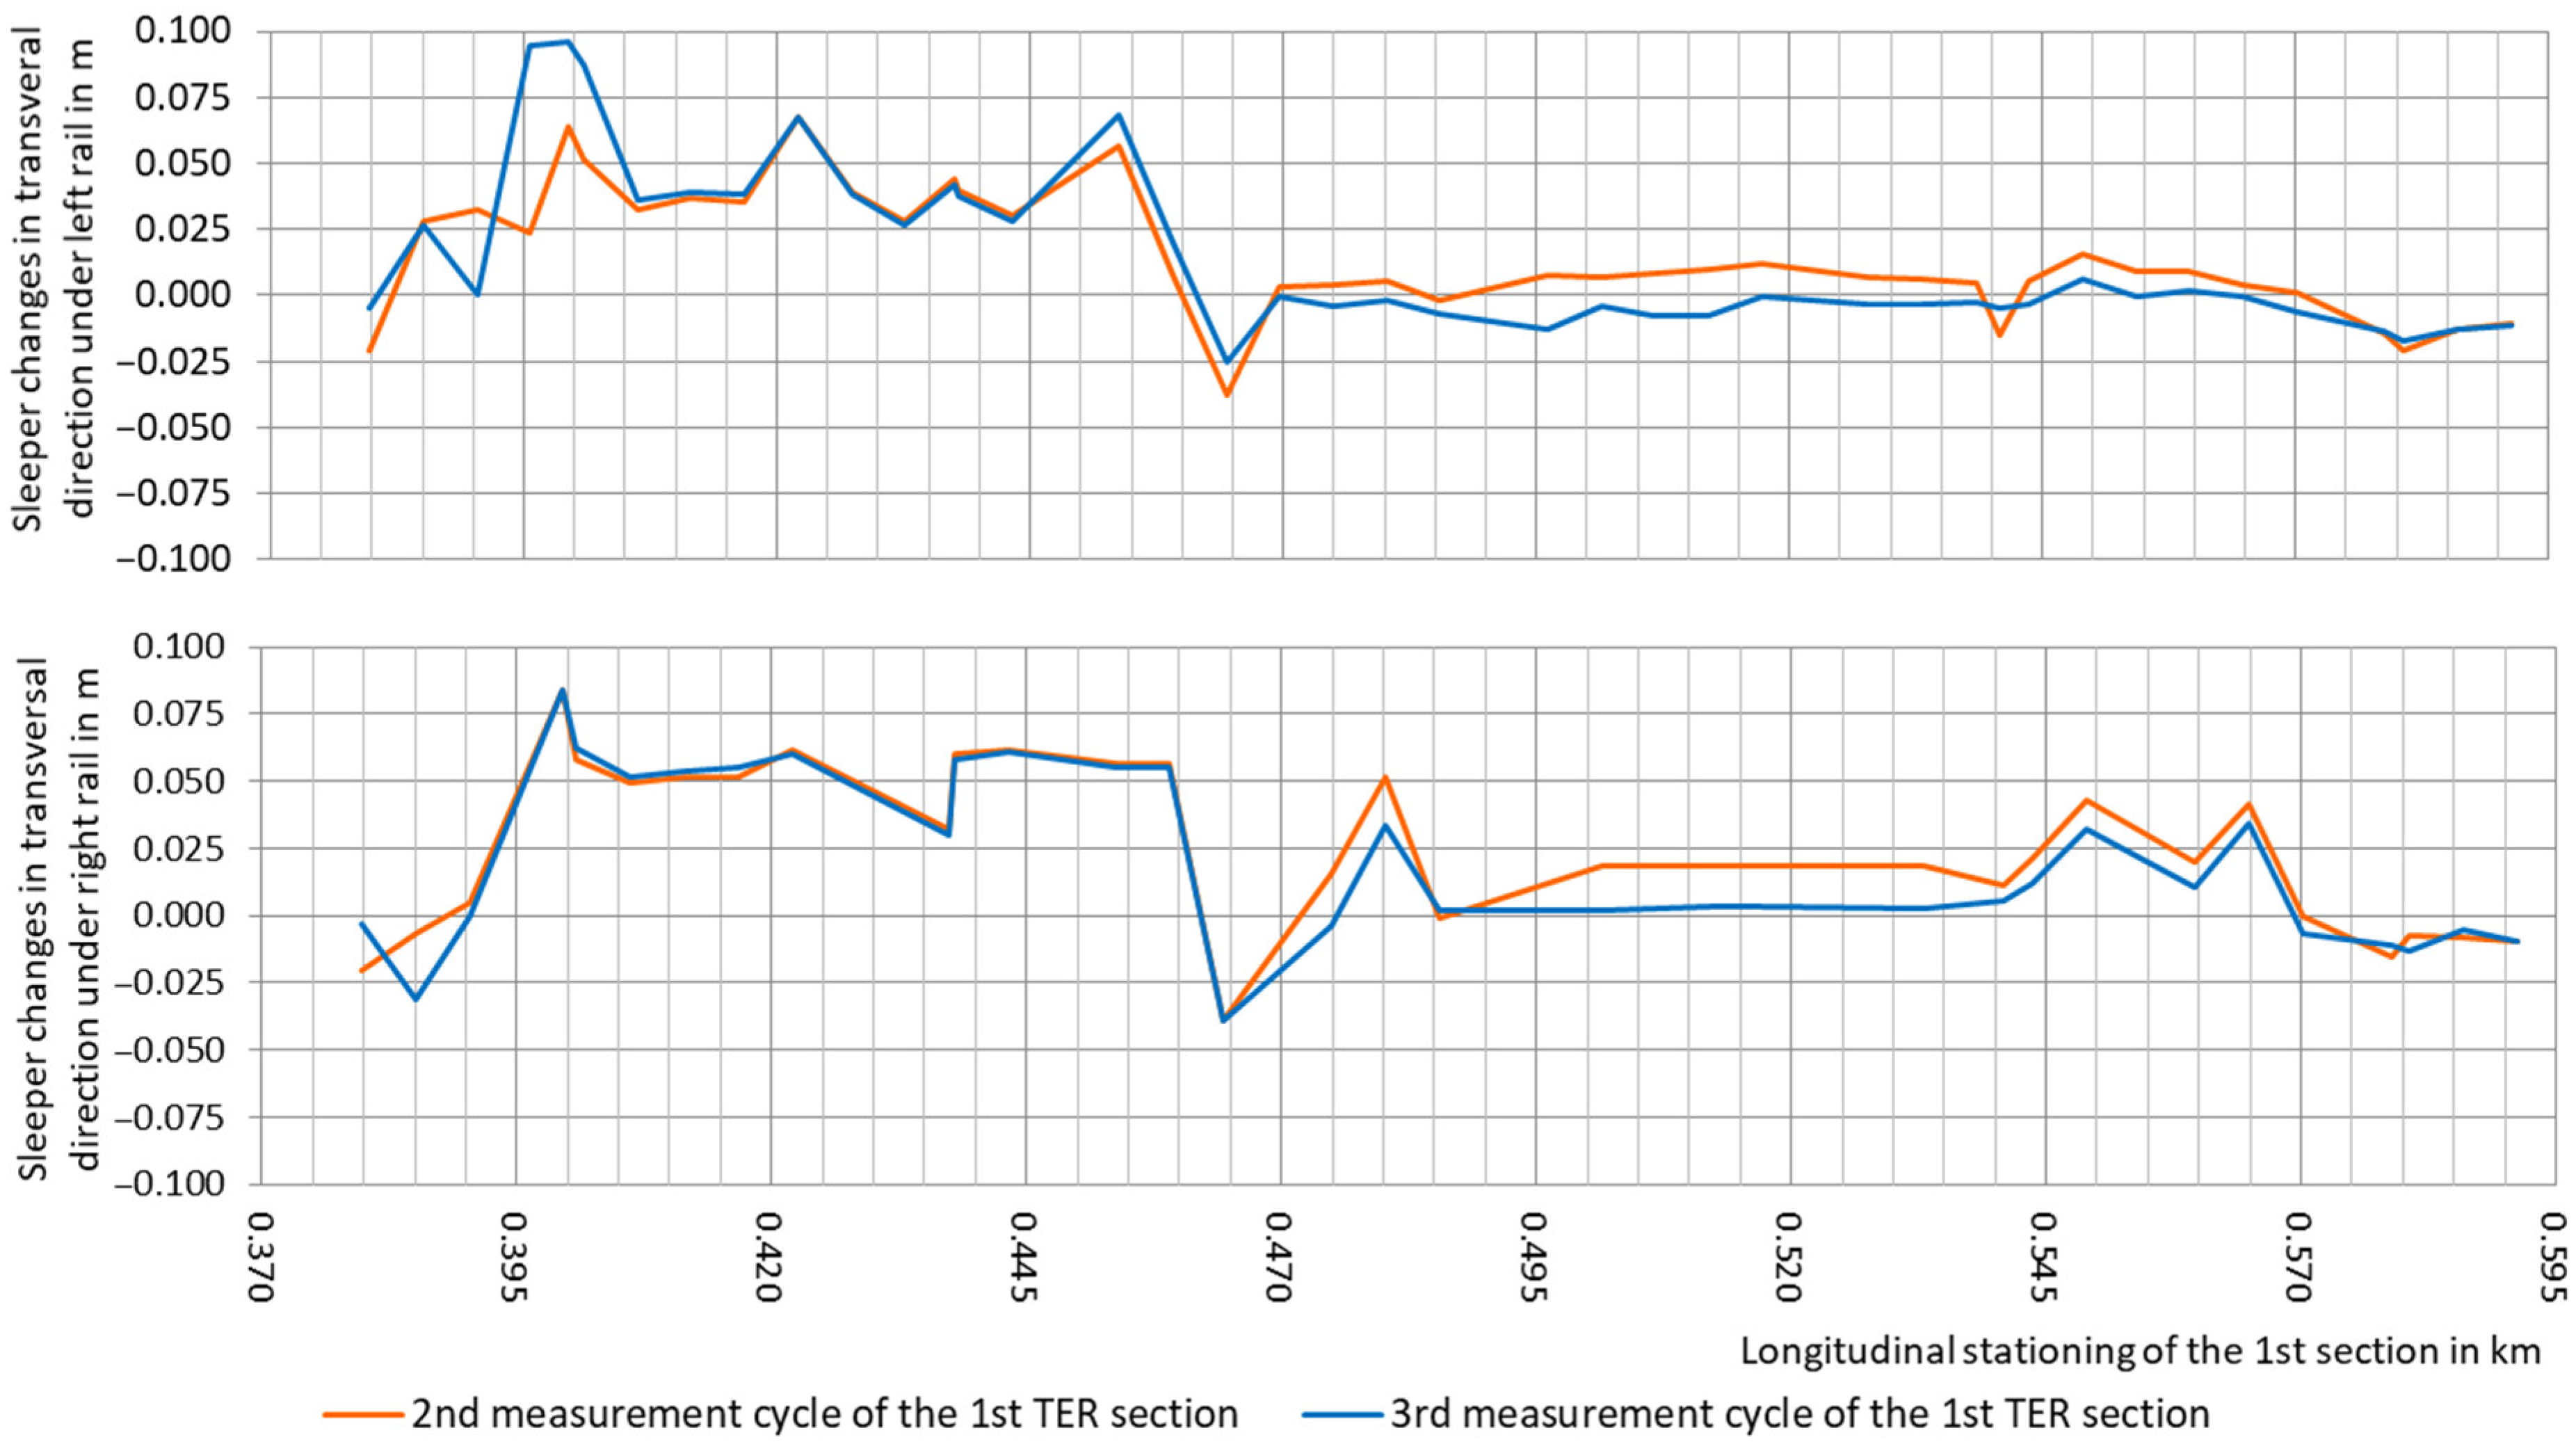
At the same time as track diagnostics with manual vehicle KRAB, the terrestrial laser scanning was performed by using a precise terrestrial laser scanner ScanStation P30 with the ultra-high speed time-of-flight enhanced by Waveform Digitising (WFD) technology and dual-axis compensator, target acquisition 2 mm at 50 m, angular horizontal and vertical accuracy 8 arcseconds and range accuracy 1.2 mm + 10 ppm. The same technology and methodology were used across all three measurement cycles to ensure homogeneity of results. The data acquisition and assessment process was carried out in accordance with the technical standard [12]. The numerical solution consisted of generating transverse profiles at 0.52 m intervals along the longitudinal track using 3D modelling manipulation functions, such as point-cloud filtering, segmentation, and clustering, to compare 3D coordinates within identical clusters across three measurement cycles. The length of the individual transverse profiles was about 0.7 m to the left (−s) and 0.7 m to the right (+s) from the point lying on the longitudinal track axis. The clusters were generated at 0.05 m spacing to maintain the intended precision in determining the spatial track position in the transverse direction. The first scanned section had 45 transversal profiles along the longitudinal axis, 212 m long; the second had 126 transversal profiles, with an overall length of 630 m; and the third section, 511 m long, had 102 transversal profiles. Deformation analysis of the track geometrical parameters scanned in three measurement cycles consisted of defining height changes separately for the left and right rails; height changes in the sleeper structure at the longitudinal axes and under both rails; horizontal changes in both rails in the transversal direction; changes in the elevation of rails; and changes in track gauge. These changes were computed as the coordinate differences between the corresponding clusters in the i-th measurement cycle (i = 2, 3) and those in the first measurement cycle. For comparison, the manuscript includes graphical results from Section 1 on the assessment of height differences for both rails and sleepers under rail and horizontal rail changes, displayed in Figure 5, Figure 6 and Figure 7. The x-axis represents the longitudinal stationing of the appropriate railway section given in km, and the y-axis shows the computed heights or transversal changes in metres. All terrestrial laser scanning results are presented in the research report [1].
Figure 5.
Assessment of height differences in the left and right rail computed in each transversal profile of the 1st TER section.
Figure 6.
Assessment of height differences of the sleeper under the left and right rail computed in each transversal profile of the 1st TER section.
Figure 7.
Assessment of horizontal changes of sleepers computed in each transversal profile of the 1st TER section.
5. Discussion
Laser scanning is a widely used method for geodetic mapping and monitoring of ground and above-ground objects. Based on key factors such as object availability, su-centimetre accuracy, and required resolution, terrestrial laser scanning was preferred over aerial laser scanning for comprehensive diagnostics of a narrow-gauge mountain railway. The main task of terrestrial laser scanning was to place the railway structure in the global coordinate system and identify changes in its transverse, longitudinal, and height positions. Laser scanning is not a new method, and monitoring was conducted in accordance with standard procedures. To maintain accuracy and capture small-scale structural deformations, the scanner positions were mutually reduced to 60 m to obtain a highly detailed 3D point cloud at the highest resolution, 0.02 m/100 m. The point-cloud processing consists of five numerical solution steps, as shown in Figure 4. A specialised algorithm for railway-line conditions was developed to determine the shape of the railway structure in the transverse profile at each measurement cycle [3,4,5,6,7,8]. Considering that the measured distances did not exceed 30 m and the internal accuracy schematically described in Figure 2, the standard deviations represented the positional accuracy of a point did not exceed 3 mm: σx = σy = σz = 0.003 m. According to the law of error propagation, the accuracy of a deformation in each axis did not exceed the value σΔx = σΔy = σΔz = 0.005 m.
The railway comprehensive diagnostics is carried out in accordance with the prescribed rules set out in the technical standards [12,13]. The quality of measured track geometric parameters is evaluated using the TQI. Table 3 presents the computed TQI values for each diagnosed railway section, which are compared with the recommended values. The TQI values were computed from the standard deviations (SDO) of each track parameter measured by the mobile vehicle KRAB. The different physical principles of KRAB, the different types of measured values, the incomparable accuracy (sub-millimetres), and the absence of a coordinate system render both the laser-scanning method and KRAB’s relative measurements non-replaceable and non-comparable.
6. Conclusions
Over three years, three measurement cycles of the Tatra Electric Railway were conducted to determine construction and geometric track parameters as part of diagnostics work by the digital mobil system KRAB. The results have yielded Track Quality Indices that quantitatively evaluate the current condition of the tested railway line [10,11]. It is estimated using weighted standard-deviation propagation, computed for each monitored geometric track parameter [3,4,5,6,7,8]. These standard deviations and TQI are compared with the recommended values in the technical directions [9]. In the event of exceeding limit values, the infrastructure manager recommends appropriate maintenance. Terrestrial laser scanning was part of the diagnostic work, with the primary task being to determine spatial track changes in the transverse and longitudinal directions, which were subsequently analysed for deformation. Classical deformation analysis is based on the study of changes in an object discretised by signalised marks. Modern contactless data-acquisition technologies have introduced a new approach to determining deformations by evaluating point clouds or creating 3D models using IT manipulation functions, supported by numerical and statistical techniques. Terrestrial laser scanning is a geodetic method that acquires large amounts of data and processes them using specialised mathematical techniques. The evaluation of three measurement cycles of TER has documented height and directional changes in standard railway construction over three years. According to the accuracy evaluation, all spatial changes greater than 2.6 cm are statistically significant, as they exceed the 95% confidence interval, which corresponds to twice the standard deviation [13]. Statistical hypothesis testing, as an essential component of deformation analysis [12,13], indicates that spatial sleeper changes (Figure 4 and Figure 5) are statistically significant and necessitate reconstruction. Despite the time-consuming processing phase, laser scanning appears essential for deformation analysis. The disadvantage of laser scanning in railway applications seems to be its inability to capture the reflective upper part of the rail. This problem is solved by modelling the missing parts of the rail into the desired shape during processing. Terrestrial laser scanning is a contactless geodetic measurement method that yields high-quality results in diagnostics, not only of construction and transport objects but also of historical buildings, industrial halls, engineering structures, products, and other objects and equipment.
The paper presents the monitoring and solution of a narrow-gauge electric railway line, but the technologies and methodologies employed are transferable to other types of railways. The described TLS monitoring has been applied in many localities with normal- and narrow-gauge railway lines, with minor variations, mainly in the number of ground-control points and instrument stations and in the image resolution, depending on the locality’s relief, mutual visibility, and accessibility to the track. So, the measurement time is limited by the railway closure. The process of comprehensive diagnostics and numerical solution of the point cloud is the same.
Author Contributions
Conceptualisation: J.I., J.C., S.H. and D.S.; methodology: J.I. and S.H.; software: J.I.; validation: J.I., J.C. and D.S.; formal analysis: J.I. and S.H.; investigation: J.I.; resources: J.I. and S.H.; data: J.I., J.C. and D.S.; writing—original draft preparation: J.I.; writing—review and editing: J.I.; visualisation: J.I., J.C. and S.H.; supervision: J.I.; project administration: J.I.; funding acquisition: S.H. All authors have read and agreed to the published version of the manuscript.
Funding
VEGA—Scientific Grant Agency of the Ministry of Education, Science, Research and Sport of the Slovak Republic and the Slovak Academy of Sciences.
Data Availability Statement
The original contributions presented in this study are included in the article. Further inquiries can be directed to the corresponding author.
Acknowledgments
This article is the result of the implementation of the project VEGA 1/0236/25: “Analysis, diagnostics and modification of structural parts in places with a significant change in the stiffness of the railway track”, supported by the Scientific Grant Agency of the Ministry of Education, Research, Development and Youth of the Slovak Republic and the Slovak Academy of Sciences. This article is also the result of the implementation of the project APVV-22-0562: “Strengthening the resilience management of key infrastructure elements using advances in 3D modelling”, supported by the Slovak Research and Development Agency of the Ministry of Education, Research, Development and Youth of the Slovak Republic.
Conflicts of Interest
The authors declare no conflict of interest.
References
- Ižvolt, L.; Šestáková, J.; Ižvoltová, J. Establishment of Contactless Track on the Tatra Electric Railway in the Inter-Station Sections of the Poprad-Tatry Railway Station-Starý Smokovec Railway Station and the Starý Smokovec Railway Station-Tatranská Lomnica Railway Station; University of Žilina, Summary Reports of the KŽSTH and KGD, 2018; University of Žilina: Žilina, Slovakia, 2019. [Google Scholar]
- Honti, R.; Erdélyi, J. Kopáčik: Automation of Segmentation of Basic Geometric Primitives from Point Clouds; Slovak Technical University in Bratislava: Bratislava, Slovakia, 2024; 94p. [Google Scholar]
- Khan, F. The All-New Simplified Point Cloud Processing Software. Leica Geosystems 2025. Available online: https://leica-geosystems.com/products/laser-scanners/software/leica-cyclone/leica-cyclone-register-360/simplified-point-cloud-processing-software (accessed on 2 May 2025).
- Miao, Y.; Sun, Y.; Zhang, Y.; Wang, J.; Zhang, X. An efficient point cloud semantic segmentation network with multiscale super-patch transformer. Sci. Rep. 2024, 14, 14581. [Google Scholar] [CrossRef] [Scilit] [PubMed]
- Oviedo, F.M.; Cabo, C.; Pardiñas, J.R.; Loudermilk, L.E.; Ordóñez, C. 3D Point Cloud Semantic Segmentation Through Functional Data Analysis. J. Agric. Biol. Environ. Stat. 2024, 29, 723–744. [Google Scholar] [CrossRef] [Scilit]
- Point Cloud Processing. MathWorks 2025. Available online: https://www.mathworks.com/help/vision/point-cloud-processing.html (accessed on 1 February 2026).
- Rusu, R.B. 3D Is Here: Point Cloud Library. Available online: https://pointclouds.org/assets/pdf/pcl_icra2011.pdf (accessed on 1 February 2026).
- Safri, M. Point Cloud Data—Preparation and Preprocessing, Medium 2024. Available online: https://medium.com/@murtazasafri/point-cloud-data-0d8c8208e06f (accessed on 12 April 2024).
- Technical Direction SR 103-7 (TS); Measurement and Evaluation of Geometrical Track Parameters of Track Gauge 1435 mm and 1520 mm by Measuring Vehicle KRAB. Slovak Railways, 2017; p. 60.
- Offenbacher, S.; Neuhold, J.; Veit, P.; Landgraf, M. Analysing Major Track Quality Indices and Introducing a Universally Applicable TQI. Appl. Sci. 2020, 10, 8490. [Google Scholar] [CrossRef] [Scilit]
- Unsiwilai, S.; Phusakulkajorn, W.; Shen, C.; Zoeteman, A.; Dollevoet, R.; Núñez, A.; Li, Z. Enhanced vertical railway track quality index with dynamic responses from moving trains. Heliyon 2024, 10, e38670. [Google Scholar] [CrossRef] [Scilit] [PubMed]
- Technical Railway Standard TNŽ 736361; Geometrical Track Position and Arrangement of Railway Lines Gauge 1000 mm. Slovak Railways, 2007; p. 37.
- Technical Standard STN 73 0275; Accuracy of Geometric Parameters in Construction. Control Measurements of Linear Construction Objects: Bratislava, Slovakia, 1991.



Disclaimer/Publisher’s Note: The statements, opinions and data contained in all publications are solely those of the individual author(s) and contributor(s) and not of MDPI and/or the editor(s). MDPI and/or the editor(s) disclaim responsibility for any injury to people or property resulting from any ideas, methods, instructions or products referred to in the content. |
© 2026 by the authors. Licensee MDPI, Basel, Switzerland. This article is an open access article distributed under the terms and conditions of the Creative Commons Attribution (CC BY) license.